Article

Effects of Nitrogen and Phosphorus Additions on Soil N2O Emission and Soil Carbon Storage in Lakeshore Zone

1
Yinshanbeilu Grassland Eco-hydrology National Observation and Research Station, China Institute of Water Resources and Hydropower Research, Beijing 100038, China
2
Inner Mongolia Key Laboratory of Grassland Ecology and the Candidate State Key Laboratory of Ministry of Science and Technology, Inner Mongolia University, Hohhot 010021, China
3
College of Ecology and Environment, Inner Mongolia University, Hohhot 010021, China
*
Author to whom correspondence should be addressed.
These authors contributed equally to this work.
Sustainability 2025, 17(13), 5987; https://doi.org/10.3390/su17135987
Submission received: 25 February 2025 / Revised: 2 June 2025 / Accepted: 18 June 2025 / Published: 29 June 2025
(This article belongs to the Section Environmental Sustainability and Applications)

Abstract

This study examined the short-term effects of nitrogen (N) and phosphorus (P) addition on soil N2O flux and organic carbon content in the lakeshore zone of an arid inland lake, Daihai. Treatments included control (N0P0), N addition (N1P0), P addition (N0P1), and NP co-addition (N1P1). Using the static chamber method and lab analyses, we measured soil N2O flux and organic carbon content at different growth stages. Results showed that, in the early growing season, short-term N and P addition had no significant effect on soil N2O flux, with all treatments acting as N2O sources. However, N and NP treatments significantly increased soil organic carbon (SOC) storage, improving carbon sequestration benefits by 72.7% to 98.1%. During the peak growing season, N and NP treatments significantly enhanced soil N2O emissions, while NP treatment further increased SOC storage, the carbon sequestration benefits of all treatments ranging from 49.0% to 56.5%. At the late growing season, N and P addition had no significant impact on soil N2O flux or organic carbon storage, with all sites acting as N2O sinks and SOC storage showing no significant change across treatments (carbon sequestration benefits ranged from 0.3% to 38.5%). The study highlights that the response of soil N2O flux to short-term N and P addition varies at different growth stages, while overall, N and P addition promotes soil carbon sequestration throughout the growing season in the lakeshore zone.

1. Introduction

Nitrous oxide (N2O) is the third most significant greenhouse gas in the atmosphere, following carbon dioxide (CO2) and methane (CH4). The global warming potential (GWP) of N2O is 298 times that of CO2 over a 100-year timescale. As a long-lived atmospheric gas, N2O exerts a substantial impact on global warming and climate change [1]. The soil organic carbon (SOC) pool is the main ingredient of the terrestrial ecosystem carbon pool, and a small change in its storage will make a critical difference to atmospheric CO2 intensity and climate change [2]. The lakeshore zone is an ecological transition zone between terrestrial and aquatic ecosystems [3]. It is not only one of the hotspots for N2O emissions [4] but also a key location for carbon sequestration [5], playing an irreplaceable role in climate regulation [4]. However, increasing nitrogen (N) deposition globally, coupled with agricultural non-point source pollution, has led to a growing N and phosphorus (P) load in lakeshore zones [6,7]. The utilization rates of N and P fertilizers in China are 30–35% and 10–20% respectively [8]. In China, non-point source N and P pollution loads in agriculture account for 81% and 93% of the total N and P pollution loads in water bodies, respectively [9]. These pollutants will enter the lakeshore zone and cause serious pollution. Moreover, although N and P fertilizers can cause leaching effects, they still have an impact on N2O emissions and SOC sequestration. Therefore, clarifying the impact of N and P additions on soil N2O fluxes and SOC storage in lakeshore zones is crucial for evaluating the effects of increased N and P loading on climate change.
The impact of N and P inputs on ecosystem N2O flux is currently one of the hot topics in research [10,11]. Studies have found that N additions can increase soil inorganic N content and enhance microbial activity, thereby promoting soil N2O emissions [12]. However, some research indicates that, during the early stages of N application, N is absorbed by plants and microorganisms, resulting in no significant effect on N2O emissions [13]. P additions, by increasing the abundance of N2O-reducing bacteria in the soil, have been found to reduce N2O emissions [14]. Nonetheless, other experiments have shown that P inputs make no critical difference to N2O emissions [15]. The response of soil N2O flux to N and P inputs remains inconclusive, and research on the response of lakeshore soil N2O fluxes to N and P inputs is relatively scarce. Furthermore, some studies have shown that an increase in soil temperature will promote the generation and emission of N2O [16]. Suitable temperature and soil moisture during the growing season promote vigorous microbial metabolism, enhance nitrification and denitrification, and increase the emission of N2O, making this period the peak of N2O flux. It is necessary to explore the influence of N and P addition during the growing season on N2O flux. Therefore, we propose Scientific Question 1: How do N and P additions affect N2O fluxes during the growing season in lakeshore zones (Q1)?
Previous studies have shown that N and P inputs promote SOC storage in global terrestrial ecosystems [17,18,19]. The effect of N and P inputs on SOC content is primarily mediated through their influence on plant growth, which in turn affects organic matter inputs [20]. The impact of N and P inputs on organic matter inputs varies across different growth stages [21,22,23], resulting in differential effects on soil carbon pools at various stages of plant development. During the growing season, when the temperature and humidity are suitable, the vegetation grows rapidly, which affects the storage of SOC. Therefore, we raise scientific question 2: How does the addition of N and P affect SOC storage during the growing season in the lakeside zone (Q2)? Furthermore, the combined effect of N and P inputs on N2O emissions and carbon sequestration in lakeshore zones remains unclear. Therefore, we propose Scientific Question 3: Can the increase in organic carbon storage due to N and P inputs offset the greenhouse potential caused by their impact on soil N2O fluxes (Q3)?
To address the above questions, this study focused on the lakeshore zone of Daihai Lake, setting up a field-controlled experiment with N addition, P addition, and N and P co-addition (NP) treatments. Using the static chamber method to measure N2O emission rates in the field, laboratory analysis was conducted to determine SOC content. The study evaluated the effects of N and P addition on N2O flux and SOC storage during different growth stages and quantified the carbon sequestration benefits resulting from changes in SOC storage and N2O flux caused by N and P addition. This study aims to explore the effects of the addition of N and P on N2O and SOC, and whether the effects of the addition of N and P on the change in N2O can offset the retention of SOC. The study can provide theoretical support for the ecosystem management of the Hubin area under the “dual carbon” strategy in the new era.

2. Materials and Methods

2.1. Overview of the Experimental Site

The research region is situated along the lakeshore zone of Daihai Lake (40.540° N, 112.728° E), within Liangcheng County, Ulanqab City, Inner Mongolia Autonomous Region. This area was previously used as farmland but has undergone natural restoration since 2010 following the implementation of the Conversion of Cropland to Grassland program. The current vegetation consists of a mixed grass community, with dominant species including Phragmites australis (common reed), Leymus chinensis (Chinese wild rye), and Leymus secalinus. Associated plant species include Artemisia scoparia (annual wormwood), Artemisia annua (sweet wormwood), Artemisia argyi (Chinese mugwort), and Lepidium apetalum (small pepperwort). In recent years, the establishment of power plants, dairy farms, and ports around Daihai Lake has led to an increase in N, P, and other nutrient levels in the lakeshore zone. The water content of the tested soil was 12.167%, nitrate nitrogen was 6.077 mg/kg, ammonium nitrogen was 1.267 mg/kg, total nitrogen was 0.05%, total carbon was 0.98%, organic carbon was 1.072 mg/kg, and bulk density was 0.97 g/cm3.

2.2. Experimental Design

The altitude of the selected experimental plots is similar, the terrain is relatively uniform, and heterogeneity is low, which provides relatively consistent environmental background conditions for the research. The experiment employed a randomized block design, based on the annual N and P levels in agricultural runoff in the Daihai watershed; four treatments were established: control (N0P0, i.e., control), N addition (N1P0, 100 kg N ha−1 y−1), P addition (N0P1, 48 kg P ha−1 y−1), and NP addition (N1P1, 100 kg N ha−1 y−1 + 48 kg P ha−1 y−1). Each treatment had four replicate plots, with each plot measuring 3 m × 3 m and spaced 2 m apart. Half of the N in ammonium nitrate (NH4NO3) fertilizer is provided in the form of NO3 and half of NH4+, which is more easily utilized by plants or microorganisms. Therefore, N fertilizer was applied in the form of NH4NO3, and P fertilizer in the form of superphosphate (Ca(H2PO4)2). Starting in 2019, the chemicals were dissolved in 5 L of pure water and evenly sprayed on each plot once a month from April to July, with the control plots sprayed with the same amount of pure water. Field measurements and sampling were conducted during the 2021 growing season. Based on the natural environment of the experimental area and the actual growth conditions of the vegetation, the growing season was divided into three stages: early growing season (May, June), peak growing season (July, August), and late growing season (September, October).

2.3. Measurement of Gas, Soil, and Environmental Factors

2.3.1. Measurement of N2O Flux

From May to October, gas samples were collected in a fixed quadrat using a static chamber [24], with sampling conducted on the first and middle ten days of each month at 14-day intervals. Gas samples were collected at 0, 10, 20, and 30 min, with simultaneous measurement of soil temperature (ST). N2O concentrations in the samples were determined using gas chromatography (SHIMADZU GC-2030).
The N2O flux was calculated as follows:
F = H × M V 0 × T 0 T × P P 0 × d C t d t
where F represents the measured gas emission flux; H is the sampling chamber height (m); M (g/mol) is the molar mass of the gas; V0, T0, and P0 represent the gas molar volume (22.4 L/mol), thermodynamic temperature (273.15 K), and pressure (1.013 × 10⁵ Pa) under standard conditions, respectively; T and P represent the thermodynamic temperature and pressure of the area at the time of sampling; Ct is the gas concentration; and dCt/dt represents the slope of the change in gas concentration over time during sampling.

2.3.2. Soil Sampling and Analysis

In the experimental plot, the plum blossom point layout method was adopted. Soil samples at the 0–10 cm layer were drilled, with soil with a diameter of 7.5 cm, in May, August and October. Five soil cores were taken and thoroughly mixed. The mixed sample was divided into two portions: one part was stored at 4 °C, while the other was sieved through a 2 mm mesh to remove fine roots and impurities before analysis. Soil NO3-N and NH4+-N concentrations were measured by KCl extraction (1:10 mass-to-volume ratio), followed by filtration and determination using continuous flow analysis [25]. Determination of microbial biomass Carbon (MBC) and Nitrogen (MBN) was carried out by chloroform fumigation [26,27]. Soil pH was measured by the potentiometric method, and the electrode method was utilized to calculate electrical conductivity. Determination of SOC was performed by the oil-bath Potassium Dichromate Oxidation Method [28]. The soil bulk density was determined by the ring knife method [29].

2.4. Data Processing and Analysis

Soil carbon density refers to the amount of carbon contained in a unit of soil mass or volume, and is a fundamental parameter for evaluating the function of soil carbon sinks.
The benefits of carbon sequestration refer to the environmental and economic benefits brought about by reducing the concentration of CO2 in the atmosphere by fixing CO2 in soil, vegetation or other carbon pools through natural or artificial measures. It includes multiple aspects, such as reducing greenhouse gas emissions, mitigating climate change, and improving soil quality.
The Formula for Calculating Soil Carbon Density is as follows [30]:
D O C = S O C × γ × H i × 10 1
where DOC represents soil carbon density (tC/ha); SOC represents soil organic carbon content (g/kg); γ represents soil bulk density (g/cm3); and Hi represents the thickness of the soil layer (cm).
The formula for calculating carbon sequestration benefits (kg·m−2) is as follows:
Carbon sequestration benefits = Carbon storage (T) + CO2 (T) equivalent
Carbon storage (T): SOC storage in each treatment minus the SOC storage in the control group (kg·m−2).
CO2 (T) equivalent: N2O flux in the control group minus the N2O flux in each treatment, multiplied by 298 to convert to the CO2 equivalent (kg·m−2).

2.5. Interactive Effects

The interactive effects between the two treatments were quantified by comparing the observed combined effects with the expected additive effects, calculated as the sum of their individual treatment effects [31]. We employed Hedge’s d to evaluate the main effect sizes of the two factors on the variables and their interaction [31,32]. The main effects of factors A and B (dA and dB, A and B indicate N addition and P addition, respectively) and their interaction (dI) were calculated using Equations (3)–(5), respectively:
d A = X ¯ A + X ¯ A B X ¯ B X ¯ C 2 S J m
d B = X ¯ B + X ¯ A B X ¯ A X ¯ C 2 S J m
d I = X ¯ A B X ¯ A X ¯ B X ¯ C 2 S J m
where X ¯ C , X ¯ A , X ¯ B and X ¯ A B are means of a specific variable in the control and treatment groups of N, P and NP additions, respectively; S (the pooled standard deviation) and J(m) (the correction term for small sample bias) were calculated using Equations (6) and (7):
S = n c 1 ( S C ) 2 + n A 1 ( S A ) 2 + n B 1 ( S B ) 2 + n A B 1 ( S A B ) 2 n C + n A + n B + n A B 4
J m = 1 3 4 m 1
where nc, nA, nB and nAB, are the sample sizes, and SC, SA, SB and SAB are the standard deviations in the control and treatment groups of N, P and NP additions, respectively; m is the degree of freedom and was calculated using Equation (8):
m = n C + n A + n B + n A B 4
The variance of dI (vdi) and the weighted mean dI (d++) and the standard error for d++ were calculated using the following equations:
v d i = 1 n C + 1 n A + 1 n B + 1 n A B + d i 2 2 n C + n A + n B + n A B + / 4
d + + = i = 1 l j = 1 k w i j d i j i = 1 l j = 1 k w i j
S d + + = 1 i = 1 l j = 1 k w i j
where l is the number of groups, k is the number of comparisons in the i group, and w is the weight, which is the reciprocal of the variances (i.e., 1/vdi). The 95%CI of d++ was calculated as d + + ± C α 2 × S d + + , where Cα/2 is the two-tailed critical value of the standard normal distribution.
The interactive effects between N and P addition were thus classified into three types: additive, synergistic and antagonistic. If the 95% confidence interval (CI) overlapped with zero, the interactive effect was additive. If the individual effect sizes were both negative or one negative and the other positive, the interactive effect size was negative for synergistic and positive for antagonistic. In cases where the individual effect sizes were both positive, the interactive effect was greater than zero for synergistic and less than zero for antagonistic [31].
In this study, all statistical analyses were performed using SPSS 26.0, and all graphs were created using “ggplot2” package in R (4.4.1) software and Origin 2022b software. All values are expressed as mean ± standard error (SE). The differences between treatments are indicated by lowercase letters. One-way analysis of variance (ANOVA) was used to evaluate the significant differences among different treatments, and two-factor analysis of variance was used to evaluate the effects of different treatments and different growth stages on N2O flux and carbon storage. Post hoc tests were conducted using the least significant difference (LSD) method, and the significance level was p < 0.05. Pearson correlation analysis was used to examine the relationship among N2O flux, organic carbon storage and environmental factors.

3. Results

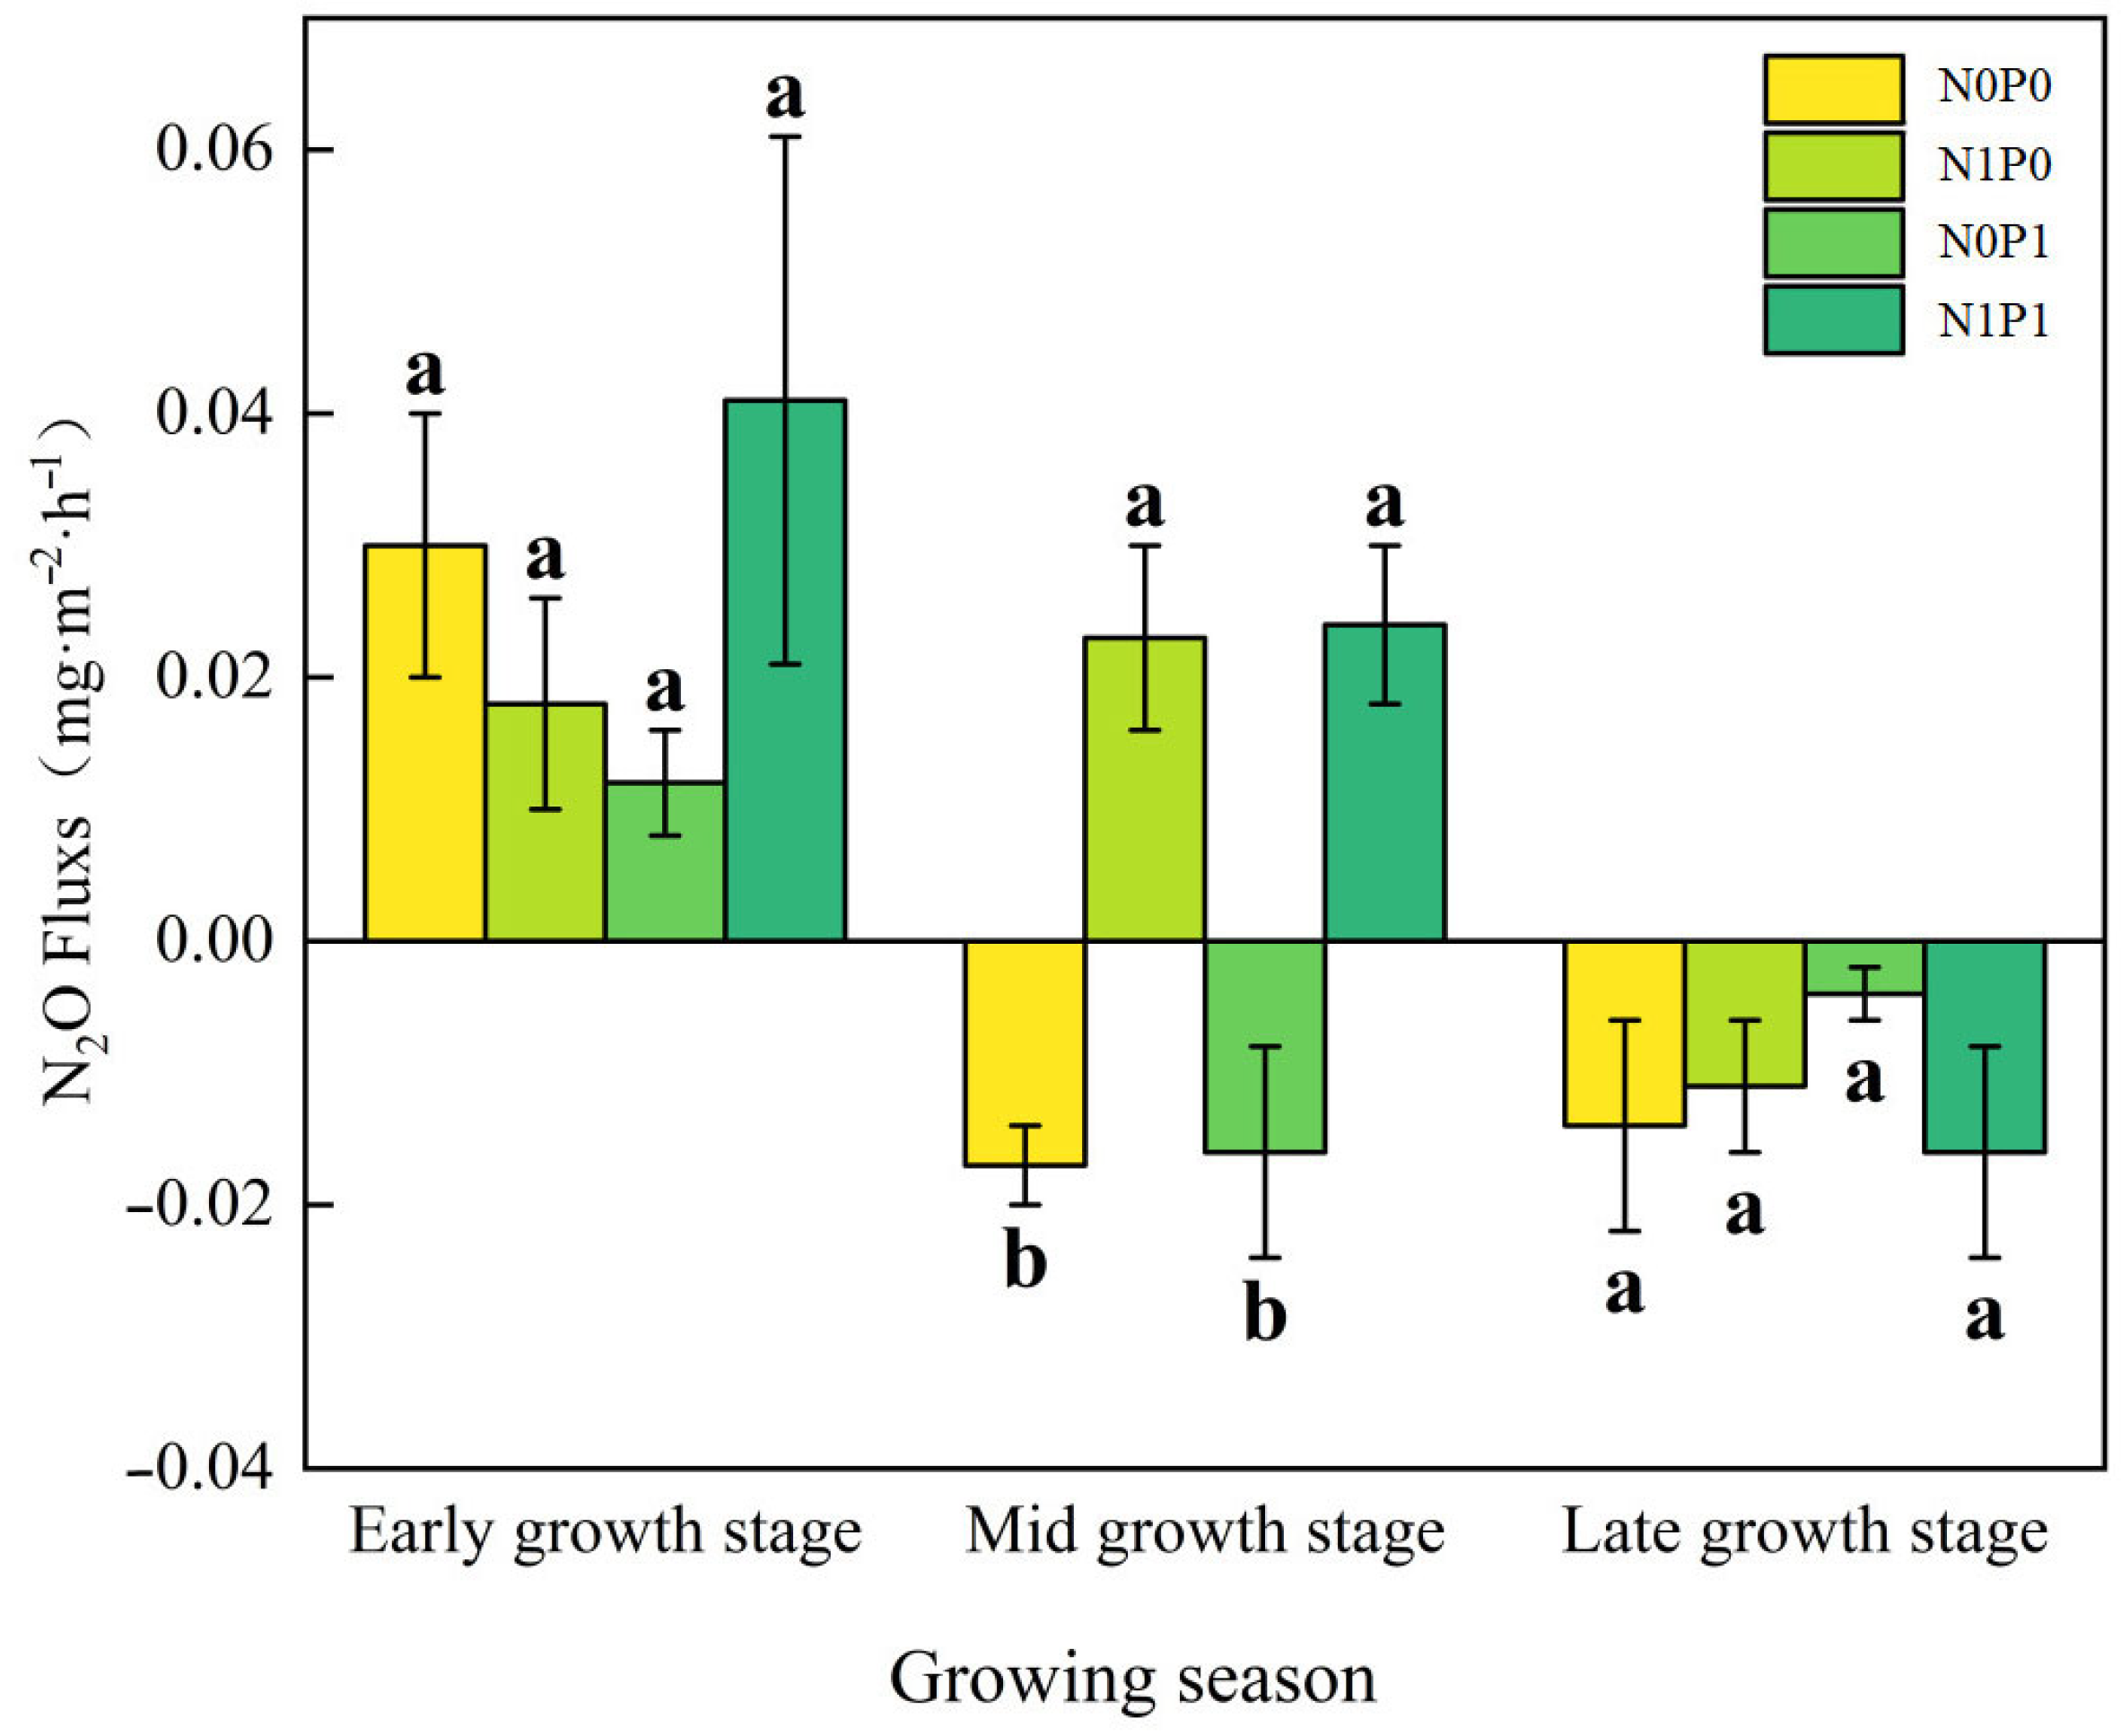
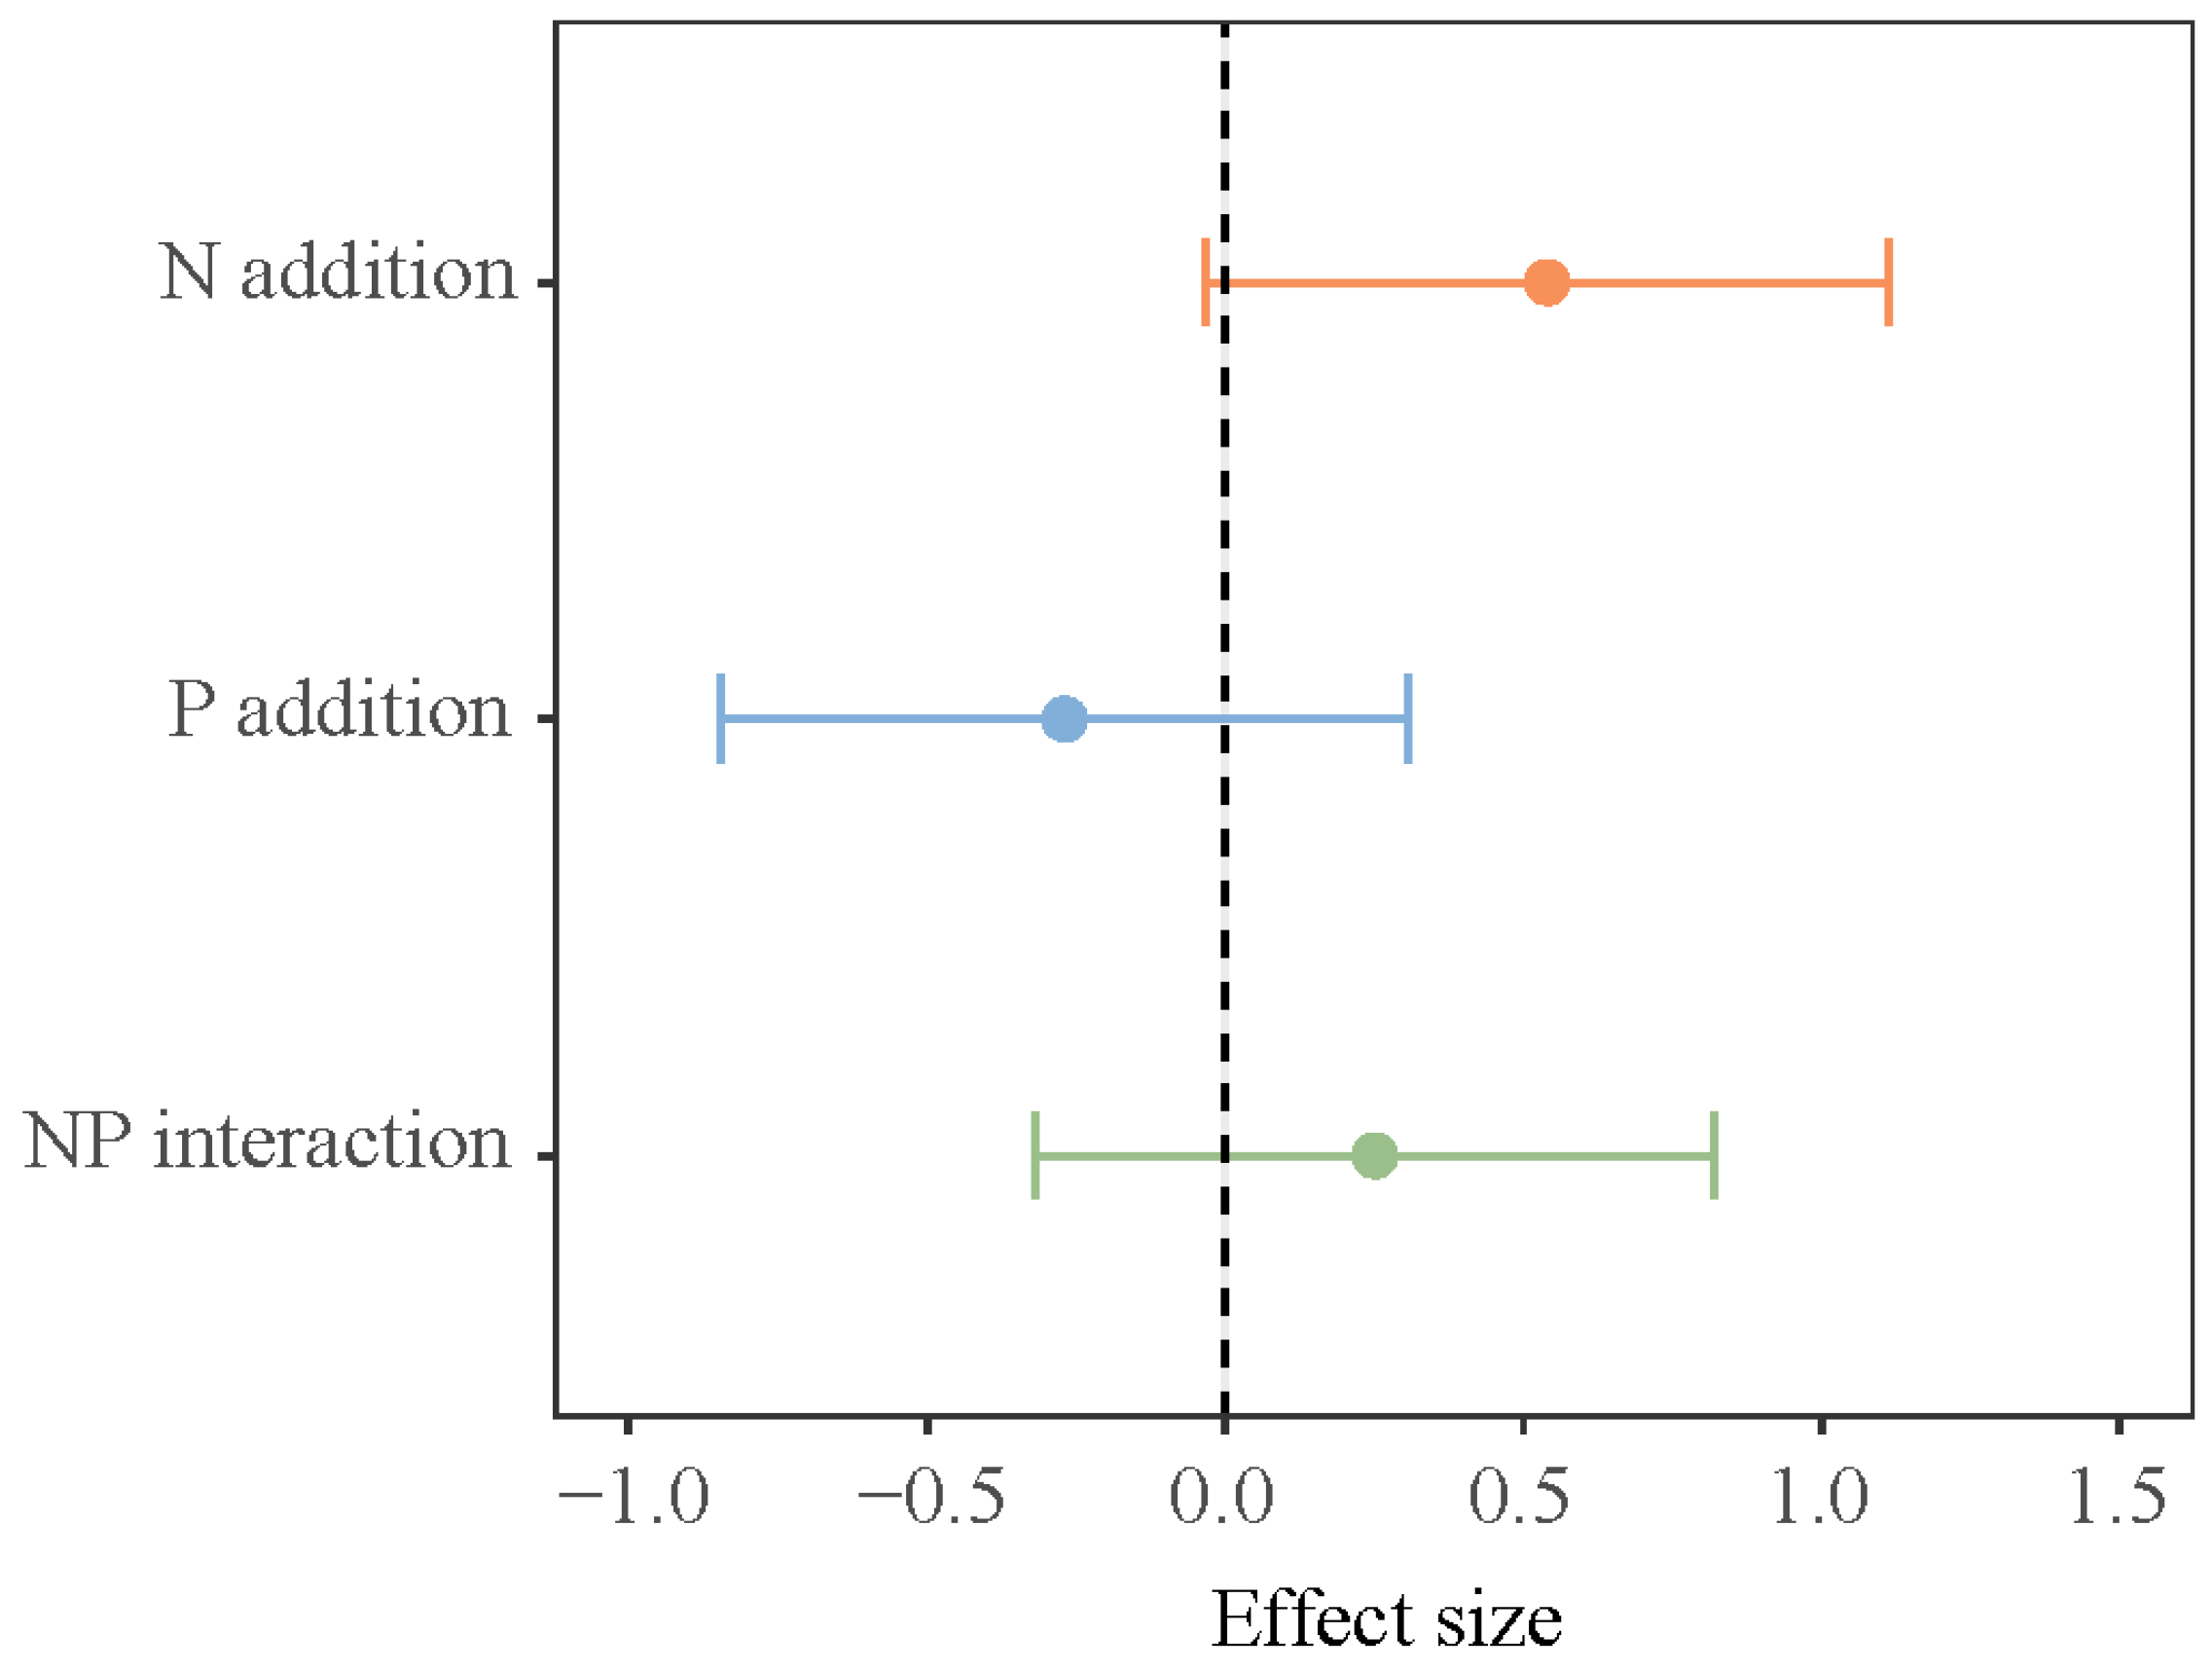
3.1. Effects of Short-Term N and P Additions on N2O Flux

The impact of different growth stages on N2O flux in the lakeshore zone was significant (p < 0.05, Table 1, bold values). At the early growing season, the lakeshore zone consistently acts as a source of N2O whereas, by the late growing season, it consistently functions as a sink for N2O (Figure 1). In both the early and late growing seasons, the separate addition of N and P decreased N2O flux in the lakeshore zone, while the NP addition increased N2O flux, but none of these effects were statistically significant. During the peak growing season, the control plot acted as a sink for N2O, while N addition and NP addition significantly increased N2O emissions in the lakeshore zone. P addition makes no critical difference to N2O flux. In the interaction of N and P addition, N and P have an additive effect (Figure 2).

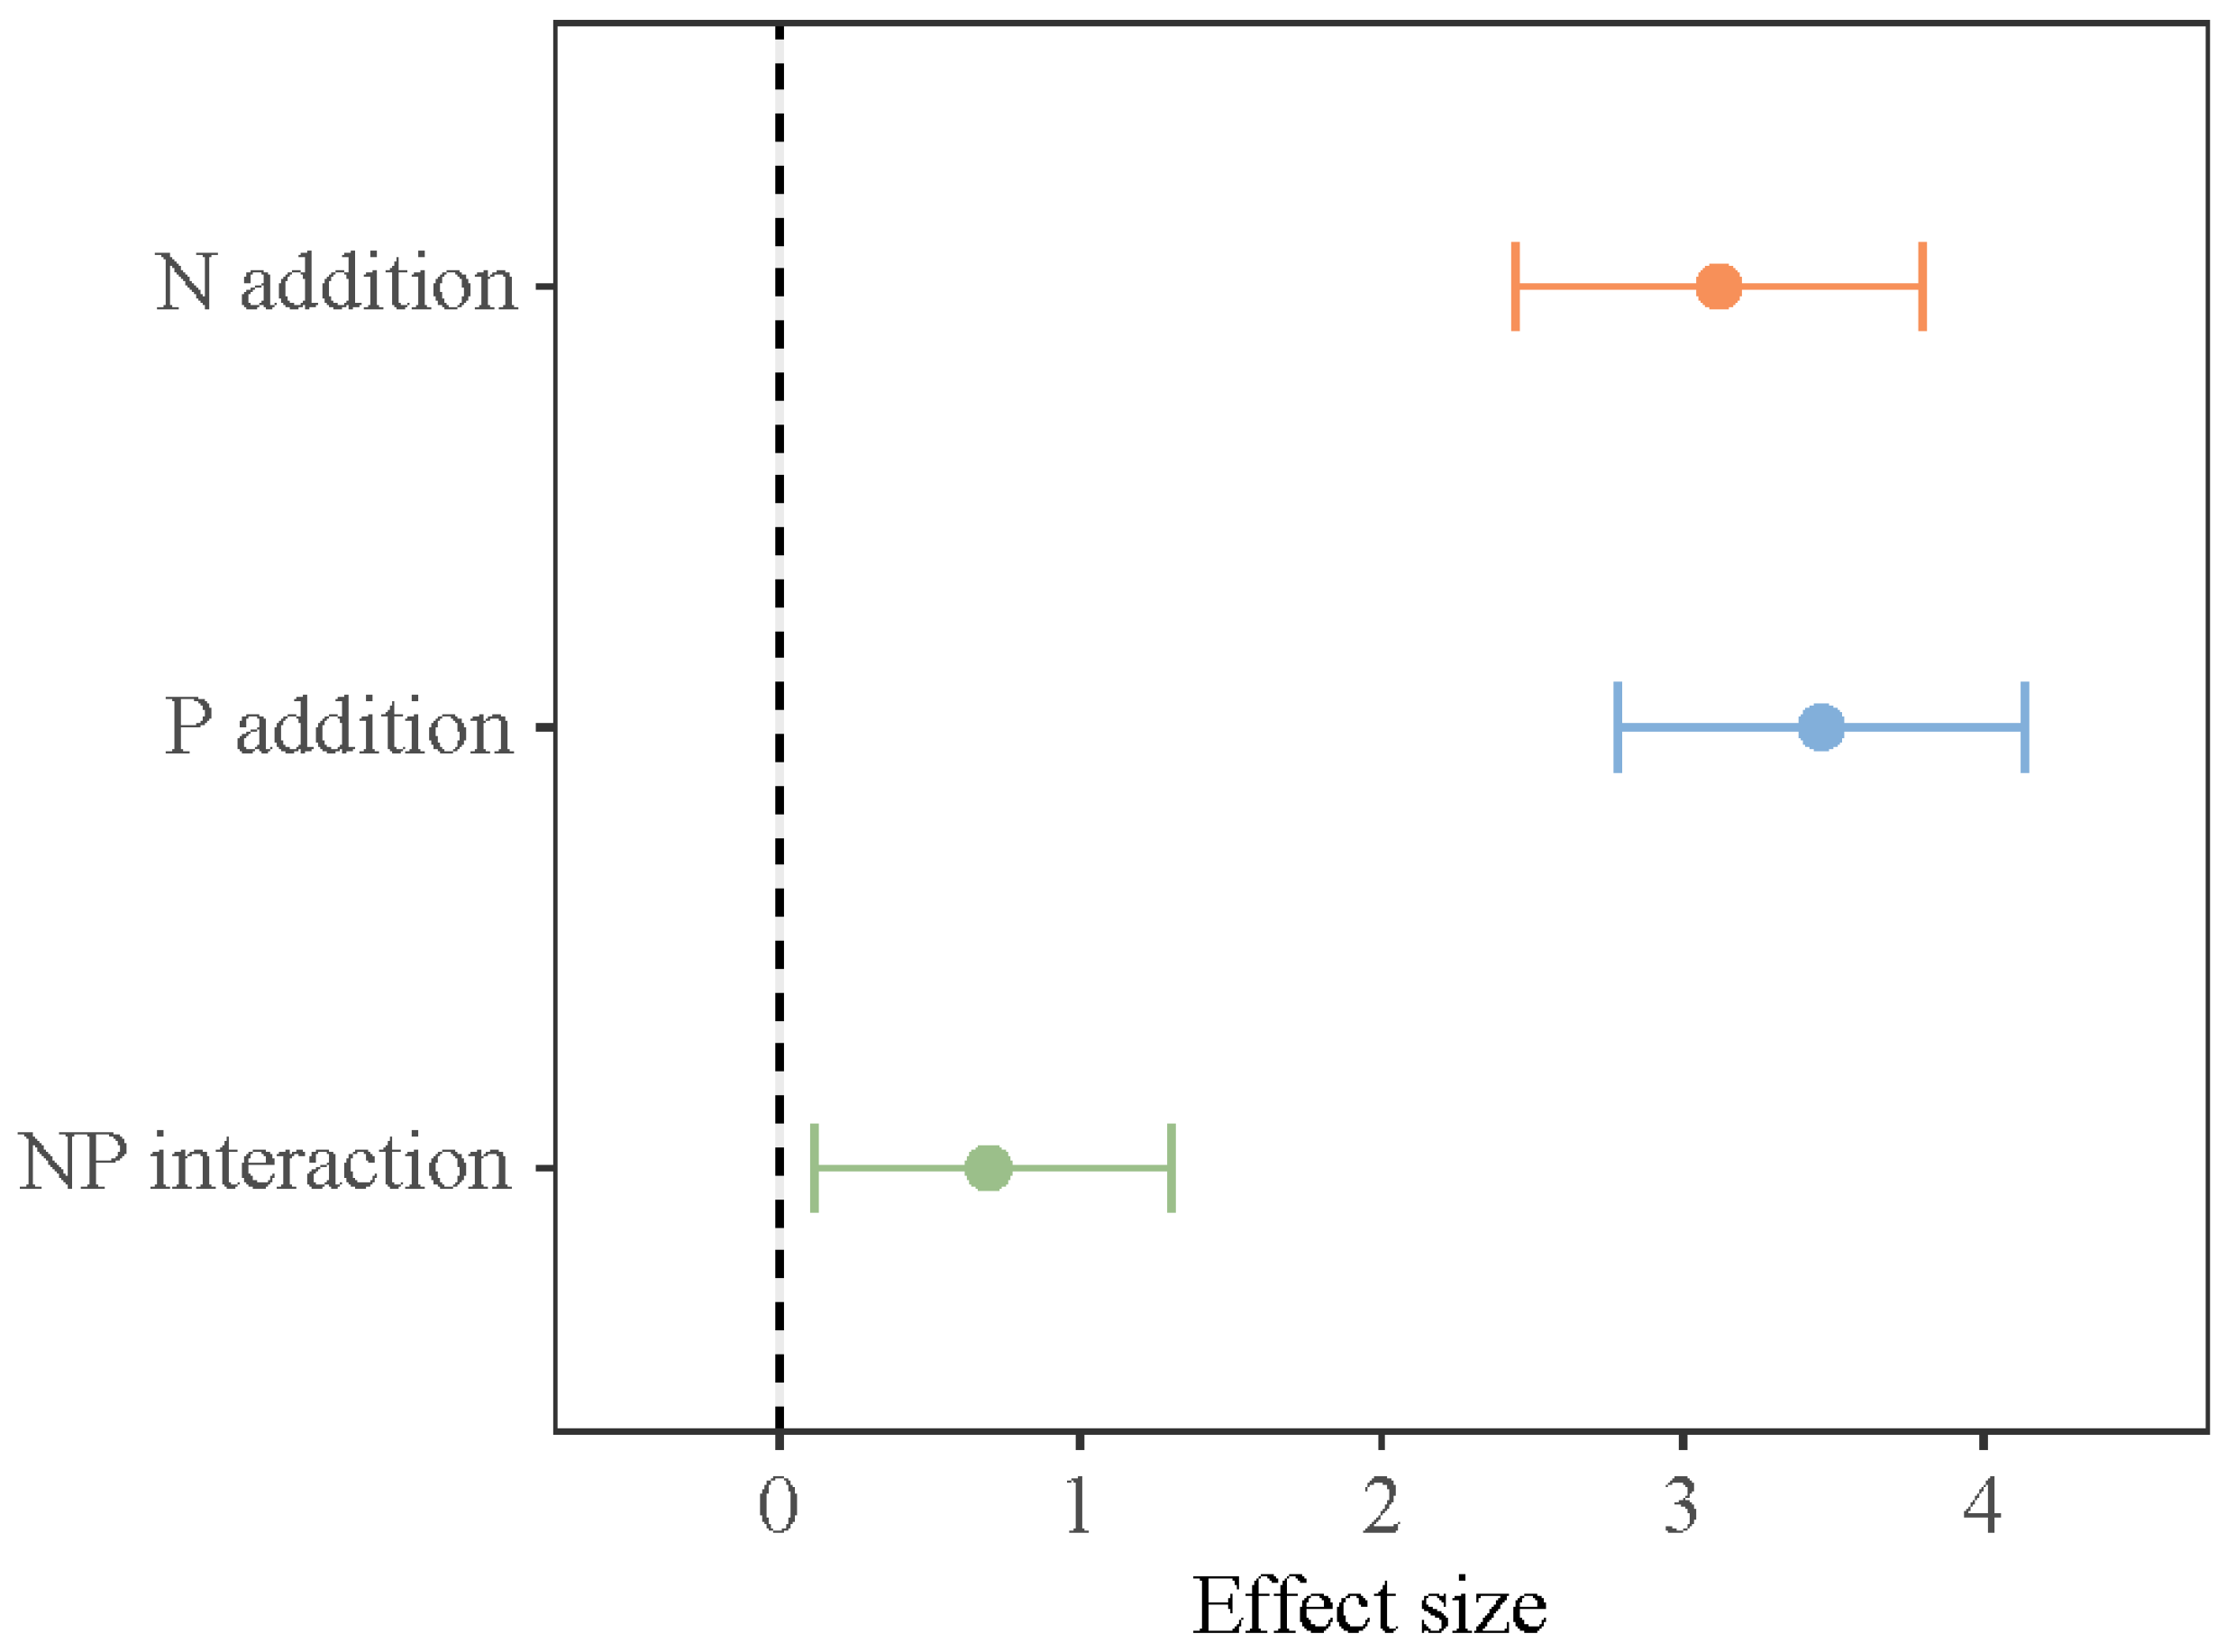
3.2. Effects of Short-Term N and P Additions on SOC Storage

Short-term N and P addition treatments, the growth stage, and their interaction all make critical differences in SOC storage in the lakeshore area (p < 0.05, Table 1). N addition and NP addition significantly increased SOC storage at the early growing season (Figure 3). During the peak growing season, only NP addition significantly increased SOC storage. At the late growing season, there were no critical differences in SOC storage among the various treatments. In the interaction of N and P addition, N and P have a synergistic effect (Figure 4).

3.3. Correlation Analysis of Soil N2O Flux, SOC Storage, and Soil Physicochemical Factors Under N and P Additions

Under short-term N and P addition, N2O flux in the lakeshore zone was positively correlated with SOC storage, ST, soil moisture (SM), nitrate nitrogen, ammonium nitrogen, and MBN, but only the correlation with soil nitrate nitrogen content was statistically significant (Table 2). SOC storage was positively correlated with SM, ST, nitrate nitrogen, and ammonium nitrogen content, but none of these correlations were statistically significant.

3.4. Effects of Short-Term N and P Additions on Carbon Sequestration Benefits During the Growing Season

The effects of short-term N and P additions on soil carbon sequestration benefits vary across different growth stages (Table 3). In the early growing season, short-term N and P additions increased soil carbon sequestration benefits, with the NP treatment showing the largest change in sequestration rate at 98.1%. A similar trend was observed in the late growing season, where both N and P additions increased soil carbon sequestration benefits, with P addition leading to the highest increase of 38.5%. However, during the peak growing season, N and P additions reduced soil carbon sequestration benefits by 49% and 19.1%, respectively, while the NP addition increased carbon sequestration benefits by 56.5%. Additionally, the CO2 equivalent under short-term N and P additions at all growth stages was much lower than the organic carbon storage in the soil during the same stages.

4. Discussion

Short-term N and NP additions can increase the inorganic nitrogen content in the soil, promoting soil N2O flux, which is consistent with the results of previous studies [33,34]. Previous research has shown that soil nitrate nitrogen and ammonium nitrogen content under N addition treatments were higher than in the control group throughout the entire growing season [35,36]. An elevation in inorganic nitrogen results in an augmentation of the substrates participating in nitrification and denitrification, which are two crucial biochemical reactions regulating N2O emissions [35]. In an in situ control experiment conducted in temperate grasslands in the UK, an increase in nitrate nitrogen content was also found to promote soil denitrification, thus increasing soil N2O flux [37]. This study also found a crucial positive correlation between nitrate nitrogen and soil N2O flux. In the early growth season, P addition inhibits N2O emissions. This might be because P addition alleviates the P limit in the soil, thereby promoting the absorption of N by plant roots and reducing the N2O flux [38]. Additionally, it may also decrease the N2O flux by reducing the nitrate nitrogen in plants [39]. P addition may also adjust soil pH, promote or inhibit phosphatase activity in the soil, change the biological properties of the soil, and further alter N2O fluxes [40].
This study found that the effect of N and P addition on soil N2O flux in the lakeshore zone of Daihai Lake was not consistent across different growth stages. This is partly related to temperature differences at these various stages. Research has shown that temperature is a major factor driving seasonal variations in soil N2O emissions [41], with N2O flux positively correlated with temperature [42], consistent with our findings. Temperature changes can alter the activity of nitrifying and denitrifying microbes involved in N2O production, thereby affecting soil N2O emissions [43]. Additionally, N2O flux is positively correlated with soil moisture, which is contrary to previous research results [44]. This might be due to the differences in climate and soil characteristics in our study area. Differences in SM across different growth stages can also lead to variations in soil N2O flux in the lakeshore zone. Sharp fluctuations in SM often lead to significant changes in the physical and chemical properties of the soil, thereby regulating the nitrification and denitrification processes. An increase in soil moisture will promote microorganisms to consume more nutrients in order to participate in soil nitrification and denitrification processes, thereby altering soil N2O emissions [45,46]. Variations in temperature and moisture can also change microbial metabolic pathways, indirectly affecting soil N2O flux [47,48]. In summary, differences in ST and SM between growth stages influence aboveground plant activity and the microorganisms involved in nitrification and denitrification, leading to variations in soil N2O flux across different growth stages [49,50]. Furthermore, the additive effect of N and P on N2O might be due to the fact that, when the stimulating effect of N addition and the inhibitory effect of P addition occur simultaneously, the presence of one does not change the effect of the other [51].
Short-term N and P additions generally increased SOC storage in the lakeshore zone of Daihai Lake during the growing season, but this dynamic was influenced by the growth stage. A global meta-analysis found that N and P additions generally show a significant trend of promoting SOC accumulation [52], consistent with our findings. N addition mainly increases soil carbon input by increasing aboveground litter input and increases carbon output by increasing DOC leaching loss. However, the loss of the latter may be much smaller than the input of the former [52]. The addition of P directly increases the availability of P in the soil, promotes the growth of aboveground and underground biomass, further enhances the vitality of soil roots, and thereby leads to more carbon entering the soil through litter and plant roots [34]. N addition stimulates the accumulation of plant biomass, which in turn increases the demand for P and may lead to P limitation in plant growth. Therefore, the additional P input will enhance the individual effect of N addition and, in addition, the combined addition of N and P stimulates microbial activity [53], thereby resulting in a synergistic interaction between NP co-addition [54].
The soil carbon sequestration benefits of soils under short-term N and P addition primarily depend on the increase or decrease in SOC storage. In calculating carbon sequestration benefits, this study found that the carbon sequestration capacity of soils far exceeded the CO2 equivalent emissions from increased N2O under different treatments. Similar results have been observed in previous research. One study found that the nitrification process promotes N2O emissions in grassland soils and affects the net greenhouse gas balance (measured in CO2 equivalents). The N2O released during nitrification can be offset by carbon fixed primarily by autotrophs, such as ammonia-oxidizing archaea (AOA) [55]. The related study by Meta also indicated that the increased N2O emissions were not sufficient to negate the greenhouse gas reduction potential achieved through carbon sequestration strategies [56], which is consistent with the conclusions of this study. To comprehensively assess the warming trend in the experimental area, further consideration of CO2 and CH4 fluxes is required.

5. Conclusions

The effects of short-term N and P addition on soil N2O flux and organic carbon storage in the Daihai lakeshore zone vary at different growth stages. In the early and late stages of the growing season, the additional amounts of N and P had no significant effect on the N2O flux. During the peak growing season, the addition of N and NP significantly promoted the emission of N2O in the lakeshore zone. SOC storage in the lakeshore zone was jointly regulated by short-term N and P additions and the growth stages. In the early growing season, N and NP additions significantly promoted SOC accumulation while, during the peak growing season, only NP addition significantly increased the organic carbon pool. In the lakeshore zone, the changes in N2O emissions caused by the addition of N and P are insufficient to offset the potential for greenhouse gas reduction achieved due to the increase in SOC storage. The trade-off results between the increase in SOC storage and the change in N2O emissions indicate that the lakeshore zone not only has a certain self-regulating capacity in the carbon and N cycle, but also can contribute to greenhouse gas reduction, enhance the ecosystem service function, and strengthen the adaptability and sustainability of the ecosystem. This reflects the complexity and significance of the dynamics of the soil carbon pool in the lakeshore zone in the functions and services of the ecosystem, and provides important scientific basis and practical guidance for the formulation and implementation of greenhouse gas management strategies.

6. Limitations and Future Prospects

Agricultural runoff entering the soil can induce leaching effects. In this study, we simulated the N and P concentration levels from surrounding agricultural fields entering the soil, which would also trigger leaching effects. However, our study did not account for the impacts of nutrient leaching. Future research should consider these effects to provide a more comprehensive understanding of the dynamics involved. Additionally, this study is short-term and did not consider cumulative effects. Future research should also address these aspects to better understand long-term impacts. In the experimental design of this study, no nutrient addition gradient was set, which limited our comprehensive understanding of the response of nutrient concentration changes to wetland ecosystems. In the subsequent research, the multi-faceted influences of nutrient addition gradients on wetland ecosystems should be comprehensively analyzed. Moreover, although this study conducted elemental analysis and examined its impacts on N2O emissions and SOC, the scope of elements analyzed was limited. Future research should include a more comprehensive analysis of additional elements to provide a fuller understanding of their interactions and effects.

Author Contributions

S.Q.: Data curation; Methodology; Writing—original draft. G.J.: Data curation; Methodology; Writing—review and editing. W.C.: Methodology; Writing—review and editing. W.Z.: Writing-review and editing. Z.W.: Writing-review and editing. L.W. (Lixin Wang): Funding acquisition; Writing—review and editing. T.L.: Supervision; Writing—review and editing. J.G.: Supervision; Writing—review and editing. L.W. (Lu Wen): Supervision; Funding acquisition; Writing—review and editing. All authors have read and agreed to the published version of the manuscript.

Funding

This research was funded by Yinshanbeilu Grassland Eco-hydrology National Observation and Research Station, China Institute of Water Resources and Hydropower Research (Grant NO.YSS202108), the Science and Technology Project of Inner Mongolia (Grant NO. 2023YFHH0053), and the National Natural Science Foundation of China (Grant Nos. 32460288, 32160279).

Institutional Review Board Statement

Not applicable.

Informed Consent Statement

Not applicable.

Data Availability Statement

The original contributions presented in this study are included in the article. Further inquiries can be directed to the corresponding author.

Acknowledgments

We acknowledge all the producers of the datasets used in this study. We are also grateful to the reviewers for their helpful comments on the manuscript.

Conflicts of Interest

The authors declare that they have no conflicts of interest.

References

  1. Lal, R. Soil Carbon Sequestration Impacts on Global Climate Change and Food Security. Science 2004, 304, 1623–1627. [Google Scholar] [CrossRef] [PubMed]
  2. Amaral, V.; Ortega, T.; Romera-Castillo, C.; Forja, J. Linkages between Greenhouse Gases (CO2, CH4, and N2O) and Dissolved Organic Matter Composition in a Shallow Estuary. Sci. Total Environ. 2021, 788, 147863. [Google Scholar] [CrossRef] [PubMed]
  3. Ji, K.; Ouyang, W.; Lin, C.; He, M.; Liu, X. Eco-Hydrological Processes Regulate Lake Riparian Soil Organic Matter under Dryness Stress. Water Res. 2024, 260, 121938. [Google Scholar] [CrossRef] [PubMed]
  4. Yang, Z.; Zhao, Y.; Xia, X. Nitrous Oxide Emissions from Phragmites Australis-Dominated Zones in a Shallow Lake. Environ. Pollut. 2012, 166, 116–124. [Google Scholar] [CrossRef]
  5. Chen, H.; Yu, Z.; Wu, N.; Wang, Y.; Liu, X. “C-Wetland”: A New Paradigm to Enhance Conservation of Carbon-Rich Wetlands. Innovation 2023, 4, 100403. [Google Scholar] [CrossRef]
  6. Dai, T.; Liu, R.; Zhou, X.; Zhang, J.; Song, M.; Zou, P.; Bi, X.; Li, S. Role of Lake Aquatic–Terrestrial Ecotones in the Ecological Restoration of Eutrophic Water Bodies. Toxics 2023, 11, 560. [Google Scholar] [CrossRef]
  7. Zhuo, Y.; Zeng, W. Using Stable Nitrogen Isotopes to Reproduce the Process of the Impact of Human Activities on the Lakes in the Yunnan Guizhou Plateau in the Past 150–200 Years. Sci. Total Environ. 2020, 741, 140191. [Google Scholar] [CrossRef]
  8. Wang, M.; Jiang, T.; Mao, Y.; Wang, F.; Yu, J.; Zhu, C. Current Situation of Agricultural Non-Point Source Pollution and Its Control. Water Air Soil Pollut. 2023, 234, 471. [Google Scholar] [CrossRef]
  9. Ongley, E.D.; Xiaolan, Z.; Tao, Y. Current status of agricultural and rural non-point source Pollution assessment in China. Environ. Pollut. 2009, 158, 1159–1168. [Google Scholar] [CrossRef]
  10. Marschner, H. Andy Meharg Marschner’s Mineral Nutrition of Higher Plants. Exp. Agric. 2012, 48, 305. [Google Scholar] [CrossRef]
  11. Shen, Y.; Zhu, B. Effects of Nitrogen and Phosphorus Enrichment on Soil N2O Emission from Natural Ecosystems: A Global Meta-Analysis. Environ. Pollut. 2022, 301, 118993. [Google Scholar] [CrossRef] [PubMed]
  12. Wolf, I.; Russow, R. Different Pathways of Formation of N2O, N2 and NO in Black Earth Soil. Soil Biol. Biochem. 2000, 32, 229–239. [Google Scholar] [CrossRef]
  13. Zhu, X.; Luo, C.; Wang, S.; Zhang, Z.; Cui, S.; Bao, X.; Jiang, L.; Li, Y.; Li, X.; Wang, Q.; et al. Effects of Warming, Grazing/Cutting and Nitrogen Fertilization on Greenhouse Gas Fluxes during Growing Seasons in an Alpine Meadow on the Tibetan Plateau. Agric. For. Meteorol. 2015, 214–215, 506–514. [Google Scholar] [CrossRef]
  14. Ma, W.; Jiang, S.; Assemien, F.; Qin, M.; Ma, B.; Xie, Z.; Liu, Y.; Feng, H.; Du, G.; Ma, X.; et al. Response of Microbial Functional Groups Involved in Soil N Cycle to N, P and NP Fertilization in Tibetan Alpine Meadows. Soil Biol. Biochem. 2016, 101, 195–206. [Google Scholar] [CrossRef]
  15. Gao, Y.; Chen, H.; Schumann, M.; Wu, Y.; Zeng, X. Short-Term Responses of Nitrous Oxide Fluxes to Nitrogen and Phosphorus Addition in a Peatland on the Tibetan Plateau. Environ. Eng. Manag. J. 2015, 14, 121–127. [Google Scholar] [CrossRef]
  16. Sommerfeld, R.; Mosier, A.; Musselman, R. CO2, CH4 and N2O flux through a Wyoming snowpack and implications for global budgets. Nature 1993, 361, 140–142. [Google Scholar] [CrossRef]
  17. Xu, Y.; Zhao, Y.; Cha, X.; Yang, W.; Zheng, M.; Liu, S.; Wang, Y.; Cai, A.; Han, X.; Yang, G.; et al. Nitrogen Addition-Driven Soil Organic Carbon Stability Depends on the Fractions of Particulate and Mineral-Associated Organic Carbon. Nutr. Cycl. Agroecosyst. 2024, 128, 269–281. [Google Scholar] [CrossRef]
  18. Tang, B.; Rocci, K.S.; Lehmann, A.; Rillig, M.C. Nitrogen Increases Soil Organic Carbon Accrual and Alters Its Functionality. Glob. Chang. Biol. 2023, 29, 1971–1983. [Google Scholar] [CrossRef]
  19. Wang, R.; Bicharanloo, B.; Hou, E.; Jiang, Y.; Dijkstra, F.A. Phosphorus Supply Increases Nitrogen Transformation Rates and Retention in Soil: A Global Meta-Analysis. Earth Future 2022, 10, e2021EF002479. [Google Scholar] [CrossRef]
  20. Feng, J.; Zhu, B. A Global Meta-Analysis of Soil Respiration and Its Components in Response to Phosphorus Addition. Soil Biol. Biochem. 2019, 135, 38–47. [Google Scholar] [CrossRef]
  21. Liu, B.; Wu, R.; Xue, B.; Gao, R.; An, H.; Liu, L.; Ndzana, G.M.; Du, L.; Kamran, M. Effects of Nutrient Addition on the Composition and Chemical Characteristics of Soil Dissolved Organic Matter in a Desert Steppe in Northern China. Land Degrad. Dev. 2024, 35, 1365–1380. [Google Scholar] [CrossRef]
  22. Liu, Y.; Zang, H.; Ge, T.; Bai, J.; Lu, S.; Zhou, P.; Peng, P.; Shibistova, O.; Zhu, Z.; Wu, J.; et al. Intensive Fertilization (N, P, K, Ca, and S) Decreases Organic Matter Decomposition in Paddy Soil. Appl. Soil Ecol. 2018, 127, 51–57. [Google Scholar] [CrossRef]
  23. Turner, B.L.; Yavitt, J.B.; Harms, K.E.; Garcia, M.N.; S. Wright, J. Seasonal Changes in Soil Organic Matter after a Decade of Nutrient Addition in a Lowland Tropical Forest. Biogeochemistry 2015, 123, 221–235. [Google Scholar] [CrossRef]
  24. Tenuta, M.; Mkhabela, M.; Tremorin, D.; Coppi, L.; Phipps, G.; Flaten, D.; Ominski, K. Nitrous Oxide and Methane Emission from a Coarse-Textured Grassland Soil Receiving Hog Slurry. Agric. Ecosyst. Environ. 2010, 138, 35–43. [Google Scholar] [CrossRef]
  25. Yin, G.; Hou, L.; Liu, M.; Li, X.; Zheng, Y.; Gao, J.; Jiang, X.; Wang, R.; Yu, C.; Lin, X. DNRA in intertidal sediments of the Yangtze Estuary. J. Geophys. Res. Biogeosci. 2017, 122, 1988–1998. [Google Scholar] [CrossRef]
  26. Wang, H.; Huang, W.; He, Y.; Niu, Y.; Zhu, Y. Effects of short-term warming and precipitation reduction on soil microbial biomass carbon, nitrogen and enzyme activity in sandy grassland. J. Desert Res. 2022, 42, 274–281. [Google Scholar]
  27. Zhou, H.; Yu, W.; Ma, Q.; Zhang, L. A Modified Fumigation Extraction Method for the Determination of Soil Microbial Biomass Carbon. Chin. J. Soil Sci. 2009, 40, 154–157. [Google Scholar]
  28. Sato, J.H.; de Figueiredo, C.C.; Marchão, R.L.; Madari, B.E.; Benedito, L.E.C.; Busato, J.G.; de Souza, D.M. Methods of Soil Organic Carbon Determination in Brazilian Savannah Soils. Sci. Agric. 2014, 71, 302–308. [Google Scholar] [CrossRef]
  29. Jiang, S. Review on soil bulk density determination method. J. Hubei Agric. Sci. 2019, 58, 82–86. [Google Scholar] [CrossRef]
  30. Ma, Y.; Feng, S.; Huang, Q.; Liu, Q.; Zhang, Y.; Niu, Y. Distribution characteristics of soil carbon density and influencing factors in Qinghai–Tibet Plateau region. Env. Geochem. Health 2024, 46, 152. [Google Scholar] [CrossRef]
  31. Crain, C.M.; Kroeker, K.; Halpern, B.S. Interactive and cumulative effects of multiple human stressors in marine systems. Ecol. Lett. 2008, 11, 1304–1315. [Google Scholar] [CrossRef] [PubMed]
  32. Zhou, L.Y.; Zhou, X.H.; Shao, J.J.; Nie, Y.Y.; He, Y.H.; Jiang, L.L.; Wu, Z.T.; Bai, S.H. Interactive effects of global change factors on soil respiration and its components: A meta-analysis. Glob. Chang. Biol. 2016, 22, 3157–3169. [Google Scholar] [CrossRef] [PubMed]
  33. Tian, H.; Xu, R.; Canadell, J.G.; Thompson, R.L.; Winiwarter, W.; Suntharalingam, P.; Davidson, E.A.; Ciais, P.; Jackson, R.B.; Maenhout, G.J.; et al. A Comprehensive Quantification of Global Nitrous Oxide Sources and Sinks. Nature 2020, 586, 248–256. [Google Scholar] [CrossRef] [PubMed]
  34. Lu, X.; Wen, L.; Sun, H.; Fei, T.; Liu, H.; Ha, S.; Tang, S.; Wang, L. Responses of Soil Respiration to Phosphorus Addition in Global Grasslands: A Meta-Analysis. J. Clean. Prod. 2022, 349, 131413. [Google Scholar] [CrossRef]
  35. Wang, F.; Li, J.; Wang, X.; Zhang, W.; Zou, B.; Neher, D.A.; Li, Z. Nitrogen and Phosphorus Addition Impact Soil N2O Emission in a Secondary Tropical Forest of South China. Sci. Rep. 2014, 4, 5615. [Google Scholar] [CrossRef]
  36. Ullah, B.; Shaaban, M.; Hu, R.; Zhao, J.; Lin, S. Assessing Soil Nitrous Oxide Emission as Affected by Phosphorus and Nitrogen Addition under Two Moisture Levels. J. Integr. Agric. 2016, 15, 2865–2872. [Google Scholar] [CrossRef]
  37. Cui, Q.; Song, C.; Wang, X.; Shi, F.; Wang, L.; Guo, Y. Rapid N2O Fluxes at High Level of Nitrate Nitrogen Addition during Freeze-Thaw Events in Boreal Peatlands of Northeast China. Atmos. Environ. 2016, 135, 1–8. [Google Scholar] [CrossRef]
  38. Mori, T.; Ohta, S.; Ishizuka, S.; Konda, R.; Wicaksono, A.; Heriyanto, J. Phosphorus application reduces N2O emissions from tropical leguminous plantation soil when phosphorus uptake is occurring. Biol. Fertil. Soils 2014, 50, 45–51. [Google Scholar] [CrossRef]
  39. Liu, Y.; Li, Y.; Wan, Y.; Gao, Z.; Qin, X.; Chen, D. Nitrous Oxide Emissions from Spring-maize Field Under the Application of Different Nitrogen and Phosphorus Fertilizers. J. Agro-Environ. Sci. 2011, 30, 1468–1475. [Google Scholar]
  40. Li, C.; Bai, H.; Dang, T.; Wang, W. Relationship of field soil phosphatase activity and soil N2O emission flux. China Environ. Sci. 2007, 2, 231–234. [Google Scholar]
  41. Bremner, J.M.; Robbins, S.G.; Blackmer, A.M. Seasonal Variability in Emission of Nitrous Oxide from Soil. Geophys. Res. Lett. 1980, 7, 641–644. [Google Scholar] [CrossRef]
  42. Cheng, J.; Xu, L.; Jiang, M.; Jiang, J.; Xu, Y. Warming Increases Nitrous Oxide Emission from the Littoral Zone of Lake Poyang, China. Sustainability 2020, 12, 5674. [Google Scholar] [CrossRef]
  43. Zhang, Y.; Zhang, N.; Yin, J.; Yang, F.; Zhao, Y.; Jiang, Z.; Tao, J.; Yan, X.; Qiu, Y.; Guo, H.; et al. Combination of Warming and N Inputs Increases the Temperature Sensitivity of Soil N2O Emission in a Tibetan Alpine Meadow. Sci. Total Environ. 2020, 704, 135450. [Google Scholar] [CrossRef] [PubMed]
  44. Manono, B.O. Carbon dioxide, nitrous oxide and methane emissions from the Waimate District (New Zealand) pasture soils as influenced by irrigation, effluent dispersal and earthworms. Cogent Environ. Sci. 2016, 2, 1256564. [Google Scholar] [CrossRef]
  45. Lan, T.; Han, Y.; Roelcke, M.; Nieder, R.; Cai, Z. Processes Leading to N2O and NO Emissions from Two Different Chinese Soils under Different Soil Moisture Contents. Plant Soil 2013, 371, 611–627. [Google Scholar] [CrossRef]
  46. Pastore, M.A.; Megonigal, J.P.; Langley, J.A. Elevated CO2 promotes long-term nitrogen accumulation only in combination with nitrogen addition. Glob. Chang. Biol. 2016, 22, 391–403. [Google Scholar] [CrossRef]
  47. Dai, Z.; Yu, M.; Chen, H.; Zhao, H.; Huang, Y.; Su, W.; Xia, F.; Chang, S.X.; Brookes, P.C.; Dahlgren, R.A.; et al. Elevated Temperature Shifts Soil N Cycling from Microbial Immobilization to Enhanced Mineralization, Nitrification and Denitrification across Global Terrestrial Ecosystems. Glob. Chang. Biol. 2020, 26, 5267. [Google Scholar] [CrossRef]
  48. Chen, H.; Mothapo, N.V.; Shi, W. Soil Moisture and pH Control Relative Contributions of Fungi and Bacteria to N2O Production. Microb. Ecol. 2015, 69, 180–191. [Google Scholar] [CrossRef]
  49. Yue, P.; Zuo, X.; Li, K.; Li, X.; Wang, S.; Ma, X.; Qu, H.; Chen, M.; Liu, L.; Misselbrook, T.; et al. Responses of Ecosystem Respiration, Methane Uptake and Nitrous Oxide Emission to Drought in a Temperate Desert Steppe. Plant Soil 2021, 469, 409–421. [Google Scholar] [CrossRef]
  50. Bouwman, A.F.; Fung, I.; Matthews, E.; John, J. Global Analysis of the Potential for N2O Production in Natural Soils. Glob. Biogeochem. Cycles 1993, 7, 557–597. [Google Scholar] [CrossRef]
  51. Tang, Y.C.; Zhang, X.Y.; Li, D.D.; Wang, H.M.; Chen, F.S.; Fu, X.L.; Fang, X.M.; Sun, X.M.; Yu, G.R. Impacts of nitrogen and phosphorus additions on the abundance and community structure of ammonia oxidizers and denitrifying bacteria in Chinese fir plantations. Soil Biol. Biochem. 2016, 103, 284–293. [Google Scholar] [CrossRef]
  52. Liu, L.; Greaver, T.L. A Global Perspective on Belowground Carbon Dynamics under Nitrogen Enrichment. Ecol. Lett. 2010, 13, 819–828. [Google Scholar] [CrossRef] [PubMed]
  53. Jiang, J.; Wang, Y.P.; Liu, F.; Du, Y.; Zhuang, W.; Chang, Z.; Yu, M.; Yan, J. Antagonistic and additive interactions dominate the responses of belowground carbon-cycling processes to nitrogen and phosphorus additions. Soil Biol. Biochem. 2021, 156, 108216. [Google Scholar] [CrossRef]
  54. Yue, K.; Fornara, D.A.; Yang, W.; Peng, Y.; Peng, C.; Liu, Z.; Wu, F. Influence of Multiple Global Change Drivers on Terrestrial Carbon Storage: Additive Effects Are Common. Ecol. Lett. 2017, 20, 663–672. [Google Scholar] [CrossRef] [PubMed]
  55. Xia, W.; Bowatte, S.; Jia, Z.; Newton, P. Offsetting N2O Emissions through Nitrifying CO2 Fixation in Grassland Soil. Soil Biol. Biochem. 2022, 165, 108528. [Google Scholar] [CrossRef]
  56. Guenet, B.; Gabrielle, B.; Chenu, C.; Arrouays, D.; Balesdent, J.; Bernoux, M.; Bruni, E.; Caliman, J.P.; Cardinael, R.; Chen, S.; et al. Can N2O Emissions Offset the Benefits from Soil Organic Carbon Storage? Glob. Change Biol. 2020, 27, 237–256. [Google Scholar] [CrossRef]
Figure 1. N2O Flux at different growth stages. Note: N0P0, N1P0, N0P1, and N1P1 represent the control, nitrogen addition, phosphorus addition, and combined nitrogen–phosphorus addition treatments, respectively. Lowercase letters atop the bar chart denote significant differences between treatments (LSD, p < 0.05). Error bars indicate standard errors (n = 4).
Sustainability 17 05987 g001
Figure 2. Interactive effects of N and P addition on soil N2O emission. Note: The error bar represents a 95% confidence interval (CI). The same applies below.
Sustainability 17 05987 g002
Figure 3. Organic carbon storage at different growth stages. Note: N0P0, N1P0, N0P1, and N1P1 represent the control, nitrogen addition, phosphorus addition, and combined nitrogen–phosphorus addition treatments, respectively. Lowercase letters atop the bar chart denote significant differences between treatments (LSD, p < 0.05). Error bars indicate standard errors (n = 4).
Sustainability 17 05987 g003
Figure 4. Interactive effects of N and P addition on soil organic carbon storage.
Sustainability 17 05987 g004
Table 1. Two-factor ANOVA of N2O flux and carbon storage under different treatments and growth stages.
FactorTreatmentGrowth StagesTreatment × Growth Stages
FpFpFp
N2O flux1.1670.3366.6870.0031.1720.343
organic carbon storage4.4870.0185.2140.0042.8260.023
Table 2. Correlation between N2O flux, organic carbon storage, and soil physicochemical factors.
N2O FluxsOrganic Carbon Storage
organic carbon storage0.4391
pH−0.164−0.504
ST0.255−0.151
SM0.1300.107
NO3-N0.682 *0.521
NH4+-N0.2020.146
MBC−0.149−0.561
MBN0.4040.089
Note: ST: Soil temperature, SM: Soil moisture, MBN: Microbial biomass nitrogen, * indicates statistical significance at p < 0.05.
Table 3. Carbon sequestration benefits of different growth stages and treatments under N and P addition.
Growth StageTreatmentOrganic Carbon Carbon Stocks (T)
kg·m−2
CO2 (T) Equivalent
kg·m−2
Carbon Sequestration Benefits (T)
kg·m−2
The Change Rate of Carbon Sequestration Benefits
%
early part of growing seasonN0.62180.00510.626972.7
P0.17300.00770.180720.9
NP0.8509−0.00470.846298.1
peak growing seasonN−0.4340−0.0172−0.4512−49.0
P−0.1757−0.0004−0.1761−19.1
NP0.5385−0.01760.520956.5
late growing seasonN0.0038−0.00130.00250.3
P0.3434−0.00430.339138.5
NP0.18180.00090.182720.8
Note: Since the global warming potential of N2O is 298 times that of CO2, CO2 equivalent = N2O flux × 298. A negative sign “−” indicates a reduction in CO2 equivalent emissions compared to the control (N0P0) treatment due to N or P additions. Change rate of carbon sequestration benefits: Carbon sequestration benefits (T)/Organic carbon storage in the control treatment (N0P0).
Disclaimer/Publisher’s Note: The statements, opinions and data contained in all publications are solely those of the individual author(s) and contributor(s) and not of MDPI and/or the editor(s). MDPI and/or the editor(s) disclaim responsibility for any injury to people or property resulting from any ideas, methods, instructions or products referred to in the content.

