Article

Sustainable Coastal Evolution and Critical Sediment Load Estimation in the Yellow River Delta

1
School of Civil Engineering, University of South China, Hengyang 421001, China
2
State Key Laboratory of Resources and Environmental Information System, Institute of Geographic Sciences and Natural Resources Research, Chinese Academy of Sciences, Beijing 100101, China
*
Author to whom correspondence should be addressed.
Sustainability 2025, 17(13), 5943; https://doi.org/10.3390/su17135943
Submission received: 28 April 2025 / Revised: 18 June 2025 / Accepted: 24 June 2025 / Published: 27 June 2025

Abstract

The coastline of the Yellow River Delta in China has experienced significant dynamic changes due to both natural and human activities. Investigating its coastal dynamics and understanding the equilibrium with riverine runoff and sediment discharge is crucial for ecological balance and sustainable development in the region. In this study, a coastline extraction algorithm was developed by integrating water index and dynamic frequency thresholds based on the Google Earth Engine platform. Long-term optical remote sensing datasets from Landsat (1988–2016) and Sentinel-2 (2017–2023) were utilized. The End Point Rate (EPR) and Linear Regression Rate (LRR) methods were employed to quantify coastline changes, and the relationship between coastal evolution and runoff–sediment dynamics was investigated. The results revealed the following: (1) The coastline of the Yellow River Delta exhibits pronounced spatiotemporal variability. From 1988 to 2023, the Diaokou estuary recorded the lowest EPR and LRR values (−206.05 m/a and −248.33 m/a, respectively), whereas the Beicha estuary recorded the highest values (317.54 m/a and 374.14 m/a, respectively). (2) The cumulative land area change displayed a fluctuating pattern, characterized by a general trend of increase–decrease–increase, indicating a gradual progression toward dynamic equilibrium. The Diaokou estuary has been predominantly erosional, while the Qingshuigou estuary experienced deposition prior to 1996, followed by subsequent erosion. In contrast, the land area of the Beicha estuary has continued to increase since 1997. (3) Deltaic progradation has been primarily governed by runoff–sediment dynamics. Coastline advancement has occurred along active river channels as a result of sediment deposition, whereas former river mouths have retreated landward due to insufficient fluvial sediment input. In the Beicha estuary, increased land area has exhibited a strong positive correlation with annual sedimentary influx. The critical sediment discharge required to maintain equilibrium has been estimated at 79 million t/a for the Beicha estuary and 107 million t/a for the entire deltaic region. These findings provide a scientific foundation for sustainable sediment management, coastal restoration, and integrated land–water planning. This study supports sustainable coastal management, informs policymaking, and enhances ecosystem resilience.

1. Introduction

Sediment dynamics in deltas significantly affect coastal morphology, ecosystem stability, and coastal management. The Yellow River Delta in China, characterized by rapid changes, offers a representative case to examine these processes under natural and anthropogenic impacts. The coast of the Yellow River Delta is primarily composed of fine silty-sandy sediments in a temperate region. It features flat topography and extensive spatial coverage. This coastal landscape has been formed through the long-term deposition of substantial sediment loads transported by the Yellow River to its estuary [1]. It is influenced by the combined effects of fluvial sediment supply, marine dynamics, and anthropogenic activities [2,3], leading to frequent and substantial morphological changes. Extensive research has been conducted on the spatiotemporal dynamics of the Yellow River Delta coast, with particular emphasis on coastline evolution [4,5], variations in land area [5,6], and the underlying mechanisms driving coastal changes [2,7,8]. Given the highly dynamic and complex nature of these coastal processes, the timely and accurate acquisition of coastal information is essential for effective dynamic monitoring. Compared to traditional field surveys, which are time-consuming, labor-intensive, and costly, remote sensing provides considerable advantages. These include wide spatial coverage, operational efficiency, and ease of data acquisition. With the increasing availability of high-resolution satellite imagery, abundant data resources have become accessible, making the long-term and large-scale monitoring of coastal zones feasible. As a result, remote sensing-based coastal monitoring has emerged as a dominant approach in the study of coastal evolution [9,10,11].
Accurate extraction of the coastline is essential for monitoring coastal evolution dynamics. Existing methodologies include visual interpretation, remote sensing-based indices, threshold segmentation, edge detection, and machine learning algorithms [7,9,12]. These techniques have generally been effective for delineating the waterline from individual satellite images. For relatively stable, artificially modified coastlines, a single waterline snapshot may sufficiently approximate the actual coastline position. However, in silty littoral environments, such as those of the Yellow River Delta, coastline location is strongly influenced by tidal fluctuations. The waterline in these regions shifts continuously with tidal rise and fall, leading to significant variability in waterline positions derived from single-date or even multi-temporal composite imagery. Consequently, identifying a stable and representative coastline becomes challenging. To address this issue, time-series analysis of Surface Water Occurrence (SWO) has increasingly emerged as a mainstream approach for delineating coastlines in dynamic tidal settings. Wang et al. [13] generated annual SWO maps using time-series remote sensing imagery to examine the effects of varying thresholds on water distribution. Their findings indicated that the high tide and low tide lines could be approximated using SWO thresholds of 0.05 and 0.95, respectively. Nevertheless, fixed threshold values are limited in their ability to capture interannual variability in tidal regimes and often fail to reflect the full dynamism of coastline evolution over time. To enhance the adaptability of annual coastline extraction, Cao et al. [2] employed the Tidal Model Driver (TMD) to simulate annual tide levels and calculate corresponding frequency thresholds for high and low tide. Additionally, Liu et al. [14] applied the Jenks natural breaks classification method to stratify tidal point data and automatically distinguish supratidal, intertidal, and subtidal zones. However, these methods rely on sparse tidal observations and are difficult to fully characterize the long-term coastline dynamics of the Yellow River Delta.
In addition, the Yellow River Delta is a river-controlled delta, where variations in fluvial material output from the Yellow River into the sea exert a profound influence on coastal evolution [15,16]. In recent years, substantial seasonal and interannual fluctuations in runoff and fluvial processes have been observed. These changes have occurred under the influence of the Lower Yellow River runoff and the Sediment Regulation Project [17,18]. Human interventions have played a key role in shaping the delta’s coastal morphology. Numerous studies have examined the relationship between coastline evolution and riverine runoff–sediment dynamics in the Yellow River Delta. For instance, Kong et al. [7] analyzed the morphological changes of the Yellow River estuary by integrating annual runoff and sediment transport data from 17 hydrological stations, thereby highlighting the impacts of estuarine diversions and flow–sediment management projects on deltaic evolution. However, most existing research has focused either on the delta as a whole or on the estuarine outlet area, often lacking detailed comparative analyses of specific estuarine segments characterized by differing runoff–sediment regimes. Since the diversion of the Yellow River in 1996, coastal evolutionary patterns have diverged significantly between the Qingshuigou estuary and the current Beicha estuary. As a result, independent analysis of these estuarine sections is essential. Their distinct runoff and depositional characteristics must be considered to accurately characterize spatially heterogeneous coastal dynamics.
In this study, a coastline extraction algorithm was developed for coastal dynamics by integrating a water index with a dynamic frequency thresholding approach on the Google Earth Engine (GEE) platform (https://earthengine.google.com/). This study utilizes a long-term time series of optical remote sensing data from Landsat and Sentinel-2 (1988–2023). In addition, coastline evolution, sediment accretion patterns, and their responses to runoff–sediment dynamics were systematically analyzed across three representative estuarine segments of the Diaokou, Qingshuigou, and Beicha estuary. The critical sedimentary influx required to maintain a dynamic balance between coastal erosion and accretion in each estuarine segment was also quantified. These results provide a scientific foundation for coastal protection and the sustainable management of the Yellow River Delta in China.

2. Study Area and Data Sources
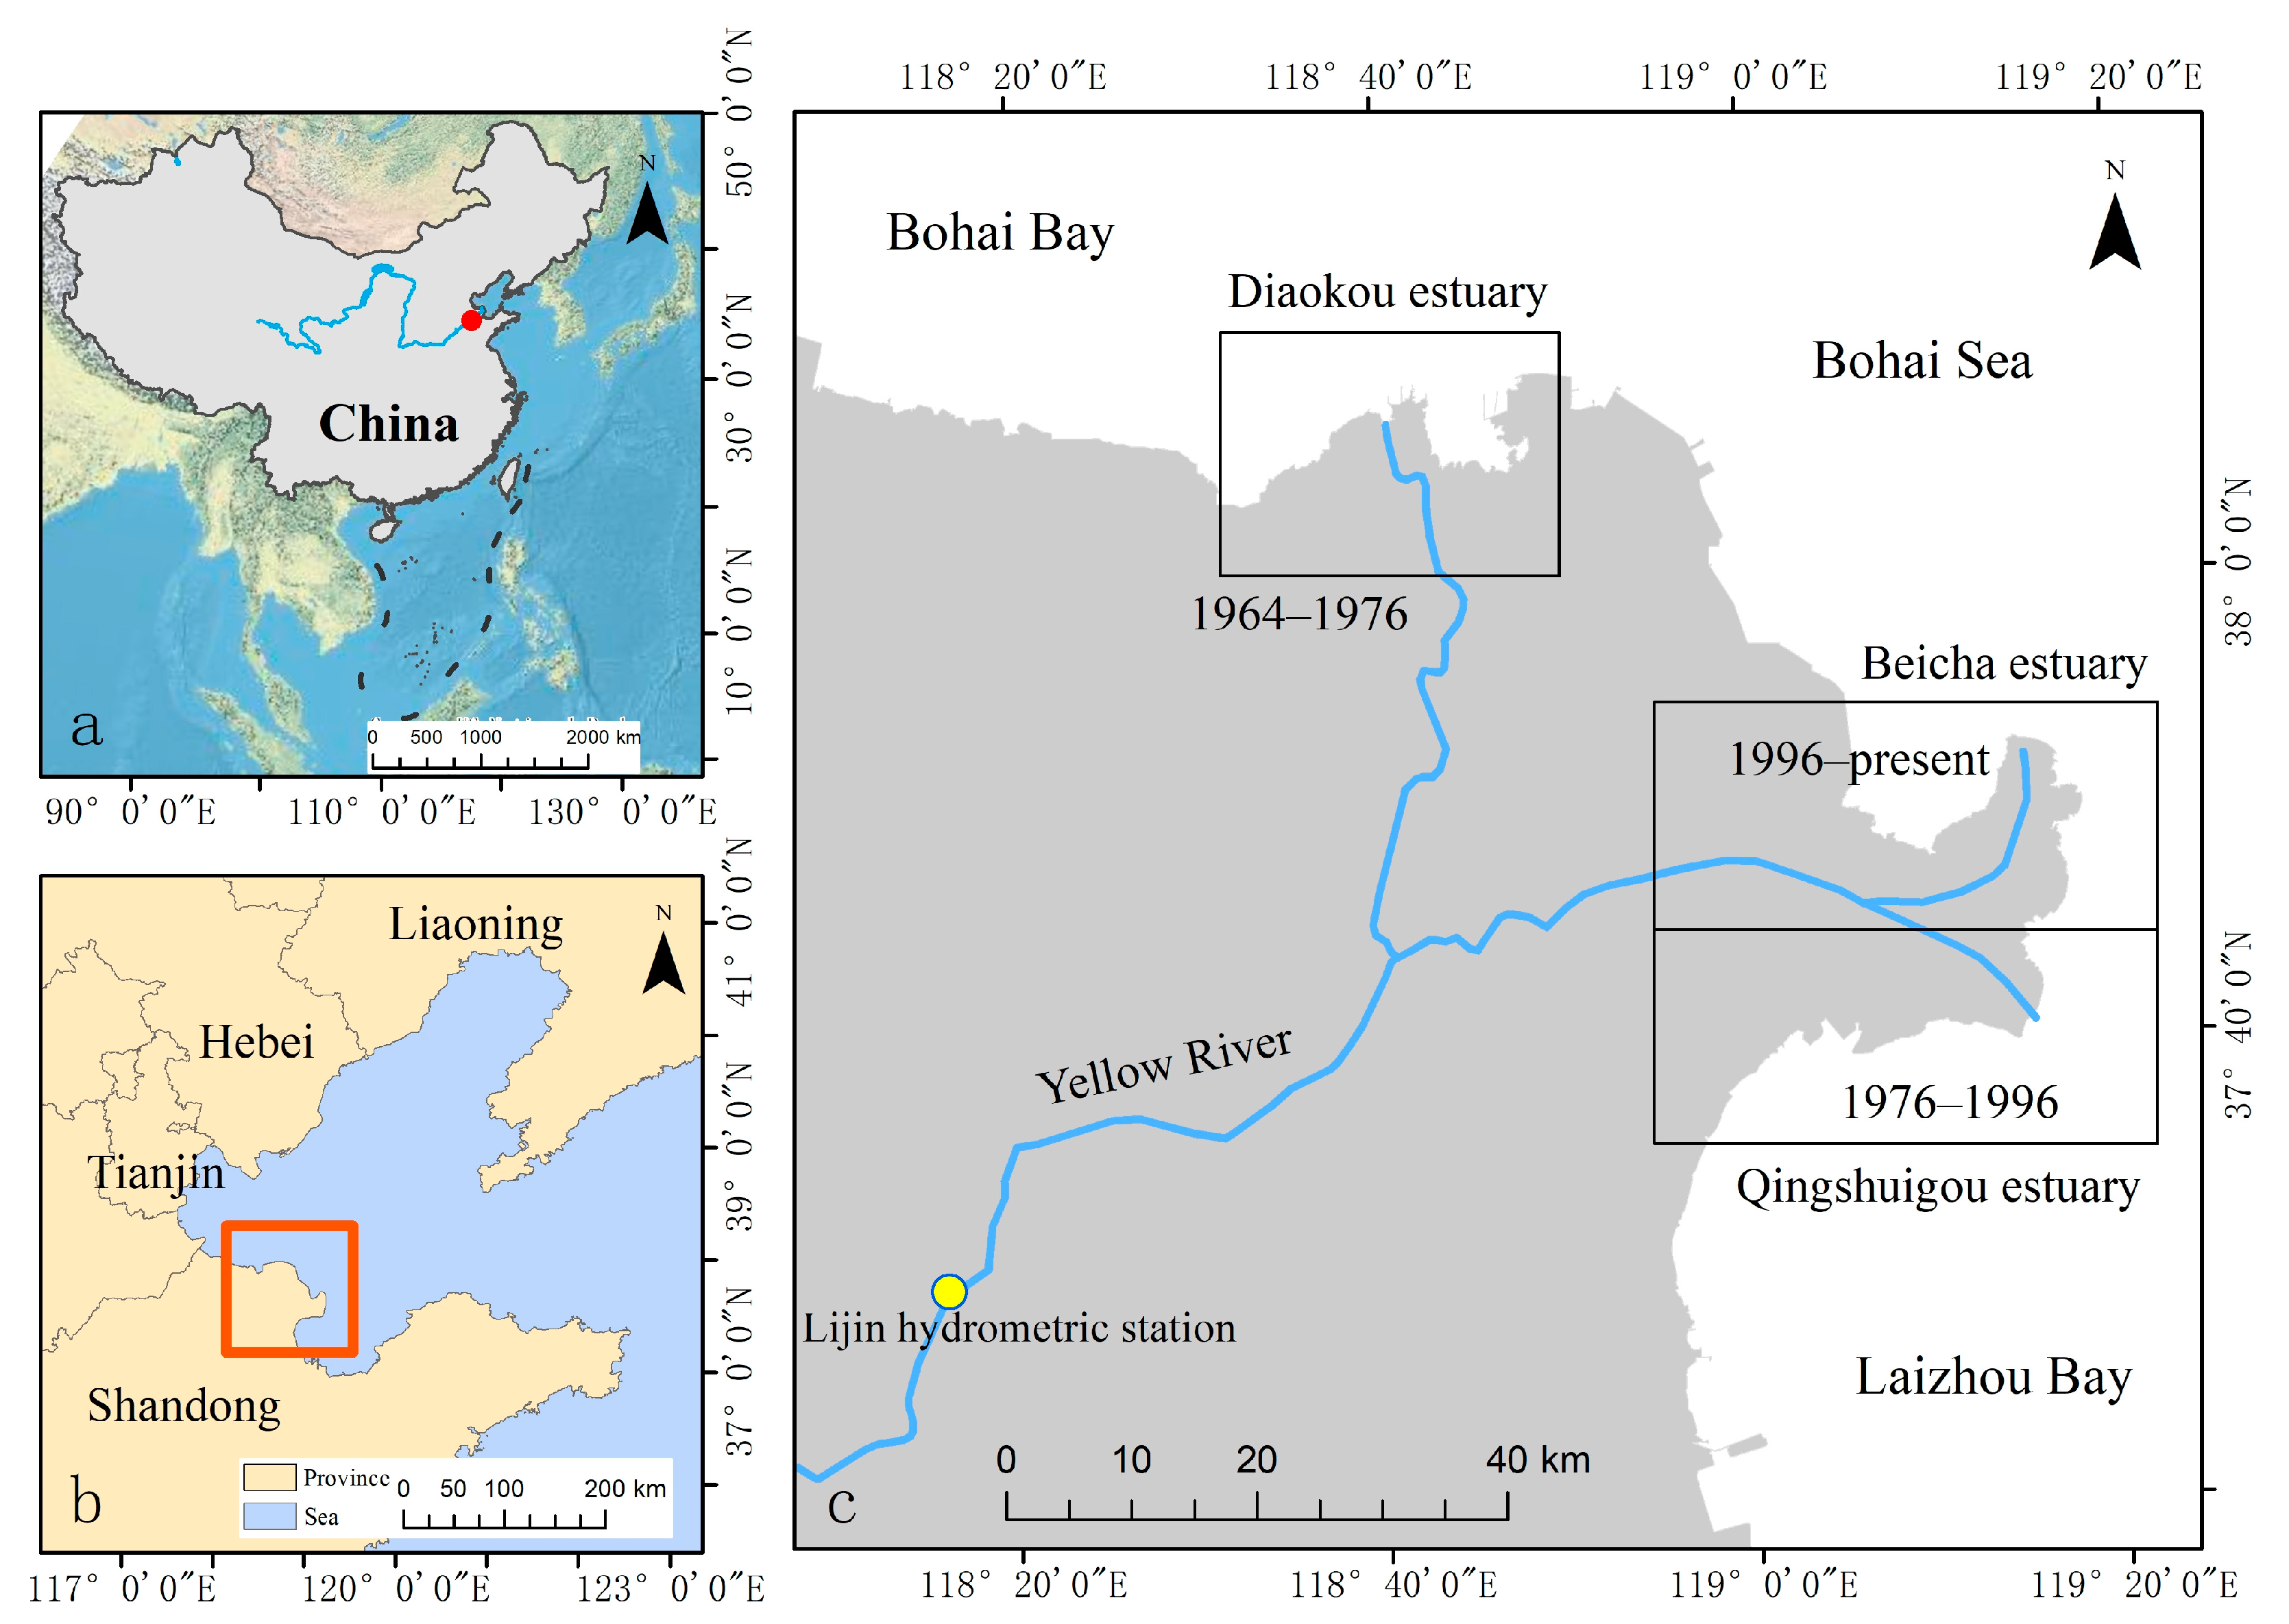
2.1. Study Area

The Yellow River Delta in China is situated in the northern part of Shandong Province, with Lijin County as its apex, extending from the Tuhai River in the west to the Xiaoqing River in the south. Throughout its history, the Yellow River has undergone three major anthropogenic diversions [5]: In 1964, the river’s outlet was shifted from Shenxiangou to the Diaokou estuary. In 1976, it was redirected to the Qingshuigou estuary. In 1996, the river was diverted again to the Beicha estuary. Since then, no large-scale alterations in the river’s path to the sea have occurred. In addition to these engineered diversions, runoff and sediment regulation projects implemented since 2002 have significantly reshaped the delta’s geomorphology [7]. Given the frequent and substantial changes along the estuarine coastline, this study not only investigates the overall coastal evolution of the Yellow River Delta, but it also focuses on three representative estuarine segments of Diaokou, Qingshuigou, and Beicha estuary (Figure 1).

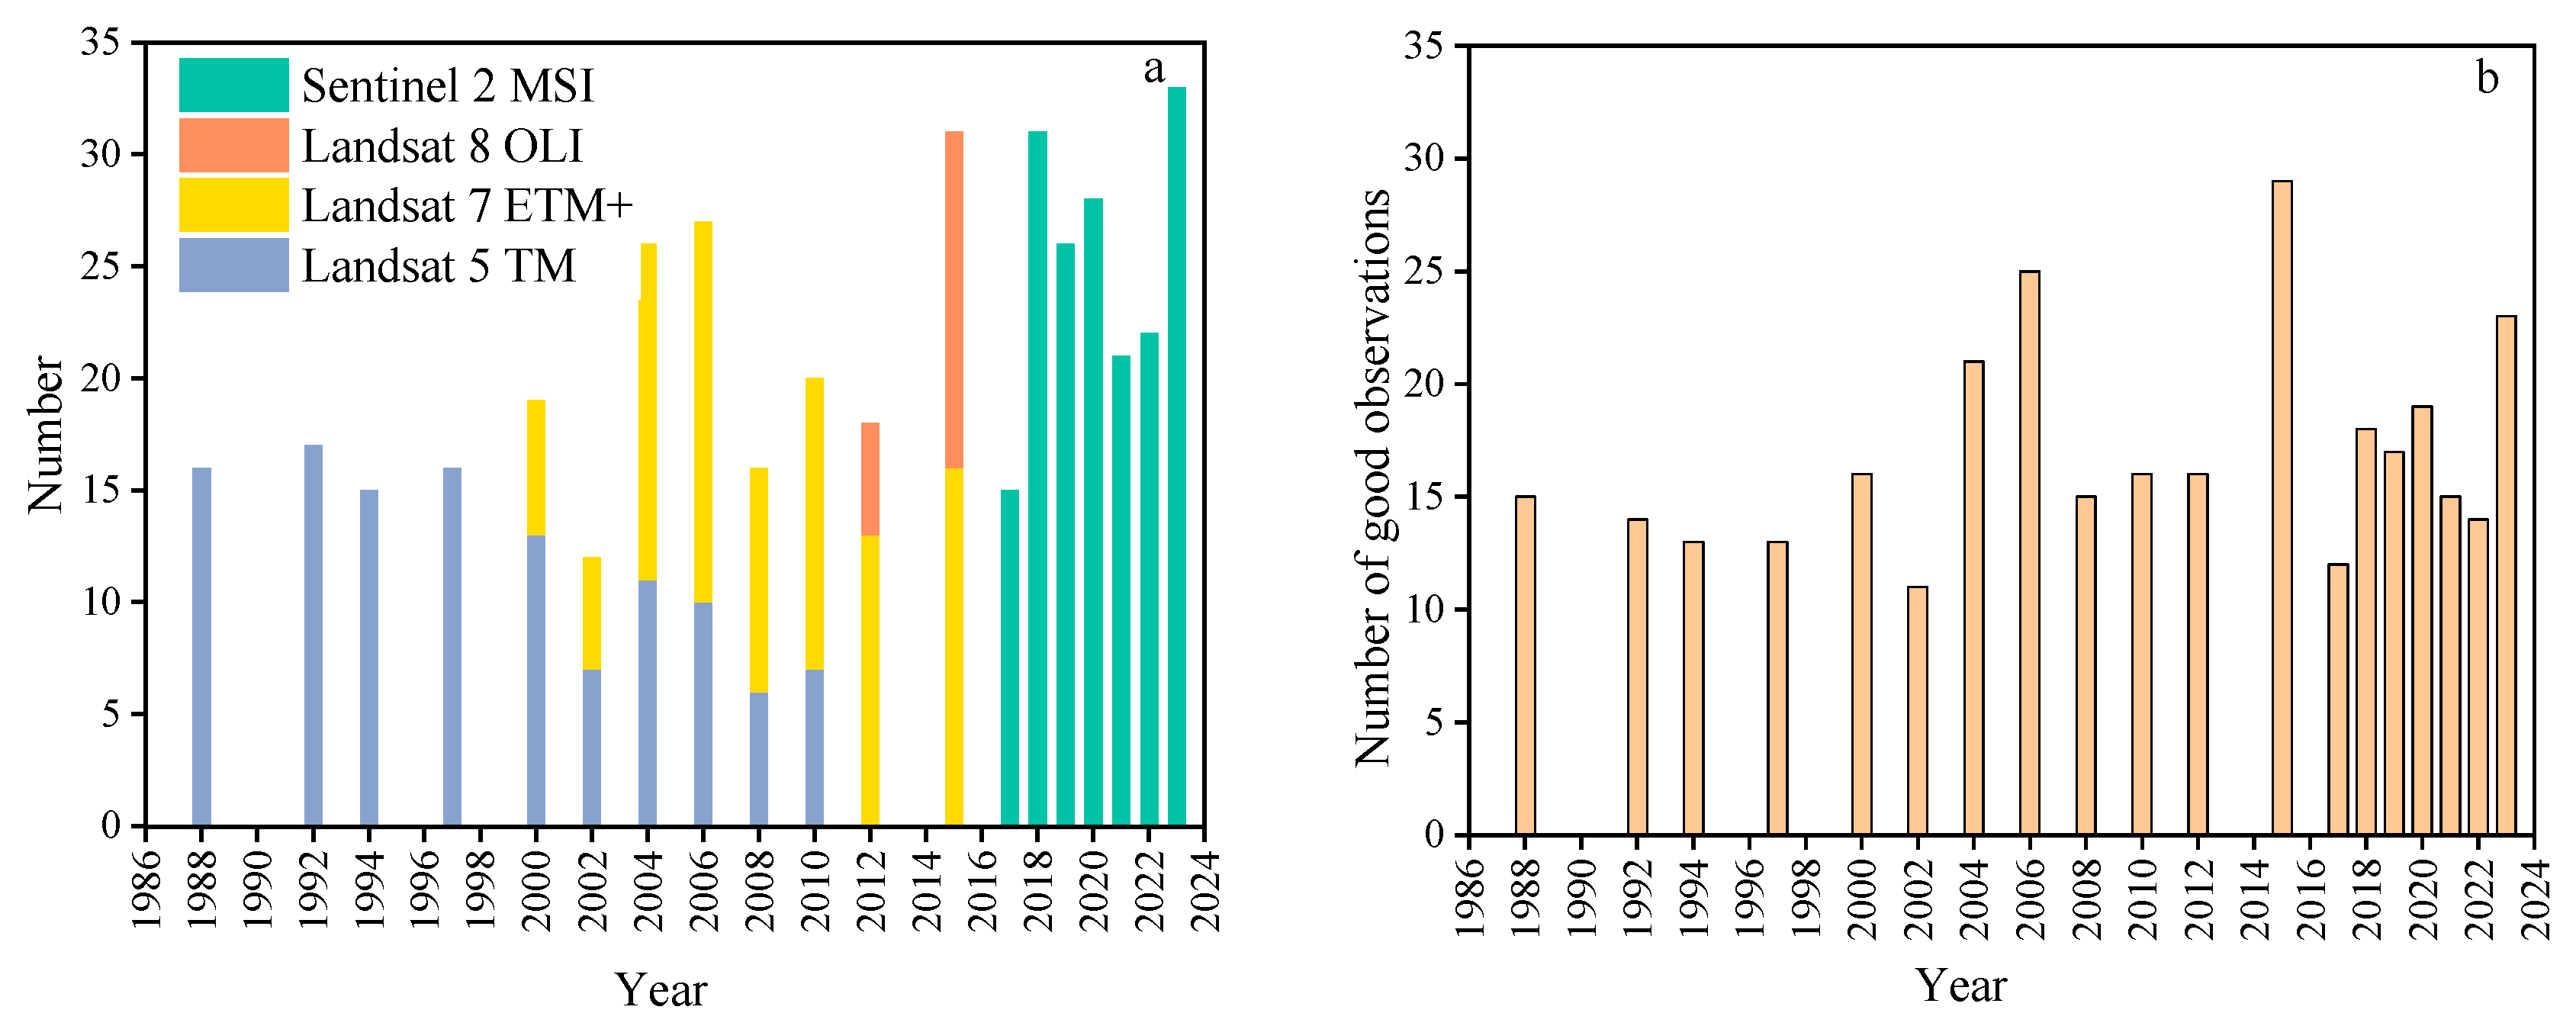
2.2. Remote Sensing Data

In this study, the Google Earth Engine (GEE) platform was used to obtain remote sensing imagery of the Yellow River Delta provided by the U.S. Geological Survey (USGS) (https://www.usgs.gov/). GEE is a platform for processing and analyzing large-scale satellite imagery and geospatial data, which is widely used in environmental and land surface studies. The dataset includes terrain-corrected and ortho-rectified Landsat 5 TM, Landsat 7 ETM+, and Landsat 8 OLI images from 1986 to 2016, along with Sentinel-2 MSI imagery from 2017 to 2023. The entire study area is covered by a single Landsat scene, from which a total of 233 images were acquired during 1986–2016. The study area is also covered by two Sentinel-2 images, with a total of 553 images acquired from 2017–2023. The spatial resolutions of Landsat and Sentinel-2 are 30 m and 10 m.
Due to the relatively limited number of annual Landsat acquisitions between 1986 and 2016, the ability to effectively detect coastline dynamics was constrained. To address this limitation, a temporal grouping strategy was adopted to ensure that each time interval contained at least 10 valid images. Specifically, all the images from 1986 to 1990 were combined into a single period, while those from 1991 to 2016 were grouped into two- to three-year intervals. In total, 786 satellite images covering the Yellow River Delta were obtained from 1986 to 2023. The number of images available for each temporal interval was quantified (Figure 2a), and high-quality observations were further filtered by excluding those affected by cloud cover, snow, ice, or other atmospheric and surface interferences. As shown in Figure 2b, a minimum of 10 valid observations was retained for each time interval, ensuring sufficient data density for subsequent coastline extraction. Good observations refer to the number of effective observations after cloud and snow filtering, while the image count refers to the total number of images before processing.

2.3. Runoff-Sediment Data

Runoff and sediment data were obtained from the Lijin hydrometric station, the lowermost monitoring station on the Yellow River, situated approximately 100 km upstream of the estuary. This station has conducted continuous daily observations of river discharge and sedimentary influx since 1950. For the present study, annual runoff and sediment transport records from 1986 to 2023 were compiled, as reported in the Yellow River Sediment Bulletin (Figure 3).
Based on the data from the Lijin Hydrological Station, the interannual variations in net water discharge and sediment load of the Yellow River from 1986 to 2023 can be divided into three periods: the pre-Xiaolangdi Reservoir period (1986–2001), the water-sediment regulation period (2002–2016), and the post-regulation recovery period following the suspension of water-sediment regulation (2017–2023). From 1986 to 2001, a decreasing trend was observed, with an average annual decline of 0.737 billion m3. In 1997, the runoff dropped to its minimum value of 1.861 billion m3, during which time a flow interruption occurred in the Yellow River. Between 2002 and 2016, the runoff initially increased and then fluctuated downward, with an average annual increase of 0.286 billion m3. A significant rise in annual runoff was recorded from 2017 to 2023, with an average annual increase of 2.282 billion m3. The annual sediment load showed an overall decreasing trend over the 40-year period. From 1986 to 2001, the sediment load initially increased markedly and then declined, with a net average decrease rate of 0.01 billion tons per year. The minimum sediment load of 0.016 billion tons was recorded in 1997. Between 2002 and 2016, the sediment load decreased at an average annual rate of 0.003 billion tons, reaching a peak of 0.37 billion tons in 2003 before falling to 0.011 billion tons in 2016. From 2017 to 2023, an increasing trend was observed, with an average annual increase of 0.015 billion tons.

3. Methodology

The Yellow River Delta coast is constantly undergoing dynamic changes. As the land–sea boundary, the coastline serves as a sensitive indicator of these changes, making its evolution a key proxy for understanding coastal variability. In this study, a coastline extraction algorithm was developed by integrating a water index with a dynamic frequency thresholding approach to delineate the shoreline of the Yellow River Delta. The relationships among coastline variation, land area change, and riverine runoff–sediment dynamics were subsequently investigated.
The extraction process of the coastline was conducted as follows: First, the water area of each image was extracted by the remote sensing water index and the Otsu method [19], where the boundary between water and land in each image represents the water–land interface rather than the actual coastline. Second, all water areas within a given period were analyzed to calculate the number of times each pixel was identified as water, thereby deriving the SWO. The high-frequency water, referring to high water levels determined through frequency analysis, was then extracted using a dynamic frequency thresholding method based on an improved k-means clustering approach. Lastly, the coastline was extracted from the boundary between the high-frequency water and land.

3.1. Remote Sensing Water Index

The modified Normalized Difference Water Index (mNDWI) was employed to distinguish between water and land. The mNDWI effectively reduces the interference from shadows and suspended sediments in water, making it more suitable for differentiating sediment-laden beaches in the Yellow River Delta from water. The mNDWI formula [20] is as follows:
mNDWI   = ( ρ green ρ swir ) / ( ρ green + ρ swir ) ,
where ρgreen represents the reflectance of the green band, and ρswir represents the reflectance of the shortwave infrared band.
After calculating the water index, the Otsu method is applied to automatically extract the water area for each image. The algorithm is particularly suitable for this task as it determines the optimal threshold by maximizing the between-class variance, effectively distinguishing water from land [19]. By avoiding manual threshold selection, Otsu’s method enhances the automation of the shoreline extraction process.

3.2. Annual Frequency of Water

In order to reduce the influence of factors such as high and low tides, waves, and sea level changes in the Yellow River estuary, and to fully utilize all the valid observation images during the year, high-frequency water is extracted by using the SWO method. This method is based on the extraction of water from each valid image of the Yellow River Delta from 1986 to 2023. The SWO calculation formula for each pixel is as follows [21,22]:
S W O = N w a t e r / N g o o d ,
where SWO is the Surface Water Occurrence, Nwater is the number of water observations in the time period, and Ngood is the total number of good observations in the time period.

3.3. Extraction of Coastline

To better adapt to coastal changes across different years and regions and more accurately capture the dynamic characteristics of the coastline, an improved k-means clustering method was applied to the frequency of the water to delineate the high tide line. Tidal information was verified by comparing the images downloaded from GEE with tide data obtained from the Maritime Service Network (https://www.cnss.com.cn/html/tide.html, accessed on 5 May 2025) for the same time periods.
K-means clustering is an unsupervised classification algorithm first introduced by J. MacQueen [23], designed to partition n data points into k clusters based on the principle of maximizing intra-cluster similarity and minimizing inter-cluster similarity. Within each cluster, SWO values exhibit low internal variability, indicating high internal similarity. In contrast, the difference in SWO values between clusters is pronounced, reflecting low inter-cluster similarity. The centroid of each cluster represents its center of mass, and the algorithm iteratively updates these centroids until convergence is achieved. Traditionally, k-means clustering has been used to generate binary classifications of land and water for single-date satellite images [24]. In this study, however, the algorithm was applied to time-series SWO statistics. Centered on the empirical SWO threshold of 0.05, the frequency range was expanded to 0–0.1 by increasing and decreasing the threshold in increments of 0.05. Within this range, k-means clustering with k = 2 was performed to classify the SWO values. The resulting inflection point in the frequency domain was automatically identified and interpreted as the slope transition point of the intertidal zone. The boundary between high-frequency water and land defined by this inflection point was considered the final coastline.
Due to differences in spatial resolution, this study does not perform a direct pixel-by-pixel comparison of shoreline positions. Instead, the spatial patterns and overall morphology of the extracted shorelines are compared. Given the resolution differences between Landsat imagery (30 m) and Sentinel-2 imagery (10 m), shorelines were extracted using their respective native resolutions. The results were then converted into vector format and spatially aligned for analysis. A spatial tolerance of ±15 m was applied to assess positional discrepancies between shorelines derived from different resolutions. This approach maintains scale uniformity between the two datasets.

3.4. Evolution Analysis of Coast

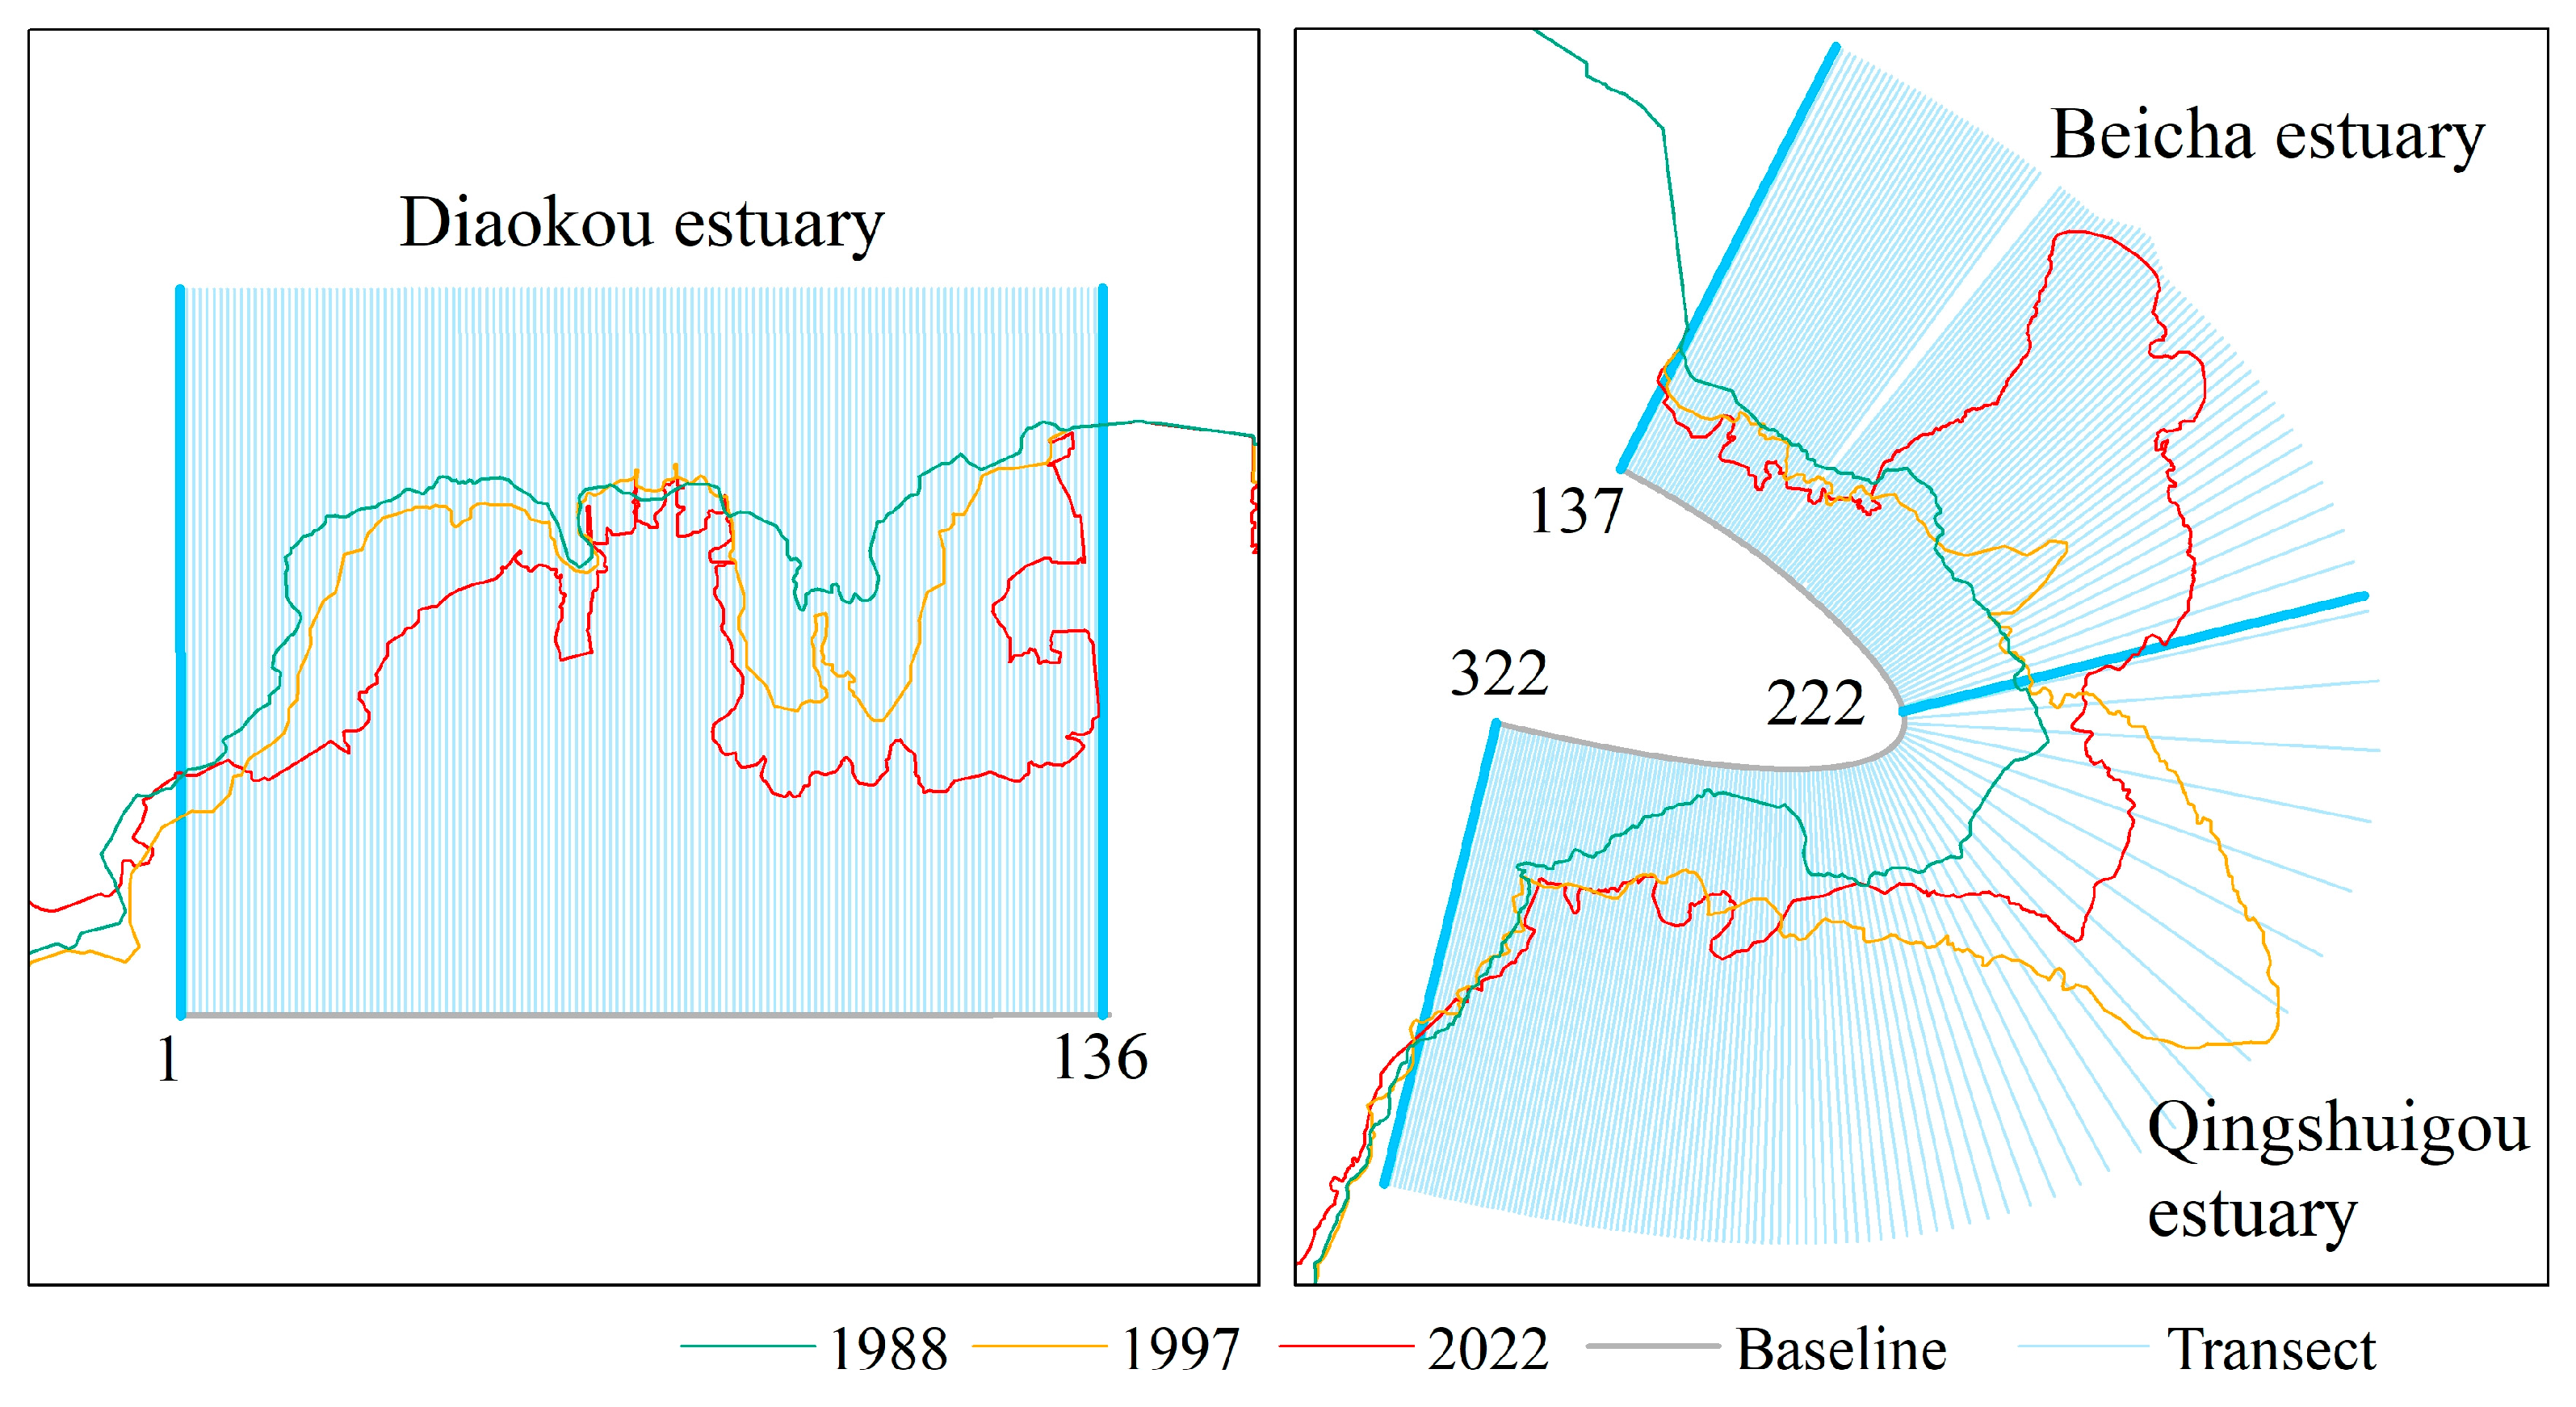
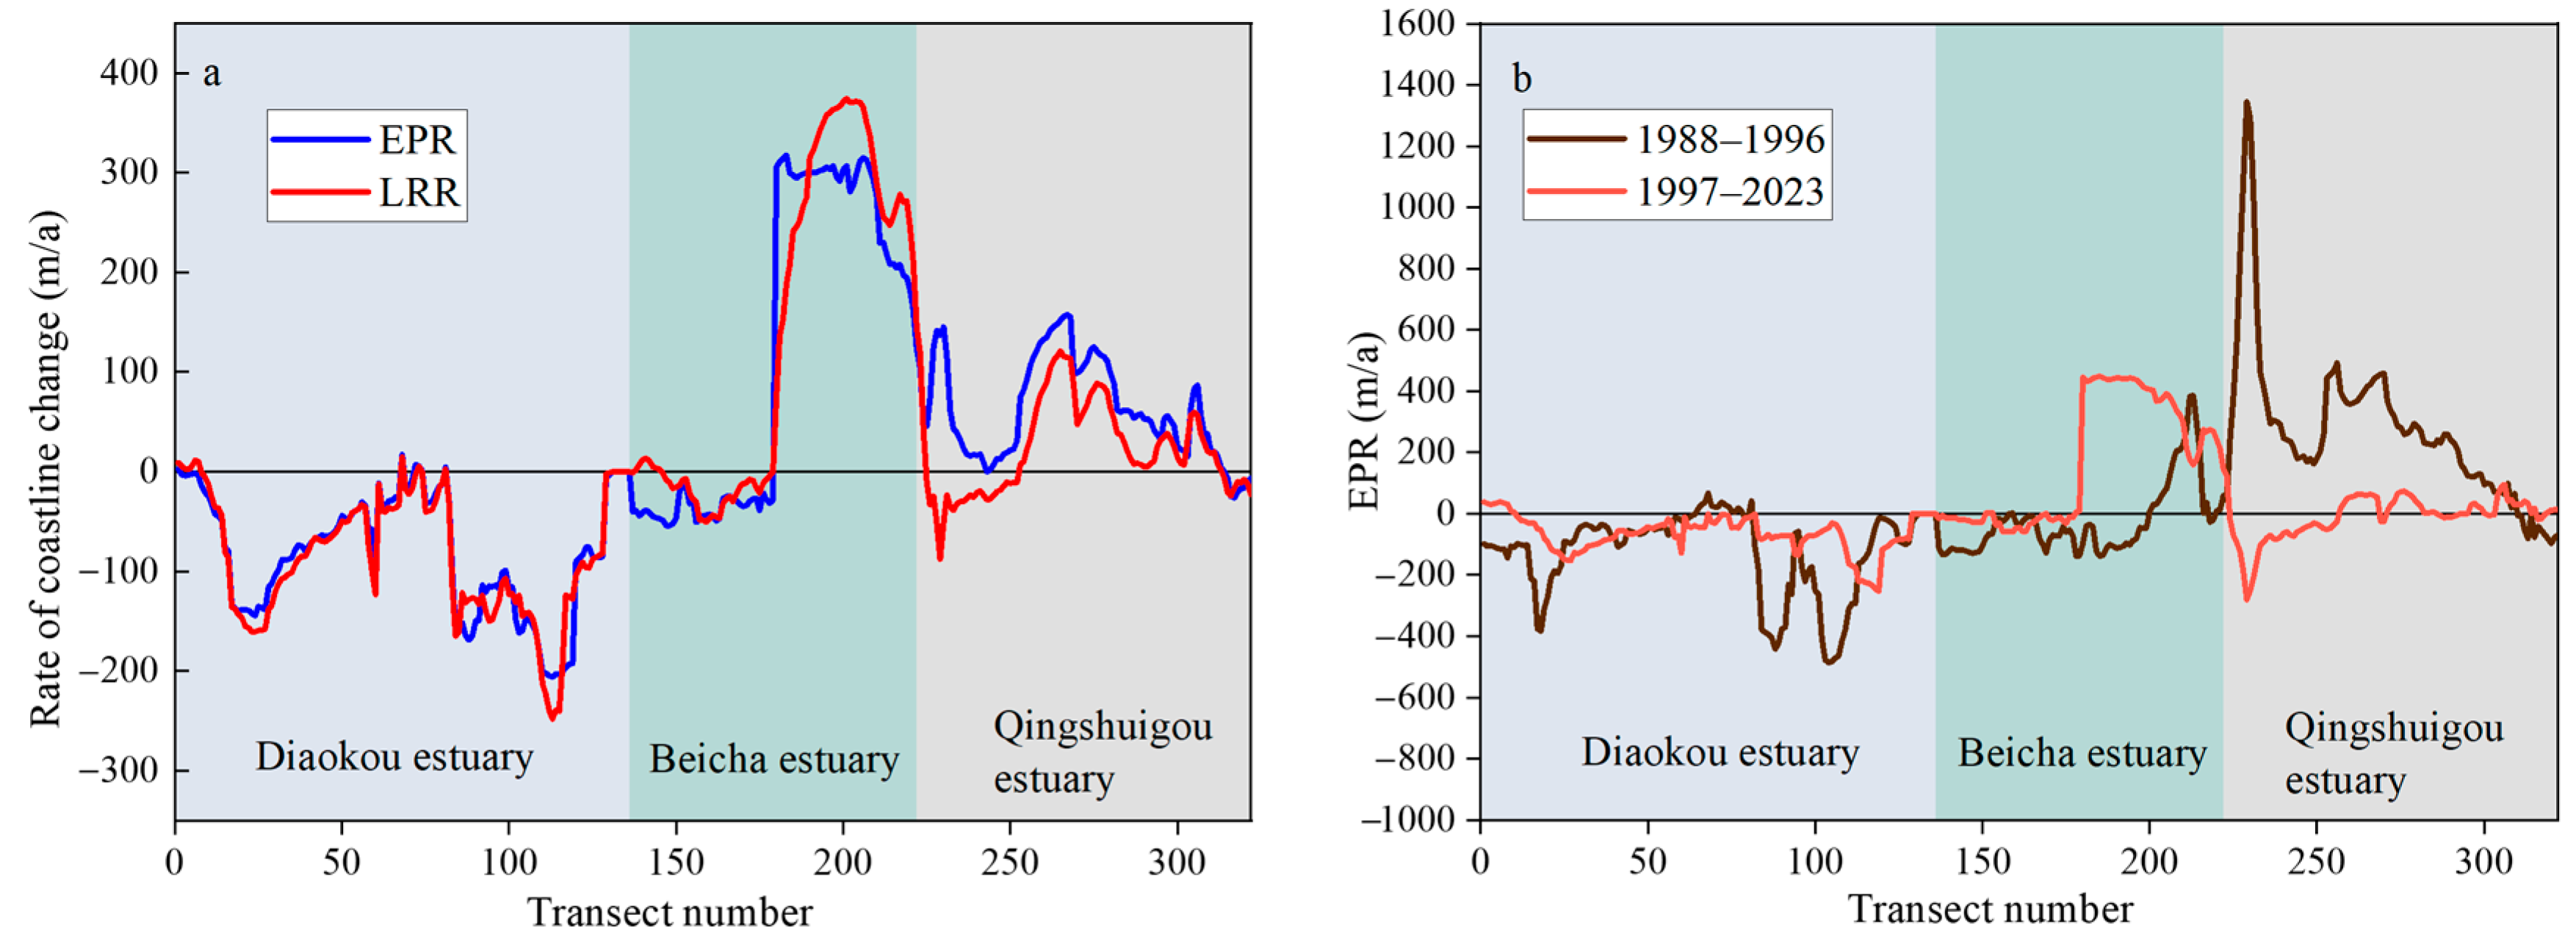
3.4.1. Analysis of Coastline Changes

The main methods for analyzing coastline change include the Net Coastline Movement (NSM) [4], Endpoint Change Rate (EPR), and Linear Regression Rate (LRR). LRR and EPR were used to assess shoreline change because they can address non-uniform temporal intervals. EPR estimates the rate of coastline change by calculating the displacement between two selected time points, without considering variations during the intervening period. LRR applies a least-squares linear regression to all temporal data points along a given transect, providing a more robust representation of the average trend in coastline movement. Considering these factors, both EPR and LRR were employed in this study to analyze coastline change.
The formula [4] is calculated as follows:
E P R = D / T
In the formula, D is the Net Coastline Movement distance, which is the distance between the two coastlines of the nearest and farthest periods in the time period, and T is the time interval between the two coastlines. Furthermore,
y = i = 1 n x i x ¯ y i y ¯ + y ¯ a x ¯ x
where y is the spatial location of the coastline, x is the year of the coastline, and x ¯ and y ¯ are the mean values of x i and y i , respectively. i = 1 n x i x ¯ y i y ¯ is the fit constant intercept, and y ¯ a x ¯ is the regression slope, which is LRR.
In this study, the Digital Shoreline Analysis System (DSAS) [25,26] was utilized to quantify the rate of coastline change. The analysis procedure consisted of several steps. First, a baseline was constructed approximately parallel to the general orientation of the coastline and positioned inland, ensuring that coastlines from different periods remained consistently on one side of the baseline. Subsequently, transects were generated at 150-m intervals, each with a length of 16 km and appropriately extended in some areas. Transect numbers are arranged sequentially along the coastline direction—from west to east in the Diaokou estuary, and from north to south in both the Beicha estuary and Qingshuigou estuary. All transects are oriented perpendicular to the baseline. For the three focal regions (Figure 4)—the Diaokou estuary (transect numbers 1–136), the Qingshuigou estuary (transect numbers 137–222), and the Beicha estuary (transect numbers 223–322)—a total of 322 transects were established. The distance between the intersections of each transect with coastlines from different time periods represented the amount of shoreline change at that location. Coastline movement landward, toward the baseline, was classified as erosion and assigned a negative change rate; movement seaward was interpreted as accretion, corresponding to a positive rate.

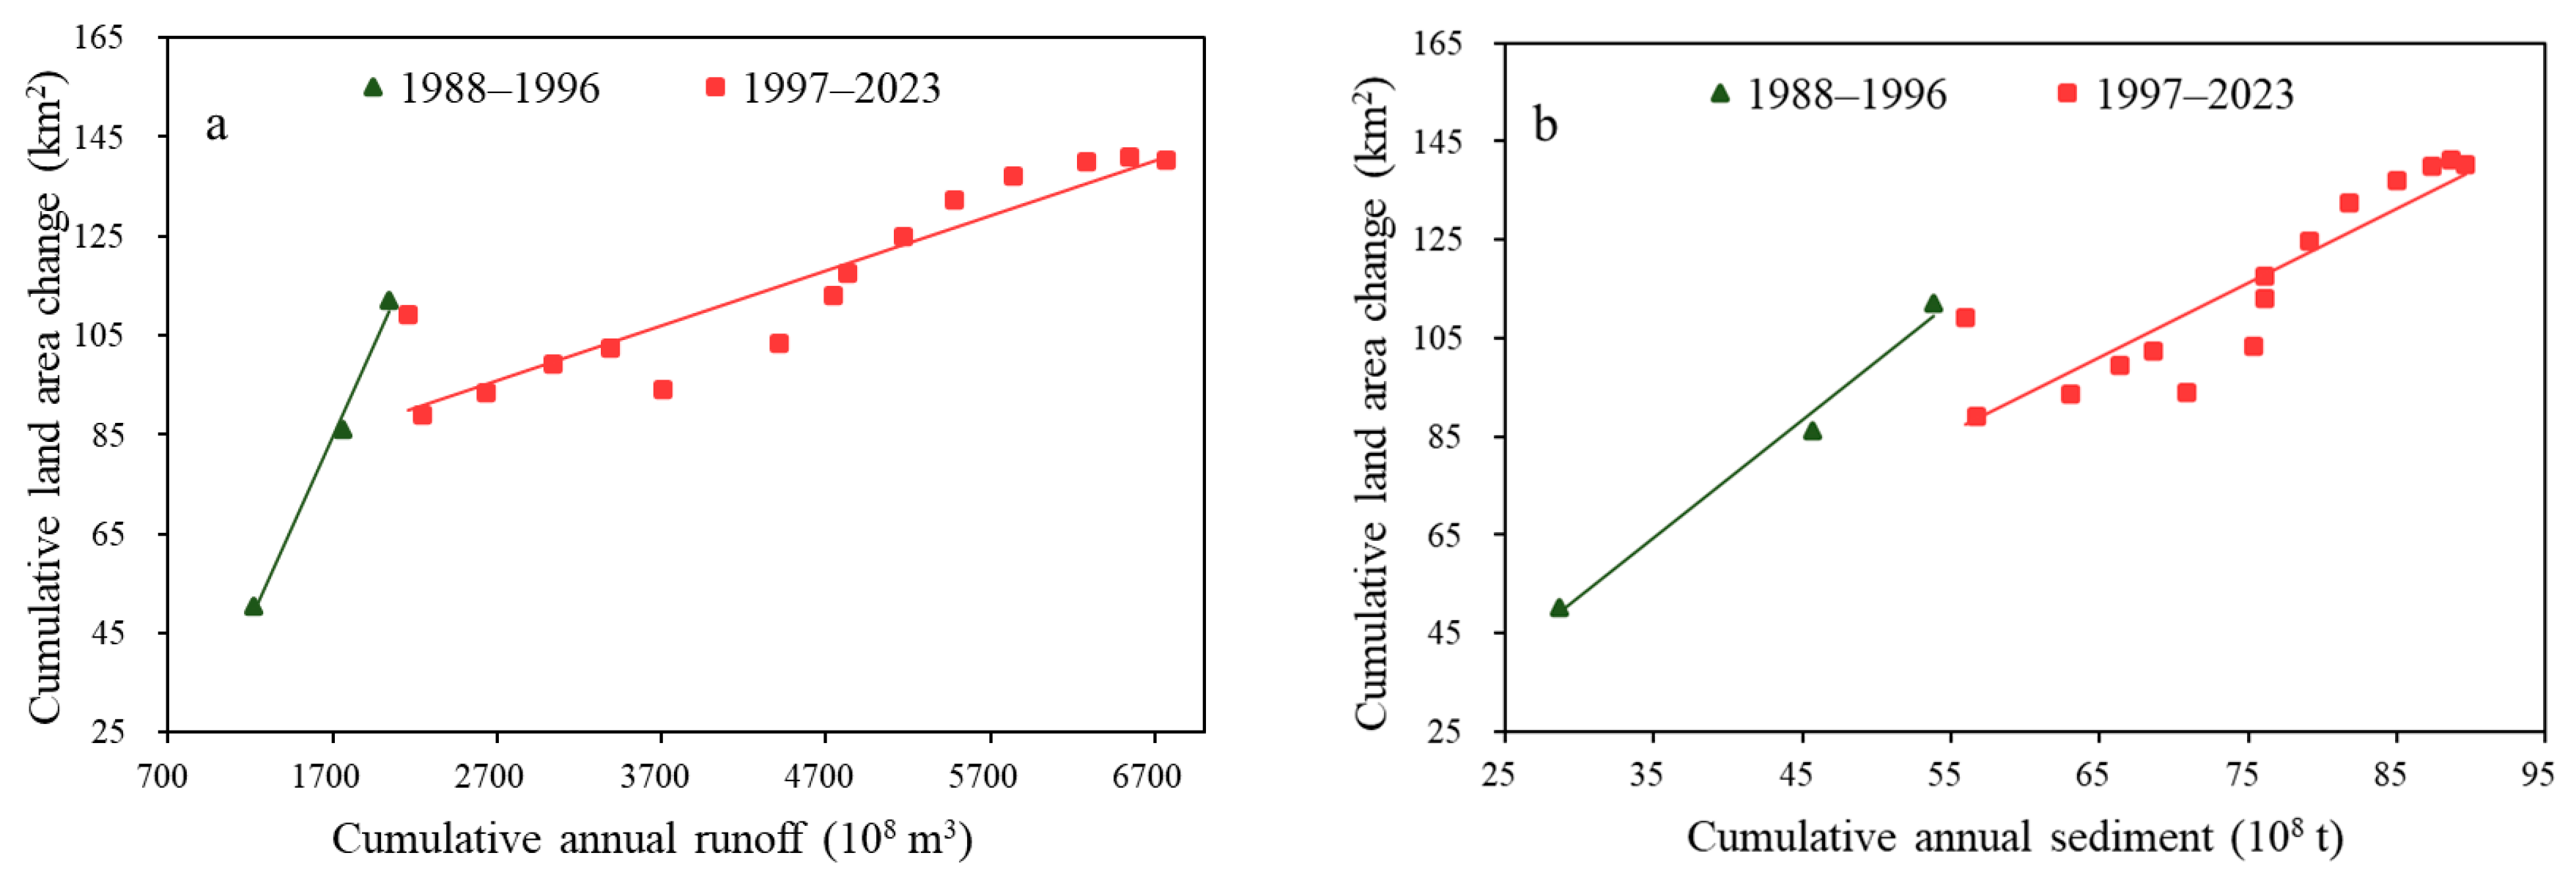
3.4.2. Assessment of Cumulative Land Area Change and the Runoff–Sediment Relationship

The land area was defined by combining the inland boundary with the coastline. The land area change was calculated by subtracting the land area of the earlier year from that of the current year. Subsequently, the cumulative land area change for each period was derived by summing the annual values. The delineation of inland boundaries and the calculation of land areas were carried out in ArcGIS 10.8, while data compilation and statistical analysis were conducted in Microsoft Excel.
The relationship between the cumulative runoff volume and sediment transport of the Yellow River and the cumulative land area change in the Diaokou estuary, Qingshuigou estuary, and Beicha estuary was examined using a one-dimensional linear regression approach. Considering the substantial interannual variation in particle transfer, the analysis was further refined to focus on the relationship between annual sediment load and land area change in the Beicha estuary during the period from 2017 to 2023. This relationship was then used to fit and estimate the critical sedimentary influx required to maintain the balance between erosion and accretion in both the Beicha estuary and the entire estuary. To ensure temporal consistency, the cumulative annual runoff and sediment transport data were aligned with the coastline extraction periods, such that the satellite imagery used in each time interval corresponded to the cumulative sediment values.

4. Results and Discussion

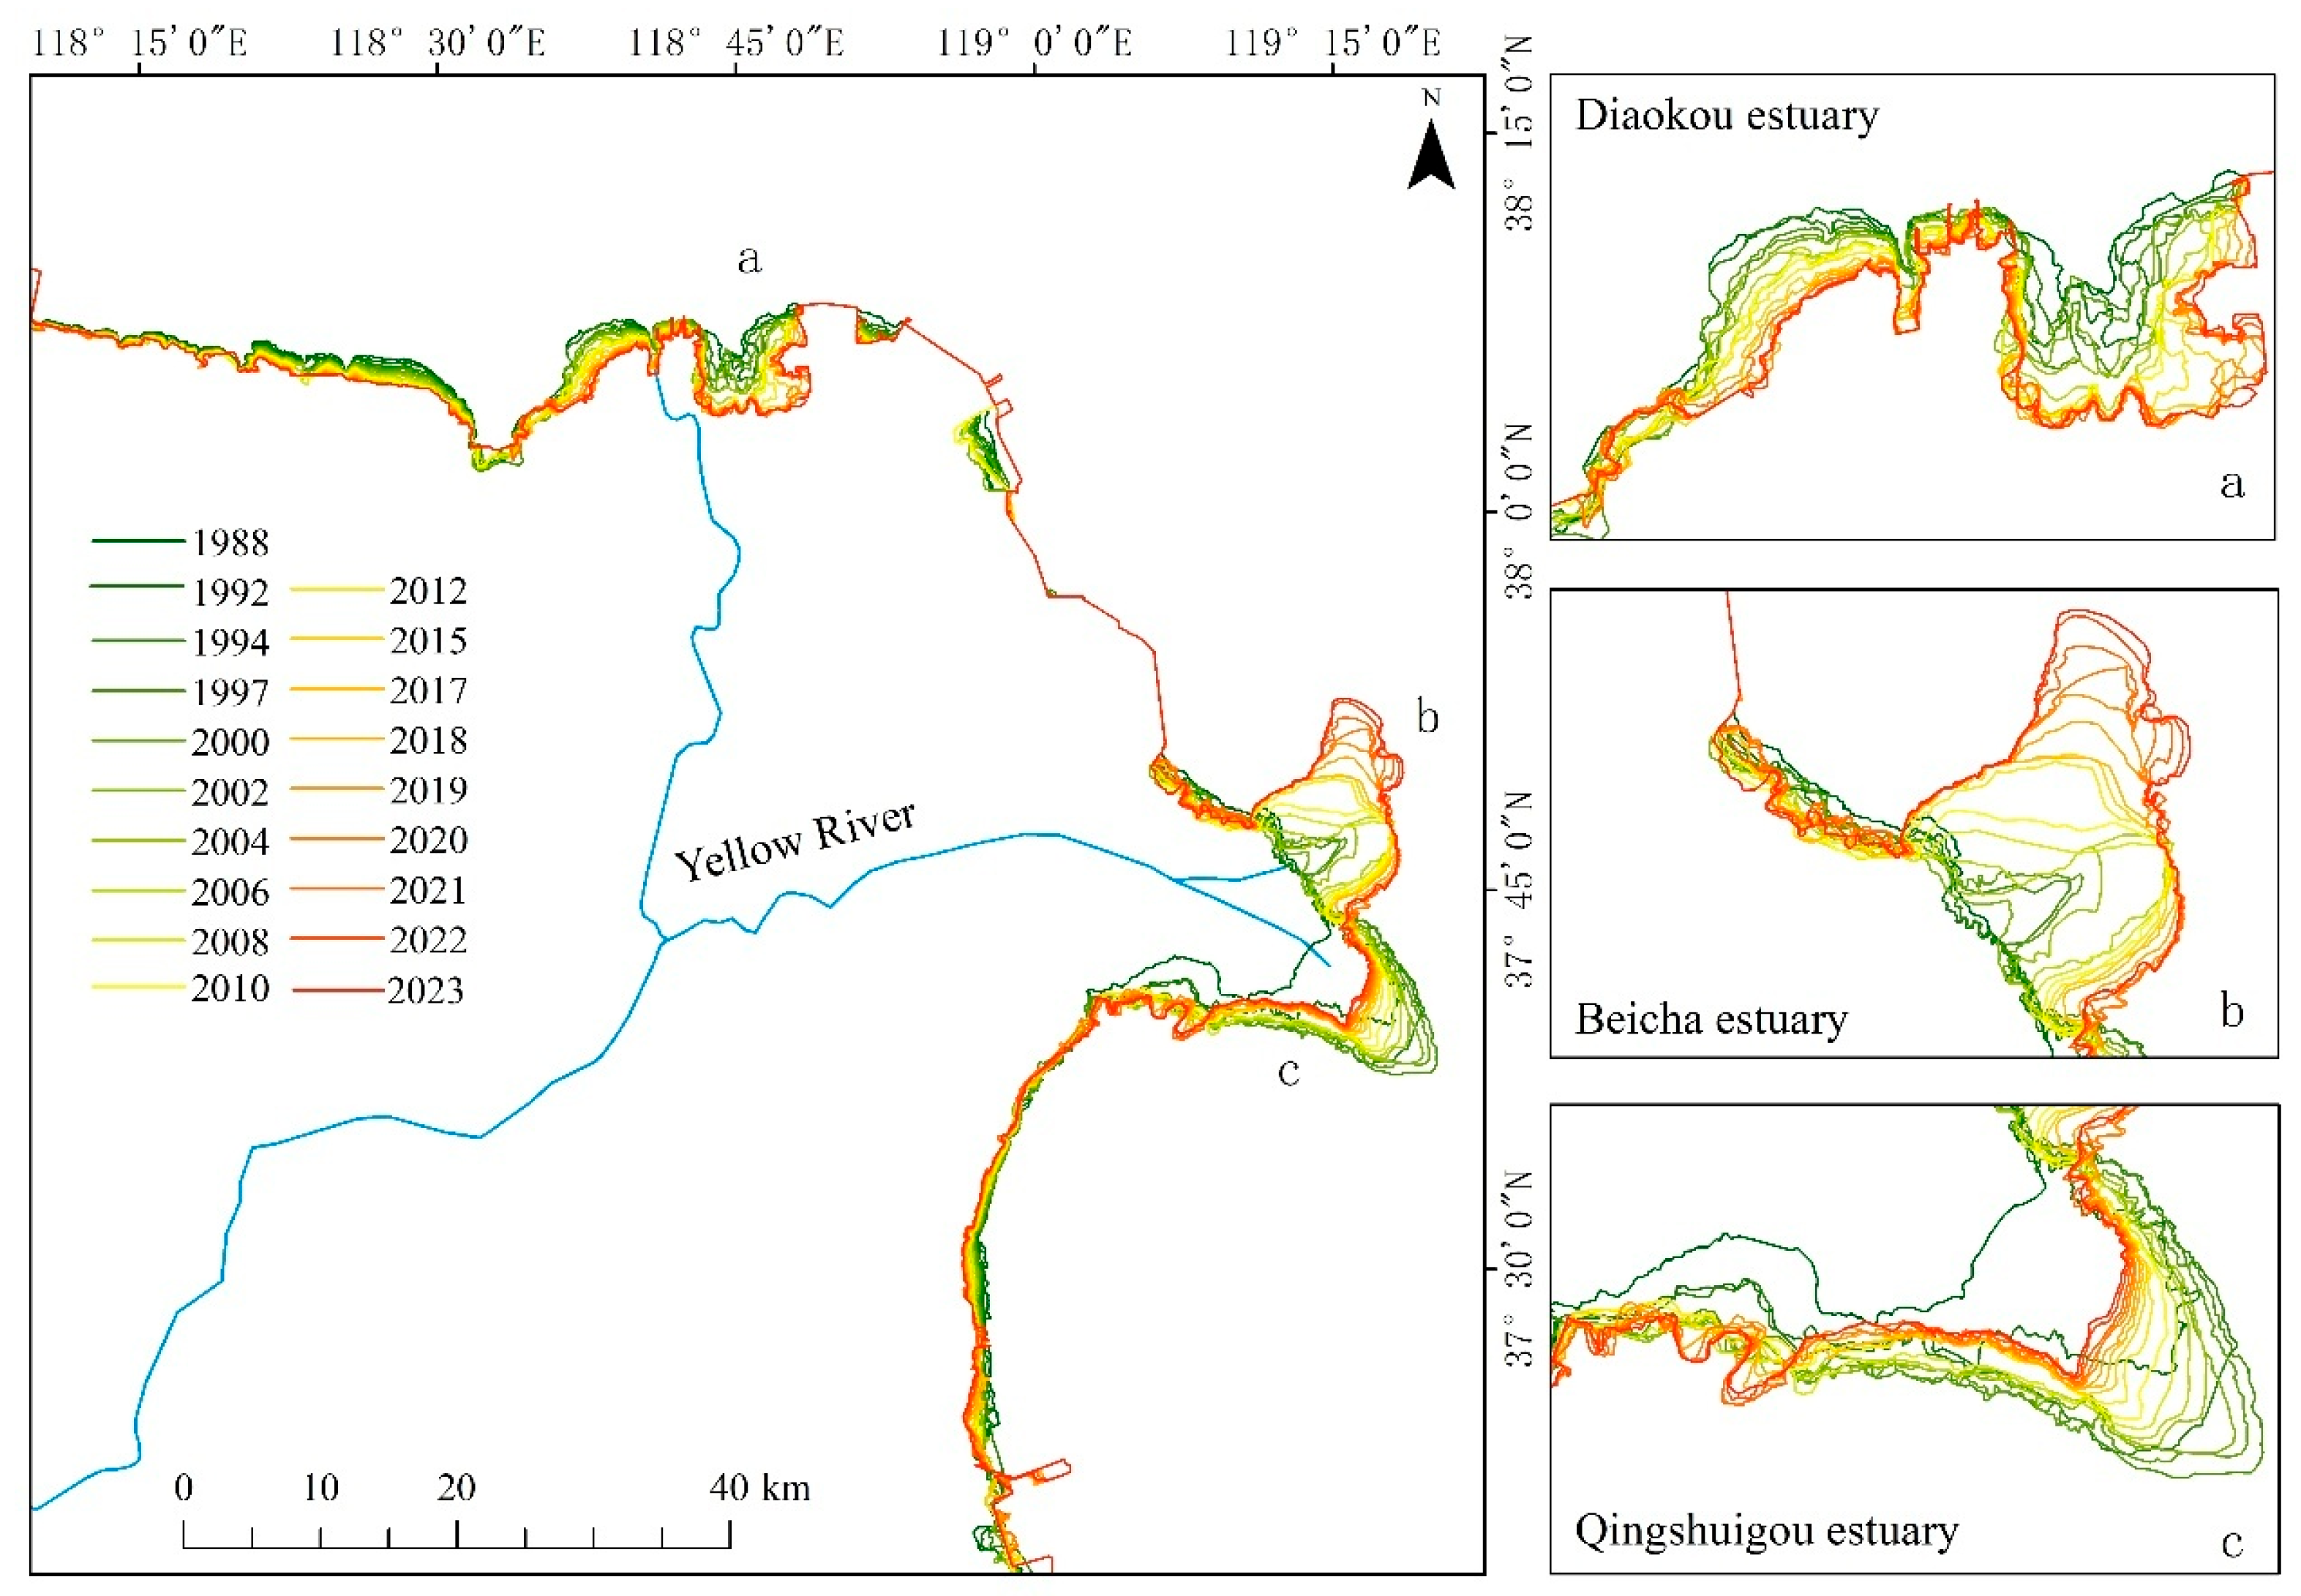
4.1. Dynamics of the Yellow River Delta Coastline

As illustrated in Figure 5, substantial changes in the coastline of the Yellow River Delta were observed between 1988 and 2023, with the most prominent alterations concentrated in the estuarine regions. The coastline along the Diaokou estuary has experienced continuous erosion and retreat. The Qingshuigou estuary initially exhibited accretion, followed by erosion and retreat, with slight land expansion observed in its western section. Along the Beicha estuary, the coastline exhibited a general trend of accretion. It initially extended eastward and subsequently shifted toward the north, with a marked intensification of northward accretion in recent years.
The evolution of the coastline in the three regions from 1988 to 2023 is presented in Figure 6a and Table 1. During this period, the average rates of coastline change across the three estuaries were calculated to be 16.11 m/a using the End Point Rate (EPR) method and 7.38 m/a using the Linear Regression Rate (LRR) method. The highest rates of seaward extension were observed along the current flow path of the Beicha estuary, reaching 317.54 m/a (EPR) and 374.14 m/a (LRR), respectively. These high rates were primarily attributed to the continued sediment supply, which facilitated persistent accretion. In contrast, the highest rates of coastal retreat occurred in the Diaokou estuary, where the coastline retreated at rates of −206.05 m/a (EPR) and −248.33 m/a (LRR). This retrogradation is primarily due to the lack of sediment influx to the Diaokou estuary after the diversion of the Yellow River, combined with oceanic dynamics that have contributed to the continuous erosion and retreat of this coastline section. Along the Qingshuigou estuary, the average rates of coastline change were 61.65 m/a (EPR) and 21.85 m/a (LRR).
The interannual dynamic evolution of the coastline in the three estuarine regions is illustrated in Figure 6b and Table 2. From 1988 to 1996, the coastline of the Qingshuigou estuary exhibited pronounced seaward progradation, primarily driven by abundant sediment supply from the Yellow River. During this period, the maximum rate of coastline advancement reached 1345.91 m/a. In contrast, the Beicha estuary experienced slight retreat, while the Diaokou estuary underwent substantial coastal retreat, with a maximum erosion rate of –486.23 m/a. Following the diversion of the Yellow River in 1996, which significantly reduced sediment input, notable shifts in coastal dynamics were observed from 1997 to 2023. The Qingshuigou estuary transitioned from a state of accretion to recession, with the average rate of change declining sharply from 268.89 m/a to −10.09 m/a. In contrast, the Beicha estuary continued to experience sustained seaward accretion due to persistent delivery of sediment, with the maximum progradation rate reaching 448.52 m/a. Although the Diaokou estuary remained erosional, the intensity of erosion gradually weakened, as indicated by an improvement in the average rate of change from −124.44 m/a to −66.69 m/a. These results demonstrate significant interannual variations in coastline dynamics among the different estuaries, which are primarily governed by changes in fluvial sediment input and oceanic processes.

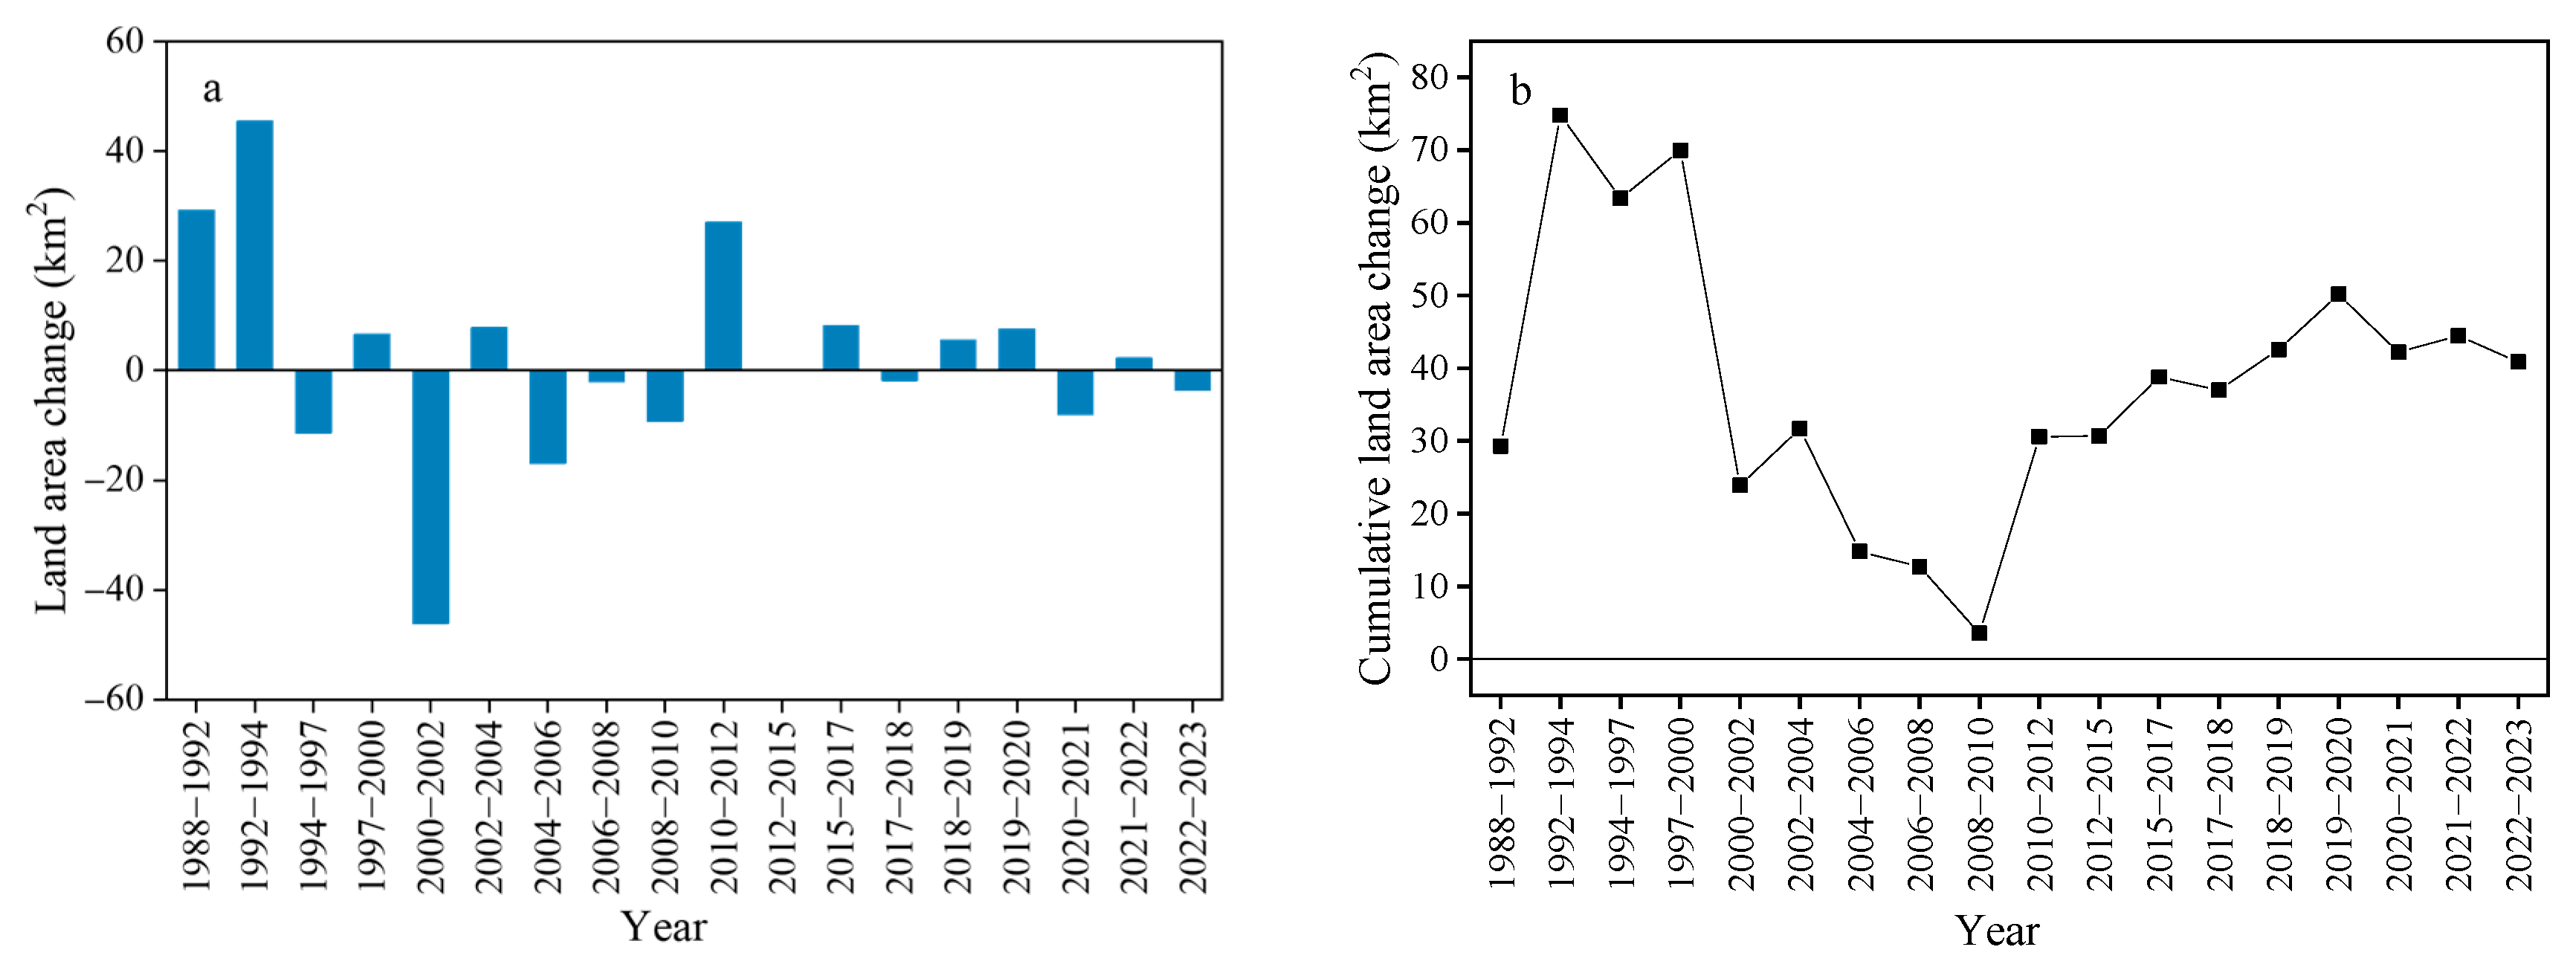
4.2. Evolution of Land Area Change in the Yellow River Delta

4.2.1. Evolution of the Overall Land Area Change in the Yellow River Delta

From 1988 to 2023, the land area change in the Yellow River Delta exhibited a declining trend (Figure 7a), with a multi-year average accretion rate of 1.17 km2/a. A notable episode of erosion occurred between 2000 and 2002, resulting in a net land loss of 46.08 km2. The cumulative land area change over the past 35 years followed a general pattern of increase–decline–recovery–stabilization (Figure 7b). Prior to 1996, rapid sediment deposition led to significant land expansion, with a peak of 74.79 km2 recorded in 1994. However, this was followed by a sharp decline from 2000 to 2002, and a short-term recovery during 2002–2004. From 2008 to 2017, the Beicha estuary experienced sustained northward accretion of the coastline. During this period, land expansion was largely driven by port construction and the development of aquaculture dikes, which significantly contributed to land growth. As a result, the cumulative land area change in the Yellow River Delta increased notably, reaching 40.87 km2 by 2023.

4.2.2. Evolution of Land Area Change in Typical Estuaries in the Yellow River Delta

Since the diversion of the Yellow River to discharge into the sea via the Qingshuigou estuary in 1976, the Diaokou estuary has experienced a lack of sediment supply from the main channel. Consequently, its land area change remained largely negative from 1988 to 2023 (Figure 8a), with an average erosion rate of approximately 1.89 km2/a. In 2010, the implementation of the “ecological recharge” strategy began to restore the estuarine ecosystem by providing water and a limited amount of sediment. This intervention contributed to a gradual reduction in the erosion rate [12]. The cumulative land area change at the Diaokou estuary has exhibited a long-term declining trend (Figure 8b), gradually approaching a stable state. By 2023, the cumulative land loss had reached −66.10 km2.
After the diversion of the Yellow River in 1996, the Qingshuigou estuary shifted from continuous land accretion to erosion (Figure 8e). From 1988 to 1996, the average rate of land area change was approximately 12.60 km2/a, whereas from 1997 to 2023, the average erosion rate reached around 2.19 km2/a. The cumulative land area change increased significantly prior to 1996, reaching a peak of 113.44 km2 in 1997 (Figure 8f), marking the primary phase of land growth at the estuary over the past 35 years. Following the reduction in fluvial material supply after 1996, the cumulative land area change in the Qingshuigou estuary showed a declining trend and has remained relatively stable since 2010.

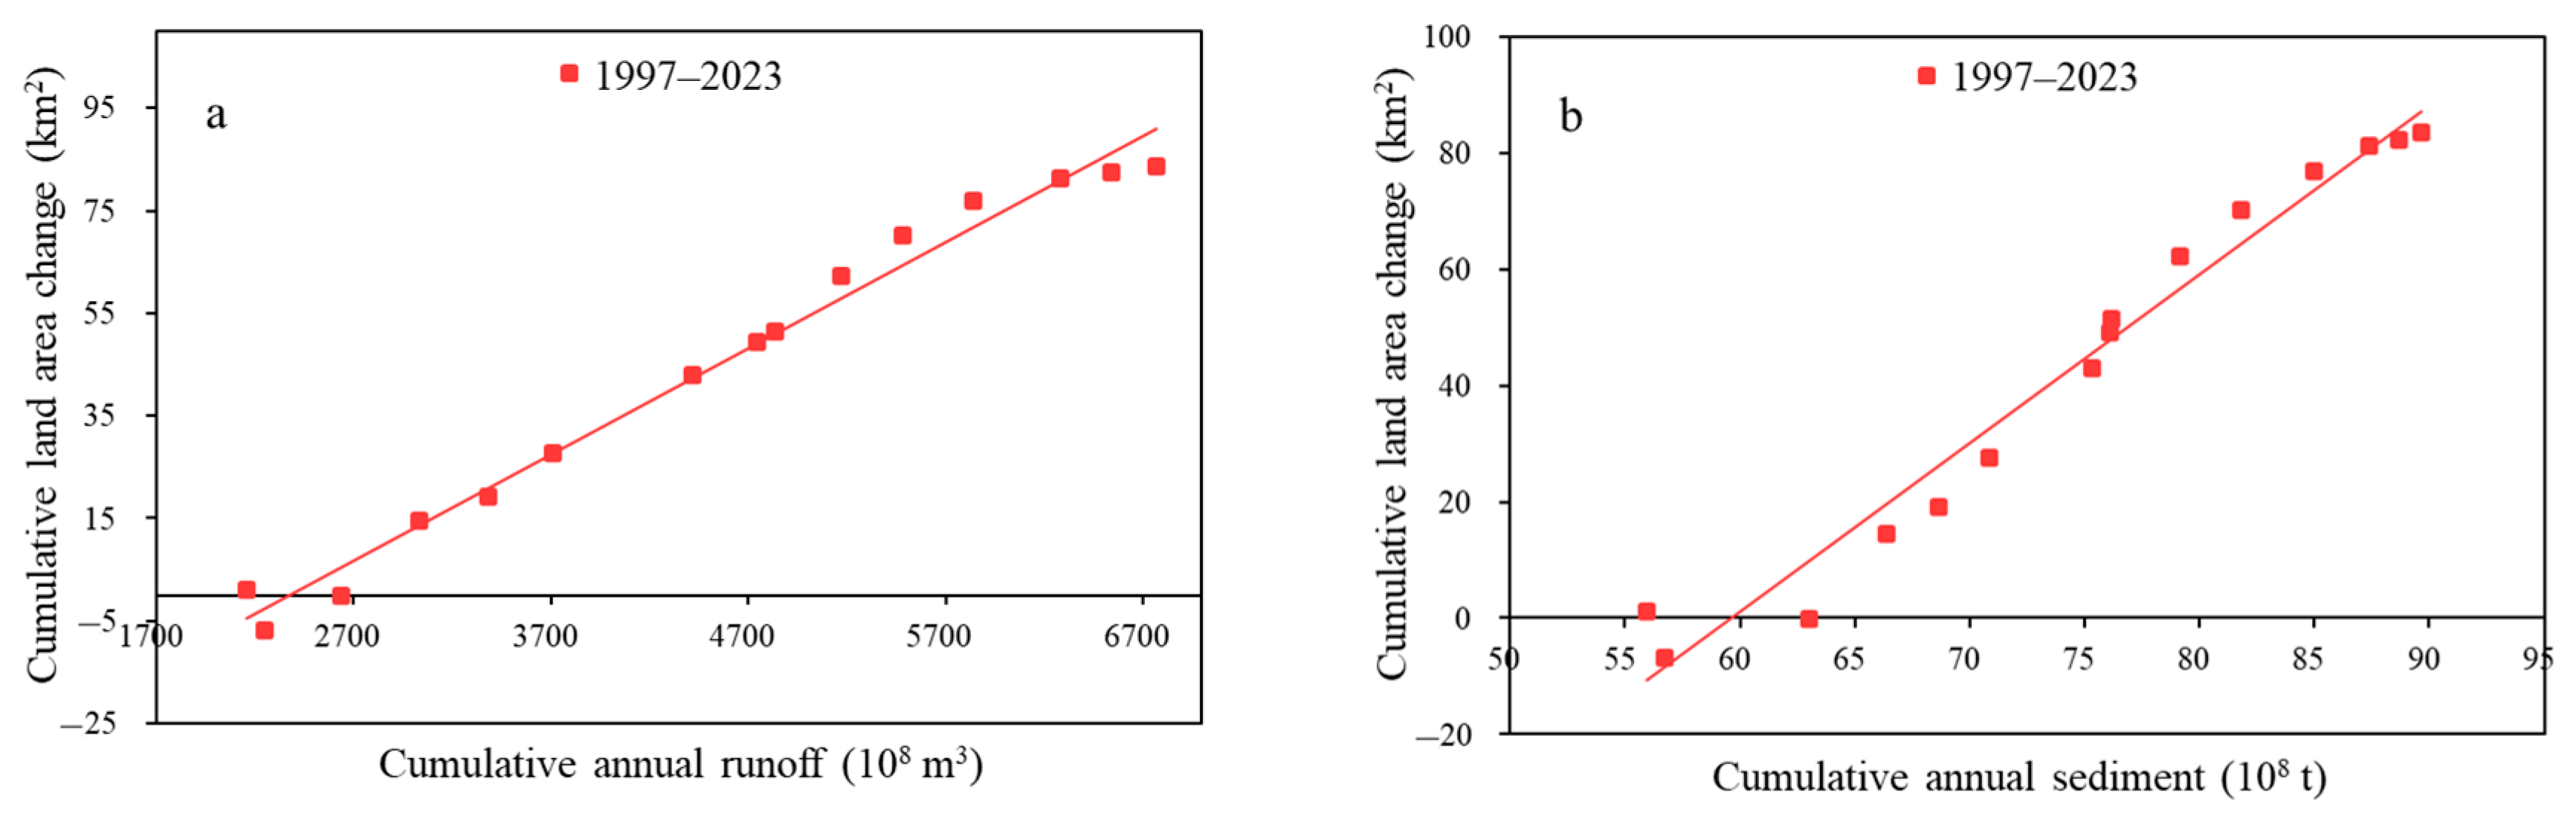
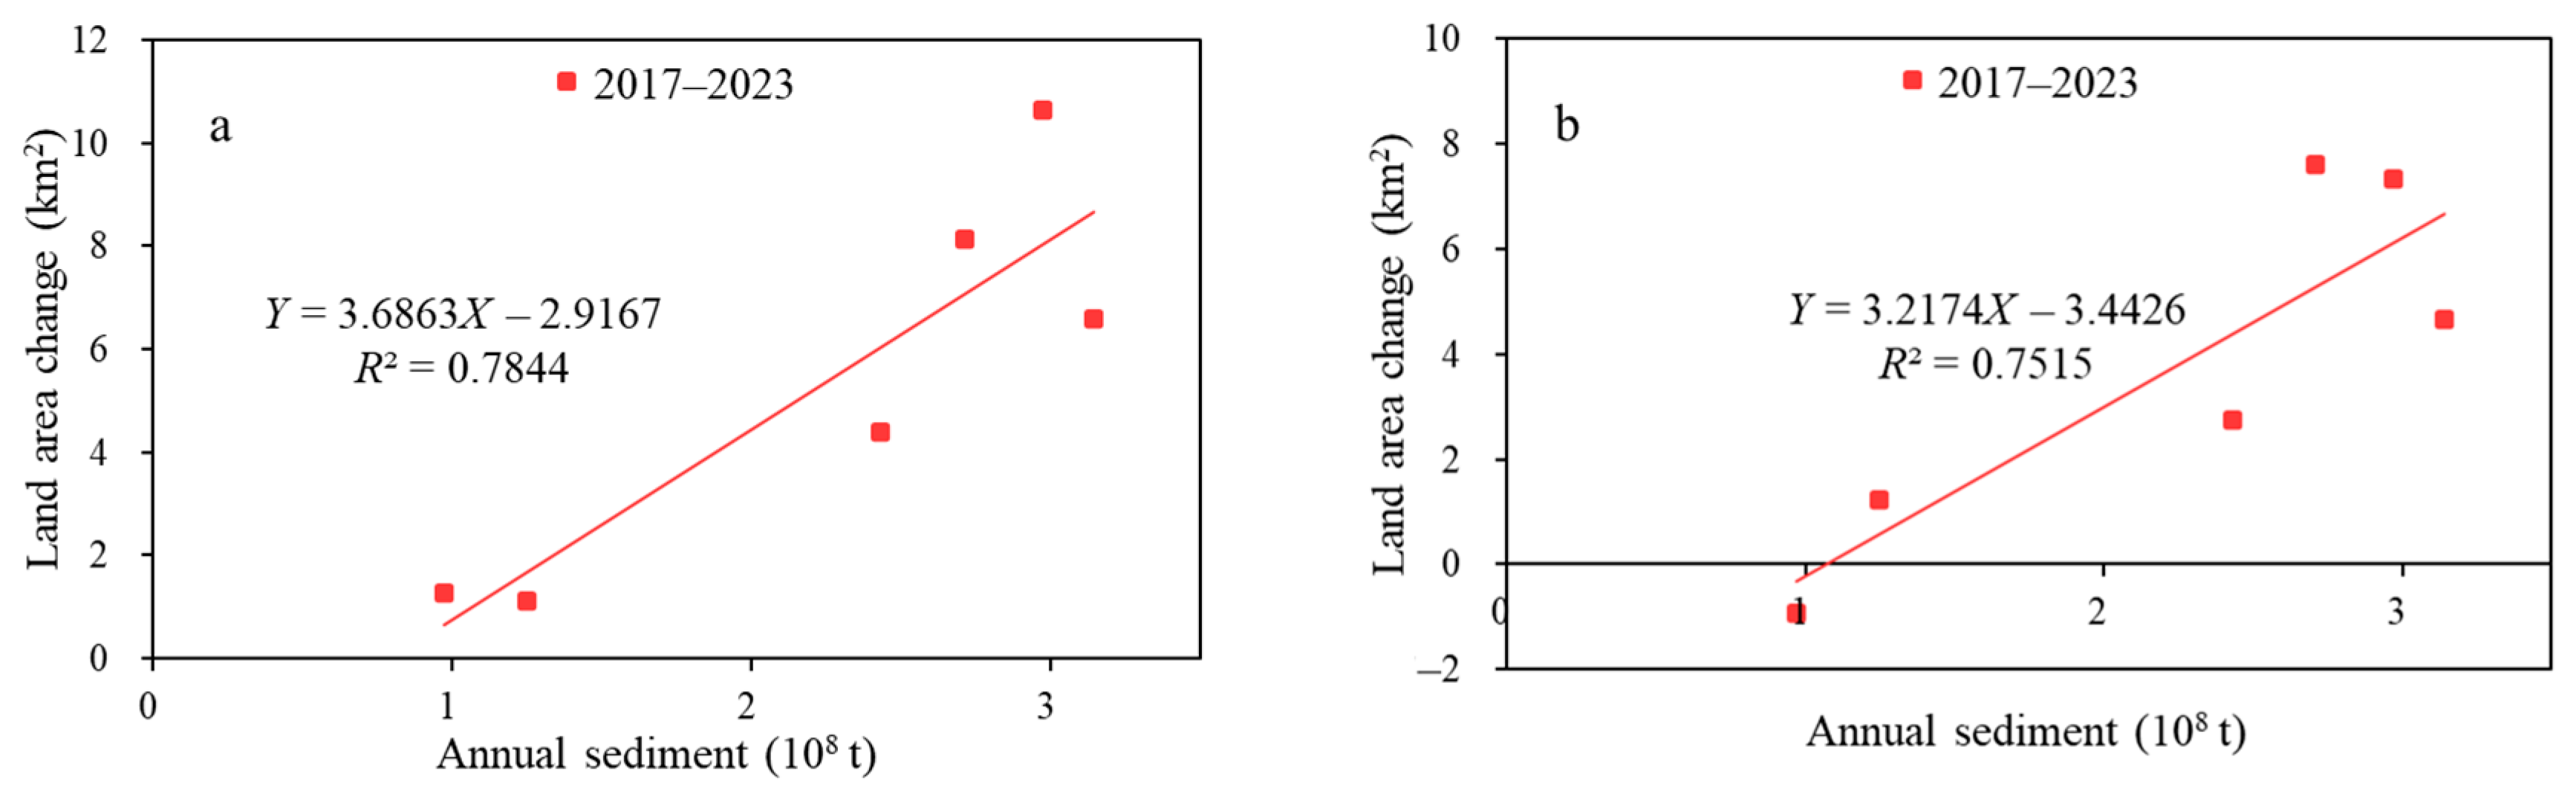
4.3. Relationship Between Cumulative Land Area Change and Runoff-Sediment

The relationship between cumulative annual runoff-sediment and the cumulative land area change in the entire estuary is illustrated in Figure 9. Before 1996, when the Yellow River discharged into the sea via the Qingshuigou estuary, the cumulative land area change increased in response to the substantial rise in cumulative annual runoff-sediment. However, during the period 1997–2023, the rate of cumulative land area change decreased despite a continued increase in cumulative runoff-sedimentation. The reversal occurred mainly due to the diversion of the Yellow River, resulting in the Qingshuigou estuary no longer receiving direct sediment inputs but instead being subject to a coastal profile increasingly driven by ocean dynamics.
After the diversion of the Yellow River in 1996, the relationship between cumulative annual runoff-sediment and the cumulative land area change in the Beicha estuary is illustrated in Figure 10. From 1997 to 2023, the cumulative land area change in the Beicha estuary increased significantly in tandem with cumulative runoff-sediment input. This indicated that the supply of runoff and sediment from the Yellow River served as the primary driving force for land area change.

4.4. Critical Sediment Load to Maintain Estuary Balance

The evolution of the Yellow River estuary is jointly influenced by fluvial sediment input from the Yellow River and oceanic dynamics. Coastline segments receiving active river discharge tend to prograde seaward due to sediment deposition. In contrast, sections lacking fluvial input are prone to landward retreat under the influence of marine erosion processes [27,28]. When the impacts of fluvial material supply and oceanic forces are balanced, the estuarine system approaches a state of dynamic equilibrium. To mitigate coastal erosion driven by marine forces, it is essential to determine the critical runoff-sediment volume required to maintain equilibrium in both the Beicha estuary and the entire estuary.
Figure 11 illustrates the relationship between annual sediment delivery and the land area change in the Yellow River Delta from 2017 to 2023. The intersection of the fitted regression line with the horizontal axis represents the flushing–siltation balance point. This indicates the delivery of sediment threshold required to maintain dynamic equilibrium when the land area change is zero. According to the fitted function in Figure 11a, the critical sediment threshold for sustaining the dynamic balance of the Beicha estuary is approximately 79 million t/a. The estuary region comprises both the abandoned Qingshuigou estuary and the Beicha estuary. Based on the fitted function in Figure 11b, the sediment threshold necessary to maintain dynamic equilibrium across the entire estuary area is 107 million t/a.
From 2002 to 2023, the average annual sediment influx was approximately 1.55 billion t, exceeding the threshold required to maintain the overall estuarine balance, thereby promoting estuarine expansion during this period [7,29]. In 2023, sediment delivery reached 0.97 billion t, surpassing the critical value needed to sustain the equilibrium of the Beicha estuary, which led to continued land expansion in that region. However, this value remained below the threshold required to maintain balance across the entire estuarine area, indicating that the accretion in the Beicha estuary was insufficient to fully compensate for the erosion occurring in the Qingshuigou estuary.
Before 1996, the Yellow River Delta experienced significant sediment accumulation. This was primarily due to the diversion of the Yellow River into the Qingshuigou estuary, which delivered substantial sediment loads and rapidly accelerated the land expansion process. This resulted in the maximum recorded land area of the Yellow River Delta in 1994 over the past 35 years, marking the principal phase of deltaic expansion. During this period, the river transported an average of 0.418 billion t of sediment annually (1988–1996), which was deposited at the river mouth, playing a crucial role in facilitating land accretion. A significant positive correlation was observed between cumulative sediment transport and the cumulative land area change in the estuary during this stage [28]. The land area of the Yellow River Delta decreased in 1997, mainly due to two factors. First, a severe flow interruption occurred in 1997, affecting a wide range of river channels and persisting for an extended period. Second, a major storm surge struck the region in the same year. When the surge coincided with high tide, it caused an abnormal rise in sea level, resulting in the offshore transport of large volumes of beach sediment. This led to pronounced coastal retreat, particularly along the Diaokou estuary [3].
After the Yellow River was diverted to the Beicha estuary, the Yellow River Delta experienced extensive erosion from 2000 to 2002. This was primarily caused by sediment interception by the Xiaolangdi Reservoir, which significantly reduced the sediment input, with the annual discharge of sediment dropping to only 0.32 billion t. As a result, erosion along the Beicha estuary intensified. Simultaneously, the Qingshuigou estuary also underwent erosion due to the lack of sediment replenishment. In 2002, water and sediment regulation measures were implemented. These measures increased water discharge to scour the downstream riverbed, transported previously accumulated sediments to the estuary, and released sediment that had been trapped upstream by the reservoir. This provided a substantial material basis for downstream land area change, leading to a sharp increase in sediment delivery over a short period [18]. From 2002 to 2004, estuarine siltation became evident, and the cumulative land area change in the Yellow River Delta increased [5,12], although it had not yet returned to its 2000 level.
Runoff and sediment regulation measures were implemented in 2002, but the annual sediment transport volume has gradually decreased. When runoff and sediment discharge adjustment were resumed in 2018, the annual runoff was approximately twice that of 2003. However, the fluvial sediment input was lower than in 2003, marking a transition in the runoff-sediment regime toward a state of “more water, less sediment” [28]. During this regulation period, riverbed sediments in the downstream channels gradually coarsened, enhancing the erosion resistance of the channel [20,30]. Consequently, the volume of sediment that could be scoured and transported decreased. Moreover, most of the mobilized sediment consisted of fine suspended particles. After deposition in the estuary, these fine particles were easily resuspended under oceanic forces and carried offshore by tidal currents, weakening the delta’s capacity for land accretion [18,31]. Therefore, in the future, both rivers and reservoirs are expected to face a continued decline in the availability of depositional input. Coupled with rising sea levels, enhanced protective measures will be necessary to maintain the fundamental stability of the estuarine areas.

5. Conclusions

In this study, long-term time-series satellite imagery from Landsat and Sentinel-2 was employed to extract the coastline of the Yellow River Delta from 1988 to 2023. This was accomplished through a combination of water index analysis and dynamic frequency thresholding methods. Based on the extracted coastlines, this study examined coastline dynamics, the evolution of land area due to erosion and deposition processes, and the relationships between these changes and the Yellow River’s runoff-sediment discharge over the study period. The main conclusions are as follows: (1) The coastline of the Yellow River Delta has exhibited pronounced long-term variability and instability, primarily driven by Yellow River runoff-sediment discharge, anthropogenic river course diversions, and oceanic forces. Between 1988 and 2023, the maximum erosion rates occurred at the Diaokou estuary, reaching −206.05 m/a (EPR) and −248.33 m/a (LRR), while the highest accretion rates were observed at the current Beicha estuary, at 317.54 m/a (EPR) and 374.14 m/a (LRR). (2) Over the past 35 years, the cumulative land area change in the Yellow River Delta has undergone significant fluctuations, characterized by alternating phases of siltation, retrogression, renewed siltation, and eventual stabilization toward a dynamic equilibrium between accretion and erosion. The Diaokou estuary has experienced persistent retreat, with an average erosion rate of approximately 1.89 km2/a. Since 1997, the Beicha estuary has shown a consistent trend of land accretion, averaging 3.28 km2/a. In contrast, the Qingshuigou estuary underwent substantial land accretion from 1986 to 1996, at an average rate of 12.60 km2/a, followed by a phase of coastal regression between 1997 and 2023, with an average erosion rate of approximately 2.19 km2/a. (3) The volume of sediment delivered by the Yellow River to the sea plays a critical role in coastal expansion. Active estuaries receiving continuous sediment input from the river tend to undergo land expansion, while abandoned estuaries without sediment replenishment are primarily governed by marine dynamics and thus prone to erosion. The land area change in the Beicha estuary showed a strong positive correlation with annual sediment influx. The critical sediment volumes required to maintain dynamic equilibrium in the Beicha estuary and across the entire estuarine region are 79 million t/a and 107 million t/a, respectively.
Overall, this study provides essential scientific support for the sustainable management of the Yellow River Delta. The proposed coastline extraction method enables the effective monitoring of continuous coastal dynamics. By quantifying coastline changes and estimating the sediment volumes required to maintain estuarine morphological stability, this study establishes a robust foundation for sediment regulation and integrated land–water planning. These findings advance broader sustainability goals by promoting coastal resilience and informing ecological restoration efforts.

Author Contributions

Investigation, conceptualization, funding acquisition, writing—review and editing, L.R.; conceptualization, formal analysis, methodology, writing—original draft preparation, Y.Z.; conceptualization, funding acquisition, writing—review and editing, H.L.; project administration, funding acquisition, writing—review and editing, C.H. All authors have read and agreed to the published version of the manuscript.

Funding

This research was funded by the Science and Technology Basic Resources Investigation Program of China (2021FY101003) and the Education Department Fund of Hunan Province of China (22B0429).

Institutional Review Board Statement

Not applicable.

Informed Consent Statement

Not applicable.

Data Availability Statement

Data is contained within the article.

Acknowledgments

We thank the anonymous reviewers for their suggestions in promoting the quality of this manuscript.

Conflicts of Interest

We declare that this research was conducted in the absence of any commercial or financial relationships that could be construed as potential conflicts of interest.

References

  1. Zhang, K.; Dong, X.; Liu, Z.; Gao, W.; Hu, Z.; Wu, G. Mapping Tidal Flats with Landsat 8 Images and Google Earth Engine: A Case Study of the China’s Eastern Coastal Zone circa 2015. Remote Sens. 2019, 11, 924. [Google Scholar] [CrossRef]
  2. Cao, Y.; Wang, Q.; Zhan, C.; Li, R.; Qian, Z.; Wang, L.; Liu, X.; Zhu, J.; Shi, H.; Li, Y. Evolution of tidal flats in the Yellow River Qingshuigou sub-delta: Spatiotemporal analysis and mechanistic changes (1996–2021). Front. Mar. Sci. 2023, 10, 1286188. [Google Scholar] [CrossRef]
  3. Gao, W.; Du, J.; Gao, S.; Xu, Y.; Li, B.; Wei, X.; Zhang, Z.; Liu, J.; Li, P. Shoreline change due to global climate change and human activity at the Shandong Peninsula from 2007 to 2020. Front. Mar. Sci. 2023, 9, 1123067. [Google Scholar] [CrossRef]
  4. Zhang, L.; Shi, H.; Xing, H.; Li, P.; Ma, P. Analysis of the evolution of the Yellow River Delta coastline and the response of the tidal current field. Front. Mar. Sci. 2023, 10, 1232060. [Google Scholar] [CrossRef]
  5. Wang, K. Evolution of Yellow River Delta coastline based on remote sensing from 1976 to 2014, China. Chin. Geogr. Sci. 2019, 29, 181–191. [Google Scholar] [CrossRef]
  6. Zhu, Q.; Li, P.; Li, Z.; Pu, S.; Wu, X.; Bi, N.; Wang, H. Spatiotemporal Changes of Coastline over the Yellow River Delta in the Previous 40 Years with Optical and SAR Remote Sensing. Remote Sens. 2021, 13, 1940. [Google Scholar] [CrossRef]
  7. Kong, D.; Miao, C.; Zheng, H.; Gou, J. Dynamic evolution characteristics of the Yellow River Delta in response to estuary diversion and a water–sediment regulation scheme. J. Hydrol. 2023, 627, 130447. [Google Scholar] [CrossRef]
  8. Chen, Y.; Dong, J.; Xiao, X.; Ma, Z.; Tan, K.; Melville, D.; Li, B.; Lu, H.; Liu, J.; Liu, F. Effects of reclamation and natural changes on coastal wetlands bordering China’s Yellow Sea from 1984 to 2015. Land Degrad. Dev. 2019, 30, 1533–1544. [Google Scholar] [CrossRef]
  9. Zhou, X.; Wang, J.; Zheng, F.; Wang, H.; Yang, H. An overview of coastline extraction from remote sensing data. Remote Sens. 2023, 15, 4865. [Google Scholar] [CrossRef]
  10. Mao, Y.; Harris, D.; Xie, Z.; Phinn, S. Efficient measurement of large-scale decadal shoreline change with increased accuracy in tide-dominated coastal environments with Google Earth Engine. ISPRS J. Photogramm. Remote Sens. 2021, 181, 385–399. [Google Scholar] [CrossRef]
  11. Zhang, S.; Xu, Q.; Wang, H.; Kang, Y.; Li, X. Automatic Waterline Extraction and Topographic Mapping of Tidal Flats From SAR Images Based on Deep Learning. Geophys. Res. Lett. 2022, 49, e2021GL096007. [Google Scholar] [CrossRef]
  12. Li, C.; Zhu, L.; Dai, Z.; Wu, Z. Study on spatiotemporal evolution of the Yellow River Delta coastline from 1976 to 2020. Remote Sens. 2021, 13, 4789. [Google Scholar] [CrossRef]
  13. Wang, X.; Xiao, X.; Zou, Z.; Chen, B.; Ma, J.; Dong, J.; Doughty, R.B.; Zhong, Q.; Qin, Y.; Dai, S.; et al. Tracking annual changes of coastal tidal flats in China during 1986–2016 through analyses of Landsat images with Google Earth Engine. Remote Sens. Environ. 2018, 238, 110987. [Google Scholar] [CrossRef] [PubMed]
  14. Liu, X.; Gao, Z.; Ning, J.; Yu, X.; Zhang, Y. An improved method for mapping tidal flats based on remote sensing waterlines: A case study in the Bohai Rim, China. IEEE J. Sel. Top. Appl. Earth Obs. Remote Sens. 2016, 9, 5123–5129. [Google Scholar] [CrossRef]
  15. Fan, Y.; Chen, S.; Zhao, B.; Pan, S.; Jiang, C.; Ji, H. Shoreline dynamics of the active Yellow River delta since the implementation of Water-Sediment Regulation Scheme: A remote-sensing and statistics-based approach. Estuar. Coast. Shelf Sci. 2018, 200, 406–419. [Google Scholar] [CrossRef]
  16. Li, D.; Gao, W.; Shao, D.; Amenuvor, M.; Tong, Y.; Cui, B. A tale of two deltas: Dam-induced hydro-morphological evolution of the Volta River delta (Ghana) and Yellow River delta (China). Water 2021, 13, 3198. [Google Scholar] [CrossRef]
  17. Jia, W.; Yi, Y. Numerical study of the water-sediment regulation scheme (WSRS) impact on suspended sediment transport in the Yellow River Estuary. Front. Mar. Sci. 2023, 10, 1135118. [Google Scholar] [CrossRef]
  18. Wang, H.; Wu, X.; Bi, N.; Li, S.; Yuan, P.; Wang, A.; Syvitski, J.P.M.; Saito, Y.; Yang, Z.; Liu, S.; et al. Impacts of the dam-orientated water-sediment regulation scheme on the lower reaches and delta of the Yellow River (Huanghe): A review. Glob. Planet. Chang. 2017, 157, 93–113. [Google Scholar] [CrossRef]
  19. Tang, W.; Zhao, C.; Lin, J.; Jiao, C.; Zheng, G.; Zhu, J.; Pan, X.; Han, X. Improved Spectral Water Index Combined with Otsu Algorithm to Extract Muddy Coastline Data. Water 2022, 14, 855. [Google Scholar] [CrossRef]
  20. Jia, M.; Wang, Z.; Mao, D.; Ren, C.; Wang, C.; Wang, Y. Rapid, robust, and automated mapping of tidal flats in China using time series Sentinel-2 images and Google Earth Engine. Remote Sens. Environ. 2021, 255, 112285. [Google Scholar] [CrossRef]
  21. Zou, Z.; Dong, J.; Menarguez, M.A.; Xiao, X.; Qin, Y.; Doughty, R.B.; Hooker, K.V.; David Hambright, K. Continued decrease of open surface water body area in Oklahoma during 1984–2015. Sci. Total Environ. 2017, 595, 451–460. [Google Scholar] [CrossRef]
  22. Wang, X.; Xiao, X.; Zou, Z.; Hou, L.; Qin, Y.; Dong, J.; Doughty, R.B.; Chen, B.; Zhang, X.; Chen, Y.; et al. Mapping coastal wetlands of China using time series Landsat images in 2018 and Google Earth Engine. ISPRS J. Photogramm. Remote Sens. 2020, 163, 312–326. [Google Scholar] [CrossRef]
  23. Macqueen, J.B. Some methods for classification and analysis of multivariate observations. In Proceedings of the Fifth Berkeley Symposium on Mathematical Statistics and Probability, Berkeley, CA, USA, 27 December 1965–7 January 1966. [Google Scholar]
  24. Figliomeni, F.G.; Guastaferro, F.; Parente, C.; Vallario, A. A proposal for automatic coastline extraction from Landsat 8 OLI images combining modified optimum index factor (MOIF) and K-Means. Remote Sens. 2023, 15, 3181. [Google Scholar] [CrossRef]
  25. Zhu, Y.; Li, Z.; Zhao, Z.; Lu, L.; Yang, S.; Wang, Z. Spatio-temporal changes of coastline in Jiaozhou Bay from 1987 to 2022 based on optical and SAR data. Front. Mar. Sci. 2023, 10, 1233410. [Google Scholar] [CrossRef]
  26. Anfuso, G.; Bowman, D.; Danese, C.; Pranzini, E. Transect based analysis versus area based analysis to quantify shoreline displacement: Spatial resolution issues. Environ. Monit. Assess. 2016, 188, 568. [Google Scholar] [CrossRef]
  27. Liu, Y.; Du, T.; Huang, H.; Liu, Y.; Zhang, Y. Estimation of sediment compaction and its relationship with river channel distributions in the Yellow River delta, China. Catena 2019, 182, 104113. [Google Scholar] [CrossRef]
  28. Li, H.; Huang, C.; Liu, Q.; Liu, G. Accretion–Erosion Dynamics of the Yellow River Delta and the Relationships with Runoff and Sediment from 1976 to 2018. Water 2020, 12, 2992. [Google Scholar] [CrossRef]
  29. Bi, N.; Wang, H.; Yang, Z. Recent changes in the erosion–accretion patterns of the active Huanghe (Yellow River) delta lobe caused by human activities. Cont. Shelf Res. 2014, 90, 70–78. [Google Scholar] [CrossRef]
  30. Li, P.; Ke, Y.; Wang, D.; Ji, H.; Chen, S.; Chen, M.; Lyu, M.; Zhou, D. Human impact on suspended particulate matter in the Yellow River Estuary, China: Evidence from remote sensing data fusion using an improved spatiotemporal fusion method. Sci. Total Environ. 2021, 750, 141612. [Google Scholar] [CrossRef]
  31. Yi, Y.; Wang, X.; Liu, Q.; Zhang, J.; Yi, Q. Influence of Water–Sediment Regulation Scheme on Accretion and Erosion in a River Delta: A Case Study of the Yellow River Delta, China. Estuaries Coasts 2022, 45, 1879–1887. [Google Scholar] [CrossRef]
Figure 1. Study area location. (a) Location of the Yellow River. (b) The Yellow River Delta in Shandong Province, China. (c) The study area.
Sustainability 17 05943 g001
Figure 2. Number of images (a) and good observations (b) per time period.
Sustainability 17 05943 g002
Figure 3. Annual runoff and sediment during 1986–2023.
Sustainability 17 05943 g003
Figure 4. Section distribution of the Yellow River Delta.
Sustainability 17 05943 g004
Figure 5. Coastline distribution of the Yellow River Delta in China during 1988–2023. (a) Diaokou estuary. (b) Beicha estuary. (c) Qingshuigou estuary.
Sustainability 17 05943 g005
Figure 6. Rate changes of the Yellow River Delta coastline. (a) Annual rate changes. (b) Interannual rate changes.
Sustainability 17 05943 g006
Figure 7. Land area change (a) and cumulative land area change (b) in the Yellow River Delta during 1988–2023.
Sustainability 17 05943 g007
Figure 8. Changes in land area change and cumulative land area change in typical estuarine segments from 1988 to 2023. (a,b) Diaokou estuary. (c,d) Beicha estuary. (e,f) Qingshugou estuary.
Sustainability 17 05943 g008
Figure 9. Relationship between cumulative annual runoff (a) and sediment (b) and the cumulative land area change in the entire estuary during 1988–2023.
Sustainability 17 05943 g009
Figure 10. Relationship between cumulative annual runoff (a) and sediment (b) and the cumulative land area change in the Beicha estuary during 1997–2023.
Sustainability 17 05943 g010
Figure 11. Relationship between annual sediment delivery and the land area change during 2017–2023. (a) Beicha estuary. (b) Entire estuary.
Sustainability 17 05943 g011
Table 1. Trends in coastline changes in the Yellow River Delta during 1988–2023.
AreaTransect NumbersAverage EPR (m/a)Average LRR (m/a)Maximum EPR (m/a)Maximum
LRR (m/a)
Minimum EPR (m/a)Minimum EPR (m/a)Average EPR (m/a)Average LRR (m/a)
Diaokou estuary1–136−81.54−84.5017.3914.98−206.05−248.3316.117.38
Beicha estuary137–222117.59135.84317.54374.14−54.13−50.58
Qingshuigou estuary223–32261.6521.85157.54120.84−26.41−87.84
Table 2. Trends in interannual coastline changes in the Yellow River Delta during 1988–2023.
Time PeriodAreaTransect NumbersAverage EPR (m/a)Maximum EPR (m/a)Minimum EPR (m/a)Average EPR (m/a)
1988–1996Diaokou estuary1–136−124.4467.63−486.2324.06
Beicha estuary137–222−25.80385.46−139.61
Qingshuigou estuary223–322268.891345.91−97.36
1997–2023Diaokou estuary1–136−66.6938.02−253.6113.36
Beicha estuary137–222167.22448.52−59.67
Qingshuigou estuary223–322−10.09124.65−281.64
Disclaimer/Publisher’s Note: The statements, opinions and data contained in all publications are solely those of the individual author(s) and contributor(s) and not of MDPI and/or the editor(s). MDPI and/or the editor(s) disclaim responsibility for any injury to people or property resulting from any ideas, methods, instructions or products referred to in the content.

