Article

MaxEnt-Based Evaluation of Cultivated Land Suitability in the Lijiang River Basin, China

College of Earth Sciences, Guilin University of Technology, Guilin 541006, China
*
Authors to whom correspondence should be addressed.
Sustainability 2025, 17(13), 5875; https://doi.org/10.3390/su17135875
Submission received: 5 May 2025 / Revised: 20 June 2025 / Accepted: 23 June 2025 / Published: 26 June 2025

Abstract

The Lijiang River Basin (LRB) is a karst ecosystem that presents unique challenges for agricultural land planning. Evaluating cultivated land suitability based on natural factors is critical for ensuring food security in this region. This study was based on the cultivated land distribution data of the LRB in the China Land-Use and Land-Cover Chang dataset, selecting 22 restriction factors across five dimensions: climate, topography, soil, hydrology, and social conditions, and the suitability of cultivated land (paddy fields and drylands) in the LRB was evaluated using the MaxEnt model to further identify the main restricting factors affecting the spatial distribution. The research showed that (1) For paddy fields, high-suitability areas covered 2875.05 km2, medium-suitability 1670.58 km2, low-suitability 3187.25 km2, and non-suitable 9368.46 km2. The main restriction factors were distance to villages, slope, surface gravel content, soil thickness, soil pH, and total phosphorus content. (2) For drylands, high-suitability areas covered 3282.3 km2, medium-suitability 2260.93 km2, low-suitability 4536.27 km2, and non-suitable 6836.85 km2. The main restriction factors were soil thickness, distance to roads, surface gravel content, elevation, soil pH, and soil texture. This research can provide a scientific basis for the layout of food security and planning agricultural land use in the LRB.

1. Introduction

Cultivated land is an indispensable component of the food supply system and an essential foundation for promoting sustainable agricultural development and assuring food security [1,2]. As urbanization continues to speed up, the cultivated land available for farming is decreasing; in addition, the quality of cultivated land has drastically degraded due to people’s long-term overexploitation of cultivated land resources and irrational methods of farming [3,4]. Evaluation of cultivated land suitability is a vital basis for optimizing and integrating cultivated land resources and ensuring food security [5]. Therefore, the evaluation of the suitability of cultivated land is significant for securing food safety and optimizing cultivated land utilization, as well as encouraging the advancement of sustainable agricultural [6].
Chinese and foreign scholars have conducted multifaceted research on evaluating the suitability of cultivated land. The selection of research methods and restriction factors, along with the evaluation system, has become increasingly refined. Research methods include hierarchical analysis, restriction factor methods, and gray relational analysis [7,8]. In terms of establishing a restriction factor selection and evaluation system construction, S. Sathiyamurthi et al. [9] selected restriction factors such as EC, soil pH, soil organic carbon, available NPK, soil texture, etc., to establish a system to evaluate the suitability of cultivated land in the Manimusha-Nadi watersheds. Arkadeep Dutta et al. [10] selected restriction factors such as precipitation, potential evapotranspiration, soil texture, soil organic carbon, soil pH, clay content, distance to the river, land use, slope, temperature, irrigation density, etc., to establish a system to evaluate the suitability of cultivated land in the Sali watershed. Although many scholars have carried extensive practical analyses on suitability evaluation of cultivated land, and while many research methods have been explored, there are still shortcomings, such as the weighting of evaluation factors often relying on expert scoring, subject to the differences between different scholars in the evaluation process, which unavoidably emerges in the evaluation of the results with subjective judgment [11,12].
With the constant development and advancement of computer technology, machine learning methods are beginning to be applied in diverse fields of study and, at the same time, present a significant opportunity to evaluate the suitability of cultivated land [13]. As one of the machine learning methods, the Maximum Entropy Model (MaxEnt) can objectively compute the importance of evaluation factors and conduct spatial analysis using currently available datasets, which has distinctive advantages for evaluating the suitability of cultivated land [14]. At present, the problems of food security and cultivated land quality are becoming increasingly important, and the Lijiang River Basin (LRB) has a suitable climate, abundant precipitation, and substantial cultivated land reserve resources [15]. Although some results have been gained in previous research on land use changes in the LRB and related aspects, there have been few empirical studies on the evaluation of cultivated land suitability [16,17,18].
Based on this, this paper selected the LRB as the study area and used the MaxEnt model combined with GIS technology to conduct an empirical evaluation of the suitability of cultivated land in the study area, to further analyze the main restricting factors on the suitability of cultivated land in the study area, with the expectation of providing a scientific basis for sustainable agricultural development and food security in the LRB.

2. Materials and Methods
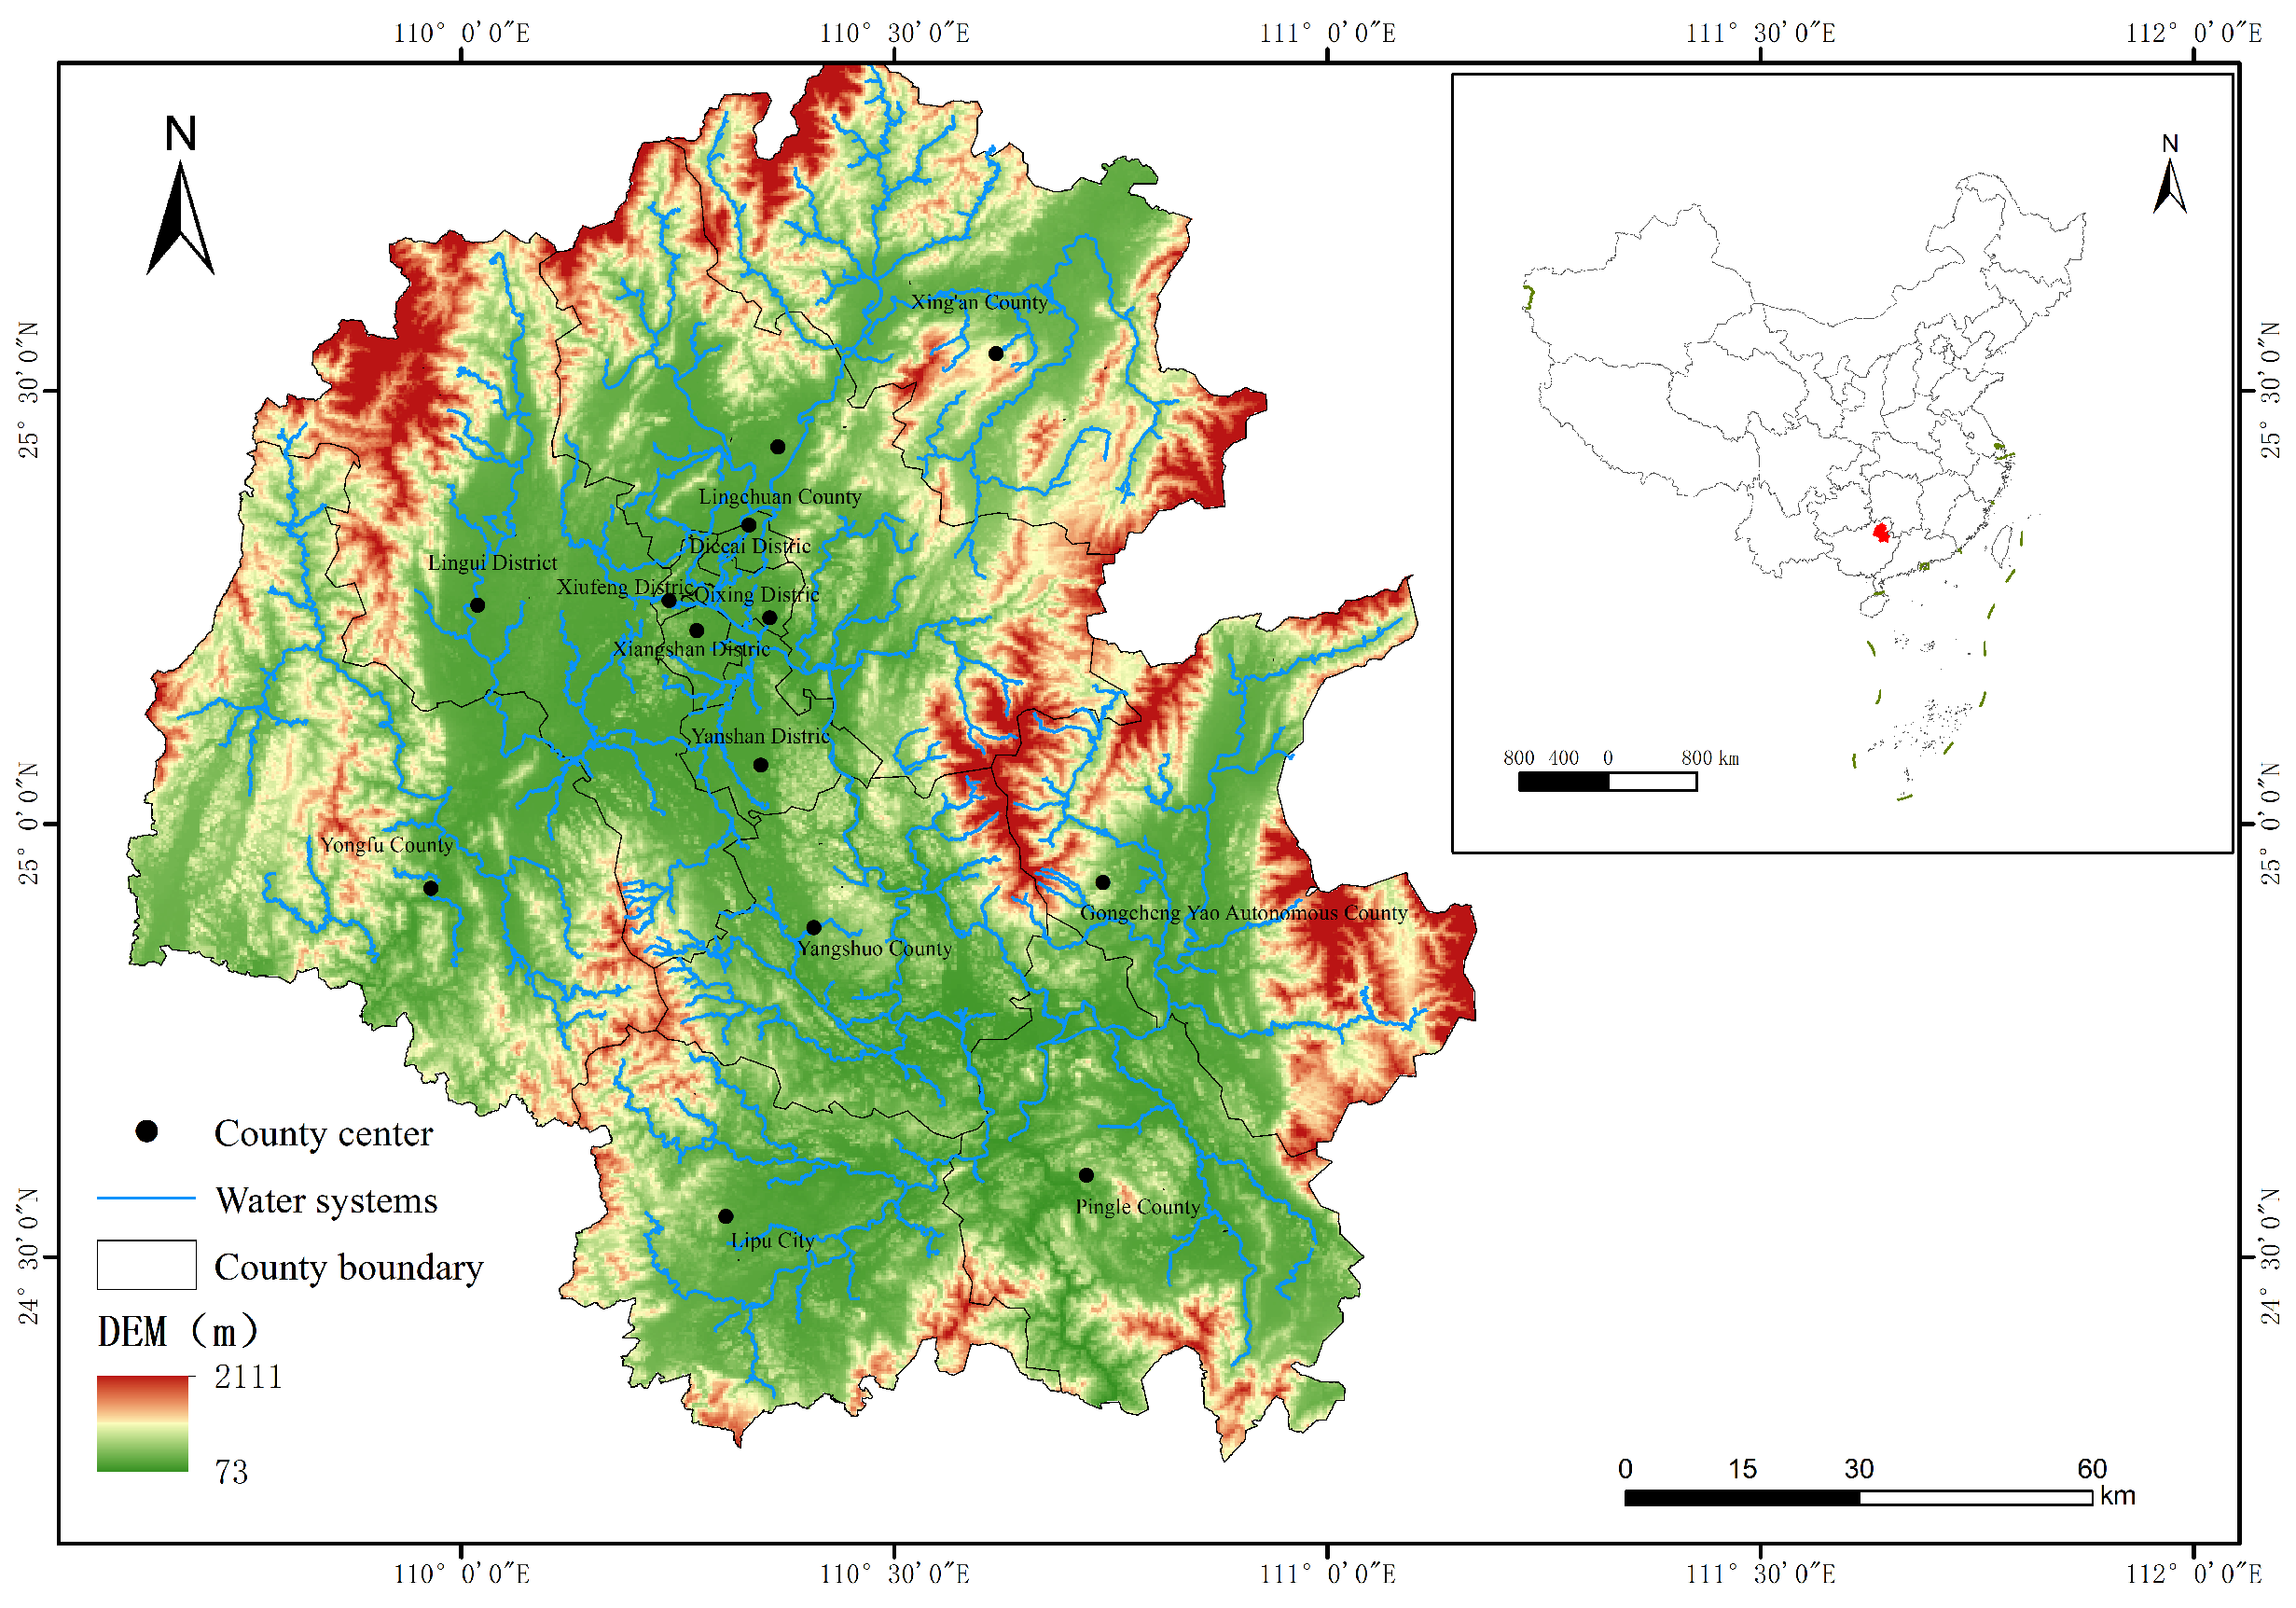
2.1. Study Area

The Lijiang River Basin (LRB) is located in the northeast of Guangxi Zhuang Autonomous Region in China, with a longitude of 110° 5 ~110° 44 E and a latitude of 24° 38 ~25° 56 N [19]. The basin has an area of around 17,377.22 km2 and flows through the urban region of Guilin and the counties and cities of Yanshan, Yangshuo, Lingui, Gongcheng, and Xing’an (Figure 1). The climate type of the LRB is a subtropical monsoon climate, with an average annual precipitation of 1596.15 mm and an average annual temperature of about 20 °C. The climate is warm, with a copious but irregular seasonal distribution of precipitation, with hot and rainy summers and mild and rainy winters. The terrain of the basin is relatively high in the north and relatively flat in the south, surrounded by mountains in the east, west, and north, with low-level valleys in the center and south, with a dense network of river branches and a unique hydrological-geomorphological system based on mountains and water.
The basin is dominated by karst landforms, with the northern half dominated by low and medium mountains, and the center and western parts relatively flat, dominated by low mountains, hills, and river valley plains. The LRB is a typical location for conducting an evaluation of cultivated land suitability due to its variable climate, topography, and soils, as well as varied hydrological conditions.

2.2. MaxEnt Model

The MaxEnt model is a statistical modeling method based on the concept of information theory, which is utilized widely in many fields such as machine learning, predictive modeling, data mining, etc., and has excellent value for assessing the potential suitability of species, as well as the prediction of the distribution of future suitable areas [20,21]. The core idea is to model by selecting the probability distribution with the maximum entropy given known facts or constraints [22]. The MaxEnt model mainly constructs a geographical distribution model by processing existing data on the distribution of species and related restricting factor data, calculates the contribution rate of the restricting factors affecting the distribution of species to identify the main restricting factors, and predicts the potential suitable distribution area of species based on the main restricting factors [23,24,25]. The MaxEnt model is more flexible in factor selection, easier to operate, and the prediction results are more accurate compared with other models; it can model suitability evaluation with only distribution point data and restriction factor data, and it can deal with continuous variables and categorical variables [26]. MaxEnt models have been widely used to research the impact of environmental factors on the distribution of suitable areas for grain crops such as wheat [27], corn [28], and rice [29]. The essence of evaluating the suitability of cultivated land is to evaluate grain crops such as rice and wheat. Therefore, this study used the MaxEnt model in combination with multiple environmental restriction factors to conduct a suitability evaluation of cultivated land (paddy fields and drylands).

2.3. Model Parameter Settings

To improve the accuracy and reasonableness of prediction outputs and prevent model overfitting, the ENMeval package was employed in R software version 4.4.2 to adjust and enhance the model’s Regularization Multiplier (RM) and Feature Combination parameter (FC) [30]. Six distinct combinations of features were tested for FC, specifically L, LQ, LQH, H, LQHP, and LQHPT, where L stands for linear features, Q for quadratic features, H for hinge features, P for product features, and T for threshold features. The RM range was set between 0.1 and 6.0 [31]. Evaluation of the model’s complexity and fit is carried out using the delta value of the corrected Akaike Information Criterion (AICc). The optimum parameter combination with the smallest delta AICc (delta AICc = 0) was finally selected for modeling [32]. For species distribution point data selection, 70% of the cultivated land distribution points were randomly picked as training data, while 30% were utilized as test data [33]. The number of Replicates was set to 10, the Replicate run type was chosen as Bootstrap, and the Maximum iterations setting was set to 5000. The options of Create response curves and Do jackknife to measure variable importance were chosen, the output format was set to Logistic, and the other settings were kept as default, while the average result of 10 runs of the model was taken as the ultimate result [34].
A receiver operating characteristic curve (ROC) of the model output results and the area (AUC) under the ROC curve were used as techniques to evaluate the correctness of the model’s operating results. The AUC result is between 0 and 1 [35]. The closer the AUC result is to 1, the higher the accuracy of the model and the better the prediction results. In particular, an AUC result of <0.5 indicates that the model run failed and has no reference value; an AUC result of 0.5 to 0.8 indicates that the model run was average and has some reference value; an AUC result of 0.8 to 0.9 indicates that the model run was good and has high reference value; an AUC result of >0.9 indicates that the model run was very good and has very high reference value [36,37].

2.4. Data Sources and Processing

2.4.1. Cultivated Land Data Sources and Processing

The data on cultivated land in the LRB utilized in this study originated from the China Land-Use and Land-Cover Chang Dataset (CNLUCC) of the Scientific Data Registration and Publishing System for Resources and the Environment (http://www.resdc.cn/DOI). The dataset is a thematic database of multi-period land use/land cover at the national scale in China, constructed with manual visual interpretation using US Landsat remote sensing images as the main source of information. A two-level classification method was adopted, with the first level separated into six categories: cultivated land, forest land, grassland, water bodies, construction land, and unused land. Cultivated land was further divided into paddy fields and drylands. The overall interpretation accuracy was above 91.2% [38]. In this study, six periods of data were selected: 1995, 2000, 2005, 2010, 2015, and 2020. The raster data of the distribution of paddy fields and drylands in the LRB were extracted using the Extract by Attribute tool in the Spatial Analyst tool of ArcGIS, and the Cell Statistics tool was used to analyze the majority of these six periods of data as the average spatial distribution of cultivated land use in the LRB over the past 25 years. To investigate the impact of different spatial resolutions on the accuracy and rationality of the modeling results for the suitability evaluation of cultivated land, paddy field, and dryland, the distribution data were resampled into four different spatial resolutions (1 km, 2 km, 5 km, and 10 km) and input into the MaxEnt model to construct models, yielding prediction results under different spatial resolutions. As demonstrated in Figure 2a,b, when the spatial resolution was 5 km, the AUC values for paddy fields and drylands were the highest. Therefore, a spatial resolution of 5 km × 5 km was used to screen the distribution points of paddy fields and drylands. The distribution point data for paddy fields and drylands used in this study were processed using the Point Distance tool in ArcGIS’s analysis tools, processing the distribution data for paddy fields and drylands to retain only one point within a 5 km × 5 km resolution. The number of distribution points for paddy fields and drylands ultimately used for suitability evaluation was 195 and 205, respectively (Figure 3).

2.4.2. Data Sources and Processing of Restriction Factors

After fully considering the climatic characteristics and environmental features of the LRB, and based on expert knowledge and an analysis of the natural geographical features of the study area, 22 environmental factors related to climate, topography, soil, hydrology, and social conditions were selected as restriction factors for the study area, for evaluation of cultivated land suitability (Table 1).
The climatic data used in this study were a monthly precipitation dataset and monthly mean temperature dataset for China, with a resolution of 1 km from 1995 to 2020, both of which were taken from the National Tibetan Plateau Data Center (http://data.tpdc.ac.cn). The average values of precipitation and temperature from 1995 to 2020 were calculated using the raster calculator of ArcGIS. Elevation data from the original SRTM DEM 90-meter resolution elevation data in the Digital Elevation Model (DEM) dataset provided by the Geospatial Data Cloud platform (https://www.gscloud.cn/) were used and processed using the mask extraction tool in ArcGIS to obtain the elevation data of the LRB. Slope data were produced by analyzing DEM data using the Slope analysis tool in ArcGIS. Slope direction data were obtained by performing slope direction analysis on slope data using ArcGIS. All soil data are from the National Tibetan Plateau Data Center’s (http://data.tpdc.ac.cn) basic soil property dataset of high-resolution China Soil Information Grids. The soil-related data of the LRB were produced using the Extract By Mask tool in ArcGIS. Hydrological data from the Scientific Data Registration and Publication System for Resources and Environment (http://www.resdc.cn/DOI) were used. Hydrological data included distance to the river and groundwater level. The distance to the river in the LRB was calculated by analyzing the hydrological data using the Euclidean Distance tool in ArcGIS; groundwater level data were sourced from the 2022 China Regional Groundwater Level Data available on the Resource and Environmental Science Data Registration and Publication System (http://www.resdc.cn/DOI). Social condition data included distance to roads and distance to villages. The distance to villages was obtained from the China Land-Use and Land-Cover Change Dataset in the Resource and Environmental Science Data Registration and Publication System (http://www.resdc.cn/DOI). The 2023 land use status data were selected, and the village data were obtained by selecting attributes. Euclidean distance analysis was then performed on the village data to obtain the results. The distance to roads data were sourced from the 2020 road spatial distribution data of the Resource and Environmental Science Data Registration and Publication System (http://www.resdc.cn/DOI). County road data were extracted using ArcGIS’s attribute extraction tool. Euclidean distance analysis was then performed on the county road data to obtain the distance to road data. Due to the mountainous terrain and significant surface elevation variations in the LRB, restriction factors (such as slope and elevation) exhibited significant changes within a 300-meter spatial range, thereby influencing the results of the cultivated land suitability evaluations. Therefore, all evaluation factor data were resampled to a spatial resolution of 300 m × 300 m and projected into the Universal Transverse Mercator (UTM) coordinate system (WGS 1984, Zone 49N). Finally, this study used the processed distribution point data and restriction factor data to construct a MaxEnt model, and evaluated the suitability of cultivated land in the LRB using a 300 m × 300 m grid as the evaluation unit.

2.5. Restriction Factor Screening

Due to the spatial correlation of restriction factors, the reliability of model predictions and the interpretation of results may be affected. Therefore, restriction factors need to be screened [39]. First, the processing data of the paddy field and dryland distribution points and restriction factors were input into the MaxEnt model, and the model was run 10 times to attain average results [40]. The contribution rate of the restriction factors was analyzed using the Jackknife test method, and then a correlation analysis was performed on all the restriction factors, to determine a correlation coefficient r between each pair of restriction factors. The restriction factors with |r| < 0.8 were preserved. If the correlation coefficient between two restriction factors was |r| > 0.8, the factor with a higher contribution rate was kept, while the variable with a lower contribution rate was eliminated [41,42,43]. Finally, the restriction factors used to evaluate the suitability of paddy fields and drylands were determined, and their contribution rates were obtained. The final restriction factors utilized to study the suitability evaluation of paddy fields and drylands were 17 and 16, respectively (Table 2).

2.6. Classification of Suitable Areas

Suitable areas were determined based on the overall distribution of suitability prediction results for paddy fields and drylands according to the MaxEnt model and dynamic changes in restriction factors. The average prediction results of the MaxEnt model repeated 10 times were imported into ArcGIS, and the Reclassify tool was used to reclassify the suitable areas of paddy fields and drylands in the LRB into four classes according to the probability of presence (P) as calculated by the model, which was high-suitability area (P > 0.5), medium-suitability area (0.4 < P < 0.5), low-suitability area (0.2 < P < 0.4), and non-suitable area (P < 0.2) [44,45].

3. Results

3.1. Analysis of Model Run Results

Following the optimization of the model with the ENMeval package in R, the optimal parameter settings for paddy fields were adopted as FC = LQHPT and RM = 4.5, while those for dryland were adopted as FC = LQ and RM = 1 (as shown in Figure 4a,b). Simulation and prediction of paddy fields and drylands in the LRB was performed using an optimized MaxEnt model. The model was run 10 times to generate the ROC curves and average AUC values of paddy fields and drylands in the LRB. The AUC results for paddy fields and drylands were 0.844 and 0.847, respectively (Figure 5), showing that the model results were good and had high reference values. The suitable area distribution of paddy fields and drylands in the LRB could be simulated and studied.

3.2. Distribution of Suitable Areas for Paddy Fields and Analysis of Major Restriction Factors

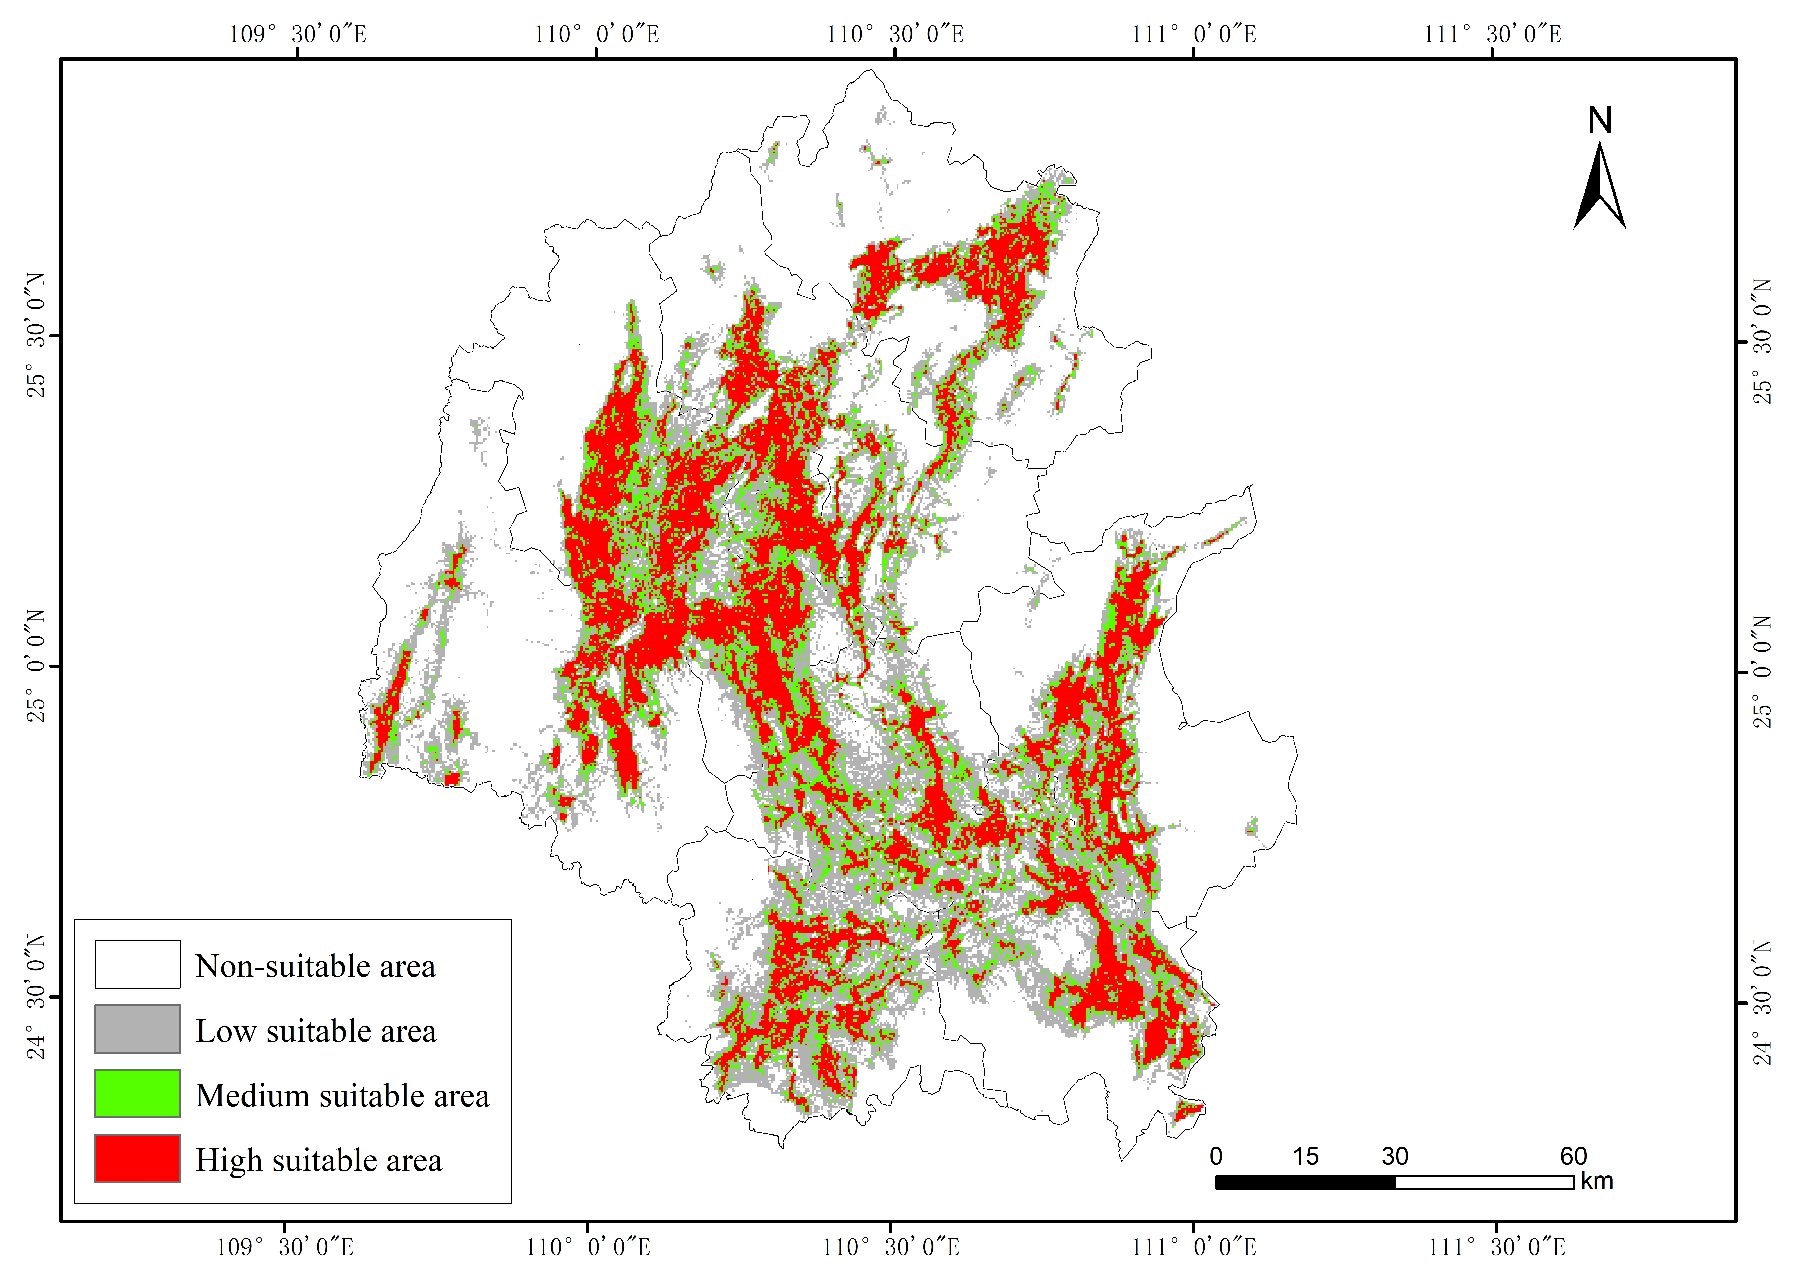
3.2.1. Distribution of Suitable Areas for Paddy Fields

The spatial distribution of the suitability of paddy fields in the LRB had a characteristic “centralized high suitability with peripheral decline” pattern. The high suitability areas for paddy fields were primarily concentrated in the western part of the LRB, with an area of 2875.05 km2, of which Lingui District, Pingle County, and Yongfu County have the largest high suitability areas, with an area of 554.94 km2, 364.32 km2, and 310.23 km2, respectively. The medium suitability areas of paddy fields were primarily concentrated in the southeastern part of the LRB, with an area of 1670.58 km2, among which Yangshuo County, Pingle County, and Lingchuan County have the largest medium suitability areas, with an area of 240.57 km2, 212.22 km2, and 191.61 km2, respectively. The low suitability areas for paddy fields were primarily concentrated in the central and southeastern regions of the LRB, with an area of 3187.25 km2, of which Pingle County, Yangshuo County, and Lipu City have the largest low suitability areas, with an area of 526.05 km2, 509.13 km2, and 471.51 km2, respectively. The non-suitable areas of paddy fields were primarily concentrated in the edge area of LRB, with an area of 9368.46 km2, of which Yongfu County, Xing’an County, and Lingchuan County have the largest non-suitable areas, with an area of 1878.39 km2, 1600.65 km2, and 1423.80 km2, respectively (as shown in Table 3 and Figure 6).

3.2.2. The Main Restriction Factors for Suitability for Paddy Fields

Distance to villages, slope, surface gravel content, soil thickness, soil pH, and total phosphorus content were considered the main restriction factors for paddy field suitability in the LRB, with contribution rates of 32.9%, 22%, 18.7%, 6.6%, 3.9%, and 3.3%, respectively, cumulatively accounting for 87.4% of the observed restriction factors.
(1)
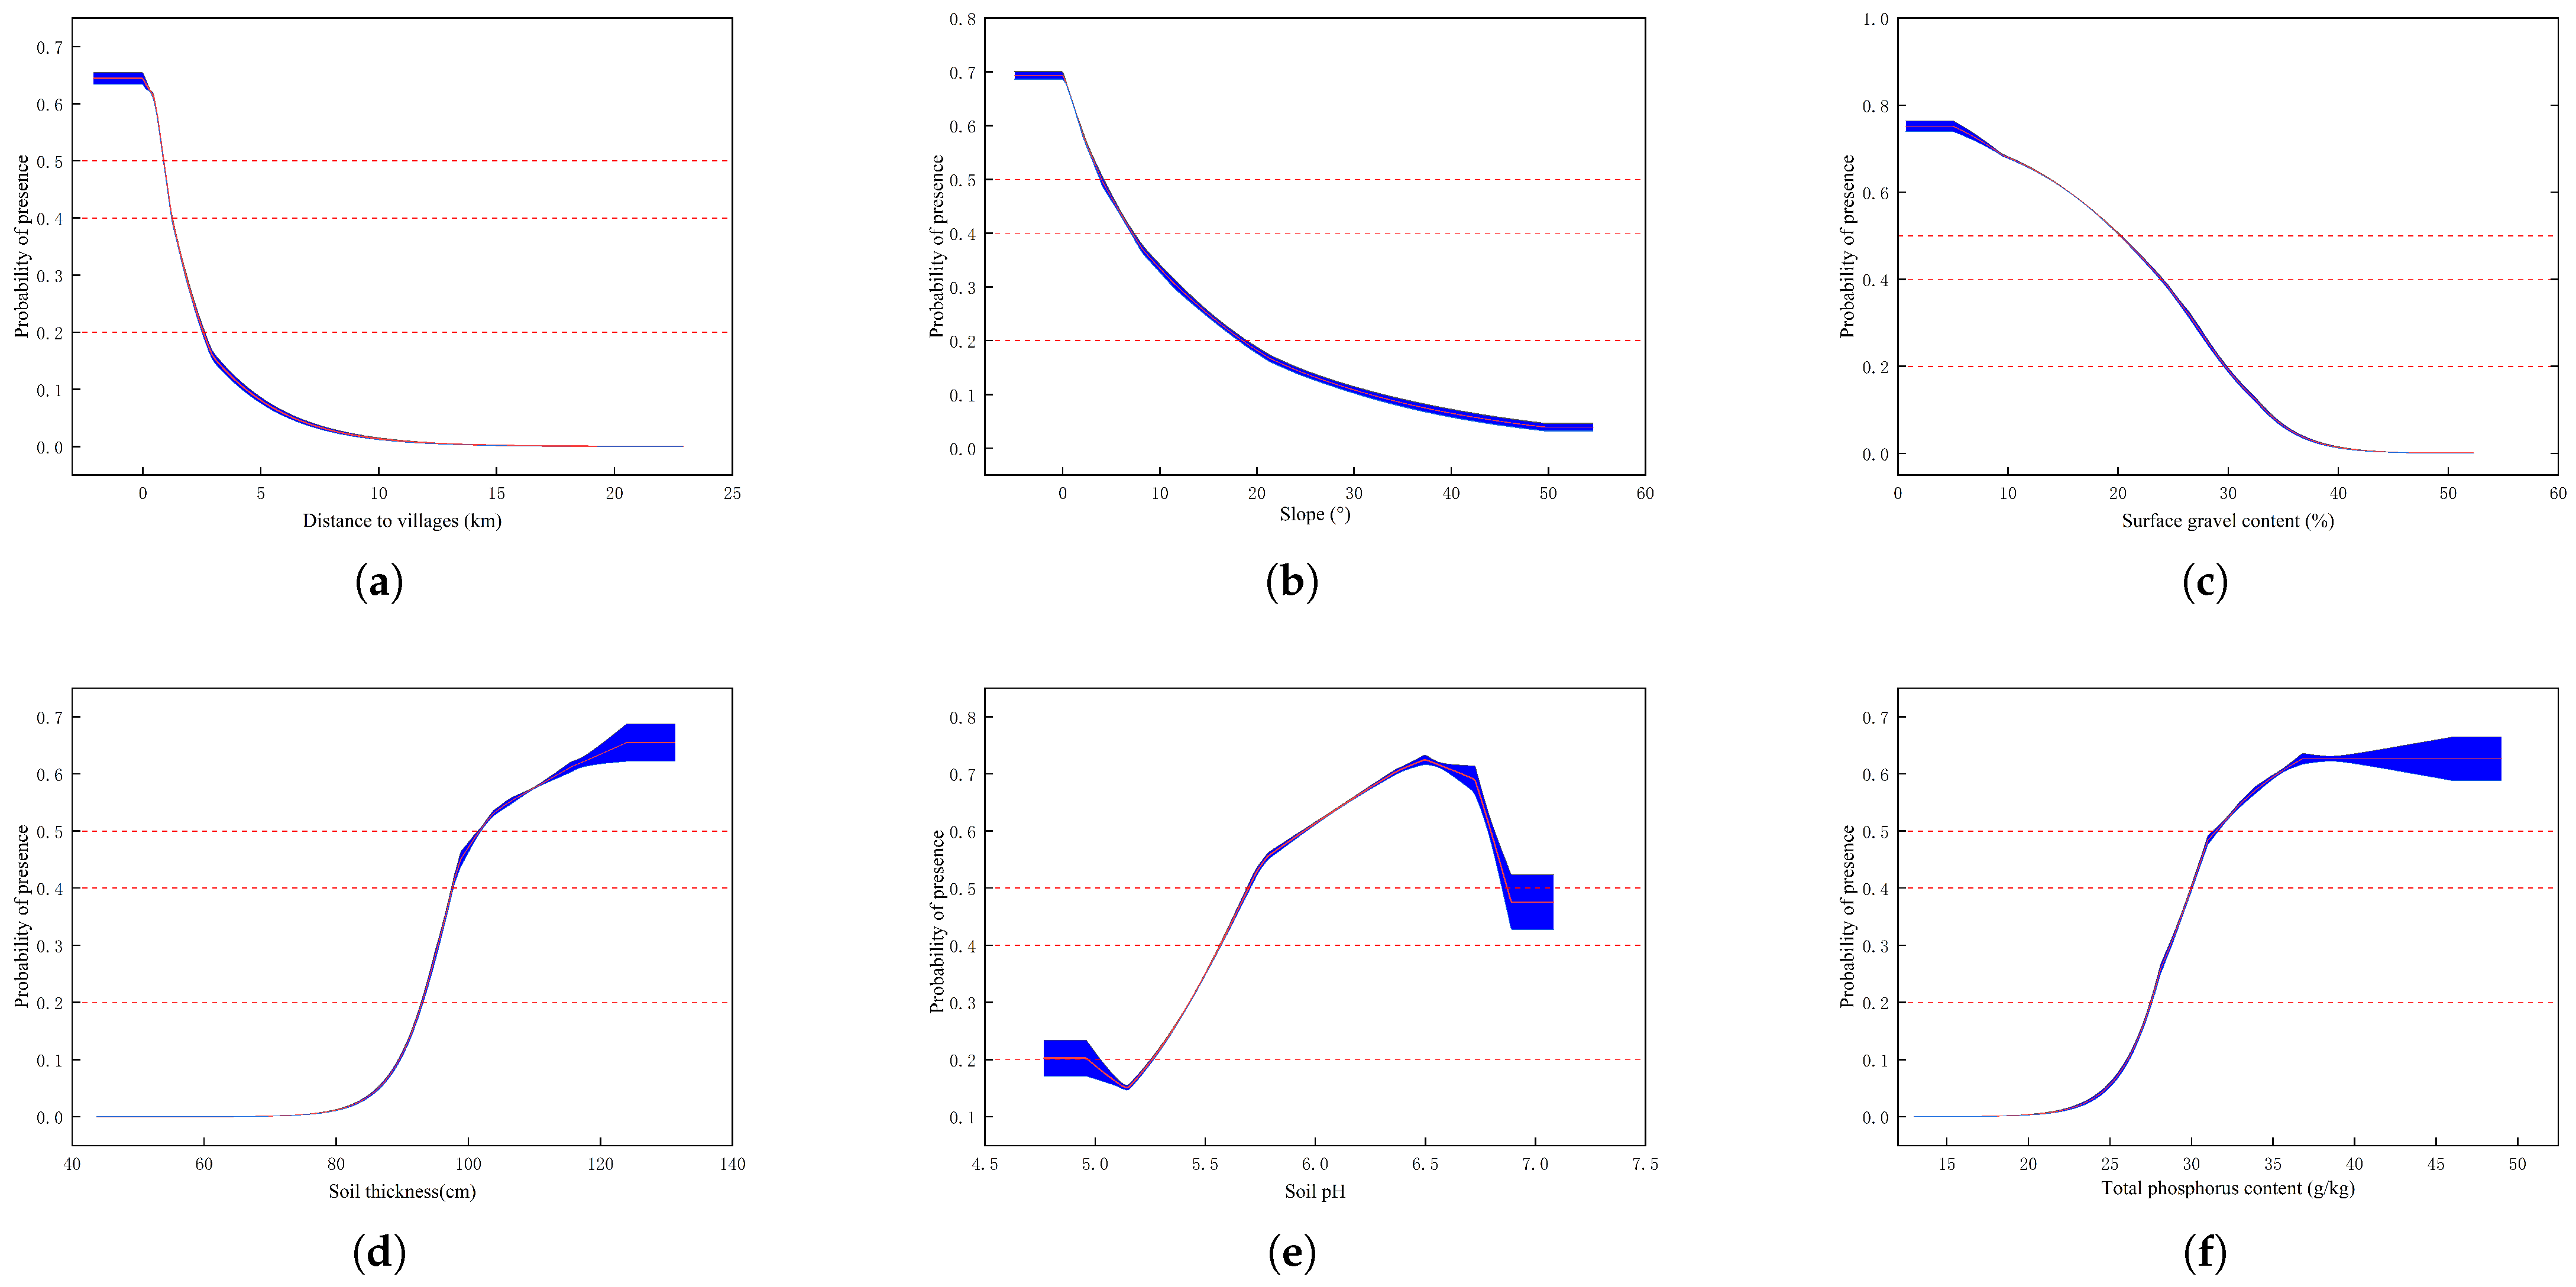
Distance to villages. The response curve of the suitability of paddy fields for distance to villages is given in Figure 7a. As the distance to villages increases, the general suitability of paddy fields exhibits a constant declining trend. When the distance to villages is less than 0.83 km, the area is suitable for paddy fields (P > 0.5), with the most favorable distance to villages being 0.016 km (Pmax); when the distance to villages exceeds 2.45 km, the area is unsuitable for paddy fields (<0.2).
(2)
Slope. The response curve of slope for the suitability of paddy fields is given in Figure 7b. As the slope increases, the general suitability of paddy fields exhibits a declining trend. When the slope is less than 3.8°, the suitability of paddy fields is relatively high (P > 0.5), with the optimal slope being 0° (Pmax). When the slope is larger than 18.1°, the area is unsuitable for paddy fields (P < 0.2).
(3)
Surface gravel content. The response curve of surface gravel content for the suitability of paddy fields is shown in Figure 7c. As the surface gravel content increases, the suitability of paddy fields exhibits a constant declining trend. When the surface gravel content is less than 20.1%, the area is suitable for paddy fields (P > 0.5), with the ideal surface gravel content being 0.7% (Pmax). When the surface gravel content exceeds 29.7%, the area is unsuitable for paddy fields (P < 0.2).
(4)
Soil thickness. The response curve of soil thickness for the suitability of paddy fields is given in Figure 7d. As soil thickness increases, the suitability for paddy fields first increases and subsequently falls. When the soil thickness exceeds 101 cm, the area is suitable for paddy fields (P > 0.5), with the optimal soil thickness being 124 cm (Pmax). When the soil thickness is less than 92 cm, the area is unsuitable for paddy fields (P < 0.2).
(5)
Soil pH. The response curve of soil pH for the suitability of paddy fields is depicted in Figure 7e. As soil pH increases, the suitability of paddy fields first increases and then decreases. When the soil pH exceeds 5.7, the area is suitable for paddy fields (P > 0.5), with the most suitable soil pH being 6.5 (Pmax); when soil pH is less than 5.3, the area is unsuitable for paddy fields (P < 0.2).
(6)
Total phosphorus content. The response curve of total phosphorus content for the suitability of paddy fields is depicted in Figure 7f. As total phosphorus content increases, the suitability of paddy fields exhibits an upward trend. When the total phosphorus content is greater than 32.1 g/kg, the area is suitable for paddy fields (P > 0.5), with the optimal total phosphorus content being 37.4 g/kg (Pmax); when the total phosphorus content is less than 27.9 g/kg, the area is unsuitable for paddy fields (P < 0.2).
Figure 7. The response curve of the main restriction factors for paddy field suitability (a). The response curve of distance to villages for paddy field. (b) The response curve of slope for paddy field. (c) The response curve of surface gravel content for paddy field. (d) The response curve of soil thickness for paddy field. (e) The response curve of soil pH for paddy field. (f) The response curve of total phosphorus content for paddy field.
Sustainability 17 05875 g007

3.3. Distribution of Suitable Areas for Drylands and Analysis of Major Restriction Factors

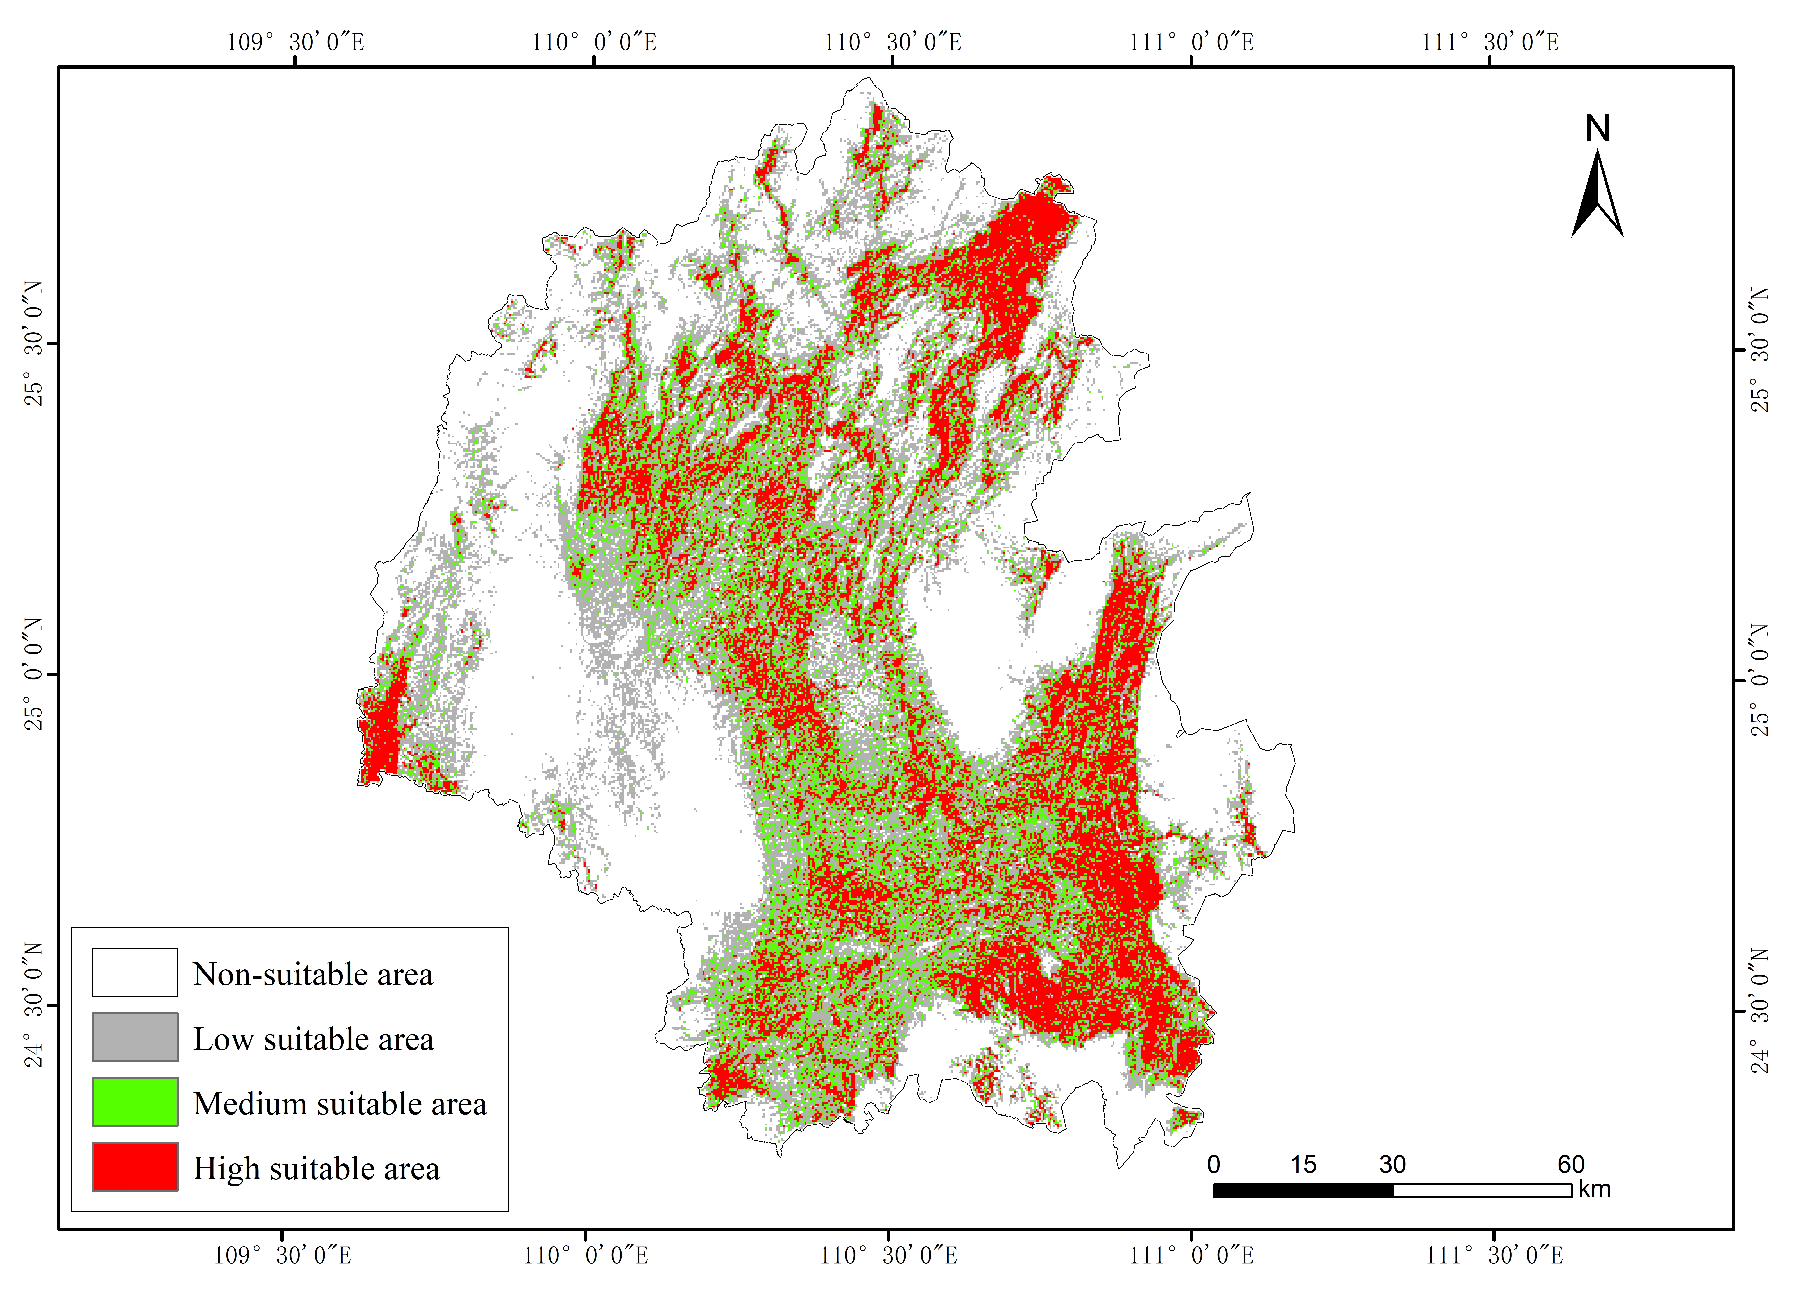
3.3.1. Distribution of Suitable Areas for Drylands

The spatial distribution of the suitability for drylands in the LRB has a characteristic “centralized high suitability with peripheral decline” pattern. The high suitable areas for drylands are concentrated primarily on the western part of the LRB, with an area of 3282.3 km2, of which Pingle County, Xing’an County, and Gongcheng Yao Autonomous County have the largest high suitability areas, with an area of 703.89 km2, 533.88 km2, and 482.49 km2, respectively. The medium suitability areas for drylands are primarily concentrated in the southeastern part of the LRB, with an area of 2260.93 km2, among which Lipu City, Yangshuo County, and Lingui District have the largest medium suitability areas, with an area of 376.38 km2, 368.28 km2, and 353.07 km2, respectively. The low suitability areas for drylands are primarily concentrated in the central and southeastern regions of the LRB, with an area of 4536.27 km2, of which Lingchuan County, Lingui District, and Yongfu County have the largest areas of low suitability, with an area of 740.07 km2, 643.23 km2, and 630.27 km2, respectively. The non-suitable areas for drylands are primarily concentrated in the edge area of the LRB, with an area of 6836.85 km2, of which Yongfu County, Gongcheng Yao Autonomous County, and Xing’an County have the largest non-suitable areas, with an area of 1886.22 km2, 1044.09 km2, and 921.60 km2, respectively (As shown in Table 4 and Figure 8).

3.3.2. The Main Restriction Factor for Suitability for Drylands

Soil thickness, distance to roads, surface gravel content, elevation, soil pH, and soil texture were considered the primary restriction factors for dryland suitability in the LRB, with contribution rates of 31.2%, 12.8%, 10.1%, 7.7%, 7.6%, and 5.8%, respectively, cumulatively accounting for 75.2% of the observed restriction factors.
(1)
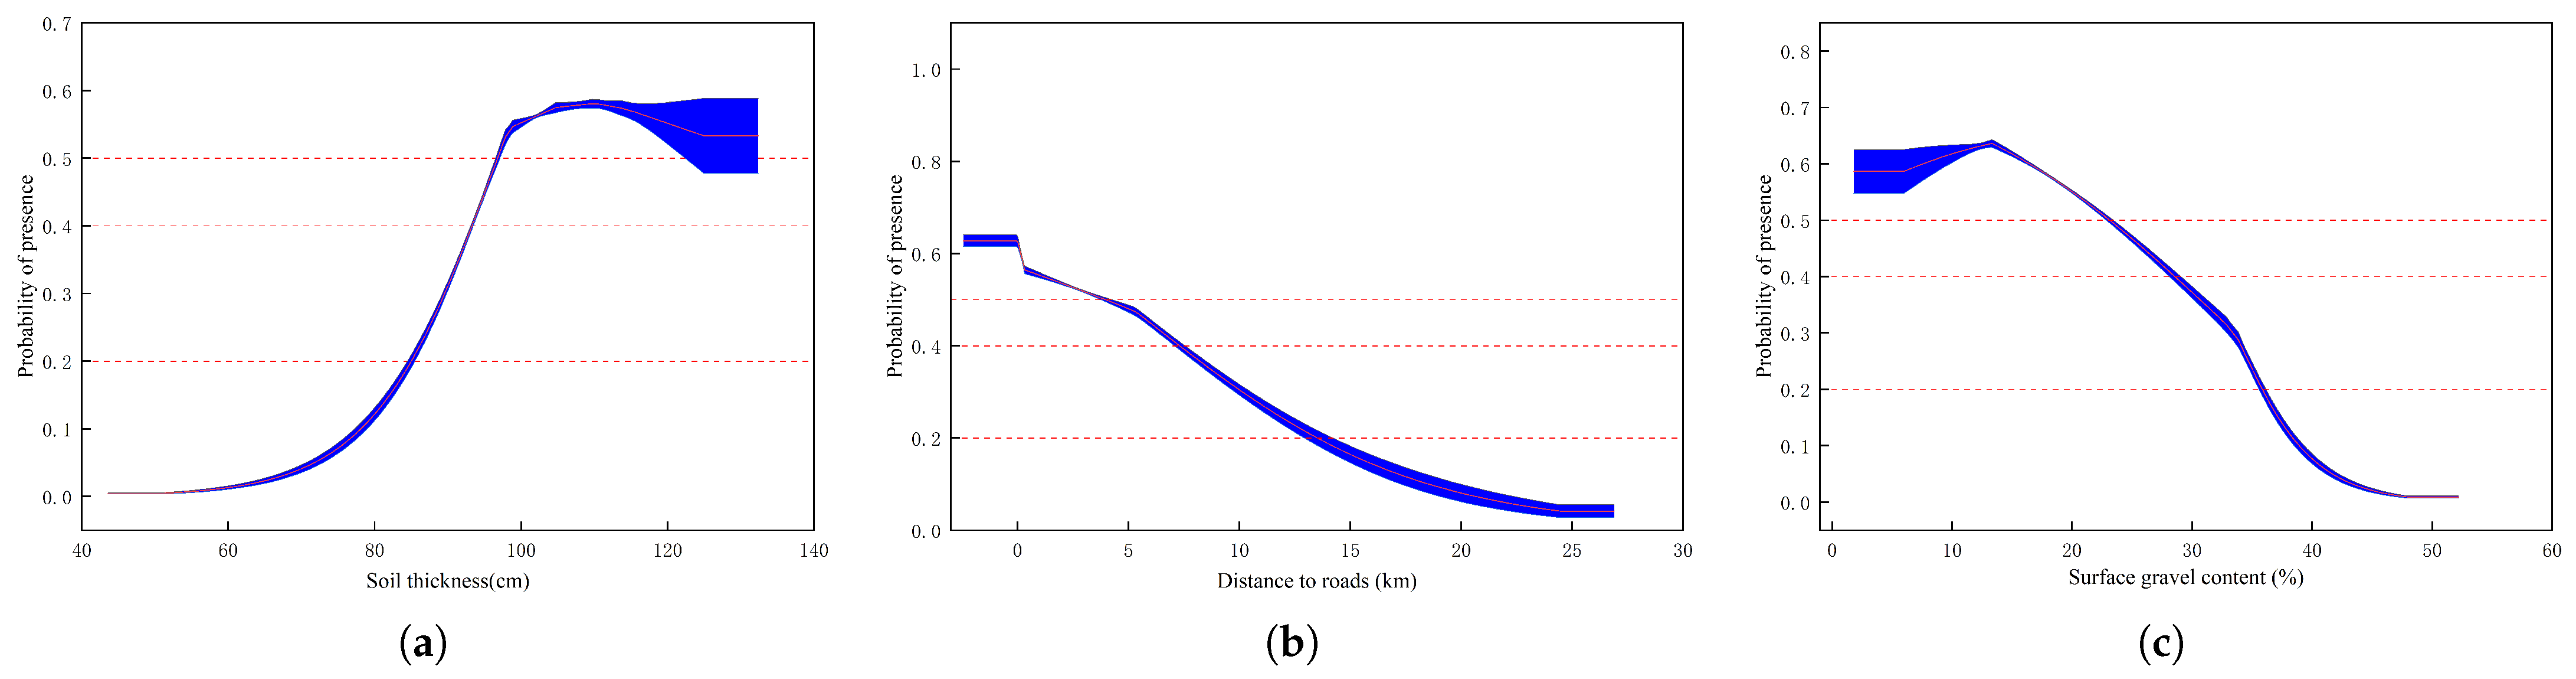
Soil thickness. The response curve of soil thickness for the suitability for dryland is shown in Figure 9a. As soil thickness increases, the overall suitability of dryland shows an upward trend. When soil thickness is greater than 97 cm, the area is relatively suitable for dryland (P > 0.5), with the optimal soil thickness being 110 cm (Pmax); when soil thickness is less than 85 cm, the land is unsuitable for dryland (P < 0.2).
(2)
Distance to roads. The response curve for distance to roads and suitability for dryland is illustrated in Figure 9b. With increasing distance to roads, the overall suitability for dryland shows a downward trend. When the distance to roads is less than 3.95 km, the area is relatively suitable for dryland (P > 0.5), with the optimal distance to roads being 0.1 km (Pmax). When the distance to roads exceeds 13.5 km, the area is unsuitable for dryland (P < 0.2).
(3)
Surface gravel content. The response curve of surface gravel content for the suitability for dryland is shown in Figure 9c. As the surface gravel content increases, the suitability for drylands exhibits a constant declining trend. When the surface gravel content is less than 23.5%, the area is suitable for drylands (P > 0.5), with the ideal surface gravel content being 17.7% (Pmax). When the surface gravel content exceeds 36.5%, the area is unsuitable for dryland (P < 0.2).
(4)
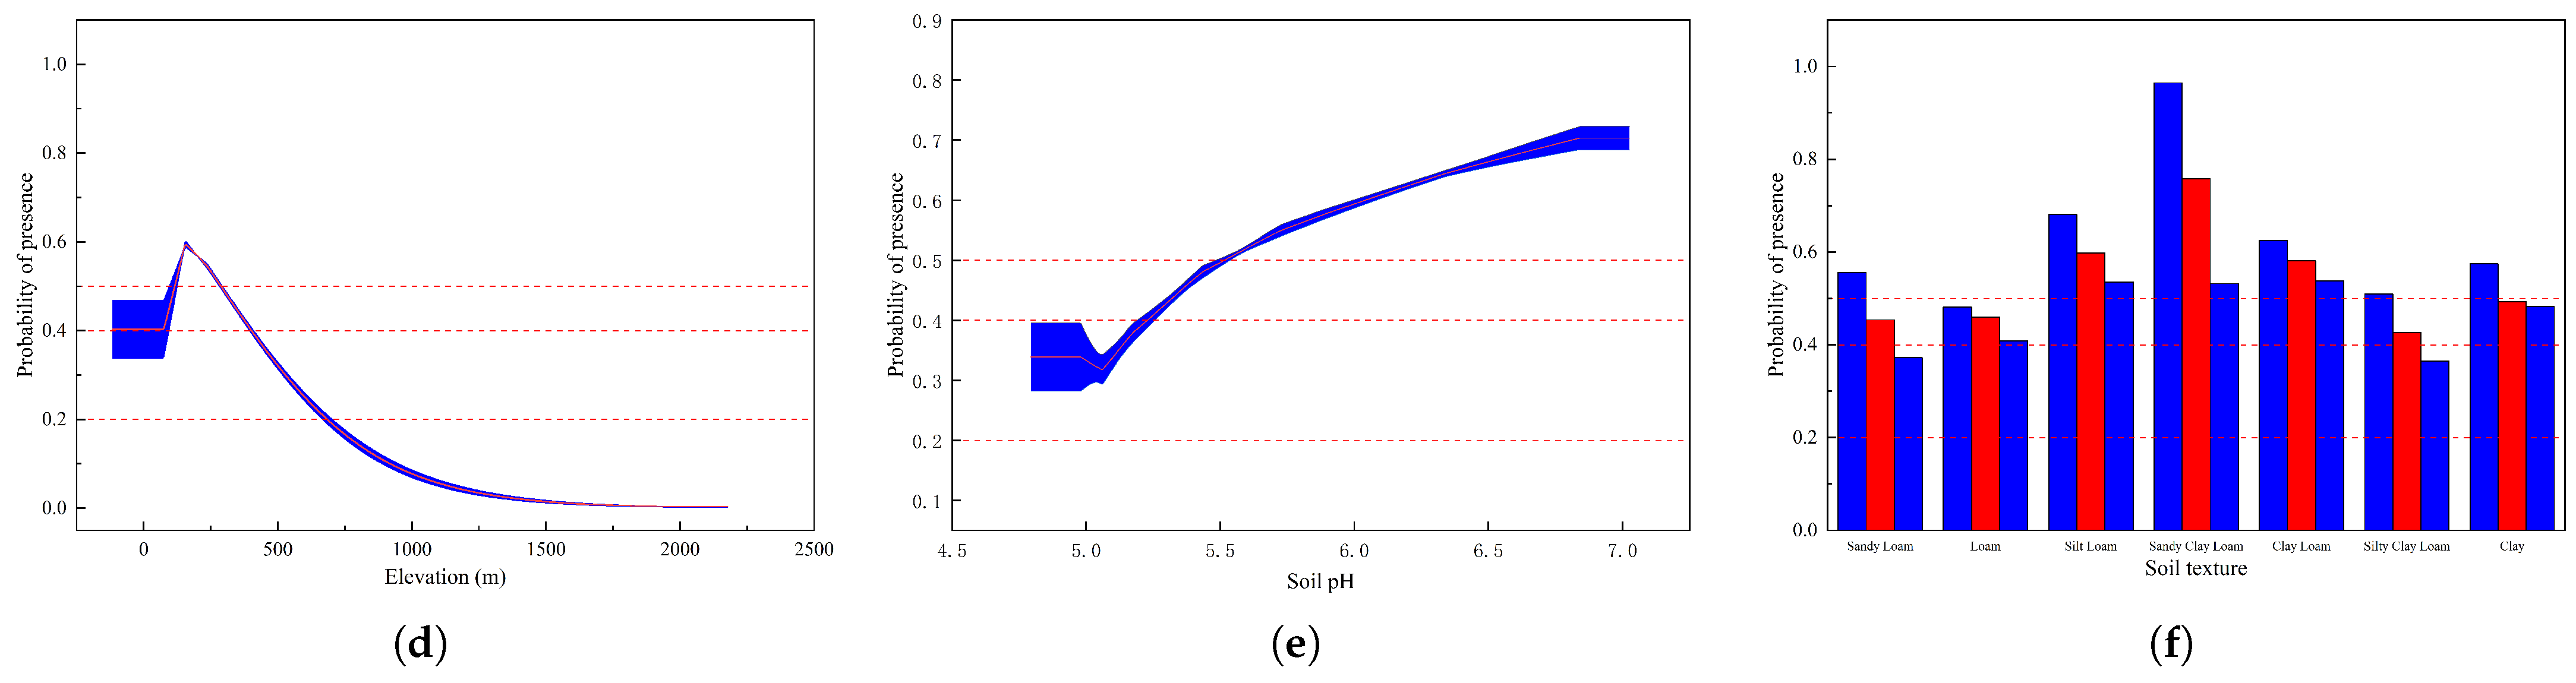
Elevation. The response curve of elevation for the suitability for dryland is shown in Figure 9d. With increasing elevation, the suitability for dryland shows a continuous downward trend. When the elevation is <286 m, the land is relatively suitable for dryland (P > 0.5), with the most suitable elevation being 155 m (Pmax); when the elevation is >683 m, the area is unsuitable for dryland (P < 0.2).
(5)
Soil pH. The response curve of soil pH for the suitability for dryland is depicted in Figure 9e. With increasing soil pH, the overall suitability for dryland shows a continuous upward trend. When the soil pH > 5.5, the soil is relatively suitable for dryland (P > 0.5), with the ideal soil pH being 6.8 (Pmax).
(6)
Soil texture. The soil texture in the LRB is primarily composed of six types: sandy loam, loam, silt loam, sandy clay loam, clay loam, silt clay loam, and clay. The response curves of soil texture for the suitability for dryland are illustrated in Figure 9f. The soil texture types ideal for dryland are silt loam, sandy clay loam, and clay loam (P > 0.5). With sandy clay loam being the most suitable (Pmax). The soil textures in the LRB are generally suitable for dryland (P > 0.2).
Figure 9. The response curves of the main restriction factors for dryland suitability (a) The response curve for soil thickness for dryland. (b) The response curve of distance to roads for dryland. (c) The response curve of surface gravel content for dryland. (d) The response curve of elevation for dryland. (e) The response curve of soil pH for dryland. (f) The response curve of soil texture for dryland.
Sustainability 17 05875 g009aSustainability 17 05875 g009b

4. Discussion

The evaluation of suitability of cultivated land is the fundamental basis for planning the layout of cultivated land and ensuring the sustainable development of cultivated land resources. Utilization of the MaxEnt model to evaluate cultivated land suitability can effectively deal with non-linear relationships and identify the spatial distribution features of cultivated land suitability based on complex interactions between environmental restriction factors, thereby improving the accuracy and reliability of the evaluation results. In contrast to prior methodologies, such as the AHP [46] combined with GIS techniques and Multi-Criteria Decision Analysis (MCDA) [47], using the MaxEnt model to evaluate the suitability of cultivated land can avoid the shortcomings of these methods in determining evaluation factor weights which are overly subjective. In addition, selecting average values of cultivated land utilization data of the last 25 years to carry out an evaluation minimizes the probability of distortion of information resulting from short-term changes to the cultivated land area, and makes the prediction results closer to the actual distribution status of cultivated land.
In this study, 22 evaluation factors were chosen from the five dimensions of climate, topography, soil, hydrology, and social conditions. The contribution rate of the evaluation factors was obtained using the MaxEnt model operation to determine the importance of the evaluation factors. The results showed that the main restriction factors affecting the suitability of cultivated land were distance to villages, soil thickness, slope, surface gravel content, distance to roads, elevation, soil pH, total phosphorus content, and soil texture. In the study, distance to villages contributed the most to the suitability of cultivated land (32.9%), mainly because villages are concentrated areas where farmers live and work. Farmers can more easily reach fields for daily farming activities when they are close to villages. The closer the cultivated land is to villages, the more easily farmers can manage the land, ensuring that all the needs of crops during their growth process are met. Javad Seyedmohammadi et al. [46] combined the AHP method with GIS technology to evaluate the agricultural suitability of land. The weights of the evaluation factors were obtained through expert assessment, with the weight of soil texture (0.14) > soil pH (0.12). In this study, the contribution rate of soil texture (5.8) > soil pH (3.9) was obtained through model calculations, indicating that soil texture and soil pH play a very important role in the evaluation of cultivated land suitability. Mengmeng Tang et al. [48] indicated that the primary limiting factors for cultivated land quality were the effective soil layer thickness and soil pH, while the results of this study indicated that soil thickness and pH were the main restriction factors for the suitability of cultivated land, which shows the pivotal role of soil properties in shaping cultivated land distribution. Wang Peijun et al. [49] demonstrated that traffic accessibility, air temperature, precipitation, elevation, and slope were the key factors impacting the spatial distribution of cultivated land, while the results of this study indicated that distance to roads, slope, and elevation had a remarkable effect on the suitability of cultivated land, and this means that topographical factors and social conditions have a significant limiting effect on the suitability of cultivated land. The consistency of these research results shows the feasibility of the MaxEnt model in evaluating the suitability of cultivated land. By integrating the MaxEnt model with multidimensional environmental factors to evaluate the suitability of cultivated land, the subjectivity inherent in traditional weighting methods is effectively avoided, while the accuracy of suitability predictions is improved.
The unique climate and topographical characteristics of karst regions are of significant importance when conducting cultivated land research. Jianhui Dong et al. [50] selected 13 evaluation factors, including average slope, effective soil layer thickness, surface soil texture, organic matter content, and soil pH, and used a comprehensive analysis approach to analyze the spatiotemporal changes in cultivated land in Long’an County, a karst region in China. In this study, 22 restriction factors were selected, and a MaxEnt model was built to evaluate the suitability of cultivated land in the Lijiang River Basin of China’s karst region. Compared to the research by Jianhui Dong et al., this study selected a greater number of environmental restriction factors for evaluation, resulting in more accurate and universally applicable evaluation results.
There are certain limitations to this study. Human activities are an important factor affecting the suitability of cultivated land; for example, places with vast undulating topographic slopes are not ideal for the development of cultivated land under natural conditions, but locations with high slopes can be changed into terraces through artificial interventions to increase their suitability for agricultural production. This study only analyzed certain objective restrictions on the suitability of cultivated land, but the influence of human activities on the suitability of cultivated land was not analyzed. In future research, more restriction factors, such as human activities and land use policies, should be incorporated to further enhance the accuracy and reliability of the model predictions and provide a more scientific rationale for the rational layout of agriculture.

5. Conclusions

In this study, the MaxEnt model was used to evaluate the suitability of cultivated land (paddy fields and drylands) in the LRB by combining environmental constraints such as climate, topography, soil, hydrology, and social conditions to classify suitability areas based on the probability of existence, which effectively reduced the subjective judgments made by the researchers in the selection of constraints and the assignment of weights, improving the accuracy in the classification of the suitability of areas for cultivated land. The main restrictive factors on the suitability for cultivated land in the LRB are distance to villages, soil thickness, slope, surface gravel content, distance to roads, elevation, soil pH, total phosphorus content and soil texture. The results indicate that the restriction factor with the highest contribution rate to paddy fields was the distance to villages, with a contribution rate of 32.9%; the restriction factor with the highest contribution rate to drylands was soil thickness, with a contribution rate of 31.2%. The main characteristics of this study are that it used the MaxEnt model combined with multi-dimensional environmental factors to explore the suitability of cultivated land in the LRB, providing new ideas for food security and sustainable development in the LRB and a scientific foundation for planning agricultural land use in the LRB.

Author Contributions

Conceptualization, Y.L. (Yu Lin) and M.W.; methodology, Y.L. (Yu Lin); software, Y.L. (Yu Lin), W.L. and M.W.; validation, Y.L. (Yu Lin), M.W., W.L. and X.C.; formal analysis, X.C. and W.L.; investigation, W.X. and Y.L. (Yinglan Lu); resources, W.X., W.L. and Y.L. (Yinglan Lu); data curation, Y.L. (Yu Lin), W.X., W.L. and Y.L. (Yinglan Lu); writing—original draft preparation, Y.L. (Yu Lin); writing—review and editing, Y.L. (Yu Lin), M.W., W.L. and X.C.; visualization, Y.L. (Yu Lin); supervision, M.W., W.L. and X.C.; project administration, Y.L. (Yu Lin), W.L. and X.C. All authors have read and agreed to the published version of the manuscript.

Funding

This research received no external funding.

Institutional Review Board Statement

Ethical review and approval were waived for this study by the institutional regulations under Article 32 of the “Measures for the Ethical Review of Life Science and Medical Research Involving Human Subjects in the People’s Republic of China”.

Informed Consent Statement

Informed consent for publication was obtained from all identifiable human participants.

Data Availability Statement

The data presented in this study are available in the article.

Acknowledgments

We thank all authors for their help and advice on this project. We also thank the anonymous reviewers for their helpful suggestions.

Conflicts of Interest

The authors declare no conflicts of interest.

References

  1. Wu, Z.; Fan, Q.; Li, W.; Zhou, Y. The Spatial–Temporal Evolution and Impact Mechanism of Cultivated Land Use in the Mountainous Areas of Southwest Hubei Province, China. Land 2024, 13, 1946. [Google Scholar] [CrossRef]
  2. Yu, Z.; Kuang, L.; Jiang, Y.; Li, W.; Zhang, J.; Zhou, Y.; Guo, X.; Ye, Y. Soil attributes are more important than others in shaping the diversity of cultivated land quality types, southern China. Ecol. Indic. 2024, 166, 112472. [Google Scholar] [CrossRef]
  3. Fan, Y.; Ning, W.; Liang, X.; Wang, L.; Lv, L.; Li, Y.; Wang, J. Spatial–Temporal Characteristics and Influencing Factors of Eco-Efficiency of Cultivated Land Use in the Yangtze River Delta Region. Land 2024, 13, 219. [Google Scholar] [CrossRef]
  4. Du, Z.; Gao, B.; Ou, C.; Du, Z.; Yang, J.; Batsaikhan, B.; Dorjgotov, B.; Yun, W.; Zhu, D. A Quantitative Analysis of Factors Influencing Organic Matter Concentration in the Topsoil of Black Soil in Northeast China Based on Spatial Heterogeneous Patterns. ISPRS Int. J. Geo-Inf. 2021, 10, 348. [Google Scholar] [CrossRef]
  5. Zhu, X.; Xiao, G.; Wang, S. Suitability evaluation of potential arable land in the Mediterranean region. J. Environ. Manag. 2022, 313, 115011. [Google Scholar] [CrossRef] [PubMed]
  6. Maddahi, Z.; Jalalian, A.; Zarkesh, M.K.; Honarjo, N. Land suitability analysis for rice cultivation using multi criteria evaluation approach and GIS. Eur. J. Exp. Biol. 2014, 4, 639–648. [Google Scholar]
  7. Han, C.; Chen, S.; Yu, Y.; Xu, Z.; Zhu, B.; Xu, X.; Wang, Z. Evaluation of agricultural land suitability based on RS, AHP, and MEA: A case study in Jilin Province, China. Agriculture 2021, 11, 370. [Google Scholar] [CrossRef]
  8. Samanta, S.; Pal, B.; Pal, D.K. Land suitability analysis for rice cultivation based on multi-criteria decision approach through GIS. Int. J. Sci. Emerg. Technol. 2011, 2, 12–20. [Google Scholar]
  9. Sathiyamurthi, S.; Saravanan, S.; Karuppannan, S.; Balakumbahan, R.; Sivasakthi, M.; Praveen Kumar, S.; Ramya, M.; Hussain, S.; Tariq, A. Agricultural land suitability of Manimutha Nadhi watershed using AHP and GIS techniques. Discov. Sustain. 2024, 5, 270. [Google Scholar] [CrossRef]
  10. Dutta, A.; Banerjee, M.; Ray, R. Land capability assessment of Sali watershed for agricultural suitability using a multi-criteria-based decision-making approach. Environ. Monit. Assess. 2024, 196, 237. [Google Scholar] [CrossRef]
  11. Yao, M.; Shao, D.; Lv, C.; An, R.; Gu, W.; Zhou, C. Evaluation of arable land suitability based on the suitability function—A case study of the Qinghai-Tibet Plateau. Sci. Total Environ. 2021, 787, 147414. [Google Scholar] [CrossRef]
  12. Kuang, L.; Ye, Y.; Guo, X.; Xie, W.; Zhao, X. Spatiotemporal variation of cultivated land security and its drivers: The case of Yingtan City. China. J. Resour. Ecol. 2021, 12, 280–291. [Google Scholar]
  13. Radočaj, D.; Jurišić, M. GIS-based cropland suitability prediction using machine learning: A novel approach to sustainable agricultural production. Agronomy 2022, 12, 2210. [Google Scholar] [CrossRef]
  14. Yu, X.; Tao, X.; Liao, J.; Liu, S.; Xu, L.; Yuan, S.; Zhang, Z.; Wang, F.; Deng, N.; Huang, J.; et al. Predicting potential cultivation region and paddy area for ratoon rice production in China using Maxent model. Field Crops Res. 2022, 275, 108372. [Google Scholar] [CrossRef]
  15. Fan, Y.; Wei, M.; Li, M.; Su, Z.; Liu, H. Spatio-Temporal Dynamic Impacts of Land Use/Cover Change on Eco-Environment Quality in Li River Basin, China. Sustainability 2025, 17, 1299. [Google Scholar] [CrossRef]
  16. Wang, H.; Li, Y.; Cheng, S.; Yuan, W.; Bai, X.; Ma, Y.; Yu, Z.; Yu, L.; Wang, B.; Guo, W. Analysis of changes in the ecohydrological situation and its driving forces in the Li River Basin. J. Water Clim. Change 2025, 16, 361–379. [Google Scholar] [CrossRef]
  17. Chu, Y.; Tang, X.; Zhong, X. Spatial–Temporal Variations in Water Use Efficiency and Its Influencing Factors in the Li River Basin, China. Water 2024, 16, 2864. [Google Scholar] [CrossRef]
  18. Dong, S.; Mo, Y.; Ma, J. Research progress on ecology and sustainable development of Guilin Lijiang River Basin, China, based on bibliometric analysis. Environ. Sci. Pollut. Res. 2024, 31, 6694–6722. [Google Scholar] [CrossRef]
  19. Cao, Y.; Zhang, J.; Yang, M.; Lei, X.; Guo, B.; Yang, L.; Zeng, Z.; Qu, J. Application of SWAT model with CMADS data to estimate hydrological elements and parameter uncertainty based on SUFI-2 algorithm in the Lijiang River Basin, China. Water 2018, 10, 742. [Google Scholar] [CrossRef]
  20. Phillips, S.J.; Anderson, R.P.; Schapire, R.E. Maximum entropy modeling of species geographic distributions. Ecol. Model. 2006, 190, 231–259. [Google Scholar] [CrossRef]
  21. Gan, T.; Qian, Q.; Liu, Z.; Xu, D. Simulation of Suitable Distribution Areas of Magnolia officinalis in China Based on the MaxEnt Model and Analysis of Key Environmental Variables. Agriculture 2024, 14, 2303. [Google Scholar] [CrossRef]
  22. Warren, D.L.; Seifert, S.N. Ecological niche modeling in Maxent: The importance of model complexity and the performance of model selection criteria. Ecol. Appl. 2011, 21, 335–342. [Google Scholar] [CrossRef] [PubMed]
  23. Bradie, J.; Leung, B. A quantitative synthesis of the importance of variables used in MaxEnt species distribution models. J. Biogeogr. 2017, 44, 1344–1361. [Google Scholar] [CrossRef]
  24. Campos, J.C.; Garcia, N.; Alírio, J.; Arenas-Castro, S.; Teodoro, A.C.; Sillero, N. Ecological niche models using MaxEnt in Google Earth Engine: Evaluation, guidelines and recommendations. Ecol. Inform. 2023, 76, 102147. [Google Scholar] [CrossRef]
  25. Gong, L.; Li, X.; Wu, S.; Jiang, L. Prediction of potential distribution of soybean in the frigid region in China with MaxEnt modeling. Ecol. Inform. 2022, 72, 101834. [Google Scholar] [CrossRef]
  26. Zhao, Y.; Deng, X.; Xiang, W.; Chen, L.; Ouyang, S. Predicting potential suitable habitats of Chinese fir under current and future climatic scenarios based on Maxent model. Ecol. Inform. 2021, 64, 101393. [Google Scholar] [CrossRef]
  27. Ali, S.; Umair, M.; Makanda, T.A.; Shi, S.; Hussain, S.A.; Ni, J. Modeling Current and Future Potential Land Distribution Dynamics of Wheat, Rice, and Maize under Climate Change Scenarios Using MaxEnt. Land 2024, 13, 1156. [Google Scholar] [CrossRef]
  28. Fitzgibbon, A.; Pisut, D.; Fleisher, D. Evaluation of Maximum Entropy (Maxent) machine learning model to assess relationships between climate and corn suitability. Land 2022, 11, 1382. [Google Scholar] [CrossRef]
  29. Heng, S.; Li, N.; Yang, Q.; Liang, J.; Liu, X.; Wang, Y. Effects of environment and human activities on rice planting suitability based on MaxEnt model. Int. J. Biometeorol. 2024, 68, 2413–2429. [Google Scholar] [CrossRef]
  30. Kang, Y.; Lin, F.; Yin, J.; Han, Y.; Zhu, M.; Guo, Y.; Tang, F.; Li, Y. Projected distribution patterns of Alpinia officinarum in China under future climate scenarios: Insights from optimized Maxent and Biomod2 models. Front. Plant Sci. 2025, 16, 1517060. [Google Scholar] [CrossRef]
  31. Shi, J.; Xia, M.; He, G.; Gonzalez, N.C.; Zhou, S.; Lan, K.; Ouyang, L.; Shen, X.; Jiang, X.; Cao, F.; et al. Predicting Quercus gilva distribution dynamics and its response to climate change induced by GHGs emission through MaxEnt modeling. J. Environ. Manag. 2024, 357, 120841. [Google Scholar] [CrossRef]
  32. Bai, J.; Wang, H.; Hu, Y. Prediction of Potential Suitable Distribution of Liriodendron chinense (Hemsl.) Sarg. in China Based on Future Climate Change Using the Optimized MaxEnt Model. Forests 2024, 15, 988. [Google Scholar] [CrossRef]
  33. He, Y.; Ma, J.; Chen, G. Potential geographical distribution and its multi-factor analysis of Pinus massoniana in China based on the maxent model. Ecol. Indic. 2023, 154, 110790. [Google Scholar] [CrossRef]
  34. Zhao, R.; Wang, S.; Chen, S. Predicting the potential habitat suitability of saussurea species in China under future climate scenarios using the optimized maximum entropy (maxent) model. J. Clean. Prod. 2024, 474, 143552. [Google Scholar] [CrossRef]
  35. Zhang, F.G.; Liang, F.; Wu, K.; Xie, L.; Zhao, G.; Wang, Y. The potential habitat of Angelica dahurica in China under climate change scenario predicted by Maxent model. Front. Plant Sci. 2024, 15, 1388099. [Google Scholar] [CrossRef] [PubMed]
  36. Luo, J.; Ma, Y.; Liu, Y.; Zhu, D.; Guo, X. Predicting Polygonum capitatum distribution in China across climate scenarios using MaxEnt modeling. Sci. Rep. 2024, 14, 20020. [Google Scholar] [CrossRef]
  37. Dong, J.; Bai, T.; Gao, Z.S.; Yang, S.W.; Zhang, J.L.; Wu, Y.W. Prediction of potential habitat areas of Rhododendron delavayi in China based on maximum entropy model MaxEnt. Front. For. Glob. Change 2024, 7, 1360823. [Google Scholar] [CrossRef]
  38. Liu, J.; Kuang, W.; Zhang, Z.; Xu, X.; Qin, Y.; Ning, J.; Zhou, W.; Zhang, S.; Li, R.; Yan, C.; et al. Spatiotemporal characteristics, patterns, and causes of land-use changes in China since the late 1980s. J. Geogr. Sci. 2014, 24, 195–210. [Google Scholar] [CrossRef]
  39. Li, S.; Wang, Z.; Zhu, Z.; Tao, Y.; Xiang, J. Predicting the potential suitable distribution area of Emeia pseudosauteri in Zhejiang Province based on the MaxEnt model. Sci. Rep. 2023, 13, 1806. [Google Scholar] [CrossRef]
  40. Ali, S.; Makanda, T.A.; Umair, M.; Ni, J. MaxEnt model strategies to studying current and future potential land suitability dynamics of wheat, soybean and rice cultivation under climatic change scenarios in East Asia. PLoS ONE 2023, 18, e0296182. [Google Scholar] [CrossRef]
  41. Shi, X.; Wang, J.; Zhang, L.; Chen, S.; Zhao, A.; Ning, X.; Fan, G.; Wu, N.; Zhang, L.; Wang, Z. Prediction of the potentially suitable areas of Litsea cubeba in China based on future climate change using the optimized MaxEnt model. Ecol. Indic. 2023, 148, 110093. [Google Scholar] [CrossRef]
  42. Gao, X.; Liu, J.; Huang, Z. The impact of climate change on the distribution of rare and endangered tree Firmiana kwangsiensis using the Maxent modeling. Ecol. Evol. 2022, 12, e9165. [Google Scholar] [CrossRef] [PubMed]
  43. Hou, J.; Xiang, J.; Li, D.; Liu, X. Prediction of potential suitable distribution areas of Quasipaa spinosa in China based on MaxEnt optimization model. Biology 2023, 12, 366. [Google Scholar] [CrossRef]
  44. Ji, W.; Gao, G.; Wei, J. Potential global distribution of Daktulosphaira vitifoliae under climate change based on MaxEnt. Insects 2021, 12, 347. [Google Scholar] [CrossRef]
  45. Chi, Y.; Wang, G.G.; Zhu, M.; Jin, P.; Hu, Y.; Shu, P.; Wang, Z.; Fan, A.; Qian, P.; Han, Y.; et al. Potentially suitable habitat prediction of Pinus massoniana Lamb. in China under climate change using Maxent model. Front. For. Glob. Change 2023, 6, 1144401. [Google Scholar] [CrossRef]
  46. Choudhary, K.; Boori, M.; Shi, W.; Valiev, A.; Kupriyanov, A. Agricultural land suitability assessment for sustainable development using remote sensing techniques with analytic hierarchy process. Remote Sens. Appl. Soc. Environ. 2023, 32, 101051. [Google Scholar] [CrossRef]
  47. Wotlolan, D.L.; Lowry, J.H.; Wales, N.A.; Glencross, K. Land suitability evaluation for multiple crop agroforestry planning using GIS and multi-criteria decision analysis: A case study in Fiji. Agrofor. Syst. 2021, 95, 1519–1532. [Google Scholar] [CrossRef]
  48. Tang, M.; Wang, C.; Ying, C.; Mei, S.; Tong, T.; Ma, Y.; Wang, Q. Research on Cultivated Land Quality Restriction Factors Based on Cultivated Land Quality Level Evaluation. Sustainability 2023, 15, 7567. [Google Scholar] [CrossRef]
  49. Peijun, W.; Ziqi, L.; Jing, W.; Yali, Y.; Shouguo, M. Spatiotemporal evolution patterns and driving factors of arable land in Huaihai Economic Zone, China. Front. Environ. Sci. 2023, 11, 1267475. [Google Scholar]
  50. Dong, J.; Yun, W.; Wu, K.; Li, S.; Liu, B.; Lu, Q. Spatio-Temporal Analysis of Cultivated Land from 2010 to 2020 in Long’an County, Karst Region, China. Land 2023, 12, 515. [Google Scholar] [CrossRef]
Figure 1. Study area.
Sustainability 17 05875 g001
Figure 2. The AUC values for cultivated land at different resolutions. (a) The AUC values for paddy fields at different resolutions. (b) The AUC values for drylands at different resolutions.
Sustainability 17 05875 g002
Figure 3. Distribution points of paddy fields and drylands.
Sustainability 17 05875 g003
Figure 4. Maxent model optimization for delta AICc of cultivated land. (a) Maxent model optimization for the delta AICc of paddy fields. (b) Maxent model optimization for delta AICc of drylands.
Sustainability 17 05875 g004
Figure 5. The ROC curve of cultivated land suitability. (a) The ROC curve of the paddy field. (b) The ROC curve of dryland.
Sustainability 17 05875 g005
Figure 6. Distribution of areas suitable for paddy fields.
Sustainability 17 05875 g006
Figure 8. Distribution of areas suitable for drylands.
Sustainability 17 05875 g008
Table 1. Summary table of restriction factors for cultivated land suitability evaluation.
Data TypeRestriction FactorDescriptionData Source
Climate DataAAP (mm)Average annual precipitation“National Tibetan Plateau Science Data Center”
(http://data.tpdc.ac.cn)
ASP (mm)Average summer precipitation
AWP (mm)Average winter precipitation
AAT (℃)Average annual temperature
AST (℃)Average summer temperatures
AWT (℃)Average winter temperatures
Topographic DataEle (m)Elevation“Geospatial Data Cloud”
(https://www.gscloud.cn)
Slope (°)Slope
SDirSlope direction
Soil DatapHSoil pH“National Tibetan Plateau Science Data Center”
(http://data.tpdc.ac.cn)
SOC (g/kg)Soil organic carbon content
TN (g/kg)Total nitrogen content
TP (g/kg)Total phosphorus content
TK (g/kg)Total potassium content
CEC (cmol(+)/kg)Cation exchange capacity
CF (%)Surface gravel content
Thickness (cm)Soil thickness
TexclsSoil texture
Hydrological dataDRiv (km)Distance to River“Resource Environmental Science Data Registry and Publishing System”
(http://www.resdc.cn/DOI)
GLe (m)Groundwater level
Social conditions dataDRoa (km)Distance to roads“Resource Environmental Science Data Registry and Publishing System”
(http://www.resdc.cn/DOI)
DVil (km)Distance to villages
Table 2. Restrictive factors and contribution rate.
Restriction Factor of Paddy FieldContribution Rate (%)Restriction Factor of DrylandContribution Rate (%)
DVil32.9Thickness31.2
Slope22DRoa12.8
CF18.7CF10.1
Thickness6.6Ele7.7
pH3.9pH7.6
TP3.3Texcls5.8
ASP2.8DVil5.8
AWP1.5Slope4.7
AST1.5AAP4
TK1.4AWP2
GLe1.3CEC1.9
TN1SOC1.7
CEC1DRiv1.7
DRoa0.6SDir1.2
DRiv0.6TP1
SOC0.6TN0.8
Texcls0.3
Table 3. Statistical table of the suitable area for paddy fields in each county of the Lijiang River Basin.
RegionThe High Suitable Area/km2The Medium Suitable Area/km2The Low Suitable Area/km2The Non-Suitable Area/km2
Lipu City274.68187.83471.51768.78
Yangshuo County257.67240.57509.13424.08
Gongcheng Yao Autonomous County308.34166.23249.661335.51
Lingui District554.94269.10293.131097.28
Lingchuan County300.15191.61371.791423.80
Yanshan Distric129.6049.0568.1355.35
Pingle County364.32212.22526.05758.97
Diecai Distric26.649.189.005.58
Xing’an County265.68145.17249.841600.65
Xiufeng Distric9.369.2719.256.39
Qixing Distric40.9512.338.198.01
Xiangshan Distric32.4926.3725.295.67
Yongfu County310.23151.65386.281878.39
Aggregate2875.051670.583187.259368.46
Table 4. Statistical table of the suitable area for drylands in each county of the Lijiang River basin.
RegionThe High Suitable Area/km2The Medium Suitable Area/km2The Low Suitable Area/km2The Non-Suitable Area/km2
Lipu City290.79376.38543.06492.57
Yangshuo County317.34368.28488.88256.95
Gongcheng Yao Autonomous County482.4920.56327.601044.09
Lingui District337.86353.07643.23880.29
Lingchuan County332.82316.71740.07897.75
Yanshan Distric86.6777.22109.8928.35
Pingle County703.89361.80388.35407.52
Diecai Distric14.4013.1417.015.76
Xing’an County533.88220.50585.36921.60
Xiufeng Distric11.8814.5814.942.97
Qixing Distric27.9017.1017.467.02
Xiangshan Distric26.5527.3630.155.76
Yongfu County115.8394.23630.271886.22
Aggregate3282.302260.934536.276836.85
Disclaimer/Publisher’s Note: The statements, opinions and data contained in all publications are solely those of the individual author(s) and contributor(s) and not of MDPI and/or the editor(s). MDPI and/or the editor(s) disclaim responsibility for any injury to people or property resulting from any ideas, methods, instructions or products referred to in the content.

