Abstract
Since the introduction of the Sustainable Development Goals, and, in particular, with the goal of reducing marine pollution (SDG 14.1), riverine microplastics are attracting public and scientific attention. But standardized monitoring methods and comparable data are still missing. Therefore, the opportunity was taken to test three of the most common monitoring methods (multiple depths net-method, pressurized fractionated filtration and sedimentation-box) at seven sites in five countries along the Danube and the Tisza Rivers. Different boundary conditions (hydrological and morphological conditions, economic situation, equipment available, etc.) were considered for the evaluation, as well as different sampling methods and sample pre-treatments together with different methodologies for microplastic identification. The sampling methods were evaluated for their suitability to be used as a standard monitoring tool in the future. Only net sampling and pressurized fractionated filtration allow for the determination of microplastic concentration as well as load, and can therefore be recommended. The multi-depth net device, as a labor-intensive method, is recommended if the focus of the monitoring is on larger particles and it is important to calculate particle and mass concentrations. Pressurized fractionated filtration is a practical tool recommended for routine monitoring, having the advantage of less effort being required for sample preparation and simply considering small particle sizes below 500 µm. From a scientific perspective it is recommended to combine both the pump sampling and the net-based device.
1. Introduction
Goal 14 of the Sustainable Development Goals published by the United Nations focuses on conservation and the sustainable use of oceans, seas and marine resources for sustainable development. Accordingly, an indicator was also formulated that specifically targets a reduction in (micro)plastic pollution. An evaluation of the achievement of the targets set requires corresponding comparable measurements. As plastic is mainly discharged into the oceans from rivers, the monitoring of rivers with regard to microplastic pollution has a special role to play. Over the last decade there has been growing scientific and research interest in microplastics (MPs) focused on their abundance, sources, distribution, biological interactions and their ubiquitous nature and potential hazardous impacts [1,2,3,4,5,6]. Microplastics include a variety of polymer types (e.g., polyethylene, polypropylene, polyvinyl chloride, polyurethanes, polyethylene terephthalate, polystyrene and polyester) and shapes (fragments, pellets and fibers) originating from all kinds of sources [7,8,9,10,11]. There are hundreds of commercially available plastic materials. MPs act as a source and sink for different hazardous compounds, such as persistent organic pollutants, plastic additives, antibiotics and heavy metals and have a harmful effect on water ecosystems and influence the environmental fate of these pollutants [7,12,13,14,15,16].
Although rivers are the primary entry route for MPs from terrestrial into marine ecosystems, the number of studies on rivers and lakes has only begun to increase recently [17,18,19,20,21]. The proposed methods for the sampling, extraction, quantification and determination of MPs in rivers are often time-consuming and require a high labor force, specific techniques and expensive analytical instruments [21]. When determining the levels of MPs in rivers, three factors can significantly influence the result. According to [21], these include factors determined by the shape of the river, its morphology and the meteorological situation. These can change over time. In addition, the hydrological conditions of the water body (currents, water density, wind, waves and tides) significantly determine the movement of microplastics in the water [22]. The second relevant conditions are sampling equipment and methodologies since they influence the size and type of particles that will be detected. The differences in the sampling methodologies make particle types and abundances largely incomparable between studies [23,24]. The selection of sampling methodology is a highly complex phase that influences the quality and uncertainty of the results [21]. Sampling methods have a significant influence on the result with regard to the measured microplastic concentration. It has been shown that a sufficient sample volume is essential to reduce random errors in the results [25].
MP identification methods are the third factor that has to be considered. Many of the MP identification methods reported rely on visual identification due to its inexpensive and relatively rapid implementation. These methods lead to quantitative rather than qualitative results and are still based on a visual count, which is a time-consuming and error-prone task due to the subjectivity of the operator [26,27,28,29,30,31]. Ref. [26] introduced and validated a semi-automatic innovative image processing tool for quantifying and measuring MPs but still highlight the need for improvements in the identification of the type of plastic. Usually, however, a distinction can be made between highly automated variants with mostly high investment costs and more manual variants with lower investment costs but higher labor inputs. The preparation of the samples for further analysis is also a factor that should not be neglected.
Although ISO standards for the analysis of microplastics in the environment (ISO 24187:23) [32] and guidance on sampling microplastics in water (ISO 5667-27:2025) [33] now exist, and those for the analysis of microplastics in water are in the drafting stage, the long period without standard sampling, sample preparation and measurements protocols for different riverine waters presents a major challenge [24,29,34] for comparing different studies. Additionally, currently too little attention is paid to the fact that the sampling method is a relevant influencing factor with regard to choosing an adequate analytical method.
According to [21], few studies and reviews have been published on methodologies concerning the quantification and characterization of MPs in freshwater environments [2,35,36,37]. The overall objective of several of these studies was to introduce practical guidelines for the precise scientific analysis of MPs in riverine systems. The specific parameters of the methods (particle size limits, density separation media and particle identification criteria) differ between studies in terms of the volume of sample studied, upper and lower particle size limits, density separation media used and particle identification criteria [29,38]. The application of non-standard measurement units for reporting MP concentration levels presents the other issue related to the comparison of results from different studies. These obstacles highlight the need for continuous efforts to standardize methods for MP sampling, extraction and quantification.
Within the Interreg Danube Transnational Programme project Tid(y)Up, three existing and previously applied sampling methods, the multiple depths net method [39], pressurized fractionated filtration [36,40,41] and sedimentation box (Joint Danube survey (JDS)), were tested together with different methodologies for MP identification under varying boundary conditions (different river types and extents of pollution) in order to gain comprehensive knowledge on the practicability of the selected methods [22]. The results of these measurements, which were carried out in different countries under the respective local conditions, can be used in the future to better understand and compare the results of MP pollution monitoring.
In contrast to one-time measurements carried out for research purposes, long-term monitoring requires the possibility of easy and affordable implementation in all participating countries. In order to determine changes and the effects of measures, it is not only necessary to determine the composition and number of microplastics in the water, but also to evaluate the respective microplastic load. For this reason, for the evaluation of the tested methods the focus was placed on ensuring the reliability and accuracy of results and the practicality, cost-efficiency and user-friendliness of the sampling and analytical methods as well as easy field application of the tested devices and the usability of the derived results [22]. The main objective of this paper is to present information on which methods/types are the most useful for riverine systems, under certain conditions including feasibility and cost criteria.
2. Materials and Methods
To ensure an appropriate comparison, three methods (multiple depths net method, pressurized fractionated filtration and sedimentation box) were applied at the same sampling locations at the same time along the Danube River in harmony with previous transnational monitoring spots from the Joint Danube Survey 4 [42]. Together with the different sampling methods, different methods for sample preparation and the identification of microplastics were taken into account.
2.1. Sampling Methodologies
2.1.1. Multi-Depth Net Method
A relatively new method for measuring microplastic transport at different depths was developed in [39] and is suitable for medium-to-large sized rivers. Unlike conventional net measurement methods such as the Manta trawl, it allows the distribution of microplastics to be measured across the entire depth profile of a river. Initial applications in the Austrian Danube showed that the concentration of microplastics varies greatly within a river cross-section. This heterogeneity can be explained by factors such as turbulent currents, different polymer densities, aggregation effects and biofilm formation. It is therefore not sufficient to limit oneself to samples from the surface zone—similar to suspended sediments, the entire water column must be taken into account. Multi-point measurements are therefore necessary to obtain a realistic picture of the spatial distribution and to be able to reliably calculate transport. Investigations into filtration efficiency and the use of different net meshes showed that mesh sizes of 500 μm delivered the best results [39] because the risk of clogging is lower and sufficiently large quantities of water can be sampled.
Therefore, simultaneous net sampling at three different depths in the water column (surface, middle and bottom of the river) with mesh sizes of 250 µm and 500 µm was performed within this study [22]. The inlet openings of the nets were 60 × 60 cm, and the sampling was possible either with double frames using different mesh sizes or with a single frame. The frames are equipped with a long fin to ensure smooth positioning in the water and have an adjustable rack at the front to account for various rope inclinations depending on flow conditions, so that the frames always stand upright in the water. Each frame is equipped with a mechanical impeller in the center of the nets, to calculate the filtered water volume. Additionally, Acoustic Doppler Current Profiler (ADCP) measurements are necessary to measure the flow velocity distribution and the discharge within the sampled cross-section. These additional measurements enable the determination of plastic transport in the cross-section and, in the case of repetitive measurements at different hydrological conditions, the calculation of yields. After cleaning the nets, the collection containers at the end of the net can be easily emptied [39].
2.1.2. Pressurized Fractionated Filtration
Pump-driven, fractionated filter systems are becoming increasingly important alongside the different types of nets that are still mainly used [36,40].
Such a system was developed in [41]. Due to its compact design, it is suitable for sampling from smaller boats as well as directly from the shore. The method is based on a jet pump powered by a generator [22]. Surface water is sucked in via a foot valve with a 1 mm coarse prefilter and fed through rubber hoses to a stainless steel filter system [22]. Filtration takes place in stages through three consecutive 10” filter cartridges with mesh sizes from 300 µm over 100 µm to 50 µm. During sampling, fractional filtration is carried out in situ, processing a water volume of 1 to 2 m3 depending on the suspended solids content. The microplastic particles are mainly collected on the stainless steel filters with the finest mesh size (50 µm). As the system is additionally equipped with a 1 mm pre-filter, the particles in the size range between 50 µm and 1 mm are captured. The total volume of water filtered is precisely determined using an integrated flow meter. The method was described previously in [41]. After sampling, filters and filter cartridges are washed with MP-free (filtered on glass fiber filter) water and collected in beakers in the laboratory.
To ensure comparability with the multi-layer net method, samples were taken at three positions along the selected river cross-section, each at three different depths. A methodological innovation was to place the suction valve directly in front of the net frame. This enabled simultaneous sampling at the same position, which improved the comparability of the different measurement methods. In addition, a surface sample was taken across the entire cross-section at each sampling location.
2.1.3. Sedimentation Box
Within the Joint Danube Survey 4 (JDS4) (ICPDR, 2020), which is an important transnational monitoring network tool, MPs were measured using a sedimentation box. For the first time a baseline of MP pollution was established by analyzing a total 22 samples by means of thermal extraction desorption–gas chromatography/mass spectrometry (TED-GC/MS) in 2019 [42]. The sedimentation box is based on the physical principle of flow deceleration for particle separation: flowing, suspended particulate matter (SPM)-laden river water is passed through a multi-chambered structure in which the flow velocity is reduced, enabling sedimentary separation of the particles. This passive sampler is positioned at a depth of approx. 60 cm below the water surface over a period of about two weeks.
The front of the box has six inlet openings, each with a diameter of 1 cm, through which the water enters the three successive chamber segments. After flowing through all six chambers, the water leaves the unit via four outlet openings at the rear of the stainless steel container. After removing the sedimentation box from the water, all openings are sealed to be airtight and watertight using silicone plugs to prevent loss of the settled particles. Samples are then taken manually: the deposited sediments are transferred to suitable sample containers using a scoop. Deposits adhering to the bottom surface are loosened by adding water from inside the box and also placed in the sample containers.
For the present study, the sedimentation box was used for a period of around two weeks in the surface area close to the river. It was installed in the direction of flow using stainless steel cables, chains or, if necessary, a fixed stainless steel structure [22]. The installation is preferably carried out at a dynamic attachment point (e.g., buoy or pontoon) to ensure a constant immersion depth of 50 cm below the water surface [22]. For optimum functionality and comparability of the results, a flow velocity in the range of 0.5 to 1.0 m/s is recommended.
2.2. Site Specific Parameter Selection
The study area covered large sections of the Danube from the upper river basin in Austria to the estuary area in Bulgaria. The testing of methodologies and sampling took place at several locations along the Danube between Vienna and Tutrakan near Bucharest as well as on one of the main tributaries of the Tisza River.
The Danube River Basin (DRB) covers the territories of 19 countries and after the Volga has the second largest river basin in Europe covering an area of 803,260 km2 [43]. Additionally, the Tisza River Basin extends over 157,186 km. The primary objective of the sampling campaign was to compare the presented sampling methods under varying specific local conditions like discharge, flow velocity, water depths, varying degrees of pollution, etc. [22]. Sampling sites on different streams and kilometers along the river were therefore chosen following the sites already used during the Joint Danube Survey 4 (JDS4) in 2019 [42] to build on previous results [22] (Figure 1).
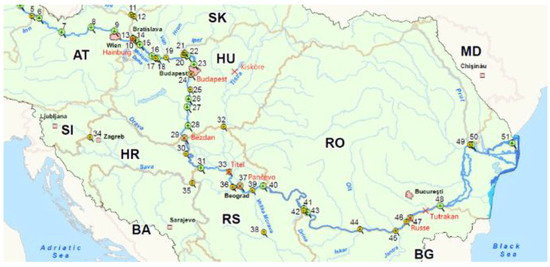
Figure 1.
Sampling locations Red marks indicate the areas examined. Numbers show locations from JDS4). Map Source: ICPDR—Joint Danube Survey 4|https://www.danubesurvey.org/jds4 accessed on 10 June 2025.
Simultaneous measurements with the methods being tested were performed from March to July 2021 in the Danube River in Hainburg (AT), Budapest (HU), Bezdan (RS), Pancevo (RS), Ruse (RO/BG), Tutrakan (RO/BG) as well as in the Tisza River (Hungarian stretch) and close to the estuary (Titel, RS) [22] (Figure 1).
According to previous studies [44], the content of MPs and their concentrations in flowing waters can vary significantly depending on the hydraulic boundary conditions (e.g., flow velocity, turbulence or discharge), the morphological setting (e.g., water depth and positioning in the cross-section of the river including the influences of hydraulic structures such as groynes) but also the type of plastic particles (e.g., density). To consider the spatial distribution of MPs as well as the depth variance, net-sampling and sampling with a pump was performed at three vertical positions over the river cross-section and at three depths. An additional integrative sample was taken with the pump at the water surface over the cross profile. Furthermore, a sedimentation box was only used for sampling close to the river bank at a water depth of approximately 50 cm, as a fixed attachment outside the navigation channel (Figure 2).
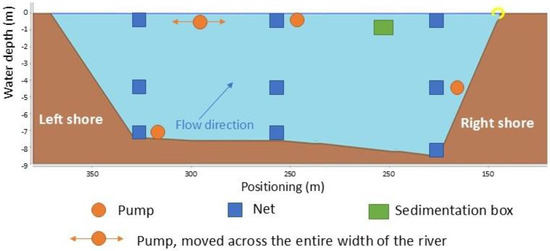
Figure 2.
Sketch of MP sampling strategy for representative sampling over water depth and river cross-section.
To address the varying boundary conditions at the different study sites (including changes in accessibility, discharge, flow velocities, cross-sectional width, etc.) and the specific circumstances in the different countries (material and personnel costs), factors influencing the monitoring were determined for the seven selected sampling sites in the countries Austria, Hungary, Romania, Serbia and Bulgaria. The following sire-specific parameters were evaluated for each methodology: sampling requirements, necessary official approvals (e.g., for bridge sampling), practicability/handling, duration of preparation, measurement and cleaning, costs. At the sampling methodology level, necessary skills, captured particle size range, representative sampling over the water column, and representative sampling over the river cross-section, as well as the sampled water volume per sample (m3), were assessed.
2.3. Sample Preparation and Analysis
The aim of sample preparation is to effectively isolate microplastic particles for subsequent identification and analysis. Depending on the sampling location and method, the composition of the samples varied considerably in terms of sample volume, particle size distribution and the proportion of organic and inorganic substances accompanying the plastics. Wetting samples in particular included a high proportion of organic material, which made preparation even more difficult. Due to the lack of a standardized protocol for sample preparation, various processing steps were tested in a variable sequence with the aim of separating microplastic particles as selectively as possible for subsequent polymer analysis.
The main challenge in processing net samples from flowing waters is that microplastic particles are always collected together with a complex mixture of organic and inorganic material. The subsequent quantitative and qualitative analyses (e.g., polymer identification, particle counting, weight determination) therefore require these matrix components to be removed as completely as possible without altering or damaging the microplastic particles themselves.
While inorganic components can usually be reliably removed by density separation or sedimentation due to their higher density, the removal of organic substances is more complex. Coarse organic material such as leaves or twigs must be separated by hand, while finer organic material is decomposed using oxidation processes (e.g., hydrogen peroxide) or enzymatic digestion. As chemical or biological processing steps can potentially lead to fragmentation or chemical alteration of microplastic particles, recovery rates were also examined in order to quantify possible losses or adulterations during sample processing.
MP research represents a relatively new field and there is a lack of comprehensive QA/QC protocols (especially because of the lack of certified reference materials), which are needed to improve the accuracy of results and allow comparisons between MP studies [45]. In order to minimize procedural MP contamination and to ensure that generated data is reliable, QA measures were considered during sampling, sample pre-treatment and analysis. While carrying out laboratory work, the risk of secondary contamination was minimized through the use of glass or metal sample containers, which were covered with lids or aluminum foil. Cotton laboratory coats were also provided during laboratory work.
2.3.1. Procedure for Collecting Net Samples
Particularly in the case of net samples, it is necessary to remove unwanted organic and inorganic components that are filtered out of the water together with the microplastics. Due to the large sample volume and heterogeneity of the sample, the isolation of MPs prior to analysis is challenging. The isolation of MPs was therefore performed for a size fraction of 500–5000 µm only. After sampling, the samples had a high-water content, which was first removed by sieving using a 50 µm sieve. Afterwards macro by-catches (leaves, branches, etc.) were removed and rinsed off to prevent to prevent adhering MPs from being overlooked. For the removal of organic and inorganic by-catches, the following pre-treatment steps were performed: (i) Fenton reaction, (ii) enzymatic treatment, and (iii) density separation. Depending on the composition of the sample (share of inorganic and organic by-catches), these steps can be repeated or carried out in a different order.
The possible processing and analysis methods change with the size of the particles. While visual and manual separation steps are still feasible for particles larger than 1000 µm, more complex physical and chemical processes are required for smaller particle sizes. On the other hand, measuring larger particles > 1000 µm is often not possible with FTIR microscopes which measure the transmission or absorption of IR radiation by the sample. If the samples are too thick, total absorption occurs and the spectra are difficult or impossible to analyze. For these analytical reasons, the pre-treated sample was divided into a 1000–5000 µm fraction and a 500–1000 µm fraction.
The fraction > 1000 µm was picked out by hand under the microscope and measured by means of Attenuated Total Reflection (ATR)–FTIR spectroscopy (BRUKER Alpha—Bruker Optic GmbH, Ettlingen, Germany). which is a contact-based method investigating the surfaces of samples and is independent from microplastic thickness. Plastic type determination was performed through a comparison with available databases and our own spectra (e.g., for non-common polymers, identified with microscope (i.e., chewing gum)).
Two different methodological approaches were compared to evaluate the fraction in the 500–1000 µm range in order to determine whether more cost-efficient methods also lead to reliable results. On the one hand, a labor-intensive variant using cheap equipment was tested used a method similar to the methodology used for the fraction above 1000 µm, including “particle picking” under the microscope and the determination of the plastic types using the cheaper and easy-to-operate ATR-FTIR spectrometer (BRUKER Alpha) (subsequently referred to as “manual method”). Here, spectra could not be obtained for most fibers; therefore, fibers were only counted using a stereomicroscope (OLYMPUS SZX12).
The other part of the samples was analyzed using a powerful but cost-intensive Fourier transform infrared (FT-IR) microscope (BRUKER LUMOS II IMG, Bruker Optic GmbH, Ettlingen, Germany). The previously prepared samples were first mixed with deionized water and then filtered using vacuum filtration on anodisc filters (Whatman, Maidstone, UK, Ø 25 mm, pore size 0.2 µm). These filters served as a carrier material for the microplastic particles during the measurement. In the following, both these measurements with the FT-IR microscope and the associated pre-treatment steps are referred to as the “automated method”.
In addition to the analysis technology, the software used also plays a central role in microplastic detection. Due to the limited performance of conventional spectrum libraries and manual comparison procedures, a special machine learning solution (Purency) was used for spectrum evaluation in the automated method. Instead of analyzing individual spectra separately, the algorithm processes the complete FT-IR image simultaneously. This intelligent image evaluation leads to a considerably faster, and at the same time more reliable, identification of microplastic particles.
The procedure carried out for reducing by-catches was optimized for effective enrichment and isolation of microplastics for subsequent analysis. On average, the dry weight of samples was reduced by up to between 94% and 99% in the case of the net samples and thus the removal of unwanted by-catches can be described as very effective. The reliability of the analysis results was confirmed by crosschecking and evaluation of results of different sampling and laboratory procedures methods. The greatest potential for error was suspected in the manual MP isolation with tweezers. Even if the sample has been well pre-treated and only comparatively few impurities are present, there is a risk that plastics will be overlooked under the microscope or mistaken for natural substances. A high recovery efficiency is crucial for the reliable estimation of pollution. To assess the recovery rates after the sample preparation procedures, net subsamples were spiked with MPs [46]. For the spike material, a red polyethylene (PE) and a blue polypropylene (PP) lid were crushed with a mill. Further, a green PP film was fragmented with a weighing knife. To obtain certain particle size fractions, wet sieving was performed. MPs were added in two runs. In run 1, particles with a size of 1000–5000 µm were examined; in run 2 particles with a size of 500–1000 µm were examined. A total of 451 of 458 reference particles were recovered in run 1. The recovery rate was thus 98.47%. The recovery rate of PE was 99.34%, and that of PP was 96.75%. In run 2 for the smaller fraction, a total of 377 of 460 reference particles was recovered. The recovery rate was thus 81.96%. The recovery rate of PE was 84.59%, and that of PP was 76.77%.
2.3.2. Procedure for Fractionated Filtration Samples
The samples from the fractionated pressure filtration system are characterized by a smaller volume and a more homogeneous composition, which is due to the smaller volume of water extracted and the pre-filtration with a 1 mm filter. Compared to the net samples, their preparation is therefore much simpler. The selected sampling technique immediately results in a laboratory sample in the particle size range of 50–1000 µm.
For further sample concentration, the water sample volume was first reduced by filtration in the laboratory. This was followed by density separation using a zinc chloride solution (density: 1.6 g/cm3) using an SVGS device (small volume glass separator, see [47]). The content of organic material was reduced by oxidation with 30% hydrogen peroxide. Finally, the sample was filtered using aluminum oxide filters (Ø 25 mm, pore size 0.2 µm), which served as a support material for the subsequent FT-IR microscopy.
The analysis was carried out using a Thermo Nicolet iN10 MX FTIR microscope (Thermo Fisher Scientific, Unicam Kft, Budapest, Hungary).
In transmission mode. The entire filter area was recorded with a spatial resolution of 25 µm per pixel. The spectral data obtained was compared with the reference spectral library of the platform https://simple-plastics.eu/ (accessed on 20 May 2023). Particles with a spectral match of more than 80% were classified as microplastics. The minimum detectable particle size was 50 µm.
2.3.3. Procedure for Sedimentation Box Samples
The by-catch in the sedimentation box is predominantly inorganic and <1 cm. Due to this predominance of inorganic by-catches, the removal of the inorganics took place before the removal of the organics. The samples (ca. 50 L) from the sedimentation box were filtered through 50 µm sieves and the resulting material was separated in the Micro Plastic Sediment Separator (MPSS hydrobios.de, Altenholz, Germany) using a 1.3 g·cm−3 CaCl2 solution. After this procedure, oxidation in 30% H2O2 was performed for separated samples followed by filtration and analysis similar to the fractionated filtration samples.
3. Results
3.1. Comparison of Sampling Procedures
The sampling methods were evaluated regarding their suitability to be used as a standard monitoring methodology for medium and large rivers in the future. Important aspects such as practicability or costs have been assessed differently in the participating countries, as the boundary conditions vary. Table 1 shows a summary of the advantages and disadvantages of the methods for the entire Danube region based on the country- and location-specific assessments. For a better visualization of the results, photos are provided in the Supplementary Materials.

Table 1.
Comparison of sampling methods (- rather negative; o moderate; + positive).
The net method is the most complex in terms of handling during sampling, at least for the net size chosen in this case (60 × 60 cm). High flow velocities or turbulence can quickly lead to challenging sampling conditions. In principle, however, the device is robust and can be used even at high flow velocities, and has already been used in [39] during a hundred-year flood (discharge: 5700 m3 s−1; flow velocities around 3 m3 s−1). However, the load capacity and strength of the crane and, depending on the situation, the boat or truck used are crucial for adequate measurement capabilities. The current design is optimized for medium and large rivers and therefore higher water depths and sampling is therefore only possible with a minimal water depth of about 2–3 m, but there are also adaptations for the device for small and shallow rivers.
When using the device with a crane, the maximum measurement depth depends on the height of the crane. However, after adaptations and using a winch, the nets can be directly attached to the cable during the lowering process enabling deep measurement depths only restricted by the cable length. Both the sedimentation box and fractionated filtration can be used with less effort than the heavy and large nets. The sedimentation box also has its limitations since it can mostly only be deployed close to the river shore (outside the shipping channel), below the water surface and where supporting bodies (e.g., buoys) are available. Installment in the middle of the river is only possible in some cases, if permits are granted, but then the measurements are also expensive due to rental fees for ships, etc. For flow velocities above 1.5 m/s, the sampling efficiency may be decreased due to disturbance. For standardized sampling, a flow velocity in the range of 0.5 to 1.0 m/s is recommended to ensure comparable results. Of the methods tested, fractionated pressure filtration has proven to be particularly practicable, clean and effective for microplastic sampling. Compared to net-based methods, the organizational and technical effort is significantly lower. The handling of the device is user-friendly: the filter units can be installed quickly and the pump can be put into operation without major effort. However, addressing near-bed sampling and samples over the whole water column is only possible if the hose is attached to a lowering device.
The measurement time for fractional pressure filtration is around 30 to 40 min, which is slightly longer than for net-based sampling (20 to 25 min). However, the preparation time for net samples is longer, as the set-up is more complex and the net must be thoroughly cleaned after each round of sampling due to the high sample volume. There is also a risk of unintentional loss of microplastic particles when transferring the net samples into sample containers. Sampling using a pump, on the other hand, can be carried out after a short preparation time. The filter units can be replaced easily by closing the used filters and replacing them with new ones. However, the running costs for the filter materials must be taken into account.
The sedimentation box requires the most time overall, as it remains in the water for a longer period of time—typically two weeks. However, continuous monitoring of the measurement is not necessary. It is only necessary to visit the sampling site at the beginning and end of the deployment. The time required for the installation and removal of the box depends on the location but is mostly low, but collection might be challenging due to the weight (40–50 kg) of the water in the box.
Cost is one of the aspects of evaluation that is adapted to the respective economic situation as well as labor and material costs and varies the most between the bordering countries. The underlying varying number of working hours and sampling requirements (e.g., fees for shipping inspectorate or truck rental, required permissions, etc.) cause differences depending on the specific local conditions of the various countries and specific sampling locations between the sampling methods. The most expensive (investment and operation) method is multi-depth net sampling, which can only be carried out from bigger ships or bridges and may require, for example, road closures, fees for trucks, fees for the shipping inspectorate, etc. At least two people are needed to operate the net. The crane must be operated and when sampling from the bridge, the ship traffic must also be kept under consideration, so in extreme cases five people are working at the same time. For sampling with the use of pressurized fractionated filtration, usually two people should be sufficient, and the same is true for the sedimentation box. Additionally, sampling requirements for smaller ships for fractionated filtration sampling are not so numerous and only a few requirements have to be met for sedimentation-box sampling. Also, regarding the costs, it must be mentioned that, when aiming to also address near-bed and multiple-depth measurements with the fractionated filtration methodology, adequate costs have to be taken into account as a lowering device is needed. The resulting costs may therefore vary to a large extent between the measurement methods.
Net sampling incurs the highest costs in comparison to the other methods. The reasons for this include high personnel costs and associated expenses, as well as additional costs for permits and, in some cases, higher costs for a larger and more stable boat or additional costs for a crane and truck. Sampling cost for the pump sampling varies from medium to high costs depending on whether it is used for multi-point sampling or not. In most of the countries, rental fees for boats and extra costs for shipping inspectorate must be considered. In terms of costs and requirements the sedimentation box proved to be the best option.
One potential disadvantage of multi-depth measurement methods is the need for official permits, especially when carrying out measurements using cranes from bridges or from stable ships, particularly in waters with shipping traffic. In Austria, for example, the use of a bridge for measurement purposes leads the closure of the affected lane. This requires approval from the relevant district administrative authority. In addition, the shipping inspectorate must be notified of the measurement activity, as it is responsible for ensuring the safety of shipping traffic. Due to the smaller equipment, sampling with pressurized fractionated filtration is also possible from small boats especially if only focusing on surface sampling. It is much easier to obtain permits for sampling with more maneuverable boats (for pump measurement) or even outside the shipping channel at already existing floating bodies (for the sedimentation box).
Due to the complexity of the net measurement (positioning of the crane on the ship or bridge, correct configuration of the nets and especially flow velocity and discharge measurement, etc.) and the enormous forces acting on the large nets, sampling with the multi-depth net device is the most demanding method in terms of the necessary skills requiring experience and knowledge that is not necessary for measurements with pump or a sedimentation box.
The captured particle size range is of course dependent on the selected mesh sizes. The ones used within the study have proven to be the most favorable for the respective method and range as follows: (i) >(250 µm) 500 µm for net samples, (ii) 50–1000 µm for pressurized fractionated filtration and (iii) <10,000 µm for sedimentation box samples. Sampling with 250 µm nets is also possible depending on the prevailing boundary conditions (e.g., suspended sediments and organic matter). Within the study, the 500 µm nets were chosen for further analysis, limiting the results to this size fraction. In general, too small mesh sizes lead to rapid clogging of the net which leads to a size limitation for small MPs. Due to the 1 mm pre-filter on the intake of the pump, larger MP particles are excluded when using the pump method. However, modifications for a larger prefilter would theoretically be possible. For the sedimentation box, it must be taken into account that there is no outflow filter and particles with buoyancy or particles of the same weight can simply pass through
The high infiltrating water volume in net sampling in a short time (~2000 m3 per net within approx. 35 min) allows for a comparatively high sample volume, which is a clear advantage in terms of representativeness. Integrated flow measurements allow for the calculation of the plastic transport (number of particles or mass × m−3) in the river. Depending on the concentration of suspended solids and the installed filter sizes, the sample volume for pressurized fractionated filtration is around 1 to 2 m3 within a period of 30 to 40 min. The actual sample volume can be precisely recorded using an integrated flow meter. In contrast to the two other sampling techniques, where the sample volume can be calculated, it is not possible to quantify the “filtered” discharge flowing through the sedimentation box, as there are no corresponding measuring devices such as flow meters or water meters.
In terms of the representativeness of the sampling, both the multi-depth net method and the pump technique provide more reliable results than the sedimentation box. In principle, the net method allows for sampling at any point in the river cross-section as well as mixed samples of the surface layer across the entire width. Simultaneous sampling at several depths or with different mesh sizes at the same depth is also possible. Simultaneous sampling at different depths in the same vertical section is important for proper calculation of microplastic transport as it takes spatial heterogeneity into account.
Pump sampling can be used flexibly at almost any point in the river and enables targeted recording of the depth distribution as well as the lateral distribution across the cross-section. In combination with a lowering device (e.g., net holder), multi-dimensional sampling can be carried out. However, sequential multi-point sampling is time-consuming—it takes about three times as long as parallel net sampling, unless several pumps are operated simultaneously.
The sedimentation box is installed over a longer period of time (typically two weeks) near the water surface and away from the navigation channel. This method only enables the qualitative detection of microplastics at a single point in the river cross-section. As there is no defined filter mesh, floating or buoyant particles on the water surface can pass through the system unhindered. The method is therefore limited to a simple, qualitative assessment of near-surface microplastics with specific density properties.
3.2. Comparison of Sample Preparation and Analysis
The advantages and disadvantages of the different partly interdependent sampling and analysis procedures used are considered below. Sample preparation in particular should not be neglected as a cost driver due to the high amount of work involved. The following evaluations of the three sampling methods and the two different lab-procedures performed within this study are listed in Table 2: (i) “automated” measurement with FTIR-microscope and subsequent analysis vs. (ii) “manual” method (particle picking under the stereomicroscope, manual measurement of each MP with simple ATR-FTIR-spectrometer and plastic type determination based on spectra libraries).
Table 2.
Comparison of sample preparation and analysis (- rather negative, o moderate, + positive).
The three sampling methods refer to different particle size ranges. While net samples (with 500 µm mesh size) have the disadvantage that even if smaller particles are caught, particles < 500 µm cannot be related to the sampled water volume, because they are smaller than the mesh size, pressurized fractionated filtration does not normally cover MPs > 1000 µm to avoid clogging the small mesh filters. The sedimentation box captures particles < 1 cm.
The nature of the sample has a decisive influence on the necessary sample preparation steps in the laboratory. Mesh samples pose a comparatively high challenge due to their inhomogeneous composition and their usually large sample mass. Excluding larger MPs and having less by-catch (due to the lower water volume sampled), as is possible with the pump and with the box, results in more homogeneous samples, from which MPs can be more easily extracted for further analysis.
The time required for sample preparation is closely linked to both the composition of the sample and the chosen analytical method, which in turn affect the overall duration of microplastic (MP) measurement. While FTIR microscope analyses are performed automatically, measurements using a conventional FTIR-ATR spectrometer necessitate the manual placement of each individual particle onto the measurement cell. Although FTIR microscope measurements are also time intensive, they can proceed unattended once initiated, reducing the need for continuous operator involvement.
All of the methods discussed involve considerable costs for both sample preparation and analysis. The combination of net sampling with a “manual” laboratory workflow results in higher personnel costs, as it requires significant manual effort during both preparation and measurement. However, this approach avoids expenses related to high-end instrumentation and consumables, such as anodisc filters.
In contrast, the “automated” laboratory workflow eliminates the need for manual isolation of each MP particle, as the FTIR microscope can analyze the entire filter area automatically. Despite its operational efficiency, this method entails significantly higher investment costs due to the specialized equipment and software required. In comparison, the “manual” method—although labor-intensive—relies on more accessible instrumentation, where each particle must be individually identified and positioned for ATR-FTIR analysis.
3.3. Comparison of Achieved Data
The microplastics detected with all different methods were counted and assigned to size classes and plastic types. For MPs in the 1000–5000 µm fraction, masses were also recorded. MP particle concentrations were calculated as mean values for each sampling point and are shown for the multiple-depth net and the pressurized fractionated filtration only (Figure 3).
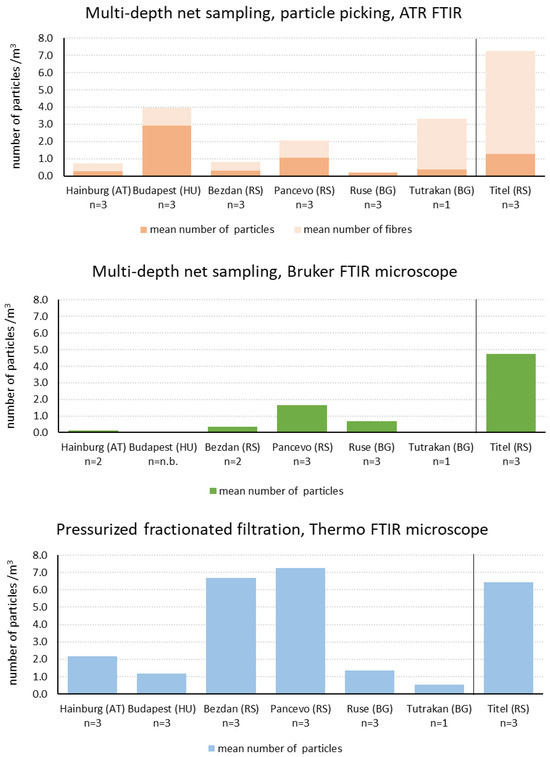
Figure 3.
Comparative representation of the MP particle concentration (number of particles per m3) detected depending on different sampling and analysis methods in the size fraction 500–1000 µm. Samples from the Danube on the left of the line, samples from the Tisza on the right of the line.
Due to the different particle size fractions, a direct comparison of the detected MP particle concentrations is shown for MPs in the size fraction 500–1000 µm (Figure 3) only. No statistically significant differences were observed between the two net-based analysis methods with respect to the number of microplastic particles detected. However, samples collected using pressurized fractionated filtration and subsequently processed and analyzed according to the described protocol yielded higher microplastic concentrations compared to those obtained via net sampling.
Regarding the compared methods, the presence of MP particles along the Danube was detected to be comparable for simultaneously taken samples. Except in Bezdan and Pancevo, significantly more particles were found with the pump method.
Due to the reasons explained above, no concentrations can be calculated for the sedimentation box samples. However, a comparison of plastic type distribution is possible for all three methodologies as depicted for the Hainburg location in Figure 4.
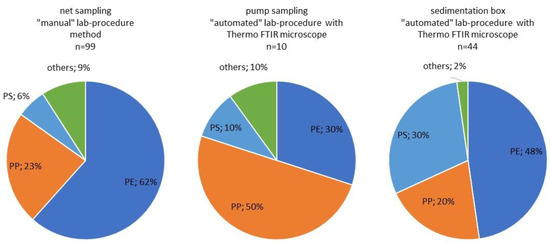
Figure 4.
Comparative representation of plastic type distribution depending on different sampling and analysis methods in Hainburg (the different counts (n) are also due to the different sizes of the subsample).
While the different methods come to similar results in terms of particle concentration, there are remarkable discrepancies in the determination of the plastic types. Particles in the size fraction 500–1000 µm from the sampling site in Hainburg considerably vary in terms of the MP type distribution. While the share of PP was relatively equal for the net-sampling and sedimentation box variants (23% and 20%, respectively), the proportion in the sample taken with pressurized fractionated filtration was around 50%. Since the analysis for both the pump method and sedimentation box variants was carried out with the Thermo Nicolet iN10 MX FTIR microscope, the different plastic type compositions are not attributable to the methodology used for particle identification but can only be due to the sampling. The measurement duration (average composition over 14 days with the sedimentation box compared with the plastic type composition at the date of pump sampling) could also be responsible for the differences. PS was found in the same order of magnitude using net sampling (6%) and the pump method (10%); for the sedimentation box, a higher PS share (30%) was detected. Further investigations into the plastic type compositions detected using the tested methods are therefore recommended.
The particle size ranges in the results depend both on the sampling and analysis method as well as on the specific demands placed on the results (Table 3). While net sampling enables a simple and relatively fast analysis exclusively for the quantification of microplastic concentrations in larger size fractions (>250/500 µm), fractionated pressure filtration extends the detection range to smaller particle sizes. The identification of polymer types is also possible for very small particles using FTIR microscopy. However, the analysis of fibers and particles smaller than 500 µm using ATR-FTIR spectroscopy often does not provide spectra of sufficient quality for reliable polymer identification.
Table 3.
Comparison of results of different sampling and preparation methods (- rather negative; o moderate; + positive; n.a. not analyzable).
Pressurized fractionated filtration enables the detection of particles smaller than 250 µm down to a lower size limit of about 50 µm—a crucial capability considering that this size fraction can account for up to two thirds of the total particle count. However, from a mass-based perspective, larger particles contribute disproportionately to the overall microplastic flux.
Although net sampling can also retain particles smaller than the nominal mesh size, these cannot be quantitatively related to the sampled water volume, as an unknown proportion of smaller particles may pass through the net. The sedimentation box generally captures all particle sizes smaller than 1 cm; however, the results cannot be related to the sampled water volume and the unknown share of low-density particles is not captured by the device.
For the three methodologies tested, the number of MPs can be evaluated and their sizes and shapes can also be determined. The concentration of particles can only be measured with the net and the pump methods. Mass concentration can only be measured using the net method. The weights of individual MPs, and therefore also the evaluation of the MP particle concentration in g·m−3, can only be determined without additional effort when using ATR- FTIR spectrometer for the analyses. Here, each particle is selected individually by hand anyway. In principle, larger particles can also be isolated and weighed after FTIR microscope measurements. However, this requires considerable additional effort. The weights of MPs > 1000 µm resulting from net samples were determined in this project.
The detection of plastic types is possible with all of the tested combinations of sampling and analysis methodologies. While the subjectivity of the examiner can influence the results, for the automated analysis, one has to be aware that the determination of the results is always only as good as the software behind it.
4. Discussion
In the recent literature, there are numerous review publications describing monitoring techniques for sampling and preparing samples for detecting MPs in water [5,21,36,48,49,50,51]. Still, there are a limited number of comprehensive experimental studies simultaneously conducting sampling in several countries and comparing sampling and sample processing techniques depending on many factors focusing on practicability and feasibility for long-term monitoring. When selecting the sampling method, it is essential to take the respective framework conditions as well as the focus of the intended study into account. Each of the methods has certain advantages and disadvantages that should be weighed up in the context of the particular problem and boundary conditions. The disadvantage of higher costs for sampling and preparation using the net methodology can be offset, for example, by the advantages of larger sample quantities and the associated higher representativeness of the results.
The comparison showed that the particle concentration can be determined by both the pump and net sampling methods. The determination of particle masses—single particle or composite masses—as a basis for measuring mass concentration, calculating the amount of MP transport in a cross-section and (when performing multiple measurements over the discharge spectrum) calculating transport yields (e.g., monthly, annual, event based, etc.) can only be undertaken with the net methodology. In principle, net sampling is a proven method in freshwater and marine waters [2,29,52], but smaller particles in particular cannot be captured because smaller mesh sizes cause the nets to become clogged too quickly. In a direct comparison of the three methods, sampling using a multi-depth net device proved to be the most complex and time consuming method. This applies both to the necessary framework conditions (permits and crane hire) and to handling, such as the time-consuming cleaning of the nets. The preparation of the net samples for the laboratory analysis is also difficult due to the large amount of unwanted organic and inorganic contamination in the samples. Numerous treatment steps are necessary in the laboratory to reduce this unwanted by-catch as much as possible. However, since river samples present heterogenic mixtures, large sample volumes might be required in order to ensure representative samples for statistically robust data. Also, ref. [25] mentions the importance of ensuring a representative sampling volume to measure sufficient particles in one sample. Moreover, the net method applied enables simultaneous sampling at different depths, as well as sampling with two different net diameters at the same depth.
The pressurized fractionated filtration sampling method was shown to be moderately complex compared to the net sampling. The only essential requirements for pump sampling are a power source and a vessel, especially if only applied near the surface. No special prior knowledge is required, and sampling at different depths over the whole water column (if mounted to a lowering device like the net sampling device) and at various vertical sections across the river cross-section is possible. By moving the pump from one bank to the other it is possible to provide integrative sampling across the river cross section. Due to the prefilter, the amount of unwanted by-catch is very low and there is no need to remove leaf debris or other macro particles prior to analyses. This enables the collection of very small particles, which cannot be captured using the net method due to net clogging when using smaller mesh sizes. According to the literature, significantly more microplastic particles are present in smaller size ranges [53]. The small sample quantity and the resulting homogeneous sample composition lead to comparably low preparation and measurement efforts in the laboratory. Therefore, apart from the investment costs, the measurement costs are also moderate. But one has to consider the much higher investment costs for the corresponding analysis devices. Depending on the prefilter selected, particles exceeding a certain size (in this case 1000 µm) are excluded from the analysis. In addition, particles adhering to larger structures cannot pass through the filter and are therefore also not taken into account. This limits the representativeness of the sample regarding the determination of MP transport and yields as for these parameters the larger particles are of higher importance. With a water volume of 1–2 m3 the representativeness of pump sampling is lower than that of net sampling.
The sedimentation box is by far the easiest method to use and requires no special prior knowledge for sampling. This makes it a practical and, above all, economical monitoring instrument. According to [42] the application of sedimentation box has two major advantages: the collection of large quantities of suspended particulate matter and a wide range of particle sizes that can be collected (from larger than 1000 μm down to smaller than 5 μm). A prerequisite for the simple use of the sedimentation box is the presence of a stable, floating object to which the box can be attached. Overall, this method is the least accurate, as many parameters cannot be recorded well due to the simple design. However, the long measurement period (over two weeks) is a major advantage. However, since only a small area of the river cross-section can be sampled, and only near the surface, no conclusions can be drawn about the degree of pollution in the entire river. Especially for the time-integrated, long-term sampling of MP, sedimentation boxes are promising devices [54]. The effort required to prepare the samples taken with sedimentation boxes is moderate. The costs are correspondingly low. However, the plastic particles detected cannot be linked to the discharge, so it is not possible to determine concentrations and loads. The sedimentation box is therefore primarily suitable as a qualitative assessment tool. Furthermore, it has to be considered that low-density particles are likely to pass through the box and are therefore underrepresented. A comparison of sampling locations or sampling periods, especially focusing on the analysis of the plastic type composition, is nevertheless possible and useful.
The laboratory determination of microplastic (MP) particles is significantly influenced by the pre-treatment steps applied during sample preparation. These procedures can lead to particle loss, missed detections or secondary contamination. Furthermore, porous plastics may be physically fragmented during processing, potentially resulting in an overestimation of particle numbers. As a consequence, variations in preparation protocols and analytical techniques can affect data quality and the interpretability of results, thereby limiting the comparability of MP studies conducted in river environments.
Sample preparation is often more complex and time-intensive than the actual measurement of particles. The key challenge lies in effectively isolating all plastic particles from a mixture of organic and inorganic materials without altering or damaging the microplastics themselves. In riverine samples, the typically low abundance of microplastics combined with a highly heterogeneous matrix makes sample processing particularly demanding compared to more homogeneous environmental media.
With regard to sample preparation and analysis, pressurized fractionated filtration is recommended as the more practical approach for long-term monitoring programs, particularly when simultaneous sampling across multiple sites in different countries with varying logistical conditions is required. This method also enables the detection of particles smaller than 250 µm—a crucial advantage given that this size fraction can represent up to two-thirds of the total particle count. However, its effectiveness depends on the availability of suitable laboratory infrastructure for the automated identification of such small particles. In cases where this equipment is not accessible and manual isolation using tweezers becomes necessary, the net-based sampling approach may offer more practical advantages.
5. Conclusions
With regard to life below water, sustainability means reducing microplastic pollution in rivers and ensuring the long-term health of water bodies. This requires the prevention of microplastics, a reduction in inputs into rivers and the development of technologies to remove existing microplastics. In future, standardized, practicable methods can help to reduce the effort involved, e.g., in transnational monitoring.
Comparing the three sampling methods, including sample preparation and the analysis procedure, it can be concluded that each method has its advantages and disadvantages depending on the boundary conditions and the focus of the intended study. It is essential that sampling and analysis are directly related to each other and that considerations about the choice of method always include both.
- (1)
- The sedimentation box provides a methodology giving initial insights, allowing for cheap and quick studies concentrating on MP quality.
- (2)
- Sampling with pressurized fractionated filtration has advantages regarding practicability, costs and handling, addressing the smallest MP particles and the subsequent preparation of samples and their analysis. It can therefore be recommended for studies addressing the smallest MP share and the particle number.
- (3)
- With the net-based device it is possible to address both the MP particle and mass concentration. As it can be applied at various verticals and in multiple points over the whole water column, spatial variability is taken into account and therefore MP transport can be determined. When performing repeated measurements covering the discharge spectrum, rating curves can be established, creating a basis for MP yield calculations.
From a scientific perspective it is recommended to combine both the pump sampling and the net-based device. The advantages of those methods complement each other perfectly to gain deep insights into the transport of MPs in rivers. Time consumption and costs do not vary considerably compared to using one single method, as the pump can be used simultaneously with the net-based device. Hence, both ranges (the smallest particles and the bigger particles) can be addressed and a high water volume can be sampled for representativeness. Furthermore, a combined approach offers the opportunity to focus on different aspects during analysis (mass, particle number, type of plastic, etc.) and to choose the most adequate and applicable analysis method.
By using those methods in a more standardized way, microplastic pollution in rivers can be recorded more precisely and comparably. This enables a better understanding of the distribution, origin and transport routes of microplastics, early identification of hotspots and targeted measures to reduce the input of MPs into aquatic ecosystems and will contribute to more sustainable development in waters from the rivers to the oceans.
Supplementary Materials
The following supporting information can be downloaded at: https://www.mdpi.com/article/10.3390/su17135836/s1, Pictures from sampling and sample preparation.
Author Contributions
Conceptualization, G.O.; methodology, G.O., G.B. and M.L.; validation, G.O., M.L., S.L. and G.O.; investigation, G.B., S.L., J.M., R.O. and S.P.; writing—original draft preparation, S.L., M.P., G.O. and M.L.; writing—review and editing, G.O. and D.U.; visualization, S.L.; project administration, G.O.; funding acquisition, G.O. All authors have read and agreed to the published version of the manuscript.
Funding
This research was funded by European Union funds (ERDF, IPA, ENI) within Interreg Danube Transnational Programme with the financial contribution of partner states and institutions.
Institutional Review Board Statement
Not applicable.
Informed Consent Statement
Not applicable.
Data Availability Statement
Dataset available on request from the authors.
Conflicts of Interest
The authors declare no conflict of interest.
References
- Waller, C.L.; Griffiths, H.J.; Waluda, C.M.; Thorpe, S.E.; Loaiza, I.; Moreno, B.; Pacherres, C.O.; Hughes, K.A. Microplastics in the Antarctic marine system: An emerging area of research. Sci. Total Environ. 2017, 598, 220–227. [Google Scholar] [CrossRef]
- Li, J.Y.; Liu, H.H.; Chen, J.P. Microplastics in freshwater systems: A review on occurrence, environmental effects, and methods for microplastics detection. Water Res. 2018, 137, 362–374. [Google Scholar] [CrossRef] [PubMed]
- Barboza, L.G.A.; Vethaak, A.D.; Lavorante, B.R.B.O.; Lundebye, A.K.; Guilhermino, L. Marine microplastic debris: An emerging issue for food security, food safety and human health. Mar. Pollut. Bull. 2018, 133, 336–348. [Google Scholar] [CrossRef] [PubMed]
- Xiao, S.; Cui, Y.; Brahney, J.; Mahowald, N.M.; Li, Q. Long-distance atmospheric transport of microplastic fibres influenced by their shapes. Nat. Geosci. 2023, 16, 863–870. [Google Scholar] [CrossRef]
- Liu, M.T.; Song, Y.; Lu, S.B.; Qiu, R.; Hu, J.N.; Li, X.Y.; Bigalke, M.; Shi, H.H.; He, D.F. A method for extracting soil microplastics through circulation of sodium bromide solutions. Sci. Total Environ. 2019, 691, 341–347. [Google Scholar] [CrossRef]
- Wong, J.K.H.; Lee, K.K.; Tang, K.H.D.; Yap, P.S. Microplastics in the freshwater and terrestrial environments: Prevalence, fates, impacts and sustainable solutions. Sci. Total Environ. 2020, 719, 137512. [Google Scholar] [CrossRef]
- Yu, J.; Adingo, S.; Liu, X.; Li, X.; Sun, J.; Zhang, X. Micro plastics in soil ecosystem—A review of sources, fate, and ecological impact. Plant Soil Environ. 2022, 68, 1–17. [Google Scholar] [CrossRef]
- Wainkwa, C.h.R.; Lee, J.Y.; Kim, H.; Jang, J. Microplastic pollution in soil and groundwater: A review. Environ. Chem. Lett. 2021, 19, 4211–4224. [Google Scholar]
- Tian, L.; Jinjin, C.; Ji, R.; Ma, Y.; Yu, X. Microplastics in agricultural soils: Sources, effects, and their fate. Curr. Opin. Environ. Sci. Health 2022, 25, 100311. [Google Scholar] [CrossRef]
- Evode, N.; Qamar, S.A.; Bilala, M.; Barceló, D.; Iqbal, H. Plastic waste and its management strategies for environmental sustainability. Case Stud. Chem. Environ. Eng. 2021, 4, 100142. [Google Scholar] [CrossRef]
- Plastics Europe. Plastics-the Facts 2018. An Analysis of European Plastics Production, Demand and Waste Data. 2018. Available online: https://plasticseurope.org/wp-content/uploads/2021/10/2018-Plastics-the-facts.pdf (accessed on 18 August 2020).
- Pathak, A.; Singh, L.K. Chapter 14-Impact of microplastics and nanoplastics interactions with other contaminants in environment. In Current Developments in Biotechnology and Bioengineering; Elsevier: Amsterdam, The Netherlands, 2023; pp. 333–359. [Google Scholar]
- Narevski, A.; Novaković, M.; Petrović, M.; Mihajlović, I.; Maoduš, N.; Vujić, G. Occurrence of bisphenol A and microplastics in landfill leachate: Lessons from South East Europe. Environ. Sci. Pollut. Res. 2021, 28, 42196–42203. [Google Scholar] [CrossRef] [PubMed]
- Afrin, S.; Uddin, M.K.; Rahman, M.M. Microplastics contamination in the soil from urban landfill site, Dhaka, Bangladesh. Heliyon 2020, 6, e05572. [Google Scholar] [CrossRef]
- Su, Y.; Zhang, Z.; Wu, D.; Zhan, L.; Shi, H.; Xie, B. Occurrence of microplastics in landfill systems and their fate with landfill age. Water Res. 2019, 164, 1–9. [Google Scholar] [CrossRef] [PubMed]
- Chaudhry, A.K.; Sachdeva, P. Microplastics’ origin, distribution, and rising hazard to aquatic organisms and human health: Socio-economic insinuations and management solutions. Reg. Stud. Mar. Sci. 2021, 48, 102018. [Google Scholar] [CrossRef]
- Lechner, A.; Keckeis, H.; Lumesberger-Loisl, F.; Zens, B.; Krusch, R.; Tritthart, M.; Glas, M.; Schludermann, E. The Danube so colourful: A potpourri of plastic litter outnumbers fish larvae in Europe’s second largest river. Environ. Pollut. 2014, 188, 177–181. [Google Scholar] [CrossRef]
- Lebreton, L.C.M.; van der Zwet, J.; Damsteeg, J.-W.; Slat, B.; Andrady, A.; Reisser, J. River plastic emissions to the world’s oceans. Nat. Commun. 2017, 8, 15611. [Google Scholar] [CrossRef] [PubMed]
- Siegfried, M.; Koelmans, A.A.; Besseling, E.; Kroeze, C. Export of microplastics from land to sea. A modelling approach. Water Res. 2017, 127, 249–257. [Google Scholar] [CrossRef]
- Mani, T.; Burkhardt-Holm, P. Seasonal microplastics variation in nival and pluvial stretches of the Rhine River—From the Swiss catchment towards the North Sea. Sci. Total Environ. 2020, 707, 135579. [Google Scholar] [CrossRef]
- Campanale, C.; Savino, I.; Pojar, I.; Massarelli, C.; Uricchio, V.F. A Practical Overview of Methodologies for Sampling and Analysis of Microplastics in Riverine Environments. Sustainability 2020, 12, 6755. [Google Scholar] [CrossRef]
- Lenz, S.; Mayerhofer, J.; Obersteiner, G. Study on Assessment of Microplastic Measurements Under Different Conditions in Fluvial Systems. Project Report Interreg DTP Tid(y)Up. Available online: https://www.interreg-danube.eu/uploads/media/approved_project_output/0001/56/fc78aec3f977dfe372db93ed0423f2bc559955cf.pdf (accessed on 13 June 2025).
- Dris, R.; Imhof, H.; Sanchez, W.; Gasperi, J.; Galgani, F.; Tassin, B.; Laforsch, C. Beyond the ocean: Contamination of freshwater ecosystems with (micro-) plastic particles. Environ. Chem. 2015, 12, 539–550. [Google Scholar] [CrossRef]
- Horton, A.A.; Walton, A.; Spurgeon, D.J.; Lahive, E.; Svendsen, C. Microplastics in Freshwater and Terrestrial Environments: Evaluating the Current Understanding to Identify the Knowledge Gaps and Future Research Priorities. Sci. Total Environ. 2017, 586, 127–141. [Google Scholar] [CrossRef] [PubMed]
- Cross, R.K.; Roberts, S.; Jürgens, M.; Johnson, A.; Davis, C.; Gouin, T. Ensuring representative sample volume predictions in microplastic monitoring. Microplast. Nanoplast. 2025, 5, 5. [Google Scholar] [CrossRef]
- Giardino, M.; Balestra, V.; Janner, D.; Bellopede, R. Automated method for routine microplastic detection and quantification. Sci. Total Environ. 2023, 859, 160036. [Google Scholar] [CrossRef] [PubMed]
- Balestra, V.; Bellopede, R. Microplastic pollution in show cave sediments: First evidence and detection technique. Environ. Pollut. 2022, 292, 118261. [Google Scholar] [CrossRef]
- Cannas, S.; Fastelli, P.; Guerranti, C.; Renzi, M. Plastic litter in sediments from the coasts of south Tuscany (Tyrrhenian Sea). Mar. Pollut. Bull. 2017, 119, 372–375. [Google Scholar] [CrossRef]
- Hidalgo-Ruz, V.; Gutow, L.; Thompson, R.C.; Thiel, M. Microplastics in the marine environment: A review of the methods used for identification and quantification. Environ. Sci. Technol. 2012, 46, 3060–3075. [Google Scholar] [CrossRef]
- Mathalon, A.; Hill, P. Microplastic fibers in the intertidal ecosystem surrounding Halifax Harbor, Nova Scotia. Mar. Pollut. Bull. 2014, 81, 69–79. [Google Scholar] [CrossRef]
- Crawford, C.B.; Quinn, B. Microplastic Pollutants; Elsevier: Amsterdam, The Netherlands, 2016. [Google Scholar]
- International Organization for Standardization. ISO 24187:2023 Principles for the Analysis of Microplastics Present in the Environment, 1st ed.; International Organization for Standardization: Geneva, Switzerland, 2023; p. 21. [Google Scholar]
- International Organization for Standardization. ISO 5667-27:2025 Water Quality—Sampling, Part 27: Guidance on Sampling for Microplastics in Water, 1st ed.; International Organization for Standardization: Geneva, Switzerland, 2025. [Google Scholar]
- Syberg, K.; Khan, F.R.; Selck, H.; Palmqvist, A.; Banta, G.T.; Daley, J.; Sano, L.; Duhaime, M.B. Microplastics: Addressing ecological risk through lessons learned. Environ. Toxicol. Chem. 2015, 34, 945–953. [Google Scholar] [CrossRef] [PubMed]
- Eerkes-Medrano, D.; Thompson, R.C.; Aldridge, D.C. Microplastics in freshwater systems: A review of the emerging threats, identification of knowledge gaps and prioritisation of research needs. Water Res. 2015, 75, 63–82. [Google Scholar] [CrossRef]
- Stock, F.; Kochleus, C.; Bänsch-Baltruschat, B.; Brennholt, N.; Reifferscheid, G. Sampling techniques and preparation methods for microplastic analyses in the aquatic environment—A review. TrAC Trend Anal. Chem. 2019, 113, 84–92. [Google Scholar] [CrossRef]
- González-Fernández, D.; Hanke, G.; Tweehuysen, G.; Bellert, B.; Holzhauer, M.; Palatinus, A.; Hohenblum, P.; Oosterbaan, L. Riverine Litter Monitoring-Options and Recommendations; MSFD GES TG Marine Litter Thematic Report; JRC Technical Report; Joint Research Centre (JRC): Luxembourg, 2016. [Google Scholar]
- Besley, A.; Vijver, M.G.; Behrens, P.; Bosker, T. A standardized method for sampling and extraction methods for quantifying microplastics in beach sand. Mar. Pollut. Bull. 2017, 114, 77–83. [Google Scholar] [CrossRef] [PubMed]
- Liedermann, M.; Gmeiner, P.; Pessenlehner, S.; Haimann, M.; Hohenblum, P.; Habersack, H. A Methodology for Measuring Microplastic Transport in Large or Medium Rivers. Water 2018, 10, 414. [Google Scholar] [CrossRef]
- Prata, J.C.; da Costa, J.P.; Duarte, A.C.; Rocha-Santos, T. Methods for sampling and detection of microplastics in water and sediment: A critical review. TrAC Trends Anal. Chem. 2019, 110, 150–159. [Google Scholar] [CrossRef]
- Bordós, G.; Gergely, S.; Háhn, J.; Palotai, Z.; Szabó, É.; Besenyő, G.; Salgó, A.; Harkai, P.; Kriszt, B.; Szoboszlay, S. Validation of pressurized fractionated filtration microplastic sampling in controlled test environment. Water Res. 2021, 189, 116572. [Google Scholar] [CrossRef]
- Kittner, M.; Kerndorff, A.; Ricking, A.; Bednarz, M.; Obermaier, N.; Lukas, M.; Asenova, M.; Bordós, G.; Eisentraut, P.; Hohenblum Ph Hudcova, H.; et al. Microplastics in the Danube River Basin: A First Comprehensive Screening with a Harmonized Analaytical Approach. ACS ES&T Water 2022, 2, 1174–1181. [Google Scholar]
- ICPDR 2021. “The Danube River Basin—Facts and Figures.” Downloaded in February 2023. Available online: https://www.icpdr.org/main/danube-basin-facts-and-figures-brochure (accessed on 25 July 2024).
- UBA. Mikroplastik in der Umwelt; Umweltbundesamt: Vienna, Austria, 2015. [Google Scholar]
- Adomat, Y.; Grischek, T. Sampling and processing methods of microplastics in river sediments—A review. Sci. Total Environ. 2021, 758, 143691. [Google Scholar] [CrossRef]
- Berghammer, J. Mikroplastik in Flussproben-Qualitätssicherung und Qualitätskontrolle im Zuge der Probenaufbereitung und -Analytik; Institut für Abfall- und Kreislaufwirtschaft, Universität für Bodenkultur Wien: Wien, Austria, 2022. [Google Scholar]
- Mári, Á.; Bordós, G.; Gergely Sz Büki, M.; Háhn, J.; Palotai, Z.; Besenyő, G.; Szabó, É.; Salgó, A.; Kriszt, B.; Szoboszlay, S. Validation of microplastic sample preparation method for freshwater samples. Water Res. 2021, 202, 117409. [Google Scholar] [CrossRef]
- Brandner, S.M.; Renick, V.; Foley, M.M.; Steele, C.; Woo, M.; Lusher, A.; Carr, S.; Helm, P.; Box, C.; Cherniak, S.; et al. Sampling and quality assurance and quality control: A guide for scientists investigating the occurence of microplastics across matrices. Appl. Spectrosc. 2020, 74, 1099–1125. [Google Scholar] [CrossRef]
- Costa, M.F.; da Costa, P.J.; Duarte, A.C. Sampling of micro(nano)plastics in environmental compartments: How to define standard procedures. Environ. Sci. Health 2018, 1, 36–40. [Google Scholar] [CrossRef]
- van Emmerik, T.; Schwarz, A. Plastic debris in rivers. WIREs Water 2020, 7, e1398. [Google Scholar] [CrossRef]
- Fok, L.; Lam, T.W.L.; Li, H.-X.; Xu, X.-R. A meta-analysis of methodologies adopted by microplastic studies in China. Sci. Total Environ. 2020, 718, 135371. [Google Scholar] [CrossRef] [PubMed]
- Miller, M.E.; Kroon, F.J.; Motti, C.A. Recovering microplastics from marine samples: A review of current practices. Mar. Pollut. Bull. 2017, 123, 6–18. [Google Scholar] [CrossRef] [PubMed]
- Razeghi, N.; Hossein Hamidian, A.; Wu, C.; Zhang, Y.; Yang, M. Microplastic sampling techniques in freshwaters and sediments: A review. Environ. Chem. Lett. 2021, 19, 4225–4252. [Google Scholar] [CrossRef]
- Saravia, C.J.; Ricking, M.; Grathwohl, P.; Bannick, C.G.; Obermaier, N. SurfaceWater Monitoring with Sedimentation Boxes: Assessing the Sampling Performance and Its Effect on Microplastic Concentration. Water 2025, 17, 1152. [Google Scholar] [CrossRef]
Disclaimer/Publisher’s Note: The statements, opinions and data contained in all publications are solely those of the individual author(s) and contributor(s) and not of MDPI and/or the editor(s). MDPI and/or the editor(s) disclaim responsibility for any injury to people or property resulting from any ideas, methods, instructions or products referred to in the content. |
© 2025 by the authors. Licensee MDPI, Basel, Switzerland. This article is an open access article distributed under the terms and conditions of the Creative Commons Attribution (CC BY) license (https://creativecommons.org/licenses/by/4.0/).