1. Introduction
The growing impacts of global climate change and environmental degradation have elevated the achievement of the Sustainable Development Goals to a top priority for all countries. In this context, mitigating environmental impacts in resource-intensive sectors and decoupling economic growth from environmental pressures have become critical objectives. The agricultural sector, while crucial for economic development and food security, also presents significant environmental challenges. Among the most pressing of these, particularly in the context of climate change and resource scarcity, are energy consumption and greenhouse gas (GHG) emissions [
1].
The European Union’s 2020 Green Deal and the accompanying “Farm to Fork” strategy provide a comprehensive policy framework that prioritizes sustainability in agricultural production. This strategy, encompassing goals such as improving resource use efficiency and reducing GHG emissions, renders both environmental and economic efficiency imperative in the agricultural sector [
2].
In this regard, the concept of eco-efficiency—defined as the simultaneous measurement of economic value creation and environmental impact—has gained prominence.
Huppes and Ishikawa [
3] define eco-efficiency as an operational indicator of sustainable development, while Mickwitz et al. [
4] emphasize that it should be understood as the economic value generated per unit of environmental burden. This approach offers policymakers objective tools for performance evaluation [
5].
Data Envelopment Analysis (DEA), as one of the most widely used methods for measuring eco-efficiency, is favored for its ability to simultaneously analyze multiple inputs and outputs [
6,
7]. This method allows for the inclusion of undesirable outputs (e.g., GHG emissions) in the model, enabling a more comprehensive assessment of the environmental impacts of agricultural production [
8,
9].
In agriculture-focused studies, Chien and Hu [
10] demonstrated that the use of renewable energy enhances technical efficiency. Vlontzos et al. [
11] revealed that agricultural subsidy regimes in EU countries have a significant impact on environmental and energy efficiency. Wysokińskiski et al. [
12] found a positive relationship between socioeconomic development and agricultural eco-efficiency. Ezici et al. [
9] emphasized the importance of energy diversification for improving eco-efficiency in the U.S. manufacturing sector. Similarly, Baležentis et al. [
7] analyzed energy efficiency using an SBM-DEA model that accounts for greenhouse gas emissions on Lithuanian dairy farms.
However, most of the existing studies in this field tend to focus on a single country (e.g., China, the United States), a specific product (e.g., milk, rice), or a particular technology [
7,
8,
10,
13]. Consequently, there is a limited body of research that conducts international cross-country comparative assessments of the agricultural sector [
11,
12,
14]. Moreover, few studies model the impacts of new-generation agricultural policies—such as the EU Green Deal and the Farm to Fork strategy—on agricultural environmental performance, despite these policies aiming to optimize resource use in production processes and link subsidies to environmental outcomes [
15,
16].
This gap restricts comprehensive and sector-specific analyses of agricultural eco-efficiency and complicates the assessment of interactions among variables such as energy consumption, labor use, and environmental pressures within the context of agricultural production. Addressing this gap, the present study conducts a comprehensive comparison of the eco-efficiency levels of 26 European Union countries and Türkiye over the 2003–2022 period. This is achieved by utilizing agriculture-specific inputs—compensation of employees (COE), energy consumption (EC), and gross fixed capital formation (GFC)—and outputs—agricultural GDP and GHG emissions (GGEs). All indicators are normalized by agricultural land area to eliminate scale-related comparability issues between countries. Furthermore, the study’s long-term scope and broad geographical coverage help overcome the common limitations of the narrow temporal and spatial coverage seen in the previous literature [
8,
11,
17,
18].
The primary objective of this study is to conduct a macro-level comparative analysis of the eco-efficiency levels in the agricultural sectors of the European Union (EU) member states and Türkiye over the period 2003–2022. Rather than evaluating individual farm performances, this research treats each country as a decision-making unit (DMU) to assess how national-level production structures and policy frameworks collectively influence eco-efficiency. Accordingly, this study seeks to answer the following research question: “Do agricultural eco-efficiency levels among EU member states and Türkiye exhibit both spatial (cross-country) and temporal (year-to-year) variation, and what macro-level patterns emerge from these differences?” In this context, this study’s main contribution is a normalized, agriculture-specific comparative framework that reveals performance disparities and benchmarks at the national scale. This sectoral focus distinguishes it from more general macroeconomic analyses [
19], while its integration of economic and environmental outputs over an extended period provides a longitudinal perspective. The findings are intended not to prescribe specific policies but to offer a diagnostic overview that can inform higher-level policy discussions and highlight areas for further, more detailed investigation.
It is crucial to acknowledge the methodological scope of this study from the outset. The Data Envelopment Analysis (DEA) employed here measures relative technical efficiency and does not establish direct causal relationships between specific policies and performance outcomes. Therefore, the policy discussions presented in this paper should not be interpreted as direct outputs of the model. Instead, they are complementary interpretations derived from the findings, viewed through the lens of the existing literature and the structural differences between countries. While DEA provides a valuable tool for benchmarking national-level eco-efficiency, it does not capture within-country structural heterogeneity, such as average farm sizes or tenure systems, which limits the depth of policy recommendations. Any policy or technology transfer must be adapted to the unique agricultural structure, production systems, and socioeconomic context of each nation.
By jointly evaluating agriculture-specific economic and environmental variables, this study aims to contribute to a better understanding of how environmental transition policies—such as the EU Green Deal—impact the agricultural sector. This transformation process has gained momentum particularly through the EU’s Farm to Fork strategy and the post-2023 reforms of the Common Agricultural Policy (CAP). These policy frameworks adopt multidimensional goals, such as building sustainable food systems, reducing carbon emissions, and improving energy efficiency, thereby seeking to construct a new paradigm for agriculture [
2]. The findings of this research are expected to support the development of policy recommendations aimed at enhancing sustainability and resource efficiency, to inform the restructuring of resource allocation strategies, and to provide an objective basis for evaluation among policymakers.
2. Materials and Methods
In this study, DEA was implemented using an input-oriented Variable Returns to Scale (VRS) model to evaluate the eco-efficiency of countries in the agricultural sector over the past two decades, covering the period from 2003 to 2022. Initially, the analysis aimed to encompass 27 European Union (EU) member states and Türkiye. However, Cyprus and Malta were excluded due to missing data, resulting in a final analysis covering 26 countries.
While DEA is frequently applied at the firm or micro-level, this study intentionally adopts an aggregate-level approach, treating countries as DMUs. This macro-level perspective is well-established in the literature for evaluating the performance of public policies and overall sectoral efficiencies, particularly when the aim is to assess national-level outcomes rather than individual firm performances [
11,
20,
21,
22]. The primary objective here is not to measure the efficiency of individual farms but to develop a diagnostic tool that benchmarks the aggregate performance of national agricultural sectors under their respective policy and structural frameworks [
23]. It is explicitly acknowledged that this level of aggregation obscures significant intra-country heterogeneity, such as farm size distributions or production systems. Therefore, the findings are not intended to inform farm-level decision making but to provide a comparative overview for higher-level policy discussions. This sectoral focus distinguishes this study from more general macroeconomic analyses [
19], and any interpretations of the results must be made with caution.
The number of DMUs (26 countries) in relation to the number of input and output variables (three inputs, two outputs) adheres to established DEA guidelines to ensure the discriminatory power of the model [
24].
For this study, an input-oriented Data Envelopment Analysis (DEA) approach was adopted to measure the eco-efficiency. This orientation was chosen because policymakers generally have more direct control over adjusting input levels (such as energy use, labor, and capital investment) than manipulating aggregate outputs like national agricultural GDPs or sector-wide GHG emissions. The model also accounts for both desirable and undesirable outputs.
The selection of variables for this study was a deliberate process aimed at capturing the fundamental trade-off at the heart of agricultural eco-efficiency: economic value generation versus resource consumption and environmental pressure. The chosen inputs—compensation of employees (COE), energy consumption (EC), and gross fixed capital formation (GFC)—represent the three core production factors of labor, energy, and capital at a macro-level, consistent with standard applications in efficiency analysis [
10,
11,
17]. The outputs—agricultural gross domestic product (GDP) and greenhouse gas emissions (GGEs)—were selected to represent the primary desirable economic outcome and the most critical undesirable environmental externality targeted by major policies like the EU’s Green Deal. While other environmental indicators are important, GHG emissions and energy use are arguably the most central to the current sustainability debate in agriculture. This parsimonious set of variables was chosen not only for its alignment with the established literature [
6,
7,
17] but also to maintain the model’s discriminatory power and ensure robust comparability across countries, based on the availability of reliable and harmonized data. Detailed definitions are presented below and in
Table 1.
Compensation of Employees (COE): This variable covers payments made to labor employed in the agricultural sector, including salaries, wages, and social contributions. As the monetary expression of the labor input, it reflects the labor intensity of the sector. Labor is a fundamental pillar of agricultural production and plays a central role in analyses of productivity and socioeconomic sustainability [
25]. The inclusion of COE adds a significant dimension to the eco-efficiency analysis by highlighting the social aspect of agricultural activities and its role in rural development. Labor has been widely recognized as one of the key production factors influencing efficiency in many studies [
7,
11,
12].
Energy Consumption (EC): This variable refers to the total amount of fossil fuel energy consumed in agricultural activities. It is particularly important for indicating the environmental pressure of production systems reliant on fossil fuels. Energy is an integral part of modern agriculture, and its use directly affects both production costs and the environmental footprint [
26]. The consumption of fossil fuels, in particular, is considered a critical indicator in eco-efficiency and sustainability assessments due to its significant contribution to greenhouse gas emissions and concerns over energy security [
27]. Therefore, this variable is a fundamental element for evaluating the impact of agricultural production on climate change and its resource efficiency. EC has frequently been used in the literature as a major production factor affecting efficiency; its relationship with environmental outputs has also been extensively studied [
7,
10,
11,
12,
18].
Gross Fixed Capital Formation (GFC): This variable represents investments made in the agricultural sector. Considered an indicator of capital input, it reflects the sector’s production capacity and technological infrastructure. The inclusion of GFC in the analysis is particularly significant, as investments in climate-friendly technologies and efficiency-enhancing infrastructure are crucial for the transition to sustainable and resilient food systems [
28]. GFC has been identified in numerous studies as a fundamental production factor affecting efficiency [
7,
8,
10,
11].
Gross Domestic Product (GDP): This variable indicates the economic value generated from agricultural activities. Representing the sector’s economic output, it is a widely accepted indicator for measuring the “economic value creation” aspect of eco-efficiency [
29]. This output signifies the agricultural sector’s contribution to the national economy, rural livelihoods, and food supply. Evaluating it alongside the environmental performance is therefore an essential component of sustainable development [
30]. The GDP has generally been used as a desirable output in efficiency analyses [
8,
12,
17].
Greenhouse Gas Emissions (GGEs): This variable reflects the total emissions of greenhouse gases such as carbon dioxide (CO
2), methane (CH
4), and nitrous oxide (N
2O) resulting from agricultural activities, expressed in CO
2 equivalents. It has been treated as an undesirable output and is included in the model as an indicator of environmental performance [
7,
11]. As a key driver of global climate change, GHG emissions from agriculture are central to international and regional policies, including the Paris Agreement and the EU’s Green Deal and Farm to Fork strategy [
2,
31]. Consequently, incorporating GGEs as an undesirable output is essential for modern eco-efficiency analysis, as it enables the evaluation of environmental sustainability in agricultural production and supports the alignment of agricultural policies with climate targets [
32].
Table 1.
Input–output variables used in DEA and their descriptions.
Table 1.
Input–output variables used in DEA and their descriptions.
| Type | Abbreviation | Description | Unit | Reference |
|---|
| Input | COE | Compensation of employees in agriculture | EUR million | [33] |
| Input | EC | Energy consumption in agriculture | TJ | [34] |
| Input | GFC | Gross fixed capital formation in agriculture | EUR million | [35] |
| Output | GDP | Gross domestic product in agriculture | EUR million | [36] |
| Output | GGEs | Greenhouse gas emissions in agriculture | 1000 tons of CO2 equivalent | [37] |
While a comprehensive evaluation of agriculture’s environmental impacts would ideally incorporate a wider array of indicators, like land degradation, water quality, and biodiversity loss—all of which are crucial to sustainability—obtaining reliable, harmonized, and sector-specific time-series data for them poses significant methodological difficulties given this study’s broad scope (26 EU countries and Türkiye, 2003–2022) [
29,
38]. For this reason, the analysis concentrates on two of the most critical and methodologically sound environmental pressures reported internationally: greenhouse gas emissions and energy consumption. This focused approach is intended to ensure analytical consistency and increase the reliability of the comparative results.
In DEA models, the relationship between the number of DMUs and the number of input and output variables is of critical importance for the model’s validity and discriminatory power. Among the established rules in the literature, Cooper et al. [
39] and Dyson et al. [
40] set limits on the maximum number of variables that can be used relative to the number of DMUs. Accordingly, given the inclusion of 26 DMUs in this study, the number of variables was constrained, and three input variables and two output variables were employed.
To minimize potential distortions arising from scale differences in cross-country comparisons, all variables were normalized by the total agricultural land area of each respective country [
41]. This normalization aimed to eliminate misleading outcomes that may have resulted from differences in the production scale. Furthermore, to ensure consistency across countries, non-EUR national currencies related to COE, GFC, and GDP were converted into EUR based on their corresponding annual exchange rates [
42]. The analysis period concludes in 2022, as this is the most recent year for which data were consistently available for the greenhouse gas emission (GGE) and energy consumption (EC) variables.
In studies utilizing DEA for environmental efficiency and energy analyses, certain outputs, such as CO
2 emissions, wastewater, and industrial solid waste, are typically classified as undesirable outputs [
43,
44,
45].
Seiford and Zhu [
46] proposed several approaches for incorporating undesirable outputs (like CO
2 emissions) into DEA models, including treating them as inputs or transforming them. Following one of these established methods, this study adopted the approach of transforming the undesirable output, GGEs, into its reciprocal value. This transformation ensured that higher emissions resulted in lower efficiency scores, thereby aligning the model with environmental sustainability objectives. All computations were performed using Win4DEAP.
The model specification for the input-oriented DEA approach incorporating undesirable variables is presented below:
In the DEA model, θ represents the extent to which the inputs of the DMU under evaluation can be reduced while maintaining the same level of outputs. For the target decision unit (DMU 0), the input quantities are denoted as xi0, the desirable output quantities as yr0, and the undesirable output quantities as yk0, and similarly, for any decision unit (j), these are represented as xij, yrj, and ykj, respectively. Additionally, λj represents the intensity value (weight) assigned to the decision unit (j) in constructing the efficient frontier. Among the constants used in the model, the number of input variables is represented by m, while the number of desired outputs is indicated by s, and the number of undesirable outputs is denoted as p. Lastly, N refers to the total number of DMUs included in the analysis.
Although DEA is a widely used and robust method for measuring efficiency, it also has certain limitations. First, DEA results are highly sensitive to the selection of the input and output variables [
39,
47]. Different sets of variables or samples of DMUs may yield varying efficiency scores and rankings. Furthermore, since efficiency scores are calculated relative to the best-performing DMUs in the sample, some units may be classified as efficient even if all the DMUs in the sample are technically inefficient.
Moreover, when the ratio between the number of DMUs and the number of input and output variables is not properly maintained, the discriminatory power of the DEA model may decline, resulting in the classification of a large number of DMUs as efficient [
17,
39,
40]. In this study, these methodological limitations were acknowledged and carefully considered during the selection of the variables and the interpretation of the results.
3. Results and Discussion
In this study, the eco-efficiency levels of the agricultural sectors in 26 EU countries and Türkiye were analyzed for the period 2003–2022 using an input-oriented DEA model with VRS. Eco-efficiency is defined as the performance level achieved by maximizing the desirable economic output (GDP) while minimizing the undesirable environmental outputs (GGEs) and economic inputs (COE, EC, and GFC).
3.1. Overall Eco-Efficiency Trends (2003–2022)
The eco-efficiency scores for the analyzed countries are presented in
Table 2. The results reveal substantial heterogeneity in the eco-efficiency levels both across countries and over time. Notably, Türkiye, Italy, the Netherlands, and Bulgaria demonstrated consistently high performances, achieving full efficiency scores (1.000) or scores very close to this threshold during much of the period.
The consistently high performances of countries like the Netherlands and Italy are noteworthy. This finding aligns with the observations of Wysokińskiski et al. [
12], who also identified these nations as highly efficient. While their study links these performances to the adoption of modern agricultural practices and technology-driven systems, the present analysis, confined to the scope of DEA, can only suggest a possible correlation between these factors and the observed eco-efficiency.
Similarly, the analysis conducted by Vlontzos et al. [
11] identified Denmark, Spain, the Netherlands, Italy, Belgium, and Bulgaria as fully efficient countries during their respective study periods.
Spain, in particular, maintained a generally high level of efficiency throughout the timeframe. According to Wysokińskiski et al. [
12], although Spain did not reach full efficiency, it performed better than many other EU countries. The country’s strong performance is consistent with the well-documented benefits of advanced technology and modern agricultural methods in promoting resource efficiency, highlighting the potential role of digital technologies in advancing environmental sustainability in the agricultural sector [
48].
Türkiye’s consistent presence on the efficiency frontier, often serving as a benchmark, is a compelling finding. This result challenges the conventional assumption that high eco-efficiency is exclusively linked to the high-capital, high-technology models seen in many Western European nations. While this study’s macro-level data do not permit an analysis of the underlying causes, they highlight Türkiye as a critical case for future research. A deeper, case-study-based investigation into the specific policy measures and structural factors that contribute to this high performance is warranted. In the case of Türkiye, its documented policy approaches, such as the provision of low-cost mechanization assistance, the enhancement of agricultural extension services, and the incorporation of regional differences into policy design [
49], may offer initial avenues for such an investigation.
By contrast, countries such as Austria, Finland, and Greece, despite achieving full efficiency scores in certain years, exhibited fluctuations in their efficiency levels during others. For instance, Austria reached full efficiency in 2007, 2008, and 2011 but experienced a notable decline to a score of 0.576 in 2015, followed by signs of recovery. Finland, in contrast, has demonstrated sustained full efficiency particularly since 2014. However, Vlontzos et al. [
11] and Matsumoto et al. [
17] pointed out that countries like Austria and Finland—despite their high environmental protection standards—were not sufficiently efficient in terms of their energy use and environmental performance in the early 2000s.
Furthermore, countries such as the Czech Republic (average score: 0.521), Denmark (0.484), Estonia (0.465), Luxembourg (0.405), and Poland (0.517) generally recorded lower eco-efficiency scores [
12], emphasizing significant improvement potential in the agricultural sectors of Estonia (0.26) and Poland (0.27). Similarly, [
11] reported that Eastern European countries—including Estonia (0.678), Poland (0.599), the Czech Republic (0.610), Slovakia (0.444), Lithuania (0.439), and Latvia (0.419)—tended to exhibit low efficiency scores, primarily due to their low levels of technological advancement. Matsumoto et al. [
17] also found that Western European countries generally demonstrated significantly higher environmental efficiency scores compared to their Eastern European counterparts. These findings suggest considerable room for improvement in both the input management and environmental performance in Eastern European countries.
A notable decline in efficiency is observed in several countries around 2015. This trend coincides with the implementation of significant structural reforms under the EU’s Common Agricultural Policy (CAP), particularly the mandatory introduction of “greening” measures [
50]. The adjustment period required for farmers to comply with these new regulations, coupled with the restructuring of direct payments, could potentially explain the temporary decrease in the eco-efficiency in some member states as production decisions and resource use were adapted.
Moreover, uncertainty surrounding the implementation of CAP reforms, along with broader economic fluctuations, may have contributed to this decline. Notably, low commodity prices and volatility in energy costs during the 2014–2016 period adversely affected capital investments and labor productivity in the agricultural sector [
51].
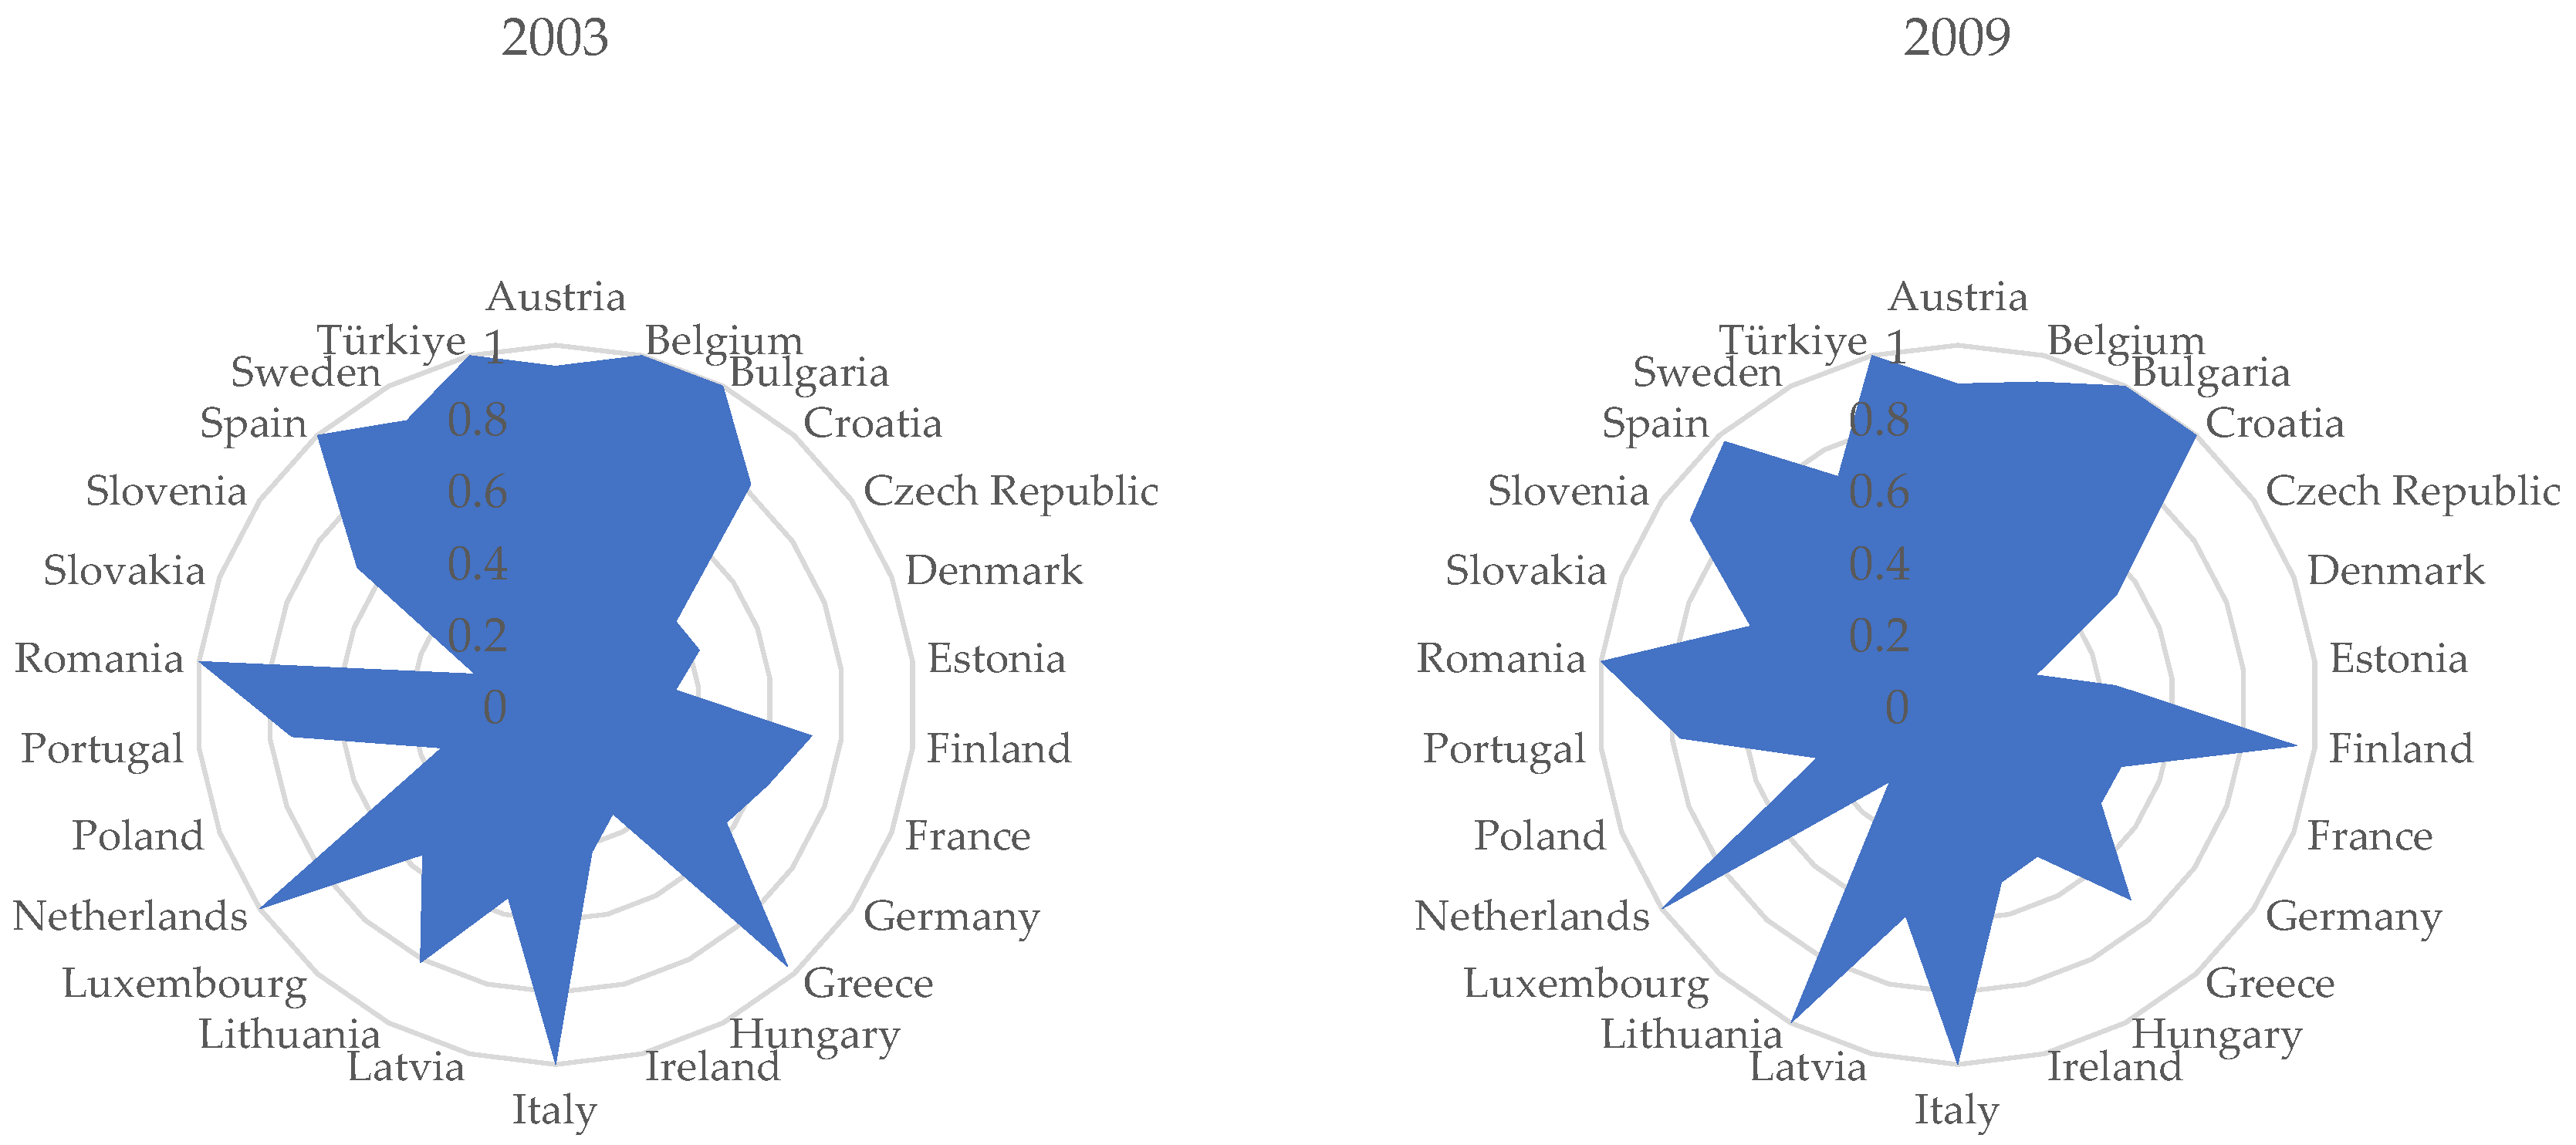
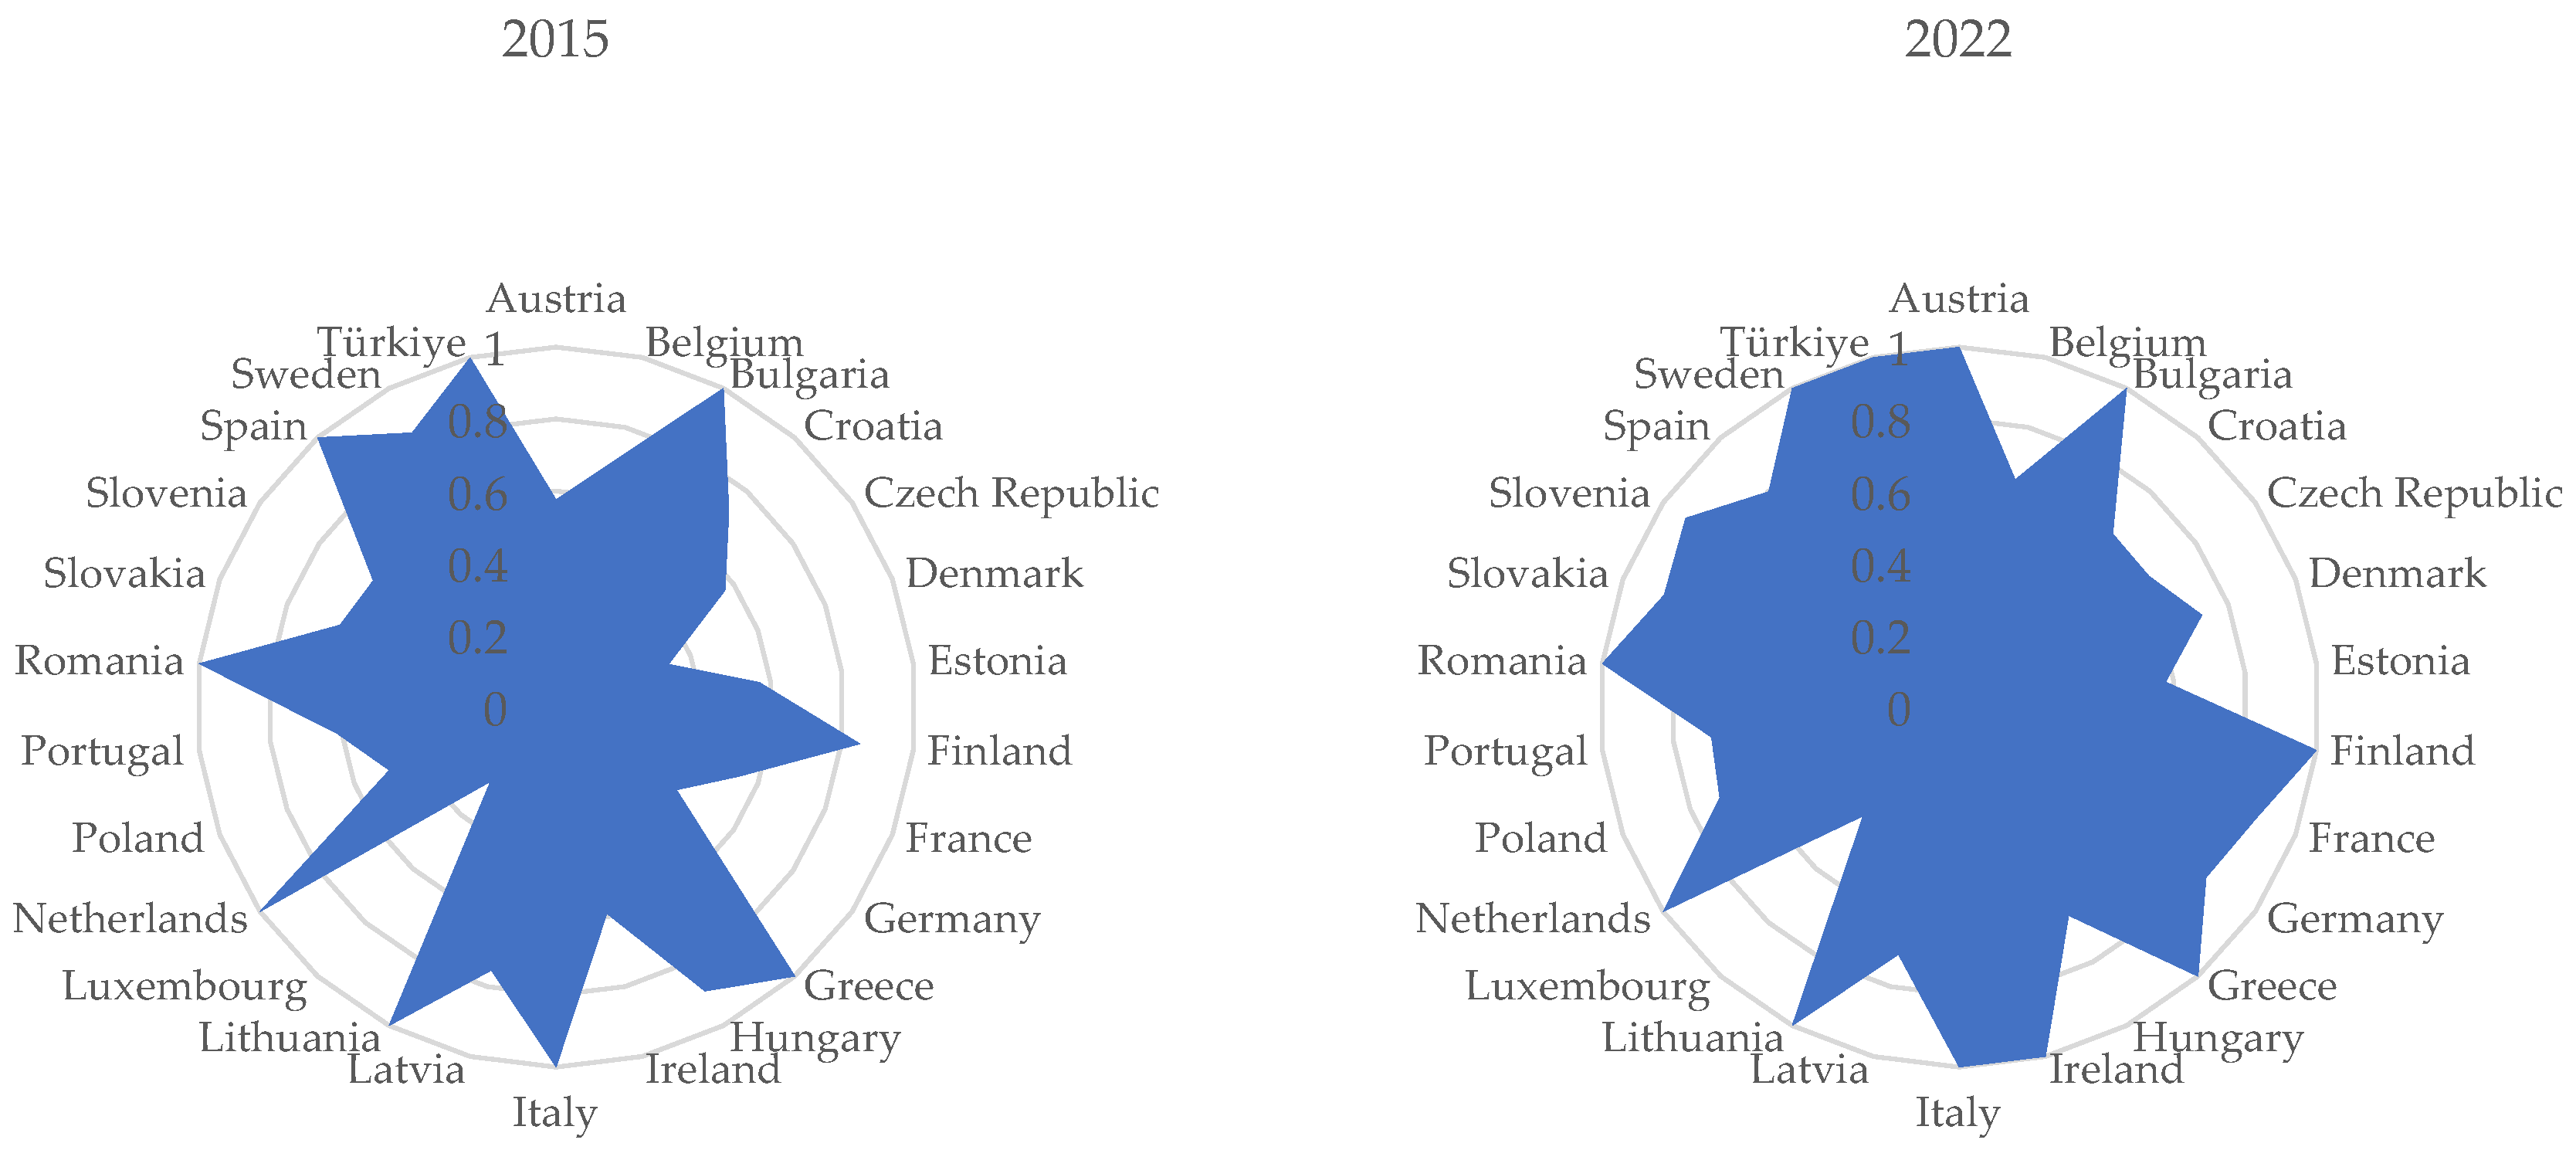
The eco-efficiency scores of EU countries and Türkiye for selected years (2003, 2009, 2015, and 2022) are presented in
Figure 1. This figure visually illustrates the comparative eco-efficiency performances of the analyzed countries across four selected years, highlighting the temporal dynamics.
The twenty-year averages indicate that Italy, the Netherlands, Romania, and Türkiye (1.000) stand out as countries with consistently high average eco-efficiency scores. The sustained eco-efficiency performances in these countries may be attributed to factors such as their advanced technological adoption, well-developed infrastructure, robust production planning, and relatively effective management of environmental impacts. Türkiye’s inclusion in this group is particularly noteworthy, as it generally exhibits lower economic indicators compared to the EU average, yet it outperforms many developed countries in terms of its resource use efficiency.
Conversely, countries such as Estonia (0.465), the Czech Republic (0.521), Denmark (0.484), and Luxembourg (0.405) have relatively lower average eco-efficiency scores. This suggests a lack of continuity in the efficient use of agricultural resources in these countries, with their performances appearing particularly weak concerning environmental outputs.
These differences are likely the result of variations in the countries’ agricultural structures, levels of technology adoption, policy frameworks, and environmental conditions. The authors of [
17] noted that the environmental efficiency scores across the EU peaked in 2012–2013 and subsequently stabilized. Similarly, this study also observed a general convergence in the eco-efficiency levels of many EU countries beginning in the early 2010s.
3.2. Eco-Efficiency and Scale Efficiency Analysis for 2022
The eco-efficiency levels of the countries for the most recent year, 2022, are presented in
Table 3. In that year, eleven countries—Austria, Bulgaria, Finland, Greece, Ireland, Italy, Lithuania, the Netherlands, Romania, Sweden, and Türkiye—achieved full efficiency scores (1.000).
In 2022, eleven countries achieved full efficiency. An interesting finding emerged from the scale efficiency analysis: countries such as Greece, Romania, and Türkiye were identified as operating at Constant Returns to Scale (CRS). This presents a paradox, particularly for nations like Greece and Romania, which are well-documented as having fragmented agricultural structures and significant labor oversupply [
52,
53,
54]. This apparent contradiction suggests that the CRS finding at the macro-level should not be interpreted as evidence of the optimal farm-level structure. Rather, it indicates that, given their current national input–output mix, the model does not detect scale-related inefficiencies. This highlights a key limitation of the aggregate approach and underscores that a more granular, micro-level analysis is needed to understand the true nature of the structural efficiency within these countries.
Conversely, the remaining fully efficient countries—including Austria, Finland, the Netherlands, and Sweden—were identified as operating under Decreasing Returns to Scale (DRS). This suggests that they might be operating at a national scale, where further expansion does not yield proportional increases in the output efficiency. For these nations, which generally possess highly productive agricultural sectors, the finding implies that efficiency gains may lie more in optimizing existing operations than in scaling them up. It is noteworthy that Italy also falls into this DRS category. Given Italy’s well-known fragmented farm structure, this specific finding highlights the complexity of interpreting macro-level-scale efficiency and warrants a country-specific investigation.
Among the countries that did not achieve full efficiency, France (0.880), Slovakia (0.877), Germany (0.833), and Spain (0.799) had relatively high scores, while Luxembourg (0.404), Estonia (0.577), the Czech Republic (0.640), and Croatia (0.643) recorded the lowest levels of eco-efficiency. Notably, Slovakia, Germany, Denmark, the Czech Republic, France, and Belgium were operating under DRS conditions, implying that their production scales may have been above the optimal levels, leading to efficiency losses.
In contrast, Spain, Poland, Latvia, Portugal, Hungary, Estonia, Luxembourg, and Croatia exhibited Increasing Returns to Scale (IRS), indicating the potential for efficiency improvements through expansion in the production scale. The fact that many of these IRS countries are also characterized by relatively smaller agricultural areas and lower agricultural GDPs is consistent with the theoretical expectation from DEA that scaling up their operations could enhance their eco-efficiency performances.
However, DEA efficiency scores are relative and do not imply structural similarity or equivalences between countries. For example, countries like the Netherlands and Romania may both receive a score of 1.000 yet achieve efficiency through fundamentally different input–output structures and technological capabilities. Thus, the efficiency scores should be interpreted within their methodological boundaries and not as indicators of a uniform sectoral performance [
23,
24].
3.3. Benchmarking and Improvement Potential for Inefficient Countries
The reference countries identified for inefficient countries (
Table 4) represent an important analytical dimension of DEA. These reference sets serve a benchmarking function by identifying a composite peer composed of efficient units. Inefficient countries can, in theory, improve their performance by emulating the input-output mix of these reference peers.
For example, Belgium, with an efficiency score of 0.650, takes Finland (weight: 0.128) and Türkiye (0.872) as its reference countries. This suggests that Belgium’s target performance is defined primarily by the input–output configurations of Türkiye and, to a lesser extent, Finland. Similarly, the Czech Republic’s reference set includes Greece (0.048), Ireland (0.093), Sweden (0.428), and Türkiye (0.431). Luxembourg is benchmarked against Greece (0.046), Ireland (0.202), Sweden (0.287), and Türkiye (0.465). These examples demonstrate that even a small country can have a reference set composed of efficient countries with diverse sizes and structural characteristics.
It is noteworthy that countries such as Türkiye, Bulgaria, Ireland, Lithuania, and Greece are frequently selected as reference units for many inefficient countries. This indicates that the input–output balances achieved by these countries in 2022 were highly optimized in both economic and environmental terms compared to others.
These findings align with one of the key advantages of DEA—its capacity to model best practices and define target units [
45]. Indeed, in a comprehensive review of DEA applications, Mardani et al. [
55] emphasized the method’s potential for identifying high-performing DMUs and establishing improvement targets for others. The reference sets thus provide concrete insights into which high-performing examples inefficient countries can focus on for potential improvement.
Some of the countries identified as references—such as Greece, Italy, and Sweden—were also highlighted by Wysokińskiski et al. [
12] as high-performing countries in terms of agricultural efficiency and as examples for other countries. This consistency suggests that these countries have achieved structural efficiency in their agricultural sectors and adopted optimized strategies for resource use. However, the composition of reference sets and the degree of dependence of inefficient countries on these references vary considerably. These differences can be attributed to variations in the scope of datasets used across studies (e.g., years covered, number of DMUs, the definition of input–output variables, or the DEA model specifications applied. It is crucial to emphasize that being a ‘benchmark’ in a DEA context does not imply that these countries are structurally similar or that their policies are directly transferable. The fact that countries with vastly different agricultural systems—such as the Netherlands and Romania—can both appear on the efficiency frontier underscores the relative nature of DEA. It simply means they have each achieved a balanced input–output mix relative to their peers in the dataset, following potentially very different pathways.
The input reduction recommendations for inefficient countries (
Table 5) reveal substantial improvement potential, particularly concerning the inputs of EC and COE. For instance, Belgium is advised to reduce its EC input by 64.32%, its gross fixed capital formation (GFC) by 48.14%, and its COE by 34.98%. Similarly, significant reductions are recommended for Croatia: 76.16% in COE, 35.73% in EC, and 35.75% in GFC. These figures suggest considerable inefficiencies in the resource utilization within the agricultural sectors of these countries, and that optimizing these inputs could enhance their eco-efficiency levels.
In a prior study by Wysokińskiski et al. [
12], which also included reference country suggestions, it was indicated that Poland should reduce its employment by 83%, its energy consumption by 74%, and its agricultural land use by 73% by benchmarking Italy and the Netherlands. In the present study, Poland is estimated to require reductions of 68.38% in its COE, 66.83% in its EC, and 28.88% in its GFC. Similarly, while Wysokińskiski et al. [
12] suggested approximately 74% reductions across all inputs for Estonia, this study calculates the necessary reductions at 43.88% for COE, 42.28% for EC, and 42.21% for GFC.
A particularly noteworthy finding relates to Denmark. Although previously evaluated as fully efficient by Wysokińskiski et al. [
12], Denmark is classified as inefficient in this study, with estimated reduction potentials of 80.09% in its COE, 40.98% in its EC, and 27.90% in its GFC. In contrast, the Netherlands, also deemed fully efficient in the previous study, maintains its efficiency status in this analysis. Meanwhile, Slovakia is identified as a country in need of reductions of 70.60% in its COE, 12.29% in its EC, and 12.20% in its GFC.
Countries such as Austria, Bulgaria, Finland, Ireland, Lithuania, and Romania, which were reported as inefficient by Wysokińskiski et al. [
12], were identified as fully efficient in this study, requiring no reductions in any input variables. In contrast to Wysokińskiski et al. [
12], which focused exclusively on EU countries, the inclusion of Türkiye in this study—and its identification as a fully efficient country—is particularly noteworthy. Türkiye’s role as a key reference unit for several EU countries, including Belgium, Croatia, Poland, Portugal, Spain, Slovakia, and Luxembourg, highlights the unique and meaningful contribution of this study to regional-scale agricultural efficiency analysis.
The reduction rates presented in
Table 5 generally indicate that labor and energy resources are relatively overutilized in the agricultural sectors of inefficient countries, while capital investments are more amenable to optimization.
The input reduction recommendations developed in this study—specifically tailored to the agricultural sector and based on normalized data—distinguish it from more general energy efficiency or macroeconomic studies, such as those by Chen and Hu [
10] and Magazzino et al. [
18]. This sectoral specificity enables agricultural policy to be shaped through more targeted and concrete insights.
The proposed reduction rates can serve as a foundation for policymakers to reassess resource allocation, develop strategies to improve energy and labor productivity, and optimize agricultural capital investments—ultimately contributing to enhancements in both economic and environmental performance.
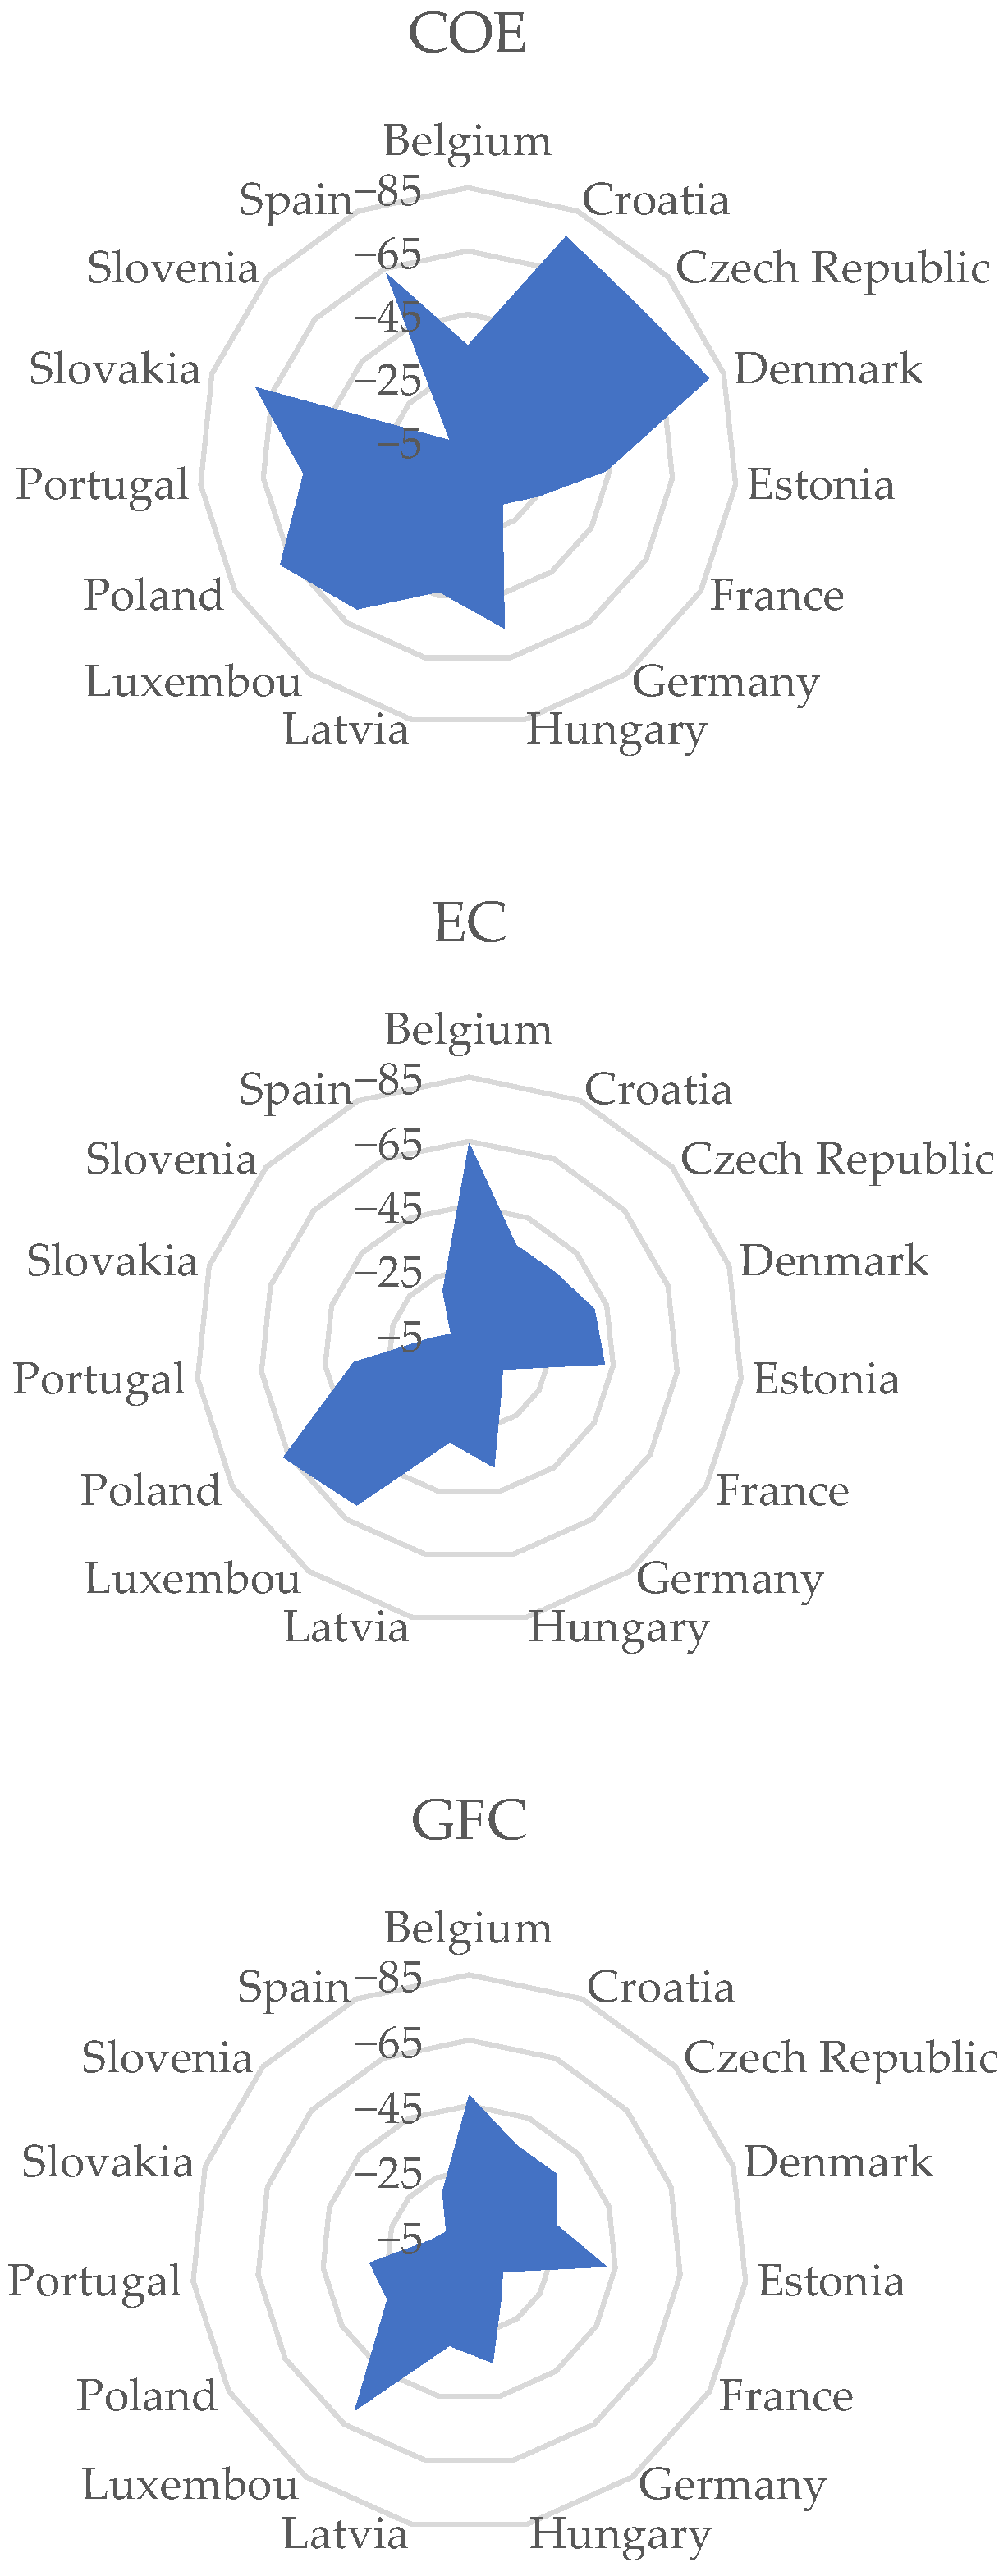
Figure 2, based on the results of the DEA, presents the potential reduction rates for EC, COE, and GFC in the agricultural sector.
The figure also illustrates which input variables exhibit relatively greater room for improvement in each country, thereby visualizing inefficiency areas that can guide countries in setting their policy priorities.
4. Conclusions
This study evaluated the eco-efficiency levels of the agricultural sectors in 26 European Union (EU) member states and Türkiye over the 2003–2022 period using Data Envelopment Analysis (DEA). The results revealed significant disparities among the countries; while some countries demonstrated full efficiency, others were identified as having considerable potential for improvement in terms of their economic and environmental outputs. Notably, Türkiye exhibited a strong performance throughout the study period, frequently emerging as a benchmark country.
A key finding of the analysis is that the identified inefficient countries have the potential to make substantial reductions in their current input levels. This indicates that optimizing resource use can yield both economic and environmental gains. The findings related to specific input categories serve as a diagnostic tool for policymakers:
Energy Efficiency: The analysis reveals the substantial potential for energy conservation, with some countries needing to reduce their energy inputs by over 60% to reach the efficiency frontier. Such a significant performance gap highlights the critical importance of policies focused on energy management. These may include strategies promoting renewable energy, disseminating energy-efficient equipment, and supporting effective on-farm conservation practices.
Labor Efficiency: The analysis points to significant inefficiencies related to labor inputs (COE) in several countries, with some requiring reductions of over 70% to align with the efficiency frontier. This finding indicates that addressing agricultural labor productivity is a primary challenge for these nations. While the model does not prescribe specific solutions, it highlights the magnitude of the issue, suggesting that national-level strategies aimed at improving the overall economic efficiency of labor in the agricultural sector should be prioritized.
Capital Efficiency: In countries where the analysis identified optimization potential in the gross fixed capital formation (GFC), the findings point to inefficiencies in how capital is utilized. This suggests that a critical review of national investment policies may be warranted. Evaluating capital allocation through an efficiency-oriented lens, for instance, by prioritizing projects based on their potential return on investment, could be a viable strategy for enhancing resource effectiveness.
The DEA results also point to the significant potential for reducing GHG emissions in the agricultural sectors of many countries. This finding is relevant, as it provides an empirical measure of the environmental performance gaps that are often the subject of policy discussions, including those concerning market-based instruments. It is crucial to clarify that this study does not advocate for or evaluate any specific policy, such as carbon pricing. Instead, it quantifies the scale of the existing inefficiencies. This provides a data-driven baseline that policymakers may consider while acknowledging—as this study emphasizes—that the design and implementation of any policy must be carefully tailored to each country’s unique agricultural structure, socioeconomic conditions, and food security objectives.
The DEA scale efficiency findings (IRS or DRS) suggest the potential for optimizing resource allocation at the national level. For countries exhibiting Increasing Returns to Scale (IRS), the results imply that an expansion of the overall agricultural sector’s scale of operations could lead to eco-efficiency gains. Conversely, for countries operating under Decreasing Returns to Scale (DRS), the findings indicate that they may be operating beyond their optimal national scale, suggesting that a more effective utilization of the existing resource base, rather than further expansion, could enhance their eco-efficiency.
It is important to consider certain methodological limitations when interpreting the findings of this study. DEA is a relative performance measurement tool and does not establish direct causal relationships. Therefore, this analysis should be viewed not as a source of policy prescriptions but as a diagnostic tool that identifies national-level performance disparities and highlights areas for more in-depth research. For instance, the performances of fully efficient countries should not be seen as a “best practice” to be directly replicated but rather as a reference point that each country can consider while developing its own context-specific strategies. In this regard, establishing sectoral learning platforms that encourage knowledge sharing and the contextual analysis of these benchmarks would enable the most constructive use of the findings.
Future research could further expand the scope of this study. While this study provides valuable insights by focusing on energy consumption and GHG emissions, including additional environmental indicators such as water use, land degradation, and biodiversity impacts would offer a more holistic picture. Furthermore, deepening the analysis with more specific data at the farm-type or production-system level and incorporating indirect inputs through approaches like Life Cycle Assessment (LCA) would contribute to a more accurate reflection of the true dimensions of the agricultural eco-efficiency. Advancements in international data collection and harmonization will be of critical importance to make such comprehensive analyses possible.


