Abstract
Landslide prevention is crucial, particularly for protecting roads and infrastructure in rock landslide-prone areas. This global issue has garnered significant attention from researchers worldwide. This study addresses landslide prevention by modeling the factor of safety (FoS) for slope stability through the Geological Strength Index (GSI), limit equilibrium method (LEM), and finite element method (FEM). A GSI analysis was conducted using RocLab software version 1.0, and slope modeling was performed using RocScience SLIDE version 6.0 and RS2 version 11. The results revealed various cohesion and friction angles across six slopes, with Slope 5 exhibiting the highest FoS values (up to 3.27 with the FEM) and Slope 1 exhibiting the lowest (1.59 with the FEM). All slopes, designed with a uniform geometry, remained stable, exhibiting FoS values greater than 1.1. This study further provides an optimal slope design for the open pit in the andesite mining plan at Anugerah Berkah Sejahtera. These findings highlight the important role of accurate modeling in the assessment of slope stability. With a suggested safe slope height of 10 m and an angle of 80° (FoS = 1.62), slope stability analysis based on the factor of safety (FoS) showed that single slopes made of andesite maintain stability at steep angles. Claystone slopes, however, have a maximum slope height of 30 m at 20° (FoS = 1.27) and 27 m at 50° (FoS = 1.34), requiring more conservative geometries to maintain their stability. For an overall slope that comprises both rock types, a height of 30 m with a slope angle of 60° is recommended (FoS = 1.23) to ensure stability. The critical design condition for a claystone slope occurs at a height of 30 m with a slope angle of 50°, yielding a factor of safety (FoS) of 0.92, which indicates instability (FoS < 1.1). Similarly, a 35 m-high slope with a slope angle of 20° produced an FoS of 1.04, and a 35 m-high slope with a slope angle of 50° produced an FoS of 0.89, further confirming instability. For the overall slope configuration, instability occurs at a height of 30 m with a slope angle of 65° that produces an FoS of 1.09.
1. Introduction
Landslides are catastrophic natural events characterized by the sudden release of rocks, soil, snow, ice, and vegetation from mountain slopes [1]. Landslides occur when a mass of rock or debris moves downslope under the influence of gravitational forces. This phenomenon is considered one of the most devastating natural disasters. Landslide prevention is crucial, particularly for ensuring public safety and protecting infrastructure [2,3,4]. Therefore, understanding the mechanisms driving instability on these slopes is essential for sustainable economic activities in these regions [5].
Determining the optimal slope angle for stability in open-pit mining requires balancing safety and economic considerations [6]. An excessively high stability may necessitate increased excavation efforts, potentially reducing the mine’s economic returns [7]. Conversely, insufficient stability may lead to slope failure, which disrupts production and increases costs [8]. The safety margin of slopes in geotechnical structures is quantified using the “factor of safety” (FoS), which is defined as the ratio of resisting forces to driving forces on a slope [9,10,11].
The open-pit mine design has been carefully optimized to ensure stability, efficiency, and cost-effectiveness while maintaining safe mining operations. In slope stability open-pit mine analysis, the careful consideration of local soil conditions is critical, as these can significantly influence the displacement transferred to the structure [12]. Claystone and andesite are the two components that make up the overall slope. The claystone deposits at Anugrah Berkah Sejahtera exhibit soft rock characteristics. A design with geometric variations is used to model the materials that comprise the entire slope. If the whole slope geometry analysis calculation achieves an FoS of more than 1.1 [13], then the findings are regarded as steady. According to the safe slope simulation results, the overall slope has an FoS value of 1.23, a slope height of 30 m, and a slope angle of 60°.
A new model integrated into Discontinuous Deformation Analysis (DDA) to simulate the complete desiccation process of clay, from volume shrinkage, desiccation cracking, to curling due to drying. This model can be useful in geotechnical engineering to predict stability issues in soil due to drying, such as cracks in the subgrade or slopes exposed to dry conditions [14]. Geotechnical stability modeling and seepage analysis were performed using GeoStudio’s SLOPE/W and SEEP/W modules. A Monte Carlo simulation approach was employed to quantify the failure probability of each slope segment, considering multiple scenarios of annual reservoir water level fluctuations and extreme rainfall events [15]. The slope analyzed in this study comprises interbedded andesite and claystone formations. However, the rock slope is continuous with the surrounding terrain, forming part of a larger land slope system [14].
For open-pit mine design, the bench configuration consists of 10 m-high benches with 10 m-wide berms, providing both structural stability and safety catch zones for falling debris. The haul road system is designed for maximum efficiency, featuring an 8% gradient, 20 m radius of corners, and proper drainage with a 2% cross-slope, ensuring smooth and safe truck movement. Material transport distances are optimized, with waste rock hauled 300–350 m to disposal sites and ore transported 200–250 m to the ROM stockpile, minimizing operational costs. This well-balanced pit layout, covering 2.88 hectares, integrates geotechnical stability with practical mining requirements, ensuring safe, economical, and productive operations throughout the mine’s lifecycle.
Studies have shown that slope stability is influenced by several parameters, including slope angle, shear strength parameters (cohesion and internal friction angle), geological structure, weathering rate, rainfall, groundwater table, vibration, and seismic factors. Specifically, the GSI is an engineering classification that allows the estimation of the mechanical properties of a rock mass [16,17,18]. The joint conditions and structural features of the rock mass are fully reflected in the GSI [19,20]. A GSI system has been embedded in RocLab software, which empirically estimates rock mass properties (cohesion, friction angle, and tensile strength) through the Hoek–Brown and Mohr–Coulomb approaches [21].
Historically, landslides have been extensively studied using limit equilibrium methods (LEMs). The majority of cases have been documented and analyzed using the toppling and circular methods of landslide analysis [22]. Moreover, the rock slope probability risk analysis approach has become increasingly important in the design of slope structures. In probability analysis, each input parameter is assigned a statistical distribution, and stability is evaluated in terms of the probability of failure (Pf) and/or the reliability index (β). The most commonly used methods include the first-order reliability method (FORM), the first-order second-moment (FOSM) method, and the second-order reliability method (SORM) [23,24,25,26]. The LEM produces safety factors for various potential instability modes on soil and rock slopes, which can be applied to both static and dynamic conditions in two- and three-dimensional spaces [27,28,29,30].
The finite element method (FEM) solves this problem by discretizing the slope into a finite number of elements. In this approach, the continuous slope structure is replaced by a discretized model, and the stability of the entire slope is analyzed based on the stress and deformation of the individual elements [31]. Strength reduction factor (SRF) analysis is employed to estimate the factor of safety (FoS) for each model [32,33]. A model generated using the FEM can more accurately estimate the slip surface [34]. The critical value of the SRF indicates the safety factor, the highest shear strain value indicates the slip surface, and the largest slope displacement value indicates the overall displacement [35,36].
This study presents a geotechnical case study analyzing slope stability in the proposed open-pit mine at Anugerah Berkah Sejahtera. In this study, we aim to address landslide prevention, a globally significant phenomenon that has garnered considerable attention from researchers. We evaluate the safety factor (FoS) of slope stability using the integration of the GSI, LEM, and FEM to provide recommendations for safe slope geometry in open-pit mining plans. The primary novelty of this study lies in determining the optimal slope angles for open-pit mining and providing critical design insights to mitigate landslide risks in the andesite mining area of Anugerah Berkah Sejahtera. These findings support the development of improved slope stability plans.
2. Topography and Geological Setting
2.1. Topography
This research was conducted in the Anugrah Berkah Sejahtera exploration area. Anugrah Berkah Sejahtera is a mining company, and it is located in Dua Kali Sebelas Kayu Tanam, Pariaman Regency, West Sumatra, Indonesia, where exploratory activities are conducted. Andesite rocks and sand are the primary commodities of Anugrah Berkah Sejahtera. The research location and topographic map are displayed in Figure 1a.
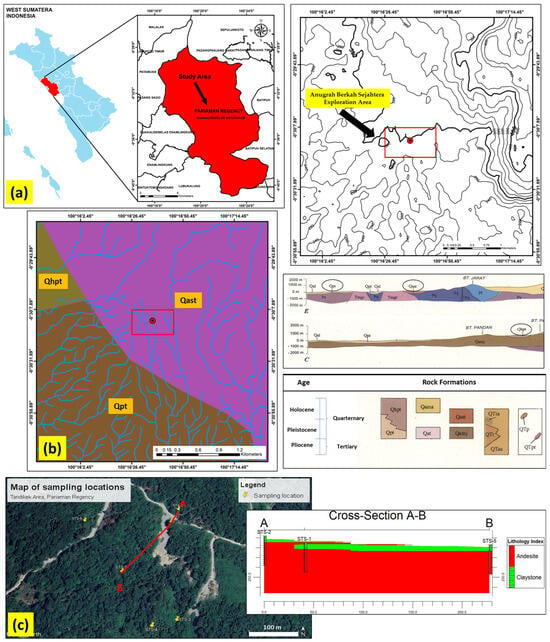
Figure 1.
(a) Location and topographic map of the research site. (b) Regional geological map, stratigraphy, and age of rock formations. (c) Map of locations of the slope observation stations and lithology section. The red frames highlight key areas.
The region generally has a wet tropical climate with the following characteristics:
- Temperature: The average temperature in the Kayu Tanam area, Pariaman Regency, and surrounding regions typically ranges from 24.4 °C to 25.7 °C. Due to its proximity to the equator, temperatures in the region remain relatively stable year-round, with slight decreases at night [37].
- Humidity: Humidity is relatively high, around 86.75% [37], mainly due to the presence of tropical forests and beaches not far from the area.
- Winds and Monsoon Influences: The climate in this area is influenced by the monsoon winds, which come from the Indian and Pacific Oceans. The southwest monsoon (June to September) brings dry winds and larger sea waves, while the northeast monsoon (December to March) brings rain from the sea [38].
Regarding hydrogeological characteristics, two main types of aquifers can be found in this area:
- Surface (Superficial) Aquifers: A subsurface layer containing water located near the Earth’s surface, typically at a depth of less than 15–30 m. This layer consists of porous and permeable materials, such as sand, gravel, or sedimentary rock, which facilitate the storage and flow of groundwater efficiently [39]. At the study area, the phreatic surface of the shallow aquifer occurs at 4 m above mean sea level (m a.s.l.).
- Deep (Closed) Aquifers: These aquifers are usually composed of sedimentary or volcanic rocks that have pores or fissures that allow groundwater to move, albeit at a slower rate [39].
There are five types of land use in the area of Dua Kali Sebelas, Kayu Tanam, Pariaman Regency: agriculture and plantations, settlements, fisheries, forest and nature conservation, and infrastructure and economic development [40].
2.2. Geological Setting
Mount Singgalang and Mount Tandikat, twin stratovolcanoes in West Sumatra, Indonesia, are part of the volcanic landscape shaped by tectonic activity along the Great Sumatran Fault (GSF) [41]. Mount Tandikat has erupted in the past, with the most recent eruption occurring in 1924. It has a crater lake and pyroclastic deposits, typical of mild explosive eruptions [42]. In contrast, Mount Singgalang is considered dormant, with its geological activity having ceased earlier than that of Tandikat [41]. These volcanoes are connected to both shallow and deep magma chambers, as indicated by subsurface magnetic and gravity studies. The surrounding region contains older metamorphic and volcanic formations, with deposits of pumiceous tuff and hornblende [43].
The regional geological map identifies three primary rock formations: the andesite rock formation of Mount Singgalang and Tandikat (Qast); the hornblende–hypersthene pumiceous tuff formation (Qhpt); and the pumice tuff and andesite (Qpt). Figure 1b illustrates a geological map of the research site. The age of rock formations is in the Quaternary to Tertiary. The andesite rock formation of Mount Singgalang and Tandikat (Qast) is associated with the Quaternary period, specifically the Holocene to Pleistocene epochs [41]. Products of Singgalang and Tandikat are considered intermediate in age between (Qama) and (Qamj) because Tandikat has a record of historic eruption but shows no present fumarolic activity. This formation, historically linked to the Tandikat eruption, consists of andesite rocks that are gray, smooth, or porphyritic in texture, exhibiting typical characteristics of volcanic rocks, with an intermediate silica content [41]. As shown on the geological map, the research location is situated in the (Qast) andesite of Mount Singgalang and Tandikat. The samples tested in this study consisted of andesite rock, which is a type of volcanic rock formed by the cooling of silica-rich lava [41]. As a versatile igneous rock, andesite is commonly used in construction for bricks, paving stones, and wall cladding [41]. Hornblende hypersthene pumice tuff (Qhpt) consists almost entirely of pumice lapilli, commonly ranging from 2 to 10 cm in diameter, which contain 3–10% hornblende, hypersthene, and (or) biotite; it is slightly consolidated—white or yellowish-gray when fresh— and weathers deep rusty brown. The geological age for these formations is between the Holocene to the Pleistocene.
Pumice tuff and andesite (Qpt) typically consist of glass shards and 5 to 80%, while pumice fragments (almost devoid of mafic minerals) are 1 to 20 cm in diameter and slightly consolidated. It locally contains layers of quartz-rich sand, as well as layers of gravel consisting of pebbles and cobbles of quartz, volcanic rocks, and limestone. The local concentration is of obsidian and pitchstone boulders. The color is pinkish gray to medium brown; the weather is the same. These tuffaceous deposits may represent either late eruptions from the Maninjau caldera or fissure eruptions related to the great Sumatra fault zone. Andesitic rock association consists of undifferentiated flow, lahars, tuff, fanglomerate, and other colluvial deposits from conical, little-dissected strato-volcanoes of Pleistocene to Pliocene age. Typically dark gray, slightly to highly porphyritic, zoned plagioclase has an estimated compositional range of plagioclase, pyroxene, magnetite, and rare olivine. The stratigraphy and age of rock formations can be seen in Figure 1c.
As illustrated in Figure 1c, six slope locations were surveyed for the open-pit plan at Anugerah Berkah Sejahtera. The coordinates for Slope 1 (STS-1) are 0°30′13.13″ south latitude and 100°16′36.18″ east longitude. The coordinates for Slope 2 (STS-2) are 0°30′11.89″ south latitude and 100°16′36.79″ east longitude. The coordinates for Slope 3 (STS-3) are 0°30′21.66″ south latitude and 100°16′36.47″ east longitude. The coordinates for Slope 4 (STS-4) are 0°30′22.11″ south latitude and 100°16′34.79″ east longitude. The coordinates for Slope 5 (STS-5) are 0°30′17.95″ south latitude and 100°16′32.56″ east longitude. Slope 6 (STS-6) is located at 0°30′13.16″ south latitude and 100°16′29.32″ east longitude. Based on cross-section A-B, the average thickness of andesite rocks was determined to be 23.5 m. In contrast, claystone units exhibit an average thickness of 6.5 m. This lithological interpretation was derived from seismic exploration data provided by Anugerah Berkah Sejahtera.
3. Methods
3.1. Laboratory Testing
- Uniaxial Compressive Strength Test
The strength of the rock samples was determined by assessing their uniaxial compressive strength (UCS). The UCS testing apparatus employed in this study was the UTC-6759 model, with a capacity of 5000 kN. As shown in Figure 2a, the rock samples collected from the field were processed into cubes measuring 50 mm ± 0.50 mm, in accordance with ASTM C109/C109M-21 standards [44]. A size of 50 mm is commonly used to test the strength of materials. In this case, three samples from each slope were tested using this technique. A sample size of three was chosen to provide a reasonable estimate of the material’s performance, accounting for natural variations in the sample properties. The total number of samples tested was 18. Young’s Modulus (E) was determined from the slope of the axial stress–strain curve. Meanwhile, Poisson’s ratio (ν) was calculated as the ratio of lateral strain to axial strain. Accurate measurement of these parameters required strain gauges during uniaxial compressive strength (UCS) testing. The claystone test specimens were similarly cube-shaped, with dimensions of 50 mm × 50 mm × 50 mm. A total of 18 samples were tested, corresponding to the six slopes analyzed. The results in Table 1 and Table 2 reflect averaged values, which were used to derive the parameters in Table 4. The Mohr–Coulomb (M-C) parameters were derived by inputting the Hoek–Brown parameters—uniaxial compressive strength (UCS), Geological Strength Index (GSI), intact rock constant (mi), disturbance factor (D), and Modulus Ratio (MR)—into RocLab version 1.0 software.
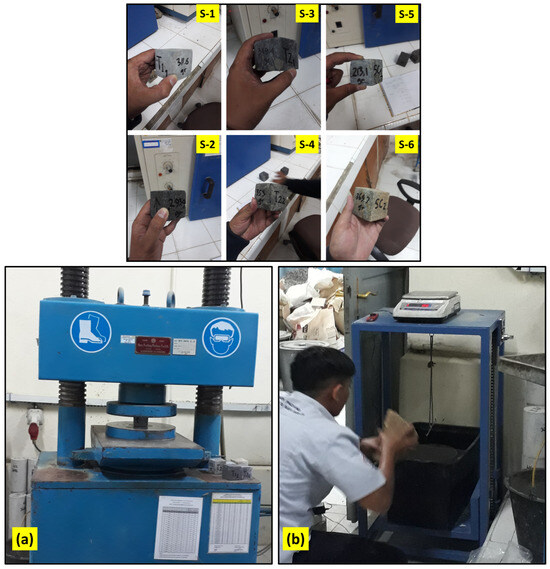
Figure 2.
(a) Rock samples and compressive strength testing apparatus (S-1, S-2, S-3, S-4, S-5, and S-6 are samples from each slope). (b) Testing of specific mass.

Table 1.
Results of the rock compressive strength test.

Table 2.
Results of the specific mass testing.
- Specific Mass Test
The tool used for specific mass testing was the Density of Coarse Aggregates Set, model ELE 4204. A total of 18 samples were tested for specific mass, with 3 samples representing each slope. To begin the process, each rock sample was immersed in water for 24 ± 4 h to ensure that the pores were fully saturated. After immersion, the sample was removed from the water, and the excess surface water was allowed to evaporate before the mass was measured. The sample’s volume was then determined using the water displacement method. Subsequently, the sample was oven-dried, and its mass was recorded. By using the obtained mass values and the formulas specified in the test procedure, the density, relative density (specific gravity), and absorption were calculated. Additionally, the mass in the saturated surface dry (SSD) condition was compared to the total separated water volume in order to determine the specific mass of the rock, following the ASTM C 127-12 standard [45]. The procedure for the specific mass test is illustrated in Figure 2b.
3.2. Assess and Design Rock Slopes in the Open-Pit Mine
The area of the open pit was calculated based on the ultimate pit limit (UPL), derived from pit optimization using Minescape version 5.7 software. The input parameters included topography, geological modeling, andesite reserves, economic factors (commodity price and mining costs), and a safe overall slope angle. The area was computed by converting the pit boundary into hectares (Ha). The bench height was determined based on geotechnical stability (slope analysis), excavation equipment capacity (e.g., excavators with an optimal reach of 10 m), and adherence to industry standards (5–15 m). The berm width was designed to prevent material sliding and serve as an evacuation route, based on geotechnical analysis. The single slope angle was determined by rock strength parameters (cohesion, friction angle, and specific mass) and was measured directly from the design or calculated using geotechnical software, specifically RocScience SLIDE Version 6.0 [46,47,48,49]. The maximum total displacement was determined using RS2 version 11 software. The critical strength reduction factor (SRF) curve for maximum total displacement exhibited three distinct stages: the converged zone, the failed-to-converge zone, and the critical SRF [5,50,51]. The overall slope angle was derived from global pit stability analysis, considering bench and berm geometry, rock strength parameters, and the safety factor. According to the slope design criteria stipulated in Regulation No. 1827 K/30/MEM/2018 by the Ministry of Energy and Mineral Resources of Indonesia, a slope is deemed critical if the factor of safety (FoS) equals 1.1, stable if FoS > 1.1, and unstable if FoS < 1.1 [13].
The ramp width was adjusted according to the hauling equipment dimensions (e.g., a 7 m-wide dump truck requires a minimum 10 m-wide ramp for two-way traffic). The distances to the disposal site, soil bank, and ROM stockpile were measured from the pit center to their respective destinations (disposal area, stockpile) using topographic maps or Minescape version 5.7 software. The range (300–350 m) reflects distance variations depending on the location. The road grade was restricted to a maximum of 8–10% to ensure hauling equipment efficiency (as per equipment specifications; e.g., the Komatsu 730 has a maximum grade limit of 8%). The road grade was calculated using the following equation:
where
- Δh = Elevation difference between two points (in meters).
- d = Horizontal distance between two points (in meters).
The cross-slope functions as a surface drainage system for roads. Meanwhile, superelevation was calculated to counteract centrifugal force on curves. The cross-slope and superelevation are calculated using the following equations:
where
- Δh = Cross-sectional elevation difference between road edges (m).
- W = Total road width (m).
- e = Superelevation rate (dimensionless).
- f = Side friction factor.
- V = Design speed (km/h).
- R = Curve radius (m).
The corner radius was designed according to the minimum turning radius of haul trucks (e.g., a 100-ton capacity dump truck requires a minimum turning radius of 20 m). Field measurements were conducted using a Sokkia GRX3 geodetic RTK GPS and DJI Mavic 2 Pro drone. The data were validated against industry standards (e.g., the International Council on Mining and Metals’ Safety Guidelines for Open-Pit Mines). Through integration of technical analysis, software modeling, and operational standards, the parameters of mining pit design geometry were determined with high accuracy.
4. Results and Discussion
The findings of the andesite rock compressive strength test are shown in Table 1. A total of 18 samples were examined, and their compressive strength values were determined. The six slopes under analysis are represented by the 18 samples. By using the data of the andesite rocks that comprise the slope, the standard deviation (SD), average, coefficient of variation (CoV), minimum value, and maximum value were determined.
An average compressive strength value of 26,004.17 kPa was obtained from the results of the laboratory rock compressive strength tests (Table 1). Specifically, Slope 6 (S-6) was characterized by the maximum compressive strength value of 28,406.69 kPa. Conversely, the lowest compressive strength of 24,122.96 kPa was recorded for Slope 5 (S-5). The coefficient of variation for the six samples was 5.63. In RocLab Version 1.0, each compressive strength data point was converted into an input parameter, σc.
The results of the specific mass tests for each slope are presented in Table 2. A total of 18 rock samples were tested, yielding an average specific mass value of 25.62 kN/m3. Slope 3 (S-3) exhibited the highest specific mass value at 26.97 kN/m3. In contrast, Slope 4 (S-4) displayed the lowest specific mass measurement at 25.21 kN/m3. The standard deviation of the specific mass of the six samples was 1.41. The coefficient of variation for the specific mass of the six slopes was calculated to be 5.49. A strong correlation was found between the compressive strength and specific mass of the rocks. Generally, a rock’s compressive strength increases with its specific mass [52], and a comparison of the compressive strength and specific mass of the rock shows that the correlation is inverse, as seen in Figure 3. Natural variability represents a primary controlling factor for the mechanical properties of rock masses. The sampled formation exhibits notable heterogeneity, attributable to complex diagenetic history, differential weathering patterns, and diverse lithofacies distributions. This inherent heterogeneity induces deviations from idealized strength–density relationships. The observed inverse correlation likely manifests this natural dispersion, as denser samples frequently exhibit higher concentrations of critical microstructural defects.
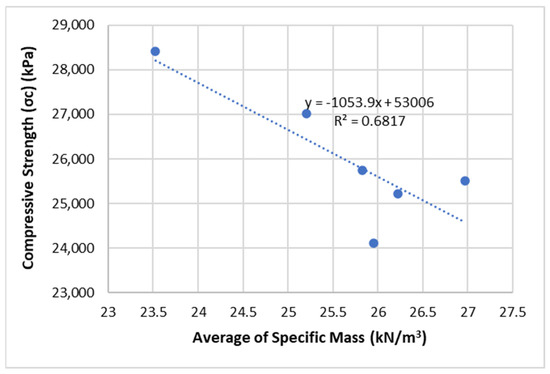
Figure 3.
The comparison of the compressive strength and specific mass.
Figure 4 illustrates the conditions used to determine the GSI values based on field observations of rock structures. The rock structure condition in STS-1 was classified as “Laminated and Fair,” with a GSI value of 25. In contrast, the rock structure condition in STS-2 was classified as “Intact and Fair,” with a GSI value of 65. The rock structure condition in STS-3 was categorized as “Disturbed and Good,” with a GSI value of 44. The rock structure condition in STS-4 was classified as “Disintegrated and Good,” with a GSI value of 35. In contrast to STS-4, the rock structure condition in STS-5 was classified as “Intact and Good,” with a GSI value of 69, according to field observations. The rock structure condition in STS-6 was classified as “Disturbed and Fair,” with a GSI value of 38. This study notes that direct photographic evidence remains insufficient.
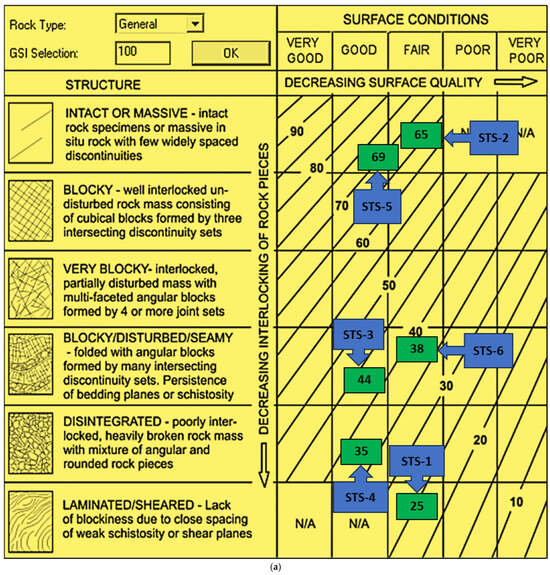
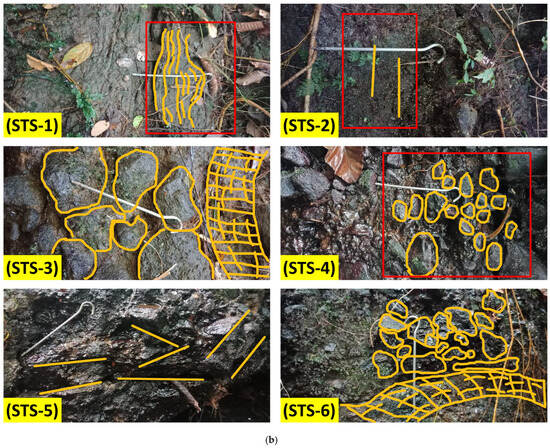
Figure 4.
(a) The GSI value conditions vary according to the specific characteristics of each location. (b) Document joint structures observed on surface features during the field investigation. The red frames highlight key areas.
In RocLab version 1.0, the disturbance factor (D) for slope handling was set to D = 0.7, which corresponds to “Good Blasting.” The value of D = 0.7 was chosen because, particularly in the case of controlled blasting, small-scale blasting on civil engineering slopes typically results in moderate rock mass damage. However, occasional disruptions may occur due to stress discharge. The parameter mi = 25 reflects the composition of the andesite rock on the slope. The MR parameter for the available andesite rocks was 400, depending on the rock type. In slope planning, a height of 25 m was considered. This value was applied consistently across all six slope conditions. Graph results were obtained by importing the complete Hoek–Brown classification parameter data and the failure envelope range, as shown in Figure 5a–e.
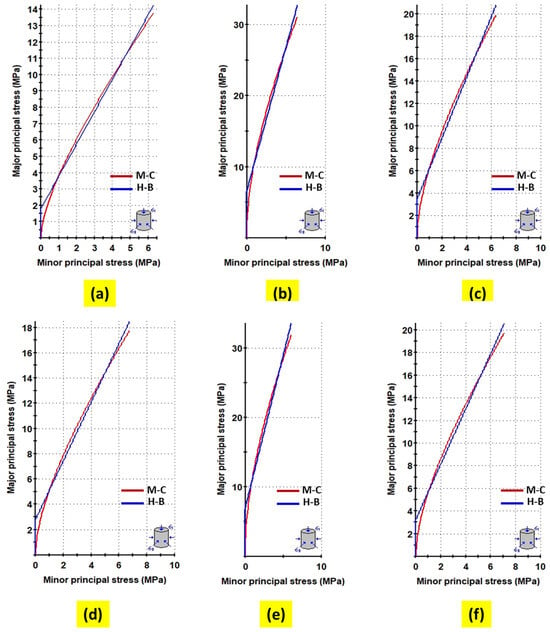
Figure 5.
Hoek–Brown and Mohr–Coulomb criterion graphs for (a) Slope 1; (b) Slope 2; (c) Slope 3; (d) Slope 4; (e) Slope 5; and (f) Slope 6.
Figure 5 illustrates the relationship between the minor and major principal stresses, which corresponds to the Mohr–Coulomb fit (depicted by the red line) and the Hoek–Brown criterion (depicted by the blue line). The results in Figure 5a show that, for Slope 1, the cohesion value is 0.64 MPa, and the friction angle is 19.13°. For Slope 2, the cohesion value is 1.66 MPa, and the friction angle is 37.17°, as shown in Figure 5b. For Slope 3, Figure 5c presents a cohesion value of 1.07 MPa and a friction angle of 27.46°. Meanwhile, Slope 4 exhibits a friction angle of 23.47° and a cohesion value of 0.92 MPa in Figure 5d. For Slope 5, Figure 5e presents a cohesion value of 1.68 MPa and a friction angle of 39.03°. Meanwhile, Slope 6 exhibits a cohesion value of 1.04 MPa and a friction angle of 24.79°, as shown in Figure 5f.
Table 3 presents the parameters of the Hoek–Brown criterion and the Mohr–Coulomb fit, derived from the RocLab version 1.0 processing results for each slope. The Hoek–Brown criterion includes three parameters: mb, s, and a. The Mohr–Coulomb fit parameters consist of cohesion and the internal friction angle. The data analysis yielded a standard deviation of 0.42 for cohesion, with an average value of 1.17 MPa. The minimum cohesion value, 0.64 MPa, was observed on Slope 1 (STS-1), while the maximum cohesion value, 1.68 MPa, was recorded on Slope 5 (STS-5).

Table 3.
Hoek–Brown criterion and Mohr–Coulomb fit values for each slope.
For the internal friction angle, the standard deviation was 7.92, and the average value across all six slopes was 28.51°. The minimum internal friction angle, 19.13°, was observed on Slope 1 (STS-1), while the maximum value, 39.03°, was recorded on Slope 5 (STS-5). The coefficient of variation for cohesion was 35.71, whereas that for the internal friction angle was 27.80. This was attributed to the observations of the rock structure type and surface quality at each location. This significantly influenced the processing parameters of the Hoek–Brown criterion (Mb and s) and Mohr–Coulomb fit (c and φ), with deviations exceeding 10%. This suggests that field observations of rock structure and surface quality have a substantial effect on the two processing parameters. The cohesion and internal friction angle values for each slope served as input parameters for RocScience SLIDE software version 6.0 and RS2 software version 11, as depicted in Figure 6.
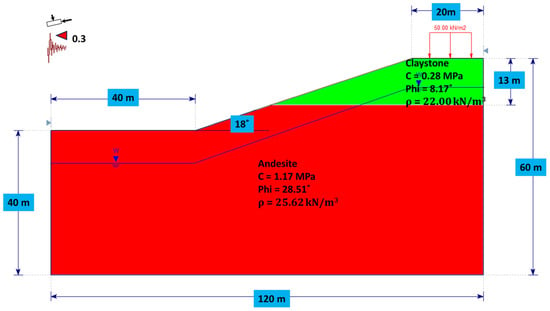
Figure 6.
Slope dimensions and material properties used in modeling.
Table 4 displays the values of the rock properties utilized in the slope stability study. According to the findings of the laboratory tests, claystone had an internal friction angle of 8.17°, a cohesiveness of 0.28 MPa, and a specific mass of 22.00 kN/m3. According to the test results, andesite had an internal friction angle of 28.51°, a specific mass of 25.62 kN/m3, and a cohesion of 0.28 MPa. Based on the results of tests conducted on the mechanical and physical properties of the rock, andesite was classified as weathered andesite. As claystone showed the same phenomenon in the results of the clay rock test, it was classified as weathered claystone. Claystone had a layer thickness of 6.5 m, but andesite rocks in the field had an average thickness of 23.50 m. Table 4 presents a statistical summary of average values derived from experimental results reported in preceding tables.


Table 4.
Parameter values of the rocks that make up the slope.
Table 4.
Parameter values of the rocks that make up the slope.
| Rock Type | Compressive Strength (MPa) | Specific Mass (KN/m3) | Young’s Modulus (GPa) | Poisson’s Ratio | Cohesion (MPa) | Internal Friction Angle (°) | Average Thickness (m) |
|---|---|---|---|---|---|---|---|
| Andesite | 26.00 | 25.62 | 20.40 | 0.30 | 1.17 | 28.51 | 23.50 |
| Claystone | 12.00 | 22.00 | 10.10 | 0.27 | 0.28 | 8.17 | 6.50 |
An evaluation was conducted on six slopes located in different areas but with similar geometries. The region remains undeveloped and has retained its natural state. By determining the factor of safety (FoS) values at various locations, we aimed to provide a reliable reference for designing slopes to open-pit mines. Figure 6 illustrates the dimensions of the slope modeling used in both the limit equilibrium method (LEM) and the finite element method (FEM). The modeled slope had a height of 60 m, a berm width of 20 m, and an angle of 18 degrees. The crest width was 40 m, and the slope material consisted of andesite rock and clay stone.
For seismic loading, an earthquake factor of 0.3 g was applied in the horizontal direction along the slope. A constant normal load of 50 kN/m2 was applied along the boundary, while a distributed load of 50 kN/m2 represented conditions such as loads from buildings, vehicles, or other human activities that could impact slope stability [33,53]. This load condition was applied to both LEM and FEM analyses at the bench width, ramp, and pit crest of slope. At the study site, the shallow aquifer is situated at a depth of 4 m below the ground surface. Accordingly, in the slope stability model, the piezometric line is defined at 4 m below the ground surface.
For the LEM, the model used 25 slices with a tolerance of 0.005, and the maximum number of iterations was set to 50. For the FEM modeling, the Young’s modulus value for andesite material is 20.40 GPa, and for claystone material it is 10.10 GPa. These values were obtained from the results of the GSI data processing with RocLab V 1.0. Poisson’s ratio was also set to 0.3 for andesite material and 0.27 for claystone material. The FEM model allowed for a maximum of 500 iterations, with a tolerance of 0.001. The mesh type was graded and consisted of six-noded triangular elements.
Figure 7 presents the results of the factor of safety (FoS) model, derived using the limit equilibrium method (LEM) and the Fellenius approach. The FoS values range from 1.24 to 2.40. The FoS value for Slope 1 is 1.24, as shown in Figure 7a. Similarly, the FoS value for Slope 2 is 2.03, as shown in Figure 7b, while Slope 3 has an FoS value of 1.99, as shown in Figure 7c. The FoS value for Slope 4 is 1.53, as shown in Figure 7d. For Slope 5, the highest FoS value of 2.40 is obtained, as shown in Figure 7e. Finally, the FoS value for Slope 6 is 1.64, as shown in Figure 7f.
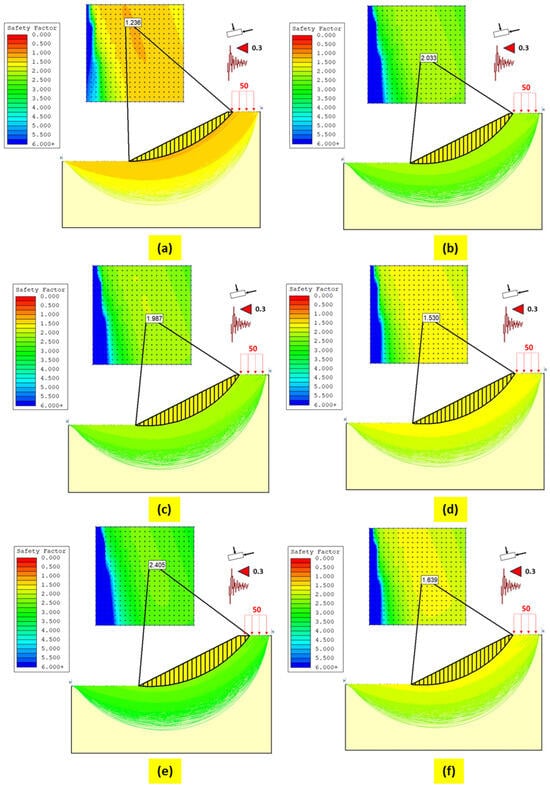
Figure 7.
FoS based on the limit equilibrium method (LEM) for (a) Slope 1; (b) Slope 2; (c) Slope 3; (d) Slope 4; (e) Slope 5; and (f) Slope 6.
The factor of safety (FoS) value derived from RS2 version 11, processed using the finite element method (FEM), is presented in Figure 8. The calculated slope FoS value corresponds to the critical strength reduction factor (SRF) and is accompanied by data on the slope displacement. The bar graph illustrates variations in the total displacement for each slope. The FoS value for Slope 1 is 1.59, as shown in Figure 8a. Slope 2 has an FoS value of 3.11, as depicted in Figure 8b. For Slope 3, the FoS value is 2.3, as shown in Figure 8c. The FoS value for Slope 4 is 1.96, as shown in Figure 8d. Slope 5 exhibits the highest FoS value at 3.27, as shown in Figure 8e. For Slope 6, the FoS value is 2.08, as shown in Figure 8f. The lower the displacement value of a slope, the greater its stability. When the critical displacement surpasses 50 mm, the slope is anticipated to collapse, resulting in significant structural damage [13]. In the FEM, the factor of safety (FoS) can be determined by analyzing the critical strength reduction factor (SRF) for each slope. Details of the displacement for each slope are derived from the relationship between the strength reduction factor (SRF) and the total maximum displacement, as shown in Figure 9.
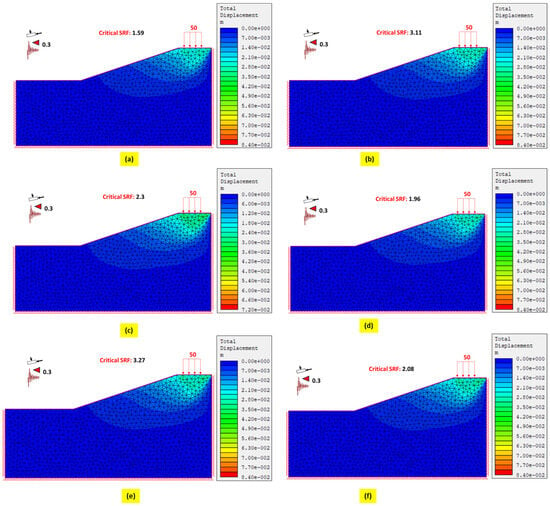
Figure 8.
FoS based on the finite element method (FEM) for (a) Slope 1; (b) Slope 2; (c) Slope 3; (d) Slope 4; (e) Slope 5; and (f) Slope 6.
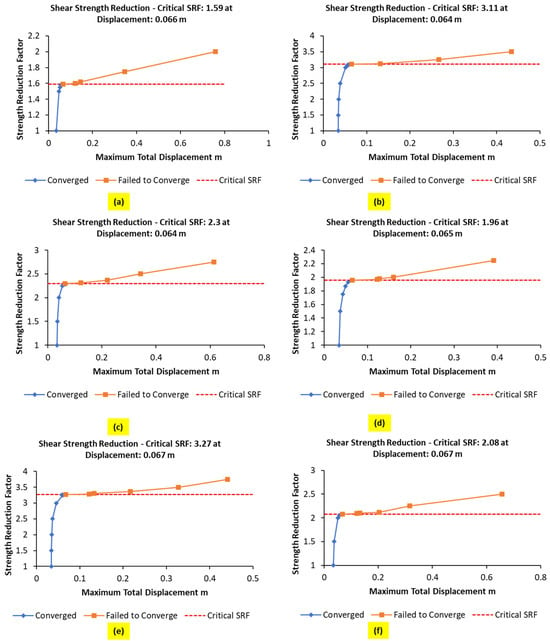
Figure 9.
Critical SRF and displacement for (a) Slope 1; (b) Slope 2; (c) Slope 3; (d) Slope 4; (e) Slope 5; and (f) Slope 6.
Figure 9 illustrates the relationship between the maximum total displacement (in meters) and the strength reduction factor (SRF). The blue line represents the converged zone, while the orange line indicates the non-converged zone. The dotted red line represents the SRF critical limit. The intersection of the converged zone, the non-converged zone, and the critical SRF, when extended to the X-axis, determines the displacement value for the slope. The displacement for Slope 1 is 0.066 m, as depicted in Figure 9a. The displacement values for Slopes 2 and Slope 3 are 0.064 m, as shown in Figure 9b and Figure 9c, respectively. The displacement for Slope 4 is 0.065 m, as shown in Figure 9d, while Slope 5 and Slope 6 exhibit the highest value at 0.067 m, as shown in Figure 9e,f. These results reveal that Slope 5 and Slope 6 have the highest displacement value at 0.067 m, whereas Slope 2 and Slope 3 have the lowest value at 0.064 m.
Table 5 presents a summary of the data comparing the FoS values between the LEM and FEM. The average FoS value for the LEM, based on the Fellenius method, is 1.81. According to the Bishop simplified method, the average FoS is 1.90. The Janbu corrected method yields an average FoS of 1.88, while the Spencer method produces an average FoS of 1.91. The Lowe–Karfiath method calculates an average FoS of 1.87, and the Morgenstern–Price method determines an average FoS of 1.90. In contrast, the FEM yields a significantly higher average FoS of 2.39.

Table 5.
Factor of safety (FoS) values derived from the LEM and FEM.
The coefficient of variation (CoV) for the LEM varies slightly across the methods, with the Fellenius method yielding a CoV of 22.49, the Bishop simplified method producing a CoV of 23.26, and the Janbu corrected method showing a CoV of 23.19. The Spencer, Lowe–Karfiath, and Morgenstern–Price methods result in CoVs of 23.43, 23.18, and 23.30, respectively. In contrast, the CoV for the FEM is higher at 27.95.
The findings show that, for all six slopes, the FoS values exceed 1.1; this suggests that all six slopes, designed with a uniform geometry, are in a stable condition. Consequently, the FEM provides higher FoS values than the LEM due to its superior accuracy in representing actual slope conditions. Additionally, while the LEM assumes a uniform or simplified stress distribution along the failure plane, the FEM computes a more detailed and realistic stress distribution across the slope, enabling a better identification of critical zones. Moreover, the FEM can model more complex and realistic material geometries and parameters.
Figure 10 presents a linear interpolation plot illustrating the relationship between the Geological Strength Index (GSI), limit equilibrium method (LEM), and finite element method (FEM). Correlation analysis revealed a linear relationship between the FEM FoS and GSI: FEM FoS = 0.038 × GSI + 0.626 (R2 = 0.999). Similarly, the LEM FoS exhibited a linear correlation with the GSI: LEM FoS = 0.022 × GSI + 0.782 (R2 = 0.873). The LEM is simpler and computationally efficient, making it suitable for preliminary analyses with conservative results. In contrast, the FEM provides higher accuracy and detailed insights, making it preferable for complex analyses requiring an in-depth understanding of material behavior. The GSI serves as a critical input parameter for both methods, particularly in rock or soil analyses where geological conditions are influential. The plot reveals that the FEM yields higher and more variable values than the LEM, suggesting that the FEM may be more sensitive to material parameter variations governed by the GSI. The LEM values range from 1.2 to 2.4, indicating relatively low safety factors, whereas the FEM values range from 2 to 3, significantly higher than those obtained from the LEM. The GSI values range from 25 to 70. In the color bar, blue represents low FoS values, while yellow indicates relatively high FoS values.
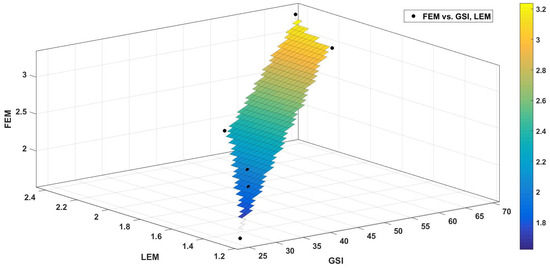
Figure 10.
Comparison of GSI analysis results with LEM and FEM.
To determine the factor of safety (FoS) values presented in Table 6, a comprehensive series of geotechnical analyses was conducted. The first stage involved the collection of fundamental parameters, including rock type characteristics (cohesive and strong andesite, deformation-prone claystone, and their mixtures), slope height variations (10–35 m), and slope angle ranges (20–80°). Material parameters such as cohesion (c), internal friction angle (φ), and specific mass (ρ) were determined through laboratory testing. The FoS was calculated by comparing the ratio of material shear strength to applied shear stress. The analytical method employed was Limit Equilibrium Analysis (Bishop’s Simplified Method), which considers force and moment equilibrium along potential failure surfaces.

Table 6.
The difference between slope height and slope angle determines the FoS value.
For example, iterative calculations for a 10 m-high andesite slope with a slope angle of 65° yielded a factor of safety (FoS) of 2.84. The results were validated via numerical modeling in RocScience SLIDE 6.0, which incorporated slope geometry and material properties. Sensitivity analysis demonstrated the significant influence of geometric parameters on stability. For an andesite slope, increasing the slope angle from 65° to 80° reduced the FoS from 2.84 to 1.62, representing a 43% decrease. In contrast, a 30 m-high claystone slope with a slope angle of 50° yielded an FoS of 0.92, indicating instability. Similarly, a 35 m-high slope with a slope angle of 20° produced an FoS of 1.04, and a 35 m-high slope with a slope angle of 50° produced an FoS of 0.89, further confirming instability. Stability thresholds were defined as follows: FoS > 1.1 (stable), FoS = 1.1 (marginally stable), and FoS < 1.1 (unstable). The results highlight a complex interplay among rock type, height, and slope angle, with claystone showing the highest susceptibility to instability. This methodology enables accurate FoS predictions for slope design by integrating critical variables via combined theoretical and numerical analyses.
The only slope considered is that to the mine level created after excavation operations for open-pit mine optimization. In order to determine the geometry of a safe single slope for mining operations, single slopes are analyzed using a variety of geometries (slope heights and angles). Their constituent materials are also considered, as well as the lithology of andesite rocks. As shown in Table 6, single slopes are examined using various materials, specifically claystone and andesite. If the geometry of a single slope has an FoS > 1.1, then the stability calculation analysis results are deemed stable. For andesite materials, a slope height of 10 m and a slope angle of 80° with an FoS of 1.62 are recommended for a satisfactory single-slope simulation outcome. At a height of 27 m, the appropriate slope is 50 degrees, and, at a height of 30 m, the appropriate slope is 20 degrees, according to the findings of the single-slope study for safe claystone materials. The FoS values of these geometries are 1.34 and 1.27, respectively, as shown in Table 6.
Figure 11 shows the layout of the open-pit mine. Line sections A–B show the overall slope. Claystone and andesite are the two components that make up the overall slope. A design with geometric variations is used to model the materials that comprise the entire slope. If the whole slope geometry analysis calculation achieves an FoS of less than 1.1, then the findings are regarded as unstable. This phenomenon occurs on a slope with a height of 30 m and an inclination of 65°. According to the safe slope simulation results, the overall slope should have an FoS value of 1.23, a slope height of 30 m, and a slope angle of 60° (Table 6). The shape of a mine slope intended for an open pit is depicted in Figure 12.
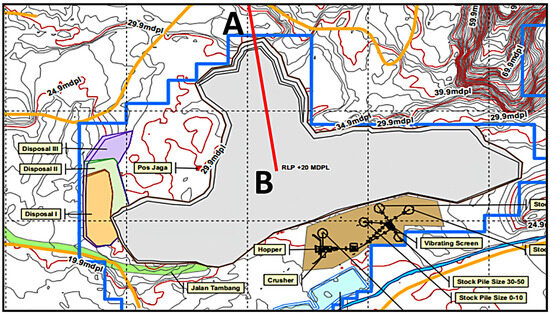
Figure 11.
Open-pit mine design.
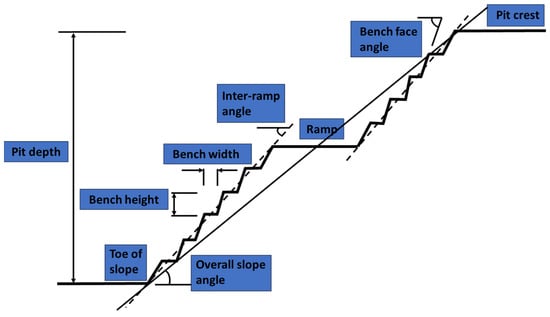
Figure 12.
A representation of the mine slope’s geometry.
Figure 12 illustrates the geometric representation of the mine slope, highlighting key parameters in open-pit mining design. The pit depth (30 m) refers to the vertical distance from the ground surface to the mine base, reflecting the operational scale of mining. A 10 m-wide ramp was constructed to accommodate a Mitsubishi Fuso FN 527 ML dump truck with a hauling capacity of 25 tons. A drainage system was installed along the ramp to prevent erosion during the rainy season. The bench width (10 m) and bench height (10 m) refer to the horizontal width and vertical height of each mining level (bench), which serves as both a working area and a structural support to prevent slope failure. The toe of the slope represents the lowest point where the slope meets the pit base; at Anugerah Berkah Sejahtera, it is located at an elevation of 20 m above sea level (m a.s.l.). The overall slope angle (60°) denotes the average inclination from the crest to the toe of the slope and must be carefully designed to mitigate landslide risks.
Table 7 displays the mining pit design’s geometric outcomes for each parameter. By taking into account the value of the factor of safety (FoS), the geometry of this design is derived from the best simulation results.

Table 7.
Results of mining pit design geometry.
Table 7 outlines the key geometric parameters of the open-pit mine design, which have been optimized to support efficient mining operations. The open-pit mining area spans 2.88 hectares (Ha), representing the total extractable zone. Each bench has a height of 10 m, with a berm width of 10 m, serving as a critical buffer to maintain slope stability and operational safety. The single-slope bench face has an 80-degree inclination, indicating a steep design, while the overall slope angle of 60 degrees was selected to ensure long-term pit stability.
In terms of road geometry, the ramp width of 10 m was designed to accommodate heavy equipment movement. The haulage distance to the disposal area and soil stockpile ranges between 300 and 350 m, while the distance to the ROM stockpile is approximately 200–250 m, reflecting efficient material transport logistics. The maximum road grade is 8%, while a 2% cross-slope ensures effective surface drainage. To enhance vehicle stability during turns, a 4% superelevation and a 20 m turning radius were implemented, enabling safe heavy equipment maneuvering. Overall, this design reflects a balanced consideration of operational efficiency, slope stability, and safety factors, thereby ensuring smooth mining operations.
A landslide will occur if the slope’s angle is too steep because the shear force of the rock or soil will be greater than its resistance. An excessively high bench may result in overload at the slope’s base. Landslides are more likely to occur if the properties of the rocks or soil are not considered in the planning. Because of this, avalanches resulting from open-pit mining must be taken into account, both in terms of height and slope.
The following are a few field phenomena associated with the slopes surrounding the study site:
- A tension fracture is present at the slope’s summit. When the material that makes up the slope slides in the direction of the pit, a crack is created. The likelihood of slope instability will increase if rainwater fills the crevice.
- A tiny section of the crest is present and slopes vertically. This is visually noticeable near the slope’s summit, indicating partial slope movement.
- Unexpected changes in groundwater conditions, such as seepage at the slope’s base (toe), are caused by rising groundwater or persistent rain. As a result, the water pressure on the slope will increase together with the weight of the slope material.
- At the base of the slope (toe), there is a minor collapse. As a result, the material on it will overhang and may also collapse.
5. Conclusions
Comprehensive analysis demonstrates that andesite specimens exhibit an average uniaxial compressive strength of 26.0 MPa (SD = 1.46 MPa, CoV = 5.63%) and a specific mass of 25.62 kN/m3 (SD = 1.41, CoV = 5.49%). An inverse strength-specific mass correlation (R2 = 0.687) was identified, resulting from microstructural heterogeneity induced by diagenetic processes and weathering. Claystone exhibited significantly reduced strength parameters (c = 0.28 MPa, φ = 8.17°), confirming its classification as a critical weakness zone within slope systems. Geological Strength Index (GSI) values (25–69) and disturbance factor (D = 0.7, corresponding to “Good Blasting” conditions) exerted significant control on Hoek–Brown parameters (mb, s, a) and Mohr–Coulomb derivatives (average cohesion = 1.17 MPa, average φ = 28.51°). Coefficients of variation (CoV) exceeding 35% reflect pronounced geological heterogeneity. Stability assessments verified all six slopes as stable (FoS > 1.24 via LEM; >1.59 via FEM), with the FEM consistently generating higher safety factors (average FoS = 2.39 versus LEM average = 1.81) owing to the enhanced modeling of complex stress distributions and displacement fields. Critical thresholds were determined: slope displacements exceeding 50 mm signify imminent failure, whereas an FoS < 1.1 constitutes instability (as observed in claystone-dominated slopes at 35 m height/50° inclination). Pronounced linear GSI-FoS correlations were established: FEM (FoS = 0.038 × GSI + 0.626; R2 = 0.999) and LEM (FoS = 0.022 × GSI + 0.782; R2 = 0.873). For optimized design, isolated andesite slopes maintain stability at 10 m height/80° inclination (FoS = 1.62), whereas claystone necessitates gentler configurations (e.g., 27 m height/50°; FoS = 1.34). Overall slopes achieve equilibrium between stability and operational efficiency at 60° inclination and 30 m height (FoS = 1.23), attained through key pit geometries: 10 m bench height, 10 m berm width, and 10 m ramp width featuring 8% grade with 4% superelevation. Practical recommendations included prioritizing the FEM for critical slopes with material variability or seismic loads, avoiding oversteepening (>60°) in claystone-dominated slopes, and implementing drainage to reduce pore pressure, along with the regular monitoring of tension cracks and toe erosion to preempt failure. This study demonstrates that integrating laboratory-derived properties with advanced numerical modeling ensures robust slope designs, balancing safety and economic viability in open-pit mining. The prospective research topic is Long-Term Stability and Climate Effects on Slopes, with a focus on evaluating the impacts of rainfall, freeze–thaw cycles, and seismic activity on slope degradation over extended temporal scales.
Author Contributions
R.A.N.: conceptualization, data curation, visualization, and writing—original draft. G.R. and Y.G.: conceptualization, data curation, methodology, supervision, validation, and writing—original draft. C.Z.: formal analysis, funding acquisition, investigation, methodology, project administration, resources, and software. L.Z., P.K. and V.S.: supervision, validation, and writing—review, and editing. All authors have read and agreed to the published version of the manuscript.
Funding
This research was funded by the National Natural Science Foundation of China, grant number 52174087.
Institutional Review Board Statement
This study was conducted under the Declaration of Helsinki and approved by the Institutional Review Board of the Wuhan University of Technology (School of Resources and Environmental Engineering).
Informed Consent Statement
Informed consent was obtained from all subjects involved in this study.
Data Availability Statement
The data are contained within this article.
Acknowledgments
The authors express their sincere gratitude to the engineers and management at Anugrah Berkah Sejahtera for their invaluable assistance and guidance throughout this project. Their expertise and support significantly contributed to the successful completion of this work.
Conflicts of Interest
The authors declare no conflicts of interest.
References
- Denissova, N.; Nurakynov, S.; Petrova, O.; Chepashev, D.; Daumova, G.; Yelisseyeva, A. Remote Sensing Techniques for Assessing Snow Avalanche Formation Factors and Building Hazard Monitoring Systems. Atmosphere 2024, 15, 1343. [Google Scholar] [CrossRef]
- Thakur, V.; Depina, I.; Degago, S.A.; Alene, G.H.; Oguz, E.A.; Singh, M.; Chandel, A. Landslide Mitigation of Urbanized Slopes for Sustainable Growth: A Summary of Recent Developments in Structural and Non-structural Countermeasures to Manage Water-Triggered Landslides. Indian Geotech. J. 2024, 54, 1751–1766. [Google Scholar] [CrossRef]
- Arrogante-Funes, P.; Bruzón, A.G.; Arrogante-Funes, F.; Ramos-Bernal, R.N.; Vázquez-Jiménez, R. Integration of Vulnerability and Hazard Factors for Landslide Risk Assessment. Int. J. Environ. Res. Public Health 2021, 18, 11987. [Google Scholar] [CrossRef]
- Al-Adhadh, A.R.; Abbas, B.J.; Hamza, A.J. Analysis and Evaluation of Landslide Failure and Using Different Techniques to the Mitigation. IOP Conf. Ser. Mater. Sci. Eng. 2021, 1090, 012008. [Google Scholar] [CrossRef]
- Lan, H.; Zhao, X.; Macciotta, R.; Peng, J.; Li, L.; Wu, Y.; Zhu, Y.; Liu, X.; Zhang, N.; Liu, S.; et al. The cyclic expansion and contraction characteristics of a loess slope and implications for slope stability. Sci. Rep. 2021, 11, 2250. [Google Scholar] [CrossRef] [PubMed]
- WLiu, W.; Sheng, G.; Kang, X.; Yang, M.; Li, D.; Wu, S. Slope Stability Analysis of Open-Pit Mine Considering Weathering Effects. Appl. Sci. 2024, 14, 8449. [Google Scholar] [CrossRef]
- Kolapo, P.; Oniyide, G.O.; Said, K.O.; Lawal, A.I.; Onifade, M.; Munemo, P. An Overview of Slope Failure in Mining Operations. Mining 2022, 2, 350–384. [Google Scholar] [CrossRef]
- Wang, S.; Zhang, Z.; Wang, C. Prediction of stability coefficient of open-pit mine slope based on artificial intelligence deep learning algorithm. Sci. Rep. 2023, 13, 12017. [Google Scholar] [CrossRef]
- Popescu, F.D.; Andras, A.; Radu, S.M.; Brinas, I.; Iladie, C.-M. Numerical Investigation of the Slope Stability in the Waste Dumps of Romanian Lignite Open-Pit Mines Using the Shear Strength Reduction Method. Appl. Sci. 2024, 14, 9875. [Google Scholar] [CrossRef]
- Enge, W.; Jianjun, Z.; Qiyi, L.; Jianle, Y.; Jie, D.; Qingmiao, L.; Jianxian, H. Influence of different mining locations on deformation characteristics of overlying strata on gently anti-dip high-steep mining slope. Sci. Rep. 2024, 14, 23415. [Google Scholar] [CrossRef]
- Durukan, S. Evaluation of the Antecedent Saturation and Rainfall Conditions on the Slope Failure Mechanism Triggered by Rainfalls. Appl. Sci. 2024, 14, 9478. [Google Scholar] [CrossRef]
- Arriola, C.; Aronés, E.; Vega, V.; Esenarro, D.; Salas, G.; Romero, A.; Raymundo, V. Physical Slope Stability: Factors of Safety Under Static and Pseudo-Static Conditions. Infrastructures 2025, 10, 53. [Google Scholar] [CrossRef]
- Simangunsong, G.M.; Prassetyo, S.H.; Pinem, R.S. Relationship between blasting operation and slope stability: A case study at Borneo Indo Bara open pit coal mine. Sci. Rep. 2024, 14, 29890. [Google Scholar] [CrossRef]
- Guo, L.; Chen, G.; Ding, L.; Zheng, L.; Gao, J. Numerical simulation of full desiccation process of clayey soils using an extended DDA model with soil suction consideration. Comput. Geotech. 2022, 153, 105107. [Google Scholar] [CrossRef]
- Guo, Z.; Chen, L.; Yin, K.; Shrestha, D.P.; Zhang, L. Quantitative risk assessment of slow-moving landslides from the viewpoint of decision-making: A case study of the Three Gorges Reservoir in China. Eng. Geol. 2020, 273, 105667. [Google Scholar] [CrossRef]
- Guo, J.; Wu, Z.-W.; Liu, K. Stability analysis of soft–hard-interbedded anti-inclined rock slope. Sci. Rep. 2023, 13, 1643. [Google Scholar] [CrossRef] [PubMed]
- Huang, X.; Wang, C.; Wang, T.; Zhang, Z. Quantification of Geological Strength Index Based on Discontinuity Volume Density of Rock Masses. Int. J. Heat Technol. 2015, 33, 255–261. [Google Scholar] [CrossRef]
- Bezie, G.; Chala, E.T.; Jilo, N.Z.; Birhanu, S.; Berta, K.K.; Assefa, S.M.; Gissila, B. Rock slope stability analysis of a limestone quarry in a case study of a National Cement Factory in Eastern Ethiopia. Sci. Rep. 2024, 14, 18541. [Google Scholar] [CrossRef]
- Li, C.; Zhao, X.; Xu, X.; Qu, X. Study on the differences between Hoek–Brown parameters and equivalent Mohr–Coulomb parameters in the calculation slope critical acceleration and permanent displacement. Sci. Rep. 2024, 14, 15128. [Google Scholar] [CrossRef]
- Li, L.; Yang, G.; Liu, H.; Song, S.; Fan, H. A quantitative model for the geological strength index based on attribute mathematics and its application. Bull. Eng. Geol. Environ. 2021, 80, 6897–6911. [Google Scholar] [CrossRef]
- You, L.K.; Rahim, I.A. Prediction of Rock Mass Properties, Tunnel Stability and Support Pressure by Geological Strength Index (Gsi) in Crocker Formation: A Case Study. Geol. Behav. 2017, 1, 31–33. [Google Scholar] [CrossRef]
- Sengani, F.; Mulenga, F. Application of Limit Equilibrium Analysis and Numerical Modeling in a Case of Slope Instability. Sustainability 2020, 12, 8870. [Google Scholar] [CrossRef]
- Abdulai, M.; Sharifzadeh, M. Probability Methods for Stability Design of Open Pit Rock Slopes: An Overview. Geosciences 2021, 11, 319. [Google Scholar] [CrossRef]
- Azarafza, M.; Akgün, H.; Ghazifard, A.; Asghari-Kaljahi, E.; Rahnamarad, J.; Derakhshani, R. Discontinuous rock slope stability analysis by limit equilibrium approaches—A review. Int. J. Digit. Earth 2021, 14, 1918–1941. [Google Scholar] [CrossRef]
- Faramarzi, L.; Zare, M.; Azhari, A.; Tabaei, M. Assessment of rock slope stability at Cham-Shir Dam Power Plant pit using the limit equilibrium method and numerical modeling. Bull. Eng. Geol. Environ. 2016, 76, 783–794. [Google Scholar] [CrossRef]
- Yang, Y.-S.; Yeh, H.-F.; Ke, C.-C.; Wei, L.-W.; Chen, N.-C. The Evaluation of Rainfall Warning Thresholds for Shallow Slope Stability Based on the Local Safety Factor Theory. Geosciences 2024, 14, 274. [Google Scholar] [CrossRef]
- Chuaiwate, P.; Jaritngam, S.; Panedpojaman, P.; Konkong, N. Probabilistic Analysis of Slope against Uncertain Soil Parameters. Sustainability 2022, 14, 14530. [Google Scholar] [CrossRef]
- Nata, R.A.; Ren, G.; Ge, Y.; Fadhly, A.; Muzer, F.; Ramadhan, M.F.; Syahmer, V. The Role of LEM in Mine Slope Safety: A Pre- and Post-Blast Perspective. Safety 2024, 10, 101. [Google Scholar] [CrossRef]
- Irwan, A.G.; Wiati, I.T. Reconstruction of Natural Slope Stability by Limit Equilibrium Methods and Finite Element Methods. DTS 2023, 16, 43–49. [Google Scholar] [CrossRef]
- Leshchinsky, B.; Ambauen, S. Limit Equilibrium and Limit Analysis: Comparison of Benchmark Slope Stability Problems. J. Geotech. Geoenviron. Eng. 2015, 141, 04015043. [Google Scholar] [CrossRef]
- Fu, B.; Ji, H.; Pei, J.; Wei, J. Numerical Computation-Based Analysis of Blasting Vibration Effects and Slope Stability in an Open-Pit Quarry. Fire 2024, 7, 420. [Google Scholar] [CrossRef]
- Ronda, G.; Santi, P.; Pope, I.E.; Luque, A.L.V.; Paria, C.J.B. Linking Inca Terraces with Landslide Occurrence in the Ticsani Valley, Peru. Geosciences 2024, 14, 315. [Google Scholar] [CrossRef]
- Nata, R.A.; Ren, G.; Fadhilah; Syahmer, V. Sustainable Slope Stability Analysis Using Finite Element Method on Clay and Andesite Materials. paperASIA 2024, 40, 192–206. [Google Scholar] [CrossRef]
- Göktepe, F.; Keskin, I. A Comparison Study between Traditional and Finite Element Methods for Slope Stability Evaluations. J. Geol. Soc. India 2018, 91, 373–379. [Google Scholar] [CrossRef]
- Hosseini, S.; Astaraki, F.; Imam, S.M.R.; Chalabii, J.; Movahedi Rad, M. Investigation of Shear Strength Reduction Method in Slope Stability of Reinforced Slopes by Anchor and Nail. Buildings 2024, 14, 432. [Google Scholar] [CrossRef]
- Rusmanawati, D.; Indrawan, I.G.B.; Setiawan, H. Slope Stability Analysis Using Finite Element Method on Tepus-Jerukwudel Road. ARCEE 2022, 3, 150–162. [Google Scholar] [CrossRef]
- Amalia, A.R.; Amalita, N.; Kurniawati, Y.; Martha, Z. Fuzzy K-Nearest Neighbor to Predict Rainfall in Padang Pariaman District. Unp J. Stat. Data Sci. 2024, 2, 64–70. [Google Scholar] [CrossRef]
- Azmiada, Z.; Elizal, E.; Mulyadi, A. The Relationship of The Distribution of Sea Surface Temperature with Rainfall and Wind in The Waters of West Sumatra. Asian J. Aquat. Sci. 2024, 7, 33–43. [Google Scholar] [CrossRef]
- Yusra, R.D.; Afdal, A. Pendugaan Instrusi Air Laut Terhadap Air Tanah Dangkal di Pantai Kecamatan Pariaman Utara Kota Pariaman. J. Fis. Unand 2022, 12, 35–41. [Google Scholar] [CrossRef]
- Ulni, A.Z.P.; Rezki, A.; Juita, E.; Zuriyani, E. Sosialisasi Dampak Konversi Lahan terhadap Perubahan Iklim di Nagari Sungai Durian Padang Pariaman. INCOME Indones. J. Community Serv. Engagem. 2023, 2, 86–93. [Google Scholar] [CrossRef]
- Dahrin, D.; Amir, H.; Suryanata, P.B.; Bijaksana, S.; Fajar, S.J.; Ibrahim, K.; Harlianti, U.; Arisbaya, I.; Pebrian, M.Q.; Rahman, A.A.; et al. Subsurface structures of Sianok Segment in the GSF (Great Sumatran Fault) inferred from magnetic and gravity modeling. Front. Earth Sci. 2022, 10, 1012286. [Google Scholar] [CrossRef]
- Trimulyati, W.; Putra, A. Identifikasi Struktur Bawah Permukaan Gunung Tandikat Menggunakan Metode Gravitasi Berdasarkan Data Satelit. J. Fis. Unand 2022, 11, 366–372. [Google Scholar] [CrossRef]
- Widyani, K.; Ridwansyah, I.; Syahrulyati, T. Paleolimnology analysis: The reconstruction of Lake Maninjau with pollen as the proxy. IOP Conf. Ser. Earth Environ. Sci. 2020, 535, 012005. [Google Scholar] [CrossRef]
- C01 Committee, Test Method for Compressive Strength of Hydraulic Cement Mortars (Using 2-in. or [50 mm] Cube Specimens). Available online: https://doi.org/10.1520/C0109_C0109M-21 (accessed on 1 January 2025).
- C09 Committee, Test Method for Relative Density (Specific Gravity) and Absorption of Coarse Aggregate. Available online: https://doi.org/10.1520/C0127-12 (accessed on 1 January 2025).
- Slide_TutorialManual. Available online: https://www.rocscience.com/help/slide2/tutorials/tutorials-overview/quick-start-tutorial (accessed on 5 December 2024).
- Saade, A.; Abou-Jaoude, G.; Wartman, J. Regional-scale co-seismic landslide assessment using limit equilibrium analysis. Eng. Geol. 2016, 204, 53–64. [Google Scholar] [CrossRef]
- Ramadhani, S.; Martini, A.; Chauf, K.; Dwijaka, A.; Bierhofa, M.Z.; Gagaramusu, Y. Slope stability using Simplified Bishop method in Kebun Kopi area Donggala regency, central Sulawesi province. IOP Conf. Ser. Earth Environ. Sci. 2022, 1075, 012027. [Google Scholar] [CrossRef]
- Pandey, B.R.; Knoblauch, H.; Zenz, G. Slope Stability Evaluation Due to Reservoir Draw-Down Using LEM and Stress-Based FEM along with Mohr–Coulomb Criteria. Water 2023, 15, 4022. [Google Scholar] [CrossRef]
- Fang, R.; Deng, L.; Fan, W.; Yang, G.; Tang, D.; Mohammad, A. Research on response characteristics of loess slope and disaster mechanism caused by structural plane extension under excavation. Sci. Rep. 2024, 14, 28700. [Google Scholar] [CrossRef]
- Wu, P.; Wu, H.; Chen, Y. Simulation Accuracy Analysis of Slope Stability Based on Finite Element Shear Strength Reduction (SSR) Method. Int. J. Min. Sci. 2017, 3, 52–59. [Google Scholar] [CrossRef]
- Chang, C.; Zoback, M.D.; Khaksar, A. Empirical relations between rock strength and physical properties in sedimentary rocks. J. Pet. Sci. Eng. 2006, 51, 223–237. [Google Scholar] [CrossRef]
- Nata, R.A.; Ren, G.; Ge, Y.; Tanjung, A.A.; Muzer, F.; Syahmer, V. Finite Element Modeling for Stability Assessment of Sedimentary Rock Slopes. Safety 2024, 10, 70. [Google Scholar] [CrossRef]
Disclaimer/Publisher’s Note: The statements, opinions and data contained in all publications are solely those of the individual author(s) and contributor(s) and not of MDPI and/or the editor(s). MDPI and/or the editor(s) disclaim responsibility for any injury to people or property resulting from any ideas, methods, instructions or products referred to in the content. |
© 2025 by the authors. Licensee MDPI, Basel, Switzerland. This article is an open access article distributed under the terms and conditions of the Creative Commons Attribution (CC BY) license (https://creativecommons.org/licenses/by/4.0/).