Spatiotemporal Dynamics of the Eco-Innovation Level of China’s Marine Economy


Abstract
1. Introduction
- (1)
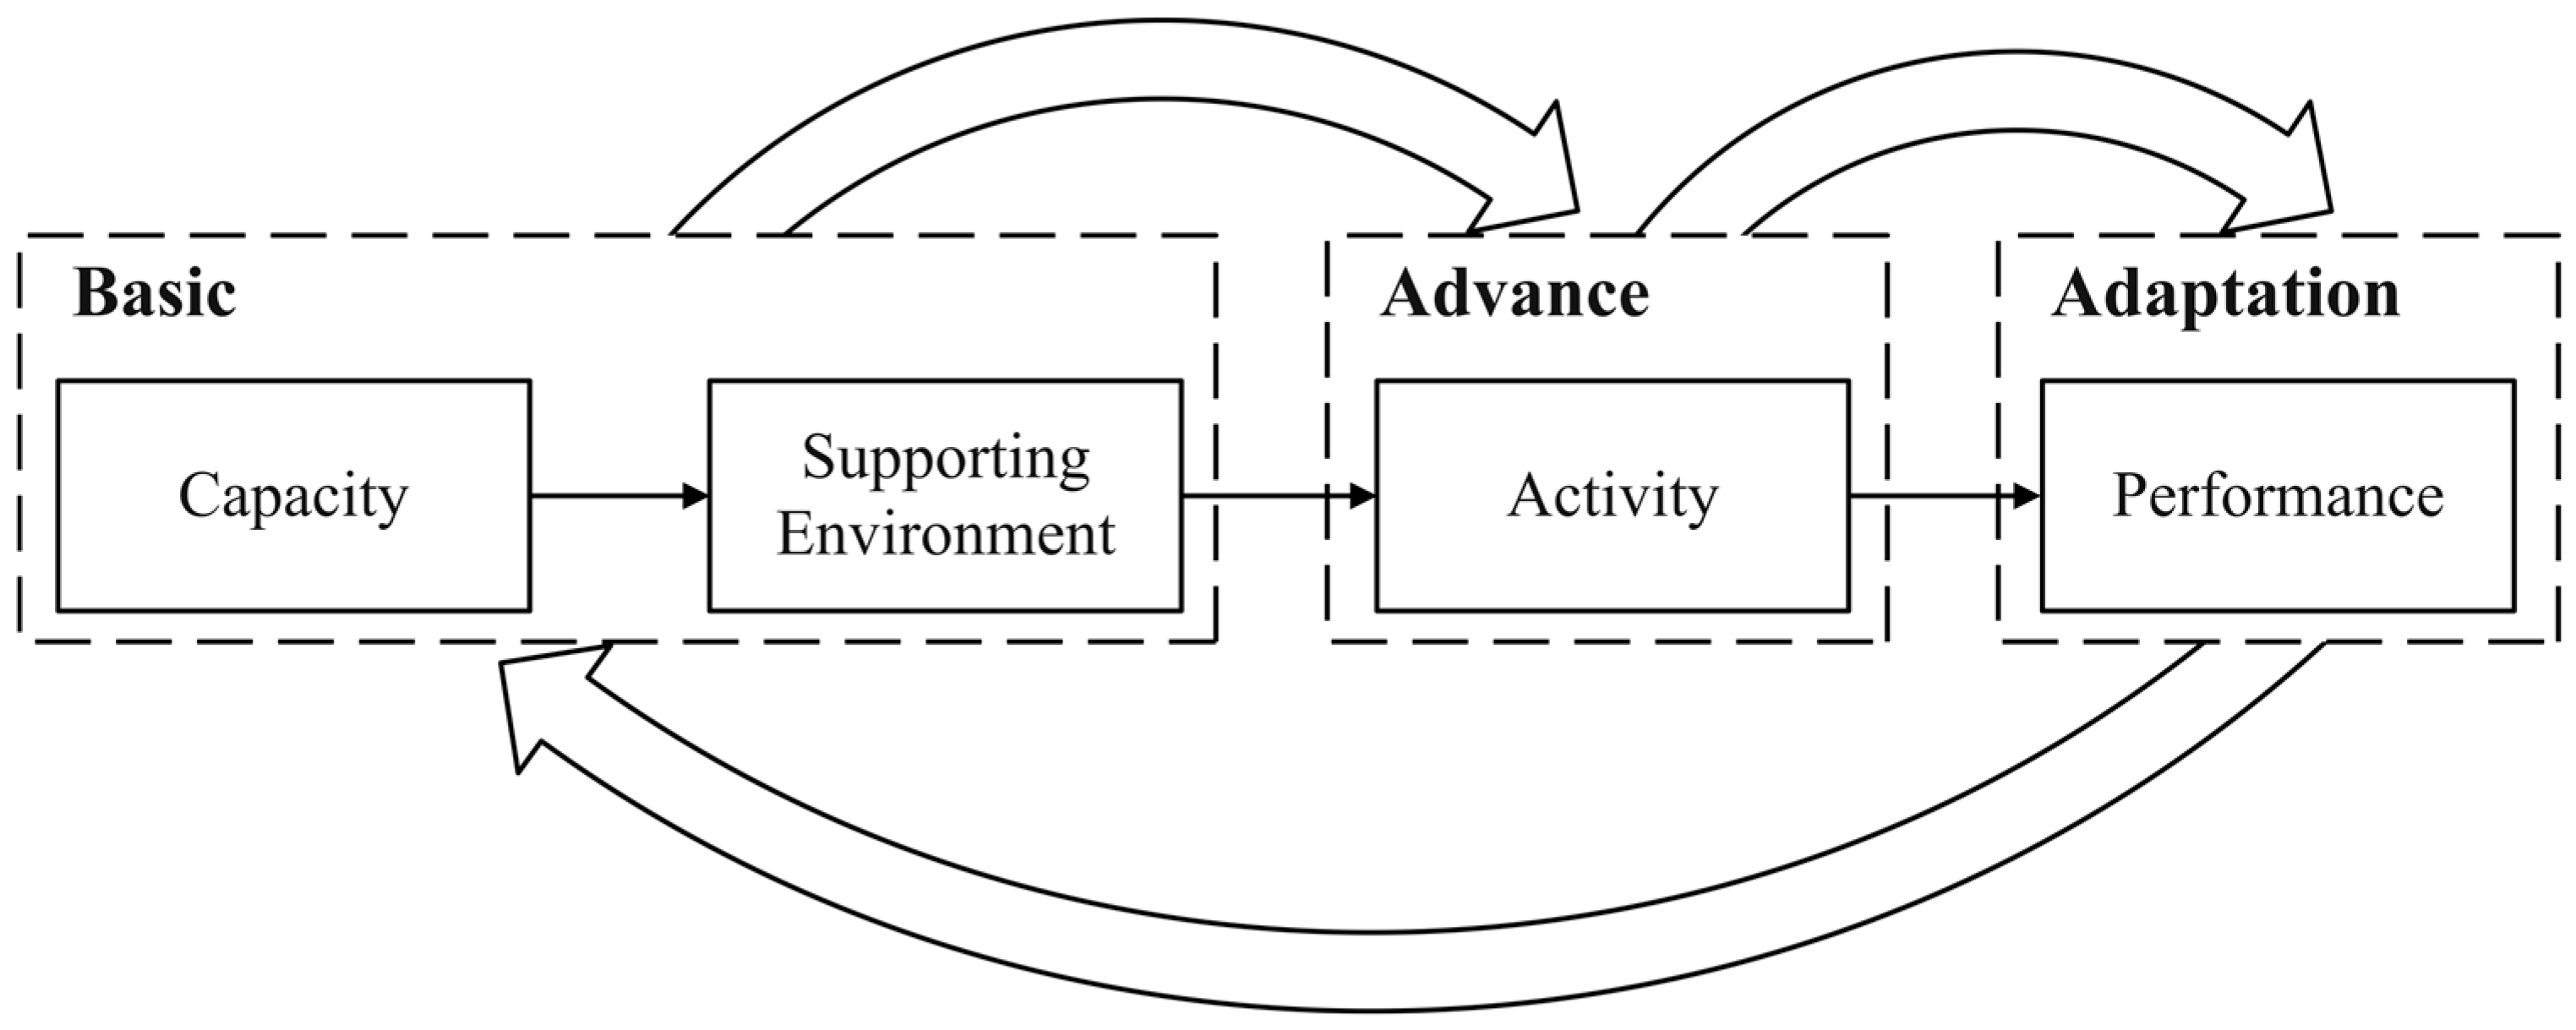
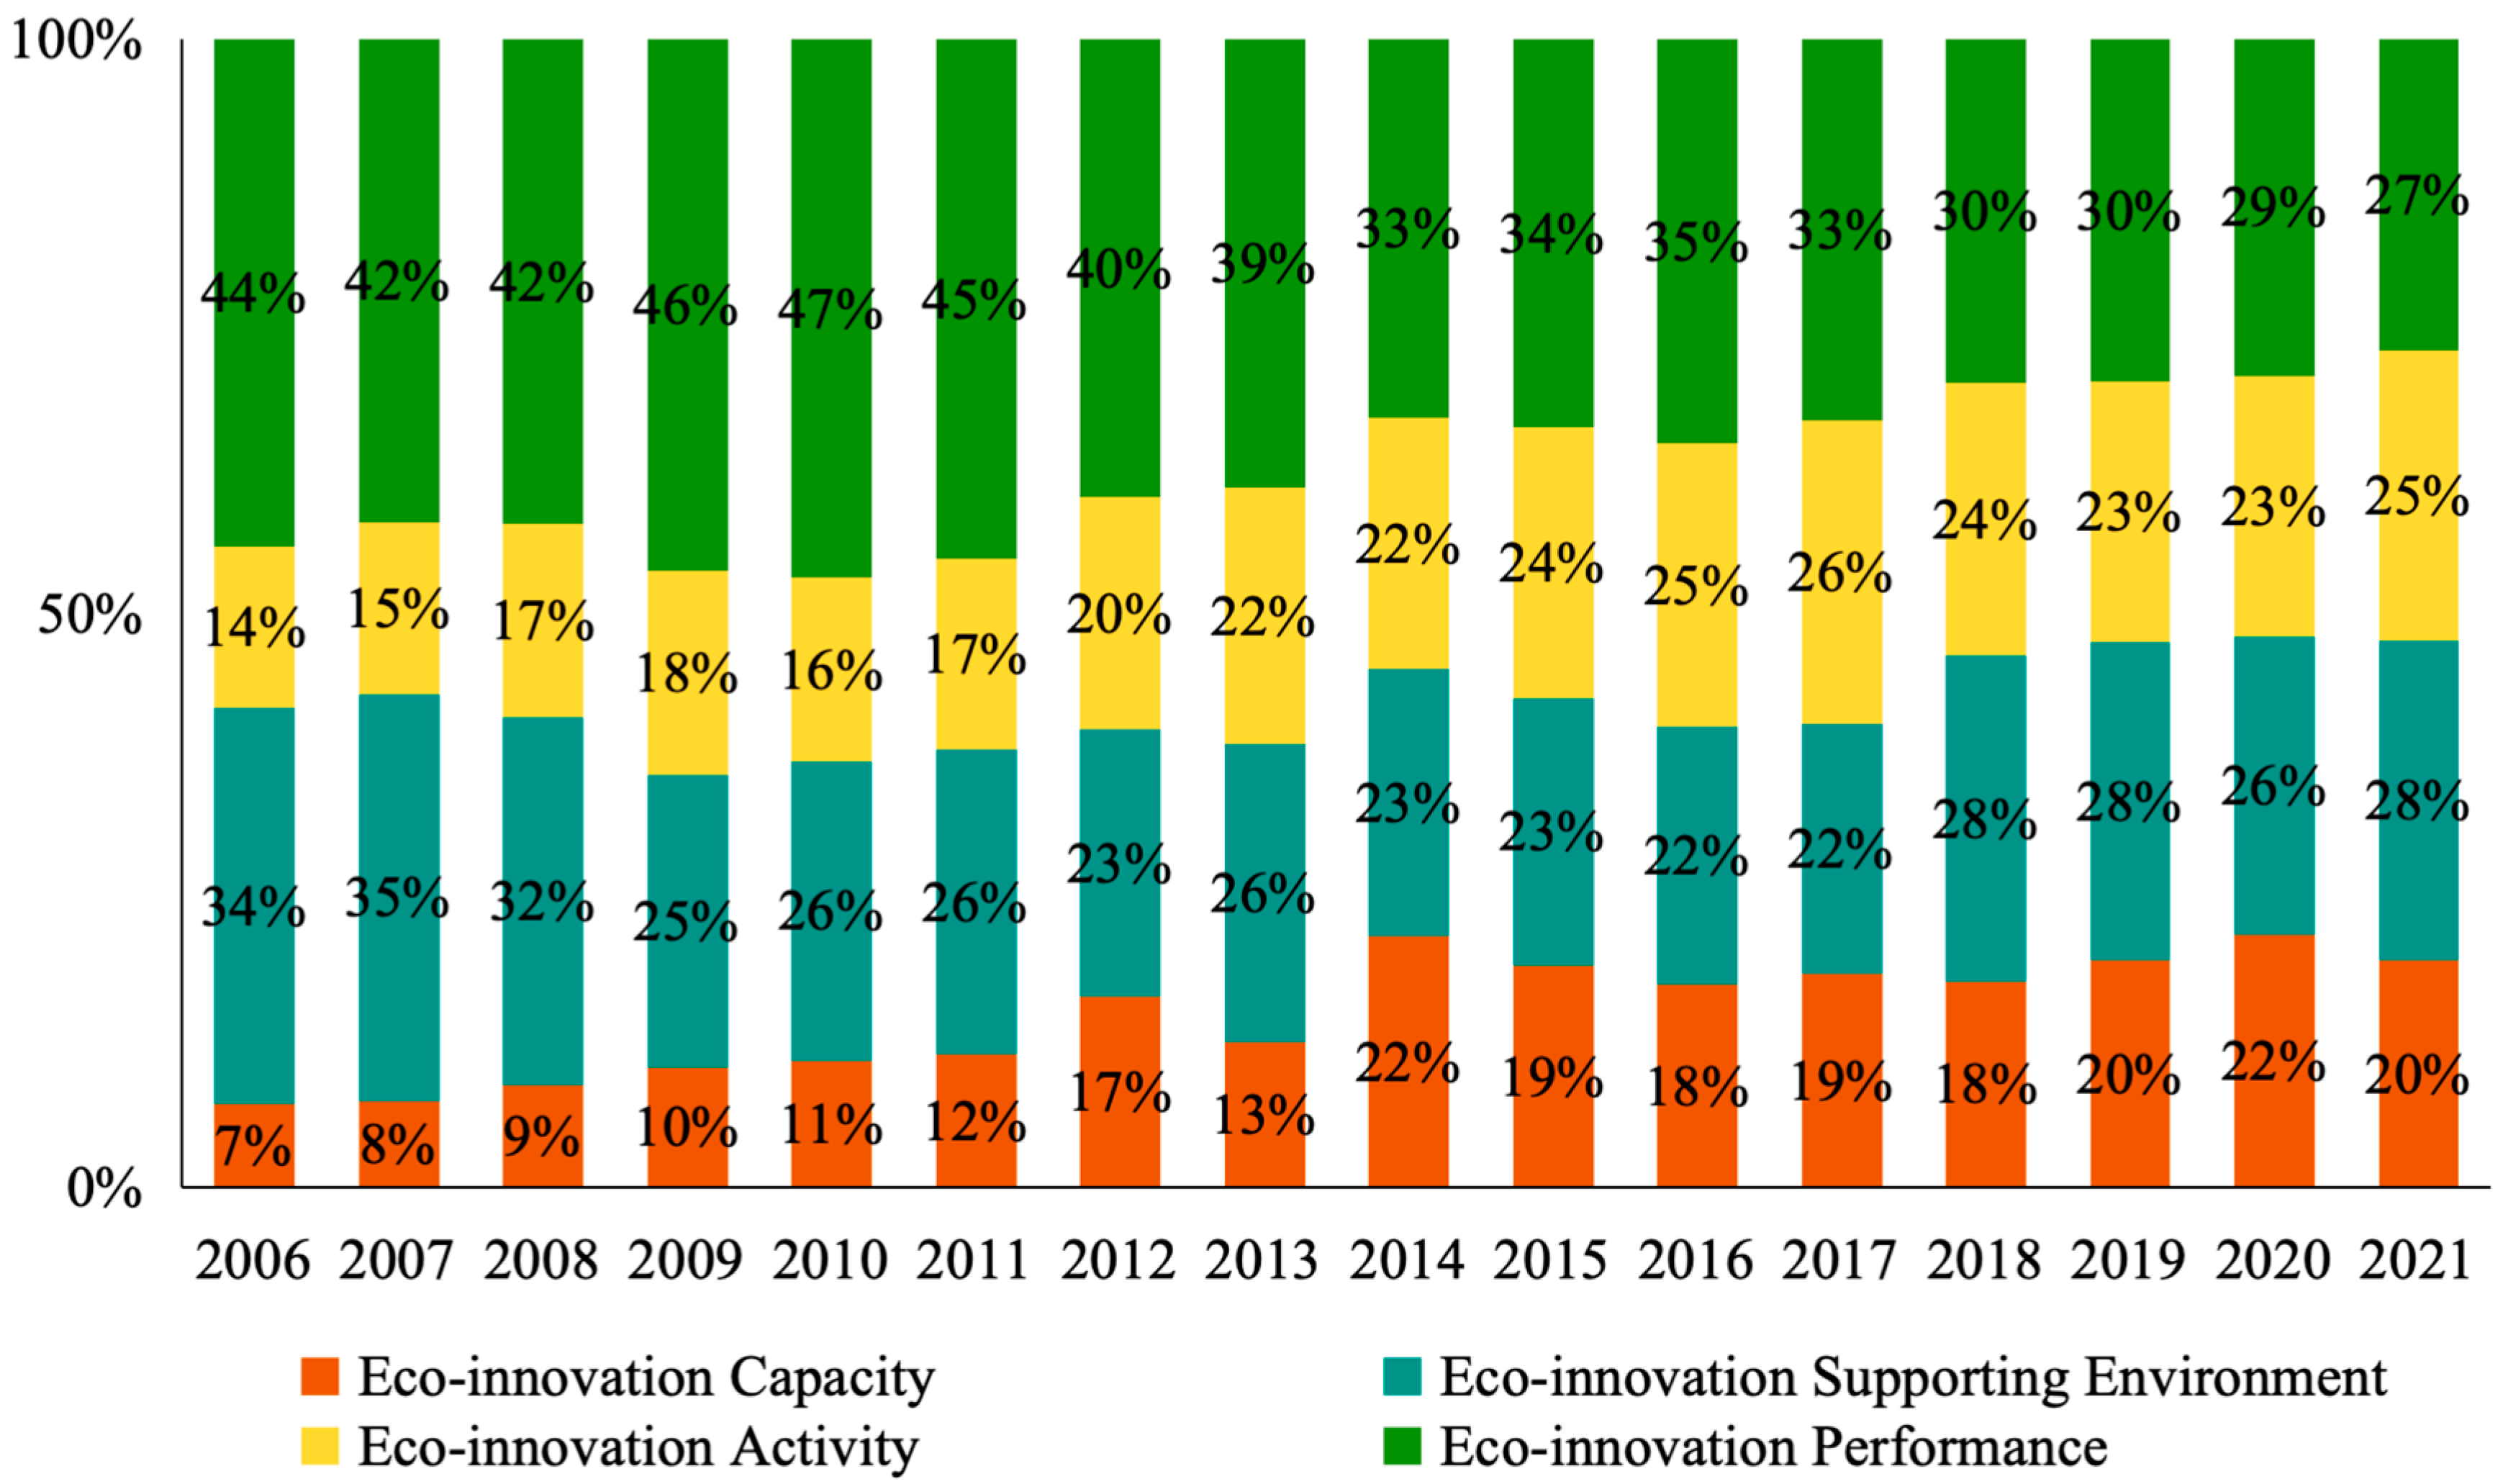
- Based on the three-stage theoretical model of “basic”, “advance”, and “adaptation”, a systematic index system is constructed to assess the level of eco-innovation in the marine economy and explore eco-innovation from four dimensions: capacity, support environment, activities, and performance.
- (2)
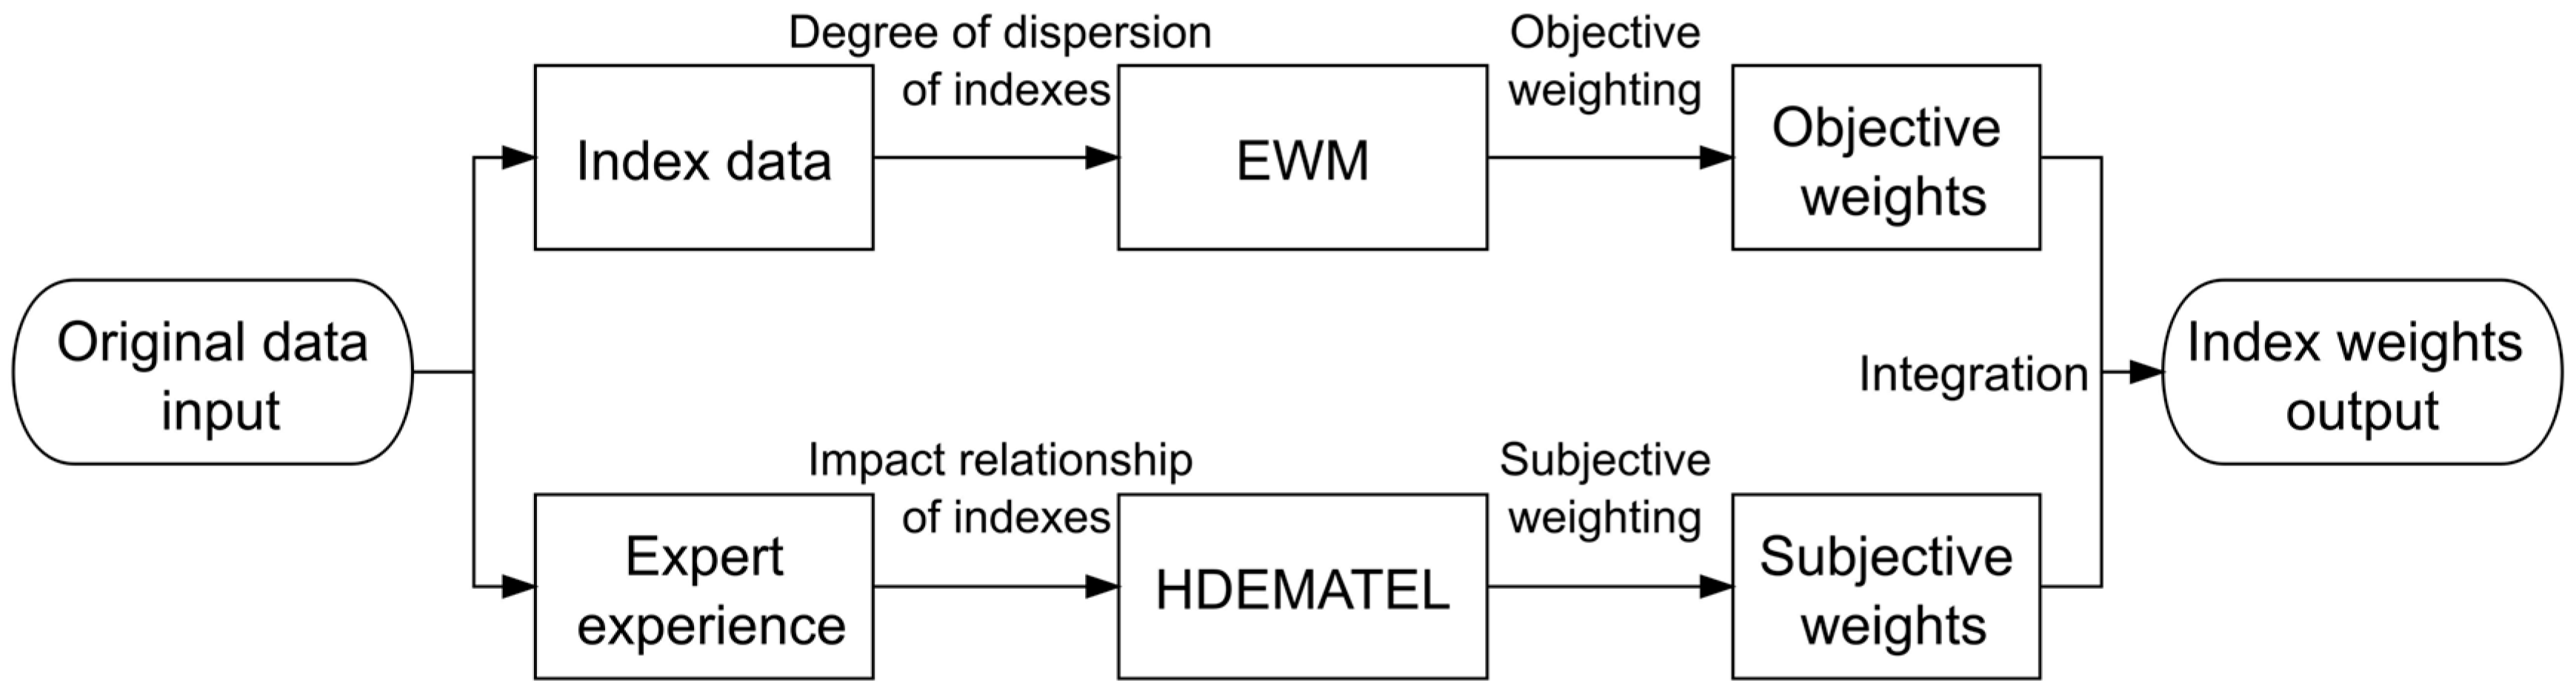
- This paper proposes a new evaluation method combined with objective and subjective properties—the integration EWM-HDEMATEL method—which rebalances subjective and objective judgments while enhancing assessment efficiency.
- (3)
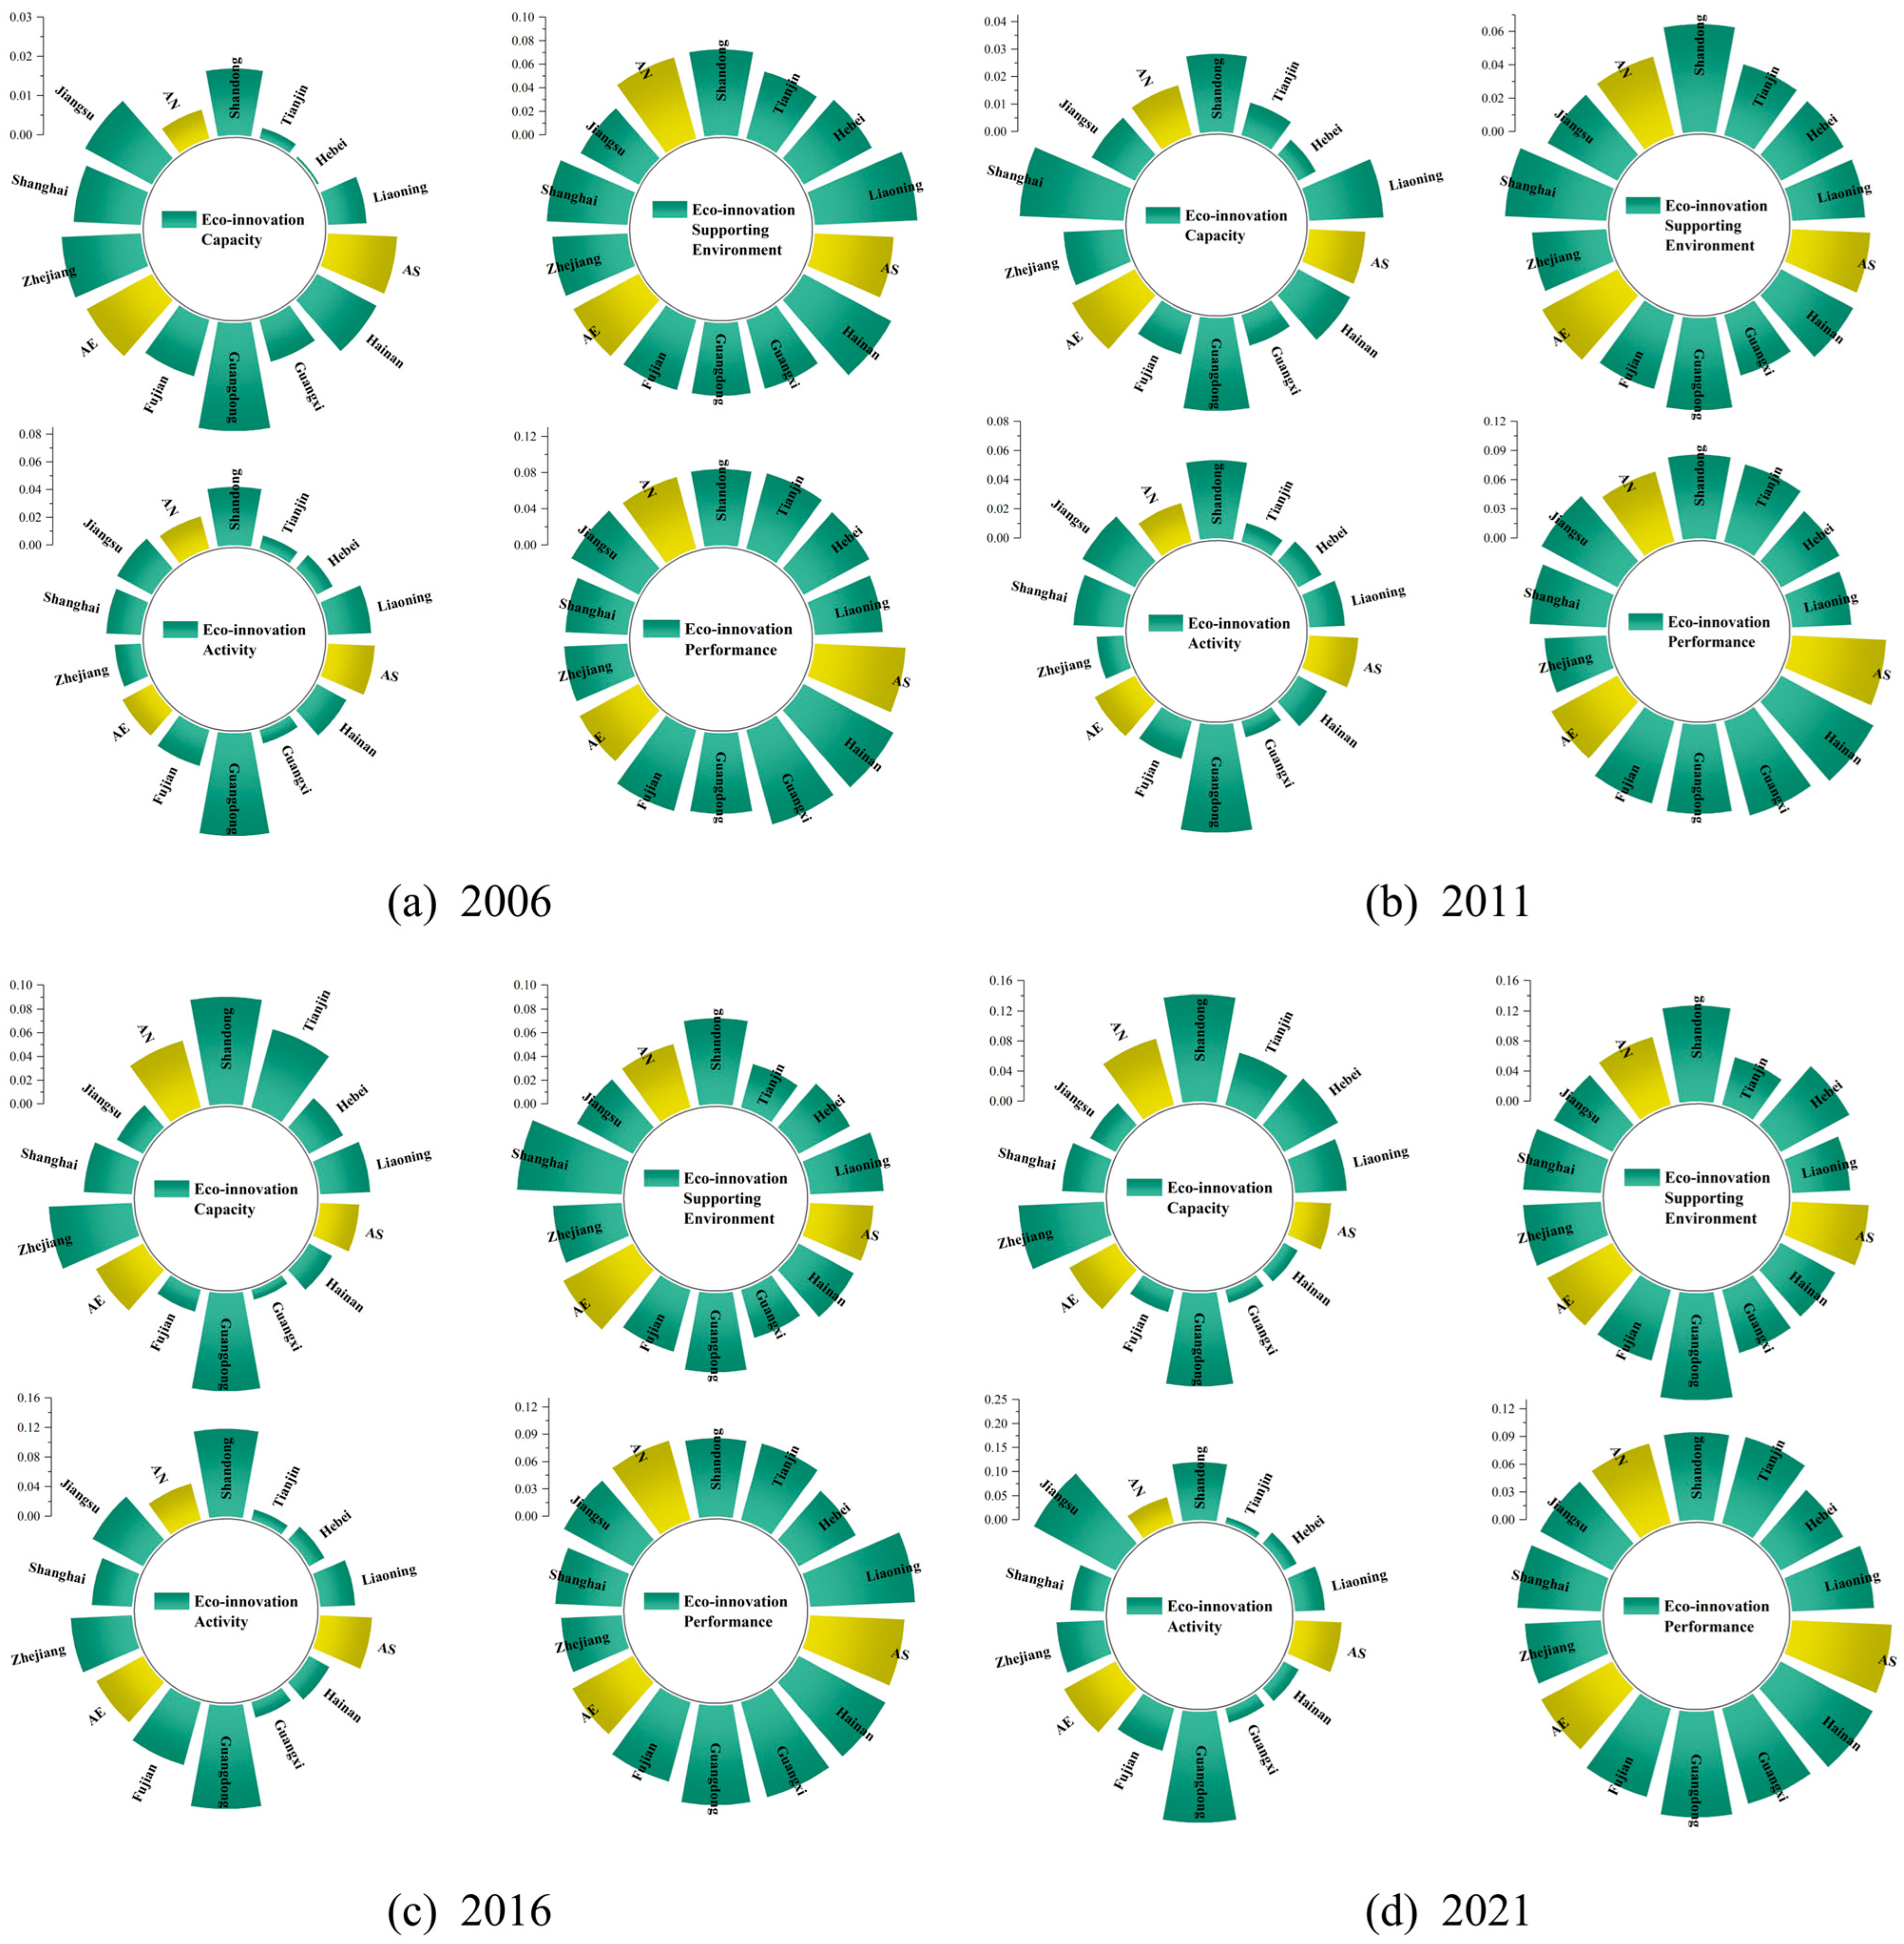
- A detailed spatiotemporal dynamic analysis of the eco-innovation levels in China’s marine economy is conducted from 2006 to 2021. It reveals the evolution trends and spatial distribution characteristics of marine economic eco-innovation levels from both overall and dimensional perspectives as well as from the perspective of the economic circle.
2. Construction of the Evaluation Index System
2.1. Theoretical Model
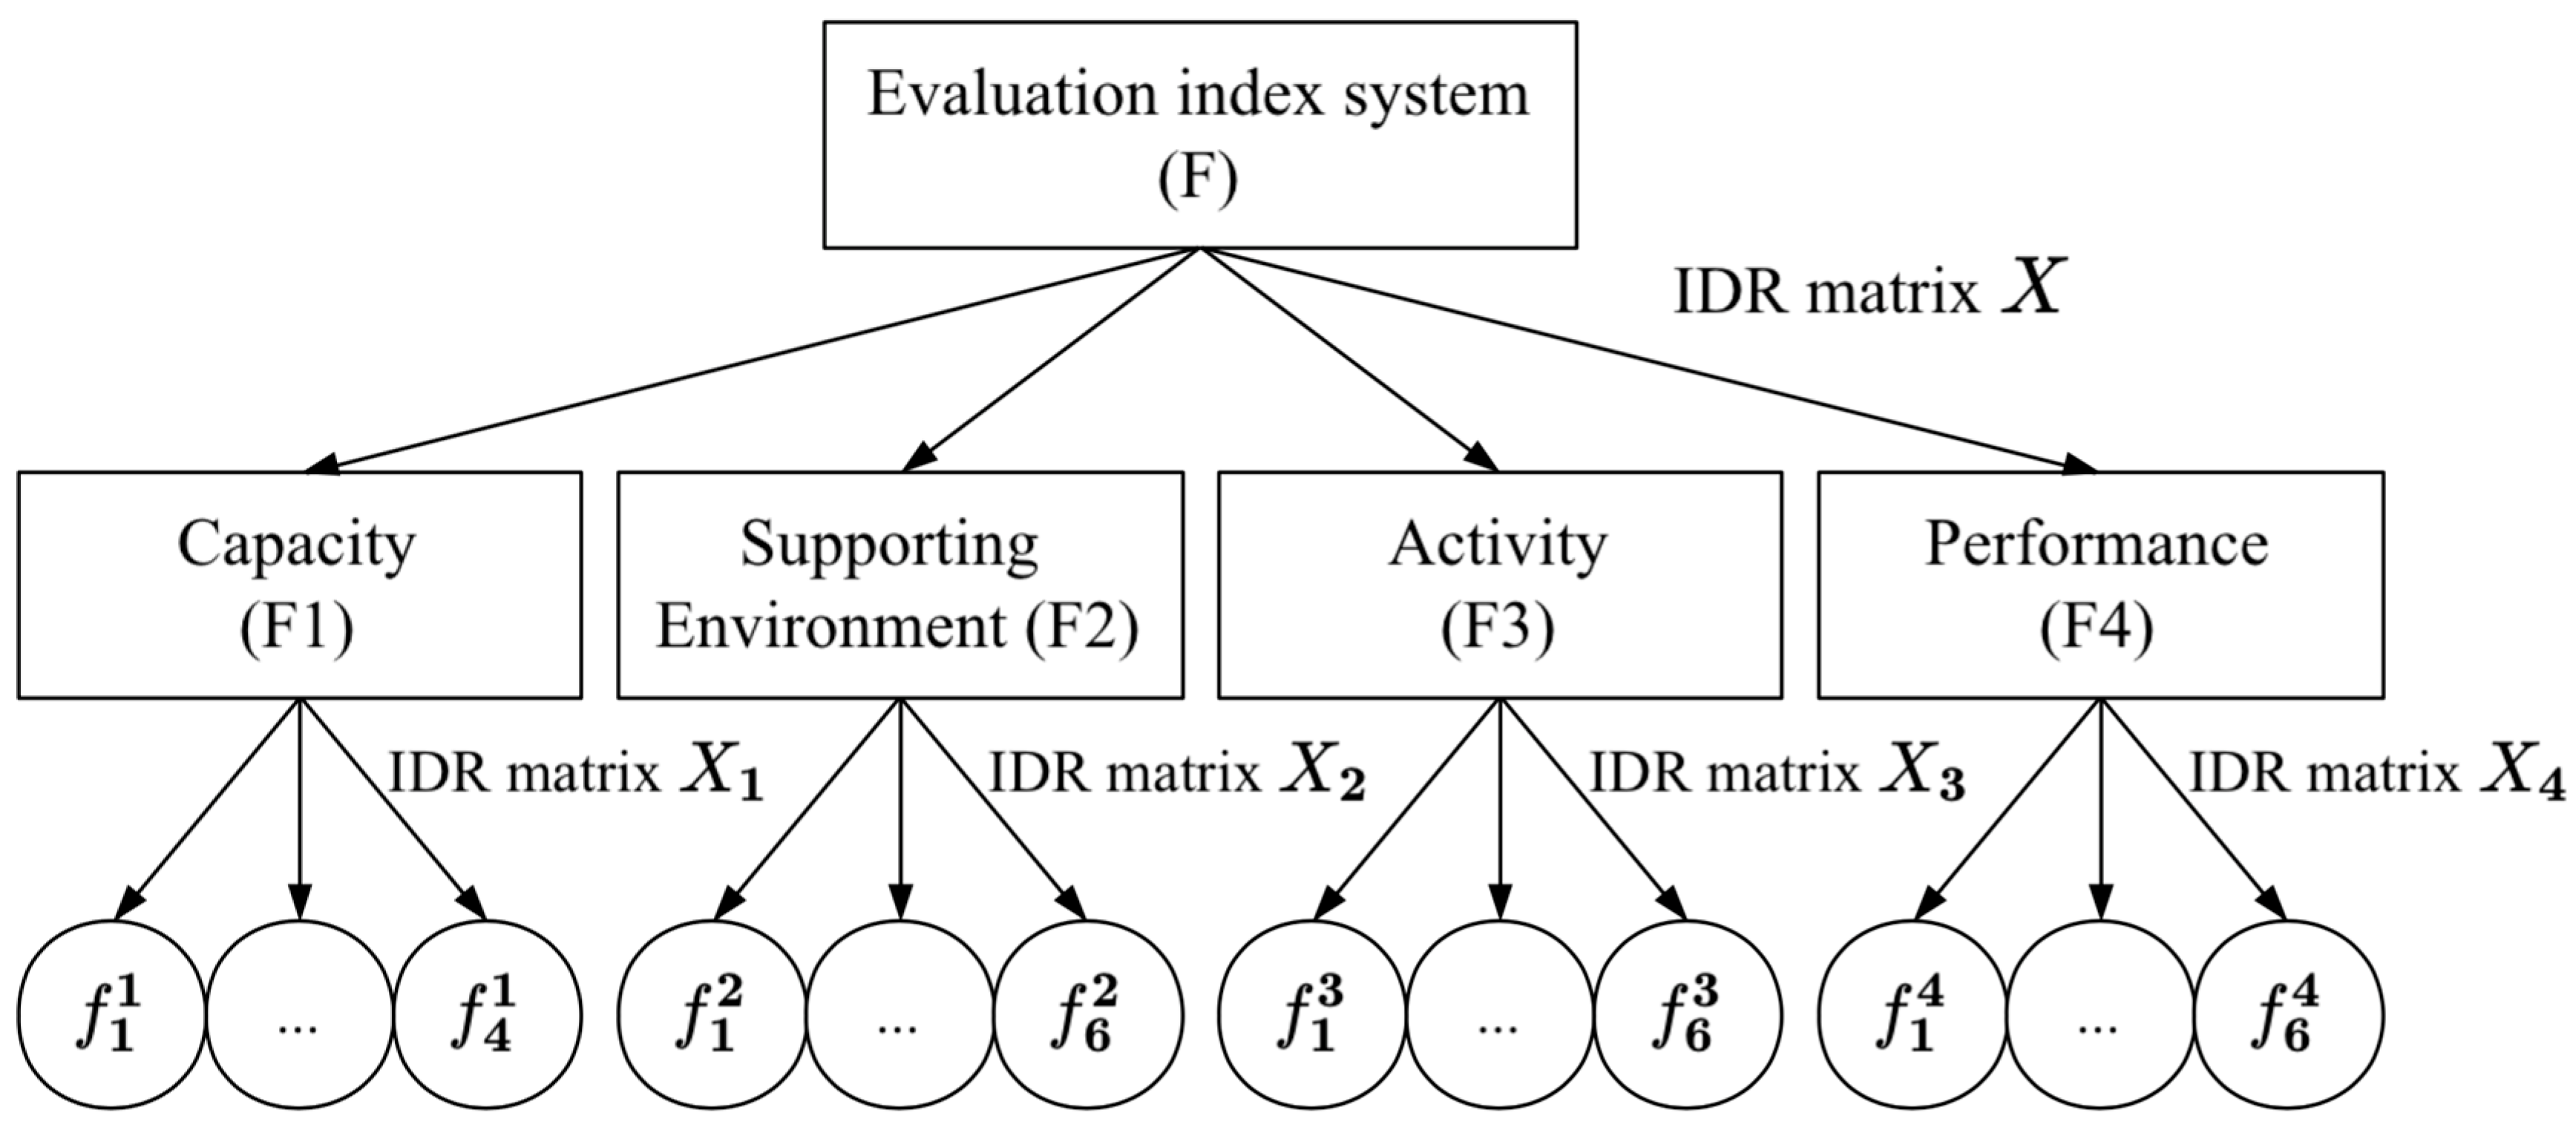
2.2. The Evaluation Index System
3. Materials and Methods
3.1. Research Area and Data Sources
3.2. Determination of Index Weights
3.2.1. Index Data-Driven Objective Weighting
3.2.2. Expert Experience-Driven Subjective Weighting
3.2.3. Integration of Subjective and Objective Weights
3.3. Calculation of the Evaluation Value
4. Results
4.1. Index Weight Analysis
4.2. Temporal Analysis
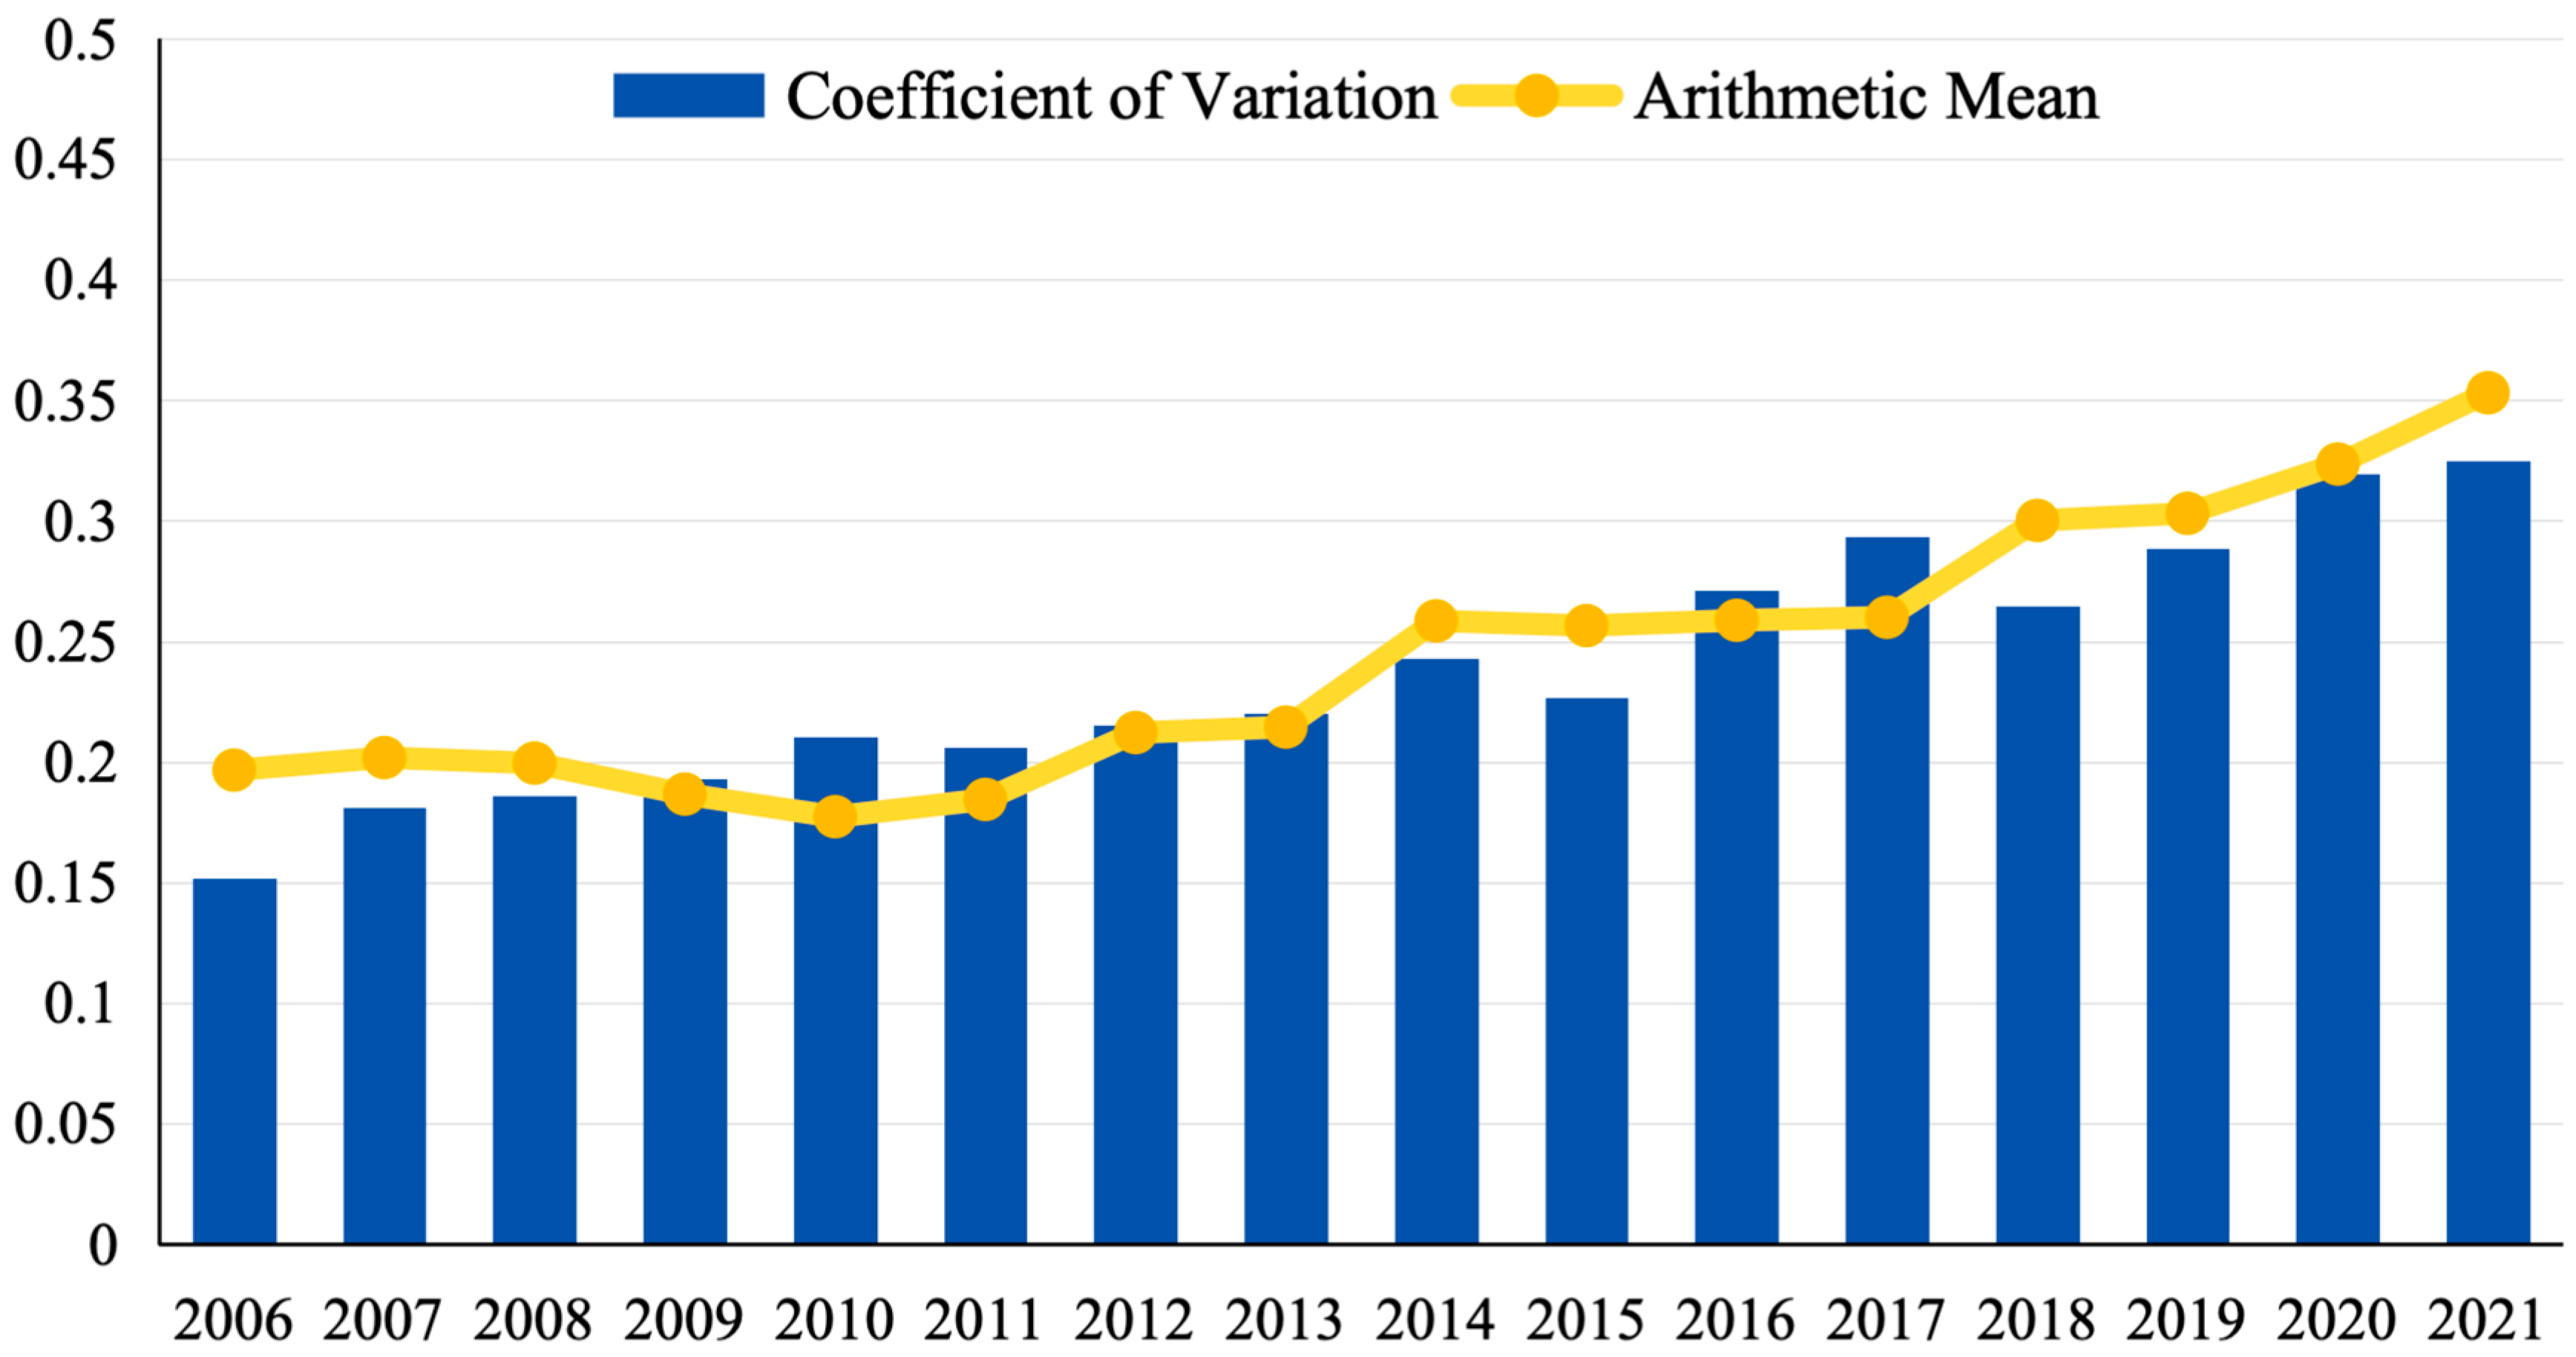
4.2.1. Overall Temporal Variation Analysis
4.2.2. Dimensional Temporal Variation Analysis
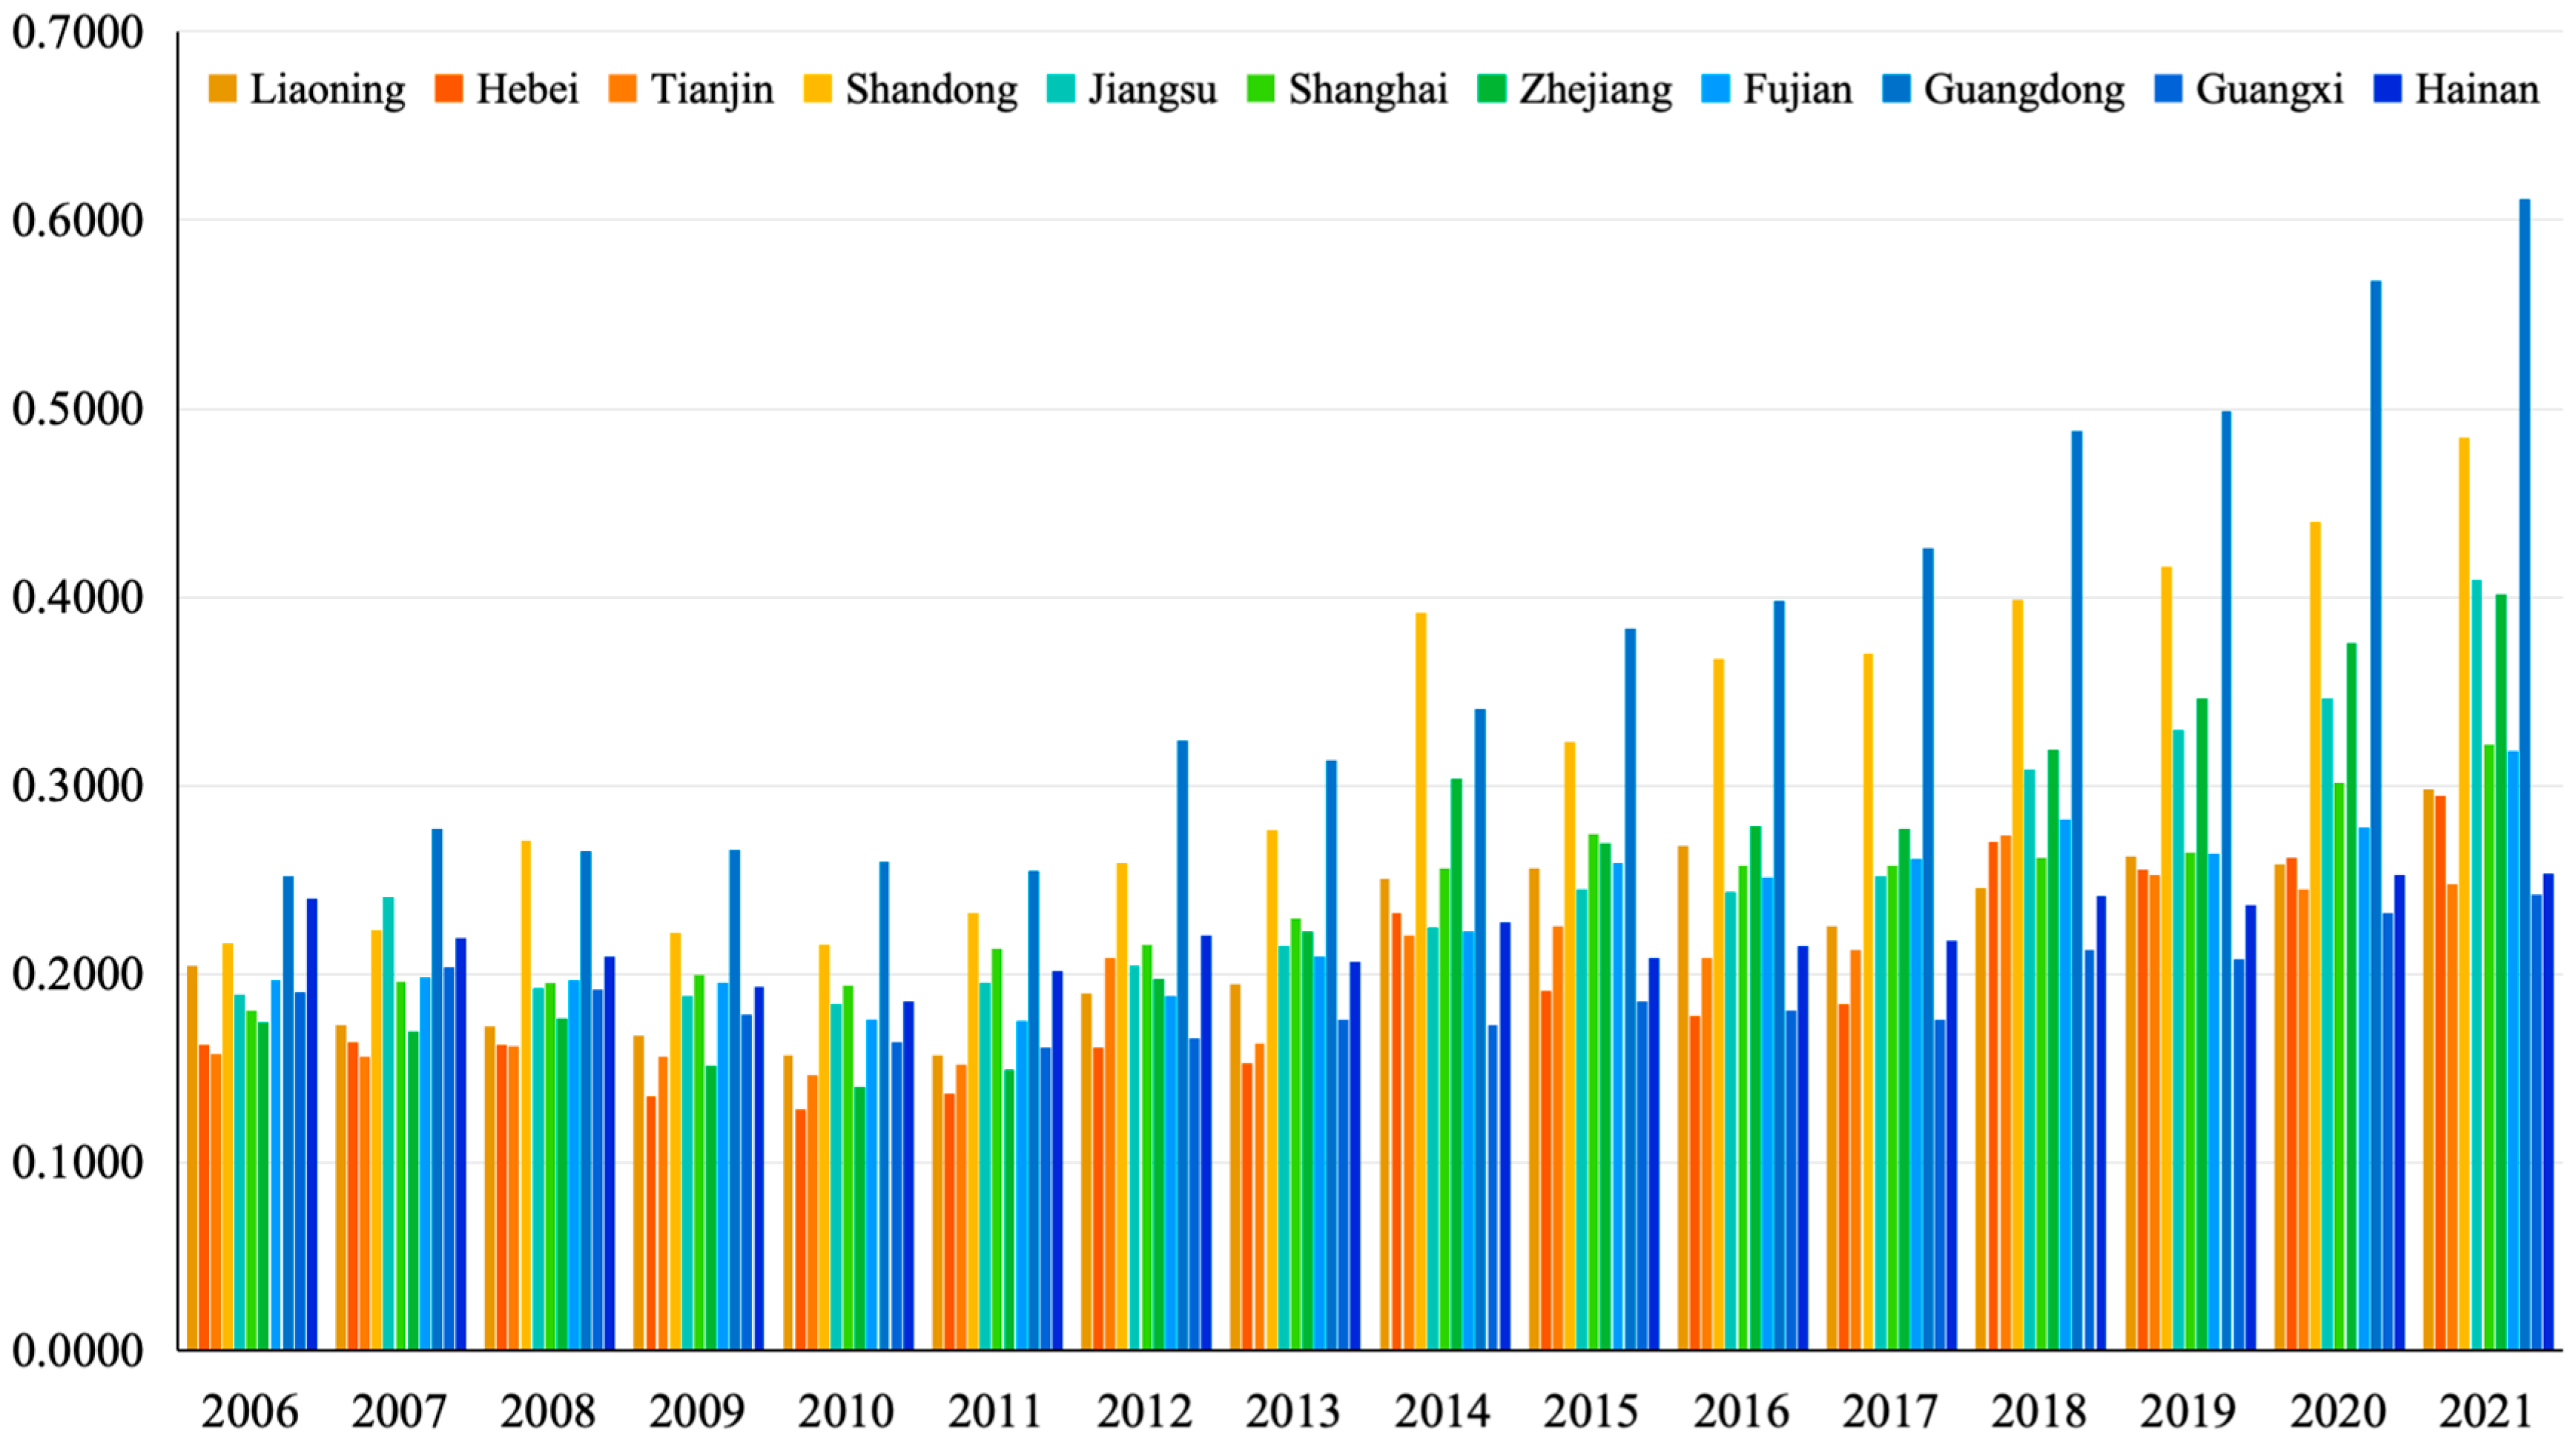
4.3. Spatial Analysis
4.3.1. Overall Spatial Variation Analysis
4.3.2. Dimensional Spatial Variation Analysis
5. Discussion
6. Conclusions
Author Contributions
Funding
Informed Consent Statement
Data Availability Statement
Conflicts of Interest
Appendix A

| The Northern Marine Economic Circle | The Eastern Marine Economic Circle | The Southern Marine Economic Circle | ||||||||||||
|---|---|---|---|---|---|---|---|---|---|---|---|---|---|---|
| Liaoning | Hebei | Tianjin | Shandong | Average | Jiangsu | Shanghai | Zhejiang | Average | Fujian | Guangdong | Guangxi | Hainan | Average | |
| 2006 | 0.2042 | 0.1624 | 0.1578 | 0.2159 | 0.1851 | 0.1892 | 0.1804 | 0.1741 | 0.1812 | 0.1964 | 0.2520 | 0.1901 | 0.2398 | 0.2196 |
| 2007 | 0.1733 | 0.1636 | 0.1563 | 0.2233 | 0.1791 | 0.2408 | 0.1958 | 0.1691 | 0.2019 | 0.1980 | 0.2770 | 0.2038 | 0.2187 | 0.2244 |
| 2008 | 0.1720 | 0.1621 | 0.1616 | 0.2711 | 0.1917 | 0.1926 | 0.1955 | 0.1767 | 0.1882 | 0.1969 | 0.2651 | 0.1915 | 0.2092 | 0.2157 |
| 2009 | 0.1676 | 0.1354 | 0.1564 | 0.2221 | 0.1704 | 0.1880 | 0.1993 | 0.1513 | 0.1796 | 0.1956 | 0.2657 | 0.1786 | 0.1929 | 0.2082 |
| 2010 | 0.1566 | 0.1282 | 0.1466 | 0.2159 | 0.1618 | 0.1841 | 0.1939 | 0.1401 | 0.1727 | 0.1757 | 0.2593 | 0.1640 | 0.1856 | 0.1961 |
| 2011 | 0.1567 | 0.1368 | 0.1519 | 0.2325 | 0.1695 | 0.1956 | 0.2134 | 0.1495 | 0.1862 | 0.1752 | 0.2545 | 0.1609 | 0.2016 | 0.1981 |
| 2012 | 0.1900 | 0.1609 | 0.2087 | 0.2590 | 0.2047 | 0.2041 | 0.2156 | 0.1971 | 0.2056 | 0.1883 | 0.3237 | 0.1657 | 0.2206 | 0.2246 |
| 2013 | 0.1945 | 0.1528 | 0.1632 | 0.2761 | 0.1967 | 0.2152 | 0.2293 | 0.2223 | 0.2222 | 0.2093 | 0.3137 | 0.1759 | 0.2065 | 0.2263 |
| 2014 | 0.2507 | 0.2323 | 0.2201 | 0.3918 | 0.2737 | 0.2249 | 0.2564 | 0.3034 | 0.2616 | 0.2226 | 0.3407 | 0.1729 | 0.2274 | 0.2409 |
| 2015 | 0.2563 | 0.1909 | 0.2256 | 0.3233 | 0.2490 | 0.2446 | 0.2746 | 0.2693 | 0.2628 | 0.2591 | 0.3834 | 0.1857 | 0.2085 | 0.2592 |
| 2016 | 0.2681 | 0.1775 | 0.2083 | 0.3673 | 0.2553 | 0.2434 | 0.2574 | 0.2786 | 0.2598 | 0.2515 | 0.3982 | 0.1806 | 0.2147 | 0.2613 |
| 2017 | 0.2256 | 0.1842 | 0.2126 | 0.3704 | 0.2482 | 0.2517 | 0.2576 | 0.2772 | 0.2622 | 0.2608 | 0.4262 | 0.1755 | 0.2176 | 0.2700 |
| 2018 | 0.2456 | 0.2699 | 0.2733 | 0.3985 | 0.2968 | 0.3086 | 0.2616 | 0.3191 | 0.2964 | 0.2820 | 0.4885 | 0.2127 | 0.2413 | 0.3061 |
| 2019 | 0.2622 | 0.2557 | 0.2524 | 0.4160 | 0.2966 | 0.3297 | 0.2644 | 0.3465 | 0.3135 | 0.2634 | 0.4984 | 0.2080 | 0.2368 | 0.3016 |
| 2020 | 0.2582 | 0.2617 | 0.2450 | 0.4399 | 0.3012 | 0.3462 | 0.3013 | 0.3753 | 0.3410 | 0.2778 | 0.5681 | 0.2323 | 0.2525 | 0.3327 |
| 2021 | 0.2984 | 0.2948 | 0.2480 | 0.4848 | 0.3315 | 0.4093 | 0.3217 | 0.4015 | 0.3775 | 0.3183 | 0.6113 | 0.2421 | 0.2533 | 0.3562 |
References
- Jiang, X.-Z.; Liu, T.-Y.; Su, C.-W. China’s Marine Economy and Regional Development. Mar. Policy 2014, 50, 227–237. [Google Scholar] [CrossRef]
- The State Council of the People’s Republic of China 6 Percent Growth in Gross Marine Product by 2023. Available online: https://www.mnr.gov.cn/dt/ywbb/202403/t20240320_2840072.html (accessed on 13 June 2024).
- Guo, J.; Yuan, X.; Song, W. Driving Forces on the Development of China’s Marine Economy: Efficiency and Spatial Perspective. Ocean Coast. Manag. 2022, 224, 106192. [Google Scholar] [CrossRef]
- Xu, T.; Dong, J.; Qiao, D. China’s Marine Economic Efficiency: A Meta-Analysis. Ocean Coast. Manag. 2023, 239, 106633. [Google Scholar] [CrossRef]
- Fang, X.; Zhang, Y.; Yang, J.; Zhan, G. An Evaluation of Marine Economy Sustainable Development and the Ramifications of Digital Technologies in China Coastal Regions. Econ. Anal. Policy 2024, 82, 554–570. [Google Scholar] [CrossRef]
- Rennings, K. Redefining Innovation—Eco-Innovation Research and the Contribution from Ecological Economics. Ecol. Econ. 2000, 32, 319–332. [Google Scholar] [CrossRef]
- Pujari, D. Eco-Innovation and New Product Development: Understanding the Influences on Market Performance. Technovation 2006, 26, 76–85. [Google Scholar] [CrossRef]
- European Commission Innovation for a Sustainable Future–The Eco-Innovation Action Plan (Eco-AP). Communication from the Commission to the European Parliament, the Council, the European Economic and Social Committee and the Committee of the Regions; European Commission: Brussels, Belgium, 2011. [Google Scholar]
- United Nations. Transforming Our World: The 2030 Agenda for Sustainable Development. N.Y. United Nations Dep. Econ. Soc. Aff. 2015, 1, 41. [Google Scholar]
- Gente, V.; Pattanaro, G. The Place of Eco-Innovation in the Current Sustainability Debate. Waste Manag. 2019, 88, 96–101. [Google Scholar] [CrossRef]
- Kemp, R.; Pearson, P. Final Report MEI Project about Measuring Eco-Innovation. UM Merit Maastricht 2007, 10, 1–120. [Google Scholar]
- Sobczak, E.; Głuszczuk, D.; Raszkowski, A. Eco-Innovation and Innovation Level of the Economy as a Basis for the Typology of the EU Countries. Int. J. Environ. Res. Public Health 2022, 19, 2005. [Google Scholar] [CrossRef]
- Keshminder, J.; del Río, P. The Missing Links? The Indirect Impacts of Drivers on Eco-Innovation. Corp. Soc. Responsib. Environ. Manag. 2019, 26, 1100–1118. [Google Scholar] [CrossRef]
- Bitencourt, C.C.; de Oliveira Santini, F.; Zanandrea, G.; Froehlich, C.; Ladeira, W.J. Empirical Generalizations in Eco-Innovation: A Meta-Analytic Approach. J. Clean. Prod. 2020, 245, 118721. [Google Scholar] [CrossRef]
- Su, C.-W.; Umar, M.; Khan, Z. Does Fiscal Decentralization and Eco-Innovation Promote Renewable Energy Consumption? Analyzing the Role of Political Risk. Sci. Total Environ. 2021, 751, 142220. [Google Scholar] [CrossRef]
- Han, M.S.; Ma, S.; Wang, Y.; Tian, Q. Impact of Technology-Enabled Product Eco-Innovation: Empirical Evidence from the Chinese Manufacturing Industry. Technovation 2023, 128, 102853. [Google Scholar] [CrossRef]
- López Pérez, G.; García Sánchez, I.M.; Zafra Gómez, J.L. A Systematic Literature Review and Bibliometric Analysis of Eco-Innovation on Financial Performance: Identifying Barriers and Drivers. Bus. Strategy Environ. 2024, 33, 1321–1340. [Google Scholar] [CrossRef]
- Garcia-Granero, E.M.; Piedra-Munoz, L.; Galdeano-Gomez, E. Eco-Innovation Measurement: A Review of Firm Performance Indicators. J. Clean. Prod. 2018, 191, 304–317. [Google Scholar] [CrossRef]
- Arranz, N.; Arroyabe, M.; Li, J.; Fernandez de Arroyabe, J.C. Innovation as a Driver of Eco-Innovation in the Firm: An Approach from the Dynamic Capabilities Theory. Bus. Strategy Environ. 2020, 29, 1494–1503. [Google Scholar] [CrossRef]
- Fernando, Y.; Tseng, M.-L.; Sroufe, R.; Abideen, A.Z.; Shaharudin, M.S.; Jose, R. Eco-Innovation Impacts on Recycled Product Performance and Competitiveness: Malaysian Automotive Industry. Sustain. Prod. Consum. 2021, 28, 1677–1686. [Google Scholar] [CrossRef]
- Kuo, F.-I.; Fang, W.-T.; LePage, B.A. Proactive Environmental Strategies in the Hotel Industry: Eco-Innovation, Green Competitive Advantage, and Green Core Competence. J. Sustain. Tour. 2022, 30, 1240–1261. [Google Scholar] [CrossRef]
- Zhang, L.; Mu, R.; Hu, S.; Zhang, Q.; Wang, S. Impacts of Manufacturing Specialized and Diversified Agglomeration on the Eco-Innovation Efficiency—A Nonlinear Test from Dynamic Perspective. Sustainability 2021, 13, 3809. [Google Scholar] [CrossRef]
- Zhao, S.; Teng, L.; Arkorful, V.E.; Hu, H. Impacts of Digital Government on Regional Eco-Innovation: Moderating Role of Dual Environmental Regulations. Technol. Forecast. Soc. Change 2023, 196, 122842. [Google Scholar] [CrossRef]
- Chaparro-Banegas, N.; Mas-Tur, A.; Park, H.W.; Roig-Tierno, N. Factors Driving National Eco-Innovation: New Routes to Sustainable Development. Sustain. Dev. 2023, 31, 2711–2725. [Google Scholar] [CrossRef]
- Kiani Mavi, R.; Kiani Mavi, N. National Eco-Innovation Analysis with Big Data: A Common-Weights Model for Dynamic DEA. Technol. Forecast. Soc. Change 2021, 162, 120369. [Google Scholar] [CrossRef]
- García-Granero, E.M.; Piedra-Muñoz, L.; Galdeano-Gómez, E. Measuring Eco-Innovation Dimensions: The Role of Environmental Corporate Culture and Commercial Orientation. Res. Policy 2020, 49, 104028. [Google Scholar] [CrossRef]
- García-Valderrama, T.; Sánchez-Ortiz, J.; Pérez-González, M.D.C.; Puentes-Graña, M.D.C. Relationship between Recycling, Circular Economy and Eco-Innovation in Europe. Application of a Dynamic Network Data Envelopment Analysis Model. Bus. Strategy Environ. 2024, 33, 5955–5974. [Google Scholar] [CrossRef]
- Šūmakaris, P.; Kovaitė, K.; Korsakienė, R. An Integrated Approach to Evaluating Eco-Innovation Strategies from the Perspective of Strategic Green Transformation: A Case of the Lithuanian Furniture Industry. Sustainability 2023, 15, 8971. [Google Scholar] [CrossRef]
- Lee, C.-H.; Wu, K.-J.; Tseng, M.-L. Resource Management Practice through Eco-Innovation toward Sustainable Development Using Qualitative Information and Quantitative Data. J. Clean. Prod. 2018, 202, 120–129. [Google Scholar] [CrossRef]
- Colombo, L.A.; Pansera, M.; Owen, R. The Discourse of Eco-Innovation in the European Union: An Analysis of the Eco-Innovation Action Plan and Horizon 2020. J. Clean. Prod. 2019, 214, 653–665. [Google Scholar] [CrossRef]
- Wang, T.-C.; Lee, H.-D. Developing a Fuzzy TOPSIS Approach Based on Subjective Weights and Objective Weights. Expert Syst. Appl. 2009, 36, 8980–8985. [Google Scholar] [CrossRef]
- Shannon, C.E. A Mathematical Theory of Communication. Bell Syst. Tech. J. 1948, 27, 379–423. [Google Scholar] [CrossRef]
- Delgado, A.; Romero, I. Environmental Conflict Analysis Using an Integrated Grey Clustering and Entropy-Weight Method: A Case Study of a Mining Project in Peru. Environ. Model. Softw. 2016, 77, 108–121. [Google Scholar] [CrossRef]
- Luo, Z.; Tian, J.; Zeng, J.; Pilla, F. Flood Risk Evaluation of the Coastal City by the EWM-TOPSIS and Machine Learning Hybrid Method. Int. J. Disaster Risk Reduct. 2024, 106, 104435. [Google Scholar] [CrossRef]
- Fontela, E.; Gabus, A. DEMATEL: Progress Achieved. Futures 1974, 6, 361–363. [Google Scholar] [CrossRef]
- Du, Y.-W.; Li, X.-X. Critical Factor Identification of Marine Ranching Ecological Security with Hierarchical DEMATEL. Mar. Policy 2022, 138, 104982. [Google Scholar] [CrossRef]
- Du, Y.-W.; Li, X.-X. Hierarchical DEMATEL Method for Complex Systems. Expert Syst. Appl. 2021, 167, 113871. [Google Scholar] [CrossRef]
- Reefke, H.; Sundaram, D. Key Themes and Research Opportunities in Sustainable Supply Chain Management – Identification and Evaluation. Omega 2017, 66, 195–211. [Google Scholar] [CrossRef]
- Govindan, K.; Dua, R.; Mehbub Anwar, A.; Bansal, P. Enabling Net-Zero Shipping: An Expert Review-Based Agenda for Emerging Techno-Economic and Policy Research. Transp. Res. Part E Logist. Transp. Rev. 2024, 192, 103753. [Google Scholar] [CrossRef]
- Park, M.S.; Bleischwitz, R.; Han, K.J.; Jang, E.K.; Joo, J.H. Eco-Innovation Indices as Tools for Measuring Eco-Innovation. Sustainability 2017, 9, 2206. [Google Scholar] [CrossRef]
- Cai, W.; Li, G. The Drivers of Eco-Innovation and Its Impact on Performance: Evidence from China. J. Clean. Prod. 2018, 176, 110–118. [Google Scholar] [CrossRef]
- Severo, E.A.; de Guimarães, J.C.F.; Henri Dorion, E.C. Cleaner Production, Social Responsibility and Eco-Innovation: Generations’ Perception for a Sustainable Future. J. Clean. Prod. 2018, 186, 91–103. [Google Scholar] [CrossRef]
- Chen, J.; Cheng, J.; Dai, S. Regional Eco-Innovation in China: An Analysis of Eco-Innovation Levels and Influencing Factors. J. Clean. Prod. 2017, 153, 1–14. [Google Scholar] [CrossRef]
- Marinelli, M. How to Build a ‘Beautiful China’ in the Anthropocene. The Political Discourse and the Intellectual Debate on Ecological Civilization. J Chin. Polit. Sci. 2018, 23, 365–386. [Google Scholar] [CrossRef]
- Yang, F.; Yang, M. Analysis on China’s Eco-Innovations: Regulation Context, Intertemporal Change and Regional Differences. Eur. J. Oper. Res. 2015, 247, 1003–1012. [Google Scholar] [CrossRef]


| Dimension | Index | Description | Unit | Attribute |
|---|---|---|---|---|
| Eco-innovation Capacity | e1. Marine science and technology patents granted | Number of patents officially granted in the field of marine science and technology | Number | + |
| e2. Share of the added value of marine scientific research, education, management and service | Share of marine scientific research, education, management and service in the value added of marine and related industries | % | + | |
| e3. Seawater desalination project scale | Total daily production of freshwater from desalination of seawater | Million tons | + | |
| e4. Charge for sea area use | Amount of royalties received by the government through the legal granting of the right to use the sea area | Million CNY | + | |
| Eco-innovation Supporting Environment | e5. Scientific and technical staff in marine research institutions | Number of persons engaged in scientific and technological activities in marine scientific research institutions | Number | + |
| e6. Coastal observation stations by coastal regions | Number of laboratories and systems for continuous observation of marine environment at the coastline or on offshore islands | Number | + | |
| e7. Green finance index | Performance of financial institutions or investment products in terms of environmental sustainability | Score | + | |
| e8. Strength of financial support | The proportion of government funds in intramural expenditure on R&D of marine R&D institutions | % | + | |
| e9. Awareness of sustainability management | Regulations, standards and policies formulated by the government in environmental protection and the strength of their implementation | Score | + | |
| e10. Losses from major marine disasters | Property damage caused by major maritime natural disasters to human production, life, and social development | Million yuan | - | |
| Eco-innovation Activity | e11. R&D projects of marine R&D institutions | Number of marine science R&D projects conducted by marine R&D institutions | Number | + |
| e12. Digital economy index | Performance of the digital economy in the region | Score | + | |
| e13. Seawater direct utilization | Direct adoption of seawater as a substitute for freshwater use in human production and life | Million tons | + | |
| e14. Offshore wind project scale | Total amount of electricity resources that can be produced by wind projects built offshore | Megawatts | + | |
| e15. Completed investment in treatment of industrial pollution | Amount of investment completed during the year in projects to treat industrial pollution | Million yuan | + | |
| e16. Marine protected areas | Number of marine protected areas set aside for the exclusive protection of marine resources, environment and ecology | Number | + | |
| Eco-innovation Performance | e17. Gross output value of marine industries | Total value of marine products produced by resident units in the marine industry sector | Billion yuan | + |
| e18. Industrial solid waste generation | Total solid waste generated in industrial production activities | Million tons | - | |
| e19. Total CO2 emissions | Total carbon dioxide emissions from major energy consumption in production and domestic use | Million tons | - | |
| e20. Wastewater discharged directly to the sea | Total amount of production and domestic wastewater discharged directly into the sea without adequate treatment | Billion tons | - | |
| e21. Health of marine ecosystems | State of health of marine ecosystems in the regional priority monitoring areas | Score | + | |
| e22. Primary and secondary water quality in nearshore waters | Proportion of the checkpoints of near-shore marine waters whose seawater quality meets national Class I and II standards | % | + |
| Index | Index | ||||
|---|---|---|---|---|---|
| e1 | 0.8545 | 0.0762 | e12 | 0.9715 | 0.0149 |
| e2 | 0.9579 | 0.0221 | e13 | 0.8113 | 0.0989 |
| e3 | 0.7619 | 0.1248 | e14 | 0.5578 | 0.2317 |
| e4 | 0.9040 | 0.0503 | e15 | 0.9309 | 0.0362 |
| e5 | 0.9412 | 0.0308 | e16 | 0.8860 | 0.0597 |
| e6 | 0.9317 | 0.0358 | e17 | 0.9251 | 0.0392 |
| e7 | 0.9824 | 0.0092 | e18 | 0.9884 | 0.0061 |
| e8 | 0.8932 | 0.0560 | e19 | 0.9873 | 0.0067 |
| e9 | 0.9505 | 0.0259 | e20 | 0.9939 | 0.0032 |
| e10 | 0.9973 | 0.0014 | e21 | 0.9838 | 0.0085 |
| e11 | 0.9076 | 0.0484 | e22 | 0.9734 | 0.0139 |
| Index | Index | ||||
|---|---|---|---|---|---|
| e1 | 4.8226 | 0.0616 | e12 | 2.9813 | 0.0381 |
| e2 | 5.2899 | 0.0675 | e13 | 2.8172 | 0.0360 |
| e3 | 2.2587 | 0.0288 | e14 | 3.0116 | 0.0384 |
| e4 | 4.2669 | 0.0545 | e15 | 3.9871 | 0.0509 |
| e5 | 3.0583 | 0.0390 | e16 | 4.1999 | 0.0536 |
| e6 | 3.3317 | 0.0425 | e17 | 4.1536 | 0.0530 |
| e7 | 3.5116 | 0.0448 | e18 | 2.8337 | 0.0362 |
| e8 | 3.7754 | 0.0482 | e19 | 2.9032 | 0.0371 |
| e9 | 3.8288 | 0.0489 | e20 | 2.7611 | 0.0352 |
| e10 | 3.0648 | 0.0391 | e21 | 3.4864 | 0.0445 |
| e11 | 4.4558 | 0.0569 | e22 | 3.5423 | 0.0452 |
Disclaimer/Publisher’s Note: The statements, opinions and data contained in all publications are solely those of the individual author(s) and contributor(s) and not of MDPI and/or the editor(s). MDPI and/or the editor(s) disclaim responsibility for any injury to people or property resulting from any ideas, methods, instructions or products referred to in the content. |
© 2025 by the authors. Licensee MDPI, Basel, Switzerland. This article is an open access article distributed under the terms and conditions of the Creative Commons Attribution (CC BY) license (https://creativecommons.org/licenses/by/4.0/).
Share and Cite
Wang, Y.-C.; Wang, Y.-Y.; Fan, Y.-P. Spatiotemporal Dynamics of the Eco-Innovation Level of China’s Marine Economy. Sustainability 2025, 17, 5660. https://doi.org/10.3390/su17125660
Wang Y-C, Wang Y-Y, Fan Y-P. Spatiotemporal Dynamics of the Eco-Innovation Level of China’s Marine Economy. Sustainability. 2025; 17(12):5660. https://doi.org/10.3390/su17125660
Chicago/Turabian StyleWang, Ye-Cheng, Ye-Ying Wang, and Yi-Pin Fan. 2025. "Spatiotemporal Dynamics of the Eco-Innovation Level of China’s Marine Economy" Sustainability 17, no. 12: 5660. https://doi.org/10.3390/su17125660
APA StyleWang, Y.-C., Wang, Y.-Y., & Fan, Y.-P. (2025). Spatiotemporal Dynamics of the Eco-Innovation Level of China’s Marine Economy. Sustainability, 17(12), 5660. https://doi.org/10.3390/su17125660