1. Introduction
Amid rapid urbanization and accelerating climate change, the urban thermal environment has emerged as a critical focus in sustainable urban planning, energy-efficient design, and climate-resilient development [
1,
2,
3,
4,
5,
6]. The thermal environment of cities is a key determinant of urban resilience, directly impacting the health and climate adaptability of local communities. Traditional thermal detecting methods like handheld infrared thermal cameras and satellite image inversion from remote sensing are limited by temporal and spatial resolution and the monitoring range. The handheld infrared thermal camera can measure the thermal environment at the pedestrian level with high resolution, but the measuring height is limited to low-rise buildings [
7]. The remote sensing approach can obtain the land surface temperature in large areas with low spatial resolution, but it cannot provide continuous temperature data due to the satellite re-entry period (for example, 16 days for Landsat-8) [
8]. Therefore, there is an urgent need for efficient and continuous monitoring approaches with high spatial and temporal resolution to support sustainable urban thermal management and climate resilience [
9].
The drone-based thermal infrared imaging technology provides an unprecedented opportunity to flexibly investigate the urban thermal environment in high spatial and temporal resolution with continuous time series [
10,
11,
12,
13]. Compared with traditional ground monitoring methods, the flexibility and mobility of drones make it possible to perform monitoring tasks between and above high-rise buildings, providing a global perspective for the thermal environment analysis at the local and city levels [
14,
15,
16,
17]. By mounting the advanced infrared thermal cameras on the drone, the temperature distribution of the vertical building surface can be measured, which can further be utilized for the evaluation of heat conduction, thermal insulation performance and energy consumption of buildings [
18,
19,
20]. Because thermal infrared cameras can capture the abnormal temperature of the building surface, drone-based thermal imaging technology has been widely applied in building thermal leakage detection and to improve the efficiency of building maintenance [
16,
21,
22,
23]. Furthermore, this approach is also used in evaluating the thermal comfort inside and outside the building for optimal space design [
24,
25]. It is, therefore, that drone-based thermal infrared imaging is a pioneer approach for obtaining urban thermal environments with high spatial and temporal resolution, especially for the acquirement of the building surface temperature distribution.
As a new photogrammetry technology in the field of computer vision, the structure-from-motion (SFM) algorithm is widely used in generating three-dimensional (3D) thermal infrared structures based on two-dimensional (2D) images. Quero et al. explored the method of near-infrared 3D image reconstruction using single-pixel imaging technology under changeable outdoor lighting conditions [
26]. Pech et al. discussed the process and method of generating multi-temporal thermal orthophotos from UAV data and put forward the method of aligning and comparing multi-temporal thermal orthophotos to facilitate time series analysis [
27]. Lagüela and Khodaei et al. suggested a method to integrate and interoperate the generated 3D model with the existing geographic information system and introduced the algorithms and methods used in the process of 3D surface generation, such as the matching algorithm and interpolation method [
28,
29].
Compared to 2D thermal infrared imaging, 3D thermal infrared imaging contains more information aside from the temperature distribution, like the building structure and spatial location. For example, Zheng et al. used the 3D thermal infrared structure to investigate the transmission mode of thermal energy on the building surface and assist in building energy efficiency and optimizing design [
30,
31]. Moreover, the 3D thermal infrared imaging relates the temperature data to the spatial geometric information of the building, which can identify the accurate location of the abnormal thermal area. This has been used in the measurement of building vertical surface temperature since drone-flying needs a wide space, which often presents as difficult for high-density cities.
From the above literature review, it can be discovered that drone-based thermal infrared imaging with 3D structure is very suitable for studying urban thermal environments both for horizontal plane and vertical building surfaces with high flexibility and spatial-temporal resolution. However, the existing research mainly focuses on the point temperature visualization of a 3D infrared imaging model, and the method of linear fitting is used to obtain temperature without temperature correction, which contains uncertain errors. Meanwhile, the previous studies are mainly focused on detecting building heat loss, which lacks investigations on detailed building surface temperature in the building cluster.
This paper aims to investigate the diurnal urban thermal environment with high spatial-temporal resolution utilizing drone-based thermal infrared imaging. A pioneering approach that obtains building surface temperature with centimeter accuracy for a group of buildings by 3D reconstruction of drone-based thermal infrared imaging is developed. This approach encompasses a drone, a thermal infrared camera, and a self-developed computational algorithm for high-precision building wall temperature extraction. The nine-building surface temperature in Yuquanting in Xiongan New Area, China, is used for the case study to demonstrate this approach. Three time periods, i.e., morning (7:00–8:00), noon (13:00–14:00), and evening (18:00–19:00), are selected to obtain the diurnal building surface temperature on 8 January 2023 (i.e., heating period). This paper provides useful tools for obtaining information about the urban thermal environment, which is also of great significance for urban microclimate and built environment studies.
The structure of this paper is organized as follows: the methodology of this study is introduced in
Section 2, and the case study information is presented in
Section 3.
Section 4 specifies the analyzed results, and the discussion and conclusion are given in
Section 5.
2. Methodology
2.1. Thermal Infrared Imaging
The principle of thermal infrared radiation is based on the fact that objects emit infrared radiation when their temperature is higher than absolute zero (i.e., T = −273 K). This phenomenon can be explained by Planck’s radiation law and Stefan–Boltzmann’s law. Planck’s radiation law describes the spectrum distribution of object radiation. The law points out that the radiation intensity of an object is related to its temperature and wavelength, which is expressed as [
32]:
where
B(
λ,
T) is radiation intensity (
),
λ denotes wavelength,
T is absolute temperature (−273 K),
h is the Planck constant (
),
c is the speed of light (3 × 10
8 m/s), and
k is the Boltzmann constant (
). This law shows that as the temperature of an object increases, the intensity of its radiation will increase, and the main wavelength of radiation will also change accordingly.
The Stefan–Boltzmann law describes the relationship between the total radiation power of black body radiation and its absolute temperature, expressed as [
33]:
where
P is radiation power,
σ is the Stefan–Boltzmann constant (
). This law shows that objects with higher temperatures will radiate more energy.
Based on Planck’s radiation law and Stefan–Boltzmann’s law, it can be concluded that the higher the temperature of an object, the greater its radiation intensity in the infrared band. This is used in the thermal infrared imaging system to obtain the temperature distribution of an object.
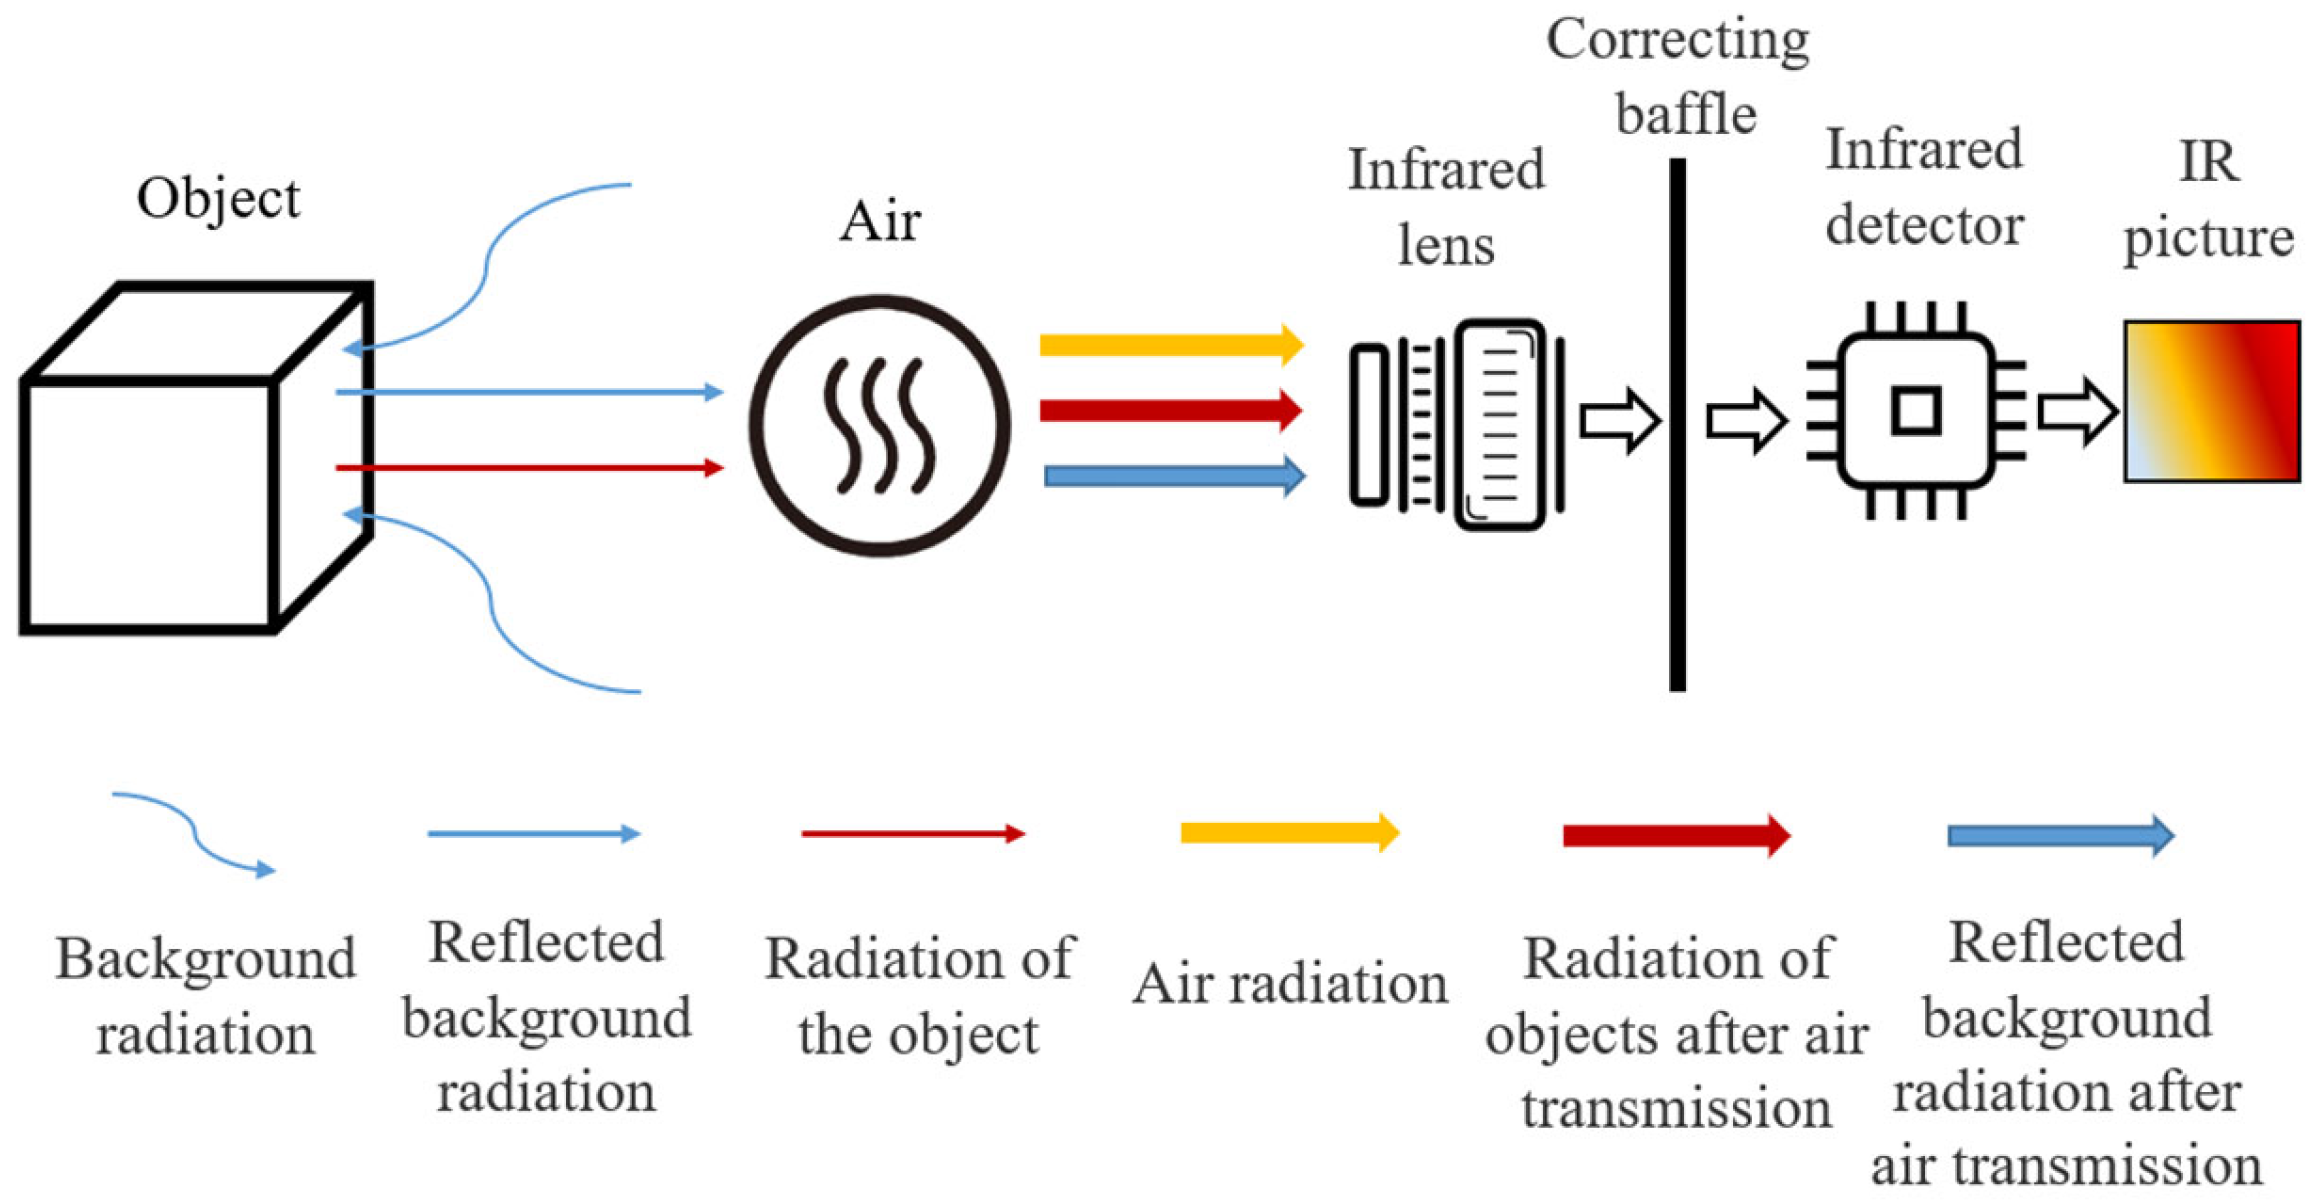
The specific process of the thermal infrared imaging system is illustrated in
Figure 1. The radiation emitted by the object includes two parts: the background radiation reflected by the object’s surface and the infrared radiation from the object itself. After air transmission, the total radiation received by the infrared camera lens includes air radiation, reflected background radiation after air transmission and radiation of the object itself after air transmission. The environmental conditions (such as temperature and humidity) may also affect the temperature measurement performance of the thermal infrared lens. The calibration baffle, with a known and stable surface temperature and emissivity (typically close to 0.95), serves as the reference source to reduce the impact of environmental noise and to calibrate the thermal infrared camera. It is used to provide a controlled environment to reduce the interference of environmental changes and provide a reference source with known temperature to ensure that the thermal infrared camera can accurately measure the object temperature under different working conditions. Finally, the corrected radiation is analyzed and processed by the infrared sensor, and a pseudo-color infrared picture containing temperature information is given.
The accuracy of infrared thermal imaging depends on many factors, such as the measuring distance, ambient temperature, humidity and emissivity. The farther the infrared camera is from the target object, the more infrared radiation is attenuated. Atmospheric conditions, i.e., air temperature and humidity, will affect the transmission and reception of infrared radiation. Meanwhile, the energy radiated by ambient temperature may be reflected by the object’s surface, which will also result in temperature measurement errors.
Equation (3) gives the method of calculating the radiation in real scenes [
13,
30]:
where
is the DN value of the pixel,
is the target emissivity, and DN stands for digital number; that is, the original pixel value recorded by the thermal sensor before calibration.
is the transmission coefficient of the window,
is the window temperature,
is the reflection coefficient of the window,
is the temperature reflected by the window,
is the transmission coefficient of the atmosphere between the target and the infrared camera,
is the atmospheric temperature,
is the background temperature (reflected by the target), and
represents the temperature of the target. The air temperature and humidity are obtained by the mobile weather station, the emissivity of the target building is set to 0.90, the distance is set to the aerial altitude, and the radiation background temperature is set to the ambient temperature (no abnormally high-temperature objects). Combined with Planck Formula (1), the target temperature value
can be solved.
2.2. Three-Dimensional Reconstruction Based on Binocular Vision
Three-dimensional (3D) reconstruction of stereoscopic vision is to obtain images from different perspectives by using binocular or multi-camera systems and then restore or estimate the three-dimensional structure of objects or scenes by using parallax information between these images [
34]. In this study, the 3D reconstruction of thermal infrared images is based on the binocular vision method, which restores the 3D structures of objects using parallax information between these images. In the binocular vision method (see
Figure 2), where
and
are the centers of two cameras, A is a point in space, and the projection of A on the corresponding image plane is
and
. The intersection points
and
between
and
and the image planes are called poles. Two cameras (
and
) are placed in different positions to mimic the observation of human eyes. By comparing the images taken by two cameras, the parallax information of the same object in the two images can be calculated, and a parallax map is formed. Prior to any measurements, the camera needs to be calibrated to obtain the baseline length, focal length, principal point rotation matrix and translation vector of the camera. Using parallax information and above camera parameters, the distance from the object to the camera is calculated by triangulation. The three-dimensional spatial coordinates are calculated according to the disparity map, and the point cloud of the object is formed. Using the point cloud data, the surface reconstruction of the object is generated and smoothed by a combination of bilateral filtering and Poisson surface reconstruction. The bilateral filter helps reduce noise while preserving the edges of thermal features, and the Poisson surface reconstruction algorithm is used to produce a continuous and watertight mesh that conforms to the geometric structure captured by the drone. These methods ensure that both thermal gradients and façade geometries are accurately preserved [
35,
36].
It is important to note that in this study, the visible-light (RGB) camera was used solely for comparative analysis and visualization. The 3D reconstruction was performed exclusively using thermal infrared images based on the binocular vision algorithm. The RGB images provided structural and material context, helping to interpret the temperature distribution observed in the thermal model (e.g., identifying wall coating colors, balcony overhangs, or roof equipment), but they were not used in the generation of the 3D geometry.
2.3. Thermal Infrared Image Processing
Once the thermal infrared images are obtained by the drone-based infrared thermal camera, the original temperature is corrected according to the local meteorological conditions, material emissivity, and measuring distance (see
Figure 3). The corrected temperature is obtained according to Formulas (1) and (3). In this study, the actual surface temperature was calculated through a two-step process. First, the total radiance measured by the thermal sensor was corrected using atmospheric parameters, emissivity, and background radiation based on the thermal radiation balance model (Formula (3)). Then, the corrected surface radiance was used in the inverse form of Planck’s law (Formula (1)) to determine the corresponding surface temperature. While the full derivation is omitted for brevity, this method follows standard procedures in thermal remote sensing and has been validated in previous studies.
All necessary parameters (e.g., emissivity, transmittance, and background radiance) were either measured or estimated based on onsite meteorological data and sensor specifications.
In order to obtain images with pure temperature information, the temperature information was converted into gray images. The gray level range is from 0 to 255, and the minimum and maximum temperatures are respectively measured. Thus, the gray images were then fitted into the measurement data by following equation [
37],
where
represents the pixel data of the gray image,
is the pixel value after linear stretching, MAX and MIN represent the maximum and minimum values of the measurement temperature, respectively, and
represents the gray level of the gray image, which is 255 in this study.
Finally, pseudo-color images were imposed on these gray images for better visual effects. Further, the image sampling approach was utilized to obtain 2D thermal images of the building façade from the 3D thermal reconstruction data. The complete technical route is shown in
Figure 3.
3. Case Description
3.1. Study Area
The Xiong’an New Area is a district under the jurisdiction of Hebei Province, China (see
Figure 4a). The Xiong’an New Area has a semi-arid and semi-humid temperate continental monsoon climate with hot-humid summer and cold-dry winter. The mean annual temperature is 12.4 °C, and the average annual precipitation is 495.1 mm. The study area in our paper is Yuquanting, with geographical coordinates of 115°55′25″ E, 39°4′9″ N.
Figure 4b shows the orthographic image of the study area, in which the underlying surface contains a large number of buildings and impervious surfaces. The study area includes nine residential buildings with an average height of 50 m.
3.2. Image Acquisition
3.2.1. Visible Light Image Acquisition
The visible light images of the study area were acquired with a DJI Jingwei M300RTK drone equipped with a DJI H20T zoom camera (see
Figure 5a) [
38]. The DJI Jingwei M300RTK was manufactured by SZ DJI Technology Co., Ltd., located in Shenzhen, China. The maximum takeoff weight of the DJI Jingwei M300RTK drone is 9 kg, and the maximum flight time is 55 min. The effective pixel of the H20T zoom camera is 20 million. During the measurements, the camera was set to 45 degrees for the tilt photography, and the flight height was 100 m above the ground surface. Five routes were determined to cover the study area so that the course overlap rate of images was 80% and the lateral overlap rate of images was 70%. The images were obtained for three periods on 8 January 2023, i.e., morning (7:00–8:00 am), noon (13:00–14:00 pm) and evening (18:00–19:00 pm).
3.2.2. Thermal Infrared Image Acquisition
Thermal infrared images were captured by the Zen H20T thermal infrared camera mounted on the drone. The Zenmuse H20T thermal infrared camera was manufactured by SZ DJI Technology Co., Ltd., located in Shenzhen, China. The detailed parameters of the thermal infrared camera are shown in
Table 1. The flight plan for acquiring thermal infrared images is the same as that for acquiring visible light images. Thermal infrared images and visible light images were obtained during the experiment. In total, 8291 images for both visible and thermal infrared pictures were obtained on 8 January 2023.
The date of 8 January 2023 was selected for field data acquisition as the meteorological conditions on that day—including clear skies, low wind speed (<3 m/s), and stable ambient temperature—were ideal for thermal imaging and ensured minimal atmospheric distortion.
3.3. Meteorology Data
The Rainwise mobile weather station [
39] was used to collect the background. Since the drone operated at a stable altitude of 100 m and the vertical air temperature gradient was found negligible under stable atmospheric conditions during winter, the ground-based mobile weather station was used as the reference for atmospheric temperature input meteorological data during the experiment, including temperature, humidity, solar radiation flux, wind speed, and wind direction. The position of the mobile weather station is shown in
Figure 5b, and data was collected in one-minute intervals.
Table 2 summarizes the specifications of the mobile weather station. The four-channel thermocouple was used to measure the building wall temperature to validate the temperature obtained from thermal infrared images (see
Figure 5c).
Figure 6 presents the monitoring of local meteorology parameters from the Rainwise mobile weather station. The exact location of the Rainwise mobile weather station can be found in
Figure 4 (i.e., the blue flag). As can be seen from
Figure 6a, the air temperature in Yuquanting was the lowest in the morning compared to the other two time periods, and it showed a decreasing trend before the sun rose. The lowest temperature (−0.5 °C) occurred at 8:35 am. After the sun rose, the ambient temperature started to rise and reached 0.5 °C at 9:00 am. During 13:00–14:00 pm, the air temperature did not change much and varied around 8.5 °C. During 18:00–19:00 pm, the air temperature decreased from 6.5 °C to 3 °C because of the lack of solar radiation. In
Figure 6b, it can be found that the Yuquanting was in a calm wind environment during the whole drone aerial photography period with a maximum wind speed of 2.8 m/s in the noon time. In
Figure 6c, the solar radiation started to increase at 8:15 am and reached the maximum value of 166 W/m
2 at 8:55 am. During noon, i.e., 13:00–14:00 pm, the solar radiation varied around 350 W/m
2.
3.4. Measurement Accuracy
In order to verify the accuracy of thermal infrared wall temperature, three measuring points on the building wall were selected, and the wall temperature was recorded by contact thermocouple (see
Figure 5). The distribution of measuring points involved the shady and the sunny side. Specifically, the P1 measuring point was located on the shady side, while the P2 and P3 measuring points were located on the sunny side. Taking the measuring point as the center and five pixels as the radius, the average value of all pixel values was chosen as the temperature value of the measuring point in the Three-Dimensional Infrared Imaging (3D-IR) model to reduce the point selection error. As shown in
Figure 7, the average temperature values of the 3D-IR model at three points were smaller than that of the measured average value from thermocouples. Overall, the errors during the morning measurement were the smallest, 0.17 °C, 0.19 °C and 0.76 °C for P1, P2 and P3, respectively. During noon measurement, the errors were 0.04 °C, 3.72 °C and 3.74 °C for P1, P2 and P3, respectively. During night measurement, the error results are 0.6 °C, 1.04 °C and 1.75 °C for P1, P2 and P3, respectively. The accuracy of the retrieved surface temperature is affected by several factors, including uncertainties in emissivity assignment, atmospheric transmittance variation, and pixel-level alignment between stereo pairs. Based on previous thermal calibration studies, the cumulative uncertainty is estimated to be within ±2–5 °C, which aligns with our validation using thermocouple data. The deviations were all within 5 °C, which is consistent with both the manufacturer’s specification and prior studies on thermal infrared building diagnostics. For instance, Yuan and Zhang (2019) reported that errors within ±2–5 °C or 10–15% are generally acceptable for UAV-based thermography in urban environments, especially when the target surface temperatures are in the 20–60 °C range [
12].
4. Results and Analysis
4.1. 3D Reconstruction of Thermal Infrared Images
The buildings in the Yuquanting residential area are primarily constructed using reinforced concrete frames with solid brick or block infill walls, finished with cement plaster and exterior paint coatings. This construction system is typical for urban residential buildings in northern China and exhibits moderate to high thermal mass.
Figure 8 shows the sunny side of the visible light and infrared three-dimensional (3D) reconstruction models of Yuquanting on 8 January 2023 for three time periods. The building surface temperature was the lowest at night time (i.e., 18:00–19:00 pm), followed by the morning time (i.e., 7:00–8:00 am). The highest temperatures on the sunny side were 39 °C, 55 °C and 20 °C during morning, noon, and nighttime, respectively. Moreover, the median temperature of the sunny side was 4 °C, 16 °C and 2 °C during morning, noon, and nighttime, respectively. By comparing the left visual light 3D model and the right thermal infrared imaging 3D model, it could be found that the building surface temperature was closely related to the solar radiation intensity. Moreover, comparing the visible 3D model with the infrared 3D model in the morning and noon time (i.e.,
Figure 8a vs.
Figure 8b), the low-temperature area was basically the same as the shadow area, which in turn verified the accuracy of our model. During the morning period (
Figure 8a), the temperature differences between the shadow area and the solar radiation area were 10~15 °C, while these differences were 20~30 °C during the noon time (
Figure 8b). The temperature difference of the shadow area was up to 5 °C for morning and noon time. This temperature difference can be attributed to the heat conduction (1.4 W/(m·K)) [
40], thermal mass (J/°K) and specific heat capacity (J·kg
−1·K
−1) of the building materials, which together influence how quickly and to what extent the surface temperature adjusts in response to solar exposure and an air temperature increase, whereas the difference between morning and noon time in the areas that received direct solar radiation was about 15 °C. This could be attributed to the difference in solar radiation intensity, around 50–150 W/m
2 during morning time and around 350 W/m
2 during noon. Since there was no solar radiation during nighttime, the surface temperatures of the entire buildings in the community were evenly distributed, and the average temperature was 3.2 °C, which was 25 °C lower than that during noon time (area-averaged temperature value).
Figure 9 shows the shaded side of the visible light and infrared 3D reconstruction models of Yuquanting on 8 January 2023 for three time periods. The highest temperature of the shaded side was 34 °C, 49 °C, and 15 °C during morning, noon, and nighttime, respectively. Moreover, the median temperature of the shaded side was 3 °C, 10 °C and 2 °C during morning, noon, and nighttime, respectively. Since there was no solar radiation on the shaded side during morning time, the overall temperature distribution was relatively uniform (
Figure 9a). During noon time (i.e., 13:00–14:00 pm), the wall temperature of buildings above the second floor was 3~4 °C higher than the air temperature, while the wall temperature of buildings below the second floor was low and was close to the air temperature. There were two reasons that led to this difference: the first floor of residential buildings was mostly an open structure, such as overhead floors or unit doors and corridors, and there were limited heating facilities on the first floor. The building materials were darker in the low floor area, and the dark coating was faster in heat dissipation than their light competitors. During nighttime (i.e., 18:00–19:00 pm), there was little difference between the shady side and the sunny side because the influence of solar radiation was absent (
Figure 8c vs.
Figure 9c).
To clearly present the diurnal variation of the building surface temperature, the building E is taken here as an example, which is located in the middle of Yuquanting.
Figure 10 shows the visible and infrared 3D models of the south-facing façade of Building E during three time periods. This façade was selected for analysis due to its direct exposure to solar radiation throughout the day, which provides representative insights into diurnal thermal behavior. In
Figure 10a,c, the building surface temperature was evenly distributed during morning time and nighttime. This low surface temperature was caused by a lack of direct solar radiation exposure. There were some high-temperature spots in the window areas during the morning period. This was because of the central heating in this community; some residents open windows for ventilation, which leads to the high temperature in this area. Moreover, there were some abnormally high-temperature spots in the roof area. These areas were exhaust heating valves, and they are used to discharge high-temperature water vapor.
During noon time (i.e., 13:00–14:00 pm), the exterior wall temperature was 2–3 °C higher than the window temperature. This was because the solar radiation absorption rate of glass (0.01~0.02 according to the glass thickness) was lower than that of the concrete wall (i.e., 0.35) [
41]. Also, the temperature in the dark paint area of the exterior wall was obviously higher than that in the light paint area, around 12 °C. This was because different colors of paint had different absorption rates of solar radiation [
41]. The temperature of the roof was between the light-colored paint exterior wall and the dark-colored paint exterior wall (about 40~50 °C). This was because the roof received more solar radiation, but its emissivity was high (0.65). Due to the shelter of buildings, the temperature in the shadow area was 10~20 °C lower than that on the exterior wall surface.
4.2. Temperature Distribution of Building Walls
According to the infrared 3D model of the residential area in
Figure 8,
Figure 9 and
Figure 10, there was no obvious heat loss for these buildings. In order to show the temperature distribution of building walls in detail, two sunny-sided walls (south and southwest sides) and the rooftop are selected for two-dimensional (2D) analysis in this section.
Figure 11 shows the 2D building wall temperature distribution of building roofs in Yuquanting. Because the roof was built in double-pitch form, the temperature distribution on the roof surface showed obvious boundaries, and the temperature in the sunny area was about 25 °C higher than that in the shaded area. However, there were some low-temperature areas on the sunny side, like building roofs in buildings A, D, and E. This was caused by the white cement protrusions, and the reflectivity of white cement was 0.95, which was much higher than that of the blue surface roof (about 0.65) [
41]. In the meantime, it was observed that the temperature of the roof edge was around 26 °C. After an on-the-spot investigation, the roof edge was a corridor with a white cement surface (see
Figure 7 for details), and its temperature was basically the same as that of the protrusions.
Figure 12 shows the temperature distribution on the south walls of Yuquanting. It could be seen that only the south-facing façade of Building G received full direct solar radiation during the survey period. This was verified by inspecting the solar position and 3D model geometry, which revealed that adjacent buildings partially shaded other façades. Although a full shadow cast simulation was not conducted in this study, the observed solar exposure pattern aligns with the captured infrared data. As can be seen from
Figure 8, the brown cement surface was used in buildings G and I except for the top two floors. Since the reflectivity of the brown cement surface was only 0.25, the overall temperature of the sun-facing walls of buildings G and I was higher than that of the other sun-facing walls. The average temperature of sun-facing walls of buildings G and I were 40.5 °C and 37.6 °C, respectively. The other seven buildings only used brown layers on the balconies. Thus, we can see an obvious temperature difference (around 10~12 °C) between the balconies and other areas in
Figure 12. Further, all nine buildings had several low-temperature zones, which were from a strip shadow area caused by the balcony protrusion.
Figure 13 shows the temperature distribution of the southwest side wall of the building. The area-average temperature of the southwest side of buildings A, B, C, D, E, F, G, H, and I was 21 °C, 22.6 °C, 21.9 °C, 19.2 °C, 15.5 °C, 13.6 °C, 25 °C, 24.4 °C, and 27.7 °C, respectively. It could be seen that the southwest side of building F had the lowest area-averaged temperature (13.6 °C) due to the fact that building F was short in height; the solar radiation on the southwest side was basically shielded. Moreover, the southwest side temperature of the building I had the highest area-average temperature because it was coated with brown cement except for the top two floors. The southwest side of building G was a conjoined residential building, and the temperature distribution pattern was similar to the south walls in
Figure 12 since it received direct solar radiation. The temperature distributions of buildings A, C, and D were similar, with relatively high temperatures on the bottom two floors (around 36 °C) and warm temperatures (around 20 °C) on the other floors. This could be attributed to the color of the cement coating, the brown coating on the bottom two floors, and the light yellow coating on the other floors.
5. Discussion
In this study, the emissivity of building surfaces was uniformly set at 0.90 for simplification. However, we acknowledge that the actual emissivity varies depending on the surface material, color, and aging. This may introduce minor uncertainties in absolute temperature estimation. In future work, we plan to integrate deep learning-based material classification to automatically identify different surface types and assign material-specific emissivity values accordingly. This approach is expected to improve the accuracy of temperature retrieval in complex urban environments.
In future studies, thermal comfort indices such as the Universal Thermal Climate Index (UTCI) and Physiological Equivalent Temperature (PET) could be calculated using combined data from surface temperature, radiation, air temperature, wind speed, and humidity. These indices would help translate the thermal information into human-centered microclimatic insights, supporting outdoor space design and climate-sensitive planning.
Although the proposed approach shows promising accuracy and flexibility, several limitations remain. The study only captured winter-season data from a single site, limiting its generalizability. The effects of wind and atmospheric stability were not deeply analyzed, though they can influence thermal readings. In future work, we plan to integrate adaptive emissivity correction, expand monitoring to different seasons and building types (e.g., glass façades and metallic surfaces), and investigate thermal dynamics under variable meteorological conditions.
This study is our first step in measuring the urban thermal environment and retrieving building surface temperature using UAV-based thermal imaging. In future research, we will extend the investigation to different building types, such as wooden and glass curtain-wall buildings. In addition, seasonal comparisons will be performed, especially during summer periods with higher thermal loads.
Furthermore, geometric indicators such as the Sky View Factor (SVF) will be integrated into our analysis framework to assess the influence of solar access and radiative heat loss on the sky dome. This is expected to enhance our ability to explain spatial temperature patterns in complex urban settings. Future work will include additional campaigns in summer and transitional seasons to better capture seasonal variability in thermal performance.
The detailed 3D thermal maps produced in this study offer valuable inputs for climate-responsive planning. First, they help identify building surfaces with excessive heat retention, which can be targeted for retrofitting (e.g., through improved insulation or reflective coatings). Second, by analyzing how surface temperature correlates with material types and solar exposure, planners can refine building codes to promote heat-resilient façade materials in specific orientations. Third, this approach supports passive design optimization by visualizing diurnal heat load variations, which is essential for reducing cooling demand in summer. Overall, integrating thermal mapping into early-stage planning and retrofitting can enhance thermal comfort, reduce energy use, and increase urban resilience to climate change. This study contributes to UN Sustainable Development Goals 11.
In contrast to the winter findings, we anticipate significantly higher surface temperatures and thermal discomfort in summer due to increased solar intensity, reduced longwave heat loss, and higher air temperatures. Future campaigns will analyze these seasonal effects and their implications on façade design, energy loads, and urban comfort.
6. Conclusions
In this study, we developed a pioneering approach to measure the building wall temperature with high spatial-temporal resolution using drone-based thermal infrared imaging. The 3D reconstruction models are established both for visual light and thermal infrared images based on binocular vision. A thermal infrared image processing method is proposed here to transfer the image to temperature data with centimeter accuracy. We have demonstrated that this approach is highly efficient and flexible in obtaining a diurnal urban thermal environment and building surface temperature. Through the field measurement in the Xiong’an New Area, the following conclusions can be obtained:
The accuracy of our approach for inversing building temperature can be limited to 5 °C during our measurement.
The building surface temperature was highly linked to exposure to solar radiation. Thus, the highest temperature on the sunny side was 55 °C during noon time, while this value was 20 °C during the evening time.
The uneven distribution of building surface temperature was largest during noon time, with 8 °C to 28 °C on the sunny side and 5 °C to 13 °C on the shaded side (25–75% value). This uneven distribution was smallest during evening time.
The color of the cement coating was also an important factor in determining the building surface temperature. The darker the coating was, the lower the reflection of the solar radiation, which then resulted in higher building surface temperature. For instance, the yellow cement was generally 9~12 °C higher than the white cement during noon time.
In conclusion, this study presents an efficient and flexible measuring approach for the urban thermal environment and building surface temperature, which is of great importance for the urban climate and built environment field in shaping the next generation of autonomous monitoring. Moreover, our findings can be useful for urban planners in building a sustainable and comfortable thermal environment.


