Article

The Impact of Urban Digital Intelligence Transformation on Corporate Carbon Performance: Evidence from China

School of Economics, Lanzhou University, Lanzhou 730000, China
*
Author to whom correspondence should be addressed.
These authors contributed equally to this work.
Sustainability 2025, 17(12), 5591; https://doi.org/10.3390/su17125591
Submission received: 6 May 2025 / Revised: 31 May 2025 / Accepted: 4 June 2025 / Published: 18 June 2025
(This article belongs to the Special Issue Artificial Intelligence (AI) and Sustainability of Businesses)

Abstract

:
In response to urban digital intelligence transformation (DIT) and the rising global emphasis on corporate carbon performance (CP), this study leverages the “National New-Generation AI Innovation Development Pilot Zones” (NAIPZs) as a quasi-natural experiment. Utilizing an unbalanced panel of A-share listed firms from China’s Shanghai and Shenzhen stock exchanges between 2010 and 2022, this study employs a multi-period Difference-in-Differences (DID) model combined with propensity score matching (PSM-DID) to examine how urban DIT affects corporate CP and its underlying mechanisms. The results indicate that the policy significantly enhances corporate CP, with robustness confirmed through parallel trend, placebo, and PSM-DID tests. Heterogeneity analysis shows stronger effects for non-state-owned enterprises, high-pollution industries, and large enterprises. Mechanism analysis reveals that green technological innovation and R&D expenditure are key drivers of improved CP. The study concludes with policy suggestions including tailored regulation, the development of innovation platforms, strengthened R&D support, and the implementation of monitoring systems to better harness AI technologies for improving corporate carbon performance.

1. Introduction

As the global issue of climate change becomes increasingly severe, corporate carbon emissions have garnered widespread attention worldwide. Climate change has become a global challenge with profound impacts on human society and the natural environment [1]. In response to this challenge, governments and international organizations around the world are taking measures to advance the establishment of a low-carbon economy. Given this background, growing emphasis has been placed on the environmental impact of corporate carbon emissions worldwide. As key participants in economic activities, corporations contribute a significant portion of the global total emissions. Therefore, reducing corporate carbon emissions is not only a crucial means of addressing climate change but also an important way for companies to fulfill their social responsibilities and enhance their image. Many countries have already implemented carbon trading systems to incentivize companies to reduce emissions through market mechanisms [2]. Moreover, an increasing number of companies are proactively taking steps, such as improving production processes, using clean energy, and enhancing energy efficiency, to reduce their carbon footprint.
China has been actively advancing a comprehensive array of strategies to mitigate carbon emissions at the corporate level. These strategies encompass the promotion of clean energy utilization, enhancement of energy efficiency, and the enforcement of stringent environmental regulations and standards. Additionally, the government has provided economic incentives such as fiscal subsidies and tax breaks to encourage companies to reduce emissions and promote green, low-carbon development. Through these comprehensive measures, China is committed to significantly reducing carbon emissions to tackle the global climate change challenge.
As China’s economy enters a new phase of development, the Chinese government has launched initiatives for urban digital intelligence transformation (DIT). This initiative specifically emphasizes the deep integration of AI technology with urban business needs, exemplified by applications such as “AI + Industrial Economy”, “AI + Citizen Life”, and “AI + Smart City”. These multifaceted AI integrations aim to empower urban digital intelligence transformation, thereby promoting the modernization of urban governance systems and capabilities and reshaping urban development patterns. With the deepening of urban DIT, especially the widespread application of new-generation artificial intelligence technologies, unprecedented opportunities have emerged. These opportunities will greatly enhance the energy efficiency of enterprises and significantly reduce carbon emissions [3]. For instance, predictive maintenance in smart manufacturing utilizes AI to analyze equipment data, providing early warnings of potential failures to minimize downtime and resource wastage. Similarly, smart logistics and supply chain management leverage AI to optimize delivery routes and inventory control, reducing fuel consumption and carbon emissions. Renewable energy forecasting and management maximize wind and solar power generation efficiencies through precise meteorological data analysis. Collectively, these applications provide robust support for enterprises striving to achieve their energy conservation and emission reduction goals. Digital intelligence is not just a tool but an important means to promote efficiency improvement and technological innovation. It is gradually being integrated into various fields of economic and social development, and it has also played a positive role in ecological protection. Through the empowerment of digital intelligence, various industries are revitalized, and traditional industries have been able to undergo technological upgrades for transformation and improvement, thereby breathing new life into them under the new era’s background.
The concept of carbon performance (CP) was first introduced by Hoffmann and Busch, integrating the dual objectives of economic benefits and carbon emission reduction. It is regarded as a crucial metric for assessing the efficiency of carbon reduction efforts and the effectiveness of environmental policy implementation [4]. Corporate CP, as an integral part of corporate environmental performance, is comprehensive, emphasizing not only improvements in emission efficiency but also considering economic benefits. Research indicates that corporate CP is influenced by both internal and external factors. Internal factors include corporate carbon risk awareness and green innovation [5], while external factors encompass government supervision [6]. In the context of China’s accelerated transition towards a low-carbon development phase, exploring whether pilot programs for carbon emissions trading can incentivize companies to enhance their CP is essential. This exploration will contribute to objectively evaluating the impact of urban digital intelligence transformation on corporate low-carbon development, providing critical evidence for the nationwide promotion of such policies and the achievement of China’s “dual carbon” goals.
In this context, this study adopts the multi-period Difference-in-Differences (DID) model to examine the impact of urban DIT on corporate CP. Taking the pilot cities of new-generation artificial intelligence as examples, it deeply analyzes how digital transformation can improve corporate carbon emission performance by improving energy efficiency, promoting green technology innovation, and optimizing supply chain management. Moreover, heterogeneity analysis highlights the differential effects of urban DIT on enterprises based on ownership-type industry pollution intensity and enterprise scale. Further analysis shows that urban digital transformation can enhance corporate CP by promoting R&D investment and green technological innovation (GI). This paper seeks to offer theoretical insights and policy-oriented guidance for advancing urban sustainable development and promoting corporate green transformation. It hopes to help cities and enterprises take more effective measures to tackle the global challenge of climate change, balancing the dual objectives of sustainable economic growth and environmental conservation, thereby contributing to global climate mitigation efforts and the promotion of environmental sustainability.

2. Literature Review

Artificial intelligence (AI) has accelerated the process of urban DIT. As a key strategy for the advancement of the digital economy, urban DIT has become crucial in driving China’s economic transformation, industrial upgrading, and high-quality corporate development. For example, building open data platforms, industrial collaboration networks, and intelligent information systems helps break down “information silos” between enterprises, promotes information flow and resource sharing, and improves the targeting of budgeting and subsidy policies. At the same time, urban digital intelligence transformation provides a supportive environment for digital talents in employment and entrepreneurship, along with multi-level technical and resource support. Moreover, beyond efficient public service platforms, urban digital intelligence transformation is also advanced through the establishment of high-tech industrial parks and technology incubators. These bases offer comprehensive support to start-ups and promote the deep integration of technological and industrial innovation. Based on these facts, this research constructs a quasi-experimental design based on AI pilot initiatives and utilizes a multi-period DID approach to investigate how urban digital transformation influences corporate carbon performance, integrating both theoretical rationale and empirical analysis.
By reviewing existing literature, we observe that corporate CP has become a focal issue of great interest to both academia and industry. Current research on CP primarily focuses on its incentive mechanisms. Factors influencing green technology innovation (GTI) activities are extensive. Previous research indicates a multifaceted linkage between economic development and corporate CP, highlighting technological innovation and the adoption of clean energy as critical drivers for decreasing carbon intensity per unit of production [7]. Energy consumption and supply directly affect corporate carbon emissions; optimizing the energy structure and substituting clean energy significantly reduce carbon emissions [8]. International trade indirectly influences corporate carbon emissions by altering production models and energy consumption structures, with export-oriented industries presenting particularly prominent carbon emission issues [9]. In the process of urbanization, enhancing energy efficiency and developing public transportation help lower carbon emissions, although challenges brought by urban expansion cannot be ignored [10]. Adjustments in industrial structure, especially transitions towards low-carbon sectors, positively contribute to reducing corporate carbon emissions [11]. The new media environment promotes green technology activities among heavily polluting enterprises, thereby lowering their carbon emissions [12]. Environmental taxes positively influence companies in reducing carbon emissions [13]. Environmental regulation also plays a positive role in reducing corporate carbon emissions [14]. Moreover, the development of the digital economy and the Internet offers new opportunities to improve corporate energy efficiency and promote green technology innovation, with AI applications demonstrating significant potential in reducing carbon emissions [15]. However, although existing studies have extensively explored the factors influencing corporate CP, few have systematically examined the causal effect of urban DIT on corporate CP from this perspective. Given the significant potential of urban DIT in areas such as energy optimization and green innovation, this study aims to explore how urban DIT affects carbon emission efficiency and its underlying mechanisms from this new angle. In doing so, it expands the existing research framework on corporate CP.
Regarding the research on the impact of urban DIT on corporate CP, scholars primarily focus on the perspective of AI, examining how AI influences carbon emissions. The adoption of industrial robots can boost production effectiveness alongside environmental management proficiency, promoting corporate green transformation [16]. Intelligent transformations improve corporate green technology innovation by strengthening the allocation efficiency of production factors, encouraging information dissemination, raising R&D spending, and enhancing the deployment of human resources [17]. Applications of the Internet and information technology (IT) strengthen environmental monitoring and assessment capabilities, making environmental policies more precise and effective [18]. Within supply chain management practices, AI optimizes logistics and inventory management, reducing carbon footprints during transportation [19]. The implementation of intelligent manufacturing systems, utilizing AI for production scheduling and quality control, further decreases energy consumption and material waste in production processes [20]. AI significantly reduces carbon emissions during the process of promoting green technological innovation and enhancing the compatibility between humans and machines [21]. Additionally, AI’s powerful data analysis capabilities provide decision support for corporate management, helping identify emission reduction opportunities and implement effective environmental strategies [22]. The application of AI in environmental monitoring increases transparency regarding corporate environmental impacts, promoting compliance with environmental regulations and reducing non-compliance emissions [23]. Finally, through analyzing consumer behavior, AI helps businesses develop greener products that better meet market demands, facilitating a transition to a low-carbon market [24]. Previous research has primarily focused on the impact of AI technology itself on corporate CP, with less attention given to the effects of policy-driven urban DIT on corporate CP. Therefore, this study considers the establishment of National New-Generation AI Innovation Development Pilot Zones as a “natural experiment” for urban DIT, aiming to identify the causal effects of urban DIT on corporate performance.
In conclusion, extensive research has been conducted on the determinants of corporate CP and the influence of AI on corporate CP, providing a basis for investigating the linkage between urban DIT and corporate CP. However, previous research on the impact of AI on corporate CP has overlooked the mechanisms by which policy-driven urban DIT affects corporate CP. Compared with previous studies, the main contributions of this paper are the following: first, it combines the NAIPZ evaluation and corporate CP into a unified analytical framework. This approach explores the role of policy-empowered urban DIT in promoting corporate CP. By adopting a multi-period DID model and related robustness tests, the accuracy and reliability of the research results are ensured. Second, this study provides empirical evidence for understanding the heterogeneous impacts of NAIPZs on corporate CP, offering insights for targeted policy design. Third, it contributes to clarifying the underlying mechanisms through which NAIPZs enhance corporate CP. By examining the roles of green technology innovation (GI) and R&D investment, this research deepens the understanding of how NAIPZs influence corporate CP through different pathways. The findings offer theoretical support and practical implications for policymakers seeking to further improve NAIPZs and promote corporate CP development.

3. Theoretical Analysis and Research Hypotheses

3.1. Policy Background

With the rapid advancement of artificial intelligence technologies, their global economic and social impact has become increasingly significant. In this context, the Chinese State Council promulgated the “New-Generation Artificial Intelligence Development Plan” (hereafter referred to as the “Notice”) in 2017. The “Notice” outlined China’s development direction and key tasks in the field of artificial intelligence, emphasizing the importance of establishing NAIPZs. In 2019, to fulfill the directives of the “Notice”, the Ministry of Science and Technology released the “Guidelines for the Establishment of NAIPZs” (hereafter referred to as the “Guidelines”), officially initiating pilot zone construction at the prefecture-level city scale. The “Guidelines” provided specific instructions and standards for pilot zone construction, aiming to explore new models and pathways for AI development through pioneering policy measures. This initiative sought to facilitate the adoption and industrialization of AI technologies across various sectors. Between 2019 and 2023, the Ministry of Science and Technology established NAIPZs in 18 cities across seven phases. The establishment of these pilot zones promoted extensive cooperation with enterprises and investigated innovative approaches for the integrated advancement of AI technologies and commercial activities, exemplified by initiatives like the national new-generation AI open innovation platforms. The pilot zones seek to investigate innovative governance frameworks in the context of the AI era, establish AI as a key driver for urban digital transformation, and expedite the advancement of urban DIT. As of December 2024, 18 cities nationwide have been approved for the establishment of NAIPZs. Each city, based on its unique characteristics and development needs, has defined distinct objectives and focus areas. The construction of these pilot zones is a significant initiative by China to respond to global AI development trends and advance the construction of national strategic technological capabilities. It holds great importance for fostering the healthy development of China’s AI industry and advancing its strategic goals in technology.

3.2. Theoretical Analysis of the Impact of Urban DIT on Corporate CP

Amidst the challenges of global climate change, corporate CP serves as a vital metric for evaluating a firm’s sustainability capacity. Urban DIT, which leverages digital and intelligent technologies to modernize city management and operations, plays a significant role in influencing corporate CP [25]. Digital intelligence transformation contributes to the optimization of resource allocation, promotes higher energy utilization efficiency, diminishes energy consumption, and subsequently leads to a reduction in carbon emissions [26]. Additionally, with big data analytics and intelligent monitoring, companies can allocate resources and schedule production more precisely, reducing waste and further optimizing CP [19]. For example, smart manufacturing systems can dynamically adjust equipment operation statuses based on production schedules, avoiding unnecessary high-energy consumption activities. Meanwhile, energy management systems can achieve fine-grained monitoring of critical resources such as water, electricity, and gas through the use of sensors and the Internet of Things (IoT), thereby enhancing energy efficiency and reducing the carbon emission intensity per unit of output. Urban DIT also optimizes supply chain management by increasing transparency and efficiency, thereby reducing the carbon footprint in logistics and helping enterprises achieve low-carbon operations. For example, blockchain, cloud computing, and AI prediction models enable enterprises to monitor and optimize their supply chains and logistics operations more efficiently. This reduces empty loads, redundant transportation, and inventory cycles, thereby lowering carbon emissions from logistics activities. Urban DIT also enhances environmental supervision; by applying AI for monitoring and data analysis, cities can conduct continuous and multi-dimensional supervision of pollution emissions, improving the detection and enforcement of violations. In addition, urban DIT improves the collection and transparency of carbon data, providing enterprises with reliable data support for carbon accounting and the formulation of science-based emission reduction strategies [27].
Therefore, we hypothesize the following:
H1. 
Urban DIT significantly improves corporate CP by enhancing resource allocation efficiency, optimizing supply chain management, and strengthening regulatory oversight.

3.3. Path Analysis of the Impact of Urban DIT on Corporate CP

To explore the impact of urban DIT on corporate CP, we focus on the perspectives of technology and R&D investment.
On the one hand, urban DIT improves corporate CP through GI. According to dynamic capabilities theory, enterprises need to continuously update their resource allocation and organizational processes in response to a constantly changing environment in order to maintain a competitive advantage [28]. Urban DIT can enhance efficiency, optimize supply chains, and stimulate green technology innovation vitality in enterprises. The enhancement of green technological innovation capabilities significantly reduces corporate carbon emissions [2]. AI innovation pilot areas support improvements in corporate carbon efficiency by encouraging the use and development of eco-friendly technologies. The application of urban AI technologies and the improvement of informatization levels, enabled by intelligent monitoring and predictive analytics, contribute to more effective environmental management and strengthen oversight of corporate emissions. This compels companies to engage in green technological innovation and adopt cleaner production methods. Moreover, advancements in technology create opportunities to improve energy utilization efficiency, thereby reducing carbon emissions [7]. From the resource-based view (RBV), green technological innovation serves as a rare and difficult-to-imitate strategic resource that can help enterprises build sustainable competitive advantages [29]. Urban DIT enhances these capabilities by improving information levels, strengthening data processing abilities, and refining decision-making systems. Consequently, this empowers enterprises to better acquire, integrate, and apply both internal and external resources, thereby enhancing their green innovation capacity. According to cost–benefit theory, corporate green technology innovation helps reduce production costs and resource consumption [30]. Urban DIT drives the transformation of corporate production methods. The use of AI enhances departmental coordination, enabling precise production and improving efficiency and cleanliness. Such initiatives facilitate efficient resource allocation, enhance energy utilization, minimize waste and environmental contamination, and establish a basis for a sustainable and low-carbon economic development.
Therefore, we hypothesize the following:
H2a. 
Urban DIT significantly enhances corporate CP by driving corporate innovation and improving green technological innovation capabilities.
On the other hand, urban DIT enhances corporate CP through R&D expenditure. Based on endogenous growth theory, investment in research and development is essential for firms to gain and maintain their competitive edge [31]. Urban DIT incentivizes firms to increase their R&D investment in AI and related technologies, significantly impacting their technological innovation capabilities and CP. Digital intelligence transformation can stimulate corporate R&D investment through technology spillover effects. For example, high-tech companies and research institutions within a city may serve as sources of knowledge and technology, encouraging neighboring firms to increase their R&D expenditures. Government policies, such as subsidies and tax incentives, directly enhance corporate R&D spending. During urban DIT processes, governments often introduce favorable policies to promote increased R&D investment by firms. Additionally, improvements in the financing environment foster greater R&D investment by reducing financing costs. Urban DIT may create a more favorable financing environment, making it easier and less costly for companies to secure the capital needed for R&D [32]. Increased R&D investment directly drives technological advancements and innovation capabilities. From the perspective of institutional theory, the policy environment and market orientation shaped by urban DIT influence firms’ expectations regarding the “legitimacy” of their behaviors [33]. As societal attention to low-carbon development continues to grow, institutional pressures motivate enterprises to invest in green technology R&D and transition toward cleaner production methods. Increased R&D investment is one of the key drivers in this process [34]. It not only directly promotes the adoption of cleaner production practices and the optimization of energy structures but also contributes to the improvement of corporate governance and the scientific decision-making processes [35].
In summary, urban DIT incentivizes enterprises to increase R&D spending, significantly boosting their technological innovation capabilities and enhancing CP. Therefore, this paper proposes the following hypothesis:
H2b. 
Urban DIT significantly enhances corporate CP by incentivizing enterprises to increase R&D expenditure and improve technological innovation capabilities.
Based on the aforementioned research contents and hypotheses, this study constructs a theoretical framework, as presented in Figure 1.

4. Research Design and Methodology

4.1. Data and Sample

In order to ensure the robustness and credibility of the empirical findings, this study utilizes a sample comprising A-share listed companies from the Shanghai and Shenzhen stock exchanges over the period from 2010 to 2022. The company data are sourced from the CSMAR database, including basic company information, control variables, green patent data, and R&D investment calculations. The following data treatments were applied: ST, PT, and *ST companies were excluded, and financial sector data were also removed. To address the influence of outlier values, the control variables underwent 1% and 99% winsorization. Data on carbon performance were obtained from the China Statistical Yearbook and the China Energy Statistical Yearbook and subsequently merged with firm-level information to construct a final dataset comprising 14,120 observations.
To examine the impact of city-level factors on firm-level outcomes, we adopt the principle that macro-level conditions influence micro-level entities. Specifically, broader economic, social, and policy environments at the city level can shape the operating context and behavior of firms located within those cities. Based on this logic, we matched each firm-year observation with corresponding city-level control variables. This ensures that each firm is associated with the macroeconomic and institutional environment of its city during the relevant time period. As a result, the number of observations for city-level variables matches that of the firm-level dataset. Moreover, city-level data are derived from a panel data set covering 284 prefecture-level-and-above cities in China from 2010 to 2022. To address data gaps, missing values were supplemented using interpolation techniques. The original data primarily originate from the China City Statistical Yearbook and the China City Construction Statistical Yearbook. All regression analyses were performed using Stata-MP 18.0 software.

4.2. Variable Design

4.2.1. Dependent Variable

In this study, corporate carbon performance (CP) is measured by carbon usage per unit of revenue [36]. The CP metric is calculated as follows:
CP = CR/CCEs
where CR = corporate revenue, and CCE = corporate carbon emissions.
A higher value of this indicator reflects lower carbon emissions per unit of revenue, thereby indicating superior CP. Corporate greenhouse gas accounting follows the international standards outlined in the Greenhouse Gas Protocol, with data primarily sourced from disclosures made by Chinese firms in their social responsibility reports, sustainability reports, or environmental disclosure documents.

4.2.2. Independent Variables

In this study, urban DIT is represented as a dummy variable. We analyze the pilot zones by matching the experimental zones with the companies located within them, thus creating a dummy variable for enterprise-level pilot policies. Specifically, this is achieved by incorporating an interaction term between the dummy variable representing the construction period of the NAIPZs and the treatment group indicator.
The focus of the AI innovation and development pilot zone initiative lies in the 18 pilot zones designated in multiple batches between 2019 and 2022. The first batch of AI innovation development pilot zones in 2019 included Beijing, Shanghai, Tianjin, Shenzhen, Hangzhou, Hefei, and Huzhou. In 2020, Chongqing, Chengdu, Xi’an, Jinan, Guangzhou, and Wuhan were added. Suzhou, Changsha, Zhengzhou, Shenyang, and Harbin joined the list in 2021. These zones are part of China’s broader innovation-driven strategy, aimed at rapidly integrating AI into economic, social, and national defense sectors through these new pilot zones. The policy seeks to foster innovation in artificial intelligence technologies, advance the development of an intelligent economy, and build a smart society. It endeavors to proactively respond to emerging challenges and promote sustainable, human-centered intelligence by constructing an integrated framework that links knowledge, technology, and industry. In parallel, it emphasizes the establishment of supporting systems related to talent development, institutional structures, and cultural foundations.
Thus, these policy pilots provide technical support and policy incentives to businesses, fostering sustainable development through optimized resource allocation and improved management efficiency. This study primarily examines the impacts of establishing AI innovation and development pilot zones.

4.2.3. Control Variables

In this study, the enterprise-level control variables used to accurately assess the impact of urban DIT on corporate CP are as follows, based on previous research [37]. (1) Enterprise listing age (ListAge): The natural logarithm of one plus the difference between the current year and the firm’s listing year. This measures the historical experience of a company, reflecting its maturity and stability in the market. (2) Return on assets (ROA): The ratio of net profit to total assets, which is an indicator of profitability. It is the foundation for corporate resource allocation and investment decisions. (3) Cash flow ratio (CashFlow): The ratio of operating cash flow net amount to total asset value. This key resource reflects the company’s short-term financial situation and liquidity. (4) Financial leverage (Lev): The ratio of total liabilities to total assets at year-end, reflecting the company’s risk management and financial structure. (5) Equity concentration (TOP): The sum of the holdings of the top ten shareholders, which reflects the distribution of ownership and influences the company’s decision-making and governance efficiency. (6) Fixed asset ratio (Fixed): The share of net fixed assets in the total asset base, which is an important indicator for analyzing capital structure and operational models. It helps assess financial stability and long-term investment value. (7) Tobin’s Q (TobinQ): The ratio of market value to replacement cost of assets, which evaluates the market performance and investment efficiency of the company. It plays an important role in investment decisions, mergers and acquisitions, and strategic planning.
City-level control variables: Building on existing research, this study further incorporates city-level control variables based on previous studies to enhance the explanatory power of the model [38]. (1) Economic development level (PGDP): Calculated as the natural logarithm of regional GDP per capita, this indicator reflects the city’s economic scale and the living standards of its residents, which have a significant impact on the business operating environment and market opportunities. (2) Education level (EDU): Measured by the ratio of local educational expenditures to the local general budget expenditure. This ratio reflects the city’s investment in education, which directly affects the quality of the workforce and innovation capability. (3) Industrial structure (LND): This indicator, defined as the proportion of secondary industry value added to regional GDP, captures the economic structural features of a city and significantly influences business performance and competitiveness. (4) Financial development level (FIN): This metric, calculated as the year-end total loan balance of financial institutions divided by regional GDP, reflects the financial service capacity and environment of the city, which play a crucial role in determining firms’ access to financing and associated costs. (5) Degree of openness (OPEN): Represented by the logarithm of the number of foreign-invested enterprises plus one, this indicator measures the city’s openness and level of internationalization. It has a positive effect on attracting foreign investment, technology introduction, and promoting technological innovation and market expansion for businesses. By including these city-level control variables, this study can more comprehensively assess the impact of urban DIT on corporate CP while controlling for potential confounding effects from city characteristics.

4.2.4. Mechanism Variable

Green technology innovation (GI): In this study, green technology innovation is quantified by the number of green patent applications. The indicator, denoted as GI, is computed as the natural logarithm of one plus the annual count of green patents filed. These patents include both green invention patents and green utility model patents. Among these, green invention patents capture a firm’s capacity for innovation in environmentally friendly technologies designed to address issues such as pollution control and ecological degradation.
Research and development investment (RD): Measured by the ratio of a company’s R&D expenditure to its operating income, indicating the company’s commitment to technological innovation. This indicates the degree of resource allocation a firm dedicates to fostering sustainable development and technological advancements. Substantial investment in R&D not only signifies the company’s capability for innovation but also plays a pivotal role in boosting its competitiveness and market standing.
Specific definitions are provided in Table 1.

4.3. Modeling

As mentioned earlier, 18 prefecture-level cities in China have been approved for the construction of the NAIPZs. The establishment of these pilot zones has provided significant support for the development of the urban AI industry and digital intelligence transformation and has made an important contribution to the application of digital intelligence in specific business scenarios. This study employs the creation of the National New-Generation Artificial Intelligence Innovation Development Pilot Zones as a quasi-natural experiment to examine the effects of urban DIT on corporate CP. Listed companies located in these cities are designated as the treatment group, while listed companies in other cities serve as the control group. Since the years of establishment of the national technology transfer regional centers vary across different cities, and the traditional Difference-in-Differences (DID) model is suitable only for policy shocks occurring in the same year, this study, following the approach of Li et al., adopts the following Difference-in-Differences model for empirical analysis [39]:
C P i , t = β 0 + β 1 D I T i , t + β 2 c o n t r o l s i , t + C o r p o r a t e i + Y e a r t + ε i , t
where C P i , t represents the carbon performance of firm i in year t, and D I T i , t is a dummy variable indicating the interaction term between the policy period dummy and the treatment group dummy, specifically D I T i , t = treat × post. Here, treat × post serves as the policy dummy variable, where t r e a t i equals 1 if the city where the listed company is registered has been approved to establish a NAIPZ during the sample period, and 0 otherwise. Meanwhile, p o s t t equals 1 after the city has been approved for zone establishment, and 0 otherwise. The coefficient β represents the strength and direction of the relationship between each independent variable and the dependent variable. Specifically, β 0 is the intercept term in the regression equation, indicating the expected value of the dependent variable when all independent variables are equal to zero. β 1 and β 2 are regression coefficients, which indicate the expected change in the dependent variable for a one-unit increase in the corresponding independent variable, holding all other variables constant. Theoretically, the value of β can range from negative infinity to positive infinity. However, in practice, its magnitude is influenced by factors such as the distribution of the data, model specification, and sample size. This study focuses on the coefficient β 1 of the core explanatory variable D I T i , t , which reflects the impact of urban DIT on the explained variable C P i , t . Additionally, c o n t r o l s i t represents a series of control variables at the corporate level, while C o r p o r a t e i and Y e a r t denote individual fixed effects and year fixed effects, respectively. Finally, ε i , t represents the random error term.
To verify Hypotheses 2 and 3, this study adopts an effect mechanism analysis model, examining the pathways through which urban digital intelligence enhances corporate CP. Specifically, the analysis proceeds as follows:
M e c h a n i s m i , t = β 0 + β 1 D I T i , t + β 2 c o n t r o l s i , t + C o r p o r a t e i + Y e a r t + ε i , t
where M e c h a n i s m i , t represents the influence mechanism. The remaining variables are consistent with those in Equation (1).

5. Analysis of Empirical Results

5.1. Descriptive Statistics

Table 2 provides descriptive statistics for the variables analyzed in this study. The carbon performance (CP) variable exhibits a range from 0.246 to 2.389, reflecting substantial heterogeneity in firms’ carbon emission efficiencies. Such variation likely arises from differences in production processes, energy usage, and the extent to which low-carbon technologies are implemented. Such heterogeneity could be shaped by various factors, including firm size, industrial classification, and regional characteristics. With regard to return on assets (ROA), the values range from −1.13 to 0.969, with a standard deviation of 0.07, suggesting moderate dispersion in financial performance across the sample companies. The average financial leverage (Lev) is 41.1%, suggesting that the debt-to-asset ratio of the sample companies is at a reasonable level. Ownership concentration (TOP) varies notably, ranging from a minimum of 1.3% to a maximum of 90%, with a standard deviation of 0.149, suggesting relatively low variability within the dataset. The maximum value of economic development level (PGDP) is 12.58, and the minimum value is 7.601, showing evident economic development disparities between regions. The mean education level (EDU) is 18.5%, with a minimum of 2.20% and a maximum of 36.4%, reflecting significant differences in education levels across regions due to variations in their economic development. The degree of openness (OPEN) ranges from 0 to 8.471, with a standard deviation of 2.977, indicating increased volatility in the data, which may be attributed to regional differences in openness levels due to geographical conditions.
Corporate green technological innovation (GI) is assessed by the quantity of green patent applications. The CP values range from 0 to 6.142, indicating substantial heterogeneity among firms. Enterprises possessing green patents typically demonstrate a stronger commitment to environmental sustainability, whereas those lacking such patents often allocate fewer resources to environmental initiatives. These variations are shaped by differences in R&D capacity, market environments, and the extent of policy support.
R&D investment (RD) has a maximum value of 317.3% and a minimum value of 0%, suggesting significant individual differences in R&D investment among the sample companies. Companies with higher R&D investment ratios are likely to focus more on technological innovation and building long-term competitiveness, while companies with lower or zero R&D investment may invest less in R&D activities and are more inclined to rely on existing technologies and market resources. These differences may be influenced by multiple factors, including company strategic positioning, financial conditions, industry competition, and macroeconomic policies.

5.2. Benchmark Regression

The baseline regression results examining the effect of urban DIT on corporate CP are presented in the Table 3. The dependent variable is the CP of listed firms. In column (1), the model controls for firm and time fixed effects but does not include additional control variables. The regression results are positively significant, indicating that urban DIT significantly improves the CP of local listed companies. In column (2), some firm-level control variables are included. In column (3), all firm-level control variables are included. In column (4), city-level control variables are added to the model.

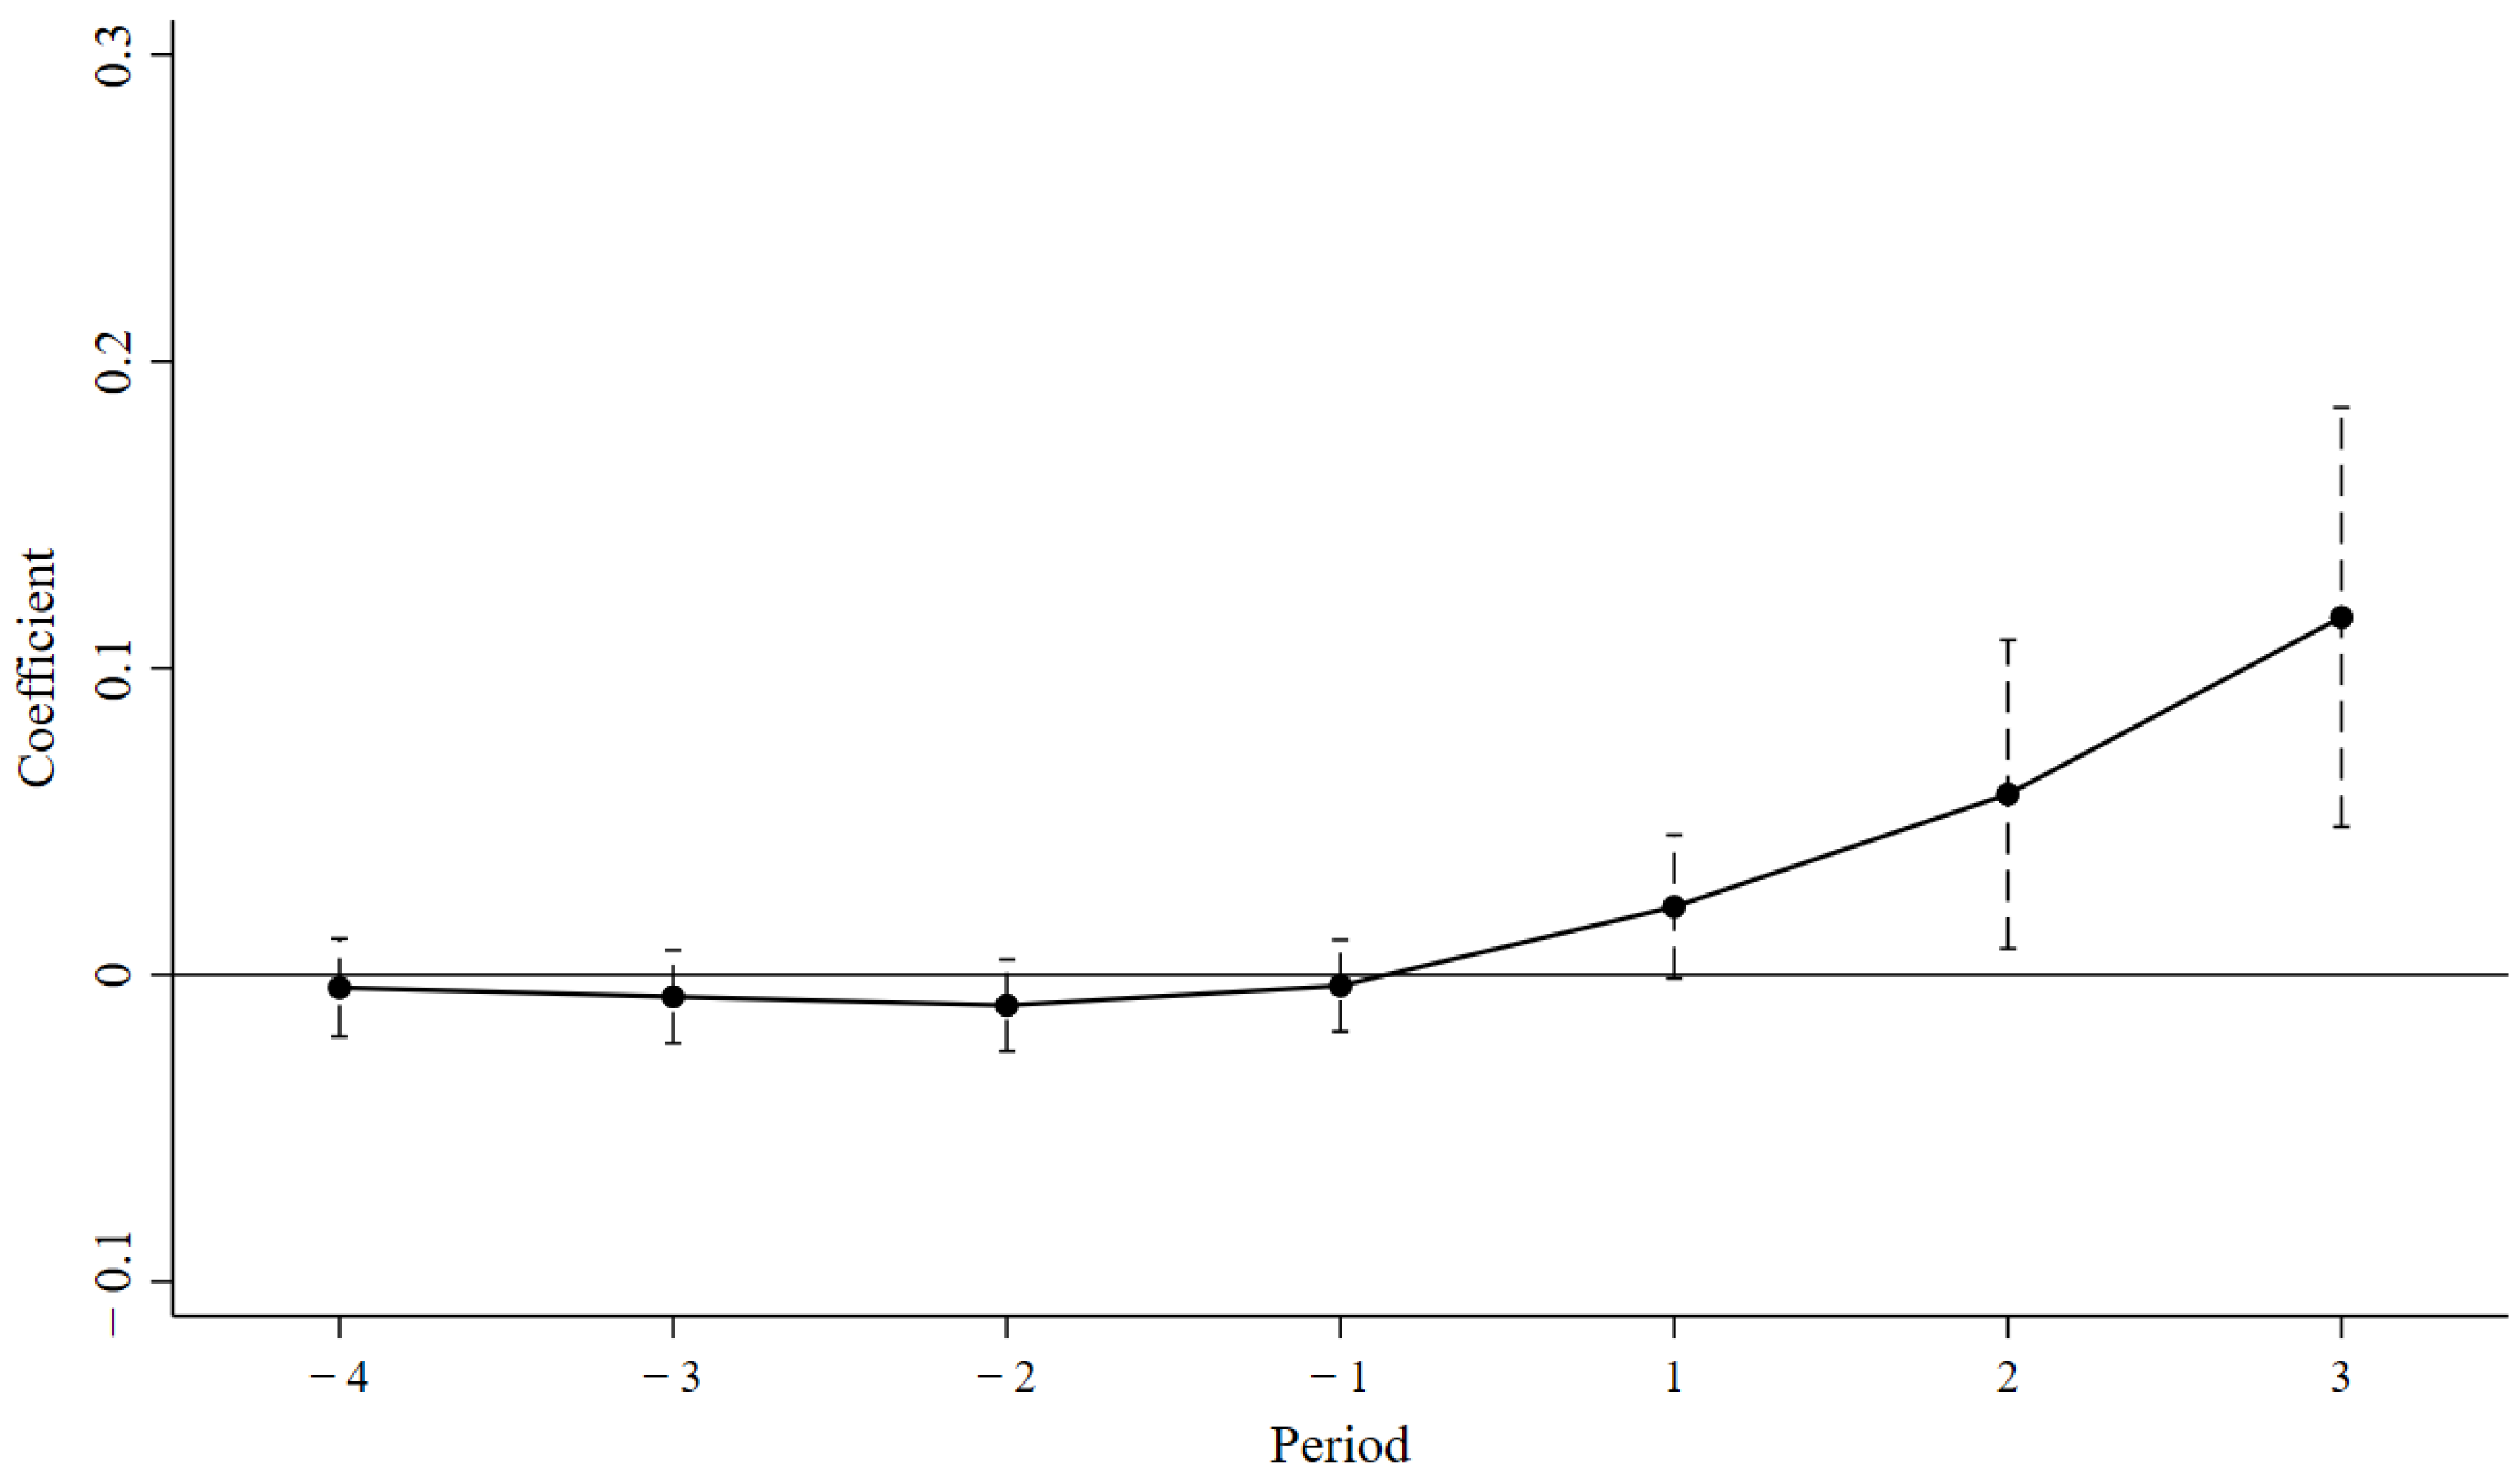
5.3. Parallel Trend Test

The parallel trend assumption is a prerequisite for conducting a DID analysis with multiple time points, meaning that the innovation levels of the treatment and control groups must follow a common trend before the policy intervention in order to use DID analysis. If significant pre-existing differences are present between the treatment and control groups before the policy implementation, the observed impact of urban DIT may be confounded by other influencing factors. Figure 2 illustrates the pre- and post-policy GI trends for both the treatment and control groups. Following standard practice, the period of policy implementation is excluded as the base period. The confidence intervals for the coefficients before the policy implementation include zero, indicating that the β values are not statistically significant. However, in the second year after policy implementation, the estimated values become significantly positive, showing a notable difference. This suggests that there were no systematic differences between the treatment and control groups before the policy was implemented, and that the impact of urban DIT on corporate CP performance exhibits a certain degree of latency. The delay is due to the time required for the policy’s effects to materialize.

5.4. Endogeneity and Robustness Test

To ensure that unobserved omitted variables do not bias the baseline regression results, this study conducts a placebo test. A pseudo-policy group is constructed by generating a pseudo-policy dummy variable, randomly selecting a list of dummy treatment groups of the same size as the treatment group from the total sample, with the remaining as the control group. This process is repeated 1000 times. As shown in Figure 3, the coefficients from the placebo test follow a normal distribution centered around zero, which is far from the true coefficient. Moreover, most of the p-values are above 0.1. The random coefficients are primarily located to the left of the true value of 0.0331 and are statistically significant at the 1% level. These results indicate that the improvement in corporate CP is due to the actual policy, rather than other random factors.
Considering the potential issue of omitted variables at the city level, where the corporate CP of listed companies could be influenced by city characteristics such as the urban environment, innovation atmosphere, government service capacity, and governance system, which may vary in their impact on corporate CP, this study further includes city fixed effects. The regression results are shown in Table 4. In column (1), the regression results with the dependent variable and urban DIT remain significantly positive, indicating that urban DIT has a positive impact on improving corporate CP, and the results are robust.
To verify the robustness of urban DIT’s impact on enhancing corporate CP, this research adopts an alternative metric for measuring CP. In the baseline regression, the dependent variable is replaced with the corporate carbon emissions index, which is calculated as the ratio of the corporate revenue divided by the product of the ratio of industry-level carbon emissions to industry operating costs and the corporate operating costs. Corporate CP is measured as revenue per unit of carbon emissions [40]. The robustness check is conducted, and the regression results, as shown in column (2) of Table 4, indicate that the regression of the dependent variable with urban DIT remains significantly positive, further confirming that urban DIT positively affects the improvement in CP.
To address potential endogeneity arising from sample selection bias, this study adopts the propensity score matching–Difference-in-Differences (PSM-DID) approach. This method pairs each treated observation with a comparable control observation, effectively approximating random assignment in the quasi-natural experiment. The matching process utilizes the study’s control variables as matching criteria, implementing 1:1 nearest neighbor matching with caliper restrictions to identify suitable control groups. Following successful matching, a staggered DID analysis is conducted on the matched sample. As presented in column (3) of Table 4, the regression outcomes using the common support sample demonstrate that the DIT coefficient remains statistically significant and positive, thereby reinforcing the reliability of the baseline regression findings.
Additionally, considering that urban DIT may be influenced by geographic location and other city characteristics, mega-cities and provincial capitals, compared to other cities, have a greater locational advantage. Therefore, to further clarify the impact of urban DIT on the innovation activities of businesses in cities of a certain scale, and especially to exclude the inherent influence of endogenous factors such as economic development between cities, the study conducts a robustness check with subsample analysis. Specifically, since Beijing, Shanghai, Guangzhou, and Shenzhen are four of China’s innovation reform frontiers and the most economically developed regions, they are likely to serve as pilot areas for urban DIT. Therefore, in column (4) of Table 4, these four mega-cities are excluded from the sample. In addition to these four cities, provincial capitals are the “vanguards” of economic development and possess stronger locational advantages. Thus, in column (4) of Table 4, provincial capitals are further excluded to improve the robustness of the research conclusions. The results in Table 4 demonstrate that urban DIT continues to exert a significantly positive effect on enterprise CP, further validating the robustness of our empirical findings.

5.5. Heterogeneity Analysis

To explore industrial heterogeneity, this study analyzes variations across corporate ownership structures, pollution-intensive sectors, and firm size categories. Specifically, we assess the impact of urban DIT on state-owned enterprises (SOEs) versus non-state-owned enterprises (non-SOEs), high-pollution enterprises (HPEs) versus non-high-pollution enterprises (non-HPEs), as well as on large enterprises (LEs) versus small and medium-sized enterprises (SMEs).
SOEs and their non-state counterparts exhibit distinct characteristics across multiple dimensions, including corporate governance structures, strategic priorities, and resource allocation mechanisms. These distinctions may significantly influence the extent to which firms prioritize green technology innovation and efforts to enhance CP, as well as the effectiveness of such initiatives. To investigate the potential moderating effect of ownership structure on the green innovation–CP relationship, we conduct subgroup analyses by categorizing sample firms into SOEs and non-SOEs, then estimating models (1) and (3) separately for each ownership type. As shown in Table 5, the coefficient of GI is 0.024 and 0.057, both significant at the 10% level, with SOEs showing a higher coefficient. This suggests that green technology innovation in SOEs more effectively enhances CP. This is because non-SOEs often face higher market competition and do not receive the same level of direct support and security from the government as SOEs. Therefore, they are more driven to adopt digital intelligence technologies to boost efficiency, optimize resources, cut costs, and improve corporate CP. Moreover, non-SOEs benefit from more flexible decision-making, enabling quicker responses to market changes and faster implementation of new technologies, thus enhancing corporate CP.
Furthermore, the impact of the policy varies by industry type. The results, shown in columns (3) and (4), reveal that in heavily polluting industries, the policy coefficient is 0.042, significant at the 5% level, while for non-HPEs, the coefficient is 0.011 and not significant. In HPEs, the application of digital intelligence technologies leads to more pronounced environmental performance improvements. This is due to two main factors: these industries have significant room for optimization in energy consumption and emissions, and they typically possess a strong automation foundation, making it easier to implement intelligent upgrades and achieve notable benefits. Additionally, policies tend to prioritize support for HPEs through financial subsidies, pilot projects, and technology promotion, creating a synergistic effect between policy incentives and technological advancements. These factors collectively result in greater corporate CP improvements in HPEs as they adopt digital intelligence technologies.
To distinguish firm size, we take the natural logarithm of firms’ total assets at the end of the year and divide the sample using the median value. Firms with asset values above the median are classified as large enterprises, while the rest are categorized as SMEs. The impact of urban DIT on different enterprise sizes is shown in columns (5) and (6) of the Table 5, with GI coefficients of 0.040 and 0.011, respectively. For LEs, the impact is significant at the 10% level, while for SMEs, the impact is not significant. This disparity primarily stems from the advantages that LEs possess in terms of financial resources, technical capabilities, and management systems, enabling them to more effectively leverage automation, IoT, big data, and other technologies to optimize production processes, improve energy efficiency, and reduce emissions. Additionally, their economies of scale and influence within supply chains facilitate overall green transformation. In contrast, SMEs face limitations due to financial shortages, inadequate technical capabilities, and difficulties in accessing policy support, making it challenging for them to effectively advance digital and intelligent transformation. Moreover, the immediate survival pressures faced by SMEs often lead them to prioritize short-term gains over long-term sustainable development.
The findings underscore the importance of tailoring policy design and implementation to account for the distinct features of various enterprise types and industrial sectors, thereby enhancing policy effectiveness and fostering corporate sustainability. Going forward, greater attention should be directed toward restructuring the governance systems of SOEs to improve their responsiveness to CP. At the same time, it remains essential to advance environmental enhancement initiatives within heavily polluting industries to drive improvements in overall CP outcomes.

5.6. Further Effect Mechanism Analysis

Our analysis shows that urban DIT enhances corporate CP levels through two main pathways: encouraging innovations in green technology and enhancing investment in R&D. The regression results of the effect mechanisms are presented in Table 6. The regression results indicate that the policy exerts a statistically significant positive impact (p < 0.05) on corporate GI, with an estimated effect size of 0.001. This positive relationship suggests that urban DIT has incentivized GI in enterprises. It not only directly boosts companies’ GI but also indirectly influences their overall performance. The empirical results further demonstrate that the policy significantly stimulates R&D investment (p < 0.10), showing a positive coefficient of 0.015. This evidence suggests that the policy effectively enhances corporate innovation capacity by boosting R&D expenditures, thereby facilitating technological progress and ultimately contributing to improved corporate performance.
Based on the above analysis, urban DIT plays a substantial role in improving corporate CP levels through enhanced GI and increased R&D investment. The analysis reveals dual policy mechanisms: direct intervention effects coupled with enterprise-driven pathways to sustainability through persistent GI and R&D commitments. These findings suggest policymakers should design targeted incentive schemes to stimulate corporate investment in strategic sectors, thereby creating mutually reinforcing economic–environmental benefits while maximizing societal welfare gains.

6. Conclusions and Policy Recommendations

6.1. Conclusions

This research employs the NAIPZ initiative as a quasi-natural experiment, analyzing panel data from Chinese listed firms during the 2010–2022 period. Utilizing a multi-period DID methodology, the investigation systematically assesses both the direct effects and transmission channels through which urban DIT influences corporate CP. The key findings can be summarized as follows:
  • The results of the baseline regression analysis reveal a statistically significant positive relationship between DIT and corporate CP. The baseline regression results, without incorporating control variables, reveal that urban DIT exhibits a positive and statistically significant coefficient of 0.035. After adding firm-level control variables, the coefficient for urban DIT remains at 0.035. When city-level control variables are included, the coefficient slightly decreases to 0.033. This suggests that after the policy implementation, corporate CP evaluations increased by 3.3%. The findings indicate that, even when considering both firm-level and city-level factors, urban DIT has a positive effect on corporate CP;
  • The parallel trends test supports the validity of the DID method. Before the pilot policy was implemented, the CP level trends for the treatment and control groups were consistent, showing comparability between the two groups prior to the policy’s implementation. Following the implementation of the policy, the treatment group exhibited a notable improvement in CP, whereas the control group showed no significant change. This outcome further substantiates the positive effect of the AI pilot policy on corporate CP;
  • An in-depth robustness analysis indicates that the placebo test, which assigns virtual strategies at random time points, yields no significant influence on corporate CP, thereby dismissing concerns related to random disturbances or model misspecification. Moreover, the application of the PSM-DID method—integrating propensity score matching with a Difference-in-Differences framework to address potential sample selection bias—further reinforces the reliability of the positive association between urban DIT implementation and corporate CP;
  • Industry heterogeneity analysis revealed that, under policy incentives, non-SOEs and heavily polluting industries experienced significant improvements in ESG performance, while state-owned enterprises showed less improvement compared to non-state-owned enterprises, and there was no significant impact on non-heavy-polluting industries. This may be attributed to the governance structure of these enterprises, the market pressure they face, and the policy-driven incentives;
  • Mechanism analysis shows that the implementation of the policy significantly enhanced corporate GI and R&D investment. Therefore, urban DIT, on the one hand, improves corporate CP performance by promoting innovation and enhancing green technology capabilities, and on the other hand, it incentivizes companies to increase R&D expenditure, which significantly boosts technological innovation and improves corporate CP performance.
These findings provide valuable insights into how urban DIT can effectively drive corporate sustainability and enhance environmental performance through innovation and investment in R&D.

6.2. Policy Recommendations

Building on the above findings, we offer specific recommendations aimed at improving the implementation of the NAIPZs and strengthening corporate CP. First, the construction of NAIPZs should continue to empower urban DIT, improve corporate CP, and achieve the goal of reducing urban carbon emissions. On the one hand, based on the experience of the current NAIPZs, efforts should be made to continue advancing the construction of these zones, creating replicable and scalable solutions to precisely support different regions and promote urban DIT. The leading role of NAIPZs in urban DIT should be fully utilized. At the same time, attention should be given to the targeted promotion of the experiences from NAIPZs, with local governments tailoring the improvement of corporate CP based on regional characteristics. On the other hand, based on the local functional positioning, economic development, and resource endowment, experiences should be cautiously and boldly adopted. Local governments should formulate innovation incentive policies based on local characteristics to guide enterprises in relying on urban DIT to enhance technological capabilities, increase innovation capacity, optimize energy consumption structures, and improve energy efficiency, thereby leveraging urban DIT’s positive effects on both the technological and energy sides to reduce corporate carbon emissions and achieve sustainable development.
Second, precise policies should be formulated based on the heterogeneity of enterprises, constructing a more-efficient urban DIT empowerment system and a greener enterprise production system. The impact of urban DIT on corporate CP is shaped by both the characteristics of the enterprise itself and industry heterogeneity, leading to different evolutionary paths. Therefore, policy formulation to promote corporate CP should fully consider the differences and targeting of the policies. For SOEs, special reform actions should be carried out, focusing on ownership systems, governance structures, and incentive mechanisms. To boost the market competitiveness and innovation capacity of SOEs, a more diversified ownership structure should be promoted. Additionally, a carbon performance-oriented evaluation mechanism should be developed, incorporating CP targets into the assessment of corporate executives. This would incentivize SOEs to transition from traditional scale-driven growth models toward more-sustainable development approaches. More financial support and policy incentives for SOEs in the fields of CP and AI research and development should be provided.
For non-state-owned enterprises, the impact of urban DIT on CP is more pronounced. Therefore, the government should use AI and other technologies to empower tax reductions, subsidies, and innovation funds to provide smarter and more-efficient financial support for non-SOEs, encouraging them to increase R&D investment and adopt green technologies. Policy measures should also be used to improve the financing environment for non-SOEs and reduce their financing costs for green transformation. For HPEs, stricter environmental standards should be implemented, prompting enterprises to accelerate technological upgrades and adopt clean production technologies and circular economy models, reducing resource consumption and waste emissions. Strengthening environmental supervision HPEs through AI-based environmental monitoring and data analysis will enhance government regulatory efficiency and effectiveness. Companies violating regulations should face severe penalties to raise the cost of non-compliance. AI can also empower the construction of green supply chains, guiding HPEs to establish green supply chains and enhancing the green level of the entire industry chain through supply chain management. For non-HPEs, they should be encouraged to implement green management practices and obtain relevant environmental certifications to improve their market competitiveness. Financial incentives such as subsidies and tax reductions should be used to encourage these enterprises to invest more resources in green technology and product innovation, strengthening their competitive advantage.
For SMEs, the government should increase support by establishing special green digitalization funds, providing tax incentives, and facilitating access to financing, in order to reduce the costs and barriers associated with technological upgrades. At the same time, the construction of public service platforms for green technology R&D and application should be strengthened, offering SMEs affordable technical consulting, talent training, and data support to enhance their digital and intelligent capabilities. In addition, carbon performance indicators can be integrated into government procurement and credit approval processes to encourage SMEs to prioritize sustainable development. On the other hand, large enterprises should play a leading role in the industrial chain by promoting the establishment of green supply chain systems and facilitating coordinated emission reductions among upstream and downstream SMEs. By combining policy guidance with market mechanisms, the disparities among firms in the process of green transformation can be gradually reduced, leading to broader and more balanced improvements in environmental performance.
Additionally, enterprises may face several challenges during the transition, including a lack of technical support, financial shortages, and talent deficiencies. The government can provide technical support and services to help non-SOEs identify and adopt effective green technologies and management practices. A special green technology innovation fund for enterprises can be established, encouraging companies to collaborate with universities and research institutions on green technology research and development, promoting the commercialization of technological achievements. Through industry–academia–research cooperation, innovation alliances can be formed to share resources and accelerate technological innovation and knowledge transfer. Financial institutions should be encouraged to offer green credit, green bonds, and other financial instruments aimed at reducing corporate financing burdens. Greater support should also be provided for talent development and the adoption of advanced technologies within heavily polluting sectors. This would encourage firms to integrate innovative green technologies and adopt best practices in environmental management, thereby enhancing their CP.
Finally, a multi-faceted collaboration framework and mechanism should be established, where by integrating resources from the governmental bodies, enterprises, academic institutions, and financial entities, a collaborative approach can be established to collectively enhance corporate carbon CP. A diversified cooperation mechanism, guided by government policies, with enterprises as the main player, participation from universities and research institutions, support from financial institutions, and involvement from the public and social supervision, should be built to form a strong synergy for promoting corporate CP. In practice, multi-stakeholder cooperation mechanisms may also encounter challenges such as conflicts of interest and coordination difficulties. For example, enterprises may experience negative impacts on short-term profits due to increased investment in environmental protection, leading to tensions with the government’s sustainable development goals. Financial institutions may lack motivation due to the relatively long payback periods of green projects. In addition, public oversight mechanisms may become merely symbolic if they lack adequate information transparency. To address these issues, it is necessary to introduce a multi-level coordination mechanism: first, to alleviate the cost pressures associated with corporate transformation through policy compensation mechanisms; second, to establish cross-departmental collaboration platforms that enable policy coordination and resource sharing; and third, to introduce third-party evaluation agencies to conduct independent monitoring and feedback, thereby enhancing the fairness and transparency of policy implementation.

6.3. Discussion and Outlook

This study only examines the effect of the AI pilot policy on corporate CP. However, given the ongoing evolution of market and enterprise environments, it is essential to continuously evaluate and optimize policy directions and technical support measures. Policymakers need to closely monitor the effectiveness of the policy implementation and make timely adjustments to policy directions and priorities. For example, policy measures should be tailored according to the developmental stages of various industries and enterprises. This approach aims to enhance the precision and efficacy of such policies by addressing the specific needs and contexts of different sectors and companies. Establishing a policy evaluation and feedback mechanism is crucial. Regular assessments and summaries of the AI pilot policy, coupled with feedback from enterprises and other social sectors, provide a foundation for policy adjustments and optimization. Concurrently, enhancing policy promotion and training can improve enterprises’ understanding and acceptance, thereby increasing the adaptability and effectiveness of policy implementation.
Moreover, this study has its limitations, and future research could expand on several fronts. First, it is worthwhile to investigate the potential interactions between the AI pilot policy and other relevant initiatives, such as the Broadband China pilot program, environmental regulations, and industrial development policies. Research could investigate how policy integration and collaborative promotion can maximize policy effectiveness. Second, conducting cross-regional comparative studies could offer insights by contrasting policies and practices in different regions or countries that promote corporate CP, analyzing successful cases and challenges to provide an international perspective for policymaking. Third, employing a variety of research methods—such as big data analytics, case study approaches, and field investigations—could offer a more comprehensive understanding of how AI pilot policies influence corporate CP, while also uncovering the underlying micro-level mechanisms and the evolving nature of policy impacts.
In conclusion, the AI pilot policy provides important momentum and valuable opportunities for promoting improvements in corporate CP. Achieving successful implementation of this policy, however, necessitates a collaborative approach involving governmental bodies, businesses, non-governmental organizations, financial entities, and other relevant parties. Through continuous refinement of policy strategies, enhancement of cooperative endeavors, and innovation in research methodologies, we can more effectively utilize AI technologies to foster corporate sustainability. This will contribute more substantially to attaining balanced economic, social, and environmental advancement.

Author Contributions

Conceptualization, H.J.; Resources, H.J.; Writing—original draft, Z.W.; Writing—review & editing, J.W. All authors have read and agreed to the published version of the manuscript.

Funding

This research was funded by the National Social Science Fund Project.

Institutional Review Board Statement

Not applicable.

Informed Consent Statement

Not applicable.

Data Availability Statement

The data presented in this study are available upon request from the corresponding authors.

Conflicts of Interest

The authors declare no conflicts of interest.

References

  1. Conversi, D. The ultimate challenge: Nationalism and climate change. Natl. Pap. 2020, 48, 625–636. [Google Scholar] [CrossRef]
  2. Chen, Z.; Zhang, X.; Chen, F. Do carbon emission trading schemes stimulate green accessed innovation in enterprises? Evidence from China. Technol. Forecast. Soc. Change 2021, 168, 120744. [Google Scholar] [CrossRef]
  3. Chen, P.; Gao, J.; Ji, Z.; Liang, H.; Peng, Y. Do artificial intelligence applications affect carbon emission performance?—Evidence from panel data analysis of Chinese cities. Energies 2022, 15, 5730. [Google Scholar] [CrossRef]
  4. Hoffmann, V.H.; Busch, T. Corporate carbon performance indicators: Carbon intensity, dependency, exposure, and risk. J. Ind. Ecol. 2008, 12, 505–520. [Google Scholar] [CrossRef]
  5. Zhu, B.; Xu, C.; Wang, P.; Zhang, L. How does internal carbon pricing affect corporate environmental performance? J. Bus. Res. 2022, 145, 65–77. [Google Scholar] [CrossRef]
  6. Pan, J.; Du, L.; Wu, H.; Liu, X. Does environmental law enforcement supervision improve corporate carbon reduction performance? Evidence from environmental protection interview. Energy Econ. 2024, 132, 107441. [Google Scholar] [CrossRef]
  7. Xie, Z.; Wu, R.; Wang, S. How technological progress affects the carbon emission efficiency? Evidence from national panel quantile regression. J. Clean. Prod. 2021, 307, 127133. [Google Scholar] [CrossRef]
  8. Zheng, H.; Song, M.; Shen, Z. The evolution of renewable energy and its impact on carbon reduction in China. Energy 2021, 237, 121639. [Google Scholar] [CrossRef]
  9. Zhang, R.; Sharma, R.; Tan, Z.; Kautish, P. Do export diversification and stock market development drive carbon intensity? The role of renewable energy solutions in top carbon emitter countries. Renew. Energy 2022, 185, 1318–1328. [Google Scholar] [CrossRef]
  10. Li, R.; Li, L.; Wang, Q. The impact of energy efficiency on carbon emissions: Evidence from the transportation sector in Chinese 30 provinces. Sustain. Cities Soc. 2022, 82, 103880. [Google Scholar] [CrossRef]
  11. Zheng, J.; Shao, X.; Liu, W.; Kong, J.; Zuo, G. The impact of the pilot program on industrial structure upgrading in low-carbon cities. J. Clean. Prod. 2021, 290, 125868. [Google Scholar] [CrossRef]
  12. Li, Z.; Huang, Z.; Su, Y. New media environment, environmental regulation and corporate green technology innovation: Evidence from China. Energy Econ. 2023, 119, 106545. [Google Scholar] [CrossRef]
  13. Doğan, B.; Chu, L.K.; Ghosh, S.; Truong, H.H.D.; Balsalobre-Lorente, D. How environmental taxes and carbon emissions are related in the G7 economies? Renew. Energy 2022, 187, 645–656. [Google Scholar] [CrossRef]
  14. Neves, S.A.; Marques, A.C.; Patrício, M. Determinants of CO2 emissions in European Union countries: Does environmental regulation reduce environmental pollution? Econ. Anal. Policy 2020, 68, 114–125. [Google Scholar] [CrossRef]
  15. Zhang, L.; Mu, R.; Zhan, Y.; Yu, J.; Liu, L.; Yu, Y.; Zhang, J. Digital economy, energy efficiency, and carbon emissions: Evidence from provincial panel data in China. Sci. Total Environ. 2022, 852, 158403. [Google Scholar] [CrossRef] [PubMed]
  16. Liang, P.; Sun, X.; Qi, L. Does artificial intelligence technology enhance green transformation of enterprises: Based on green innovation perspective. Environ. Dev. Sustain. 2024, 26, 21651–21687. [Google Scholar] [CrossRef]
  17. Gao, Q.; Cheng, C.; Sun, G. Big data application, factor allocation, and green innovation in Chinese manufacturing enterprises. Technol. Forecast. Soc. Change 2023, 192, 122567. [Google Scholar] [CrossRef]
  18. Khuntia, J.; Saldanha, T.J.; Mithas, S.; Sambamurthy, V. Information technology and sustainability: Evidence from an emerging economy. Prod. Oper. Manag. 2018, 27, 756–773. [Google Scholar] [CrossRef]
  19. Hasan, M.; Islam, M.Z.; Sumon, M.F.I.; Osiujjaman, M.; Debnath, P.; Pant, L. Integrating artificial intelligence and predictive analytics in supply chain management to minimize carbon footprint and enhance business growth in the USA. J. Bus. Manag. Stud. 2024, 6, 195–212. [Google Scholar] [CrossRef]
  20. Waltersmann, L.; Kiemel, S.; Stuhlsatz, J.; Sauer, A.; Miehe, R. Artificial intelligence applications for increasing resource efficiency in manufacturing companies—A comprehensive review. Sustainability 2021, 13, 6689. [Google Scholar] [CrossRef]
  21. Lu, Y.; Liao, Z. The influence of AI application on carbon emission intensity of industrial enterprises in China. Sci. Rep. 2025, 15, 12585. [Google Scholar] [CrossRef] [PubMed]
  22. Benzidia, S.; Makaoui, N.; Bentahar, O. The impact of big data analytics and artificial intelligence on green supply chain process integration and hospital environmental performance. Technol. Forecast. Soc. Change 2021, 165, 120557. [Google Scholar] [CrossRef]
  23. Ameh, B. Digital tools and AI: Using technology to monitor carbon emissions and waste at each stage of the supply chain, enabling real-time adjustments for sustainability improvements. Int. J. Sci. Res. Arch. 2024, 13, 2741–2754. [Google Scholar] [CrossRef]
  24. Zheng, L.J.; Zhang, J.Z.; Lee, L.Y.S.; Jasimuddin, S.M.; Kamal, M.M. Digital technology integration in business model innovation for carbon neutrality: An evolutionary process model for SMEs. J. Environ. Manag. 2024, 359, 120978. [Google Scholar] [CrossRef]
  25. Guo, X.; Xu, J. Can urban digital intelligence transformation promote corporate green innovation? Evidence from China. J. Environ. Manag. 2024, 371, 123245. [Google Scholar] [CrossRef]
  26. Chong, Y.; Zhang, Y.; Di, D.; Chen, Y.; Wang, S. Digital transformation and synergistic reduction in pollution and carbon Emissions—An analysis from a dynamic capability perspective. Environ. Res. 2024, 261, 119683. [Google Scholar] [CrossRef] [PubMed]
  27. Cheng, K.; Jin, Z.; Wu, G. Unveiling the role of artificial intelligence in influencing enterprise environmental performance: Evidence from China. J. Clean. Prod. 2024, 440, 140934. [Google Scholar] [CrossRef]
  28. Li, D.-y.; Liu, J. Dynamic capabilities, environmental dynamism, and competitive advantage: Evidence from China. J. Bus. Res. 2014, 67, 2793–2799. [Google Scholar] [CrossRef]
  29. Andersén, J. A relational natural-resource-based view on product innovation: The influence of green product innovation and green suppliers on differentiation advantage in small manufacturing firms. Technovation 2021, 104, 102254. [Google Scholar] [CrossRef]
  30. Seman, N.A.A.; Govindan, K.; Mardani, A.; Zakuan, N.; Saman, M.Z.M.; Hooker, R.E.; Ozkul, S. The mediating effect of green innovation on the relationship between green supply chain management and environmental performance. J. Clean. Prod. 2019, 229, 115–127. [Google Scholar] [CrossRef]
  31. Romer, P.M. The origins of endogenous growth. J. Econ. Perspect. 1994, 8, 3–22. [Google Scholar] [CrossRef]
  32. Boeing, P.; Eberle, J.; Howell, A. The impact of China’s R&D subsidies on R&D investment, technological upgrading and economic growth. Technol. Forecast. Soc. Change 2022, 174, 121212. [Google Scholar]
  33. Zhang, K.; Pan, Z.; Zhang, K.; Ji, F. The effect of digitalization transformation on greenwashing of Chinese listed companies: An analysis from the dual perspectives of resource-based view and legitimacy. Front. Environ. Sci. 2023, 11, 1179419. [Google Scholar] [CrossRef]
  34. Chen, Z.; Zhang, Y.; Wang, H.; Ouyang, X.; Xie, Y. Can green credit policy promote low-carbon technology innovation? J. Clean. Prod. 2022, 359, 132061. [Google Scholar] [CrossRef]
  35. Zhang, Q.; Chen, L.; Feng, T. Mediation or moderation? The role of R&D investment in the relationship between corporate governance and firm performance: Empirical evidence from the Chinese IT industry. Corp. Gov. Int. Rev. 2014, 22, 501–517. [Google Scholar]
  36. Bolton, P.; Kacperczyk, M. Do investors care about carbon risk? J. Financ. Econ. 2021, 142, 517–549. [Google Scholar] [CrossRef]
  37. Huang, Y.; Liu, S.; Gan, J.; Liu, B.; Wu, Y. How does the construction of new generation of national AI innovative development pilot zones drive enterprise ESG development? Empirical evidence from China. Energy Econ. 2024, 140, 108011. [Google Scholar] [CrossRef]
  38. Liu, X.; Li, Y.; Chen, X.; Liu, J. Evaluation of low carbon city pilot policy effect on carbon abatement in China: An empirical evidence based on time-varying DID model. Cities 2022, 123, 103582. [Google Scholar] [CrossRef]
  39. Li, P.; Lu, Y.; Wang, J. Does flattening government improve economic performance? Evidence from China. J. Dev. Econ. 2016, 123, 18–37. [Google Scholar] [CrossRef]
  40. Yu, P.; Hao, R.; Cai, Z.; Sun, Y.; Zhang, X. Does emission trading system achieve the win-win of carbon emission reduction and financial performance improvement?—Evidence from Chinese A-share listed firms in industrial sector. J. Clean. Prod. 2022, 333, 130121. [Google Scholar] [CrossRef]
Figure 1. Theoretical framework.
Sustainability 17 05591 g001
Figure 2. Parallel trend test.
Sustainability 17 05591 g002
Figure 3. Placebo tests.
Sustainability 17 05591 g003
Table 1. Variable definition.
Variable Type Variable NameVariable SymbolMeasurement Method
Independent variablesDigital intelligence
transformation
DITTreat × post
Dependent variablesCarbon performanceCPCorporate revenue/corporate carbon emissions
Corporate control variablesCorporate listing ageListAgeLn (the current year − the listing year + 1)
Return on assetsROANet profit/total assets
Cash flow ratioCashFlowNet cash flow from operating activities/total assets
Financial leverageLevTotal liabilities at year-end/total assets at year-end
Equity concentrationTOPThe sum of the shareholding percentages of the top ten shareholders
Fixed asset ratioFIXEDNet fixed assets/total assets
Tobin’s QTobinQMarket value/replacement cost of assets
City control variablesEconomic development levelECOLn (per capita regional)
Education levelEDULocal education expenditure/local fiscal general budget expenditures
Industrial structureLNDThe added value of the secondary industry/regional GDP
Financial development levelFINThe balance of loans from financial institutions at year-end/regional GDP
Degree of opennessOPENLn (the number of foreign
− invested enterprises + 1)
Mechanism variableGreen technological
innovation
GILn (green patent applications + 1)
Research and
development
R&DR&D expenditure/revenue
Table 2. Descriptive statistics of variables.
VariableNMeanSDMinMax
CP14,1200.4750.7340.2462.389
DIT14,1200.1870.39001
ListAge14,1202.0010.94903.497
ROA14,1200.04700.0700−1.1300.969
CashFlow14,1200.05000.0710−0.5280.726
Lev14,1200.4110.2050.008000.994
TOP14,1200.3460.1490.013000.900
FIXED14,1200.2230.15400.912
TobinQ14,1202.0482.2070.681122.2
PGDP14,12010.230.7887.60112.58
EDU14,1200.1850.03700.02200.364
LND14,12044.0611.8719.24026.49
FIN14,1200.9650.5650.07506.193
OPEN14,1202.9772.02908.471
GI14,1200.3900.82306.142
RD14,1200.06602.6630317.3
Table 3. Benchmark regression results.
(1)(2)(3)(4)
CPCPCPCP
DIT0.035 ***0.034 ***0.034 ***0.033 **
(0.0077)(0.0099)(0.0096)(0.0105)
ListAge 0.033 ***0.031 **0.032 **
(0.0061)(0.0219)(0.0192)
ROA 0.182 ***0.218 ***0.219 ***
(0.0076)(0.0047)(0.0046)
CashFlow −0.019−0.018−0.020
(0.7426)(0.7569)(0.7231)
Lev 0.086 **0.087 **
(0.0183)(0.0163)
TOP 0.1410.140
(0.2415)(0.2446)
FIXED 0.0240.022
(0.5972)(0.6331)
TobinQ −0.002−0.002
(0.1608)(0.1685)
PGDP 0.007
(0.6158)
EDU −0.056
(0.6695)
LND −0.001 **
(0.0424)
FIN −0.002
(0.7254)
OPEN 0.000
(0.9531)
_cons0.456 ***0.370 ***0.287 ***0.285 *
(0.0000)(0.0000)(0.0000)(0.0998)
Corporate FEYesYesYesYes
Year FEYesYesYesYes
N14,12014,12014,12014,120
R20.6950.6960.6960.696
* p < 0.1. ** p < 0.05. *** p < 0.01.
Table 4. Robustness test results.
(1)(2)(3)(4)
CPCPCPCP
DIT0.031 **0.051 ***0.031 **0.042 **
(0.0178)(0.0054)(0.0160)(0.0127)
ListAge0.032 **0.020 *0.031 **0.026
(0.0193)(0.0868)(0.0239)(0.1979)
ROA0.225 ***0.137 **0.208 **0.249 **
(0.0027)(0.0160)(0.0111)(0.0348)
CashFlow−0.012−0.024−0.0130.010
(0.8349)(0.6786)(0.8291)(0.9060)
Lev0.083 **0.088 ***0.087 **0.100 *
(0.0198)(0.0037)(0.0202)(0.1000)
TOP0.1610.0160.1490.219
(0.1923)(0.7719)(0.2386)(0.3109)
FIXED0.041−0.0060.0200.108
(0.3738)(0.8737)(0.6805)(0.2237)
TobinQ−0.003−0.003−0.002−0.003
(0.1265)(0.2040)(0.1580)(0.2209)
PGDP0.0210.0030.0060.009
(0.1301)(0.8187)(0.6672)(0.6554)
EDU−0.010−0.123−0.077−0.140
(0.9430)(0.3342)(0.5696)(0.4618)
LND−0.001 **−0.002 ***−0.002 **−0.001
(0.0214)(0.0006)(0.0309)(0.1747)
FIN−0.002−0.006−0.011−0.003
(0.7794)(0.3686)(0.4603)(0.7764)
OPEN0.001−0.005−0.000−0.001
(0.8718)(0.5434)(0.9963)(0.9094)
_cons0.1300.439 ***0.313 *0.254
(0.4829)(0.0035)(0.0982)(0.3505)
Corporate FEYesYesYesYes
Year FEYesYesYesYes
City FEYesNoNoNo
N14,12010,91113,7909022
R20.6970.7630.6930.675
* p < 0.1. ** p < 0.05. *** p < 0.01.
Table 5. Analysis of heterogeneity.
(1)(2)(3)(4)(5)(6)
SOEsnon-SOEsHPEsnon-HPEsLEsSMEs
DIT0.024 *0.057 *0.042 **0.0110.040 *0.011
(0.0621)(0.0772)(0.0127)(0.4917)(0.0543)(0.4917)
ListAge0.040 **0.0540.0260.029 **0.0840.029 **
(0.0127)(0.1577)(0.1979)(0.0277)(0.1764)(0.0277)
ROA0.234 **0.1420.249 **0.175 ***0.1420.175 ***
(0.0115)(0.1520)(0.0348)(0.0050)(0.2090)(0.0050)
CashFlow−0.009−0.0630.010−0.077 *0.086−0.077 *
(0.8873)(0.5971)(0.9060)(0.0869)(0.5171)(0.0869)
Lev0.088 *0.093 *0.100 *0.0550.0620.055
(0.0649)(0.0914)(0.1000)(0.1750)(0.2898)(0.1750)
TOP0.2310.0750.2190.004−0.0080.004
(0.2786)(0.4134)(0.3109)(0.9527)(0.9135)(0.9527)
FIXED0.0070.0600.1080.018−0.0060.018
(0.9182)(0.1881)(0.2237)(0.7190)(0.9116)(0.7190)
TobinQ−0.002−0.006−0.003−0.002−0.001−0.002
(0.3118)(0.1428)(0.2209)(0.3390)(0.7579)(0.3390)
PGDP−0.0110.043 **0.009−0.0180.032−0.018
(0.5238)(0.0410)(0.6554)(0.3747)(0.1021)(0.3747)
EDU−0.010−0.269−0.1400.105−0.2760.105
(0.9482)(0.2193)(0.4618)(0.5103)(0.2331)(0.5103)
LND0.000−0.005 ***−0.001−0.001−0.003 ***−0.001
(0.6174)(0.0000)(0.1747)(0.1971)(0.0091)(0.1971)
FIN0.007−0.013−0.003−0.0100.006−0.010
(0.4090)(0.2764)(0.7764)(0.2280)(0.6471)(0.2280)
OPEN0.015 *−0.033 *−0.001−0.0040.005−0.004
(0.0636)(0.0820)(0.9094)(0.5737)(0.7447)(0.5737)
_cons0.3260.1390.2540.597 ***0.0490.597 ***
(0.1551)(0.5052)(0.3505)(0.0061)(0.8378)(0.0061)
Corporate FEYesYesYesYesYesYes
Year FEYesYesYesYesYesYes
N441896695090902260647866
R20.7380.6860.6750.7810.6640.781
* p < 0.1. ** p < 0.05. *** p < 0.01.
Table 6. Analysis of effect mechanisms.
(1)(2)(3)
CPGIR&D
DIT0.033 **0.001 **0.015 *
(0.0105)(0.0105)(0.0747)
ListAge0.032 **0.0000.008
(0.0192)(0.9387)(0.2814)
ROA0.219 ***−0.0020.027
(0.0046)(0.3527)(0.4812)
CashFlow−0.0200.004 ***0.004
(0.7231)(0.0020)(0.8980)
Lev0.087 **−0.002 **−0.048 **
(0.0163)(0.0311)(0.0336)
TOP0.1400.0010.084 **
(0.2446)(0.6951)(0.0414)
FIXED0.0220.007 ***0.007
(0.6331)(0.0000)(0.8449)
TobinQ−0.0020.0000.000
(0.1685)(0.1518)(0.7951)
PGDP0.007−0.000−0.015
(0.6158)(0.4220)(0.1667)
EDU−0.056−0.007 *−0.058
(0.6695)(0.0556)(0.5028)
LND−0.001 **−0.000−0.000
(0.0424)(0.1040)(0.4258)
FIN−0.0020.001−0.000
(0.7254)(0.2076)(0.9798)
OPEN0.0000.001 ***0.007 *
(0.9531)(0.0008)(0.0728)
_cons0.285 *0.024 ***0.209 **
(0.0998)(0.0000)(0.0430)
Corporate FEYesYesYes
Year FEYesYesYes
N14,12014,12014,120
R20.6960.8780.589
* p < 0.1. ** p < 0.05. *** p < 0.01.
Disclaimer/Publisher’s Note: The statements, opinions and data contained in all publications are solely those of the individual author(s) and contributor(s) and not of MDPI and/or the editor(s). MDPI and/or the editor(s) disclaim responsibility for any injury to people or property resulting from any ideas, methods, instructions or products referred to in the content.

