
Understanding the Spatiotemporal Patterns and Drivers of Carbon Stock in Central-Southern China’s Hilly Regions Through Land Use Change and Scenario Simulation

 ,
,
Abstract
1. Introduction
2. Study Area and Methods
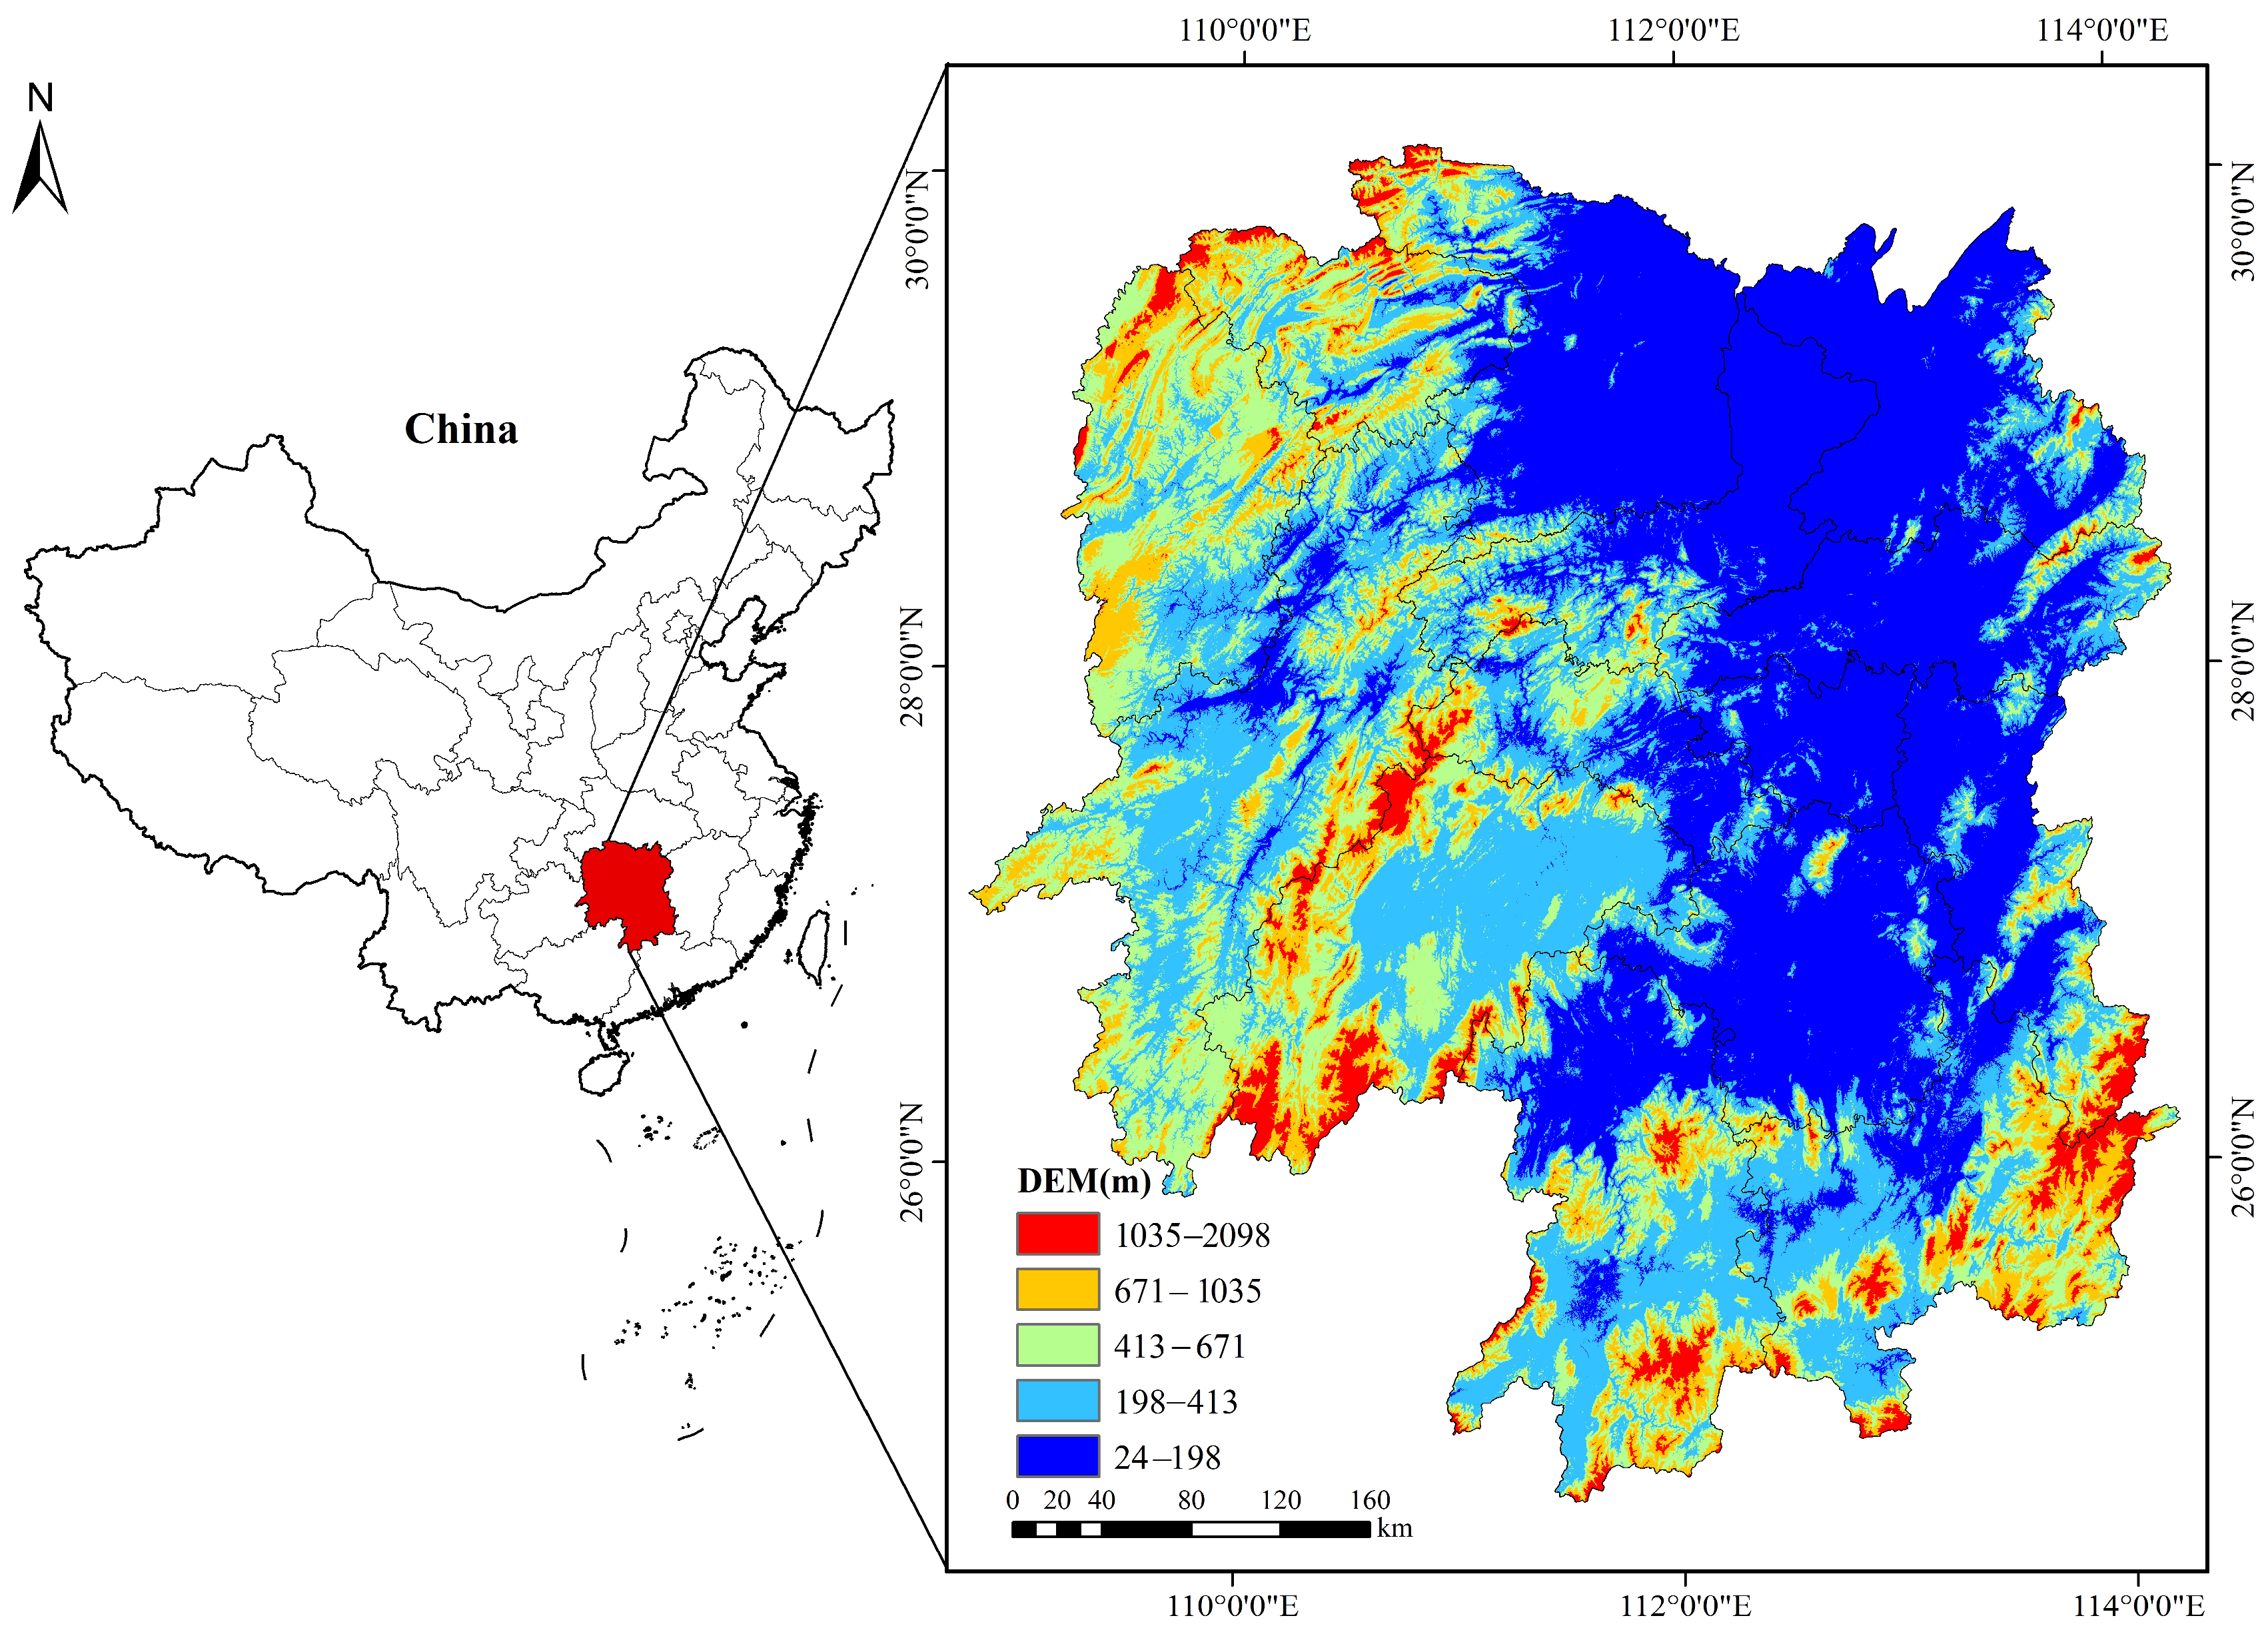
2.1. Overview of the Study Area
2.2. Data Sources
- (1)
- Land Use/Cover (LULC) data
- (2)
- Driving factors for LULC change simulation
- (3)
- Selection of carbon stock influencing factors. The thoughtful selection of influencing factors plays a critical role in elucidating the mechanisms underlying carbon stock changes. Based on the specific conditions of Hunan Province, 17 driving factors were selected from natural environmental, socioeconomic, and locational conditions (Table 2). All influencing factors were rasterized in ArcGIS, and the coordinate system was unified. The comprehensive index of land use intensity was derived from current land use data.
- (4)
- Soil and vegetation serve as fundamental carbon reservoirs within terrestrial ecosystems, with their capacity to sequester carbon varying significantly across different land use types. To establish a comprehensive baseline, we systematically compiled carbon density values for each major land use type across China from extensive national-level literature reviews conducted by various prominent researchers [36,37,38,39,40]. These baseline values, encompassing plant biomass, belowground biomass, soil organic carbon, and dead organic carbon, are presented in Table 3.
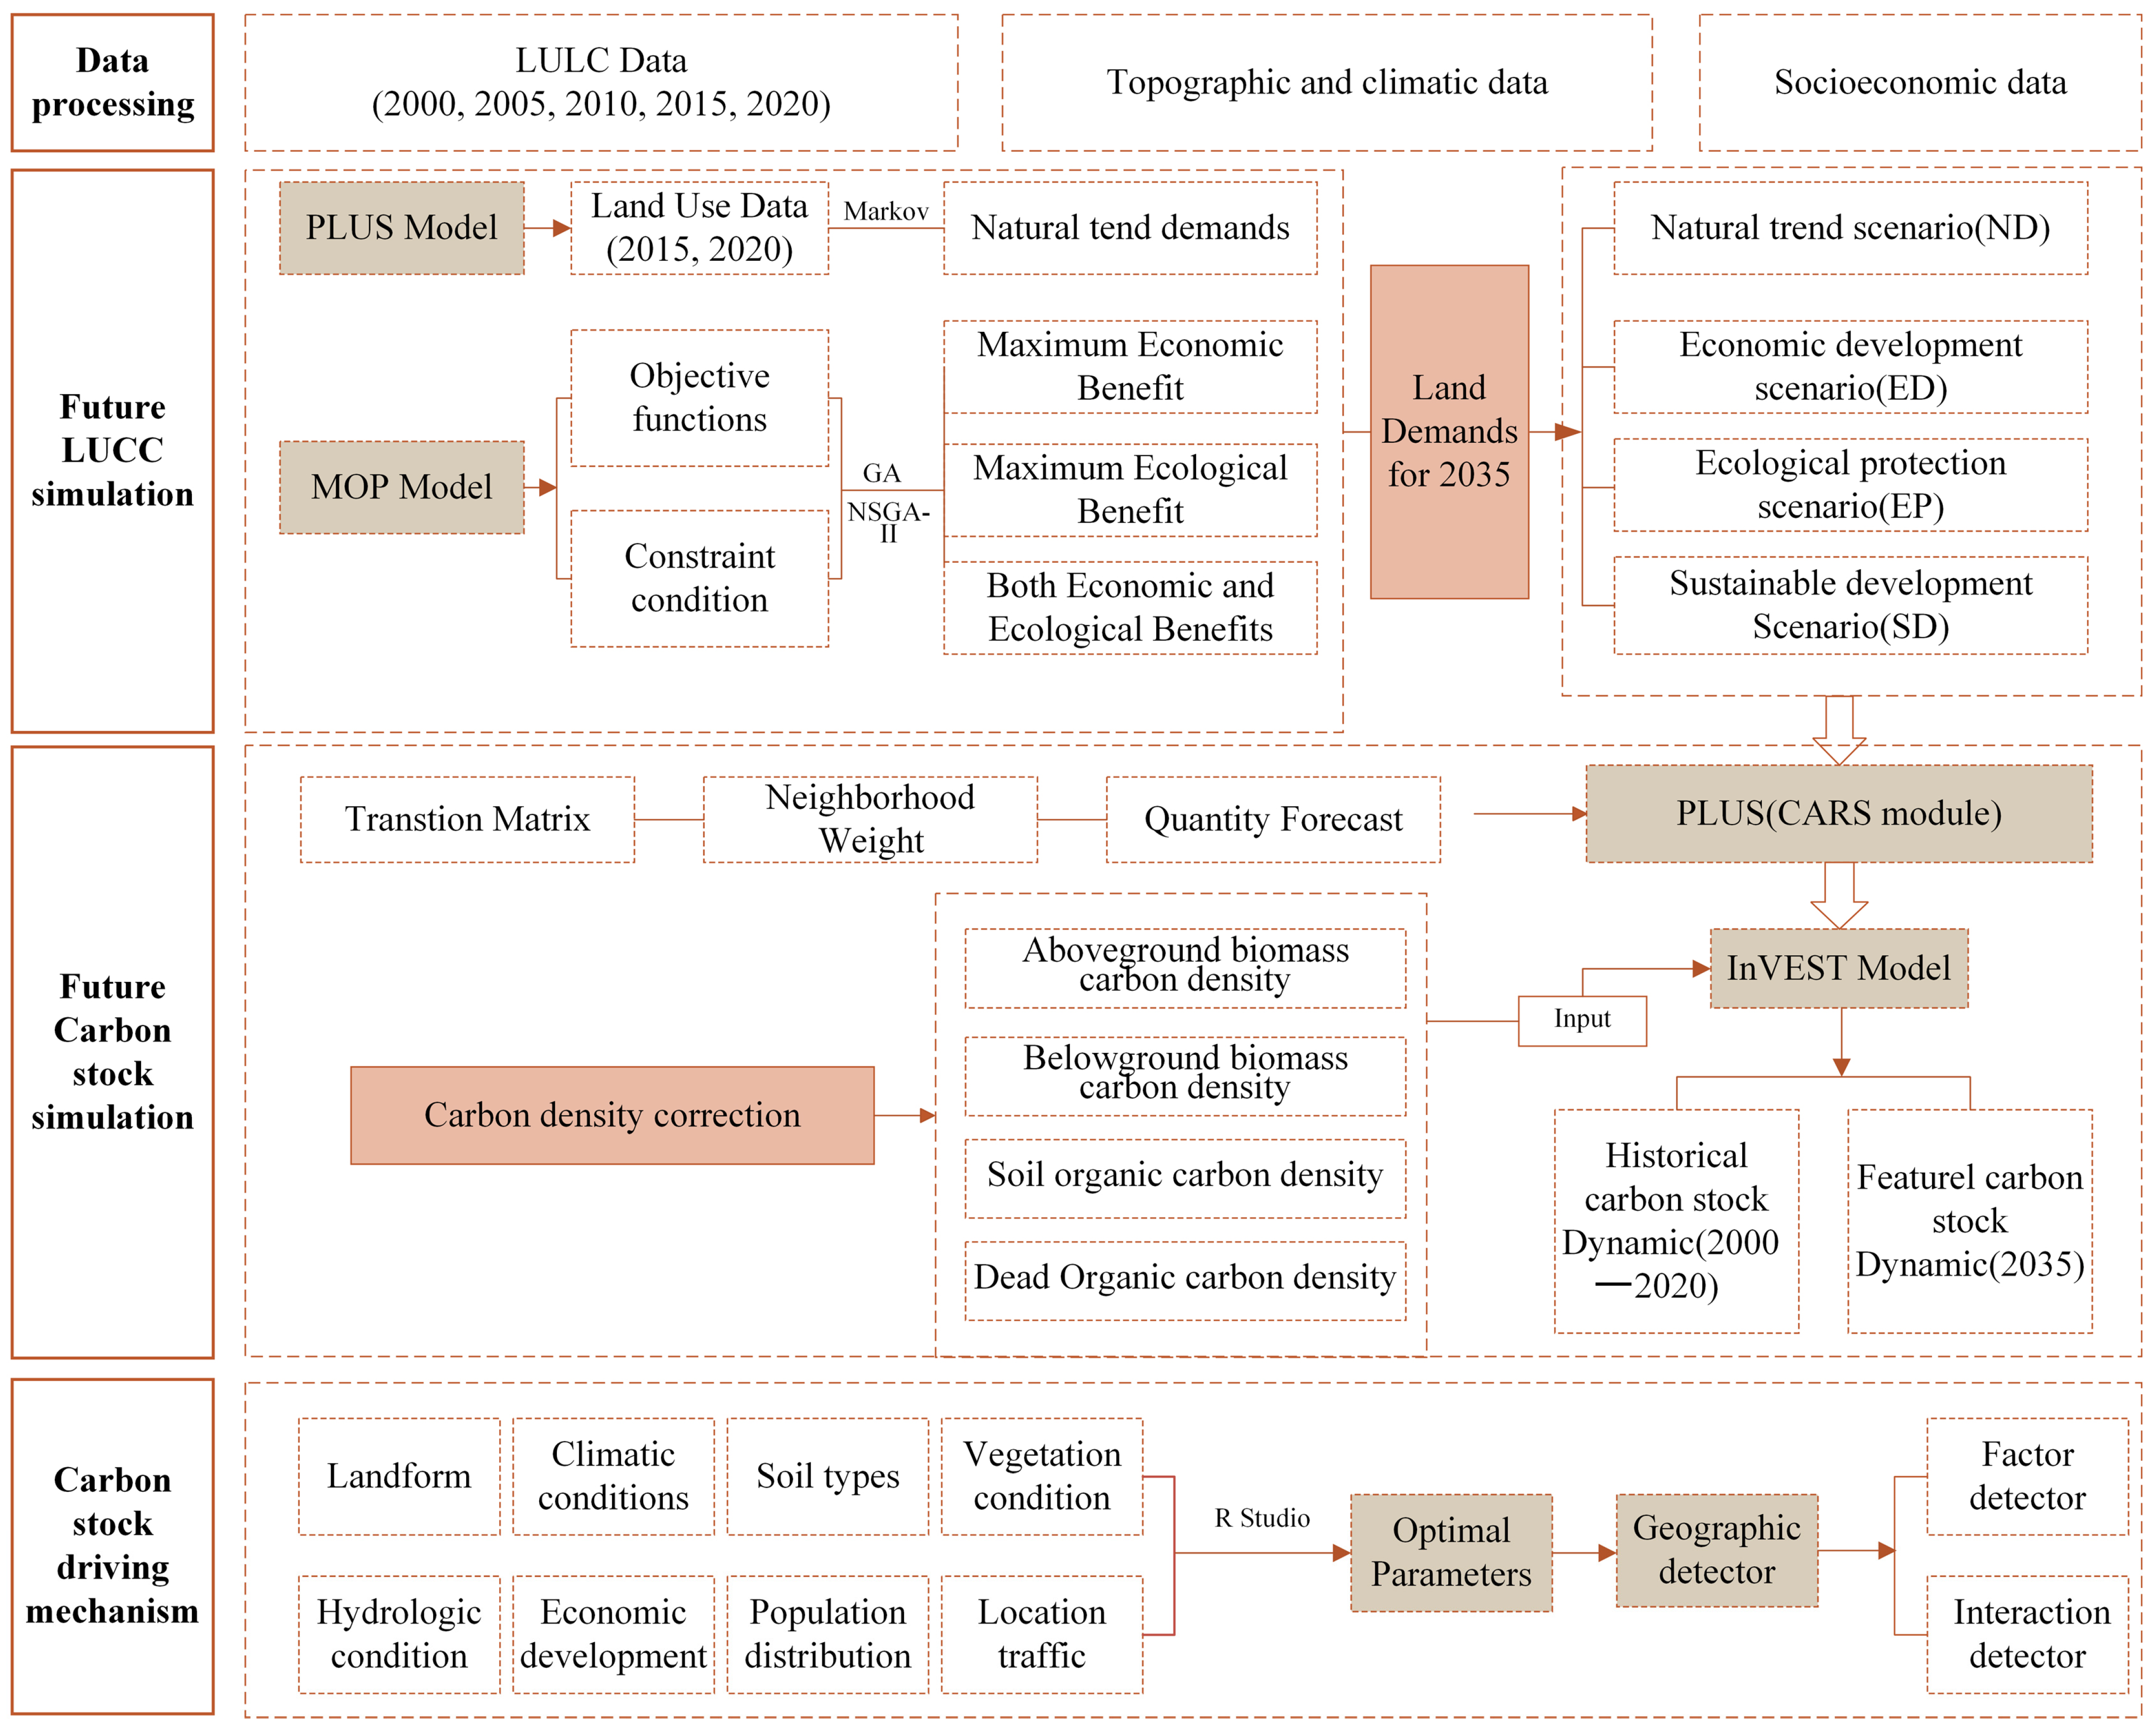
2.3. Research Methods
2.3.1. MOP–PLUS Model-Based Land Use Simulation
MOP Model and Genetic Algorithm
- (1)
- Objective function
- (2)
- Constraints
- (3)
- Multi-objective genetic algorithm (NSGA-II)
PLUS Model and Simulation Process
- (4)
- Model accuracy validation
2.3.2. Carbon Density Correction and InVEST Model Calculations
Carbon Density Correction
InVEST Model Operation
Carbon Density Sensitivity Analysis
2.3.3. Optimal Parameter-Based Geographical Detector Model
3. Results
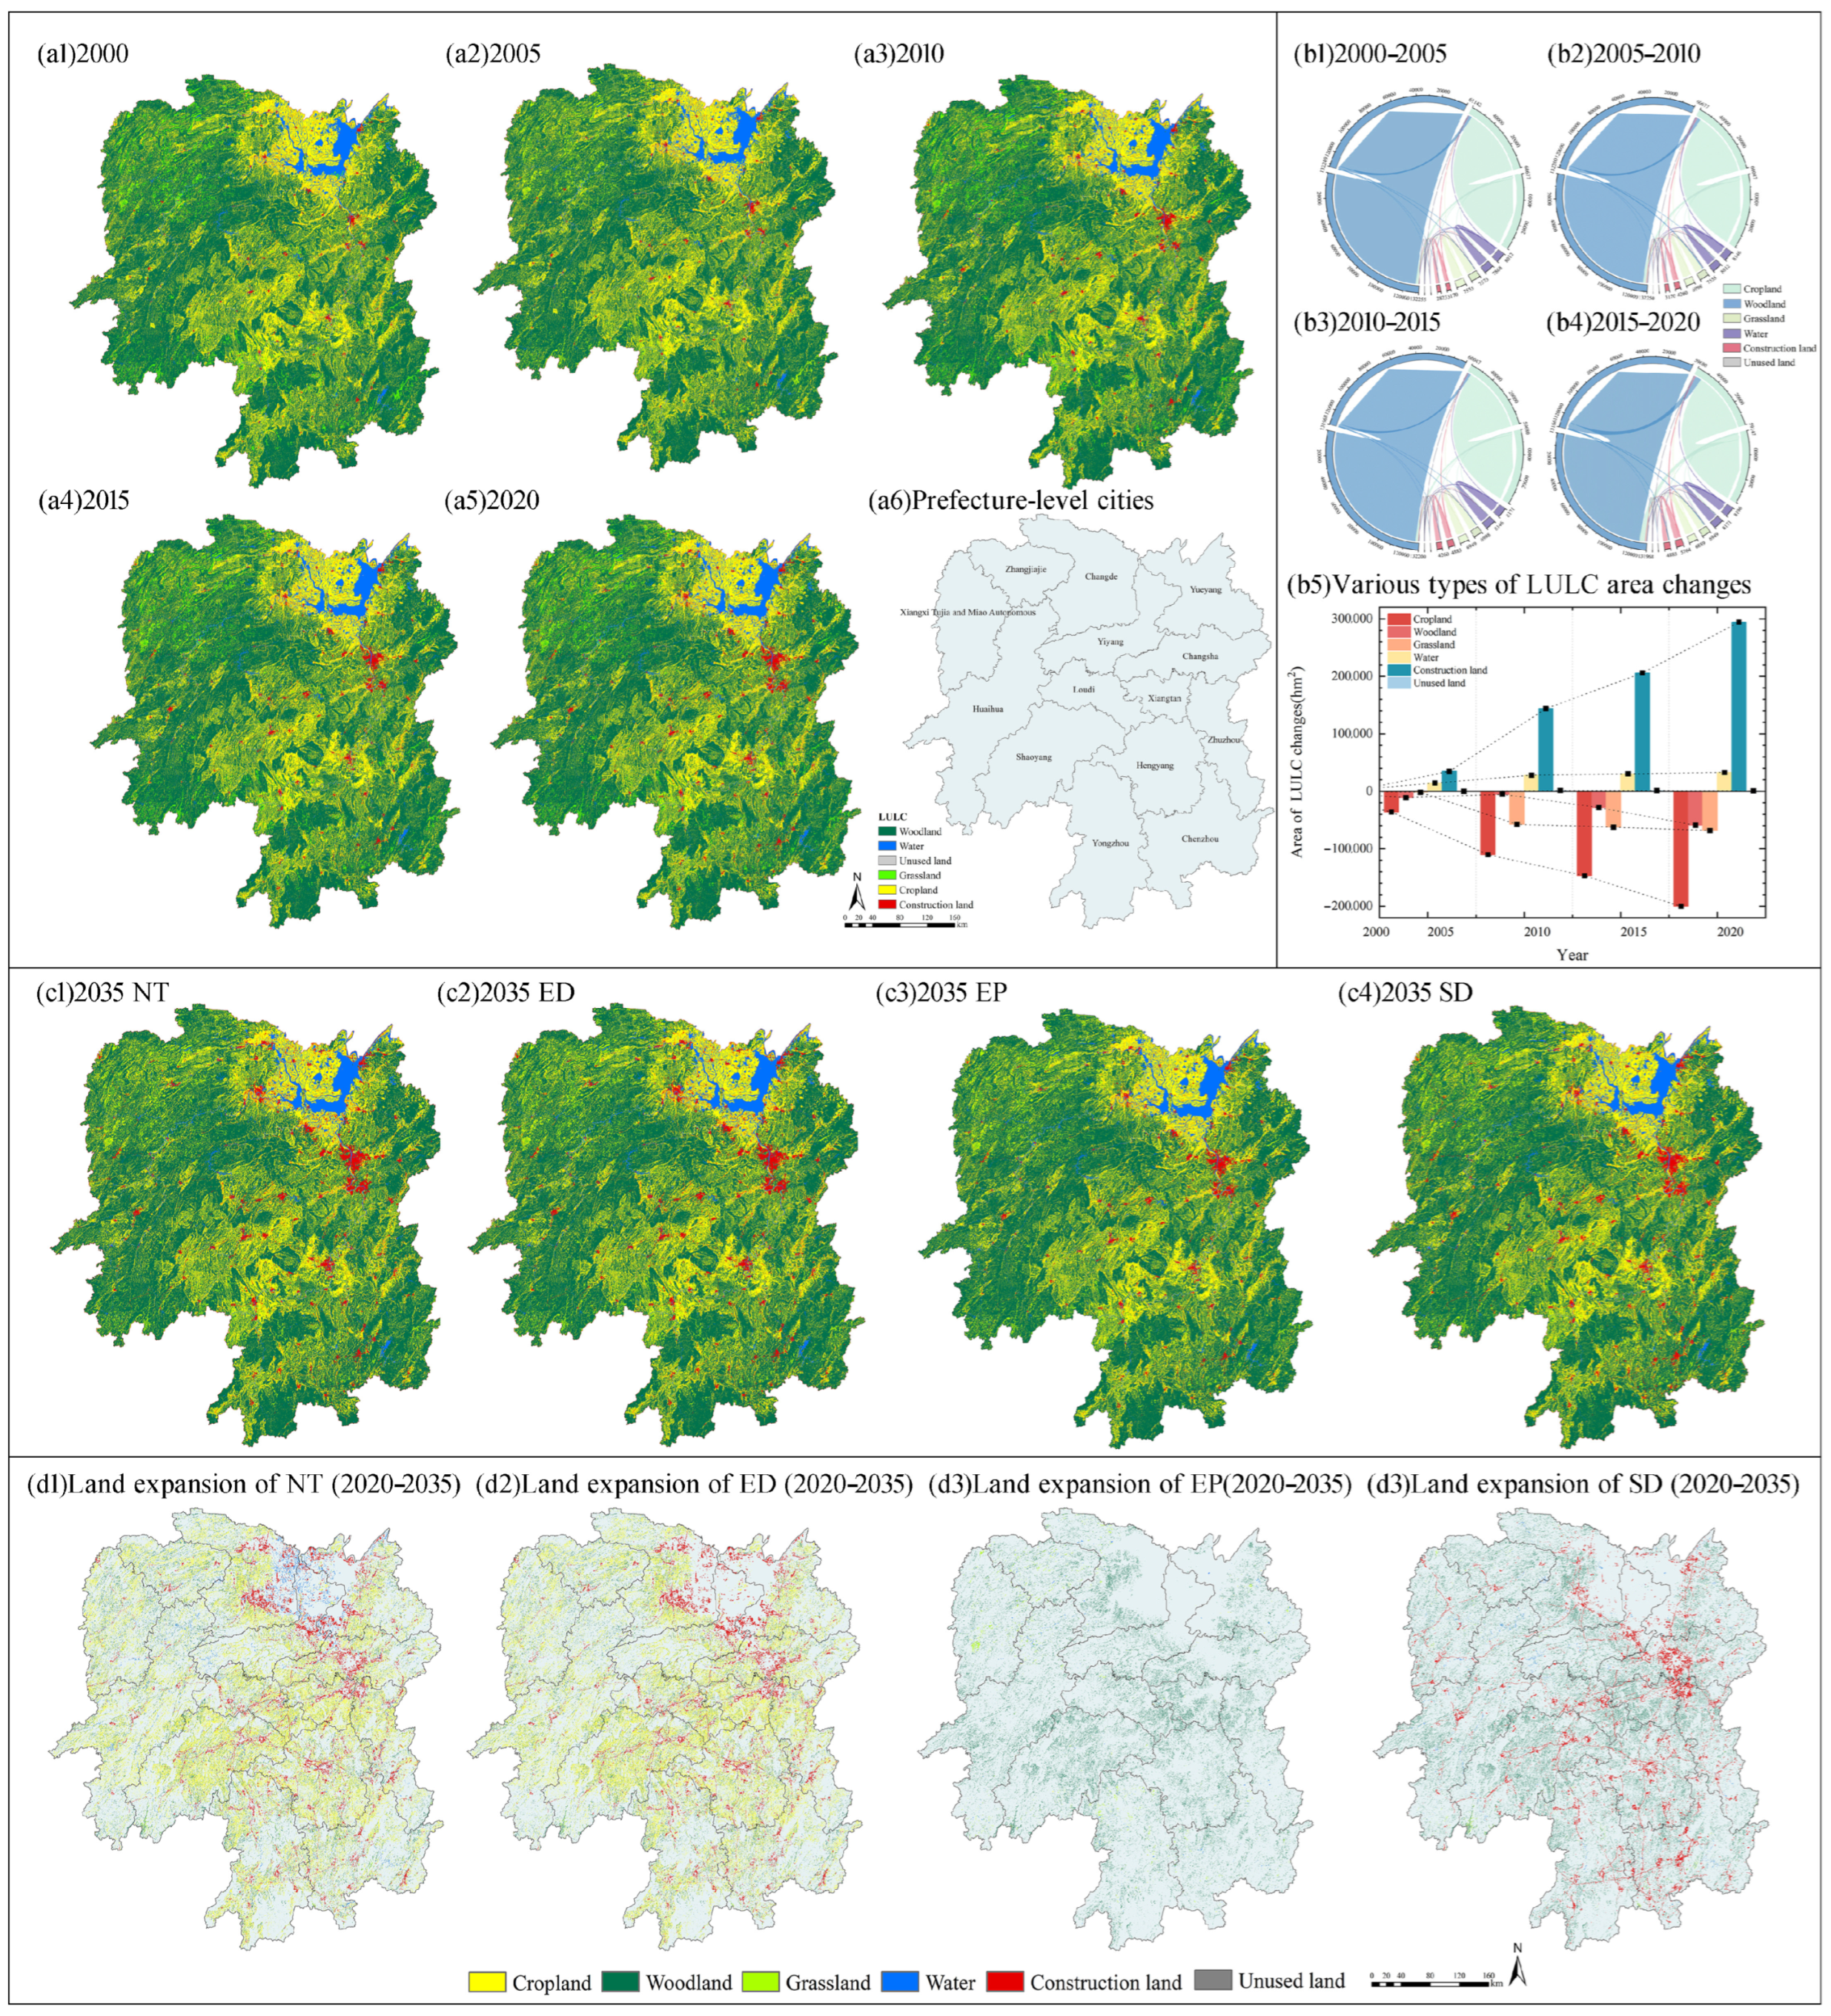
3.1. Changes in LULC Dynamics in Hunan Province, 2000–2035
3.1.1. Spatial-Temporal Evolution of Land Use from 2000 to 2020
3.1.2. Spatial-Temporal Evolution of Land Use from 2020 to 2035
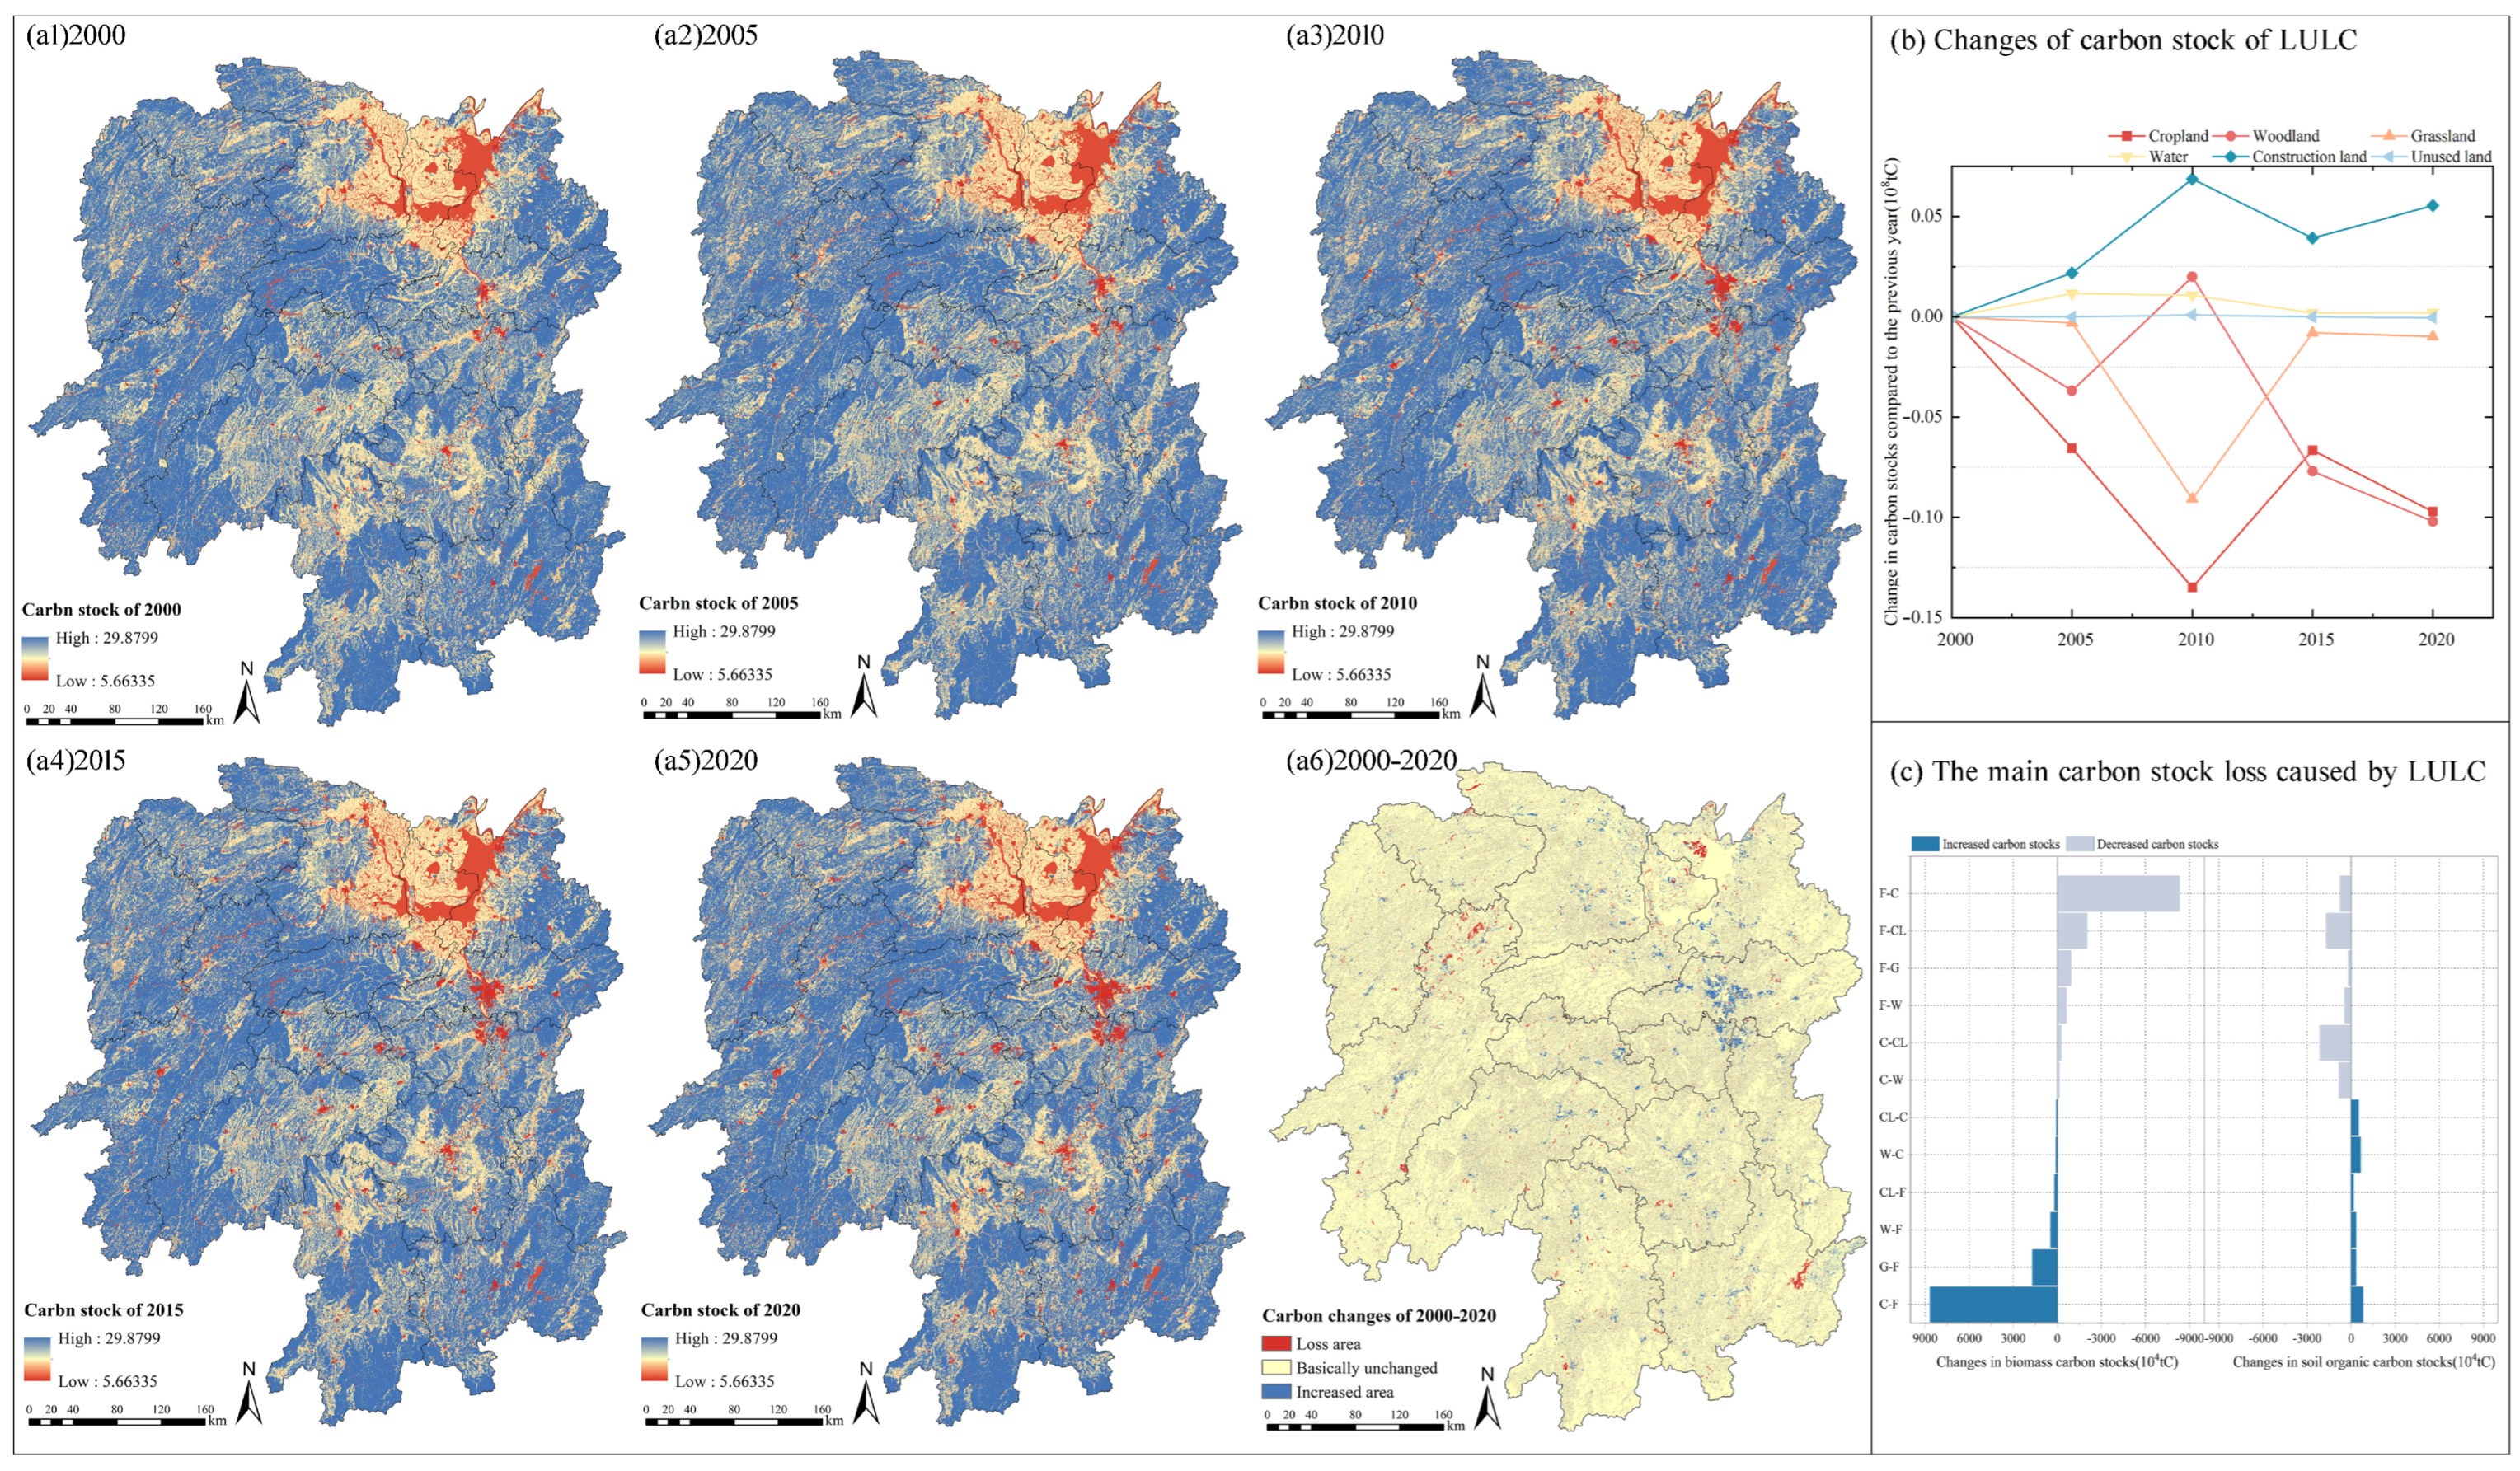
3.2. Dynamic Changes in Carbon Stock in Hunan Province from 2000 to 2035
3.2.1. Carbon Stock Dynamics from 2000 to 2020
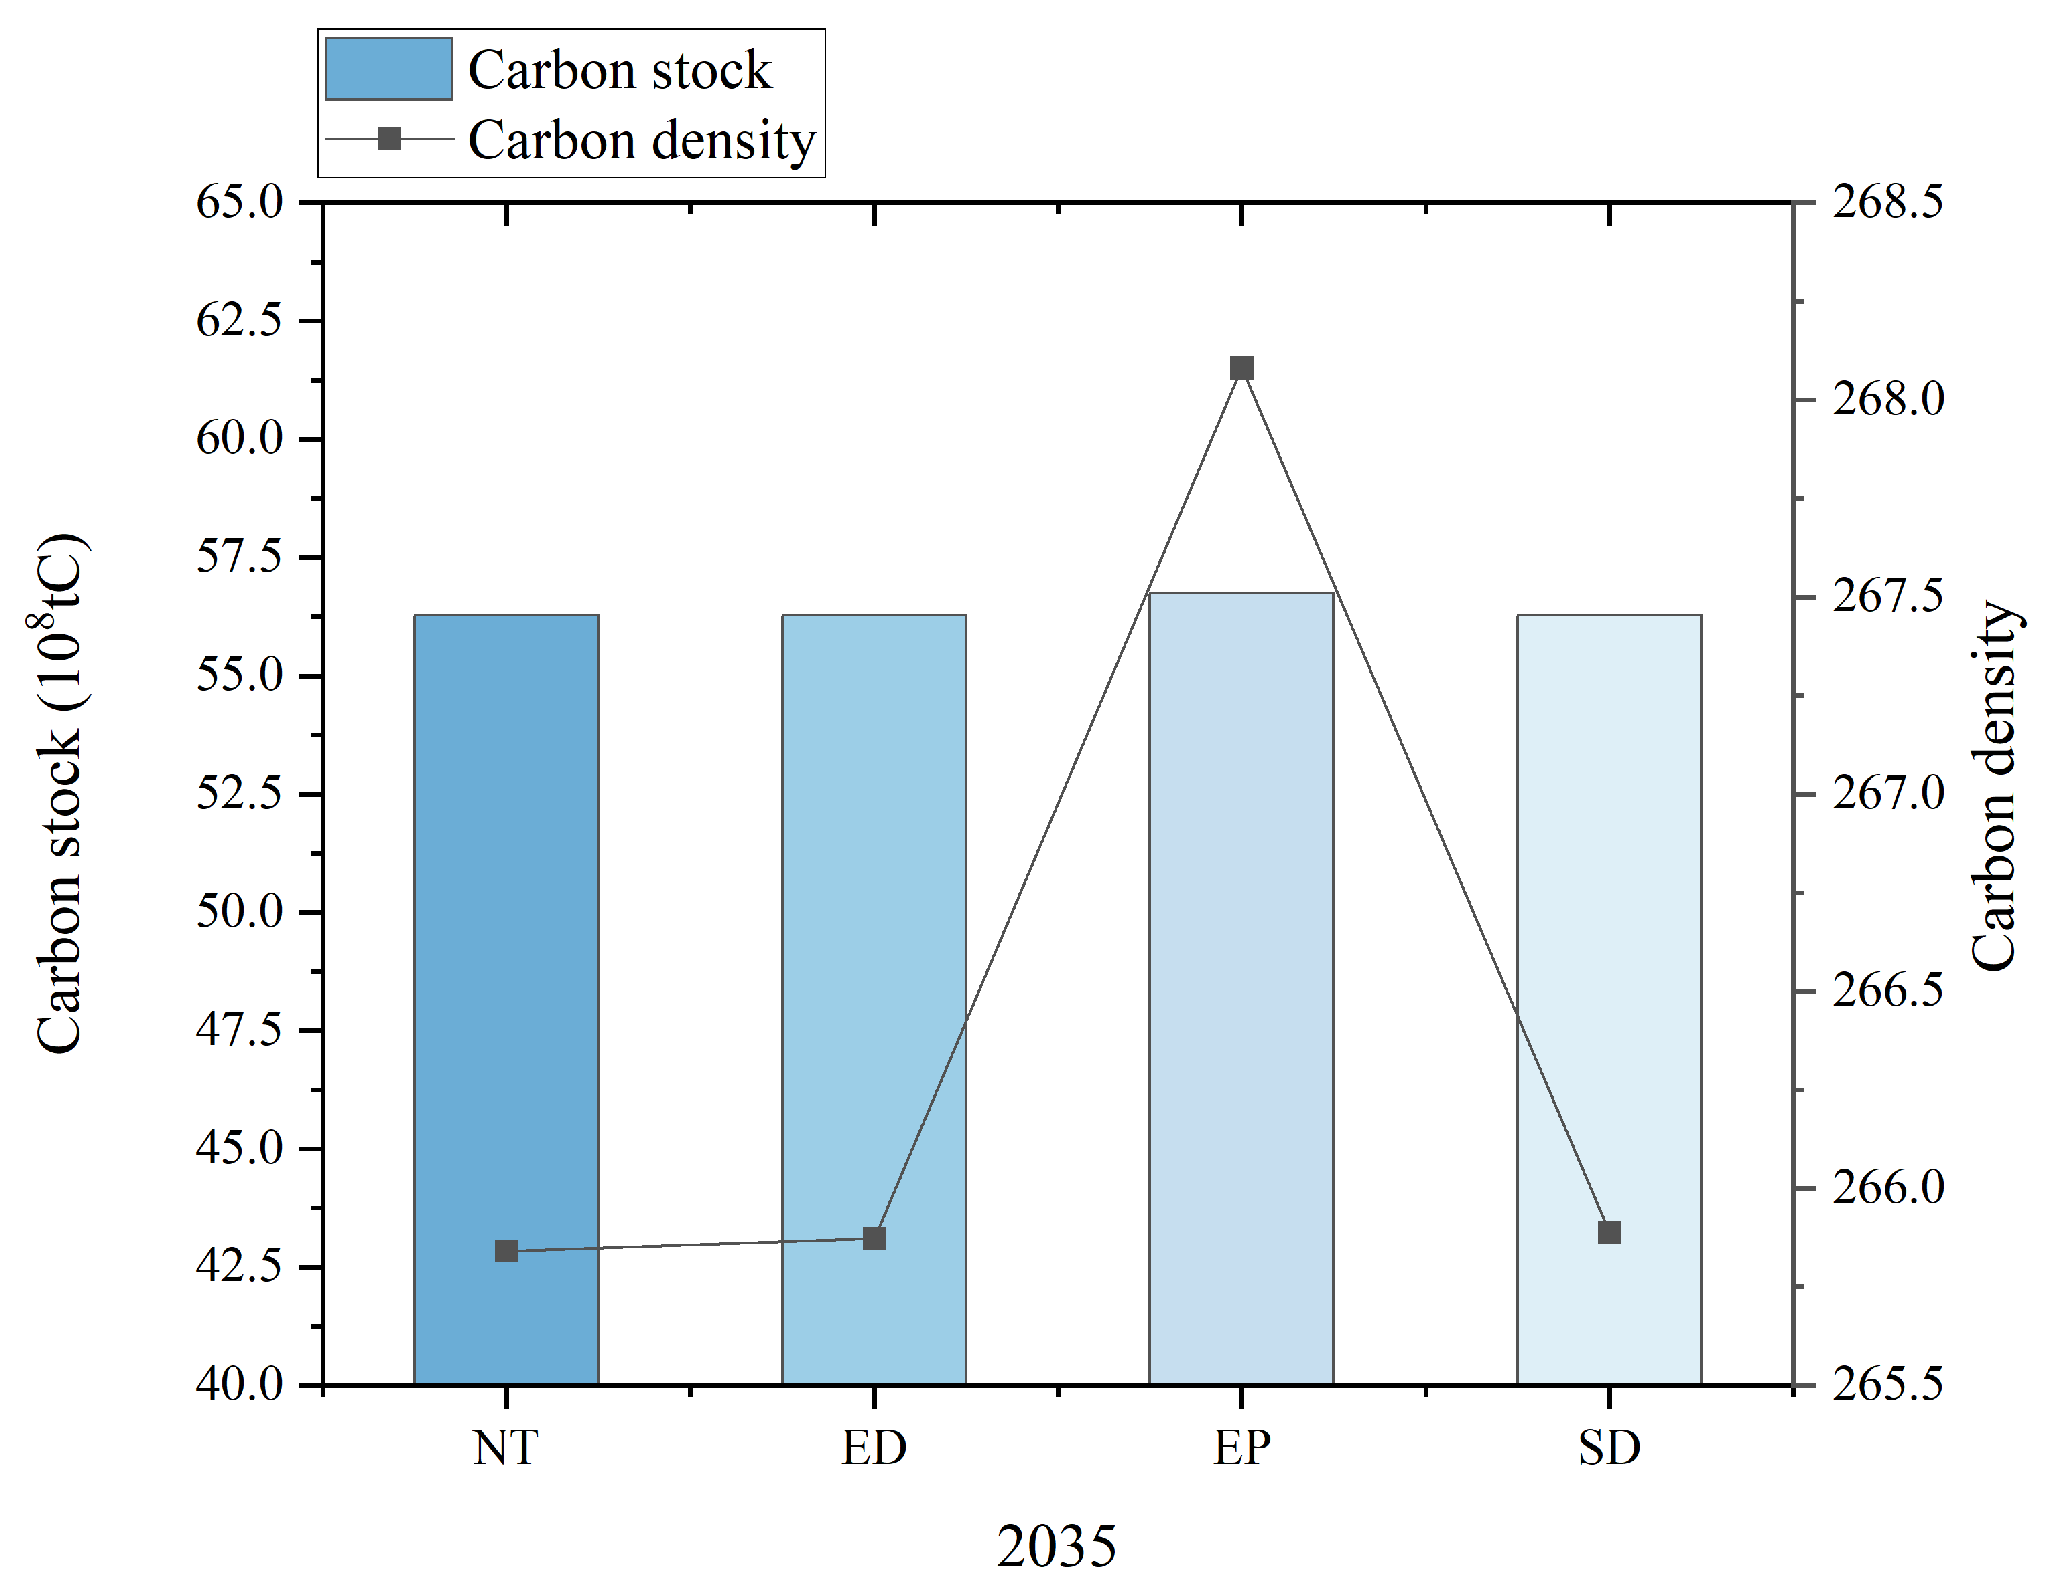
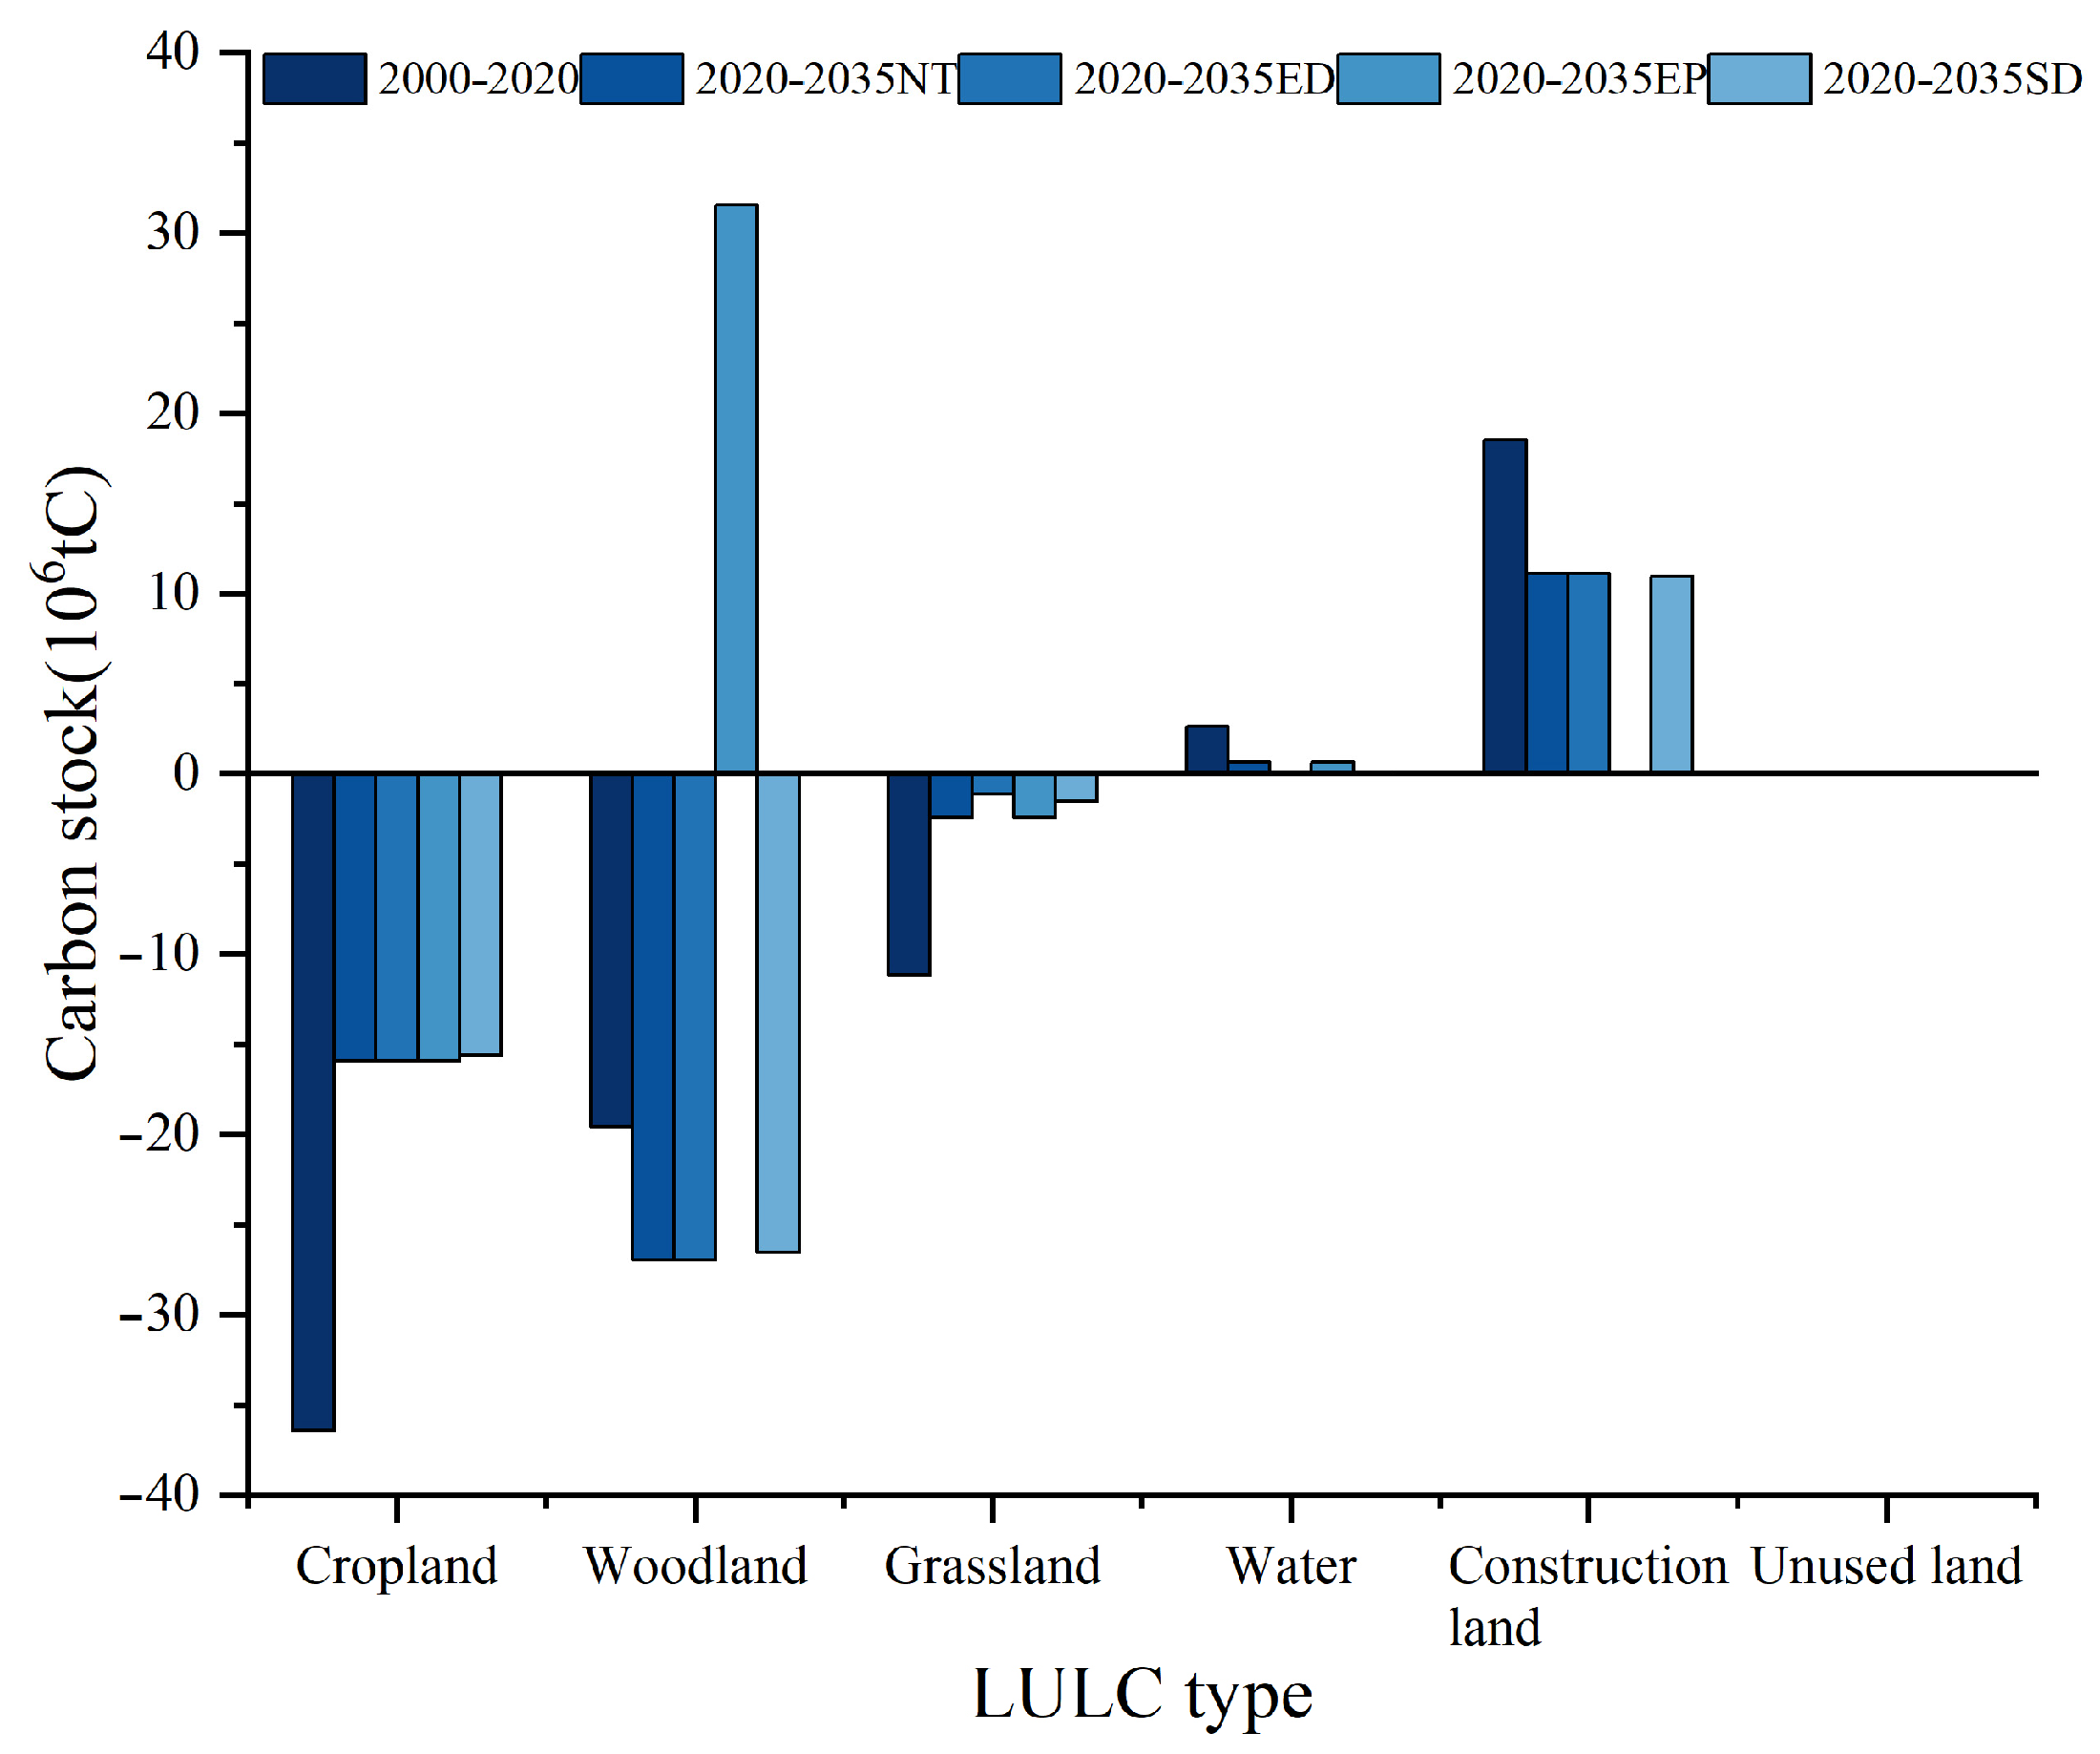
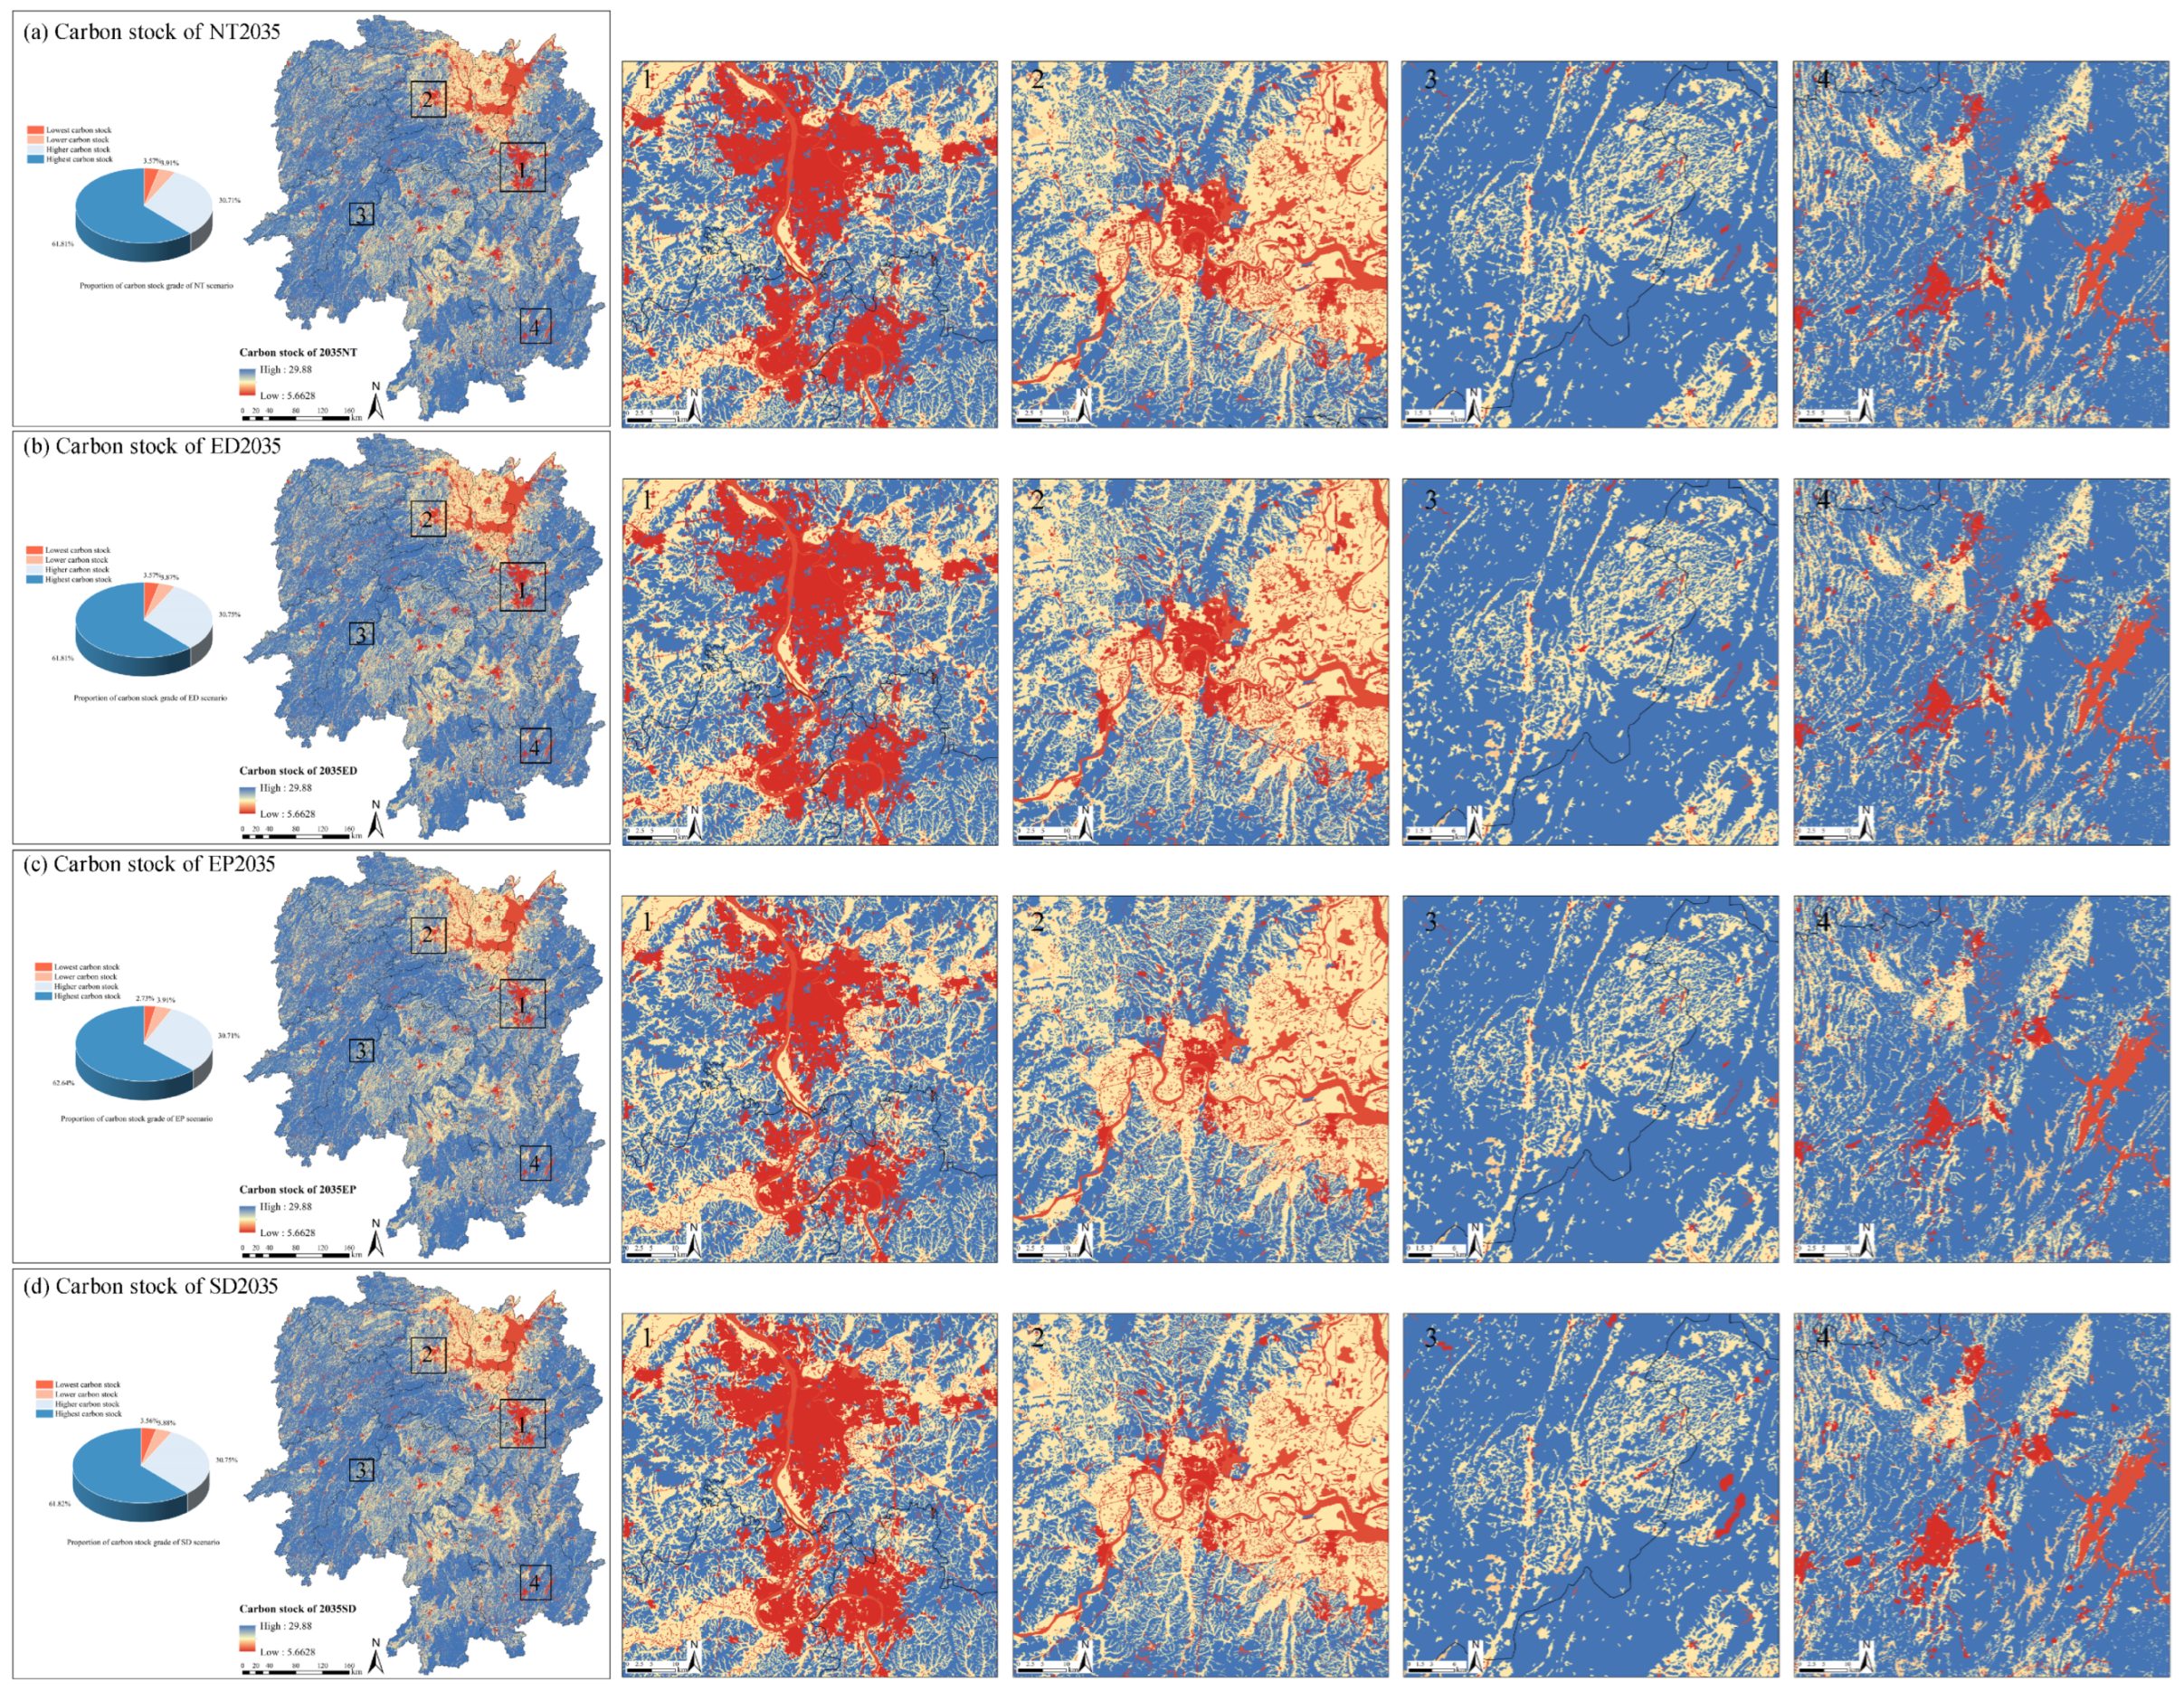
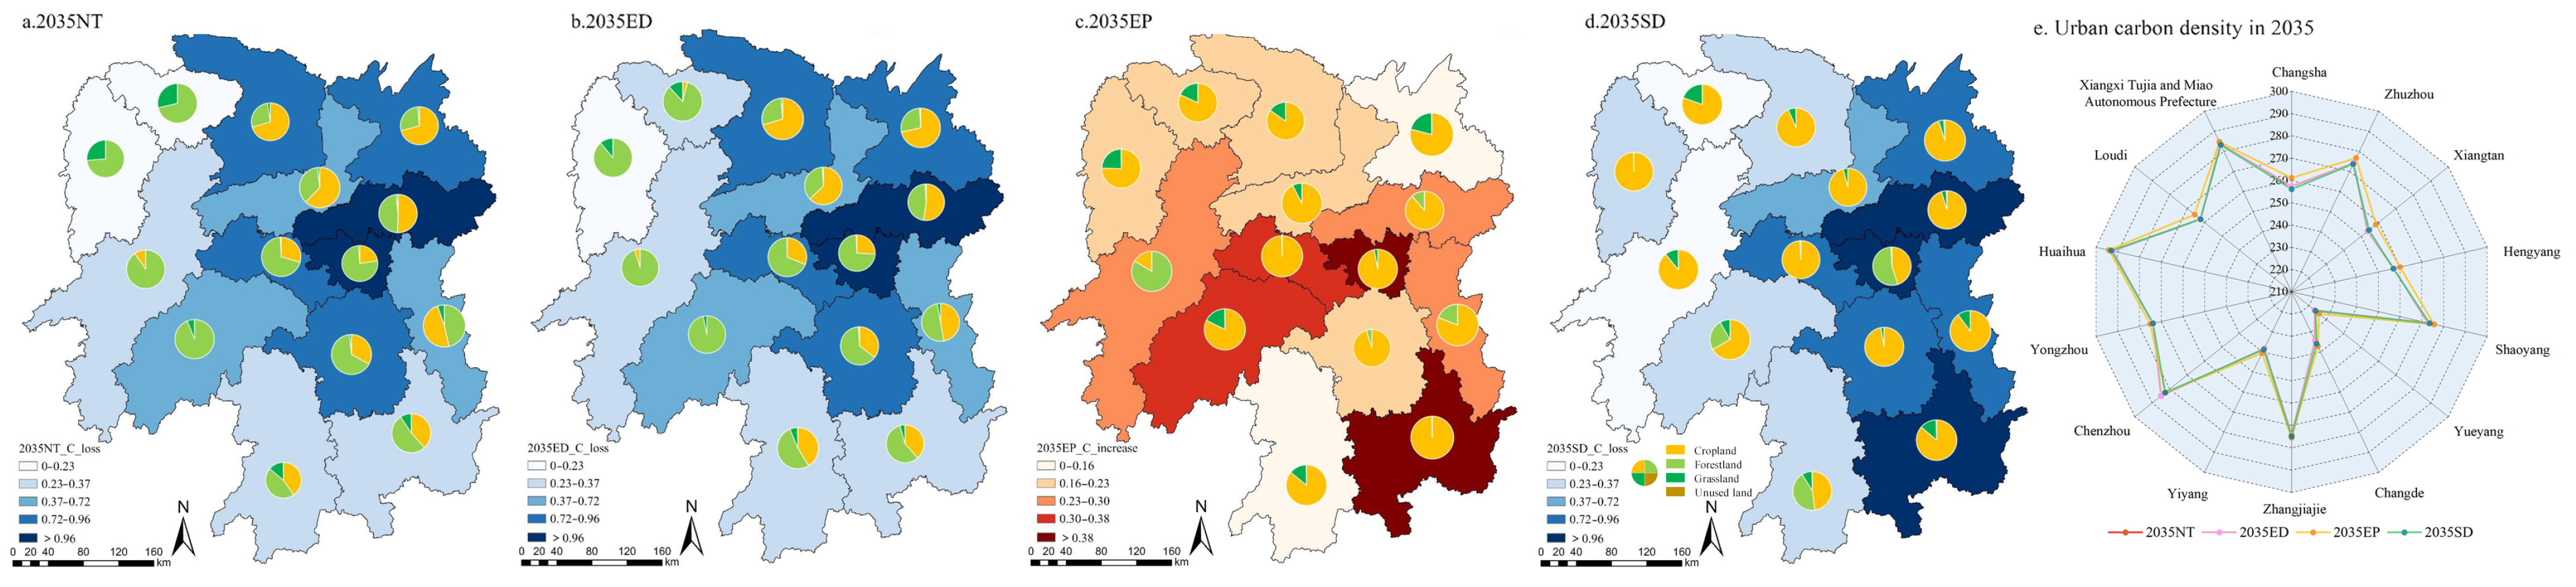
3.2.2. Assessment of Carbon Stocks in 2035 Under Different Scenarios
3.3. Spatial Differentiation and Driving Mechanisms of Carbon Stock
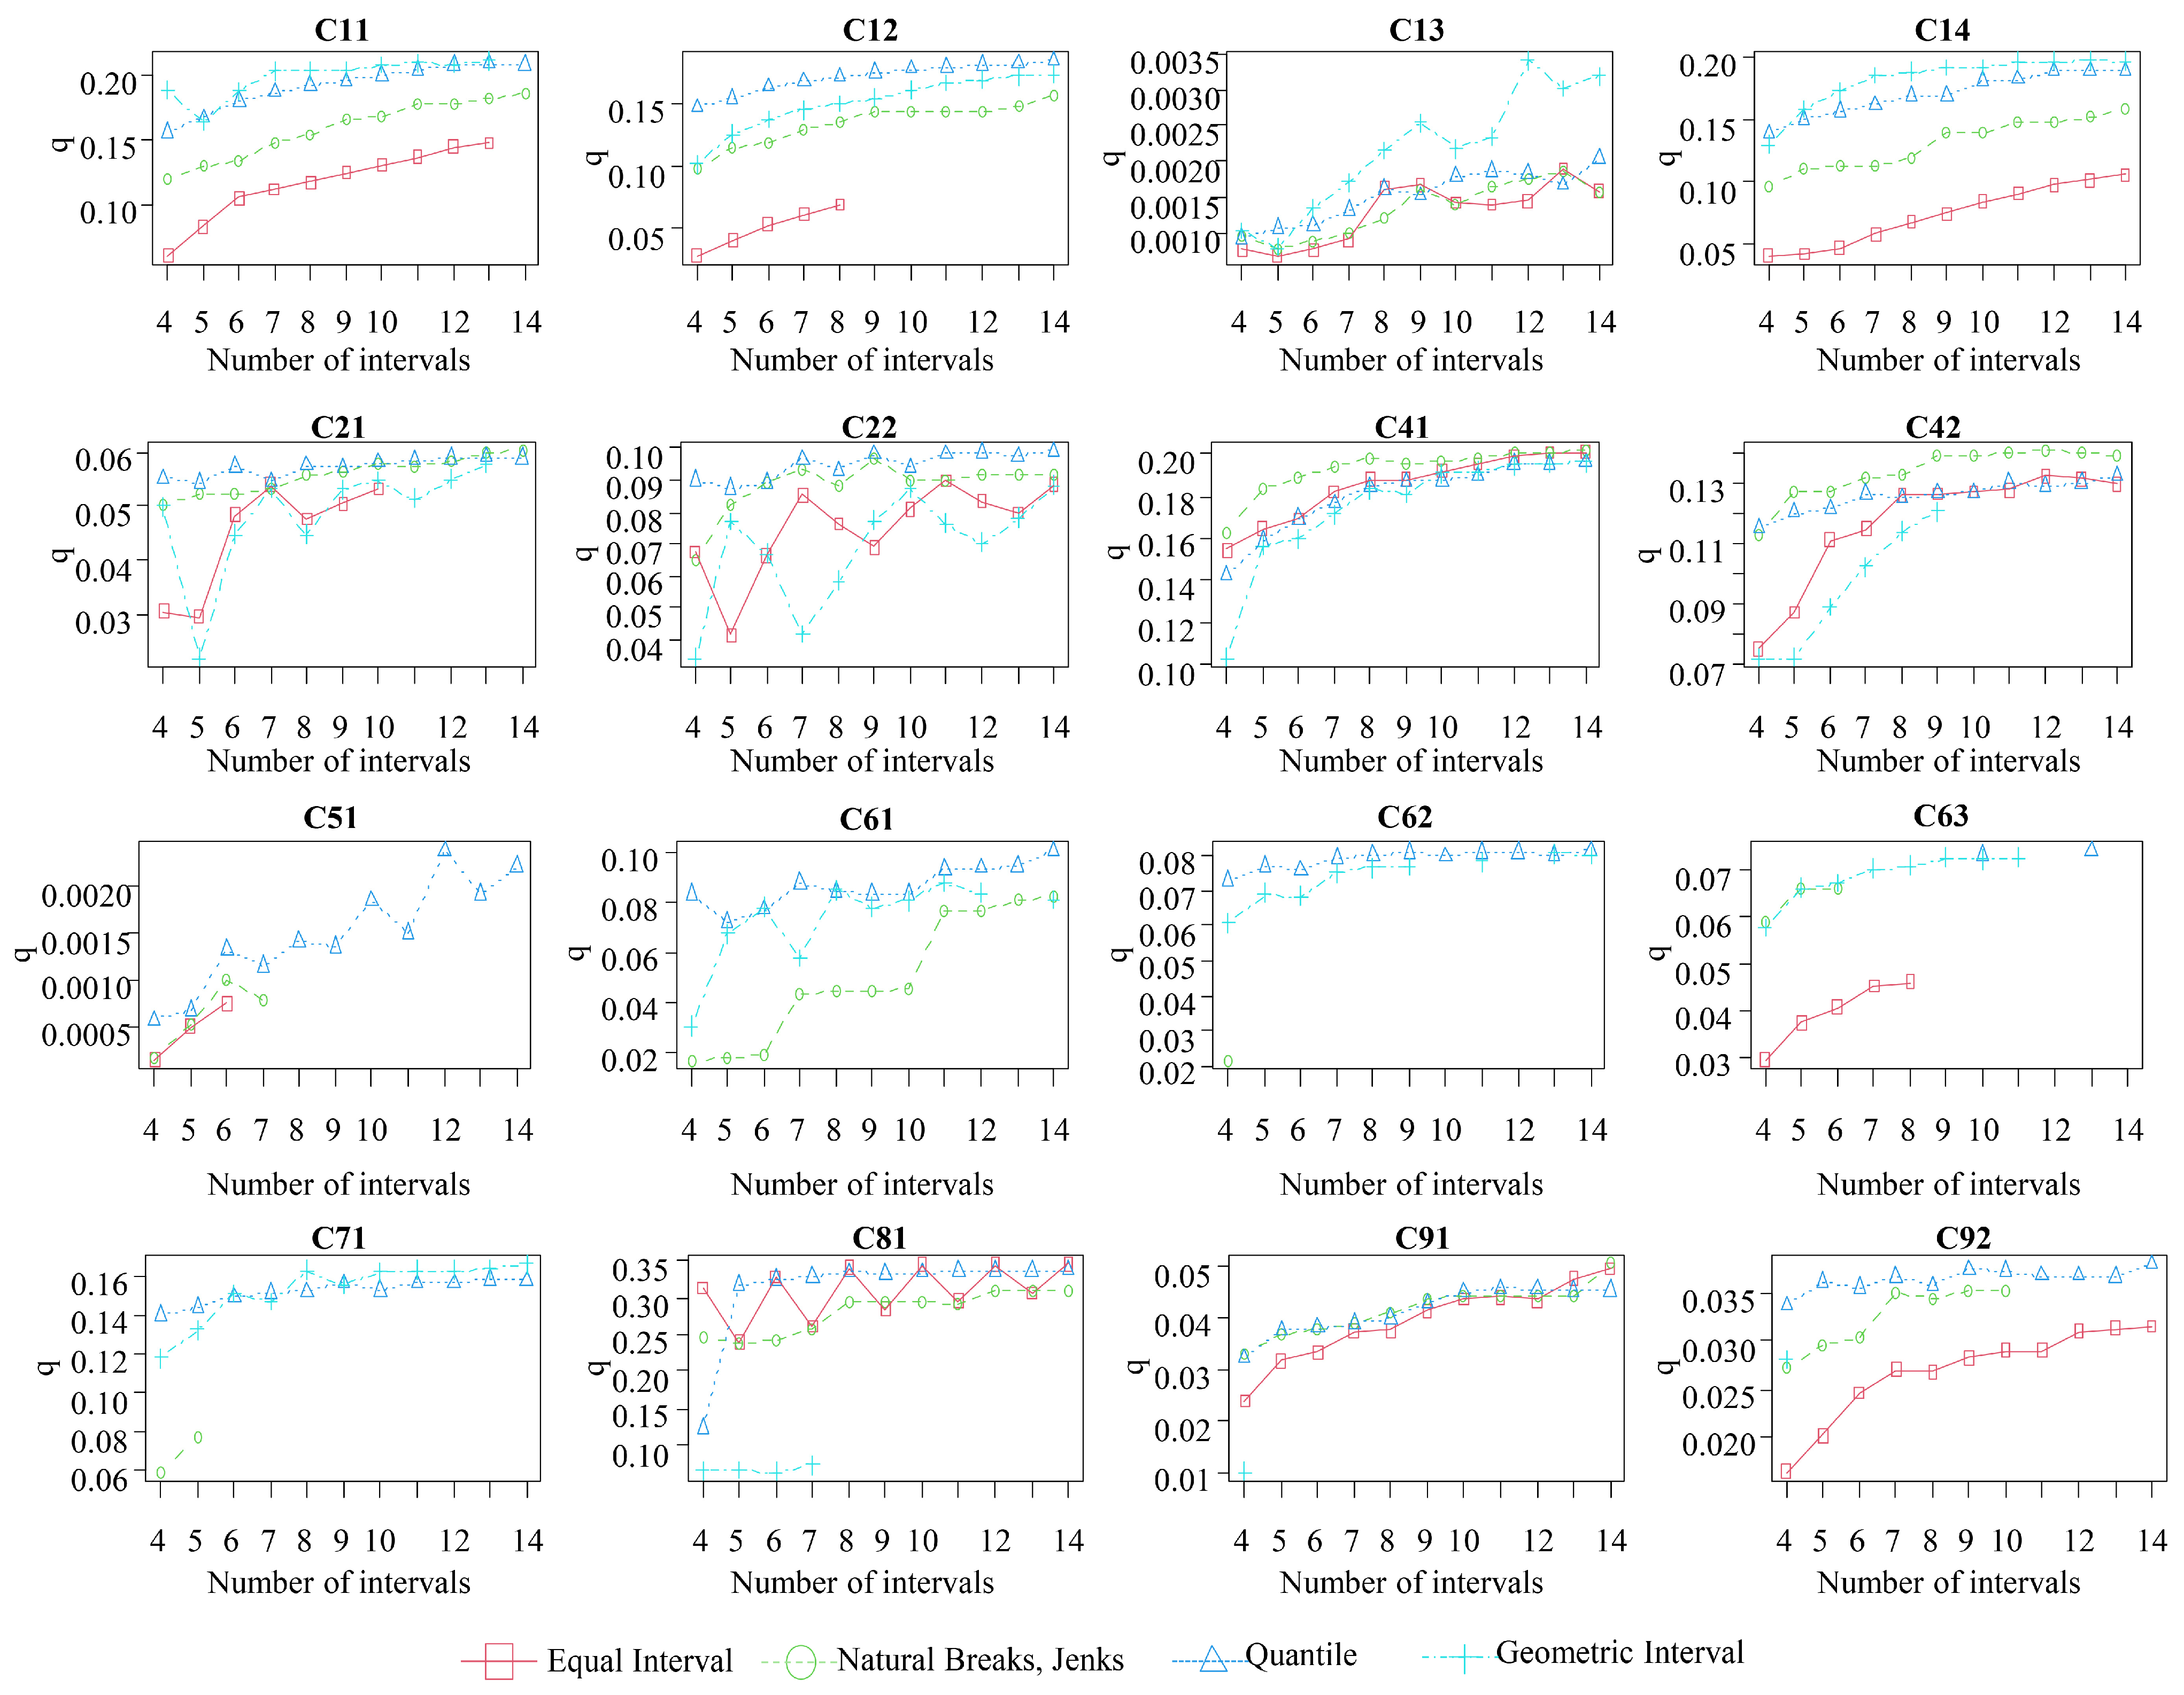
3.3.1. Identification of Optimal Parameters
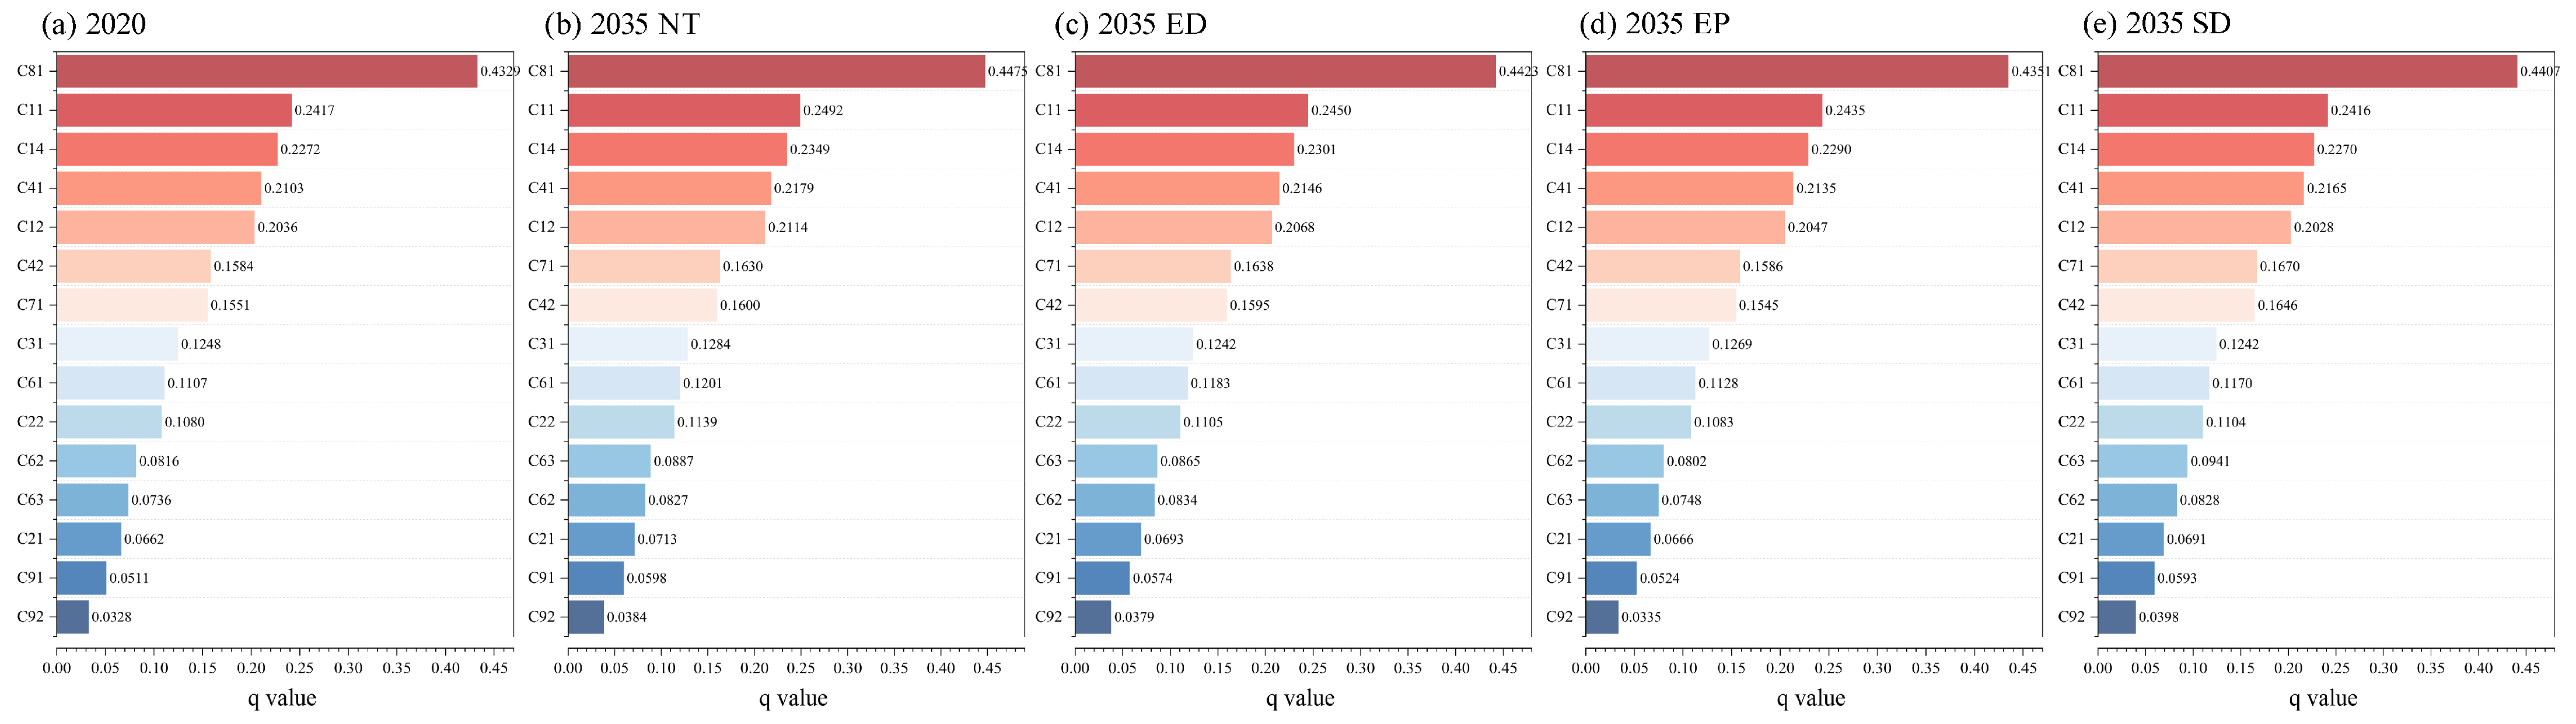
3.3.2. Detection of Dominant Factors
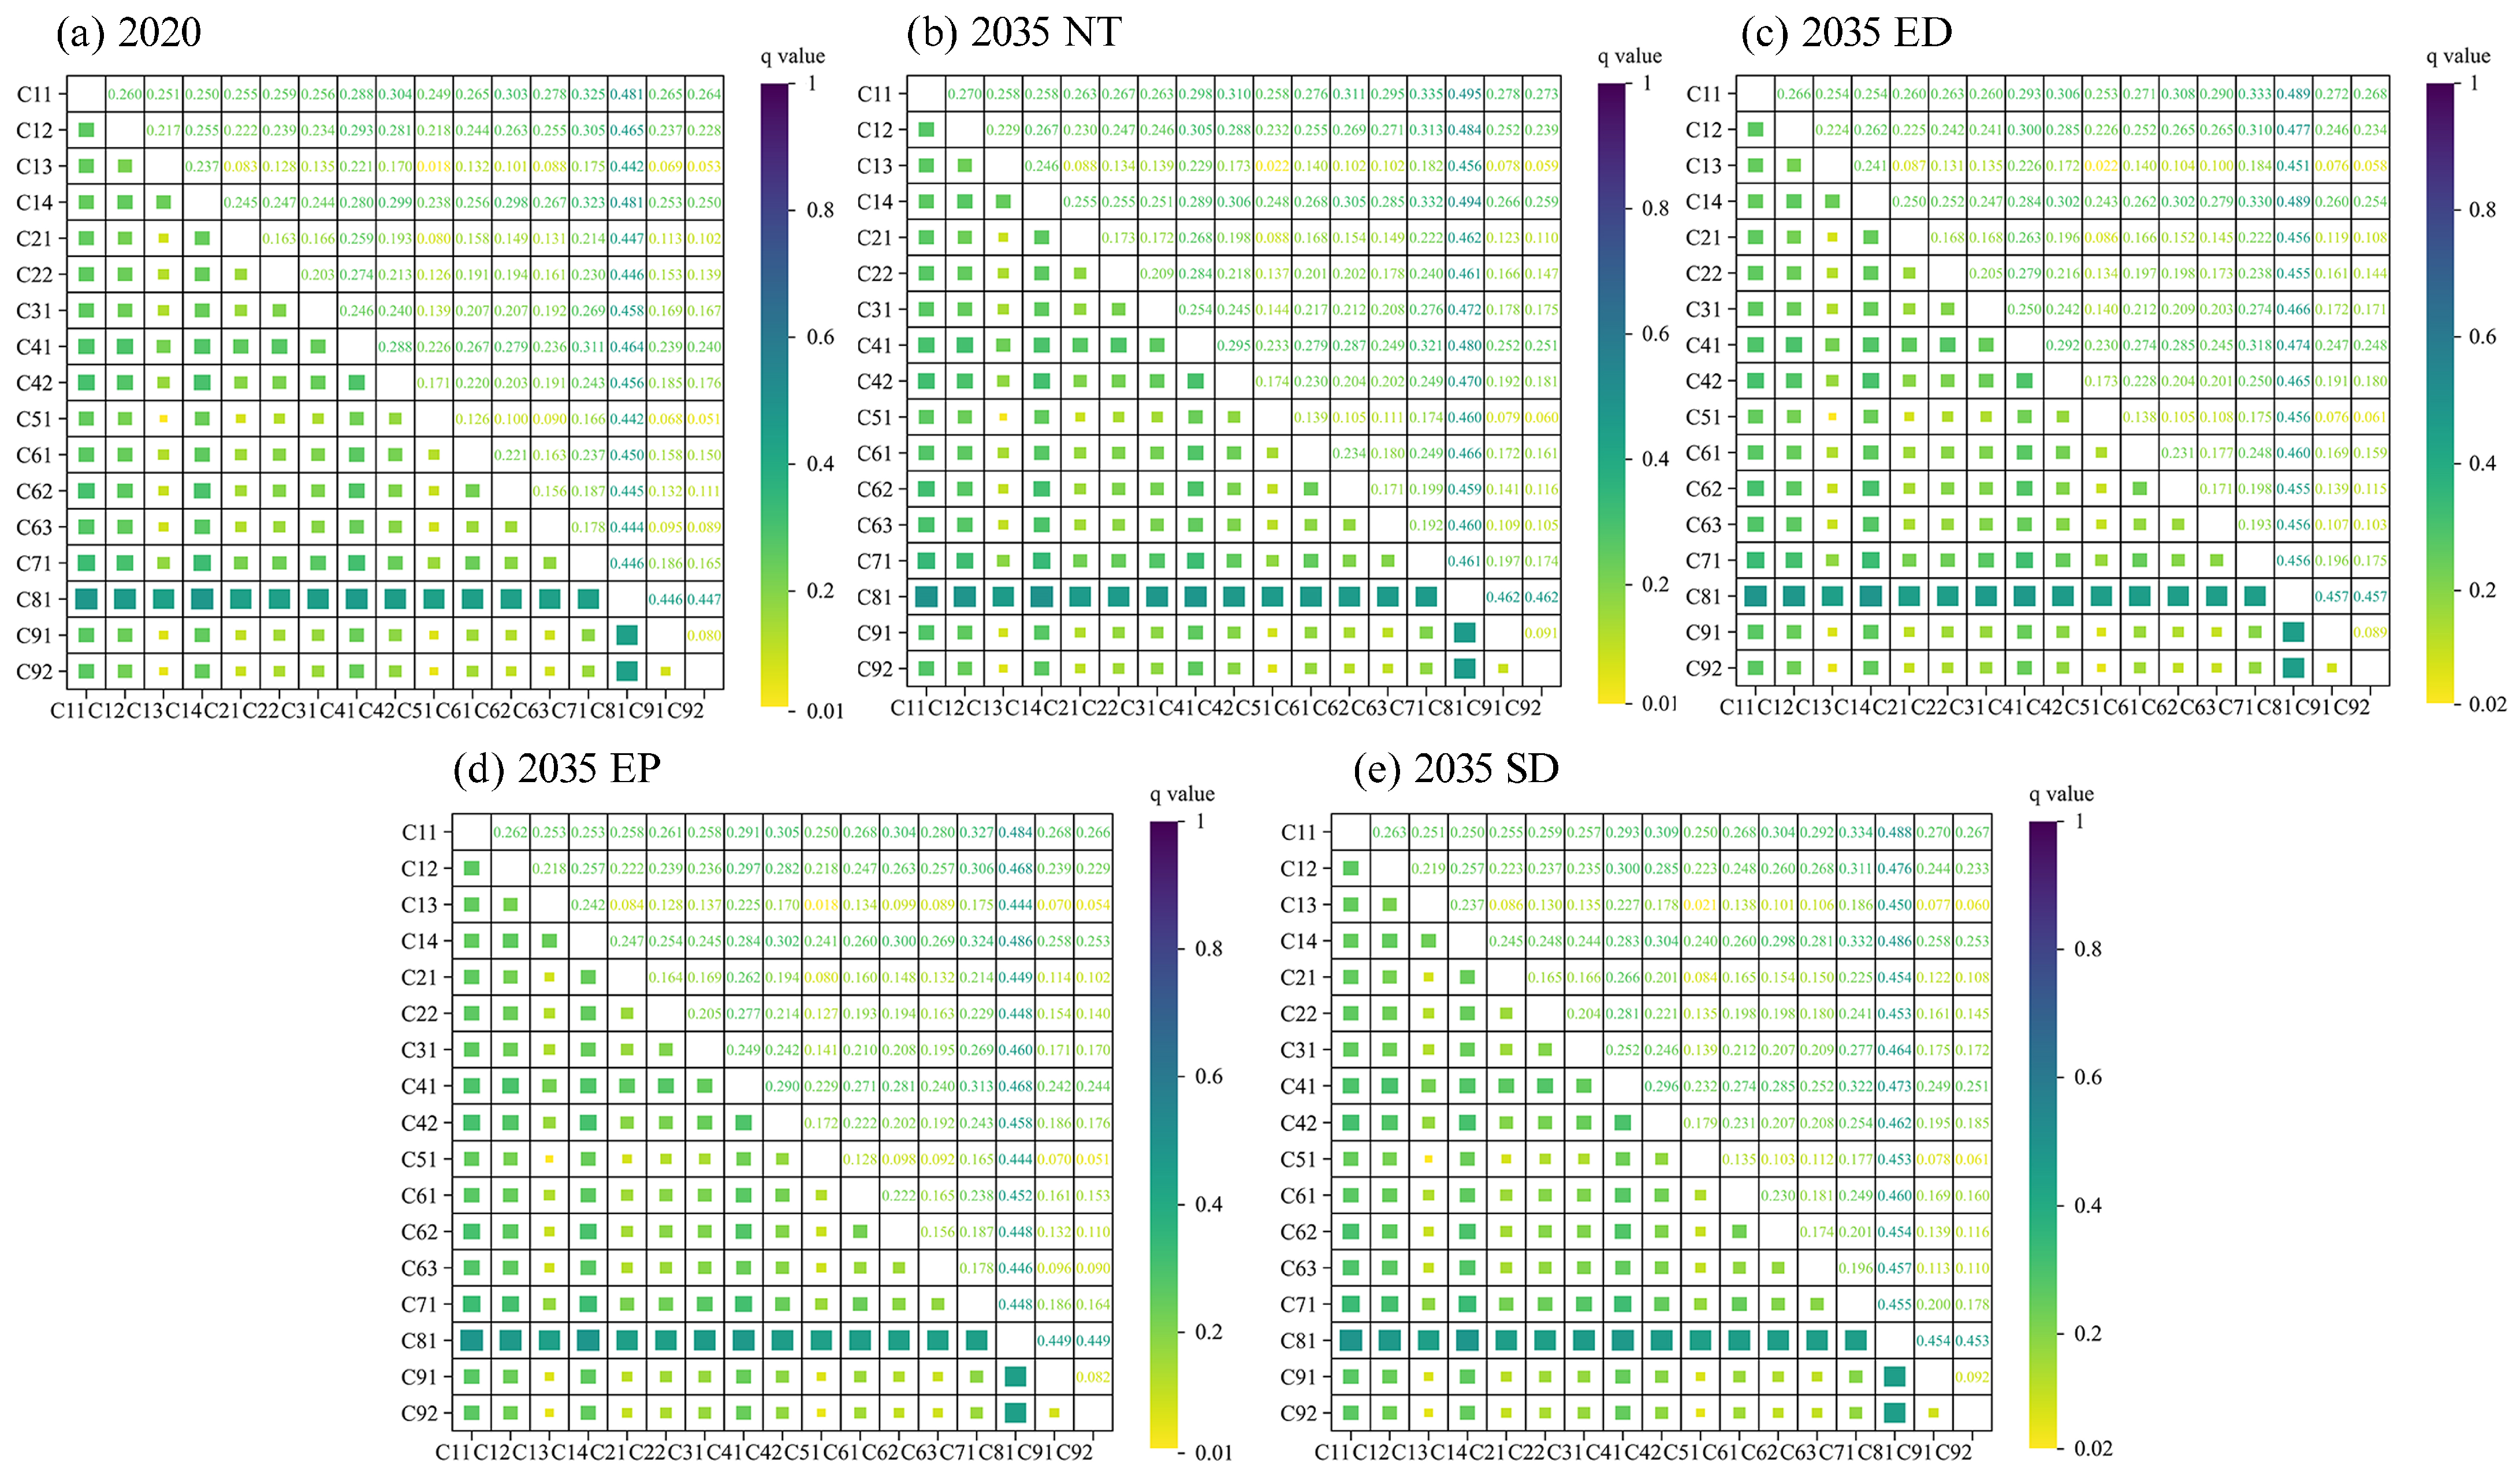
3.3.3. Analysis of Bi-Variable Interaction Mechanisms
4. Discussion
4.1. Advancing Understanding of Spatial Drivers of Carbon Stocks: Insights from OPGD Modeling
4.2. The Role of Woodlands in Regional Carbon Dynamics
4.3. Practical Implications for Carbon Management and Land Use Planning
4.4. Limitations and Perspectives
5. Conclusions
Author Contributions
Funding
Institutional Review Board Statement
Informed Consent Statement
Data Availability Statement
Acknowledgments
Conflicts of Interest
References
- Zaehle, S.; Bondeau, A.; Carter, T.R.; Cramer, W.; Erhard, M.; Prentice, I.C.; Reginster, I.; Rounsevell, M.D.A.; Sitch, S.; Smith, B.; et al. Projected Changes in Terrestrial Carbon Storage in Europe under Climate and Land-use Change, 1990–2100. Ecosystems 2007, 10, 380–401. [Google Scholar] [CrossRef]
- Kato, T.; Tang, Y.; Gu, S.; Cui, X.; Hirota, M.; Du, M.; Li, Y.; Zhao, X.; Oikawa, T. Carbon dioxide exchange between the atmosphere and an alpine meadow ecosystem on the Qinghai–Tibetan Plateau, China. Agric. For. Meteorol. 2004, 124, 121–134. [Google Scholar] [CrossRef]
- Foteinis, S.; Andresen, J.; Campo, F.; Caserini, S.; Renforth, P. Life cycle assessment of ocean liming for carbon dioxide removal from the atmosphere. J. Clean. Prod. 2022, 370, 133309. [Google Scholar] [CrossRef]
- Baumann, M.; Gasparri, I.; Piquer Rodríguez, M.; Gavier Pizarro, G.; Griffiths, P.; Hostert, P.; Kuemmerle, T. Carbon emissions from agricultural expansion and intensification in the Chaco. Glob. Change Biol. 2017, 23, 1902–1916. [Google Scholar] [CrossRef] [PubMed]
- Han, X.; Gao, G.; Chang, R.; Li, Z.; Ma, Y.; Wang, S.; Wang, C.; Lü, Y.; Fu, B. Changes in soil organic and inorganic carbon stocks in deep profiles following cropland abandonment along a precipitation gradient across the Loess Plateau of China. Agric. Ecosyst. Environ. 2018, 258, 1–13. [Google Scholar] [CrossRef]
- Dondini, M.; Martin, M.; De Camillis, C.; Uwizeye, A.; Soussana, J.; Robinson, T.; Steinfeld, H. Global Assessment of Soil Carbon in Grasslands: From Current Stock Estimates to Sequestration Potential; FAO Animal Production and Health Paper, 187; FAO: Rome, Italy, 2023. [Google Scholar]
- Piao, S.; Huang, M.; Liu, Z.; Wang, X.; Ciais, P.; Canadell, J.G.; Wang, K.; Bastos, A.; Friedlingstein, P.; Houghton, R.A. Lower land-use emissions responsible for increased net land carbon sink during the slow warming period. Nat. Geosci. 2018, 11, 739–743. [Google Scholar] [CrossRef]
- Li, Y.; Geng, H. Spatiotemporal trends in ecosystem carbon stock evolution and quantitative attribution in a karst watershed in southwest China. Ecol. Indic. 2023, 153, 110429. [Google Scholar] [CrossRef]
- Di Matteo, G.; Luzzi, G.; Basile, A.; Sposato, A.; Bertini, G.; Neri, U.; Pennelli, B.; Napoli, R.; Nardi, P. Carbon concentrations and carbon storage capacity of three old-growth forests in the Sila National Park, Southern Italy. J. For. Res. 2023, 34, 233–242. [Google Scholar] [CrossRef]
- Ren, S.; Wang, T.; Guenet, B.; Liu, D.; Cao, Y.; Ding, J.; Smith, P.; Piao, S. Projected soil carbon loss with warming in constrained Earth system models. Nat. Commun. 2024, 15, 102. [Google Scholar] [CrossRef]
- Ewing, P.M.; Tu, X.; Runck, B.C.; Nord, A.; Chikowo, R.; Snapp, S.S. Smallholder farms have and can store more carbon than previously estimated. Glob. Change Biol. 2023, 29, 1471–1483. [Google Scholar] [CrossRef]
- Andriamananjara, A.; Hewson, J.; Razakamanarivo, H.; Andrisoa, R.H.; Ranaivoson, N.; Ramboatiana, N.; Razafindrakoto, M.; Ramifehiarivo, N.; Razafimanantsoa, M.; Rabeharisoa, L. Land cover impacts on aboveground and soil carbon stocks in Malagasy rainforest. Agric. Ecosyst. Environ. 2016, 233, 1–15. [Google Scholar] [CrossRef]
- Liu, X.; Wang, S.; Wu, P.; Feng, K.; Hubacek, K.; Li, X.; Sun, L. Impacts of urban expansion on terrestrial carbon storage in China. Environ. Sci. Technol. 2019, 53, 6834–6844. [Google Scholar] [CrossRef] [PubMed]
- Liu, B.; Zhang, L.; Lu, F.; Deng, L.; Zhao, H.; Luo, Y.; Liu, X.; Zhang, K.; Wang, X.; Liu, W. Methodology for accounting the net mitigation of China’s ecological restoration projects (CANM-EP). Methodsx 2019, 6, 1753–1773. [Google Scholar] [CrossRef] [PubMed]
- Houghton, R.A. The annual net flux of carbon to the atmosphere from changes in land use 1850–1990. Tellus B 1999, 51, 298–313. [Google Scholar] [CrossRef]
- Tong, X.; Wang, K.; Yue, Y.; Brandt, M.; Liu, B.; Zhang, C.; Liao, C.; Fensholt, R. Quantifying the effectiveness of ecological restoration projects on long-term vegetation dynamics in the karst regions of Southwest China. Int. J. Appl. Earth Obs. 2017, 54, 105–113. [Google Scholar] [CrossRef]
- Zhao, M.; He, Z.; Du, J.; Chen, L.; Lin, P.; Fang, S. Assessing the effects of ecological engineering on carbon storage by linking the CA-Markov and InVEST models. Ecol. Indic. 2019, 98, 29–38. [Google Scholar] [CrossRef]
- Sitch, S.; Smith, B.; Prentice, I.C.; Arneth, A.; Bondeau, A.; Cramer, W.; Kaplan, J.O.; Levis, S.; Lucht, W.; Sykes, M.T. Evaluation of ecosystem dynamics, plant geography and terrestrial carbon cycling in the LPJ dynamic global vegetation model. Glob. Change Biol. 2003, 9, 161–185. [Google Scholar] [CrossRef]
- Ni, J. Carbon storage in Chinese terrestrial ecosystems: Approaching a more accurate estimate. Clim. Change 2013, 119, 905–917. [Google Scholar] [CrossRef]
- Zhou, T.; Shi, P. Indirect Impacts of Land Use Change on Soil Organic Carbon Change in China. Adv. Earth Sci. 2006, 21, 138. [Google Scholar]
- Gao, Z.; Liu, J.; Cao, M.; Li, K.; Tao, B. Impacts of land-use and climate changes on ecosystem productivity and carbon cycle in the cropping-grazing transitional zone in China. Sci. China Ser. D Earth Sci. 2005, 48, 1479–1491. [Google Scholar] [CrossRef]
- Babbar, D.; Areendran, G.; Sahana, M.; Sarma, K.; Raj, K.; Sivadas, A. Assessment and prediction of carbon sequestration using Markov chain and InVEST model in Sariska Tiger Reserve, India. J. Clean. Prod. 2021, 278, 123333. [Google Scholar] [CrossRef]
- Gong, W.; Duan, X.; Mao, M.; Hu, J.; Sun, Y.; Wu, G.; Zhang, Y.; Xie, Y.; Qiu, X.; Rao, X. Assessing the impact of land use and changes in land cover related to carbon storage by linking trajectory analysis and InVEST models in the Nandu River Basin on Hainan Island in China. Front. Environ. Sci. 2022, 10, 1038752. [Google Scholar] [CrossRef]
- Ke, X.; Tang, L. Impact of cascading processes of urban expansion and cropland reclamation on the ecosystem of a carbon storage service in Hubei Province, China. Acta Ecol. Sin. 2019, 39, 672–683. [Google Scholar]
- He, X.; Xu, Y.; Fan, X.; Geng, Q.; Tian, Z. Temporal and spatial variation and prediction of regional carbon storage in Zhongyuan Urban Agglomeration. China Environ. Sci. 2022, 42, 2965–2976. [Google Scholar]
- Qing, M.; Zhao, J.; Feng, C.; Huang, Z.H.; Wen, Y.Y.; Zhang, W.J. Response of ecosystem carbon storage service to land-use change in Shiyang River Basin from 1980 to 2030. Acta Ecol. Sin. 2022, 42, 9525–9536. [Google Scholar]
- Liu, Y.; Zhang, J.; Zhou, D.M.; Ma, J.; Dang, R.; Ma, J.J.; Zhu, X.Y. Temporal and spatial variation of carbon storage in the Shule River Basin based on InVEST model. Acta Ecol. Sin. 2021, 41, 4052–4065. [Google Scholar]
- Wang, J.F.; Li, X.H.; Christakos, G.; Liao, Y.L.; Zhang, T.; Gu, X.; Zheng, X.Y. Geographical detectors-based health risk assessment and its application in the neural tube defects study of the Heshun Region, China. Int. J. Geogr. Inf. Sci. 2010, 24, 107–127. [Google Scholar] [CrossRef]
- Song, Y.Z.; Wang, J.F.; Ge, Y.; Xu, C.D. An optimal parameters-based geographical detector model enhances geographic characteristics of explanatory variables for spatial heterogeneity analysis: Cases with different types of spatial data. GISci Remote Sens. 2020, 57, 593–610. [Google Scholar] [CrossRef]
- Liang, X.; Guan, Q.; Clarke, K.C.; Liu, S.; Wang, B.; Yao, Y. Understanding the drivers of sustainable land expansion using a patch-generating land use simulation (PLUS) model: A case study in Wuhan, China. Comput. Environ. Urban Syst. 2021, 85, 101569. [Google Scholar] [CrossRef]
- Cao, S.; Jin, X.; Yang, X.; Sun, R.; Liu, J.; Han, B.; Xu, W.; Zhou, Y. Coupled MOP and GeoSOS-FLUS models research on optimization of land use structure and layout in Jintan district. J. Nat. Resour. 2019, 34, 1171. [Google Scholar] [CrossRef]
- Chen, Y.; Zhang, L.; He, L.; Men, M. Multi-scenario simulation of land-use structure based on dual combined model. Acta Ecol. Sin. 2016, 36, 5391–5400. [Google Scholar]
- Li, Y.; Yao, S.; Jiang, H.; Wang, H.; Ran, Q.; Gao, X.; Ding, X.; Ge, D. Spatial-Temporal Evolution and Prediction of Carbon Storage: An Integrated Framework Based on the MOP–PLUS–InVEST Model and an Applied Case Study in Hangzhou, East China. Land 2022, 11, 2213. [Google Scholar] [CrossRef]
- Li, P.; Chen, J.; Li, Y.; Wu, W. Using the InVEST-PLUS model to predict and analyze the pattern of ecosystem carbon storage in Liaoning Province, China. Remote Sens. 2023, 15, 4050. [Google Scholar] [CrossRef]
- State Council of the People’s Republic of China. The Fourteenth Five-Year Plan for the National Economic and Social Development of the People’s Republic of China and the Outline of the Long-Range Goals to 2035; State Council: Beijing, China, 2021. Available online: http://www.gov.cn/xinwen/2021-03/13/content_5592681.htm (accessed on 6 July 2024).
- Zhou, Y.; Yu, Z.; Zhao, S. Carbon storage and budget of major Chinese forest types. Chin. J. Plant Ecol. 2000, 24, 518. [Google Scholar]
- Lijun, C.; Gaohuan, L.; Xianfeng, F. Estimation of net primary productivity of terrestrial vegetation in China by remote sensing. J. Integr. Plant Biol. 2001, 43, 1191. [Google Scholar]
- Li, K.R.; Wang, S.; Mingkui, C. Vegetation and soil carbon stocks in China. Sci. Sin. Terrae (Ser. D) 2003, 33, 72–80. [Google Scholar]
- Chuai, X.; Huang, X.; Lai, L.; Wang, W.; Peng, J.; Zhao, R. Land use structure optimization based on carbon storage in several regional terrestrial ecosystems across China. Environ. Sci. Policy 2013, 25, 50–61. [Google Scholar] [CrossRef]
- Xiao-Huan, X.; Min, L.I.; Xiu-Zhi, Z.; Yan-Beng, Z.; De-Cun, Z.; Jian-Xin, Z.; Lei, D.; Yi, Y. Research on soil organic carbon distribution and change trend in middle east plain and its vicinity in China. Earth Sci. Front. 2013, 20, 154. [Google Scholar]
- Xianli, X.; Bo, S.; Huizhen, Z.; Zhongpei, L.; Anbo, L. Organic carbon density and storage in soils of China and spatial analysis. Acta Pedol. Sin. 2004, 41, 35–43. [Google Scholar]
- Newland, C.P.; Maier, H.R.; Zecchin, A.C.; Newman, J.P.; van Delden, H. Multi-objective optimisation framework for calibration of Cellular Automata land-use models. Environ. Modell. Softw. 2018, 100, 175–200. [Google Scholar] [CrossRef]
- Hamel, P.; Chaplin-Kramer, R.; Sim, S.; Mueller, C. A new approach to modeling the sediment retention service (InVEST 3.0): Case study of the Cape Fear catchment, North Carolina, USA. Sci. Total Environ. 2015, 524, 166–177. [Google Scholar] [CrossRef] [PubMed]
- Natural Capital Project. InVEST 3.16.0a1. Stanford University, University of Minnesota, Chinese Academy of Sciences, The Nature Conservancy, World Wildlife Fund, Stockholm Resilience Centre and the Royal Swedish Academy of Sciences. 2025. Available online: https://natcap.github.io/invest.release-metadata/3.16.0.html (accessed on 4 June 2025).
- Guo, P.; Wang, H.; Qin, F.; Miao, C.; Zhang, F. Coupled MOP and PLUS-SA Model Research on Land Use Scenario Simulations in Zhengzhou Metropolitan Area, Central China. Remote Sens. 2023, 15, 3762. [Google Scholar] [CrossRef]
- Yang, Y.; Wang, H.; Li, X.; Huang, X.; Lyu, X.; Tian, H.; Qu, T. How will ecosystem carbon sequestration contribute to the reduction of regional carbon emissions in the future? analysis based on the MOP-PLUS model framework. Ecol. Indic. 2023, 156, 111156. [Google Scholar] [CrossRef]
- Wang, Y.; Li, X.; Zhang, Q.; Li, J.; Zhou, X. Projections of future land use changes: Multiple scenarios-based impacts analysis on ecosystem services for Wuhan city, China. Ecol. Indic. 2018, 94, 430–445. [Google Scholar] [CrossRef]
- Zhang, Y.; Hu, X.; Wei, B.; Zhang, X.; Tang, L.; Chen, C.; Wang, Y.; Yang, X. Spatiotemporal exploration of ecosystem service value, landscape ecological risk, and their interactive relationship in Hunan Province, Central-South China, over the past 30 years. Ecol. Indic. 2023, 156, 111066. [Google Scholar] [CrossRef]
- Xie, G.D.; Zhen, L.; Lu, C.X.; Cao, S.Y.; Xiao, Y. Supply, consumption and valuation of ecosystem services in China. Resour. Sci. 2008, 30, 93–99. [Google Scholar]
- Costanza, R.; De Groot, R.; Sutton, P.; Van der Ploeg, S.; Anderson, S.J.; Kubiszewski, I.; Farber, S.; Turner, R.K. Changes in the global value of ecosystem services. Glob. Environ. Change 2014, 26, 152–158. [Google Scholar] [CrossRef]
- He, K.; Song, H.Y. China’s food security under the constraints of resources and environment: Connotation, challenges and policy orientation. J. Nanjing Agric. Univ. (Soc. Sci. Ed.) 2021, 21, 45–57. [Google Scholar]
- Zhang, J.; Ding, H.; Xu, J.; Zheng, B. A Simulation-Based Prediction of Land Use Change Impacts on Carbon Storage from a Regional Imbalance Perspective: A Case Study of Hunan Province, China. Land 2024, 13, 1721. [Google Scholar] [CrossRef]
- Yu, R.; Cheng, H.; Ye, Y.; Wang, Q.; Fan, S.; Li, T.; Wang, C.; Su, Y.; Zhang, X. Optimization of the Territorial Spatial Patterns Based on MOP and PLUS Models: A Case Study from Hefei City, China. Int. J. Environ. Res. Public Health 2023, 20, 1804. [Google Scholar] [CrossRef]
- Xiaojie, G.; Handong, G.; Chen, Z. Restoration of ecosystem and water resources conservation in forests and wetlands in Hunan Province. Hunan For. Sci. Technol. 2003, 1, 9–12. [Google Scholar]
- Wang, H.Y.; Gao, P.C.; Xie, Y.R.; Song, C.; Cheng, C.; Ye, S. Multi-objective optimization of land use in Xining City based on improve NSGA-Ⅱ. Geogr. Geo-Inf. Sci. 2020, 36, 84–89. [Google Scholar]
- Deb, K.; Pratap, A.; Agarwal, S.; Meyarivan, T. A fast and elitist multiobjective genetic algorithm: NSGA-II. IEEE T Evol. Comput. 2002, 6, 182–197. [Google Scholar] [CrossRef]
- Du, M.; Liu, C.; Wang, W.; Yang, H. Simulation of Ecological Risk in Beijing Using Mop-Plus Model. Int. Arch. Photogramm. Remote Sens. Spat. Inf. Sci. 2022, 48, 15–22. [Google Scholar] [CrossRef]
- Wang, R.; Zhao, J.; Lin, Y.; Chen, G.; Cao, Q.; Feng, Y. Land Change Simulation and Forest Carbon Storage of Central Yunnan Urban Agglomeration, China Based on SSP-RCP Scenarios. Forests 2022, 13, 2030. [Google Scholar] [CrossRef]
- Shuqi, L.; Xiaomeng, H.U.; Yuan, S.; Cai, Y.; Xin, Z. Multi-scenario land use change and its impact on carbon storage based on coupled Plus-Invest model. Chin. J. Eco-Agric. 2023, 31, 300–314. [Google Scholar]
- Jobbágy, E.G.; Jackson, R.B. The vertical distribution of soil organic carbon and its relation to climate and vegetation. Ecol. Appl. 2000, 10, 423–436. [Google Scholar] [CrossRef]
- Giardina, C.P.; Coleman, M.D.; Hancock, J.E.; King, J.S.; Lilleskov, E.A.; Loya, W.M.; Pregitzer, K.S.; Ryan, M.G.; Trettin, C.C. The Response of Belowground Carbon Allocation in Forests to Global Change; Springer: Berlin/Heidelberg, Germany, 2005; pp. 119–154. [Google Scholar]
- Huang, M.; Ji, J.J.; Cao, M.K.; Li, K.R. Modeling study of vegetation shoot and root biomass in China. Acta Ecol. Sin. 2006, 26, 4156–4163. [Google Scholar]
- Chen, G.S.; Yang, Y.S.; Xie, J.S.; Du, Z.; Zhang, J. Total belowground carbon allocation in China’s forests. Acta Ecol. Sin. 2007, 27, 5148–5157. [Google Scholar]
- Chen, G.; Yang, Y.; Liu, L.; Li, X.; Zhao, Y.; Yuan, Y. Research review on total belowground carbon allocation in forest ecosystems. J. Subtrop. Resour. Environ. 2007, 2, 34–42. [Google Scholar]
- Alam, S.A.; Starr, M.; Clark, B.J. Tree biomass and soil organic carbon densities across the Sudanese woodland savannah: A regional carbon sequestration study. J. Arid. Environ. 2013, 89, 67–76. [Google Scholar] [CrossRef]
- Tang, X.; Zhao, X.; Bai, Y.; Tang, Z.; Wang, W.; Zhao, Y.; Wan, H.; Xie, Z.; Shi, X.; Wu, B. Carbon pools in China’s terrestrial ecosystems: New estimates based on an intensive field survey. Proc. Natl. Acad. Sci. USA 2018, 115, 4021–4026. [Google Scholar] [CrossRef] [PubMed]
- Li, J.P.; Xia, S.X.; Yu, X.B.; Li, S.X.; Xu, C.; Zhao, N.; Wang, S.T. Evaluation of carbon storage on terrestrial ecosystem in Hebei province based on InVEST model. J. Ecol. Rural Environ. 2020, 36, 854–861. [Google Scholar]
- Eggleston, H.S.; Buendia, L.; Miwa, K.; Ngara, T.; Tanabe, K. (Eds.) IPCC Guidelines for National Greenhouse Gas Inventories; The National Greenhouse Gas Inventories Programme: Iges, Japan, 2006. [Google Scholar]
- Zhu, C.; Yuan, S.; Yang, L. Spatial optimization of land use pattern and trade-off analysis in Hangzhou City by coupling MOP and FLUS model. Trans. Chin. Soc. Agric. Eng. (Trans. Csae) 2023, 39, 235–244. [Google Scholar]
- Chuai, X.W.; Huang, X.J.; Zheng, Z.Q.; Zhang, M.; Liao, Q.; Lai, L.; Lu, J. Land use change and its influence on carbon storage of terrestrial ecosystems in Jiangsu Province. Resour. Sci. 2011, 33, 1932–1939. [Google Scholar]
- Walker, W.S.; Gorelik, S.R.; Cook-Patton, S.C.; Baccini, A.; Farina, M.K.; Solvik, K.K.; Ellis, P.W.; Sanderman, J.; Houghton, R.A.; Leavitt, S.M. The global potential for increased storage of carbon on land. Proc. Natl. Acad. Sci. USA 2022, 119, e2111312119. [Google Scholar] [CrossRef]
- Chen, G.; Peng, Q.; Fan, Q.; Lin, W.; Su, K. Spatial-Temporal Variation and Driving Forces of Carbon Storage at the County Scale in China Based on a Gray Multi-Objective Optimization-Patch-Level Land Use Simulation-Integrated Valuation of Ecosystem Services and Tradeoffs-Optimal Parameter-Based Geographical Detector Model: Taking the Daiyun Mountain’s Rim as an Example. Land 2025, 14, 14. [Google Scholar]
- Zhang, H.; Li, X.; Luo, Y.; Chen, L.; Wang, M. Spatial heterogeneity and driving mechanisms of carbon storage in the urban agglomeration within complex terrain: Multi-scale analyses under localized SSP-RCP narratives. Sustain. Cities Soc. 2024, 109, 105520. [Google Scholar] [CrossRef]
- Mengni, D.; Zhen, H.; Jun, H. Analysis of Influencing Factors of Carbon Storage Change in Pudong New Area of Shanghai; The Administration and Technique of Environmental Monitoring: Nanjing, China, 2024. [Google Scholar]
- Cornejo, N.S.; Becker, J.N.; Hemp, A.; Hertel, D. Effects of land-use change and disturbance on the fine root biomass, dynamics, morphology, and related C and N fluxes to the soil of forest ecosystems at different elevations at Mt. Kilimanjaro (Tanzania). Oecologia 2023, 201, 1089–1107. [Google Scholar] [CrossRef]
- Xinhui, J.; Yongqiang, C.; Jiaqi, Y.; Haoran, Z.; Jun, F. Land use and ecosystem carbon storage change and prediction in the Haihe River basin. South-North Water Transf. Water Sci. Technol. 2023, 5, 985–995. [Google Scholar]
- Mao, Y.F.; Zhou, Q.G.; Wang, T.; Luo, H.R.; Wu, L.J. Spatial-temporal Variation of Carbon Storage and Its Quantitative Attribution in the Three Gorges Reservoir Area Coupled With PLUS-InVEST Geodector Model. Resour. Environ. Yangtze Basin 2023, 32, 1042–1057. [Google Scholar]
- Zhu, L.; Song, R.; Sun, S.; Li, Y.; Hu, K. Land use/land cover change and its impact on ecosystem carbon storage in coastal areas of China from 1980 to 2050. Ecol. Indic. 2022, 142, 109178. [Google Scholar] [CrossRef]
- Tang, L.; Ke, X.; Zhou, T.; Zheng, W.; Wang, L. Impacts of cropland expansion on carbon storage: A case study in Hubei, China. J. Environ. Manag. 2020, 265, 110515. [Google Scholar] [CrossRef]
- Li, J.; Wang, J.; Li, L.; Zhou, C.; Niu, Q.; Zhang, C. Impact of land use change on carbon storage in the Dongting Lake eco-economic Zone. Chin. J. Ecol. 2022, 41, 1156–1165. [Google Scholar]
- Wang, C.Y.; He, N.P.; Lyu, Y.L. Latitudinal patterns and factors affecting different soil organic carbon fractions in the eastern forests of China. Acta Ecol. Sin. 2016, 36, 3176–3188. [Google Scholar]
- Li, M.; Shangguan, Z.; Deng, L. Spatial distribution of carbon storages in the terrestrial ecosystems and its influencing factors on the Loess Plateau. Acta Ecol. Sin. 2021, 41, 6786–6799. [Google Scholar]
- Manning, W.J.; Tiedemann, A.V. Climate change: Potential effects of increased atmospheric Carbon dioxide (CO2), ozone (O3), and ultraviolet-B (UV-B) radiation on plant diseases. Environ. Pollut. 1995, 88, 219–245. [Google Scholar] [CrossRef]
- Hernández-Alonso, H.; Madrigal-González, J.; Tornos-Estupiña, L.; Santiago-Rodríguez, A.; Alonso-Rojo, P.; Morera-Beita, A.; Silla, F. Tree-size heterogeneity modulates the forest age-dependent carbon density in biomass and top soil stocks on Mediterranean woodlands. Plant Soil. 2023, 486, 361–373. [Google Scholar] [CrossRef]
- Zhong, Y.; Zhang, X.; Yang, Y.; Xue, M. Optimization and Simulation of Mountain City Land Use Based on MOP-PLUS Model: A Case Study of Caijia Cluster, Chongqing. Isprs Int. J. Geo-Inf. 2023, 12, 451. [Google Scholar] [CrossRef]
- Zhu, W.; Zhang, J.; Cui, Y.; Zheng, H.; Zhu, L. Assessment of territorial ecosystem carbon storage based on land use change scenario: A case study in Qihe River Basin. Acta Geogr. Sin. 2019, 74, 446–459. [Google Scholar]
- Zou, W.T.; He, Y.J.; Ye, B.; Zhao, X.D.; Xu, D.Y.; Xiao, R.G.; Duan, Y.X. Study on carbon storage of ecosystem in Qianjiangyuan national park based on InVEST model. J. Cent. South. Univ. Technol. 2021, 41, 120–128. [Google Scholar]
- Chang, X.; Xing, Y.; Wang, J.; Yang, H.; Gong, W. Effects of land use and cover change (LUCC) on terrestrial carbon stocks in China between 2000 and 2018. Resour. Conserv. Recycl. 2022, 182, 106333. [Google Scholar] [CrossRef]

| Data Type | Data Name | Data Source | Resolution |
|---|---|---|---|
| Natural factor | Annual precipitation | Resources and Environmental Science and Data Center, Chinese Academy of Sciences (https://www.resdc.cn/) accessed on 18 October 2024. | 1 km |
| Annual mean temperature | 1 km | ||
| DEM | Geospatial data cloud (https://www.gscloud.cn/) accessed on 6 October 2024. | 30 m | |
| Slope | |||
| Aspect of slope | |||
| Soil type | Resources and Environmental Science and Data Center, Chinese Academy of Sciences (https://www.resdc.cn/) accessed on 28 October 2024. | 1 km | |
| Soil erosion | 1 km | ||
| Social factor | Distance to highway/grade one road/grade two road/grade three road | National geographic information resources directory service system (https://www.webmap.cn/) accessed on 23 October 2024. | - |
| Distance to railway | OSM (http://www.openstreetmap.org) | - | |
| Distance to train station | National geographic information resources directory service system (https://www.webmap.cn/) accessed on 20 October 2024. | - | |
| Distance to water | National geographic information resources directory service system (https://www.webmap.cn/) accessed on 20 October 2024. | - | |
| Distance to government | National geographic information resources directory service system (https://www.webmap.cn/) accessed on 21 October 2024. | - | |
| GDP | Resources and Environmental Science and Data Center, Chinese Academy of Sciences (https://www.resdc.cn/) accessed on 18 October 2024. | 1 km | |
| Population density | 1 km |
| Primary Index | Secondary Index | Tertiary Index | Data Source |
|---|---|---|---|
| Natural factor | C1 Landform | C11 Elevation | Geospatial data cloud (https://www.gscloud.cn/) |
| C12 Slope | |||
| C13 Aspect of slope | |||
| C14 Topographic relief | Earth Resources Data Cloud (www.gis5g.com) | ||
| C2 Climate | C21 Annual precipitation | Resources and Environmental Science and Data Center, Chinese Academy of Sciences (https://www.resdc.cn/) | |
| C22 Average annual temperature | |||
| C3 Soil | C31 Soil type | ||
| C4 Vegetation | C41 Net primary productivity of vegetation | https://doi.org/10.5067/MODIS/MOD17A3HGF.061 | |
| C42 Normalized vegetation index | http://www.nesdc.org.cn/ | ||
| C5 Hydrology | C51 Distance to water | National geographic information resources directory service system (https://www.webmap.cn/) | |
| Social factor | C6 Economic development | C61 Gross regional Product | Resources and Environmental Science and Data Center, Chinese Academy of Sciences (https://www.resdc.cn/) |
| C62 GDP per capita | |||
| C63 Night light index | National Earth System Science Data Center (https://www.geodata.cn) | ||
| C7 Population distribution | C71 Population Distribution Grid | ORNL LandScan Viewer—Oak Ridge National Laboratory (https://landscan.ornl.gov/) | |
| C8 Urbanization process | C81 Comprehensive index of land use degree | Derived from LULC data | |
| Location condition | C9 Location traffic | C91 Distance to administrative center | National geographic information resources directory service system (https://www.webmap.cn/) |
| C92 Distance to highway |
| Land Use Type | Plant Biomass Density | Soil Carbon Density | Dead Organic Matter | ||||||
|---|---|---|---|---|---|---|---|---|---|
| Carbon Density | Researcher | Study Scope | Carbon Density | Researcher | Study Scope | Carbon Density | Researcher | Study Scope | |
| Cropland | 5.7 | Li et al. [38] | China | 108.4 | Li et al. [38] | China | 0 | Li et al. [38] | China |
| Woodland | 57.07 | Zhou et al. [36] | 115.9 | Xie et al. [41] | 8.21 | ||||
| Grassland | 3.4 | Li et al. [38] | 99.9 | Li et al. [38] | 0 | ||||
| Water | 0 | Li et al. [38] | 51.8 | Chuai et al. [39] | 0 | ||||
| Construction land | 0.25 | Chen et al. [37] | 40.24 | Xi et al. [40] | Central and East China | 0 | |||
| Unused land | 0 | Li et al. [38] | 28.24 | 0 | |||||
| Constraint Factor | Constraint Condition | Rule Basis |
|---|---|---|
| Total land area | x1 + x2 + x3 + x4 + x5 + x6 = 21,168,510.39 The formula represents the total planned area (ha) of cropland, woodland, grassland, water, construction land, and unused land in 2035. | This fundamental constraint ensures the conservation of the total geographical area of Hunan Province, reflecting the finite nature of land resources and serving as a basic closure condition for land use allocation models. |
| Cropland | NT: Cropland area = Cropland area in 2035. (projected by historical trend, 5,827,405.41 km2) ED: Cropland area ≤ Cropland area in 2020 (5,914,659.15 km2). EP: Cropland area ≥ Cropland area in 2035 (NT). SD: Cropland area is between the 2035 NT and the 2020 cropland area. 5,827,405.41≤ x1 ≤ 5,914,659.15 | China’s national policy emphasizes the “red line” for cropland protection to ensure food security, while also recognizing the inevitability of cropland loss due to urbanization and industrialization [45]. The observed trend in Hunan Province from 2000 to 2020 also indicates a slight decreasing trend in cropland (e.g., historical data showed a decline of approximately 0.70% per year). However, advancements in agricultural technology and increases in yield per unit area are expected to mitigate food security challenges despite some reduction in total cropland [51]. Therefore, for the ED, the 2020 cropland area was set as an upper bound, reflecting potential land occupation by economic development while preventing uncontrolled expansion. For the EP, the 2035 NT projection serves as a lower bound, emphasizing cropland preservation. The SD seeks to balance these two approaches. |
| Woodland | NT: Woodland area = Historical trend projection for 2035. ED: Woodland area ≥ Woodland area in 2035 (NT). EP: Woodland area ≤ Woodland area in 2035 (NT) × 1.01. SD: Woodland area is between the 2035 NT and the 2035 EP, encouraging moderate growth. 13,084,800.66 ≤ x2 ≤ 14,393,280.73 | Woodlands play a substantial role in mitigating carbon emissions and enhancing carbon sequestration, aligning with China’s national carbon peaking and carbon neutrality goals. While Hunan Province experienced a decreasing trend in woodland area over the past two decades (e.g., a net decrease of approximately 0.5% between 2000 and 2020), national and provincial ecological restoration policies, such as the “Grain for Green” program and initiatives for afforestation and forest protection, aim to reverse this trend and increase forest cover [52]. For EP, an upper limit of a 1% increase over the NT woodland area in 2035 was established. This specific 1% target is a commonly adopted ambition in regional ecological planning efforts in China, reflecting an achievable yet ambitious goal for forest expansion given land availability and restoration potential [53], and other relevant regional planning documents or expert consensus if available]. The ED constrains woodland area to be at least the natural trend to prevent excessive forest loss. The SD seeks moderate growth in woodland area, between the natural trend and the ecological protection scenario’s upper limit, reflecting coordinated ecological and economic development. |
| Grassland | NT: Grassland are = Historical trend projection for 2035. ED: Grassland area ≤ Grassland area in 2010 (reflecting rapid conversion upper limit). EP: Grassland area ≥ Grassland area in 2035 (NT). SD: Grassland area is between the 2035 NT and the 2010 grassland area, managing its conversion. 674,066.16 ≤ x3 ≤ 699,804.90 | Analysis of the land use transfer matrix (2000–2020) indicates that grassland in Hunan Province has primarily been converted to cropland, woodland, and construction land, serving as a relatively flexible land reserve for various land use expansions. The area showed a steady decline from 2000 to 2020 (e.g., a total decline of approximately 9% over the period). Given this historical trend and the pressure from other land demands, the lower limit for the EP is set at the 2035 NT projection to prevent further significant degradation. The ED’s upper limit is the 2010 level, representing a plausible upper bound given historical conversion rates rather than an unrealistic reversal of long-term trends. The SD aims to control uncontrolled grassland conversion, allowing for some development needs while preventing excessive decline. |
| Water | Will generally remain stable or slightly expand within scenario-specific bounds. NT: Water area = Historical trend projection for 2035. ED: Water area ≥ Water area in 2020 (ensuring basic water resources). EP: Water area ≤ Water area in 2035 (NT) (limiting excessive expansion). SD: Water area is between the 2020 water area and the 2035 NT, encouraging orderly utilization. 819,623.70 ≤ x4 ≤ 827,499.06 | The spatial extent of water bodies in Hunan Province has generally expanded over the past 20 years, largely due to reservoir construction, river regularization projects, and natural hydrological processes [54]. To ensure the maintenance of essential hydrological functions and ecological services, the lower limit for all scenarios was set at the 2020 water area level. The upper limit for the EP is set to the projected NT water area for 2035, reflecting a balance between natural expansion and land management, preventing excessive encroachment on other land types. The ED allows for reasonable development and utilization while safeguarding water resources. The SD aims to maintain water body stability and promote sustainable management. |
| Construction land | NT: Construction land area = Historical trend projection for 2035. ED: Construction land area ≤ Construction land area in 2035 (NT) (allowing maximum expansion). EP: Construction land area ≥ Construction land area in 2020 (ensuring basic development needs). SD: Construction land area is between the 2020 construction land area and the 2035 NT, controlling for reasonable growth. 576,397.98 ≤ x5 ≤ 752,625.27 | Construction land in Hunan Province experienced rapid expansion between 2000 and 2020 due to accelerated urbanization and industrialization (e.g., a net increase of approximately 104% over the period). As a fundamental component of socio-economic development, the total area of construction land must at least be maintained at the 2020 level in all scenarios to accommodate basic development needs. For the ED, the upper limit was set to the projected NT area for 2035, reflecting historical growth momentum and a continuation of current development patterns, allowing for maximum expansion. For the EP, growth is strictly limited to prioritize ecological preservation, accommodating only necessary, minimal needs. The SD emphasizes the efficient and intensive use of construction land, controlling its growth within a reasonable range. |
| Unused land | NT: Unused land area = Historical trend projection for 2035. ED: Unused land area ≤ Unused land area in 2035(NT). EP: Unused land area ≥ Unused land area in 2035 NT. SD: Unused land area is between the 2035 NT and the 2020 unused land area, balancing rational development and protection. 2113.83 ≤ x6 ≤ 2866.68 | While the area of unused land in Hunan Province showed an increasing trend from 21.89 km2 in 2000 to 28.67 km2 in 2020 (an approximate 30% increase), this recent growth might be attributed to specific reclassification or abandonment patterns. However, with accelerating urbanization and intensified land development pressures, the long-term trend for unused land is likely to be a gradual reduction as it serves as a critical land bank for future expansion of other LULC types. Therefore, for all future scenarios (ED, EP, SD), the upper limit for unused land area is set to its 2020 level. This conservative approach acknowledges that despite past increases, sustainable land management and urban expansion will likely constrain future growth or even lead to a reduction of this resource. The lower limit is set to the 2035 NT projection, ensuring that the model maintains at least the naturally projected amount of unused land. This combined approach reflects the dynamic nature of unused land, balancing its historical increase with anticipated future pressures. |
| Land Use Type | Cropland | Woodland | Grassland | Water | Construction Land | Unused Land |
|---|---|---|---|---|---|---|
| Neighborhood weight | 0.2370 | 0.2207 | 0.0403 | 0.0214 | 0.4786 | 0.0020 |
| Future Land Use Development Scenarios | Cropland | Woodland | Grassland | Water | Construction Land | Unused Land | |
|---|---|---|---|---|---|---|---|
| NT | Cropland | 1 | 1 | 0 | 0 | 1 | 0 |
| Woodland | 1 | 1 | 0 | 0 | 0 | 0 | |
| Grassland | 1 | 1 | 1 | 1 | 1 | 1 | |
| Water | 1 | 0 | 0 | 1 | 0 | 1 | |
| Construction land | 0 | 0 | 0 | 0 | 1 | 0 | |
| Unused land | 1 | 1 | 1 | 1 | 1 | 1 | |
| ED | Cropland | 1 | 1 | 1 | 0 | 0 | 0 |
| Woodland | 1 | 1 | 1 | 0 | 0 | 0 | |
| Grassland | 1 | 1 | 1 | 0 | 0 | 1 | |
| Water | 1 | 0 | 0 | 1 | 1 | 1 | |
| Construction land | 0 | 0 | 0 | 0 | 1 | 0 | |
| Unused land | 1 | 1 | 1 | 1 | 1 | 1 | |
| EP | Cropland | 1 | 1 | 0 | 0 | 0 | 0 |
| Woodland | 0 | 1 | 0 | 0 | 0 | 0 | |
| Grassland | 0 | 1 | 1 | 0 | 0 | 0 | |
| Water | 0 | 0 | 0 | 1 | 0 | 0 | |
| Construction land | 0 | 0 | 0 | 0 | 1 | 0 | |
| Unused land | 1 | 1 | 1 | 1 | 1 | 1 | |
| SD | Cropland | 1 | 1 | 1 | 0 | 0 | 0 |
| Woodland | 0 | 1 | 0 | 0 | 0 | 0 | |
| Grassland | 0 | 1 | 1 | 0 | 0 | 1 | |
| Water | 0 | 0 | 0 | 1 | 0 | 0 | |
| Construction land | 0 | 0 | 0 | 0 | 1 | 0 | |
| Unused land | 1 | 1 | 1 | 1 | 1 | 1 | |
| LULC | Plant Biomass Density | Aboveground Biomass | Subsurface Biomass | Soil Carbon Density | Dead Organic Matter |
|---|---|---|---|---|---|
| Cropland | 13.96 | 11.73 | 2.23 | 167.86 | 0.00 |
| Woodland | 139.81 | 102.80 | 37.01 | 179.48 | 12.71 |
| Grassland | 8.33 | 1.34 | 6.99 | 154.70 | 0.00 |
| Water | 0.00 | 0.00 | 0.00 | 80.21 | 0.00 |
| Construction land | 0.61 | 0.61 | 0.00 | 62.31 | 0.00 |
| Unused land | 24.98 | 3.84 | 21.14 | 43.73 | 1.21 |
| LULC | 2000 | 2005 | 2010 | 2015 | 2020 |
|---|---|---|---|---|---|
| Cropland | 61,148.49 | 60,787.96 | 60,046.51 | 59,680.50 | 59,146.59 |
| Woodland | 132,250.57 | 13,2139.66 | 132,199.72 | 131,967.67 | 131,660.57 |
| Grassland | 7573.28 | 7554.93 | 6998.05 | 6949.38 | 6889.06 |
| Water | 7868.10 | 8012.07 | 8146.19 | 8170.93 | 8196.24 |
| Construction land | 2822.78 | 3169.94 | 4260.40 | 4882.73 | 5763.98 |
| Unused land | 21.89 | 20.54 | 34.23 | 33.90 | 28.67 |
| Year | Future Development Scenarios | Cropland | Woodland | Grassland | Water | Construction Land | Unused Land |
|---|---|---|---|---|---|---|---|
| 2020 | / | 5,914,659.15 | 13,166,056.8 | 688,906.08 | 819,623.7 | 576,397.98 | 2866.68 |
| 2035 | NT | 5,827,405.41 | 13,084,800.66 | 674,066.16 | 827,499.06 | 752,625.27 | 2113.83 |
| ED | 5,827,405.41 | 13,084,800.66 | 681,941.52 | 819,623.7 | 752,625.27 | 2113.83 | |
| EP | 5,827,405.41 | 13,261,027.93 | 674,066.17 | 827,499.06 | 576,397.98 | 2113.83 | |
| SD | 5,828,995.08 | 13,086,113.58 | 679,635.86 | 821,207.47 | 750,428.97 | 2129.42 |
| Year | Cropland | Woodland | Grassland | Water | Construction Land | Unused Land |
|---|---|---|---|---|---|---|
| 2000 | 0.5860 | 0.1456 | 0.4963 | 1.0000 | 0.0833 | 0.3866 |
| 2005 | 0.6031 | 0.2027 | 0.6968 | 1.0000 | 0.9241 | 0.2335 |
| 2010 | 0.5936 | 0.1984 | 0.6882 | 1.0000 | 0.9212 | 0.2283 |
| 2015 | 0.6055 | 0.2039 | 0.6990 | 1.0000 | 0.9249 | 0.2349 |
| 2020 | 0.6015 | 0.2020 | 0.6954 | 1.0000 | 0.9237 | 0.2327 |
| Year | C_Above | C_Below | C_Soil | C_Dead | Carbon Density | Total Carbon Stock |
|---|---|---|---|---|---|---|
| 2000 | 14.32 | 5.08 | 35.98 | 1.68 | 269.60 | 57.07 |
| 2005 | 14.31 | 5.08 | 35.93 | 1.68 | 269.26 | 57.00 |
| 2010 | 14.31 | 5.08 | 35.81 | 1.68 | 268.67 | 56.87 |
| 2015 | 14.28 | 5.07 | 35.74 | 1.68 | 268.15 | 56.76 |
| 2020 | 14.24 | 5.05 | 35.64 | 1.67 | 267.43 | 56.61 |
Disclaimer/Publisher’s Note: The statements, opinions and data contained in all publications are solely those of the individual author(s) and contributor(s) and not of MDPI and/or the editor(s). MDPI and/or the editor(s) disclaim responsibility for any injury to people or property resulting from any ideas, methods, instructions or products referred to in the content. |
© 2025 by the authors. Licensee MDPI, Basel, Switzerland. This article is an open access article distributed under the terms and conditions of the Creative Commons Attribution (CC BY) license (https://creativecommons.org/licenses/by/4.0/).
Share and Cite
Zhang, Y.; Tang, J.; Hu, X.; Chen, C.; Luo, Z.; Li, Q.; Li, Q. Understanding the Spatiotemporal Patterns and Drivers of Carbon Stock in Central-Southern China’s Hilly Regions Through Land Use Change and Scenario Simulation. Sustainability 2025, 17, 5578. https://doi.org/10.3390/su17125578
Zhang Y, Tang J, Hu X, Chen C, Luo Z, Li Q, Li Q. Understanding the Spatiotemporal Patterns and Drivers of Carbon Stock in Central-Southern China’s Hilly Regions Through Land Use Change and Scenario Simulation. Sustainability. 2025; 17(12):5578. https://doi.org/10.3390/su17125578
Chicago/Turabian StyleZhang, Yali, Jia Tang, Xijun Hu, Cunyou Chen, Ziwei Luo, Qian Li, and Qizhen Li. 2025. "Understanding the Spatiotemporal Patterns and Drivers of Carbon Stock in Central-Southern China’s Hilly Regions Through Land Use Change and Scenario Simulation" Sustainability 17, no. 12: 5578. https://doi.org/10.3390/su17125578
APA StyleZhang, Y., Tang, J., Hu, X., Chen, C., Luo, Z., Li, Q., & Li, Q. (2025). Understanding the Spatiotemporal Patterns and Drivers of Carbon Stock in Central-Southern China’s Hilly Regions Through Land Use Change and Scenario Simulation. Sustainability, 17(12), 5578. https://doi.org/10.3390/su17125578