Article

Effects of Cover Crop Mixtures on Soil Health and Spring Oat Productivity

by
Aušra Marcinkevičienė
1,*,
Lina Marija Butkevičienė
1,
Lina Skinulienė
1 and
Aušra Rudinskienė
2
1
Department of Agroecosystems and Soil Sciences, Agriculture Academy, Vytautas Magnus University, K. Donelaičio Str. 58, LT-44248 Kaunas, Lithuania
2
Bioeconomy Research Institute, Agriculture Academy, Vytautas Magnus University, K. Donelaičio Str. 58, LT-44248 Kaunas, Lithuania
*
Author to whom correspondence should be addressed.
Sustainability 2025, 17(12), 5566; https://doi.org/10.3390/su17125566
Submission received: 10 May 2025 / Revised: 4 June 2025 / Accepted: 13 June 2025 / Published: 17 June 2025
(This article belongs to the Section Environmental Sustainability and Applications)

Abstract

:
Growing cover crop mixtures is a sustainable agriculture tool that helps to reduce fertilizer use and, at the same time, ensures lower environmental pollution. The aim of this research is to assess the biomass of the aboveground part of cover crop mixtures and the nutrients accumulated in it and to determine their influence on the soil properties and productivity of spring oats (Avena sativa L.). The biomass of the aboveground part of cover crop mixtures of different botanical compositions varied from 2.33 to 2.67 Mg ha−1. As the diversity of plant species in cover crop mixtures increased, the accumulation of nutrients in the aboveground part biomass increased, and the risk of nutrient leaching was reduced. The post-harvest cover crop mixture TGS GYVA 365, consisting of eight short-lived and two perennial plant species, significantly reduced the mineral nitrogen content in the soil in spring and had the strongest positive effect on organic carbon content. Post-harvest cover crop mixtures TGS GYVA 365 and TGS D STRUKT 1 did not affect the content of available potassium in the soil but significantly reduced the content of available phosphorus. All tested cover crop mixtures, including the undersown TGS BIOM 1 and the post-harvest mixtures TGS D STRUKT 1 and TGS GYVA 365, reduced soil shear strength and improved soil structure, although the reduction was not statistically significant for TGS D STRUKT 1. Cover crop mixtures left on the soil surface as mulch had a positive effect on the chlorophyll concentration in oat leaves, number of grains per panicle, and oat grain yield. A significant positive correlation was found between oat grain yield and several yield components, including crop density, plant height, number of grains per panicle, and grain mass per panicle. These findings highlight the potential of diverse cover crop mixtures to reduce fertilizer dependency and improve oat productivity under temperate climate conditions.

1. Introduction

Cover crops are becoming an important agricultural practice that may be crucial in strengthening sustainable agriculture and supporting ecosystem services. Cover crops provide many legitimate benefits to the agroecosystem, such as increasing biodiversity, reducing the spread of insects and nutrient leaching, and improving soil quality [1,2]. Studies have shown that cover crop mixtures have more advantages than monocrops: they produce more biomass and nutrients; are more effective at suppressing weeds; interrupt disease and pest cycles; stimulate soil biological processes; improve soil agrophysical, agrochemical and biological properties; increase yields of succeeding crops; and lead to greater production stability [3,4,5]. Different plant species form different root systems at different depths, which is beneficial for nutrient uptake from different soil layers. Mixtures of cover crops improve nutrient management by developing root systems that explore a greater soil volume, enabling more efficient nutrient uptake from different soil layers. Compared to a monocrop, cover crop mixtures can be advantageous in forming aboveground biomass due to their higher persistence and nutrient uptake under adverse autumnal conditions, such as lower temperatures, reduced daylight, and fluctuating soil moisture levels [6,7,8,9].
This advantage may be based on the stimulation of microorganism biomass through increased carbon supply to the rhizosphere [10] or the release of specific root exudates that stimulate beneficial microorganism taxa and quicken root growth in different plant species [11,12]. Cover crops increase the potential for carbon sequestration by providing plant cover [13,14] and improve the uptake of macro- and micronutrients available to plants from the soil [15,16]. Environmental conditions strongly affect the growth and nutrient uptake in the roots and aboveground part of individual cover crop species [17].
Research shows that cover crop mixtures significantly improve soil structure. They reduce mega-aggregates and promote macro-aggregate formation, which increases soil stability and the storage capacity of moisture and organic matter [18]. Blanco-Canqui et al. [19] found that mixtures of legumes and grasses reduce soil compaction and erosion. Ehrmann and Ritz [20] observed that a diverse root system in cover crops increases aeration, structural stability, and soil carbon storage, which not only reduces erosion but also supports efficient nutrient cycling and long-term soil health. Dong and Zeng [21] argue that cover crop mixtures are a viable alternative to conventional tillage and the use of pesticides in agricultural systems. Although cover crop mixtures offer numerous benefits for soil properties and ecosystem services, their success largely depends on appropriate seeding rates and species compatibility, as highlighted in several studies [18,19,20,21].
Oats (Avena sativa L.) are a globally cultivated cereal of the Poaceae family, and their use for human consumption has increased in recent decades due to acknowledged health benefits [22]. In 2024, about 110,500 ha of oats were grown in Lithuania, with an average grain yield of 2.19 Mg ha−1 [23]. This yield is below the EU average, suggesting there is room for improvement, particularly through sustainable practices such as the use of cover crops. In Lithuania, oats are valued for their adaptability to local conditions, relatively low input requirements, and role in crop rotations, especially on smaller farms. According to Løes et al. [24], cover crops grown for green manure can increase cereal grain yield by an average of 30%, making their integration into oat-based systems particularly promising for improving both productivity and sustainability. A wide range of spring and winter cover crops is recommended in Lithuania and other countries. However, according to the researcher’s assessment, only a few species of cover crops are used in practice, so the diversification of cover crops is insufficient. Little or no research has been carried out on the production of cover crop mixtures. The multifunctionality of all available cover crops is hardly exploited, and there is a lack of research on the effects of many of them on soil fertility and crop productivity. The potential for reducing fertilizer requirements has not been fully explored. In particular, there is a lack of long-term and field-scale studies evaluating how different combinations of cover crop species—especially legume and non-legume mixtures—affect the availability and retention of key nutrients such as nitrogen, phosphorus, and potassium. Moreover, the extent to which cover crops can reduce the need for synthetic fertilizers under different soil types, climatic conditions, and crop rotations remains insufficiently understood. Lithuania’s humid continental climate, characterized by cold winters and variable soil moisture, poses distinct challenges for the winter survival and establishment of cover crops, highlighting the need for region-specific studies on cover crop mixtures.
The aim of this research is to assess the aboveground biomass and nutrient content of cover crop mixtures and to determine their influence on soil properties and productivity of spring oats. We hypothesized that diverse cover crop mixtures would enhance soil fertility and oat productivity more than monocrops. To test these hypotheses, we evaluated three cover crop mixtures in oat rotation. These mixtures were selected to combine complementary functional plant groups aimed at enhancing soil fertility and crop productivity. The undersown mixture TGS BIOM 1 consists of legumes, such as Egyptian and Persian clover, which contribute to biological nitrogen fixation, together with Italian ryegrass that provides biomass stability and rapid soil coverage. The post-harvest mixture TGS D STRUKT 1 includes a diverse assemblage of grasses, legumes, brassicas, and other species intended to improve soil structure and nutrient cycling. The TGS GYVA 365 mixture combines legumes, grasses, and brassicas to optimize nutrient uptake, increase soil organic matter content, and support soil health during the winter period.

2. Materials and Methods

2.1. Experimental Site

The field experiment was carried out in 2023 and 2024 on the farm of Česlovas Tallat-Kelpša in Kaunas district, Vilkija eldership (55°04′09.0″ N latitude, 23°32′49.5″ E longitude). The farm is dominated by Luvisol and Cambisol soils [25]. The soil has the following agrochemical properties: a pH of 6.5 to 6.9, a mineral nitrogen of 6.88–9.71 mg kg−1, humus of 3.03–3.76% (very high). The available nutrients are as follows: P2O5 is 136.3–238.2 mg kg−1 (moderate to high), and K2O is 140.3–162.3 mg kg−1 (moderate) [26].

2.2. Experimental Design

The experiment comprised three cover crop mixture treatments, which differed in terms of their species composition and functional groups. The species included in each treatment and the composition used in the experimental design are summarized in Table 1.
In 2023, the cover crop mixture was sown in winter wheat (Triticum aestivum L.) ‘Skagen’ (Nordic Seed A/S, Ry, Denmark) on 24 April with a seed drill (Horsch Pronto, Jyvaskyla, Finland). The post-harvest intercrop mixtures of winter wheat were sown directly into the stubble on 15 August with the seed drill “Horsch Pronto” seeder. The cover crop mixtures were not fertilized additionally and left to grow until the following spring (Figure 1).
In spring 2024, the cover crop mixtures were left as mulch on the soil surface to conserve moisture and improve soil structure. The mixtures were terminated by spraying with glyphosate Rodeo FL at a rate of 2.5 L ha−1 on 22 April. Due to differences in species development, the cover crop mixtures were terminated at varying growth stages depending on the species composition. Glyphosate use complied with EU Regulation No 1107/2009, ensuring safe and regulated application.
On 2 May, oat seeds (Avena sativa L.) ‘Scorpion’ (Nordsaat Saatzucht GmbH, Pölchow, Germany) (190 kg ha−1) were sown at 12.5 cm row spacing. The oats were fertilized on the same day (2 May) with N15P15K15 complex fertilizer (200 kg ha−1) (EuroChem Agro GmbH, Mannheim, Germany). On 5 June, the crop was sprayed with the microelements manganese (1.0 L ha−1), zinc (1.0 L ha−1), and copper (0.7 L ha−1), as well as the herbicides Starane XL (FMC Agro Ltd., Cambridge, UK) (florasulam and fluroxypyr) (0.35 L ha−1) and Trimmer 50 SG (ADAMA Sweden, Malmö, Sweden) (tribenuron methyl) (0.02 kg ha−1).
On 3 July, the growth regulator Stabilan 750 SL (chlormequat chloride) (2.0 L ha−1) and the fungicides Innox (BASF Agricultural Solutions, Ludwigshafen, Germany) (prothioconazole) (0.3 L ha−1), Poleposition 300 EC (ADAMA Northern Europe B.V., Leusden, The Netherlands) (prothioconazole) (0.25 L ha−1), and Elatus Era (Syngenta UK Ltd., Cambridge, UK) (benzovindiflupyr and prothioconazole) (0.5 L ha−1) were applied. The oats were harvested on 16 August. The experiment was arranged as a randomised block design with four replicates, resulting in a total of 16 experimental plots. Treatments were randomly assigned within each block to minimise systematic bias. The blocks were separated from each other by strips in the field to reduce edge effects and minimise environmental interference between neighbouring plots. Each plot measured 5 × 20 m (100 m2), and a central assessment area measuring 4 × 18 m (72 m2) was used for data collection.

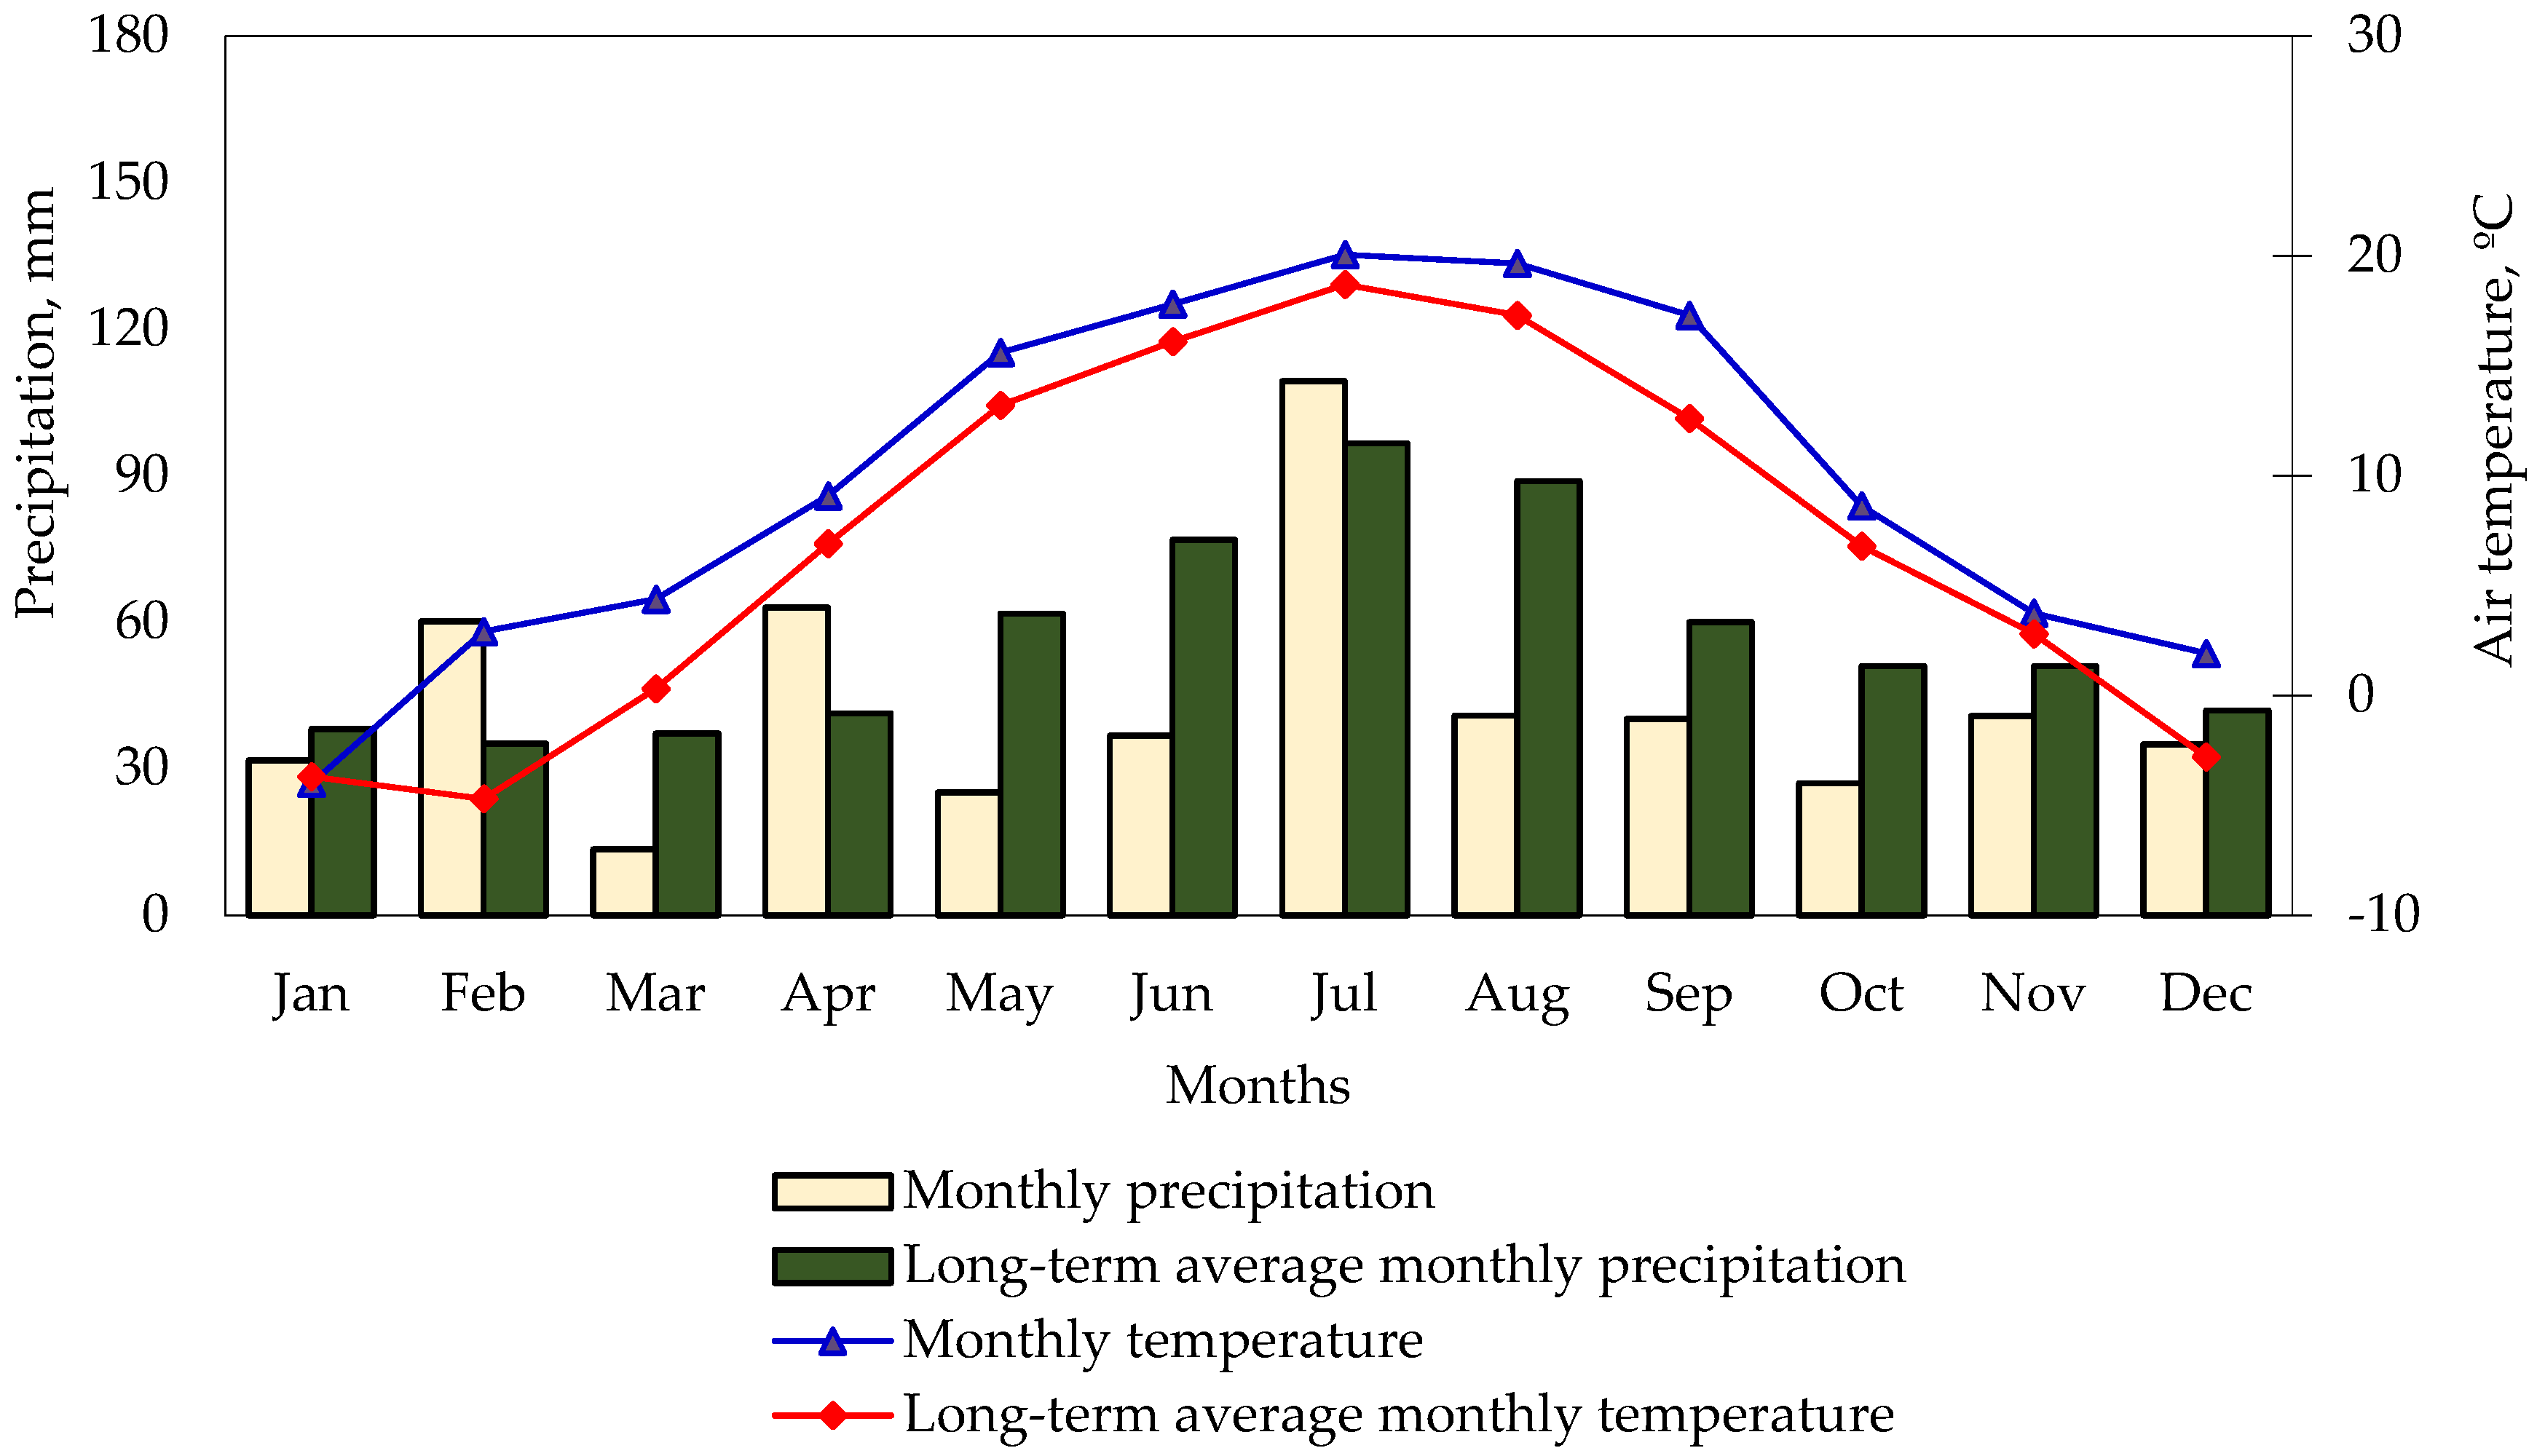
2.3. Meteorological Conditions

The Lithuanian climate zone has a humid continental climate (Köppen–Geiger code: Dfb) [27].
In 2024, January was colder, and February and March were warmer than the long-term average (Figure 2). Plant vegetation resumed in the third decade of March. Temperatures in April were 2.2 °C higher and precipitation—21.7 mm higher than the long-term average.
May and June were warm and dry. Temperatures in the latter months were 2.4 and 1.7 °C higher than the long-term average, and precipitation was 36.6 and 40.1 mm lower than the long-term average. July was 1.4 °C warmer and wetter than the long-term average. August had 48.0 mm less rainfall than normal, and temperatures were 2.4 °C above the long-term average. These meteorological conditions were generally favourable for oat growth, biomass accumulation, and nutrient uptake. The early resumption of vegetation in March and sufficient moisture in April supported root development and nutrient availability. Although May and June were warm and dry, conditions remained suitable for active growth. The wetter conditions in July further supported grain development, while the dry and warm conditions in August had a limited negative impact on the final yield.

2.4. Research Methods with Measurements and Determinations

Soil agrochemical properties were determined in 2024 at the resumption of plant vegetation in spring. For the analyses, soil samples were taken with a Nekrasov drill at 15 points in each experimental field, about 300 g from the 0–20 cm soil layer. The soil samples were assayed for (1) soil pHKCl, using the potentiometric method; (2) total nitrogen, using the Kjeldahl method; (3) available phosphorus (P2O5) and available potassium (K2O) in mg kg−1 soil, using the Egner–Rhim–Doming (A-L) method; and (4) organic carbon, using a Heraeus apparatus through combustion of the soil samples at 900 °C. The humus content was calculated by multiplying the organic carbon content by van Bemelen’s factor of 1.724. The analyses were carried out in the Agrochemical Research Laboratory of Vytautas Magnus University Agriculture Academy. Soil aggregate–size distribution was determined with a Retsch sieving apparatus (Retsch GmbH, Haan, Germany Retsch Lab Equipment) after the resumption of plant vegetation in spring. In each experimental field, a soil sample of about 300 g was taken with a shovel from at least 3 places in the 0–20 cm of the soil layer. A 200 g sample was taken and sieved for 2 min, with a sieving amplitude of 60%. The soil shear strength was determined with a Geonor 72,410 field hardness tester (Geonor AS, Østerås, Norway), measured at 10 points in each field at a depth of 8–10 cm.
The aboveground plant biomass of the cover crop mixtures was determined at the end of the vegetation period and at the resumption of vegetation in spring, while the oat plant biomass was measured at the flowering stage (BBCH 65), which corresponds to full flowering. In each experimental field, the plant biomass was cut and weighed in four randomly selected 0.25 m2 fields, two samples of about 20 g were taken and dried at 105 °C in a drying oven (LST ISO 751:2000) [28]. The biomass of the cover crop mixtures and the aboveground part of the oats were converted to absolute dry matter (DM) biomass Mg ha−1.
To determine the chemical composition of the aboveground part of the cover crop mixtures, samples (about 0.5 kg) were taken to assess their productivity and dried in a laboratory drying oven at 65 °C. The aboveground plant biomass was analyzed for (1) total nitrogen content (%) using the Kjeldahl method (Commission Regulation (EC) No 152/2009); (2) total phosphorus content (%) using the photometric method (dry combustion) (Commission Regulation (EC) No 152/2009); (3) total potassium content (%) by flame photometry (Commission Regulation (EC) No 152/2009); and (4) organic carbon content (%) using Heraeus apparatus, by dry-burning the samples at 900 °C (ISO 10694:1995) [29]. The studies were carried out in the Agrochemical Research Laboratory of Vytautas Magnus University Agriculture Academy.
The density of the oat crop (pcs. m−2) was determined before harvest by counting the number of productive stems along 1 m of row length, on both sides of a central inter-row space, at four locations in each field. Chlorophyll concentration (µmol m−2) in oat leaves was determined with a mobile meter “MC–100” (Apogee Instruments, Inc., Logan, UT USA), which measures chlorophyll based on light transmittance through the leaf at two wavelengths (653 and 931 nm). The device provides fast, reliable, and non-destructive chlorophyll estimation. Measurements were taken at four representative locations in each plot before harvest. Oat biometric and yield structure parameters were determined before harvest. In each experimental field, 30 productive stems of oats were cut. The biometric (height (cm) and yield structure parameters (number of grains per panicle (pcs.) and mass of grains per panicle (g)) were determined for each productive stem. The mass of 1000 oat grains (g) was determined with an Elmor precision seed calculator (Elmor Corporation AG, Schwyz, Switzerland). Oat grain yield was calculated at a standard moisture content of 14% and absolute clean grain (Mg ha−1).

2.5. Statistical Analysis

The significance of differences between the means of the treatments was assessed using the t-test [30] at the 95% probability level. Correlation and regression methods were used to assess relationships between traits. Statistical analysis was performed using the STATISTICA software, version 10.0 (StatSoft Inc., Tulsa, OK, USA). Standard errors of the means are indicated by whiskers.

3. Results

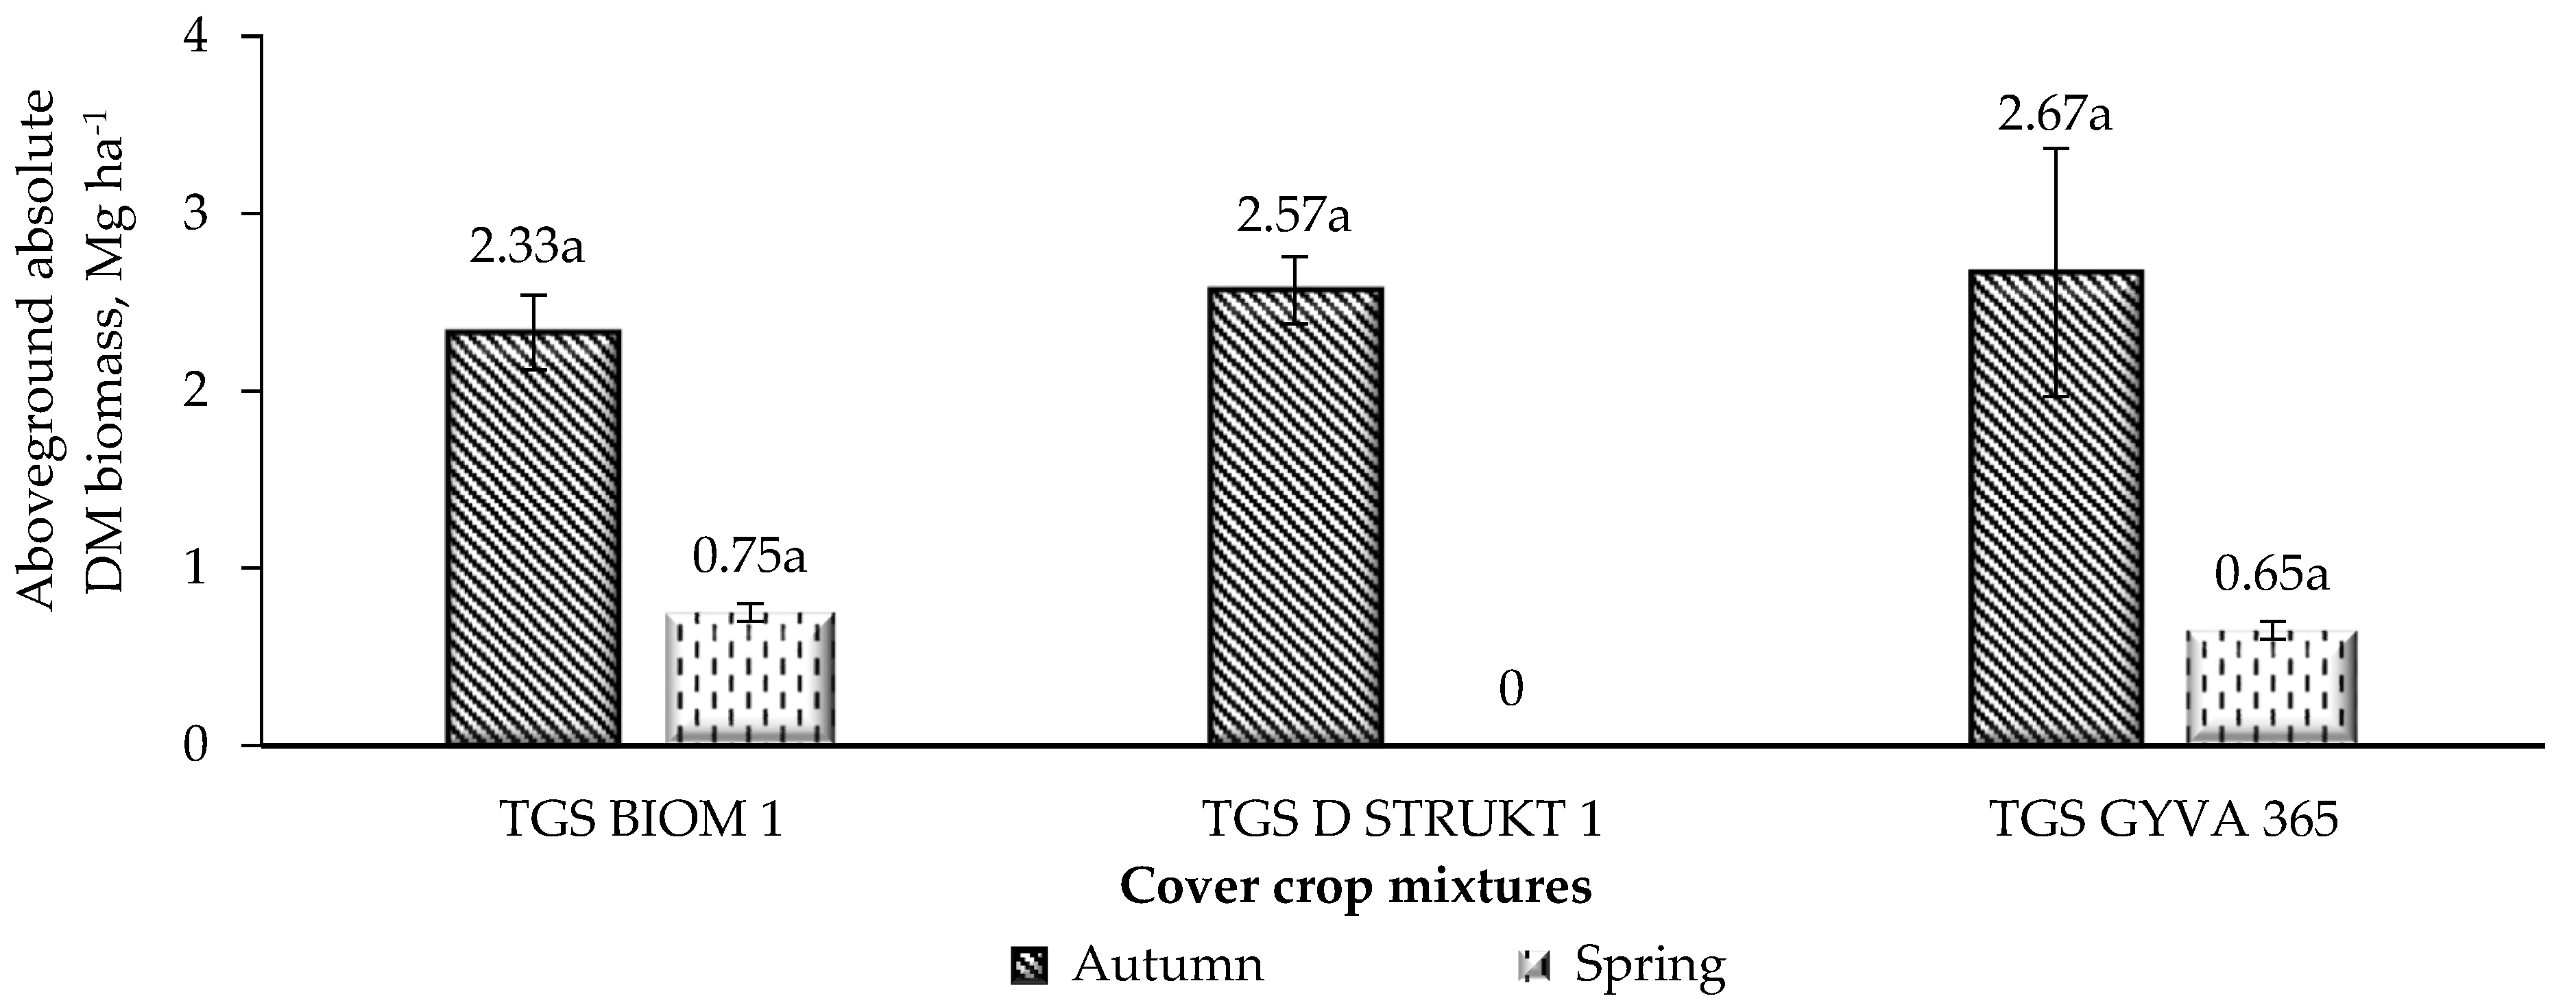
3.1. Productivity of Cover Crop Mixtures and Nutrients Accumulated in Their Aboveground Biomass

The studies showed that at the end of the vegetation period, the aboveground biomass of the cover crop mixtures with different botanical compositions varied from 2.33 to 2.67 Mg ha−1 (Figure 3). There was no significant difference in aboveground biomass between the undersown and all post-harvest cover crop mixtures (p > 0.05).
In 2023–2024, Italian ryegrass in the undersown cover crop mixture TGS BIOM 1 accumulated 0.75 Mg ha−1 of overwintering aboveground biomass, whereas red clover and perennial ryegrass in the post-harvest mixture TGS GYVA 365 accumulated 0.65 Mg ha−1. Cover crop mixtures accumulated 76.8 to 103.4 kg ha−1 nitrogen, 8.06 to 13.3 kg ha−1 phosphorus, 88.4 to 102.3 kg ha−1 potassium, and 758.2 to 782.0 kg ha−1 organic carbon in the aboveground biomass (Table 2).
The post-harvest cover crop mixture TGS GYVA 365, consisting of eight short-lived and two perennial species, accumulated significantly more (34.6%) total nitrogen than the cover crop TGS BIOM 1 (p < 0.05). The post-harvest cover crop mixtures accumulated significantly more total phosphorus in the aboveground biomass than the undersown TGS BIOM 1, 65.0% and 51.4% respectively (p < 0.05). Both post-harvest cover crop mixtures accumulated more total potassium and organic carbon in the aboveground biomass than the undersown cover crop, but no significant differences were found (p > 0.05). The post-harvest cover crop mixture TGS GYVA 365 accumulated more total nitrogen, potassium, and organic carbon than the post-harvest TGS D STRUKT 1, but no significant differences were found (p > 0.05).

3.2. Soil Agrochemical Properties

In the fields where the post-harvest cover crop mixture consisting of eight short-lived and two perennial plant species was grown, the content of mineral nitrogen in the soil was found to be significantly lower, from 19.2% to 29.1%, than in the fields without cover crops and in the fields where other cover crop mixtures consisting of short-lived plant species were grown (p < 0.05) (Table 3). The spring-emerging red clover and perennial ryegrass used the mineral nitrogen in the soil.
In fields without cover crops and in fields where the undersown cover crop mixture TGS BIOM 1 was grown, the content of available phosphorus in the soil was significantly higher than in fields where the post-harvest cover crop mixtures were grown, rising from 55.1% to 70.7% and from 58.8% to 74.8%, respectively (p < 0.05). Cover crop mixtures did not significantly affect the content of available potassium in the soil. The content of organic carbon in the soil was increased the most, compared to fields without cover crops, by the undersown cover crop mixture TGS BIOM 1 and the post-harvest cover crop mixture TGS GYVA 365, but no significant differences were found (p > 0.05). When growing the post-harvest mixture TGS D STRUKT 1, the organic carbon content in the soil was determined to be significantly (18.5 and 19.3%) lower than when growing the mixtures TGS BIOM 1 and TGS GYVA 365 (p < 0.05).

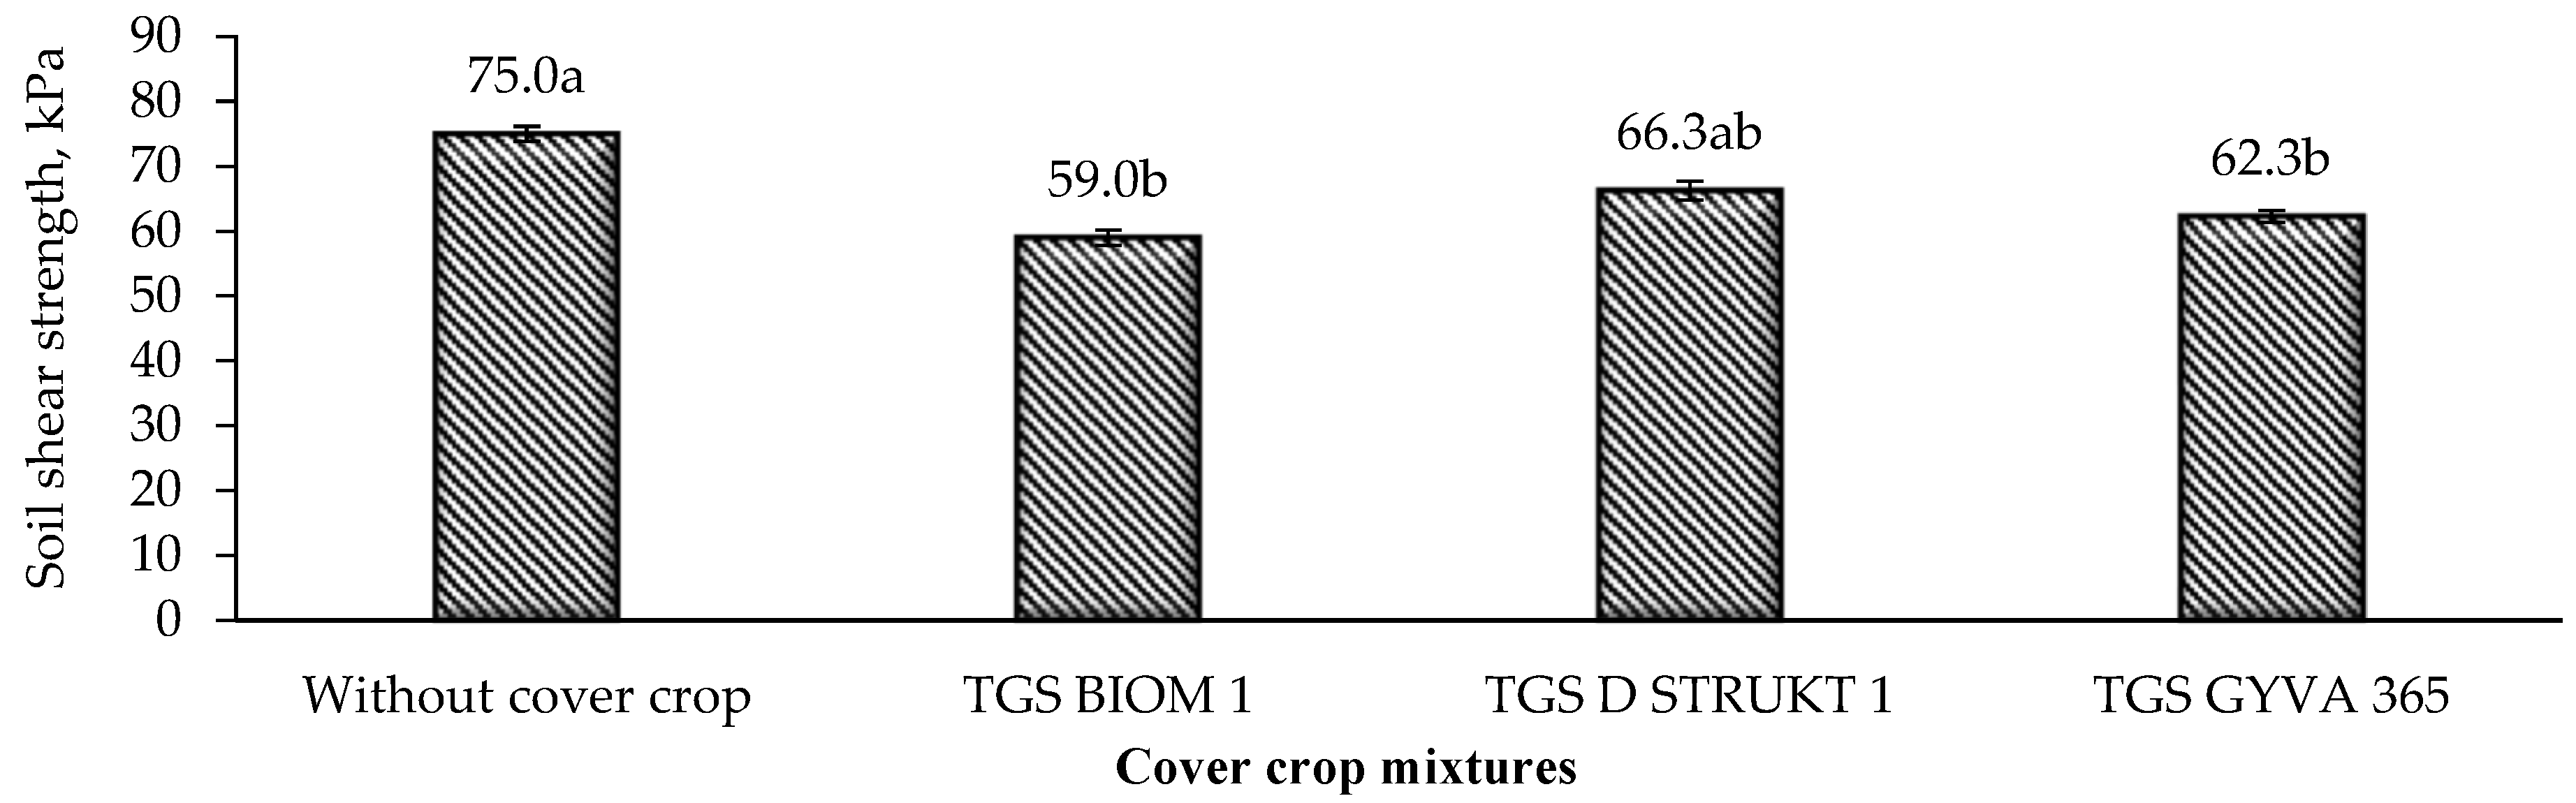
3.3. Soil Agrophysical Properties

The largest proportion was made up of macro-aggregates, from 40.9% to 64.3% (Table 4). In the fields where the undersown cover crop mixture was grown, a trend of decreasing mega-aggregates and increasing macro-aggregates was observed, compared to the fields without cover crops, but no significant differences were found (p > 0.05). The amount of micro-aggregates in different cover crop mixtures did not differ significantly (p > 0.05).
When growing cover crop mixtures, soil shear strength was found to be significantly lower (p < 0.05) by 16.9 to 21.3% compared to fields without cover crops, except for the mixture TGS D STRUKT 1 (Figure 4).

3.4. Productivity of Spring Oats

When oats were grown after cover crop mixtures, the chlorophyll concentration in the leaves was significantly higher—ranging from 1.7 to 2.1 times—compared to oats grown in fields without cover crops (p < 0.05) (Table 5). The aboveground biomass of oats at the flowering stage was found to be significantly 34.6% higher, compared to fields without cover crops, when growing them after the post-harvest cover crop mixture TGS D STRUKT 1, consisting of nine short-lived plant species (p < 0.05). The other tested cover crop mixtures did not have a significant effect on the aboveground biomass of oats.
When growing oats after cover crop mixtures, a trend of increasing crop density was observed, but no significant differences were found (p > 0.05).
Cover crop mixtures, compared to fields without cover crops, tended to increase oat height, mass of grains per panicle, and mass of 1000 grains, but no significant differences were found (p > 0.05) (Table 6).
The average number of grains per panicle (24.4% and 32.4%) and grain yield (54.3% and 56.3%) of oats were significantly increased by the undersown TGS BIOM 1 and post-harvest TGS D STRUKT 1 cover crop mixtures, compared to fields without cover crops (p < 0.05). Oat grain yield depended on crop density (r = 0.95, y = −6.48 + 0.02x, p < 0.05), plant height (r = 0.98, y = −5394 + 0.14x, p < 0.05), number of grains per panicle (r = 0.96, y = −1.96 + 0.24x, p < 0.05), and mass of grains per panicle (r = 0.99, y = −2.60 + 7.55x, p < 0.01).

4. Discussion

Cover crop mixtures play an important role in improving soil properties and enhancing subsequent crop productivity, making their selection and management a critical factor in sustainable agricultural systems. The results of our research showed that at the end of the vegetation period, the aboveground biomass of cover crop mixtures with different botanical compositions changed slightly by 14.6% and did not differ significantly (Figure 3). The aboveground biomass of cover crops was influenced by the wintering conditions in 2023 and 2024; the aboveground biomass of the Italian ryegrass crop was higher compared to the aboveground biomass of overwintered red clover and perennial ryegrass. Heuermann et al. [17] found that environmental conditions have a greater influence on the formation of the aboveground biomass of a single species of cover crop compared to the cultivation of cover crop mixtures. They found that the total aboveground biomass of cover crop mixtures (S. alba, P. tanacetifolia, A. strigosa) was affected by growing conditions in a similar way to that of a monocrop of T. alexandrinum, but the biomass in the mixtures differed only by a factor of about 3, which was much less than in monocrops, where the difference ranged from 6 to 24. Various studies show a positive relationship between species diversity and total biomass production [31]. Cover crop mixtures are more resilient to unfavorable environmental conditions (such as drought, heatwaves, and cold spells) and tend to produce a more stable aboveground biomass yield. This stability is particularly important in variable climates, as it ensures more reliable nutrient capture and soil protection from season to season. In contrast, monocrops may show greater fluctuations in biomass production, which can reduce their effectiveness in nutrient management and erosion control. Therefore, cover crop mixtures could be more effective in improving nutrient cycling efficiency than their single species. The reason is that different species occupy complementary environmental niches (above and below ground), thus improving the use of all available resources [32]. However, the performance of species mixtures depends heavily on nutrient availability, growing conditions, and species selection (root architecture, persistence, nitrogen fixation capacity, etc.) [33]. Different plant species interact at different levels. These interactions can be complementary, facilitative, or competitive. Complementary species do not affect each other because they occupy different ecological niches [34]. Thus, complementarity can lead to more efficient resource use compared to monocrops.
In crop rotations, winter cover crops are grown to bind soil nutrients during the winter, which are then absorbed by the main crops being grown [35]. Liu et al. [36] indicate that the suitability of cover crops to reduce nutrient leaching and increase nutrient availability for the subsequent crop is determined by agrotechnical and climatic factors during their cultivation. Of particular importance is the binding of nitrate nitrogen, which tends to leach into deeper soil layers [17]. Sieling [35] states that cover crops can reduce nitrogen leaching by up to 100 kg ha−1, depending on the species, cover crop cultivation methods, and geographical location. Mixtures of legume and non-legume cover crops are often studied, considering nitrogen use [37]. Growing cover crop mixtures is expected to result in more efficient nutrient fixation due to compensatory effects between the constituent cover crop species [16]. Selzer and Schubert [38] found that growing a single cover crop (P. tanacetifolia Benth.) can be as effective in reducing the risk of nutrient leaching as growing cover crop mixtures, but this is highly dependent on the moisture regime and nutritional conditions in the soil. Phacelias have a high potential to store nitrogen, phosphorus, and potassium for the subsequent crop, but a low C:N ratio, and a cold-sensitive crop can promote nutrient leaching in winter. A mixture of seven different cover crops accumulated nutrients similarly, and their nutrient uptake was closely related to root length and root area. In our experiment, the post-harvest cover crop mixture TGS GYVA 365, consisting of eight short-lived and two perennial plant species, accumulated total nitrogen by 34.6% more than the undersown TGS BIOM 1 cover crop, which contains only those plant species (Table 2). Scientific studies have shown that the cultivation of cover crops reduces phosphorus losses. Plants can reduce phosphorus losses by taking it from the soil and accumulating it in their phytomass during leaching periods [36]. The post-harvest cover crop mixtures TGS GYVA 365 and TGS D STRUKT 1 accumulated significantly higher total phosphorus in the aboveground mass than the undersown TGS BIOM 1, 65.0% and 51.4%, respectively. Heuermann et al. [17] argue that phosphorus accumulation in crops of different cover crop species depended on the plant species. The most efficient phosphorus accumulation in aboveground biomass was observed in P. tanacetifolia, followed by A. strigosa, S. alba, and T. alexandrinum. Selzer and Schubert [38] indicate that phacelia and sunflower accumulate more potassium in the aboveground part than other cover crops. Our research data showed that post-harvest cover crop mixtures accumulated more total potassium and organic carbon in the aboveground mass than the undersown cover crop, but no significant differences were found.
It has been found that the total nitrogen and organic carbon contents in the soil are higher when cover crop mixtures are grown compared to monocrops [39]. Cover crop residues can increase the accumulation of soil organic carbon and nitrogen, as well as increase the availability of phosphorus and potassium in some soil types under certain climatic conditions [18]. High variability in nitrogen accumulation may reflect patchy winter survival, which could influence the consistency of these effects across treatments. Khan et al. [40] indicate that cover crop mixture residues had a small effect on the concentration of phosphorus and potassium in the soil but significantly increased the content of organic matter. According to our research data, the post-harvest cover crop mixture TGS GYVA 365, consisting of eight short-lived and two perennial plant species, significantly reduced the mineral nitrogen content in the soil in spring by 19.2% to 29.1%, compared to the cultivation of other cover crop mixtures and fields without cover crops (Table 3). The red clover and perennial ryegrass that re-emerged in spring likely used the mineral nitrogen in the soil. The latter cover crop mixture increased the organic carbon content in the soil the most, compared to the other tested measures. Post-harvest cover crop mixtures, compared to fields without cover crops and the undersown cover crop mixture TGS BIOM 1, did not significantly affect the content of available potassium in the soil but significantly reduced the content of available phosphorus from 35.5% to 42.8%.
According to Kaudahe [18], cover crops reduced soil density, improved soil structure and hydraulic properties, and increased water retention. According to our findings, the amount of macro-aggregates in the 0–20 cm soil layer was increased most by the undersown cover crop mixture TGS BIOM 1 (Table 4). This was related to the fact that Italian ryegrass formed a more abundant root system in the aforementioned soil layer. All cover crop mixtures, compared to fields without cover crops, reduced soil shear strength by 11.6% to 21.3% (Figure 4). Our results suggest that improved soil aggregation and reduced shear strength under cover crop mixtures may enhance water infiltration, reduce erosion risk, and improve overall soil resilience.
Studies have shown that the cultivation of cover crops has a positive effect on the crops grown after them, when applying both conventional and sustainable tillage [41]. Based on the data of Kebede et al. [42], the yield of spring oat grains depended on the species selected for cultivation, fertilization, and the meteorological conditions of the year. Our results showed that the cover crop mixtures left on the soil surface as mulch did not significantly affect the density, height, mass of grains per panicle, or the mass of 1000 grains of the oat crop, and they significantly increased the chlorophyll concentration in the leaves from 1.7 to 2.1 (Table 5 and Table 6). The higher chlorophyll content in oat leaves observed in treatments with cover crop mixtures was associated with improved plant growth conditions and positively correlated with crop density, plant height, number of grains per panicle, and ultimately, grain yield. The number of oat grains per panicle (24.4% and 32.4%) and grain yield (54.3% and 56.3%) were significantly increased by the undersown cover crop mixture TGS BIOM 1 and the post-harvest cover crop mixture TGS D STRUKT 1, consisting of nine short-lived plant species. The positive effects of TGS BIOM 1 may be attributed to the combination of Italian ryegrass (L. multiflorum L.), which forms a dense fibrous root system that improves soil structure, and leguminous species like Egyptian clover (T. alexandrinum L.) and Persian clover (T. resupinatum L.), which contribute to nitrogen fixation. Similarly, TGS D STRUKT 1 included a diverse mixture of species such as legumes (Egyptian clover, Persian clover, serradella), deep-rooted crops (tillage radish and sunflower), and fast-growing species (buckwheat, flax, phacelia) that may have improved nutrient cycling, enhanced soil aeration, and increased the availability of nitrogen and other essential elements for the subsequent oat crop. Güngör et al. [43] indicate that oat grain yield was positively correlated with panicle length, number of grains per panicle, and mass of grains per panicle. Zorovski [44] states that oat grain yield is most influenced by crop structure elements (panicle productivity).
These findings emphasise the wider agronomic importance of choosing diverse cover crop blends, not only because of their direct impact on soil’s physical and chemical properties, but also because they enhance the productivity of subsequent crops, such as oats. Well-designed mixtures improve nutrient retention, soil structure and plant physiological responses (e.g., chlorophyll content), thereby contributing to more sustainable and resilient cropping systems. The observed benefits imply that the targeted use of specific species combinations could optimise nutrient cycling and reduce environmental losses, particularly in regions with similar climatic conditions. Although this study did not include an economic evaluation, it is important to note that the observed increases in oat grain yield may partly compensate for the costs of cover crop establishment. Future research should address the cost-effectiveness of different cover crop strategies under varying environmental and market conditions.

5. Conclusions

This study demonstrated that different cover crop mixtures significantly influence soil properties and the productivity of spring oats. Aboveground biomass ranged from 2.33 to 2.67 Mg ha−1, with nutrient accumulation increasing alongside plant species diversity. Certain post-harvest mixtures reduced spring mineral nitrogen by up to 29.1% while enhancing soil organic carbon, suggesting improved nutrient retention. Though some mixtures reduced available phosphorus, all cover crops improved soil structure by increasing macro-aggregates and reducing shear strength. Oats grown after cover crops showed higher chlorophyll content and significant yield improvements—up to 56.3%—which are linked to better crop density and panicle parameters. These findings highlight the potential of strategically selected cover crop mixtures to improve soil health, reduce reliance on synthetic inputs, and support sustainable crop production. In the context of climate change and growing pressure on agroecosystems, cover crops offer a multifunctional solution for maintaining productivity and enhancing long-term soil functionality. However, the present results are based on a single growing season and specific regional conditions, which may not fully reflect the variability associated with different soils or interannual climatic fluctuations. Therefore, future research should prioritise long-term, multi-location studies to validate the consistency and applicability of cover crop benefits across diverse agroecological environments. Farmers operating in similar agroclimatic conditions may benefit from using tailored cover crop mixtures depending on crop rotation and available sowing windows. Undersown legume–grass mixtures such as TGS BIOM 1 were particularly effective in improving soil structure and enhancing oat yield, while post-harvest mixtures (e.g., TGS D STRUKT 1 and TGS GYVA 365) contributed to nitrogen retention, organic carbon accumulation, and reduced soil compaction. Selecting the appropriate mixture based on seasonal timing and desired soil improvement goals can increase the overall effectiveness of cover cropping strategies. The use of cover crop mixtures supports key Sustainable Development Goals (SDGs), including sustainable agriculture (SDG 2), climate action (SDG 13), and land and soil health (SDG 15).

Author Contributions

Conceptualization, methodology, software, validation, investigation, data curation, writing—original draft preparation, writing—review and editing, supervision, funding acquisition, A.M., L.M.B. and L.S.; visualization, project administration, A.R. All authors have read and agreed to the published version of the manuscript.

Funding

This research was funded by the EIP project “Diversification of cover crops and use of multifunctional properties to increase soil sustainability and carbon sequestration potential for reduction of fertilizer requirements” (No. JVS/2020/042).

Institutional Review Board Statement

Not applicable.

Informed Consent Statement

Not applicable.

Data Availability Statement

Data is contained within the article.

Conflicts of Interest

The authors declare no conflicts of interest.

References

  1. Baraibar, B.; Hunter, M.C.; Schipanski, M.E.; Hamilton, A.; Mortensen, D.A. Weed suppression in cover crop monocultures and mixtures. Weed Sci. 2018, 66, 121–133. [Google Scholar] [CrossRef]
  2. Lavergne, S.; Vanasse, A.; Thivierge, M.N.; Halde, C. Using fall-seeded cover crop mixtures to enhance agroecosystem services: A review. Agrosyst. Geosci. Environ. 2021, 4, e20161. [Google Scholar] [CrossRef]
  3. Schipanski, M.E.; Barbercheck, M.; Douglas, M.R.; Finney, D.M.; Haider, K.; Kaye, J.P.; Kemanian, A.R.; Mortensen, D.A.; Ryan, M.R.; Tooker, J.; et al. A framework for evaluating ecosystem services provided by cover crops in agroecosystems. Agric. Syst. 2014, 125, 12–22. [Google Scholar] [CrossRef]
  4. Groff, S. The past, present, and future of the cover crop industry. J. Soil Water Conserv. 2015, 70, 130–133. [Google Scholar] [CrossRef]
  5. Moreno-Cadena, P.; Salmeron, M.; Canisares, L.P.; Poffenbarger, H.J. Productivity benefits of cereal-legume cover crop mixtures under variable soil nitrogen and termination times. Eur. J. Agron. 2024, 155, 127114. [Google Scholar] [CrossRef]
  6. Wortman, S.E.; Francis, C.A.; Lindquist, J.L. Cover Crop Mixtures for the Western Corn Belt: Opportunities for Increased Productivity and Stability. J. Agron. 2012, 104, 699–705. [Google Scholar] [CrossRef]
  7. Kramberger, B.; Gselman, A.; Podvršnik, M.; Kristl, J.; Lešnik, M. Environmental advantages of binary mixtures of Trifolium incarnatum and Lolium multiflorum over individual pure stands. Plant Soil Environ. 2013, 59, 22–28. [Google Scholar] [CrossRef]
  8. Elhakeem, A.; van der Werf, W.; Ajal, J.; Lucà, D.; Claus, S.; Vico, R.A.; Bastiaans, L. Cover crop mixtures result in a positive net biodiversity effect irrespective of seeding configuration. Agric. Ecosyst. Environ. 2019, 285, 106627. [Google Scholar] [CrossRef]
  9. Khan, Q.A.; McVay, K.A. Productivity and stability of multi-species cover crop mixtures in the northern great plains. Agron. J. 2019, 111, 1817–1827. [Google Scholar] [CrossRef]
  10. Gentsch, N.; Boy, J.; Batalla, J.D.K.; Heuermann, D.; von Wirén, N.; Schweneker, D.; Feuerstein, U.; Groß, J.; Bauer, B.; Reinhold-Hurek, B.; et al. Catch crop diversity increases rhizosphere carbon input and soil microbial biomass. Biol. Fertil. Soils 2020, 56, 943–957. [Google Scholar] [CrossRef]
  11. Mommer, L.; Van Ruijven, J.; De Caluwe, H.; Smit-Tiekstra, A.E.; Wagemaker, C.A.M.; Joop Ouborg, N.; Bögemann, G.M.; Van Der Weerden, G.M.; Berendse, F.; De Kroon, H. Unveiling below-ground species abundance in a biodiversity experiment: A test of vertical niche differentiation among grassland species. J. Ecol. 2010, 98, 1117–1127. [Google Scholar] [CrossRef]
  12. Yu, P.; He, X.; Baer, M.; Beirinckx, S.; Tian, T.; Moya, Y.A.T.; Zhang, X.; Deichmann, M.; Frey, F.P.; Bresgen, V.; et al. Plant flavones enrich rhizosphere Oxalobacteraceae to improve maize performance under nitrogen deprivation. Nat. Plants 2021, 7, 481–499. [Google Scholar] [CrossRef]
  13. Bavec, M.; Narodoslawsky, M.; Bavec, F.; Turinek, M. Ecological impact of wheat and spelt production under industrial and alternative farming systems. Renew. Agric. Food Syst. 2011, 27, 242–250. [Google Scholar] [CrossRef]
  14. Kwiatkowski, C.A.; Harasim, E.; Pawłowski, L. Can catch crops be an important factor in carbon dioxide sequestration? Int. J. Conserv. Sci. 2020, 11, 1005–1018. [Google Scholar]
  15. Harasim, E.; Antonkiewicz, J.; Kwiatkowski, C.A. The effects of catch crops and tillage systems on selected physical properties and enzymatic activity of loess soil in a spring wheat monoculture. Agronomy 2020, 10, 334. [Google Scholar] [CrossRef]
  16. Kwiatkowski, C.A.; Harasim, E.; Staniak, M. Effect of catch crops and tillage systems on some chemical properties of loess soil in a short-term monoculture of spring wheat. J. Elem. 2020, 25, 35–43. [Google Scholar]
  17. Heuermann, D.; Gentsch, N.; Guggenberger, G.; Reinhold-Hurek, B.; Schweneker, D.; Feuerstein, U.; Heuermann, M.C.; Groß, J.; Kümmerer, R.; Bauer, B.; et al. Catch crop mixtures have higher potential for nutrient carry-over than pure stands under changing environments. Eur. J. Agron. 2022, 136, 126504. [Google Scholar] [CrossRef]
  18. Koudahe, K.; Allen, S.C.; Djaman, K. Critical review of the impact of cover crops on soil properties. Int. Soil Water Conserv. Res. 2022, 10, 343–354. [Google Scholar] [CrossRef]
  19. Blanco-Canqui, H.; Shaver, T.M.; Lindquist, J.L.; Shapiro, C.A.; Elmore, R.W.; Francis, C.A.; Hergert, G.W. Cover crops and ecosystem services: Insights from studies in temperate soils. J. Agron. 2015, 107, 2449–2474. [Google Scholar] [CrossRef]
  20. Ehrmann, J.; Ritz, K. Plant: Soil interactions in temperate multi-cropping production systems. Plant Soil 2013, 366, 503–523. [Google Scholar] [CrossRef]
  21. Dong, F.; Zeng, W. Effects of fall and winter cover crops on weed suppression in the United States: A Meta-analysis. Sustainability 2024, 16, 3192. [Google Scholar] [CrossRef]
  22. Ma, B.L.; Zheng, Z.M.; Pageau, D.; Vera, C.; Fregeau-Reid, J.; Xue, A.; Yan, W. Nitrogen and phosphorus uptake, yield and agronomic traits of oat cultivars as affected by fertilizer N rates under diverse environments. Nutr. Cycl. Agroecosyst. 2017, 108, 245–265. [Google Scholar] [CrossRef]
  23. Official Statistics Portal. 2024. Available online: https://osp.stat.gov.lt/statistiniu-rodikliu-analize?hash=1c60de45-f3c7-4cb1-95db-4b5e4ca4d976#/ (accessed on 2 June 2025).
  24. Løes, A.K.; Henriksen, T.M.; Eltun, R.; Sjursen, H. Repeated use of green-manure catch crops in organic cereal production—grain yields and nitrogen supply. Acta Agric. Scand.–B Soil Plant Sci. 2011, 61, 164–175. [Google Scholar] [CrossRef]
  25. IUSS Working Group WRB. World Reference Base for Soil Resources. In International Soil Classification System for Naming Soils and Creating Legends for Soil Maps, 4th ed.; International Union of Soil Sciences (IUSS): Vienna, Austria, 2022. [Google Scholar]
  26. Staugaitis, G.; Vaišvila, Z.J. Soil Agrochemical Research. In Scientific-Methodical Material; The Lithuanian Research Centre for Agriculture and Forestry Agrochemical Research Laboratory: Kėdainiai District, Lithuanian, 2019; p. 112. [Google Scholar]
  27. Peel, M.C.; Finlayson, B.L.; McMahon, T.A. Updated world map of the Köppen-Geiger climate classification. Hydrol. Earth Syst. Sci. 2007, 11, 1633–1644. [Google Scholar] [CrossRef]
  28. LST ISO 751:2000; Fruit and Vegetable Products—Determination of Water-Insoluble Solids. Lithuanian Standards Board: Vilnius, Lithuania, 2000.
  29. ISO 10694:1995; Soil Quality—Determination of Organic and Total Carbon After Dry Combustion (Elementary Analysis). International Organization for Standardization: Geneva, Switzerland, 1995.
  30. Raudonius, S. Application of statistics in plant and crop research: Important issues. Zemdirb. Agric. 2017, 104, 377–382. [Google Scholar] [CrossRef]
  31. Finney, D.M.; White, C.M.; Kaye, J.P. Biomass production and carbon/nitrogen ratio influence ecosystem services from cover crop mixtures. Agron. J. 2016, 108, 39–52. [Google Scholar] [CrossRef]
  32. Hooper, D.U.; Chapin, F.S., III; Ewel, J.J.; Hector, A.; Inchausti, P.; Lavorel, S.; Lawton, J.H.; Lodge, D.M.; Loreau, M.; Naeem, S.; et al. Effects of biodiversity on ecosystem functioning: A consensus of current knowledge. Ecol. Monogr. 2005, 75, 3–35. [Google Scholar] [CrossRef]
  33. Baraibar, B.; Murrell, E.G.; Bradley, B.A.; Barbercheck, M.E.; Mortensen, D.A.; Kaye, J.P.; White, C.M. Cover crop mixture expression is influenced by nitrogen availability and growing degree days. PLoS ONE 2020, 15, e0235868. [Google Scholar] [CrossRef]
  34. Heuermann, D.; Gentsch, N.; Boy, J.; Schweneker, D.; Feuerstein, U.; Groß, J.; Bauer, B.; Guggenberger, G.; von Wirén, N. Interspecific competition among catch crops modifies vertical root biomass distribution and nitrate scavenging in soils. Sci. Rep. 2019, 9, 11531. [Google Scholar] [CrossRef]
  35. Sieling, K. Improved N transfer by growing catch crops-a challenge. J. Cultiv. Plants 2019, 71, 145–160. [Google Scholar]
  36. Liu, J.; Ulén, B.; Bergkvist, G.; Aronsson, H. Freezing–thawing effects on phosphorus leaching from catch crops. Nutr. Cycl. Agroecosyst. 2014, 99, 17–30. [Google Scholar] [CrossRef]
  37. Wendling, M.; Büchi, L.; Amossé, C.; Sinaj, S.; Walter, A.; Charles, R. Influence of root and leaf traits on the uptake of nutrients in cover crops. Plant Soil 2016, 409, 419–434. [Google Scholar] [CrossRef]
  38. Selzer, T.; Schubert, S. Nutrient uptake of catch crops under non-limiting growth conditions. J. Plant Nutr. Soil Sci. 2021, 184, 709–722. [Google Scholar] [CrossRef]
  39. Nakajima, T.; Nakamura, R.; Kawamura, R.; Mihara, M. Cover crop mixtures effects on soil physical and chemical properties in Japan. Int. J. Environ. Rural Dev. 2020, 11, 182–186. [Google Scholar]
  40. Khan, R.; Farooque, A.A.; Brown, H.C.P.; Zaman, Q.U.; Acharya, B.; Abbas, F.; McKenzie-Gopsill, A. The role of cover crop types and residue incorporation in improving soil chemical properties. Agronomy 2021, 11, 2091. [Google Scholar] [CrossRef]
  41. Wittwer, R.A.; Dorn, B.; Jossi, W.; van der Heijden, M.G.A. Cover crops support ecological intensification of arable cropping systems. Sci. Rep. 2017, 7, 41911. [Google Scholar] [CrossRef]
  42. Kebede, G.; Worku, W.; Jifar, H.; Feyissa, F. Effects of fertilizer levels and varieties on fodder yield productivity, nutrient use efficiency, and profitability of oat (Avena sativa L.) in the central highlands of Ethiopia. J. Agric. Food Res. 2024, 16, 101161. [Google Scholar] [CrossRef]
  43. Güngör, H.; Çakir, M.F.; Kantar, B.H.; Gedіk, B.; Dumlupinar, Z. Evaluation of some oat cultivars for grain yield, yield components and quality traits in Düzce ecological conditions. J. Agric. Sci. 2023, 7, 718–729. [Google Scholar]
  44. Zorovski, P. Development, productivity and quality of naked oat grain after treatment with biofertilizers in the conditions of organic agriculture. Sci. Pap. Ser. A Agron. 2021, 64, 758–765. [Google Scholar]
Figure 1. General view of field experiment. Coordinates: 55°04′09.0″ N latitude, 23°32′49.5″ E longitude.
Sustainability 17 05566 g001
Figure 2. Meteorological conditions in 2024 in Kaunas district, Vilkija eldership (55°04′09.0″ N latitude, 23°32′49.5″ E longitude) according to Kaunas Weather Station.
Sustainability 17 05566 g002
Figure 3. Effect of different cover crop mixtures on aboveground dry biomass in 2023–2024. No significant differences were found (p > 0.05); error bars indicate the standard error, n = 4.
Sustainability 17 05566 g003
Figure 4. Effect of different cover crop mixtures on soil shear strength in 2024. Different letters indicate significant differences between the treatments (p < 0.05); data represent mean ± standard error, n = 4. In the fields where different cover crop mixtures were grown, soil shear strength did not differ significantly (p > 0.05).
Sustainability 17 05566 g004
Table 1. Experimental treatments of cover crop mixtures.
TreatmentCover Crop
Mixture Name
Species CompositionPlant
Family
Seeding Rate (kg ha−1)Sowing Time
1.Without cover crops
2.TGS BIOM 1Italian ryegrass (70%),Poaceae45Undersown
Egyptian clover (15%),Fabaceae
Persian clover (15%)Fabaceae
3.TGS D STRUKT 1Black oat (20%)Poaceae45Post-harvest
Buckwheat (15%)Polygonaceae
Flax (15%)Linaceae
Egyptian clover (15%)Fabaceae
Tillage radish (10%)Brassicaceae
Sunflower (10%)Asteraceae
Persian clover (5%)Fabaceae
Lacy phacelia (5%)Boraginaceae
Serradella (5%)Fabaceae
4.TGS GYVA 365Red clover (25%)Fabaceae30Post-harvest
Perennial ryegrass (20%)Poaceae
White mustard (10%)Brassicaceae
Flax (10%)Linaceae
Pea (10%)Fabaceae
Squarrose clover (5%)Fabaceae
False flax (5%)Brassicaceae
Buckwheat (5%)Polygonaceae
Tillage radish (5%)Brassicaceae
Radish (5%)Brassicaceae
Note: Italian ryegrass (Lolium multiflorum L.), Egyptian clover (Trifolium alexandrinum L.), Persian clover (Trifolium resupinatum L.), black oat (Avena strigosa Schreb.), buckwheat (Fagopyrum esculentum Moench.), flax (Linum usitatissimum L.), tillage radish (Raphanus sativus var. longipinnatus L.), sunflower (Helianthus annuus L.), lacy phacelia (Phacelia tanacetifolia Benth.), serradella (Ornithopus sativus Brot.), red clover (Trifolium pratense L.), perennial ryegrass (Lolium perenne L.), white mustard (Sinapis alba L.), pea (Pisum sativum L.), squarrose clover (Trifolium squarrosum L.), false flax (Camelina sativa L.), radish (Raphanus sativus L.).
Table 2. Effect of different cover crop mixtures on nutrient accumulation in aboveground biomass in 2023.
Cover Crop MixturesTotal Nitrogen,
kg ha−1
Total Phosphorus, kg ha−1Total Potassium, kg ha−1Organic Carbon, kg ha−1
Undersown TGS BIOM 176.8 ± 6.62 b8.06 ± 0.98 b88.4 ± 9.98 a758.2 ± 56.8 a
Post-harvest TGS D STRUKT 195.9 ± 3.75 ab13.3 ± 1.30 a91.0 ± 11.8 a777.9 ± 76.5 a
Post-harvest TGS GYVA 365103.4 ± 30.1 a12.2 ± 3.78 a102.3 ± 34.5 a782.0 ± 177.3 a
Different letters indicate significant differences between the treatments (p < 0.05). Data represent mean ± standard error, n = 4.
Table 3. Effect of different cover crop mixtures on soil nutrient content in 2024.
Cover Crop MixturesMineral Nitrogen, %Available Phosphorus, mg kg−1Available Potassium, mg kg−1Organic Carbon, %
Without cover crops9.64 ± 0.78 a232.7 ± 15.8 a145.0 ± 10.0 a1.99 ± 0.17 ab
Undersown TGS BIOM 18.51 ± 0.41 a238.2 ± 42.8 a162.3 ± 4.18 a2.16 ± 0.08 a
Post-harvest TGS D STRUKT 19.71 ± 1.09 a150.0 ± 23.8 b149.7 ± 11.6 a1.76 ± 0.13 b
Post-harvest TGS GYVA 3656.88 ± 0.33 b136.3 ± 25.6 b140.3 ± 18.1 a2.18 ± 0.06 a
Different letters indicate significant differences between the treatments (p < 0.05). Data represent mean ± standard error, n = 4.
Table 4. Comparison of soil aggregate–size distribution under different cover crop mixtures in 2024.
Cover Crop MixturesSoil Aggregate–Size Distribution, %
Mega
>10 mm
Macro
0.25–10 mm
Micro
<0.25 mm
Without cover crops43.2 ± 4.24 a52.3 ± 4.05 a4.50 ± 0.75 a
Undersown TGS BIOM 130.7 ± 7.15 a64.3 ± 6.32 a5.00 ± 0.86 a
Post-harvest TGS D STRUKT 140.6 ± 14.0 a54.2 ± 12.4 a5.20 ± 2.18 a
Post-harvest TGS GYVA 36543.6 ± 0.90 a50.4 ± 1.12 a6.00 ± 0.24 a
No significant differences were found (p > 0.05). Data represent mean ± standard error, n = 4.
Table 5. Effect of different cover crop mixtures on chlorophyll concentration, aboveground dry biomass, and crop density of spring oat in 2024.
Cover Crop MixturesChlorophyll Concentration in the Oat Leaves, µmol m−2Aboveground Absolute DM Biomass at the Flowering Stage, Mg ha−1Crop Density,
pcs. m−2
Without cover crops267.8 ± 28.4 b9.66 ± 1.36 b427 ± 34.1 a
Undersown TGS BIOM 1553.1 ± 59.3 a11.7 ± 0.30 ab516 ± 28.0 a
Post-harvest TGS D STRUKT 1474.5 ± 16.6 a13.0 ± 0.35 a506 ± 10.7 a
Post-harvest TGS GYVA 365465.9 ± 73.8 a10.6 ± 1.40 ab479 ± 34.2 a
Different letters indicate significant differences between the treatments (p < 0.05). Data represent mean ± standard error, n = 4.
Table 6. Effect of different cover crop mixtures on the biometric traits, yield structure, and grain yield of spring oats in 2024.
ParametersCover crop mixtures
Without Cover CropsTGS BIOM 1Post-Harvest
TGS D STRUKT 1
Post-Harvest TGS GYVA 365
Plant height, cm66.4 ± 2.54 a80.8 ± 2.08 a80.3 ± 4.00 a74.1 ± 4.16 a
Number of grains per panicle, pcs.23.8 ± 1.71 b29.6 ± 0.12 a31.5 ± 2.79 a24.3 ± 2.58 b
Mass of grains per panicle, g0.82 ± 0.06 a1.05 ± 0.06 a1.08 ± 0.13 a0.88 ± 0.08 a
Mass of 1000 grains, g34.3 ± 1.85 a35.1 ± 1.94 a34.3 ± 1.01 a36.3 ± 1.01 a
Grain yield, Mg ha−13.50 ± 0.41 b5.40 ± 0.58 a5.47 ± 0.56 a4.16 ± 0.15 ab
Different letters indicate significant differences between the treatments (p < 0.05). Data represent mean ± standard error, n = 4.
Disclaimer/Publisher’s Note: The statements, opinions and data contained in all publications are solely those of the individual author(s) and contributor(s) and not of MDPI and/or the editor(s). MDPI and/or the editor(s) disclaim responsibility for any injury to people or property resulting from any ideas, methods, instructions or products referred to in the content.

