Article

A Sustainable Framework for Realism Evaluation and Optimization of Virtual Fabric Drape Effect

1
College of Fashion and Design, Donghua University, Shanghai 200051, China
2
Key Laboratory of Clothing Design and Technology, Donghua University, Shanghai 200051, China
*
Author to whom correspondence should be addressed.
Sustainability 2025, 17(12), 5550; https://doi.org/10.3390/su17125550
Submission received: 21 April 2025 / Revised: 11 June 2025 / Accepted: 11 June 2025 / Published: 17 June 2025

Abstract

:
As awareness of the negative environmental impact of fashion grows, most companies are choosing to innovate in areas such as recycling and digital transformation. In the context of the rising digital economy and the ongoing development of 3D simulation software, there has been a notable increase in the demand for realistic 3D virtual-fitting effects. However, no standardized evaluation method exists for the realism of virtual fabric drape. This study proposes a systematic approach to enhance the objective evaluation and rapid optimization of virtual fabric drape realism. The research is structured in four stages. First, virtual drape testing conditions are established by referencing real-world fabric drape tests. Second, fuzzy classification is employed to categorize the realism of virtual drape effects into six levels. Third, subjective evaluations of representative fabrics are conducted to define the grading thresholds and reveal differences among the fabric types. Finally, a backpropagation (BP) neural network is used to construct three rapid evaluation models and one optimization model, which are validated through practical application. The proposed method supports accurate assessment and optimization of virtual simulations, contributes to a refined virtual fabric database, and offers insights for improving other 3D fitting software.

1. Introduction

It has become widely recognized that the fashion industry is one of the most polluting industries in the world, due to the fabric scraps that end up in landfills, the carbon footprint generated by production, and water pollution caused by poor waste management [1]. Fabric waste resulting from the fabric-cutting process generates 10% of the solid apparel industry waste. With population growth and economic development, textile production continues to rise. Additionally, the rise of fast fashion has led to increased per capita textile consumption and a shorter lifespan for textiles. As a result, the production of textile waste has increased dramatically [2]. In response, sustainability has emerged as a critical concern. From material recycling and life-cycle design to the integration of digital tools, a range of innovations is being incorporated into apparel design and manufacturing processes. Among these, digital transformation—particularly virtual garment simulation—has shown considerable promise in reducing environmental impacts while enhancing design efficiency [3]. The current clothing and textile industry is undergoing a gradual digital transformation to enhance work efficiency and establish a sustainable production model [3]. Currently, many large-scale clothing enterprises are implementing digital and automated supply chains through virtual fabric simulation technology [4].
Virtual simulation technology has revolutionized the fashion industry by providing efficient and cost-effective tools for design, production, and sales. As shown in Figure 1, in design, software like CLO 3D and V-Stitcher allows designers to simulate fabric texture, style, and drape, eliminating traditional methods like pattern making and sample creation. This speeds up the design process, reduces costs, and minimizes waste. In production, virtual simulations enable customized and on-demand models, addressing issues like inventory backlog and slow sales. During sales, virtual fitting technology improves the consumer experience by reducing return rates and lowering logistics and inventory costs. Additionally, this technology can be applied to the e-commerce sector to enhance the texture and dynamic effects of virtual clothing displays. In educational settings, the realism of virtual fabrics can be utilized in courses related to textile technology and fashion design. However, challenges remain, such as rigid 3D human models that do not fully capture comfort and psychological perception, and simulations of fabric drape and texture that are not yet completely realistic. Therefore, enhancing the realism of 3D virtual fitting effects remains a key direction for optimization. The realism of virtual fabrics plays a pivotal role in determining the overall authenticity of 3D virtual fitting effects. This realism can be analyzed through multiple dimensions, including drape realism, wrinkle realism, texture representation, and material representation. Among these, drape realism assumes a dominant role in shaping the perceptual fidelity of virtual fabrics [5]. Therefore, this paper focuses on researching how to achieve an efficient and objective evaluation of the realism of virtual fabric drape effects and optimize simulation results.
In research on virtual fabric wrinkle effects, Wang et al. developed an instance-based fold synthesis technology in 2010, which integrated high-quality clothing folds with coarse cloth simulation to compute the global and dynamic aspects of clothing movement [6]. In 2013, Dong-Eun Kim found in his research that fabrics with lower elasticity appear stiffer in virtual simulation and may fail to effectively represent small and soft wrinkles [7]. Chang Wei et al. employ fractal geometry principles and digital simulation technology (virtual software) to simulate the design process and effects of pleated clothing, verifying the feasibility of simulation software in assisting pleated clothing design [8]. Research on fabric wrinkle effects has laid the micro-technical foundation for virtual fabric drape research [9].
The research on fabric drape simulation originated in the 1930s [10]. There are two research directions in drape simulation: (1) computer vision simulation based on the physical behavior of fabrics, which mainly simulates the appearance without involving the mechanical properties of fabrics, and (2) establishing appropriate engineering mechanics models based on the mechanical properties of fabrics to achieve a precise simulation of fabric drape. Recent studies have made significant contributions to understanding the gap between the behavior of virtual and real fabrics. For example, in 2025, Seonyoung Youn et al. conducted virtual drape tests on fabrics, analyzing discrepancies between a fabric’s physical properties and the virtual simulation, and developed a method to compare and evaluate fabric parameters in a virtual environment through drape analysis [11]. Their approach to quantifying discrepancies between the physical properties and the virtual simulation provides key inspiration for this study’s real–virtual drape feature-matching evaluation system. In the same year, Liu Chen et al. assessed the alignment of eight drape characteristics between real fabrics and virtual simulations in Style 3D software. Through image analysis using MATLAB and statistical tests (Shapiro–Wilk test and paired t-test), they compared the simulation performance. They found that five drape indicators showed good restoration effects, while three showed significant deviations [12]. In 2024, Kim, Jeong Hwa studied the real and virtual drape parameters of traditional Korean hanbok silk fabrics, analyzing the correlation between their physical properties and drape coefficients using the KES-FB fabric evaluation system and CLO 3D software (V.7.1) [13]. Their correlation model between the fabric’s mechanical properties and the drape coefficients provides a modeling approach for addressing mechanical parameter mapping of complex fabrics in this study. In 2022, Lu Xueshan et al. investigated the virtual draping properties of various silk fabrics, evaluating the simulation effect of CLO 3D on silk draping using paired sample t-tests and rank-sum tests. This paper draws on their analytical methods for the drape simulation effects [14]. In 2018, Evrim Buyukaslan et al. selected five different fabrics and used the Optitex 3D Suite simulation software (Version 15) to compare the actual and virtual fabric drape across three dimensions: drape area, number of nodes, and pleat shape [15]. This study contributed to improving the realism and accuracy of fabric and clothing simulations. Building on these studies, this paper expands the range of research samples to encompass a broader variety of fabrics with diverse characteristics and moves beyond a comparative analysis to evaluate and optimize drape realism.
Fabric draping is influenced not only by fiber composition and weaving processes but also by factors such as weight, thickness, and post-processing techniques. Therefore, the evaluation system for fabric drape has been the focus of extensive investigation in the pursuit of understanding the mechanical properties of fabric drape.
In the evaluation of fabric drape, there are two primary methods. (1) Subjective evaluation is where evaluators assess the drape based on personal feelings. This method is straightforward and expedient. However, because subjective perceptions differ among individuals, establishing a unified standard is challenging. Consequently, this can result in significant discrepancies in evaluation outcomes and considerable limitations. (2) Instrumental measurement involves the use of instruments to quantify indicators that characterize the drape performance of the fabric, such as the drape coefficient and other relevant metrics. This approach aims to minimize or eliminate the influence of subjective factors on the evaluation results. Cusick employed the paper-weighing method to determine the drape coefficients of fabrics [9]. In this technique, a fabric specimen measuring 24, 30, or 36 cm in diameter was placed on an 18 cm diameter supporting disk. As the fabric naturally draped downward under the influence of gravity, the drape coefficient (F) could be calculated and defined as in Equation (1):
F = ( W 1 W 2 )   ×   100
where W1 refers to the paper ring that contains the shadow image of the draped configuration, which is subsequently weighed. W2 denotes the shadow image that is cut from the paper ring and is also subjected to weighing.
Currently, the evaluation methods for virtual fabrics mainly simulate the conditions of real fabric testing. In this approach, the sample is placed flat on a support plate, and a lifting mechanism simultaneously raises both the sample and the sample tray at a constant speed. Then, the sample drops under its weight. In 2018, Wang, Pengcheng et al. proposed a testing and analysis method for fabric drapability based on 3D-scanning technology, discovering that parameters such as the number of wave patterns in each cut layer of the fabric intuitively reflect changes in the shape of the draping surface in three-dimensional space, providing a new method for evaluating fabric drapability [16]. In 2011, Kim et al. used female fashion professionals as an evaluation group, showed them photos of real and virtual garments, and conducted a questionnaire survey. They then used the survey results to evaluate the visual similarity between real garments and 3D virtual garments [17]. In 2017, Buyukaslan et al. used Optitex software to simulate the draping behavior of five fabrics virtually, asked 27 subjects to match real and virtual draping images, and studied the simulation effect and subjective evaluation differences of virtual draping. They found that some fabric simulation images could be correctly matched, but the overall simulation accuracy was limited [18]. However, the evaluation criteria for subjective experiments were relatively simple. Therefore, in this paper’s subjective evaluation, three scoring dimensions were designed, namely overall perception, degree of draping, and draping morphology, and an optimization framework was proposed. Regarding the evaluation of the virtual fabrics’ realism, there is currently no unified evaluation system, which mainly relies on subjective judgments and limited physical parameters, making it difficult to be universally applicable across different fabrics and platforms. Therefore, a data-driven and reproducible system is needed to evaluate and optimize the realism of the virtual fabric simulation effects.
This paper proposes a sustainable framework for evaluating and optimizing the realism of virtual fabric drape effects. Drawing inspiration from the concept of a Digital Twin, constructing a virtual mapping of physical objects through data-driven approaches [19], which serves as a key mechanism connecting “sustainable goals” and “digital tools”. The framework achieves continuous optimization of virtual fabric authenticity simulation through a closed-loop process of physical testing–virtual simulation–feedback optimization [20]. The framework integrates fuzzy clustering, subjective scoring, and BP neural network prediction models to build a closed-loop, low-carbon, and efficient virtual simulation optimization system. This method not only enables more accurate and efficient objective evaluation of the realism of virtual fabric drape effects and rapid optimization of virtual fabric simulation effects, but also accumulates data to construct a more precise virtual fabric database. Meanwhile, it effectively reduces material waste and carbon emissions, helping the fashion production industry transform toward sustainability and digitalization.
This research includes (1) generating virtual fabric and establishing the experimental conditions for virtual fabric drape based on real fabric drape experiments; (2) classifying the realism of the virtual fabric drape effect using paired sample t-tests and fuzzy classification methods; (3) subjectively evaluating the representative virtual fabric simulation scenarios across two dimensions, namely realism evaluation grade and fabric composition, while determining the grade threshold range; and (4) employing a BP neural network to develop a fast evaluation model that assesses the realism of the drape effect of virtual fabrics based on overall feeling, drape degree, and drape form in two dimensions, alongside a realism optimization model for the drape effect. This article aims to investigate the realism of virtual fabric drape and proposes a comprehensive set of evaluation and optimization processes for virtual fabric drape effects.

2. Research Methodology

2.1. Fabric Selection

To select suitable fabric samples for this experiment, consultations were held with experts in the field of garment fabrics, and visits were made to offline fabric markets. Fabric classification labels were based on the intended use of the fabrics, and typical fabric varieties were chosen, as shown in Table 1. After consultations with a garment digitalization engineer, it was found that conventional fabrics are primarily utilized in 3D garment modeling via CLO software (7.0), with applications spanning women’s tops, dresses, shirts, men’s shirts, jackets, down jackets, suits, and coats. Additionally, among woven fabrics, twill is frequently used. Through the literature research, it was found that, when comparing the drape coefficients of various samples, lighter and more loosely woven fabrics exhibited smaller drape coefficients, indicating that these fabrics are softer. Furthermore, it was discovered that the impact of the weight gain rate on the drape coefficients of different samples varies [21]. Therefore, this study should aim to select fabrics with different compositions and qualities to enhance the persuasiveness of the research results.
Informed by previous studies, this research carefully selected fabric types to ensure diversity and relevance. In 2011, Shao Yanfang selected 45 types of chemical fiber fabrics for experiments aimed at examining the relationship between the fabric’s mechanical properties and the static drape aesthetics [22]. In 2022, Wang Xia selected 83 fabrics from the Style 3D library while researching virtual fabric drape using a BP neural network [23]. Ultimately, 71 types were selected, primarily comprising cotton, linen, rayon, polyester, nylon, and their blended fibers, along with some innovative fabrics, as illustrated in the accompanying table. Partial testing sample information is shown in Table 2.

2.2. Generation of Virtual Fabric

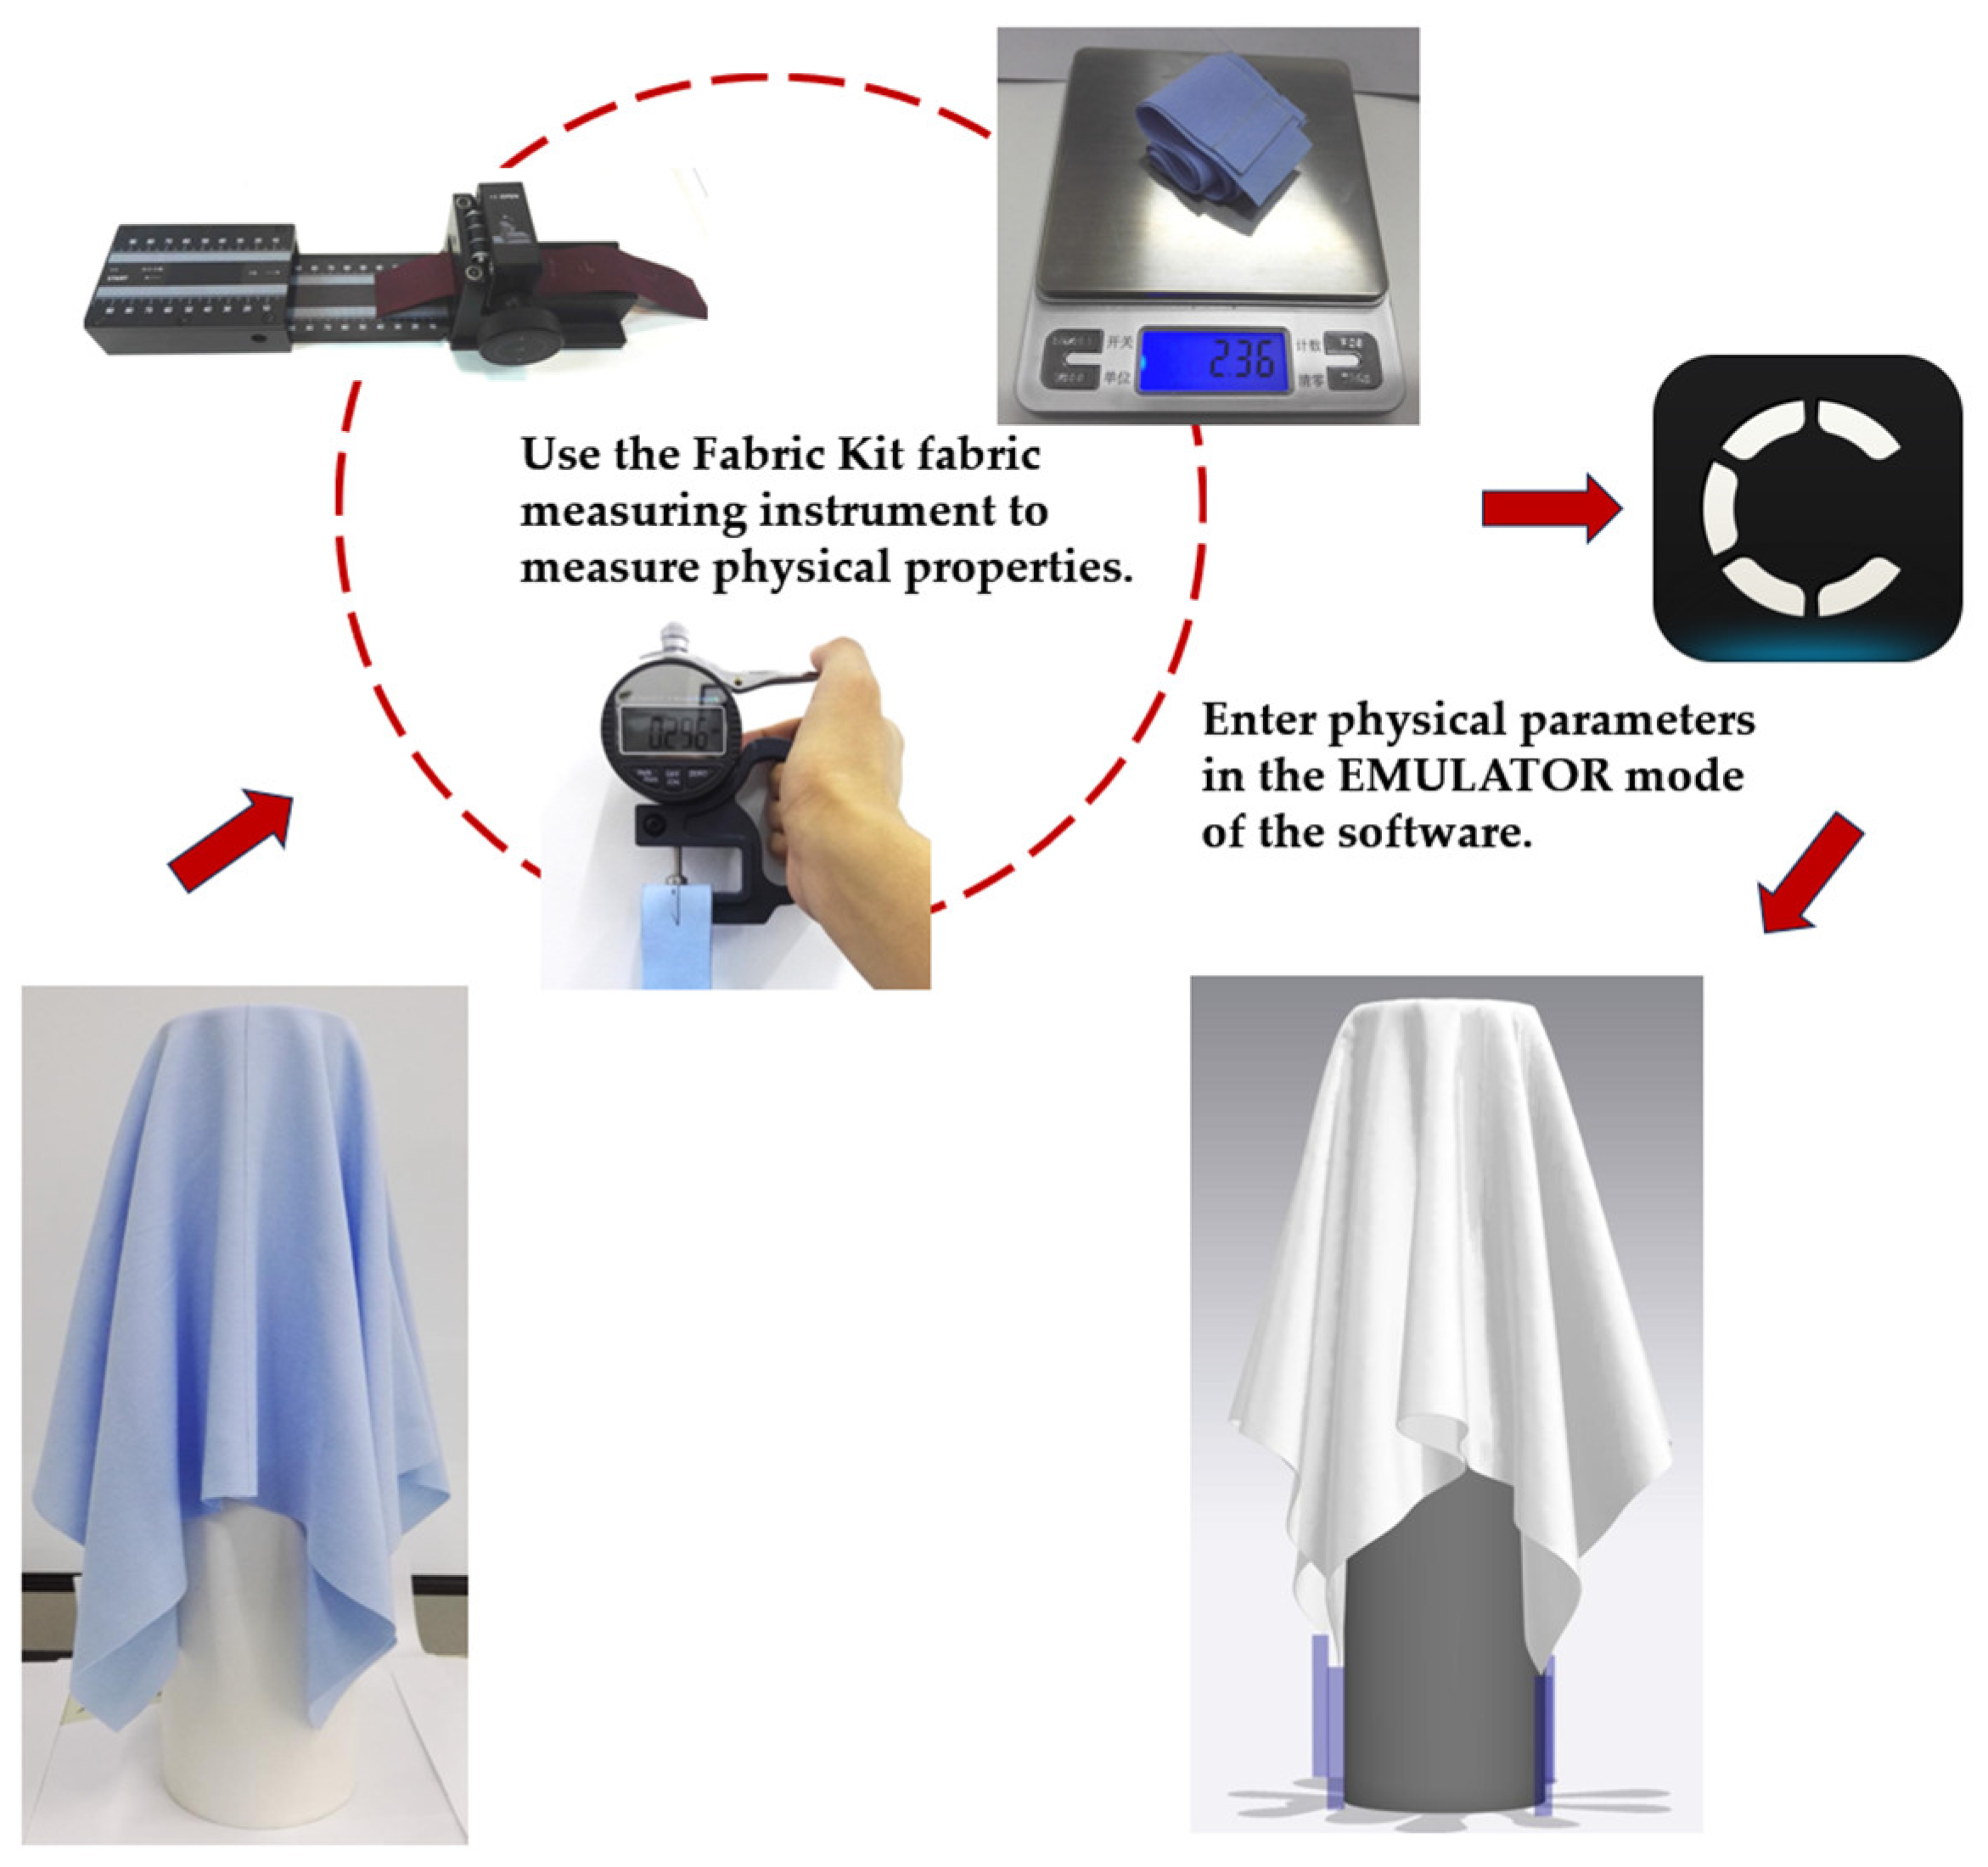
The virtual fabric is generated using the EMULATOR mode in the CLO software. In this mode, the relevant physical property parameter data from the real fabric is input, enabling the calculation and generation of a virtual fabric file. These physical property parameters are obtained using the Fabric Kit, a comprehensive set of fabric-testing instruments specifically designed to match the input requirements of the CLO 3D system. The kit includes a sample cutting template, an electronic balance, a thickness gauge, a bending stiffness tester, and a tensile strength tester.
The weight, thickness, flexural strength, and tensile strength of the samples were measured using the Fabric Kit fabric-measuring instrument. For each piece of fabric, three samples were taken, with each sample measuring 220 mm by 30 mm. Finally, the measured physical property parameter data of the real fabric is entered into the EMULATOR mode of the software, where calculations are performed to generate the virtual fabric file. This virtual fabric file includes six specific physical properties: weft strength, warp strength, diagonal tension, bending strength (weft), bending strength (warp), and density. The virtual fabric generation process is shown in Figure 2.

2.3. Drape Tests in Real and Virtual Environments

2.3.1. Real Fabric Drape Experiment

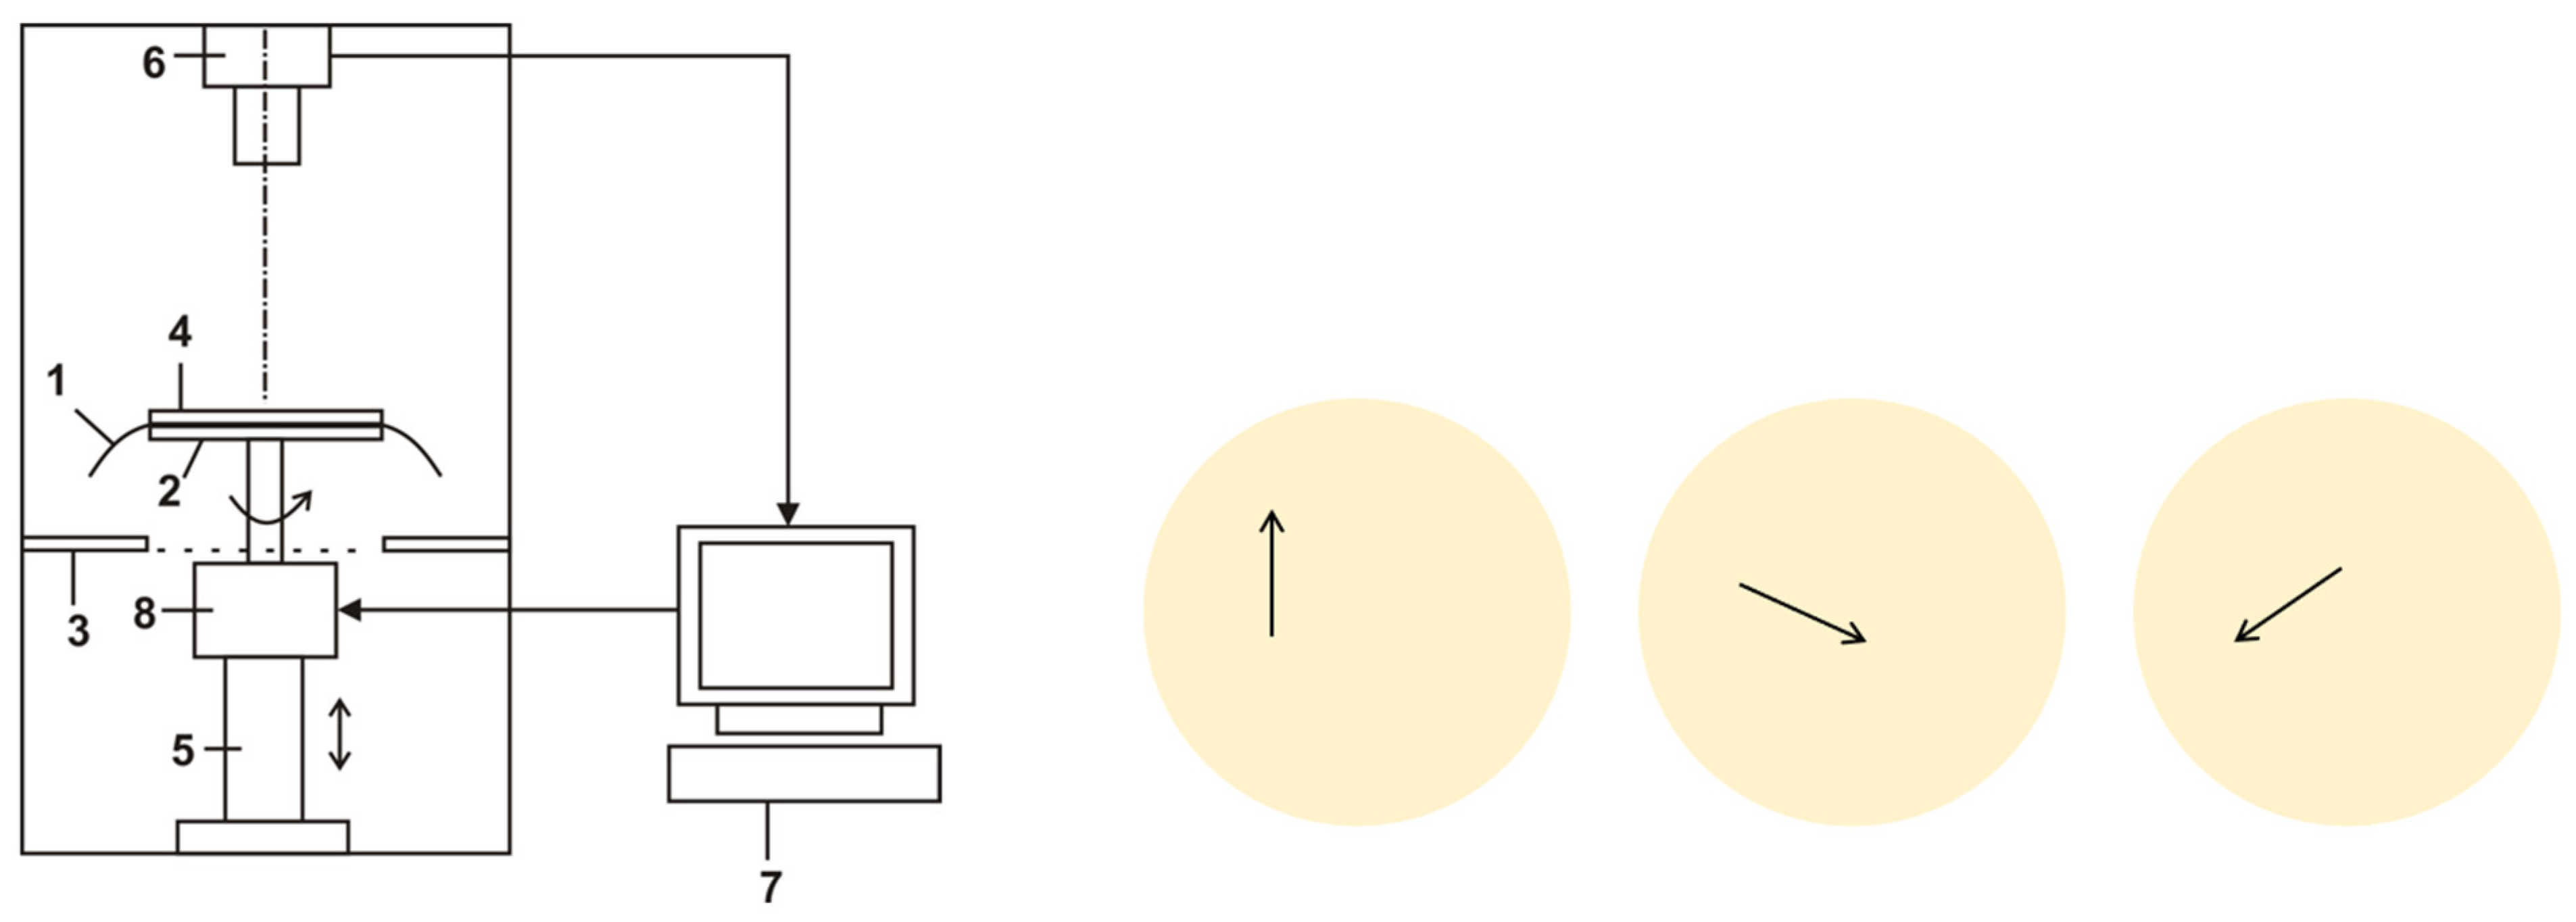
This experiment was conducted using the XDP-1 drape tester developed by Xinlin et al., based on the image-processing method specified in national standard GB/T 23329-2009 [24] for drape testing, which outlines the determination of drape for textile fabrics. A total of 71 fabric types were utilized for the actual drape tests. Each fabric was ironed without steam, then cut into circular specimens with a diameter of 240 mm, with a round hole measuring approximately 4–5 mm cut out at the center of each circle. All samples were conditioned for 24 h at a temperature of 20 °C and a relative humidity of 65%. According to the instruction manual for the XDP-1 drape tester, the standard test duration for this experiment was set at 3 min. The real fabric drape test detailed in this article included 71 fabric samples, with each sample tested in 3 different directions, resulting in a total of 213 fabric drape images. The experimental equipment and the three grain line directions during testing are shown in Figure 3.
A total of 213 real fabric drape images were imported into MATLAB (R2024), from which eight drape indices were determined as indicators to evaluate the realism of the virtual fabric drape effect objectively. These indices include the drape coefficient (F), wave number (N), maximum wave peak amplitude (MaxCR), minimum wave peak amplitude (MinCR), maximum peak angle (MaxCA), minimum peak angle (MinCA), peak amplitude uniformity (CVR), and peak angle uniformity (CVA). Directional drape index data for each fabric were measured three times and averaged. F can be defined following Equation (2):
F = A F A d A D A d × 100 %
where AF and AD are, respectively, the areas of the projected shadow of the fabric sample after and before draping, and Ad is the area of the bottom of the cylinder in the devised virtual drape test.

2.3.2. Virtual Drape Test

Before conducting the fabric drape test, it is essential to establish the test conditions. In CLO 3D, factors such as particle spacing, mode conflict, thickness, and surface spacing have a significant influence on 3D clothing modeling and simulation. In this study, the particle spacing is set to 5 mm, the plate collision thickness is set to 2.5 mm, and the surface spacing is set to 0 mm.
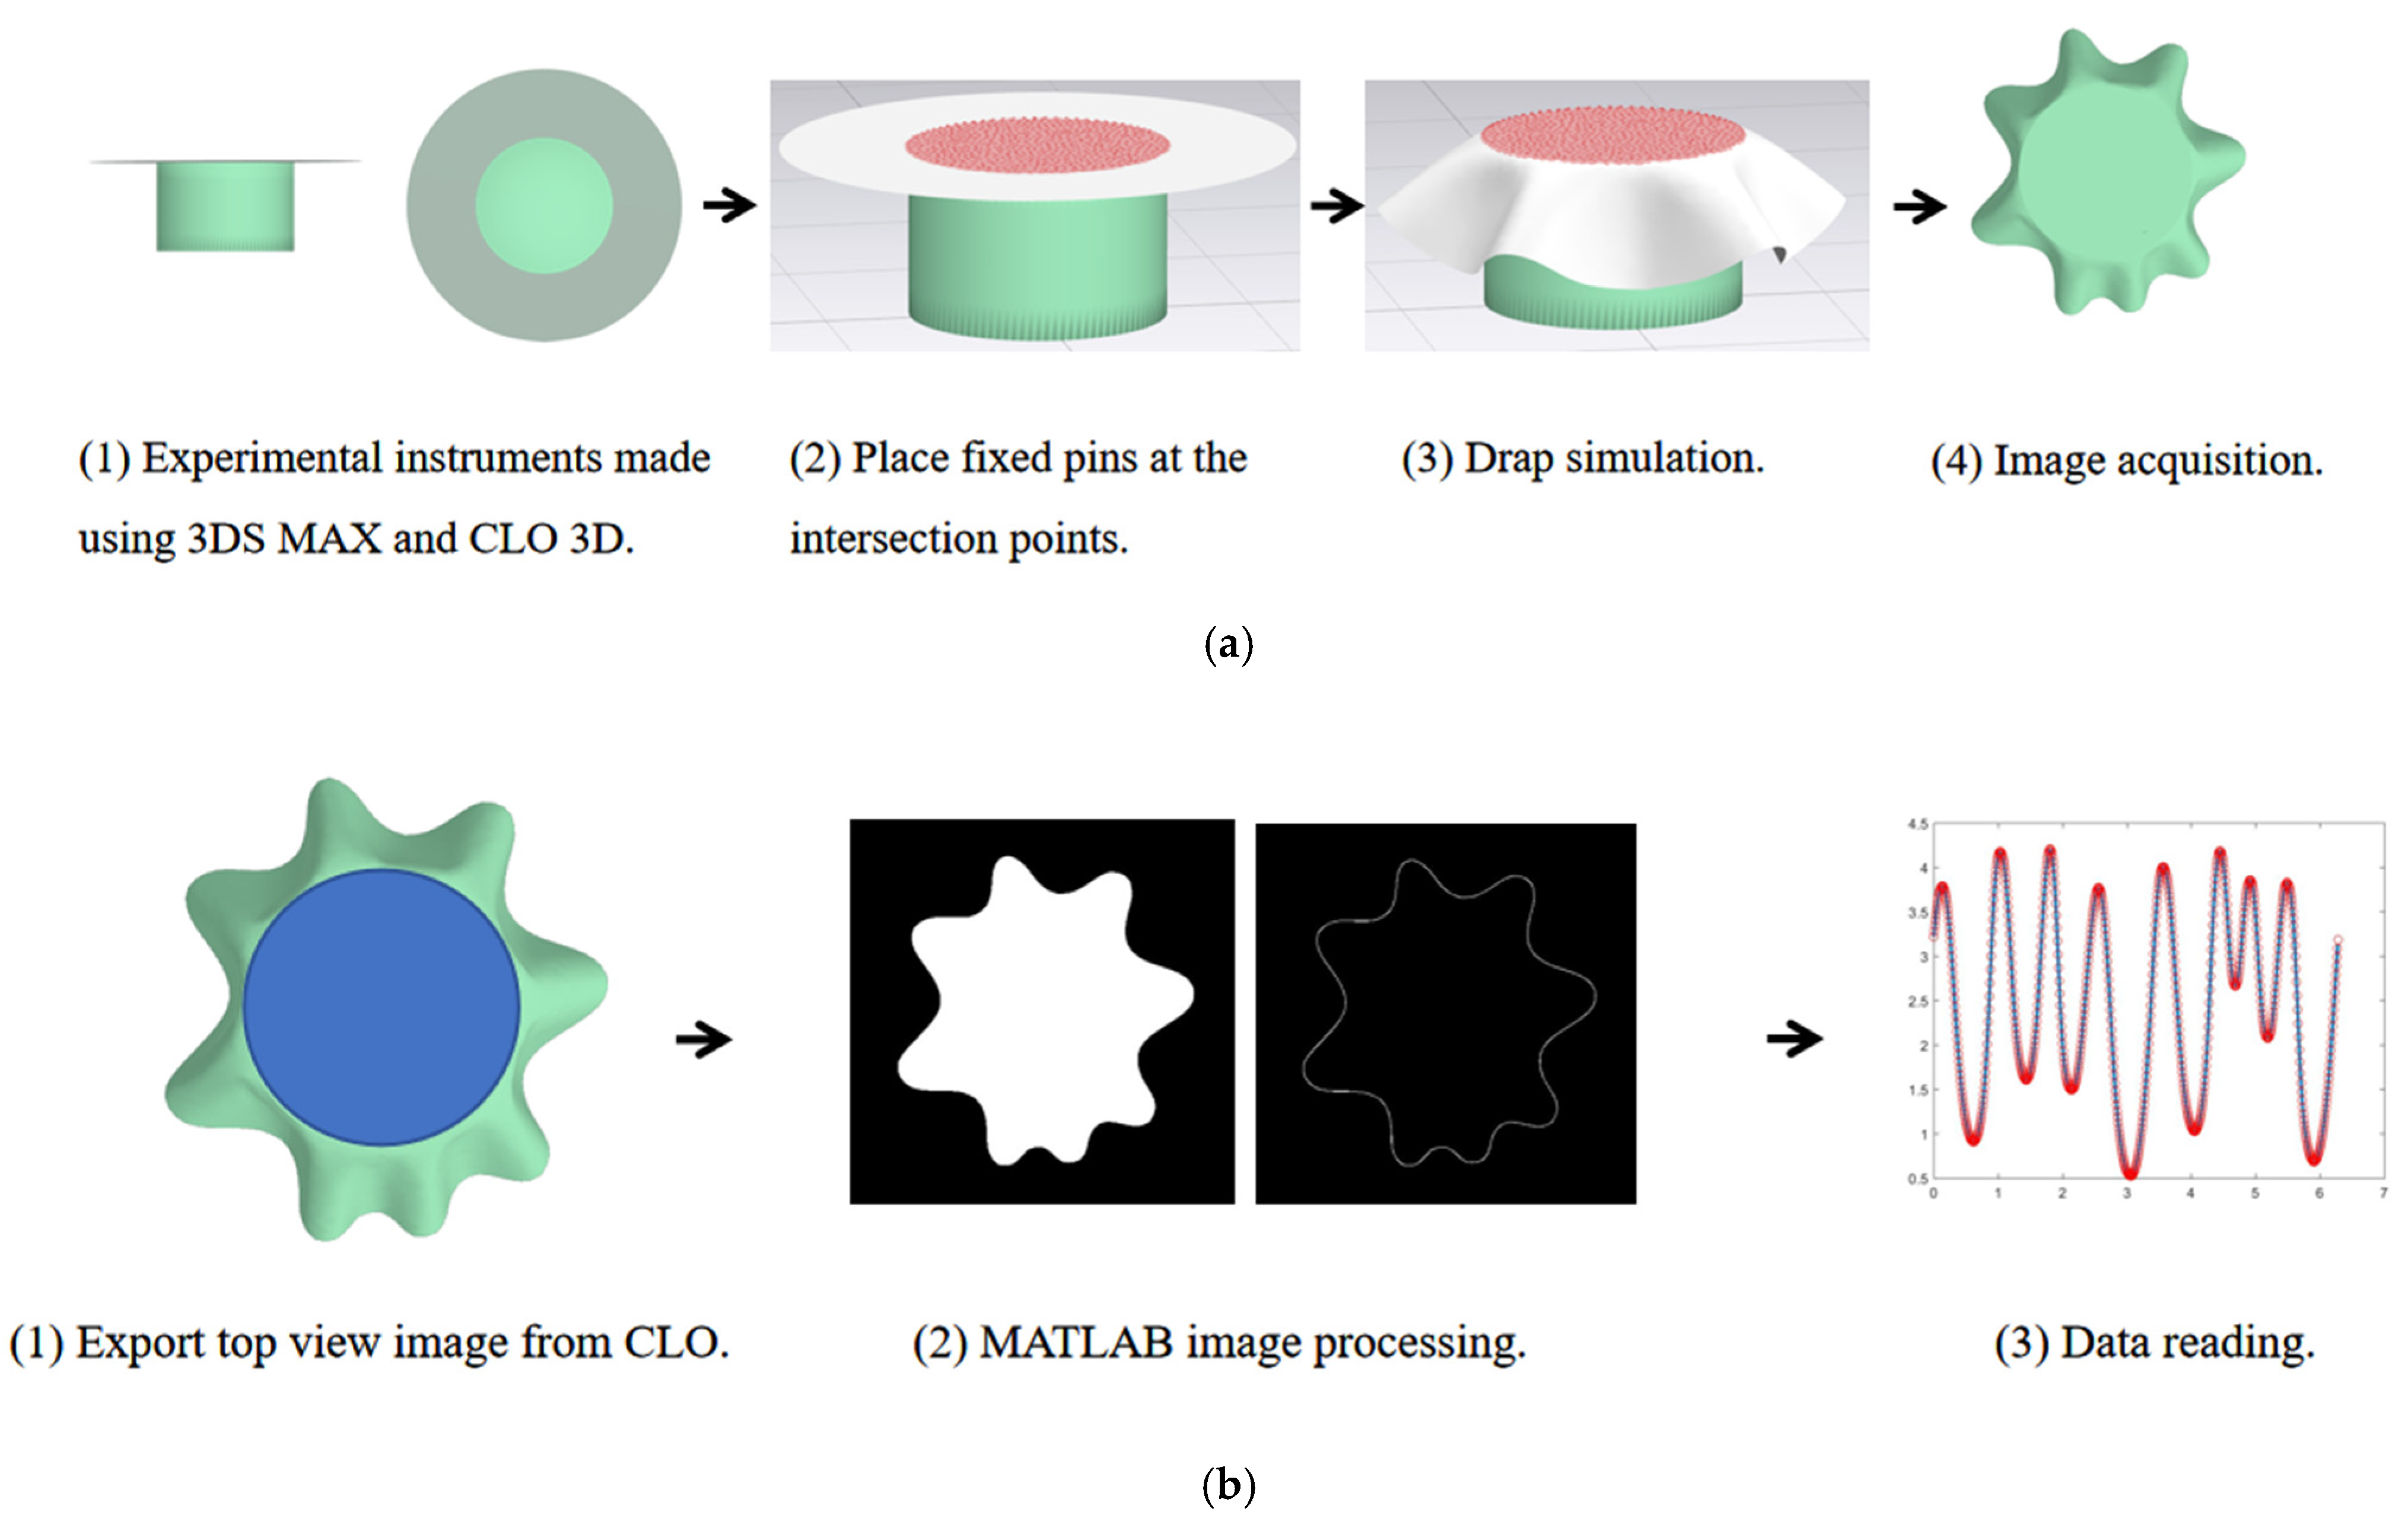
To replicate the experimental conditions of the XDP-1 drapability tester, a cylinder with a height of 78 mm and a circular section diameter of 120 mm, as well as a circular plate with a diameter of 240 mm, were designed using 3DS MAX (2020) and CLO 3D. In the actual fabric overhang test, the fabric exhibits a natural overhang due to the elevation of the tray. However, this dynamic environment cannot be simulated in CLO. Consequently, we opted to place fixed pins at the intersection points of the grid within the inner circle, which has a diameter of 120 mm. Upon activating the simulation state, the virtual fabric will exhibit a natural hanging configuration.
The export plan for the virtual fabric drape image involves adjusting the lens attribute parameters: setting the field of view to 2, the type to spherical, and the distance to −7163. The snapshot will be exported with an image size of 512 pixels by 512 pixels and a transparent background. Additionally, Photoshop will modify the image resolution to 300 pixels per inch while maintaining the original image dimensions of 512 pixels by 512 pixels and save it in JPG format. Furthermore, MATLAB and SPSS 23 were utilized to perform curve estimation, resulting in a correction function that facilitates consistent adjustments of the projected area and radius for both the real fabric and virtual fabric drape images. The specific virtual fabric drape testing process is shown in Figure 4.
This study conducted a drape test on 71 types of virtual fabrics. Each fabric was tested once in three different grain line placement positions. The resulting 213 virtual fabrics were imported into MATLAB, where their eight drape index data, along with the drape projection area-filling diagram and the extension length–angle expansion diagram, were analyzed. Some virtual and real fabric drape index data are shown in Table 3.

2.4. Statistical Analysis

2.4.1. Objective Evaluation of Reality

The paired t-test is employed to determine whether two groups of related samples originate from normal populations with identical means, specifically to assess whether there exists a significant difference between the means of the two populations. In this study, a paired t-test was conducted to compare eight indicators of virtual fabric drape with eight indicators of real fabric drape. The differences between the variables are assessed and compared significantly based on the mean and p-values. It is stated that, if the p-value is less than the alpha level of 0.05, this indicates a statistically significant difference and strong correlation [25].

2.4.2. Classification System Development Using Fuzzy Clustering Analysis

Among the various fuzzy clustering analysis methods, the fuzzy c-means clustering algorithm (FCM) is a partition-based clustering algorithm [26].
Fuzzy c-means (FCM) clustering analysis was performed to develop a classification system for objective numerical values. Specifically, FCM clustering was conducted based on the drapability of the 71 fabric samples. A comprehensive program was developed using the MATLAB programming language to perform a fuzzy clustering analysis on the differences in the drape coefficients between the virtual and real fabrics.
Among the eight indices used to evaluate the drape performance of fabrics in this paper, the drape coefficient is an indicator characterizing the degree of fabric drape, while the wave number, maximum wave peak amplitude (MaxCR), minimum wave peak amplitude (MinCR), maximum wave peak angle (MaxCA), minimum wave peak angle (MinCA), wave peak amplitude uniformity (CVR), and wave peak angle uniformity (CVA) are indicators characterizing the drape morphology of fabrics. Thus, this paper first performed a fuzzy cluster analysis on the differences in the drape coefficients between the virtual and real fabrics, dividing them into three categories. Subsequently, a fuzzy cluster analysis was conducted on the seven indices characterizing drape morphology (wave number, MaxCR, MinCR, MaxCA, MinCA, CVR, and CVA), which were ultimately divided into six categories according to the analysis results.

2.4.3. Subjective Evaluation of Reality

To ensure the operability of the experiment, representative fabrics from each subdivision category were selected for subjective evaluation of the realism of the virtual fabric drape effect, based on the results of fuzzy clustering. The clustering centers of the different categories were used as reference standards, with the samples that had the closest or relatively close centers being chosen. Table 4 shows the selected representative samples.
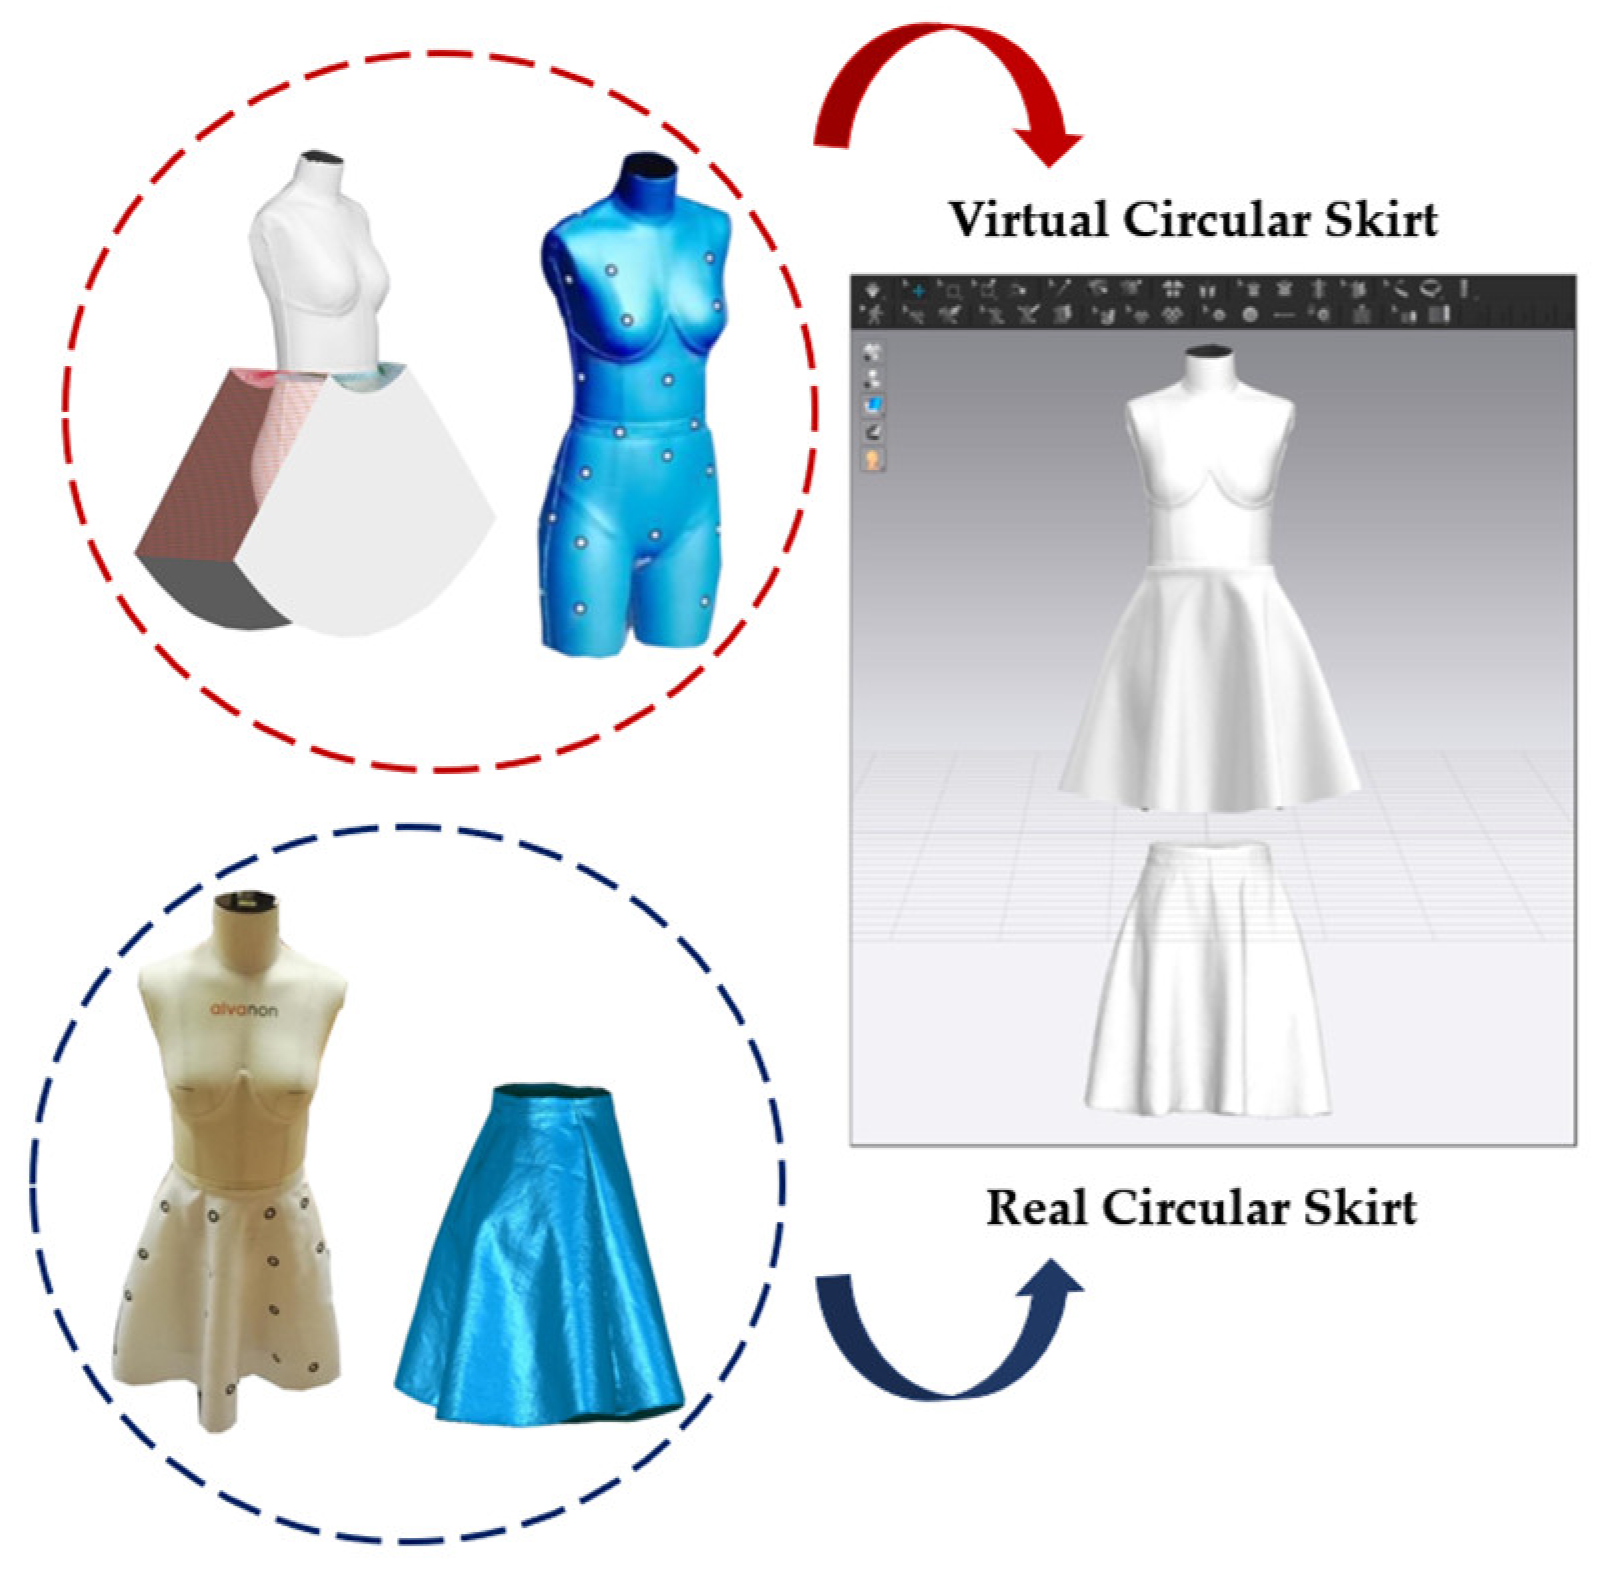
The subjective evaluation test employs the Alvanon female intermediate half mannequin AVF62502, which has a waist circumference of 35 cm, as the test subject. The waist circumference (W) is established in accordance with the skirt–waist structure proportion drawing method outlined in the book “Pattern Making for Fashion Design” edited by Zhang Wenbin [27]. With a waist circumference of 35 cm and a skirt length (L) of 25 cm, adjustments were made after fitting the two-piece skirt on the mannequin. Specifically, the cut pieces were corrected, and the side seams on both sides were tightened by 4 mm to ensure a proper fit for the two-piece skirt. A handheld 3D body scanner was utilized to scan the mannequin, and the resulting data was imported into CLO to create and simulate the virtual two-piece skirt. To enhance the validity of the subjective evaluation, a three-dimensional scan of the actual circular skirt was conducted simultaneously, as illustrated in Figure 5. The three-dimensional shape of the real circular skirt was obtained, and its OBJ file was subsequently imported into CLO, with specific locations indicated in the figure.
The subjective evaluation of the realism of the virtual fabric drape effect is based on three-dimensional renderings of six virtual round skirts, compared to real round skirts. Each skirt is presented in six views: front, front–right, right, back, left, and front–left. All images are saved with a width of 600 pixels and a height of 1000 pixels, featuring a transparent background.
Before the subjective evaluation, we conducted a preliminary assessment to select an appropriate evaluation index. We evaluated the realism of the virtual circular skirt drape effect using a five-level scale and identified three key indicators for assessment: overall impression, degree of drape, and drape shape. The overall feeling pertains to the overall similarity between the virtual and real circular skirt drape effects. The degree of drape refers to the fluffiness observed on both sides of the circular skirt. The drape shape is primarily assessed based on the number and configuration of the waves.
To investigate whether virtual circle skirts can effectively simulate the realism of actual circle skirts, a subjective evaluation was conducted. In line with studies suggesting that the consistency of subjective evaluations can be influenced by fashion-related professional knowledge, we selected 30 individuals for the validation of this study. The panel of evaluators included professionals with a certain level of understanding of three-dimensional virtual fitting, as well as individuals lacking relevant professional knowledge.
Before the subjective evaluation, the evaluators were allowed to examine three-dimensional renderings of both the virtual and real round skirts. Subsequently, they assessed the drape effect solely from the perspective of the fabric’s behavior, using the actual drape effect of a circle skirt as the reference standard.

2.5. The BP Neural Network Modeling

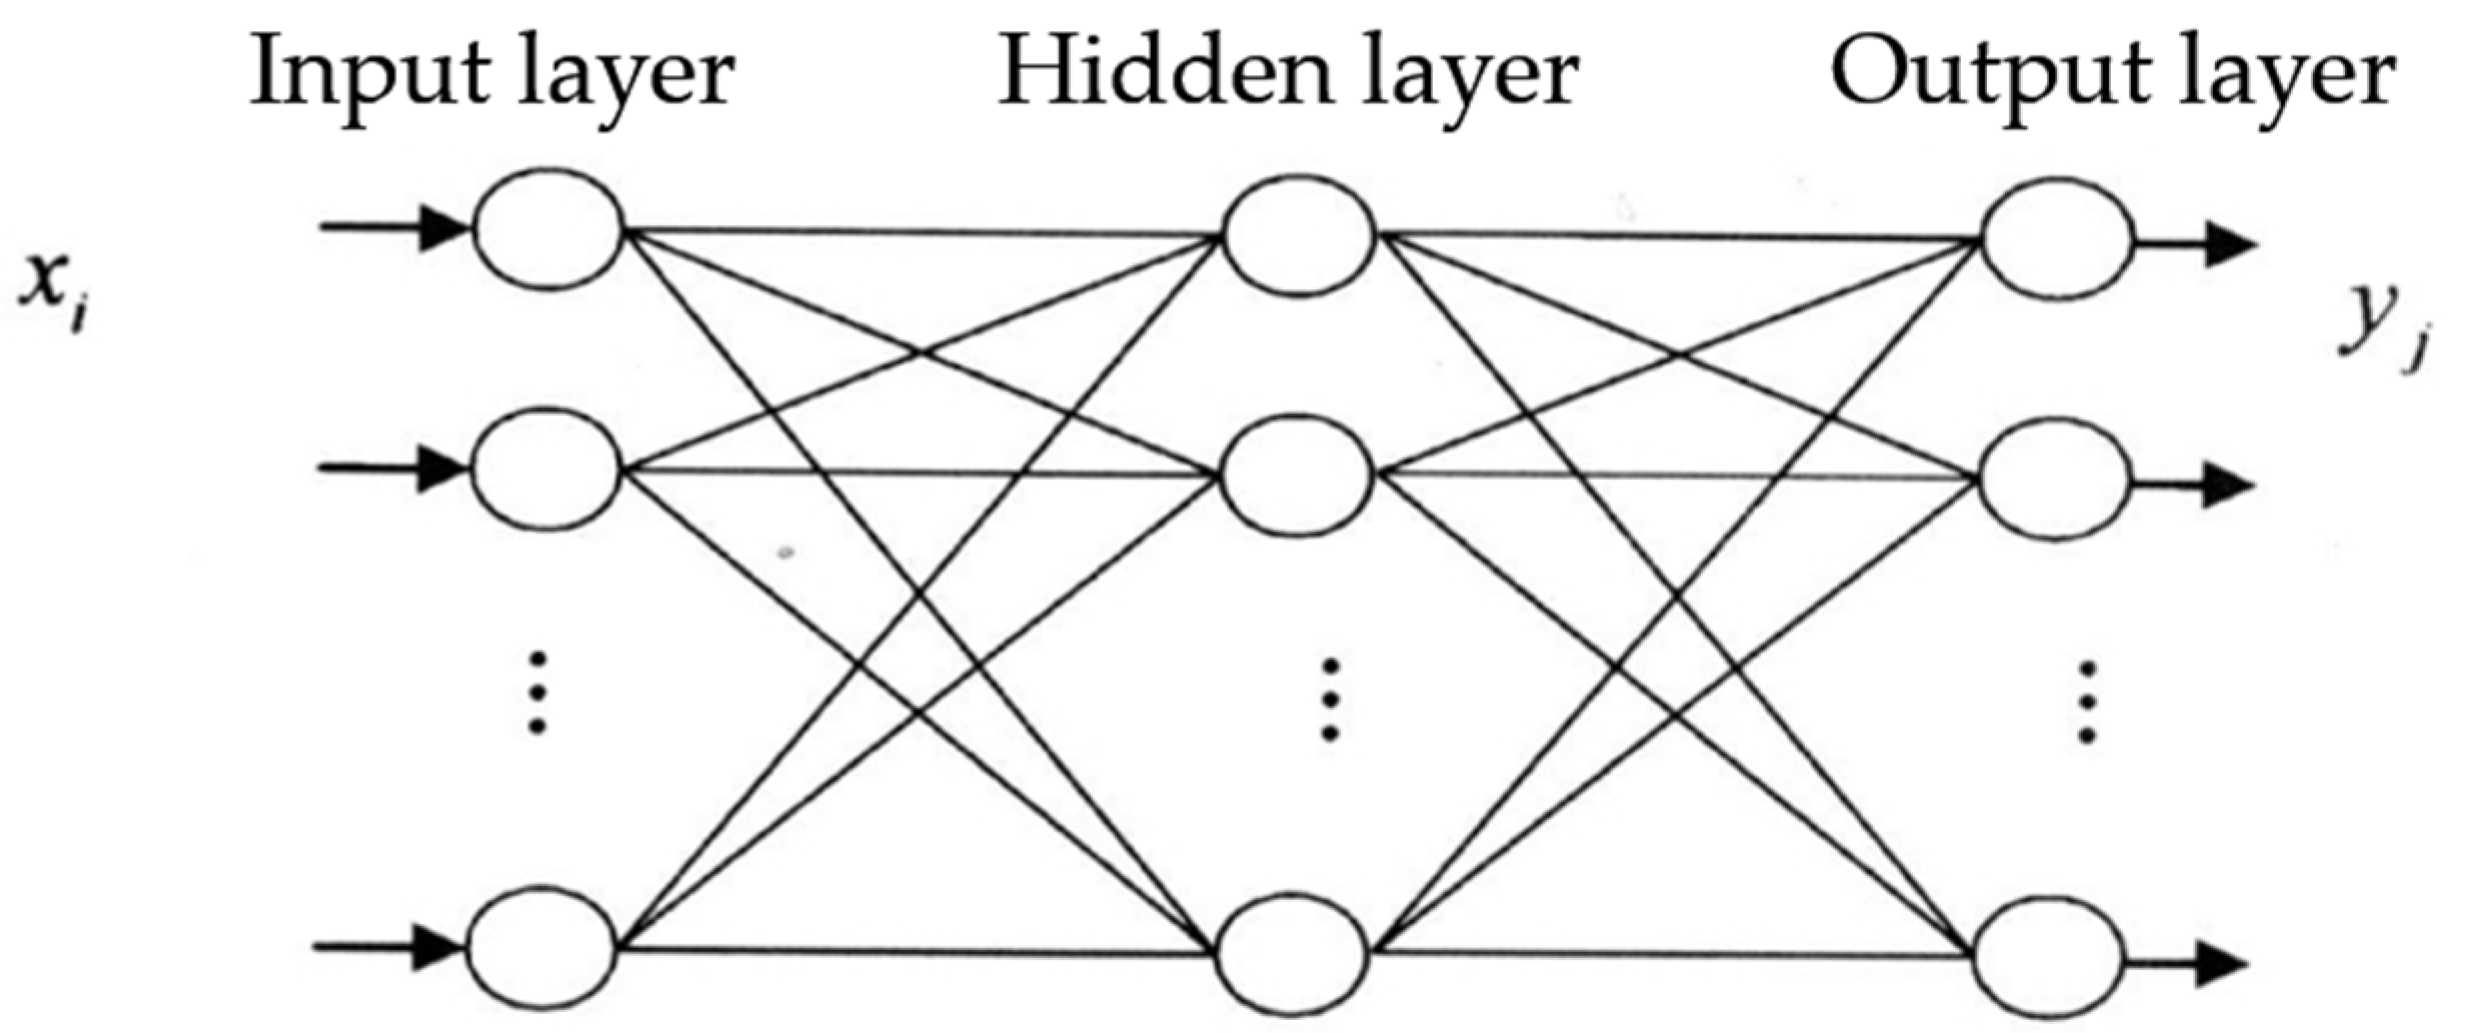
In this study, the BP neural network is employed to develop a rapid evaluation model for assessing the realism of virtual fabric drape effects, as well as a realism optimization model for these drape effects. The BP neural network is a multi-layer feedforward network that is trained using the backpropagation algorithm. It typically comprises three layers: the input layer, the hidden layer, and the output layer [28]. The topology of the backpropagation (BP) neural network is shown in Figure 6. This neural network serves as an effective tool for addressing both classification and regression problems. Therefore, we address the drape effect as a problem and train a prediction model using the BP neural network, along with the drape index and subjective evaluation scores obtained from the tests. Furthermore, the photorealistic optimization model is validated based on the rapid evaluation model.

2.5.1. Data Preprocessing

We selected a sample size of 71 for both the input and output layers. Given the extensive range and significant differences in magnitude among the variables, it is essential to preprocess the data before constructing the model. This article employs MATLAB’s mapminmax function for the normalization and denormalization of the data. The statement format of data normalization is shown in Equation (3):
Pnt = mapminmax (‘apply’, pt, ps)
where Pnt is the normalized value, pt is the model input value, and ps is the normalized regularity information of the original input values of the model.
This article uses the sim function to perform the simulation, and subsequently applies the developed neural network to derive the predicted value, as shown in Equation (4):
b = sim (net, Pnt)
where b is the predicted value of the model.
After simulating the model, the mapminmax function is employed to denormalize the predicted values, as shown in Equation (5):
out = mapminmax (‘reverse’, b, ts)
where ts is the normalized regularity information of the original output data of the model, and out is the actual data after denormalization.
Using the feedforwardnet function, the number of neurons in the hidden layer can be specified. The syntax is net = feedforwardnet(11). Different numbers of neurons will result in varying levels of model accuracy. Thus, the value inside the parentheses can be adjusted to modify the number of hidden neurons, followed by retraining the model. The training function is defined using trainFcn = ‘trainlm’. Here, ‘trainlm’ refers to the Levenberg–Marquardt algorithm, which features the highest accuracy and the fastest convergence speed. Model performance is evaluated using the perform function, which calculates the difference between the predicted values and the actual target. A lower perf value, closer to zero, indicates better model performance. The view(net) command can be used to visualize the structure and parameters of the trained neural network. Finally, the regression results can be assessed using the regression plot. A regression coefficient (R value) close to one indicates a well-fitted model.
The empirical formula for determining the number of neurons in the hidden layer is shown in Equation (6):
l = n + m + 1 , 10
where n is the number of elements in the input vector, and m is the number of elements in the output vector. By comparing the perf values and the regression coefficient R values, the accuracy of the models with different numbers of hidden layer neurons can be evaluated, thereby identifying the optimal model configuration.

2.5.2. BP Neural Network Construction

This article presents a three-dimensional rapid evaluation model for assessing the effects of virtual fabric drape, alongside a realism optimization model for these drape effects. The rapid evaluation models are grounded in three dimensions: overall perception, drape degree, and drape shape. The three models utilize the difference between the average values of the virtual fabric and the real fabric drape indices as input. Additionally, the eight indicators used to evaluate fabric drape performance serve as the input vector for the BP neural network. We configure the model with one intermediate hidden layer, resulting in a three-layer BP neural network architecture.
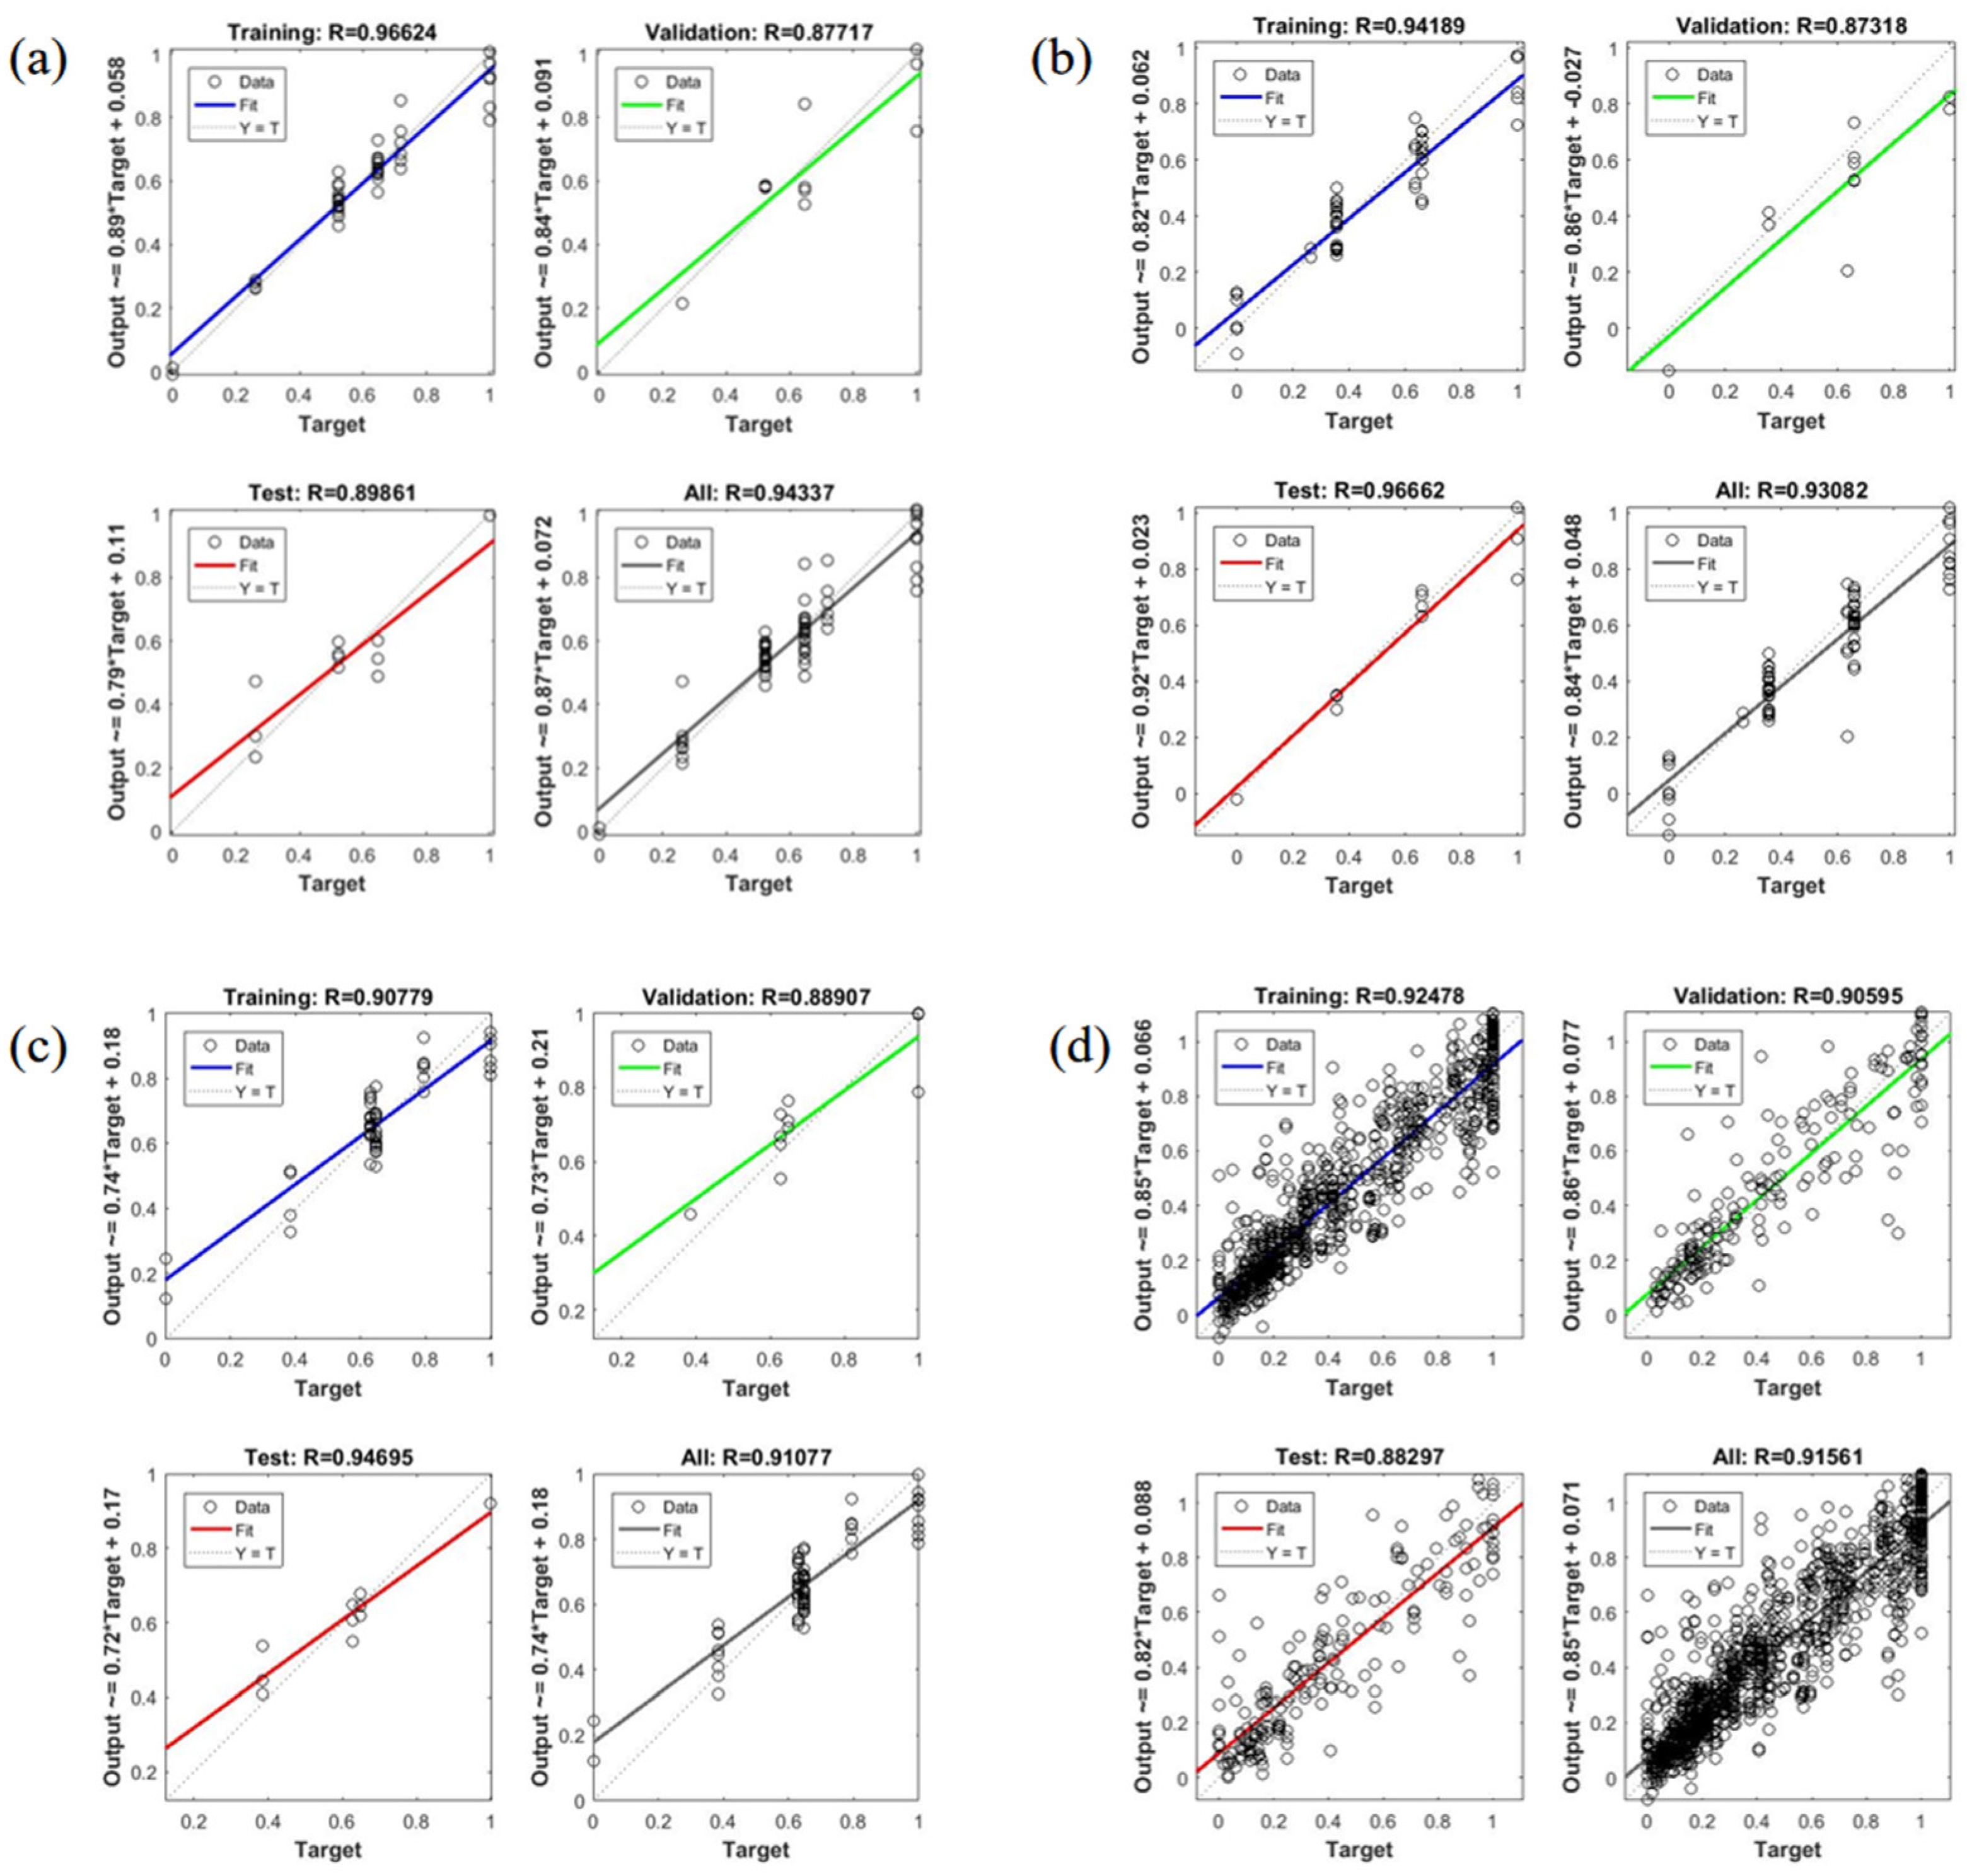
During the training process, we consistently compared the perf values and R-values of various models. Through these experiments, we ultimately determined that the optimal number of hidden layer nodes is 12. The overall feeling-oriented realism rapid evaluation model utilizes the overall feeling score from subjective evaluations as the output vector for the BP neural network. This model ultimately identifies an optimal configuration with a performance (perf) of 0.0055 and an overall R value of 0.94337. Additionally, a rapid realism evaluation model focused on the degree of drape uses the score of the degree of drape from subjective evaluations as its output vector. The optimal model for this evaluation was determined to have a performance of 0.0122 and an overall R value of 0.93082. Furthermore, a realism model oriented by the overhang form facilitates a quick evaluation process. The output vector for this model is the score of the overhang form derived from subjective evaluations, with the optimal configuration identified as having a performance of 0.0071 and an overall R value of 0.91077.
The realistic optimization model employs the average value of the virtual fabric drape index as the input layer of the BP neural network. It utilizes the drape coefficient, wave number, maximum peak amplitude, minimum peak amplitude, maximum peak angle, minimum peak angle, peak amplitude uniformity, and peak angle uniformity as the eight data items forming the input vectors of the BP neural network. The virtual fabric’s physical attributes, including weft strength, warp strength, diagonal tension, bending strength in the weft, bending strength in the warp, and density, comprise the six items of data used as the output vector of the BP neural network. The model features one intermediate hidden layer, resulting in a three-layer BP neural network structure. The sample size for both the input and output layers is 213. Ultimately, it is determined that the optimal model consists of 10 hidden layer nodes, with a performance (perf) of 0.0169 and an overall R value of 0.91561. The regression-fitting diagram of the specific evaluation model is shown in Figure 7.

3. Results and Discussion

3.1. Paired t-Tests

Table 5 presents the paired t-test results comparing the drape metrics between the virtual and real fabrics, including mean, standard deviation, t-value, p-value (two-tailed), and Cohen’s d. For seven pairs (F2–F1, N2–N1, MaxWC2–MaxWC1, MinWC2–MinWC1, MaxCA2–MaxCA1, CVR2–CVR1, CVA2–CVA1), the pp-values were ≤ 0.05, which led to the rejection of the null hypothesis (H0: no mean difference). According to Cohen’s (1988) [29] criteria, F2–F1 (d = 0.973) and MinWC2–MinWC1 (d = 0.876) exhibited large effects, and N2–N1 (d = 0.500) showed a medium effect. Moreover, negative d values, such as MaxCA2–MaxCA1 (d = −0.727) and CVA2–CVA1 (d = − 0.832), indicated lower values in virtual fabrics. However, MinCA2–MinCA1 was an exception (p = 0.215, d = 0.148), indicating no significant difference in the minimum wave crest angles.

3.2. Results of Fuzzy Clustering Classification

The results of the fuzzy cluster analysis on the drape coefficient F are presented in Table 6. It is concluded that the fuzzy cluster center values for the drape coefficient are 8.35, 22.70, and −2.66, respectively. There are 45 types of fabric samples corresponding to Category 1, 10 types corresponding to Category 2, and 16 types corresponding to Category 3. Building on this classification, further subdivisions are made based on the seven index data that characterize the overhang form. Testing reveals that, when the number of subdivision categories for each major category is set to two, the characteristics of the subdivision categories are relatively distinct, with minimal overlap among these characteristics. Consequently, the samples were ultimately divided into six categories. For each drape index difference, the samples were sorted to identify the maximum and minimum values, which were then used to establish the tolerance range for each drape index difference within the subdivision categories. The resulting tolerance ranges for each indicator difference across the six subdivision categories are summarized in Table 7.

3.3. Subjective Evaluation Results

In the subjective evaluation score, a five-level scale was employed to assess the realism of the virtual circle skirt drape effect. The specific scales are presented in Table 8. This article examines the software simulation effect based on two dimensions: the realism evaluation level and the fabric composition. The subjective evaluation results are detailed in Table 9, where the evaluations are categorized into grades, with the scores incremented by 0.5. The total scores are classified into four levels. Specifically, the degree of realism of the virtual fabric drape effect in Category 3.2 is rated between 4.0 and 4.5 points (inclusive), which is defined as Level 1. The degree of realism for the virtual fabric drape effects in Categories 3.1 and 1.1 is rated between 3.5 and 4.0 points (inclusive of 3.5 points), categorized as Level 2. The realism of the virtual fabric drape effect in Category 1.2 is rated between 3.0 and 3.5 points (inclusive), defined as Level 3. Finally, the degree of realism of the virtual fabric drape effects in Categories 2.1 and 2.2 is rated between 2.5 and 3.0 points, which is classified as Level 4.
According to the fabric subdivision categories and the types of fabrics included, among the 71 test fabrics, there are a total of 27 types that contain rayon (viscose) components, with 16 types having a higher content of rayon (viscose) than other ingredients. Among these 16 fabrics, 5 belong to Category 1.1, 10 to Category 1.2, and 1 to Category 2.2. In total, Category 1 accounts for 93.75% of these fabrics, while Category 2 accounts for 6.25%. Overall, CLO effectively simulates fabrics containing rayon (viscose). In contrast, cotton, polyester, linen, Tencel, spandex, and metallic fibers have minimal impact, whereas nylon significantly affects the simulation. Additionally, there are 28 types of fabrics containing cotton, with 25 types having cotton content greater than or equal to that of other ingredients. Among these 25 fabrics, Category 1 comprises 40.00%, Category 2 comprises 12.00%, and Category 3 comprises 48.00%. Generally, CLO effectively simulates fabrics containing cotton. Overall, rayon, polyester, linen, modal, spandex, polyurethane, and Tencel have a minimal impact, while nylon has a significant effect. There are six types of fabrics containing linen components, of which five types have a higher linen content than other components. Among these five types, Category 1 accounts for 60.00%, while Category 3 accounts for 40.00%. Generally speaking, CLO simulates fabrics containing linen effectively, whereas cotton and rayon (viscose) have a lesser impact on this simulation. Additionally, there are 17 types of fabrics containing polyester, of which 13 have a greater polyester content than other ingredients. Category 1 accounts for 84.62%, and Category 3 accounts for 15.38%. Overall, CLO simulates fabrics with polyester well, while cotton, rayon (viscose), spandex, modal, island fiber, nylon, and others have a minimal impact on the simulation. Furthermore, there are eight types of fabrics containing nylon components, with five types exhibiting a higher nylon content than other components. Category 1 accounts for 20.00%, and Category 2 accounts for 80.00%. Overall, CLO’s simulation of fabrics containing nylon components is poor.
In summary, the three-dimensional virtual fitting software effectively simulates the virtual fabric drape effects of cotton, linen, rayon, and polyester fabrics, but the simulation of nylon fabrics is inadequate. However, this observation reflects a general trend rather than a definitive conclusion. As many fabrics in our dataset are fiber blends, isolating the contribution of a single fiber type to the simulation result is challenging. Therefore, we do not argue that the predominant fiber composition is the most significant factor affecting drape realism. Instead, fiber type may be one of several contributing factors, alongside weight, thickness, weave, and post-processing. Future research using single-fiber fabrics under controlled conditions is needed to explore the independent effects of fiber composition.

3.4. Prediction Models Verification of BP Neural Network

We utilized the differences to validate the photorealistic optimization model. Seven fabrics were selected as verification samples, and the drape index data for these seven fabrics were obtained from eight real fabric samples. The model was employed to derive the corresponding virtual fabric physical attribute values, which were then adjusted in the three-dimensional virtual fitting software. The virtual fabric drape simulation was conducted again, and MATLAB was used to generate images of the drape index data. Subsequently, the differences between the simulated and real fabric drape index data were calculated. The rapid evaluation model was applied to obtain a score, which was then compared to the previous score to assess any improvements, thereby verifying the effectiveness of the realism optimization model. The specific verification process is illustrated in Figure 8.
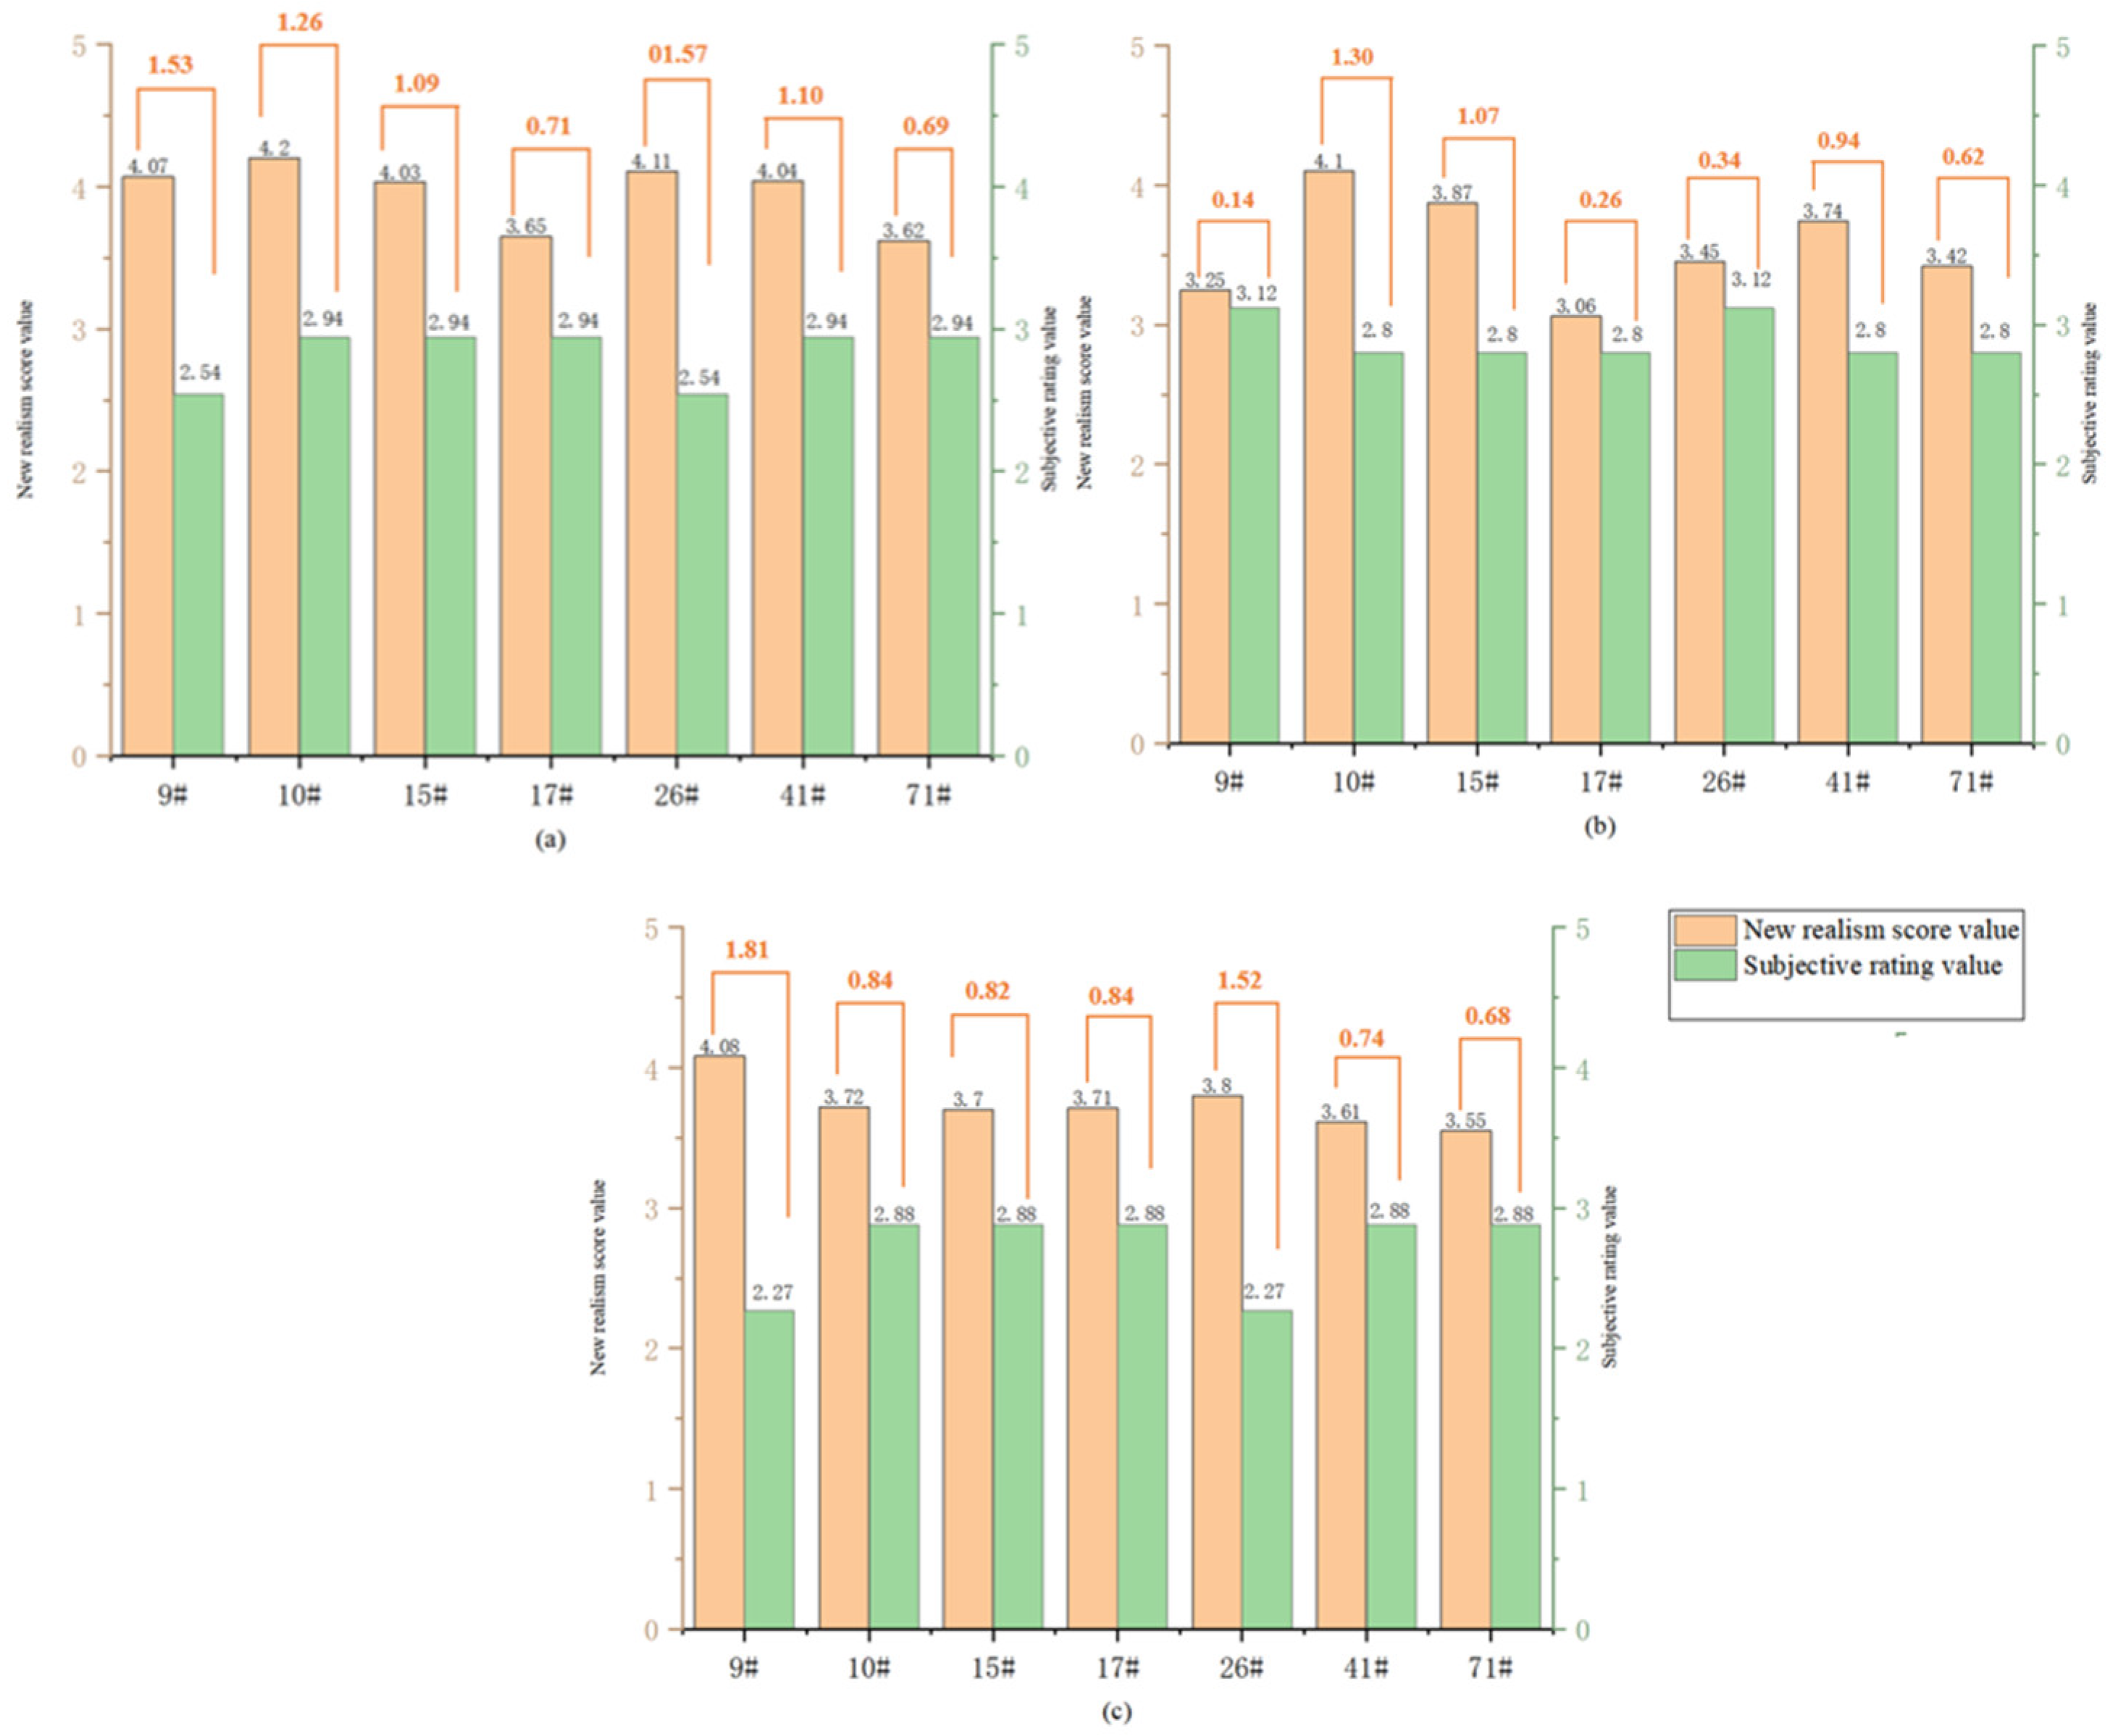
Table 10 presents the optimized drape effect diagram for the seven fabrics. The difference between the virtual drape index data obtained using MATLAB and the actual fabric drape index data is detailed in Table 11. After inputting these differences into the realistic optimization model, three sets of corresponding new realistic scores were obtained. These scores were then compared with the original three sets of subjective scores, which were based on overall feeling, degree of drape, and form of drape. The results, as shown in Figure 9, indicate that both differences are positive, suggesting that the developed virtual fabric drape effect realism optimization model effectively achieves the goal of enhancing the realism of virtual fabric drape effects.

4. Limitations

This study has several limitations that warrant consideration. First, during the drapability testing of real fabrics, only one specimen per fabric was cut for evaluation, which may introduce potential variability due to limited sample replication. Future studies should incorporate multiple specimens per fabric to enhance the reliability and generalizability of results. Second, the simulation validation was confined to comparing the predicted values from the rapid evaluation model with real fabric measurements. To further validate the realism-optimized model, subjective assessments should be conducted if time permits. Additionally, the sample size of the evaluators in subjective assessments was relatively small; expanding the participant pool would improve the statistical robustness of subjective evaluations. Finally, the fabrics tested in this study were primarily cotton, linen, rayon, polyester, and nylon. In future research, the scope could be expanded to include a broader range of textile types, thereby enhancing the model’s applicability across diverse material categories. Additionally, in-depth investigations could be undertaken to explore further the underlying causes of the inadequate simulation performance observed for nylon fabrics in this study.

5. Conclusions

From the perspective of sustainable development, this research offers new support for the digital transformation of the garment industry, significantly enhancing the efficiency of clothing design and development while simultaneously reducing the negative environmental impact of the fashion industry. Additionally, it enhances the realism of virtual fabrics and garments, which holds significant importance for the subsequent digital transformation and the advancement of 3D virtual technology. In the future, as 3D virtual technology matures, it can effectively reduce textile waste generated during the stages of clothing research and development, production, and marketing, thereby alleviating the pressure on recycling and resource wastage within the fashion industry.
This article examines the disparity between virtual fabric drape and actual fabric. Utilizing data from eight drape indices, the realism of the virtual fabric drape effect is categorized into six levels through paired sample t-tests and fuzzy classification. Six representative fabrics were selected for production, and subjective evaluation experiments were conducted on both real and virtual round skirts. The simulation effectiveness of the software was assessed from two perspectives: the level-of-realism evaluation and fabric composition. A five-point scale was used to evaluate the realism of the virtual fabric drape effect, enabling the determination of the evaluation-grade threshold range.
Finally, this paper introduces the use of a BP neural network to create three dimensions—overall feeling, overhang degree, and overhang shape—based on clustering results. It develops a rapid evaluation model for assessing the realism of the drape effect of virtual fabrics, as well as a realism optimization model for this effect. Seven representative fabrics, characterized by relatively poor realism in subjective evaluations, were selected. The drape index data for these real fabrics were input into the photorealistic optimization model, utilizing 3D virtual software and MATLAB to determine the differences between the new virtual fabric drape index and the real fabric. This data was then input into three rapid evaluation models. The results indicated that the realism scores produced by the rapid evaluation models showed improvement compared to the original subjective scores, demonstrating the effectiveness of the photorealistic optimization models for the virtual fabric drape effects developed in this study. This indicates that the proposed realism evaluation and optimization process for virtual fabric drape effects is feasible and holds significant reference value for the realism evaluation and optimization of other three-dimensional virtual fitting software.

Author Contributions

Methodology, Q.C.; Resources, F.F.; Writing—original draft, R.W. All authors have read and agreed to the published version of the manuscript.

Funding

This research received no external funding.

Institutional Review Board Statement

Not applicable.

Informed Consent Statement

Not applicable.

Data Availability Statement

Data are contained within the article.

Conflicts of Interest

The authors declare no conflict of interest.

References

  1. Marin, I. Research regarding new sustainable methods of garment pattern drafting. J. Text. Eng. Fash. Technol. 2022, 8, 140–143. [Google Scholar] [CrossRef]
  2. Fan, W.; Wang, Y.; Liu, R.; Zou, J.; Yu, X.; Liu, Y.; Zhi, C.; Meng, J. Textile production by additive manufacturing and textile waste recycling: A review. Environ. Chem. Lett. 2024, 22, 1929–1987. [Google Scholar] [CrossRef]
  3. Bertola, P.; Teunissen, J. Fashion 4.0. Innovating fashion industry through digital transformation. Res. J. Text. Appar. 2018, 22, 352–369. [Google Scholar] [CrossRef]
  4. Pal, R.; Jayarathne, A. Digitalization in the textiles and clothing sector. In The Digital Supply Chain; Elsevier: Amsterdam, The Netherlands, 2022; pp. 255–271. [Google Scholar]
  5. Bottino, A.; Laurentini, A.; Scalabrin, S. Quantitavely Comparing Virtual and Real Draping of Clothes. 2001. Available online: http://wscg.zcu.cz/wscg2001/Papers_2001/R159.pdf (accessed on 10 June 2025).
  6. Wang, H.; Hecht, F.; Ramamoorthi, R.; O’Brien, J.F. Example-based wrinkle synthesis for clothing animation. In Proceedings of the ACM SIGGRAPH 2010 Papers, Los Angeles, CA, USA, 26–30 July 2010; pp. 1–8. [Google Scholar]
  7. Kim, D.-E.; LaBat, K. An exploratory study of users’ evaluations of the accuracy and fidelity of a three-dimensional garment simulation. Text. Res. J. 2013, 83, 171–184. [Google Scholar] [CrossRef]
  8. Chang, W.; Xu, X. Research on design thinking of pleated clothing inspired by fractal geometry. Int. J. Cloth. Sci. Technol. 2025, 37, 22–47. [Google Scholar] [CrossRef]
  9. Petrak, S.; Mahnić Naglić, M.; Rogale, D.; Geršak, J. Analysis of polygonal computer model parameters and influence on fabric drape simulation. Materials 2021, 14, 6259. [Google Scholar] [CrossRef]
  10. Peirce, F.T. 26—The “handle” of cloth as a measurable quantity. J. Text. Inst. Trans. 1930, 21, T377–T416. [Google Scholar] [CrossRef]
  11. Youn, S.; Knowles, C.G.; Mills, A.C.; Mathur, K. Comparative study of physical and virtual fabric parameters: Physical versus virtual drape test using commercial 3D garment software. J. Text. Inst. 2025, 116, 33–46. [Google Scholar] [CrossRef]
  12. Liu, C.; Feng, H. Real performance analysis of drape of virtual cotton fabric based on Style3D. Int. J. Cloth. Sci. Technol. 2025, 37, 48–59. [Google Scholar] [CrossRef]
  13. Kim, J.H.; Lee, J.S. Investigating parameters affecting the real and virtual drapability of silk fabrics for traditional Hanbok. Fash. Text. 2024, 11, 21. [Google Scholar] [CrossRef]
  14. Lu, X.; Zhu, H.; Wang, X. Comparative study on drapability of virtual silk fabrics. J. Silk 2022, 59, 38–45. [Google Scholar]
  15. Buyukaslan, E.; Jevsnik, S.; Kalaoglu, F. Comparative analysis of drape characteristics of actually and virtually draped fabrics. Int. J. Cloth. Sci. Technol. 2018, 30, 286–301. [Google Scholar] [CrossRef]
  16. Wang, P.; Liu, J. Method of fabric drape test based on 3D scanning technology. J. Silk 2018, 55, 25–30. [Google Scholar]
  17. Kim, H.-A.; Ryu, H.-S.; Lee, J.-H.; Nam, Y.-J. A study on the comparing visual images between the real garment and the 3D garment simulation of flare skirts. Sci. Emot. Sensib. 2011, 14, 385–394. [Google Scholar]
  18. Buyukaslan, E.; Kalaoglu, F.; Jevsnik, S. Drape simulation and subjective assessment of virtual drape. IOP Conf. Ser. Mater. Sci. Eng. 2017, 254, 162002. [Google Scholar] [CrossRef]
  19. Grieves, M. Digital twin: Manufacturing excellence through virtual factory replication. White Pap. 2014, 1, 1–7. [Google Scholar]
  20. Tao, F.; Qi, Q.; Wang, L.; Nee, A. Digital twins and cyber–physical systems toward smart manufacturing and industry 4.0: Correlation and comparison. Engineering 2019, 5, 653–661. [Google Scholar] [CrossRef]
  21. Hu, J.; Chan, Y.-F. Effect of fabric mechanical properties on drape. Text. Res. J. 1998, 68, 57–64. [Google Scholar] [CrossRef]
  22. Shao, Y. The Study on Relationship between Drape Aesthetic Perception and Property of Mechanics. Master’s Thesis, Zhejiang Sci-Tech University, Hangzhou, China, 2011. [Google Scholar]
  23. Wang, X. Simulation of Drapability of 3D Virtual Fabric Based on BP Neural Network. Master’s Thesis, Zhejiang Sci-Tech University, Hangzhou, China, 2022. [Google Scholar]
  24. GB/T 23329-2009; Textiles—Determination of Drapability of Fabrics. China Textile Industry Association: Beijing, China, 2009.
  25. Bhatti, N.B.; Siyal, A.A.; Qureshi, A.L.; Bhatti, I.A. Socio-economic impact assessment of small dams based on t-paired sample test using SPSS software. Civ. Eng. J. 2019, 5, 153–164. [Google Scholar] [CrossRef]
  26. Bezdek, J.C.; Ehrlich, R.; Full, W. FCM: The fuzzy c-means clustering algorithm. Comput. Geosci. 1984, 10, 191–203. [Google Scholar] [CrossRef]
  27. Zhang, W. Pattern Making for Fashion Design; China Textile & Apparel Press: Beijing, China, 2006; p. 321. [Google Scholar]
  28. Liang, J.; Zhou, J.; Hu, X.; Luo, H.; Cao, G.; Liu, L.; Xiao, K. Digital Grading the Color Fastness to Rubbing of Fabrics Based on Spectral Reconstruction and BP Neural Network. J. Imaging 2023, 9, 251. [Google Scholar] [CrossRef] [PubMed]
  29. Cohen, J. The Effect Size. Statistical Power Analysis for the Behavioral Sciences; Routledge: Abingdon, UK, 1988; pp. 77–83. [Google Scholar]
Figure 1. (a) The significance of real fabric evaluation; (b) the significance of virtual fabric evaluation.
Sustainability 17 05550 g001
Figure 2. The production process of virtual fabric.
Sustainability 17 05550 g002
Figure 3. Schematic diagram of the XDP-1 drape tester instrument and the three grain line directions during testing.
Sustainability 17 05550 g003
Figure 4. The virtual drape test process includes (a) device simulation and (b) image acquisition and processing.
Sustainability 17 05550 g004
Figure 5. The process of creating the real skirt and virtual skirt for subjective evaluation.
Sustainability 17 05550 g005
Figure 6. BP neural network structure diagram.
Sustainability 17 05550 g006
Figure 7. Regression-fitting graph of the realistic rapid evaluation model oriented to the (a) overall perception; (b) drape degree; (c) and drape shape; (d) regression-fitting diagram for optimizing the realistic effect of virtual fabric hanging.
Sustainability 17 05550 g007
Figure 8. The verification process of a photorealistic optimization model.
Sustainability 17 05550 g008
Figure 9. New realism score, raw score, and difference based on (a) overall perception; (b) drape degree; (c) and drape shape.
Sustainability 17 05550 g009
Table 1. Some typical varieties of clothing fabrics.
FabricVarietySuitable Clothing
CottonPoplin—plain weave, small figured plain weaveShirts, trousers, jackets, outerwear, etc
CottonKhaki—twill about 70°Outerwear such as trench coats
CottonCorduroy—weft double layer, soft handfeel, clear grain, round and plump ridgesAll kinds of men’s and women’s clothing and apparel items
SilkChiffonSummer fabric
NylonNylonDown jacket
Table 2. Partial testing sample information.
NumberFabric CompositionWeight (g/m²)NumberFabric CompositionWeight (g/m²)
1#100% Viscose Rayon13337#98% Rayon, 2% Silver Thread109
2#100% Polyester6338#50% Cotton, 50% Tencel138
3#80% Rayon, 20% Silk19339#100% Tencel172
4#100% Silk8440#60% Cotton, 40% Polyester127
5#95% cotton, 5% polyurethane (PU faux leather)10441#100% Cotton100
Table 3. Fabric drape index data.
NumberTest TypeF
(%)
NMaxCR
(cm)
MinCR
(cm)
MaxCA
(deg)
MinCA
(deg)
CVR
(%)
CVA
(%)
1#Real fabric drape test17.7883.212.27126.8461.4211.0826.30
Virtual drape test33.1574.373.79117.5074.775.2215.94
2#Real fabric drape test10.6782.421.85107.8283.129.578.93
Virtual drape test17.75113.401.7288.1246.4017.6119.11
3#Real fabric drape test10.8582.311.61104.4873.7711.2712.29
Virtual drape test17.5493.502.6494.8073.779.849.26
4#Real fabric drape test17.9873.572.73118.5088.1210.2711.93
Virtual drape test22.1483.653.0897.8083.455.855.34
5#Real fabric drape test67.2275.464.87140.1969.103.7226.39
Virtual drape test70.2275.625.00129.1870.103.8222.47
Table 4. Representative fabrics for each category.
CategoryFabric NumberReal FabricVirtual FabricCategoryFabric NumberReal FabricVirtual Fabric
1.14#Sustainability 17 05550 i001Sustainability 17 05550 i0022.29#Sustainability 17 05550 i003Sustainability 17 05550 i004
1.21#Sustainability 17 05550 i005Sustainability 17 05550 i0063.150#Sustainability 17 05550 i007Sustainability 17 05550 i008
2.117#Sustainability 17 05550 i009Sustainability 17 05550 i0103.28#Sustainability 17 05550 i011Sustainability 17 05550 i012
Table 5. Paired samples test.
Paired DifferencestdfSig.
(2-Tailed)
d
MeanStd. DeviationStd. Error Mean95% Confidence Interval of the Difference
LowerUpper
1F2–F18.165498.392630.996026.1789910.152008.198700.0000.973
2N2–N10.6341.2680.1500.3340.9344.213700.0000.500
3MaxWC2–MaxWC10.283800.586580.069610.144960.422644.077700.0000.484
4MinWC2–MinWC10.557040.636110.075490.406480.707617.379700.0000.876
5MaxCA2–MaxCA1−20.5822528.309623.35973−27.28303−13.88148−6.126700.000−0.727
6MinCA2–MinCA13.8808526.144893.10283−2.3075510.069241.251700.2150.148
7CVR2–CVR1−3.541274.042920.47981−4.49821−2.58432−7.381700.000−0.876
8CVA2–CVA1−7.362548.852091.05055−9.45779−5.26728−7.008700.000−0.832
Table 6. Clustering centers and corresponding fabric samples of the three major categories.
CategoryCluster CenterThreshold RangeCorresponding Fabric Sample
Category 18.347930295654423.000~15.3701#, 2#, 3#, 4#, 5#, 6#, 7#, 11#, 12#, 13#, 14#, 16#, 19#, 20#, 21#, 22#, 23#, 24#, 25#, 27#, 28#, 29#, 30#, 32#, 33#, 34#, 35#, 37#, 39#, 43#, 45#, 49#, 52#, 53#, 54#, 57#, 59#, 61#, 63#, 64#, 65#, 66#, 68#, 69#, 70#
Category 222.699576004254417.988~30.1109#, 10#, 15#, 17#, 18#, 26#, 31#, 41#, 58#, 71#
Category 2−2.65507031633409−11.037~2.5988#, 36#, 38#, 40#, 42#, 44#, 46#, 47#, 48#, 50#, 51#, 55#, 56#, 60#, 62#, 67#
Table 7. Tolerance range of 8 indicators corresponding to each segmentation category.
CategoryF
(%)
NMaxCR
(cm)
MinCR
(cm)
MaxCA
(deg)
MinCA
(deg)
CVR
(%)
CVA
(%)
Category 1.13.757~13.7670.333~3.333−0.214~1.184−0.263~1.055−74.771~−9.680−36.718~20.028−14.432~8.046−27.784~12.695
Category 1.23.000~15.370−2.000~0.667−0.005~1.2890.046~1.524−29.040~54.075−4.673~66.426−10.172~2.321−20.738~9.940
Category 2.117.988~30.110−1.000~2.333−0.061~1.4210.443~1.666−104.478~27.038−39.722~26.036−8.937~−1.626−20.961~11.484
Category 2.224.851~29.472−3.000~−1.0000.506~2.0341.382~2.775−0.668~17.02477.107~106.481−8.195~−6.841−32.433~−26.797
Category 3.1−4.202~2.013−1.000~1.000−0.311~0.301−0.108~0.498−29.708~16.022−16.690~26.036−3.644~0.012−11.837~6.006
Category 3.2−11.037~2.5980.667~2.667−1.054~0.122−0.832~0.192−74.771~−37.385−26.370~9.346−10.377~2.644−19.279~−4.386
Table 8. A 5-level subjective evaluation scale for the realism of the drape effect of virtual circular skirts.
Score12345
Corresponding meaningPoorFairacceptableGoodExcellent
Table 9. The subjective evaluation results.
Fabric NumberEvaluation AspectResult (Average Value)Fabric NumberEvaluation AspectResult (Average Value)
4#Overall Feeling3.531#Overall Feeling3.34
Degree of Draping3.60Degree of Draping3.23
Draping Form3.27Draping Form3.30
17#Overall Feeling2.949#Overall Feeling2.54
Degree of Draping2.80Degree of Draping3.12
Draping Form2.88Draping Form2.27
50#Overall Feeling3.648#Overall Feeling4.07
Degree of Draping3.57Degree of Draping4.01
Draping Form3.53Draping Form3.86
Table 10. Seven kinds of fabrics to re-simulate drape renderings.
NumberInitial Simulated Drape RenderingsSimulated Drape Renderings After Optimization
9#Sustainability 17 05550 i013Sustainability 17 05550 i014
10#Sustainability 17 05550 i015Sustainability 17 05550 i016
15#Sustainability 17 05550 i017Sustainability 17 05550 i018
17#Sustainability 17 05550 i019Sustainability 17 05550 i020
26#Sustainability 17 05550 i021Sustainability 17 05550 i022
41#Sustainability 17 05550 i023Sustainability 17 05550 i024
71#Sustainability 17 05550 i025Sustainability 17 05550 i026
Table 11. The differences between the drape index data of 8 virtual fabrics and 7 real fabrics are analyzed to verify the model.
NumberF (%)NMaxCR (cm)MinCR (cm)MaxCA (deg)MinCA (deg)CVR (%)CVA (%)
9#−13.1600.010.19−16.0214.35−0.03−10.66
10#−1.373−0.27−0.39−69.10−47.730.22−0.62
15#2.292−0.160.02−47.07−51.07−1.924.87
17#−7.1500.070.1515.6922.03−0.22−4.08
26#−3.0310.06−0.79−65.4216.028.32−25.71
41#0.863−0.48−0.12−59.08−42.06−3.76−0.83
71#−1.4710.220.14−15.35−2.00−0.43−2.78
Disclaimer/Publisher’s Note: The statements, opinions and data contained in all publications are solely those of the individual author(s) and contributor(s) and not of MDPI and/or the editor(s). MDPI and/or the editor(s) disclaim responsibility for any injury to people or property resulting from any ideas, methods, instructions or products referred to in the content.