Article

Can the Urea Fatty Fraction Support Sustainable Agriculture in the Improvement of Soil Properties?

by
Barbara Filipek-Mazur
1,
Barbara Wiśniowska-Kielian
1,
Leszek Wojnar
2 and
Krystyna Ciarkowska
3,*
1
Department of Agricultural and Environmental Chemistry, University of Agriculture in Krakow, Av. Mickiewicz Adam 21, 31-120 Krakow, Poland
2
Department of Applied Informatics, University of Technology, Av. Jana Pawła II 37, 31-864 Krakow, Poland
3
Department of Soil Science and Agrophysics, University of Agriculture in Krakow, Av. Mickiewicz Adam 21, 31-120 Krakow, Poland
*
Author to whom correspondence should be addressed.
Sustainability 2025, 17(12), 5529; https://doi.org/10.3390/su17125529
Submission received: 9 May 2025 / Revised: 10 June 2025 / Accepted: 13 June 2025 / Published: 16 June 2025

Abstract

One of the assumptions of the circular economy is the introduction of nitrogen (N) fertilizers into soil in the form of by-products, such as urea fatty fraction (UFF). Another recommended sustainable agriculture treatment is to plough post-harvest straw into soil to improve the organic matter (OM) balance. We aimed to verify the efficacy of UFF as a N fertilizer applied with wheat or rape straw by examining its effect on the total carbon and N contents, pH, enzyme activity, OM mineralization and stabilization of soil. For this, we conducted a 120-day-long incubation experiment in which we compared the effect of UFF fertilizer applied with urea (both with and without a Ure inhibitor) on soil properties. Our main findings were that UFF acidified the soil (pH was lowered to 5.93) more than the urea (pH was above 6). Both fertilizers administered with straw slightly increased the soil carbon (to above 14 g kg1) and N contents (to around 1.4 g kg−1) compared to the control treatment and caused an increase in enzyme activity at the beginning of the experiment, followed by a gradual decrease. The UFF application accelerated the OM decomposition, although urea had a more stabilizing effect on the OM expressed by larger (above 16%) areas occupied by stable, aggregated OM than UFF (below 10%). We concluded that UFF can replace urea as an environmentally friendly N fertilizer, and that it has a similar effect to urea on soil properties.

1. Introduction

The circular economy is a business model that aims to minimize the consumption of raw materials and the generation of waste, to rationally use resources and reduce the negative impacts of manufactured products on the environment, and also keep manufactured products in circulation for as long as possible [1].
Nitrogen (N) is a plant nutrient that determines the size and quality of crops, and that also has a major effect on the environmental components of air, water and soil. Although rational N fertilization positively affects plant yield, improperly conducted agro-technical procedures and unjustifiably high doses of N can disrupt the proper functioning of agro-ecosystems [2,3]. The fertilizer market offers a wide range of products containing N. These include single- and multi-component mineral fertilizers, natural fertilizers in solid or liquid form, and organic fertilizers. To maintain a healthy natural environment, N fertilizers should be used in gradual-release form. Urea is one such fertilizer, especially when used in tandem with a urease (Ure) inhibitor, and this has led to the release-to-market of a fat fraction of urea (urea fatty fraction, UFF). Urea fatty fraction is a by-product of the extraction of fatty acids from fish and the production of polyunsaturated fatty acid concentrates. It has been certified in Denmark for use as a fertilizer. In Poland, it has been approved for circulation in accordance with Article 5 of the Fertilizers and Fertilization Act (Journal of Laws of 2024, item 105 [4]), based on a provision introducing the principle of the mutual recognition of products approved for circulation in another EU Member State while maintaining standards of quality appropriate for domestic fertilizers. Urea fatty fraction fertilizer is crystalline in form and is made up of about 73% urea, which corresponds to 33% N, 22% ethyl esters and 5% ethanol. It can be applied in the form of a powder or a solution [5]. Its application, similarly to other fatty acids, may increase soil electrolytic conductivity (EC) [6]. The increase in the EC usually means the increase in soluble salts in the soil; therefore, a potential risk of a regular use of UFF is salinization and the lowering of the soil water content. UFF was also found to enhance the soil acidity [6], which may affect soils positively or negatively depending on their original pH values. Regular use of UFF on slightly acidic soils may lead to their further acidification, with all negative consequences regarding soil properties resulting in their low agricultural productivity. However, the introduction of fatty acids into the slightly alkaline soil may increase solubility and availability of phosphorous, leading to an increase in plant growth, and fatty acids may act as washing agents, helping in the remediation of soil contaminated with vanadium and chromium [6]. UFF and other fatty acids are known to affect total nitrogen and carbon contents in soils. Their influence on soil C and N reflects their effect on the activity of enzymes, usually serving as substrates for microbes; however, some of them can inhibit the microbial activity, followed by changes in the soil organic matter formation, decomposition and stabilization [5,7].
UFF is also recommended to apply to straw left in the field, which improves the C:N ratio, accelerates its mineralization process and prevents N immobilization in the soil [7]. The introduction of straw into the soil, which contains a lot of C compounds, with a C:N ratio of 60–100:1, stimulates the development of soil microorganisms. They consume N from the decomposition of the straw, and also the N contained in the soil, which results in the biological immobilization of N [8].
The use of straw depends on the needs of the farm and when there is a surplus, it becomes a marketable product. The importance of, and directions for using, straw have changed over the years and show regional differences [9,10]. In order to improve the soil properties, it is justified to leave cereal straw and straw from other crops, such as rape, in the field and plough it in. Based on the literature, after harvesting cereal plants, 3–5 Mg ha−1 d.m. of residues (straw, chaff, roots) is left behind; after maize grown for grain, this is 10–15 Mg ha−1 d.m., and after winter rape, 10–12 Mg ha−1 d.m. [11,12]. The dynamics of the decomposition of cereal straw are determined by its chemical properties in addition to the soil and climatic conditions. Cereal straw contains significant amounts of cellulose and hemicellulose, so it is a source of easily available C, which stimulates the development of microorganisms [13]. Farms focused on rape production do not have livestock and, in this situation, rape straw should be ploughed in first. Rape straw contains up to several dozen percent more N than cereal straw and, when ploughing it in, additional fertilization with this component is not necessary, although it can stimulate its decomposition. It has been found that ploughing-in post-harvest straw improves the physicochemical properties of the soil, including the pH, organic C, N, phosphorus (P) and potassium (K) contents—and in the case of rape straw, also sulphur (S)—thus enriching the soil with nutrients and organic matter (OM) [14,15,16,17].
The stages of OM decomposition can be evaluated at the microscopic level through the differences in the OM components of colour, opacity and birefringence [18]. In addition to optical microscopy, a quantitative analysis of the amount of soil OM and the proportion of soil aggregates and plant residues can be performed using scanned images [19]. Establishing the degree of the OM decomposition provides insights into its turnover, which is essential for evaluating soil management practices [20]. Despite their relevance, qualitative and quantitative studies on organic residue decomposition at the micro-scale are rarely performed in agro-environmental research, especially when combined with soil enzyme activity analysis, particularly when assessing whether the use of fertilizers has been carried out in an environmentally sustainable manner.
For this reason, we aimed to assess the effect of urea and UFF fertilizers, used exclusively or together with a Ure inhibitor, on the rate of the transformation of OM from wheat and rape straw based on changes in the soil enzyme activity, pH and total C and N contents, as well as the degree of OM decomposition, determined from micromorphological studies.
We hypothesized that (1) the introduction of UFF into the soil would increase the accumulation of C and N more than applying urea, and (2) the straw introduced into the soil would decompose faster when accompanied by UFF rather than urea.

2. Materials and Methods

2.1. Soil Material Used in the Incubation Experiment

The study was carried out on soil collected from the 0–25 cm layer of an arable field located at the experimental station of the University of Agriculture in Krakow-Mydlniki, Poland (50°19′ N 19°16′ E). The soil was a Eutric Cambisol, derived from Pleistocene sand lying on Jurassic limestone, and had a sandy loam texture (with 64% of sand, 29% of silt and 7% of clay [21,22]). The soil had a pH value measured in water of 6.81, a total C and N content of 13.07 and 1.30 g kg−1 d.m., respectively, an available P content of 72.5 mg P kg−1 d.m, an available K content of 200 mg kg−1 d.m, a cation exchange capacity (CEC) of 229 mmol (+) kg−1 d.m and a maximum water capacity of 29%.

2.2. Incubation Condition

The research was conducted in an incubation experiment under laboratory conditions. The incubation experiment allowed for the verification of the transformation of nutrients and organic matter in the soil, as well as the enzyme activity. In the discussed experiment, plants were not cultivated. The soil was incubated in plastic boxes, filled with 700 g of soil d.m., and enriched with the appropriate additives based on the experimental design (Table 1) for 120 days. The experiment included nine treatments in three replicates and was conducted in a completely randomized design. The N dose was 0.1 g kg−1 of soil d.m., introduced in the form of UFF fertilizer, and, for comparison of its effects, urea. Wheat and rape straw were used, cut into pieces about 1 cm long and applied in amounts of 6 g kg−1 of soil d.m. MoNoliyth46 was used as a Ure inhibitor at a dose of 0.51 mg kg−1 of soil d.m. in order to limit the ammonification of the urea, thus N was lost in the form of volatilized ammonia.
The containers with soil were kept at a temperature 25 ± 2 °C. Soil humidity was kept at 50% maximum water capacity (MWC). Soil moisture was checked every two days. Distilled water was added based on a mass loss. Samples for the analysis of soil enzyme activity were taken on five days—on the first day of incubation and 30, 60, 90 and 120 days after the start of incubation—and for the determination of pH, C and N contents, on the first day of the experiment and at the end of the incubation (Day 120). The enzyme activity analyses were performed on fresh material. The remaining analyses were performed on air-dried soil sieved through a 2 mm mesh.
Micromorphological studies were performed on thin-sections made from undisturbed samples of soil taken up using Kubiena boxes from selected treatments—control (Crt, no treatment), wheat + urea, wheat + UFF, rape + urea and rape + UFF (Table 1)—at the end of the experiment. In the laboratory, the soil samples were hardened using Araldite® epoxy resin, then cut into slices, glued to a microscope slide and thinned to 30 µm.

2.3. Soil Chemical Analyses

The soil reaction was determined using the potentiometric method in a suspension of the soil with distilled water (m/v 1:2.5), using a CPC-502 multifunctional device (Elmetron, Zabrze, Poland) [23]. The total C and N contents in the soil samples were established through a dry-combustion method using a Vario MAX Cube CNS analyzer (Elementar Analysensysteme GmbH, Langenselbold, Germany) [24].
The CEC was calculated as a sum of basic cations and hydrolytic acidity; both soil properties were determined by the Kappen method. MWC was established by the weight method [25]. The available P and K were extracted according to the modified Egner’s method, using a 0.03-M acetic acid (CH3COOH) buffered solution [26]. The concentrations were estimated with the use of inductively coupled plasma–optical emission spectrometry (ICP–OES, PerkinElmer Optima 7300 DV, Markham, ON, Canada).

2.4. Soil Enzyme Activity

The dehydrogenase activity (DHA) was determined by the soil incubation with a 1.0% 2,3,5-triphenyltetrazolium chloride solution. After incubation (m/v 1:1, 24 h, 30 °C), the obtained 1,3,5-triphenylformazan (TPF) was extracted with methyl alcohol and measured colorimetrically at a wavelength of 485 nm on a DU 640 ultraviolet–visible spectrophotometer (Beckman Instruments, Inc., Fullerton, CA, USA). The results were given as the amount of TPF produced during 24 h of DHA per kilogram of soil [27].
The urease activity (Ure) was determined after the samples had been incubated at 30 °C with a urea solution for 2 h, based on the method described by Kandeler and Gerber [28]. Urea is used as a substrate that is hydrolysed to NH3 by Ure. The measurement was obtained by colorimetry using a Beckman DU 600 spectrophotometer (Beckman, Brea, CA, USA) at a wavelength of 690 nm. The results are given as milligrams of N bound in ammonium ions (NH4+), produced as a result of 2 h of Ure activity per kilogram of soil.
The Inv activity was determined after the soil samples were incubated for 24 h at 37 °C with a sucrose solution as the substrate, which underwent hydrolysis to glucose and fructose. The intensity of the colour was measured in a Beckman DU 600 spectrophotometer at a wavelength of 540 nm [29]. The results are given in milligrams of inverted sugar produced during 24 h of Inv activity per kilogram of soil.

2.5. Micromorphological Methods

Micromorphometry was performed on images obtained from thin sections imaged using an Epson scanner (Seiko Epson Corporation, Suwa, Japan) and converted to TIFF format. Areas of 3.5 × 5.0 cm were processed using the 4800 dpi option with a 0.0053 pixel size. We specifically selected organic material in various stages of decomposition, which we divided into a well-decomposed aggregated category (Macroagg) and a slightly decomposed or undecomposed category—mainly straw residues with recognizable tissue remnants (UndOM). For the identification and quantification of the Macroagg, we applied the fully automatic Otsu method [30], which is useful for evaluating images with bimodal distributions of pixel values representing dark and bright objects (Figure 1). The detection of UndOM was performed by manual thresholding. All the image processing and measurements were performed using the Aphelion version 4.6.0 software package (ADCIS S.A., Inc., Monroe, NJ, USA).
The micromorphological study of the thin sections was performed using a Nikon Eclipse E400 POL optical microscope (Nikon Instruments, Tokyo, Japan) under plane-polarized light (PPL) and cross-polarized light (XPL) at a magnification of 100×. The microscopic observation of small organic components that were not visible in the scans and that showed different degrees of decomposition involved recording their colour, internal structure and opacity in PPL and their birefringence and isotropy in XPL. The detection and description of these features were based on established guidelines for thin-section descriptions [18]. Four classes of OM decomposition were determined, as indicated in Table 2, and the area covered by each OM decomposition stage (expressed as a percentage) was estimated based on the guidelines for soil description [31]. Illustrative photomicrographs were taken using a Moticam Pro S5 camera (Motic Group, Wetzlar, Germany).

2.6. Statistical Analyses

A two-way analysis of variance (ANOVA) was applied to determine differences in the variables (pH values, C and N contents) among the experimental treatments on two days (the 1st and 120th days of the experiment). A one-way ANOVA was used to determine differences in the OM decompositional stages among the selected treatments (Crt, wheat + urea, wheat + UFF, rape + urea, rape + UFF) at the end of the experiment. Prior to the ANOVAs, the normal distribution of the tested variables was verified (Shapiro–Wilk’s test) and a homogeneity of variance was performed (Levene’s test). Owing to the presence of a normal distribution, a parametric variance analysis was applied. In order to estimate the least significant differences between the mean values of homogeneous groups, a post hoc Bonferroni correction was applied (at p < 0.05). Principal component analysis (PCA) was used to determine the relationship between the examined variables (selected soil parameters) and the different treatments. Plotting the soil parameters in a PC1–PC2 plan allowed us to select groups of parameters that correlated with each other and to specify which of these affected the properties of a given treatment. The statistical analyses were conducted using Statistica PL version 13.3 [33] and Canoco 5 [34] software.

3. Results

3.1. Soil Properties

3.1.1. pH Value

On the first day of the experiment, the soil pH value ranged from 6.89 to 7.27, depending on the experimental treatment (Table 3). Soil fertilized with urea or UFF, with the addition of wheat or rape straw, with or without the addition of a Ure inhibitor had significantly higher pH values than the Crt soil. Over the 120 days of incubation, the pH value of the soil in all treatments decreased significantly compared to the initial values, ranging from 5.93 to 6.10, indicating a gradual acidification of the soil. The effect of the urea and UFF fertilizers applied together with the wheat or rape straw on the soil acidification was not significantly different, although the decrease in pH values was greater in the treatments with UFF than in the treatments with urea. The addition of a Ure inhibitor to the UFF fertilizer only slightly limited its acidifying effect. The soil in the treatments with rape straw had a higher pH value than the treatments with wheat straw. The two-way ANOVA showed that the soil pH was most strongly influenced by the incubation time and the interaction of time and the treatments added to the soil. The value of the determination coefficient R2 indicates that the analyzed factors (time, treatment and their interaction) had a significant effect on the pH.

3.1.2. Carbon Content

On the first day of the experiment, the C content of the soil ranged from 13.87 to 16.10 g C kg−1 d.m. (Table 3). After 120 days, the C content had decreased in the soil for all treatments by about 2–10%, ranging from 13.27 to 14.63 g C kg−1 d.m. On the first day of incubation, the addition of wheat or rape straw to the soil increased the C content compared to the C content in the Crt sample, but the differences between treatments were not statistically significant. In the soil of the wheat + urea and wheat + urea + inh treatments, the C contents were lower than in the wheat + UFF and wheat + UFF + inh treatments. The opposite relationship was noted after the application of the rape straw, with the soil of the rape + urea and rape + urea + inh treatments being characterized by higher C contents compared to the analogous treatments but with UFF fertilizer. Similar trends in the C contents were noted after 120 days of incubation. Statistical analysis revealed a separately significant effect of time and fertilizer on the C content in the soil, although the interaction of these factors was insignificant.

3.1.3. Nitrogen Content

On the first day of the experiment, the N content in the soil ranged from 1.29 to 1.48 g kg−1 d.m. (Table 2). Only the addition of wheat straw together with UFF fertilizer caused a significant increase in the content of this element in the soil. An increase in N content was also found in the soil of the remaining treatments, but the difference was not statistically significant. After 120 days of incubation, no significant differences were found in the N content between the treatments, although in comparison to the content of this element on the first day of the experiment, it was usually slightly lower. Statistical analysis showed a significant effect on the soil N content only in the fertilizer combination.

3.2. Enzyme Activity

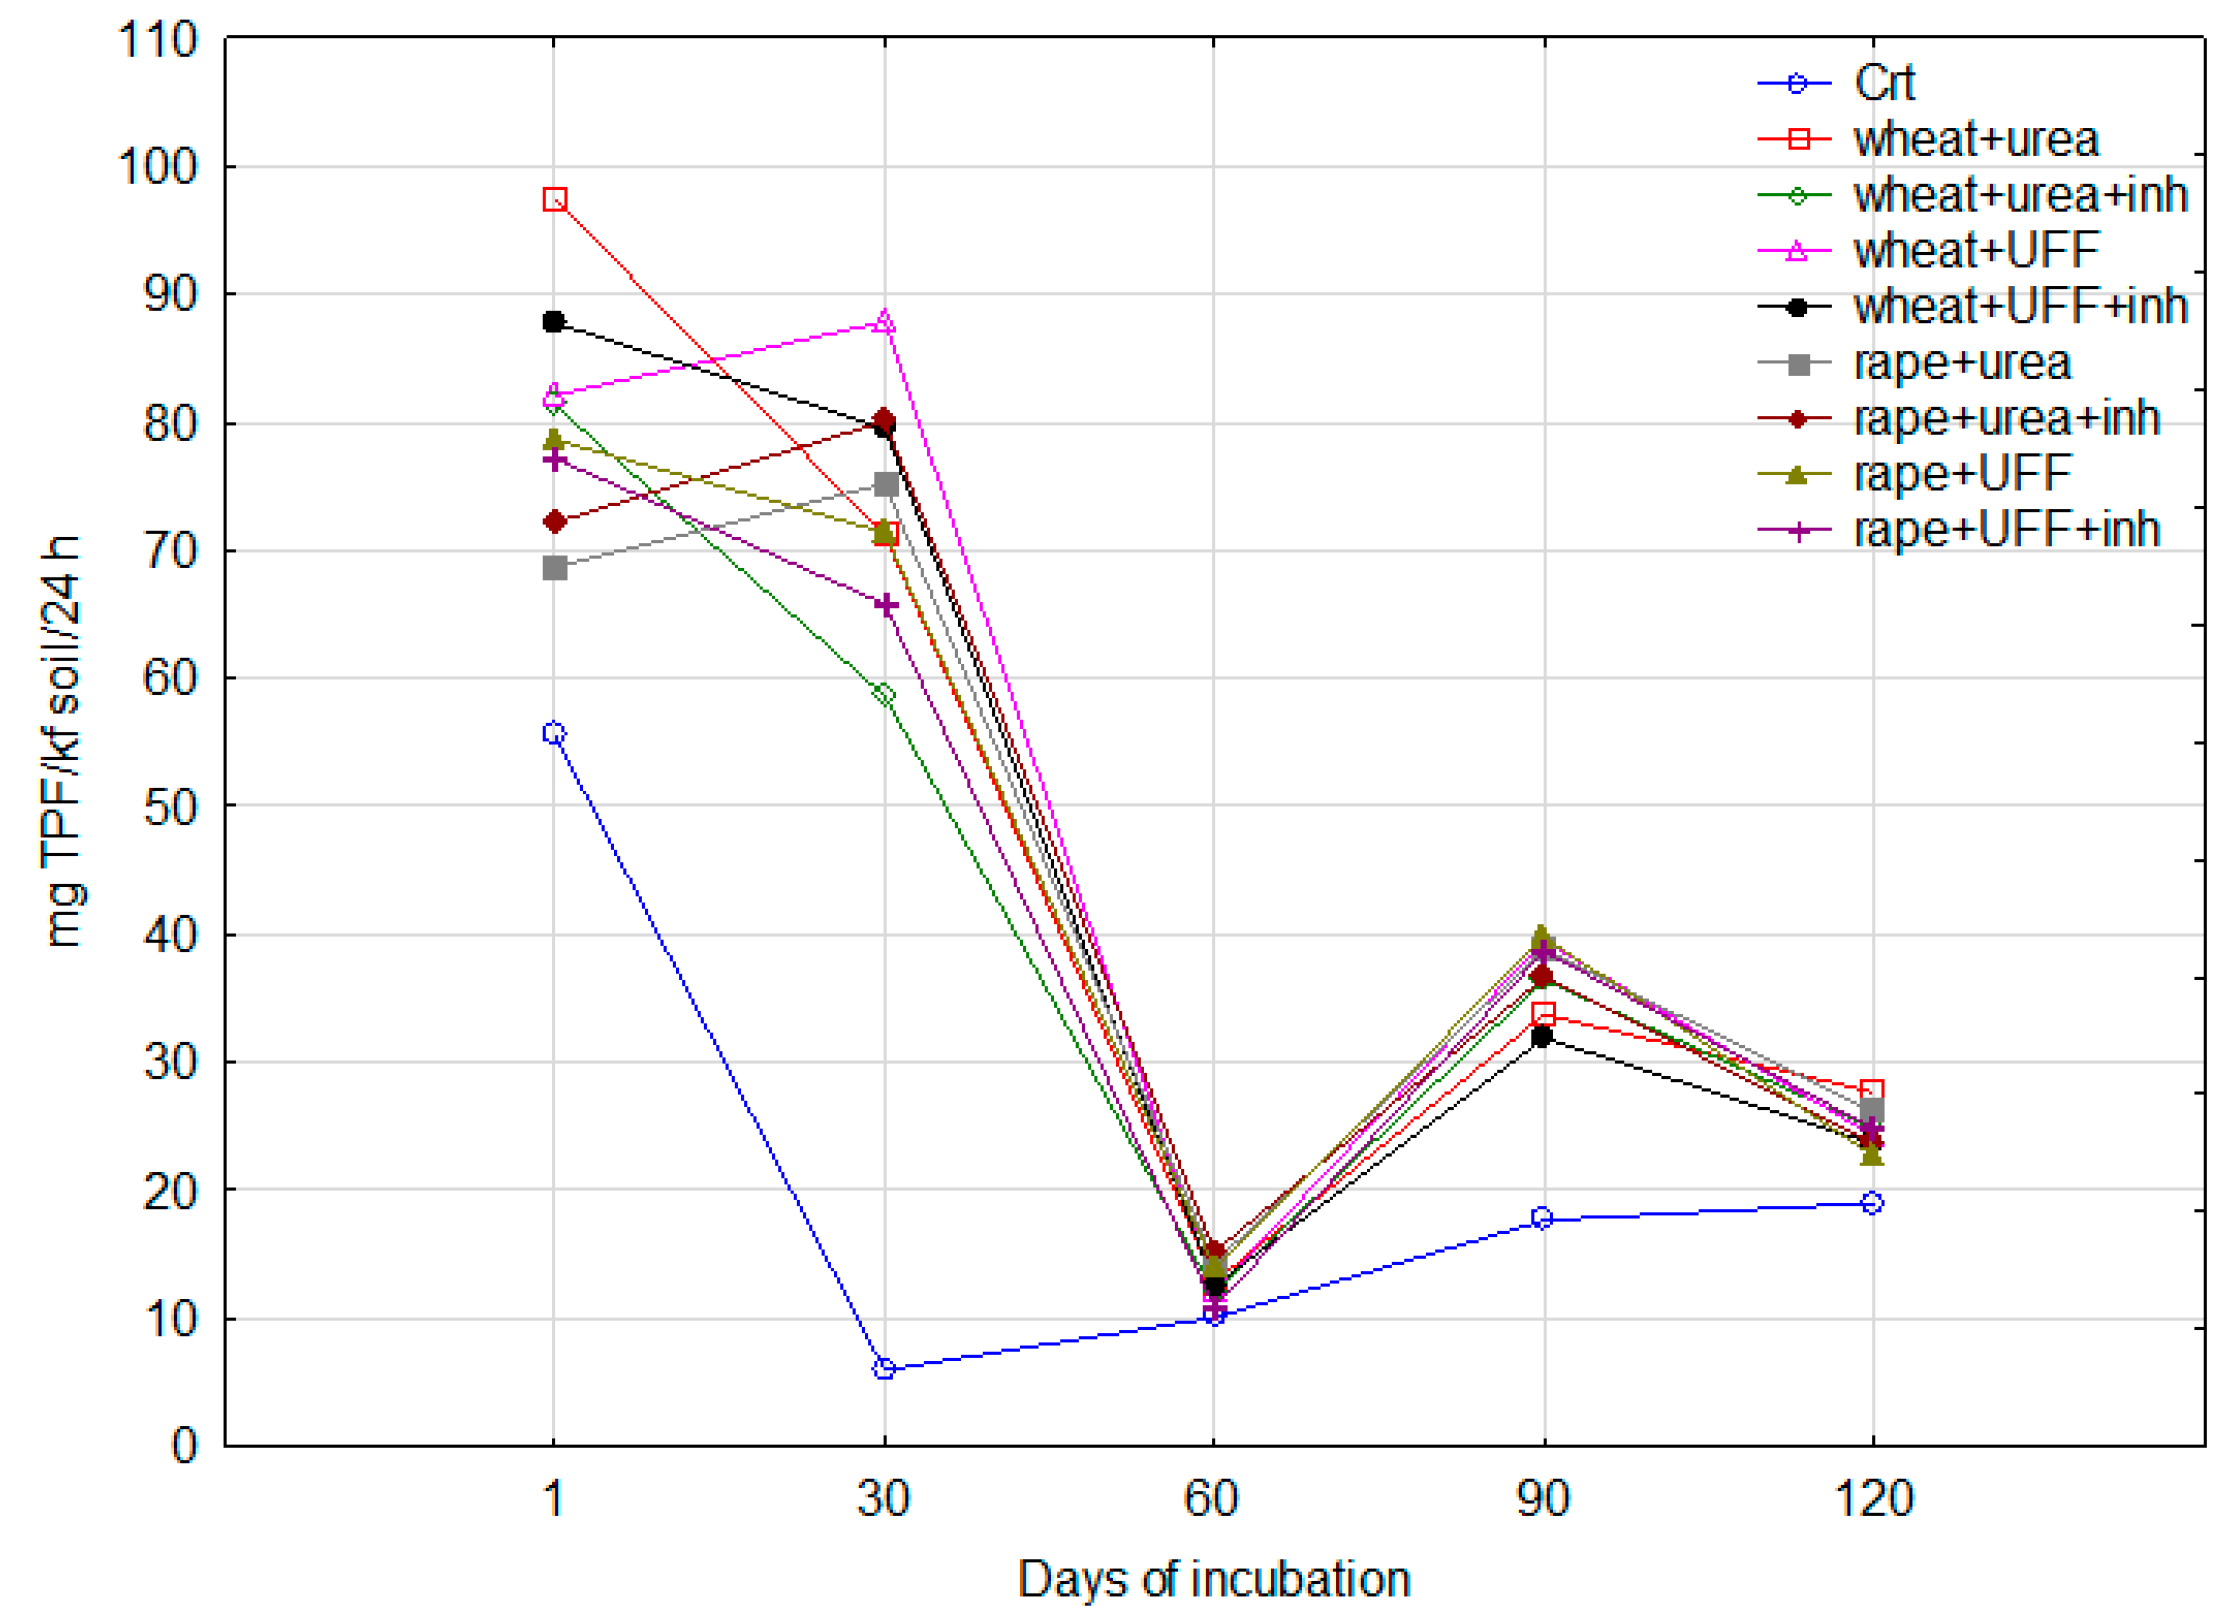
3.2.1. Dehydrogenase Activity

The highest DHA values for wheat + urea + inh and wheat + UFF, ranging from 58.62 to 87.86 mg TPF kg−1 soil over 24 h, respectively, were determined on the 30th day of the experiment, followed by those from the 1st day (55.5 mg TPF kg−1/24 h in the Crt to 97.41 mg TPF kg−1/24 h in the wheat + urea treatment). Generally, the fertilizers (urea, UFF) increased the DHA values for all times and treatments compared to the Crt (Figure 2 and Figure A1). On later days (60th, 90th and 120th days of the experiment), the DHA values were much lower, independent of the treatment, and the differences in the DHA values among the treatments were also insignificant, with the lowest enzyme activity generally occurring after 60 days of the experiment, regardless of the treatment, but with a small increase in the DHA observed on the 90th day in all treatments with additives. There were statistically higher DHA values in the wheat + UFF, rape + urea, rape + UFF and rape + UFF + inh treatments compared to the others determined at 90 days (Figure 2).
The two-way ANOVA showed that, even though the time and treatment factors separately and together significantly affected the DHA, time was more influential (F = 237.796, p = 0.000), with the coefficient of determination (adjusted R2) amounting to 0.893 (Table 4), showing a good explanation for the DHA by the factors.

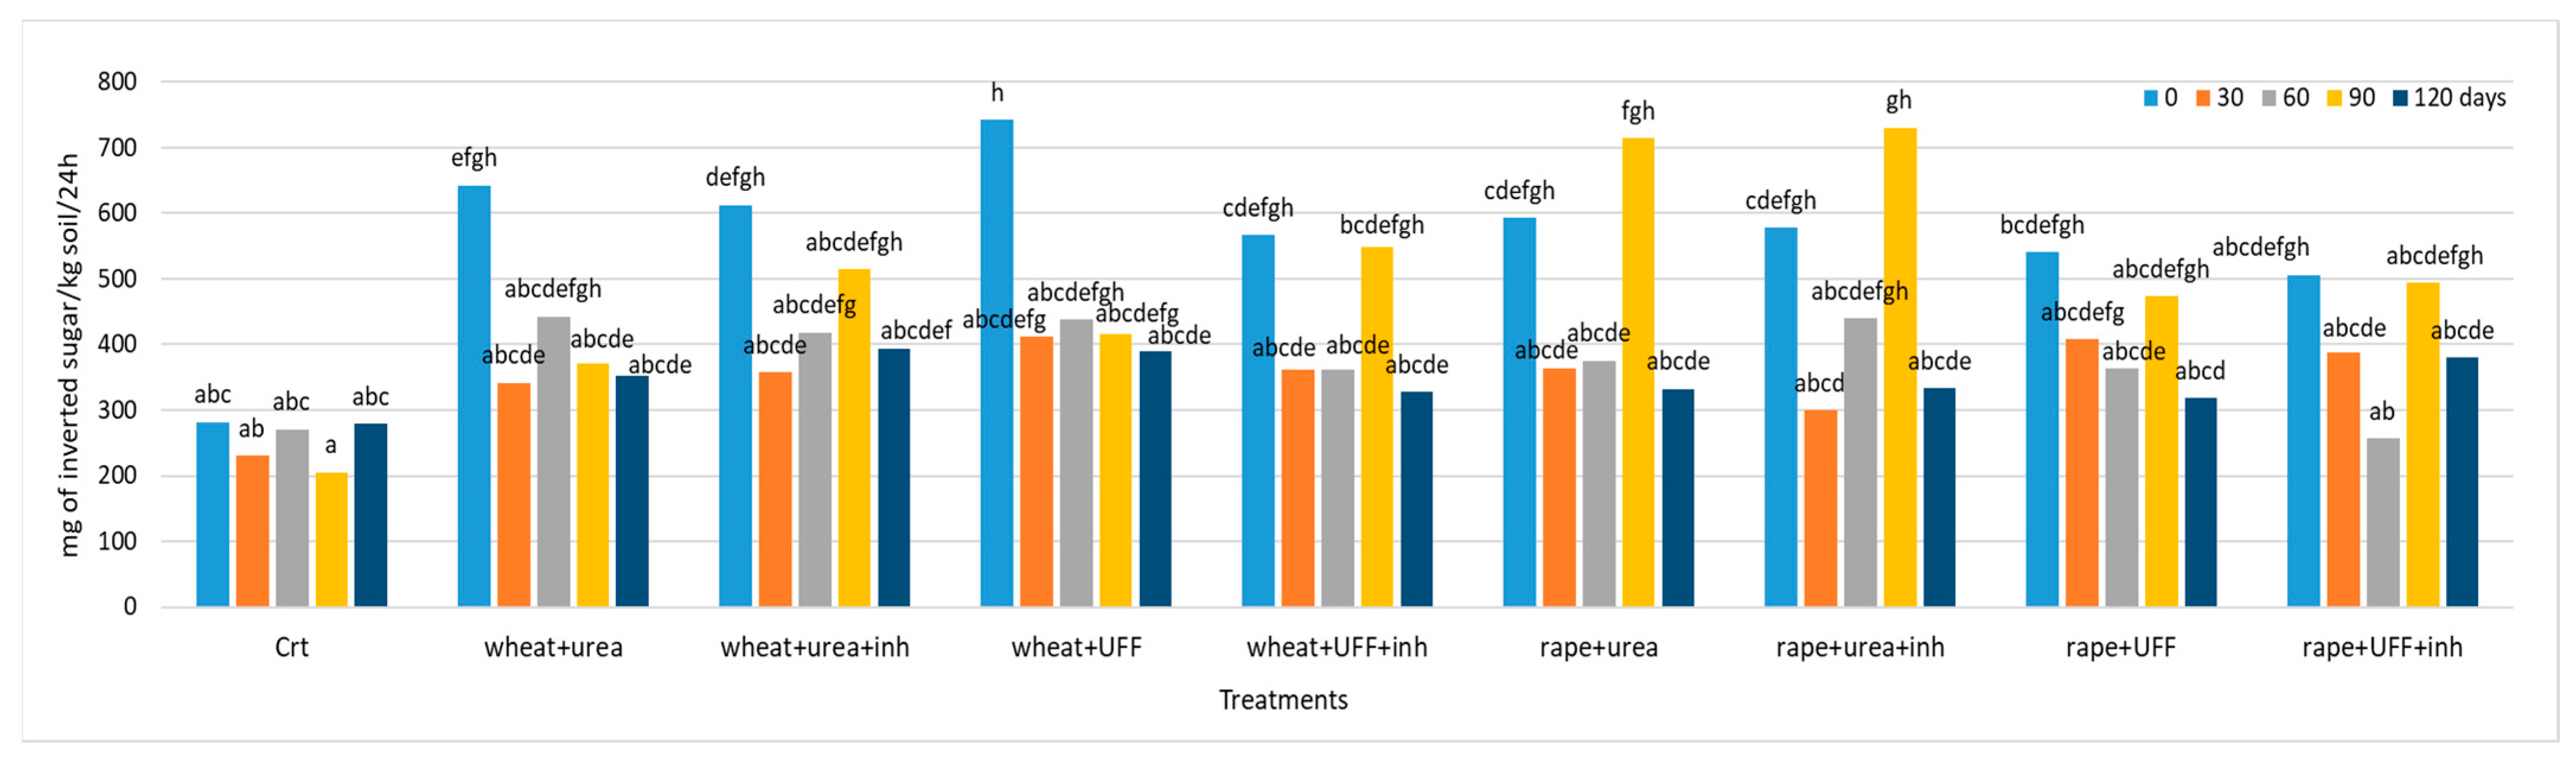
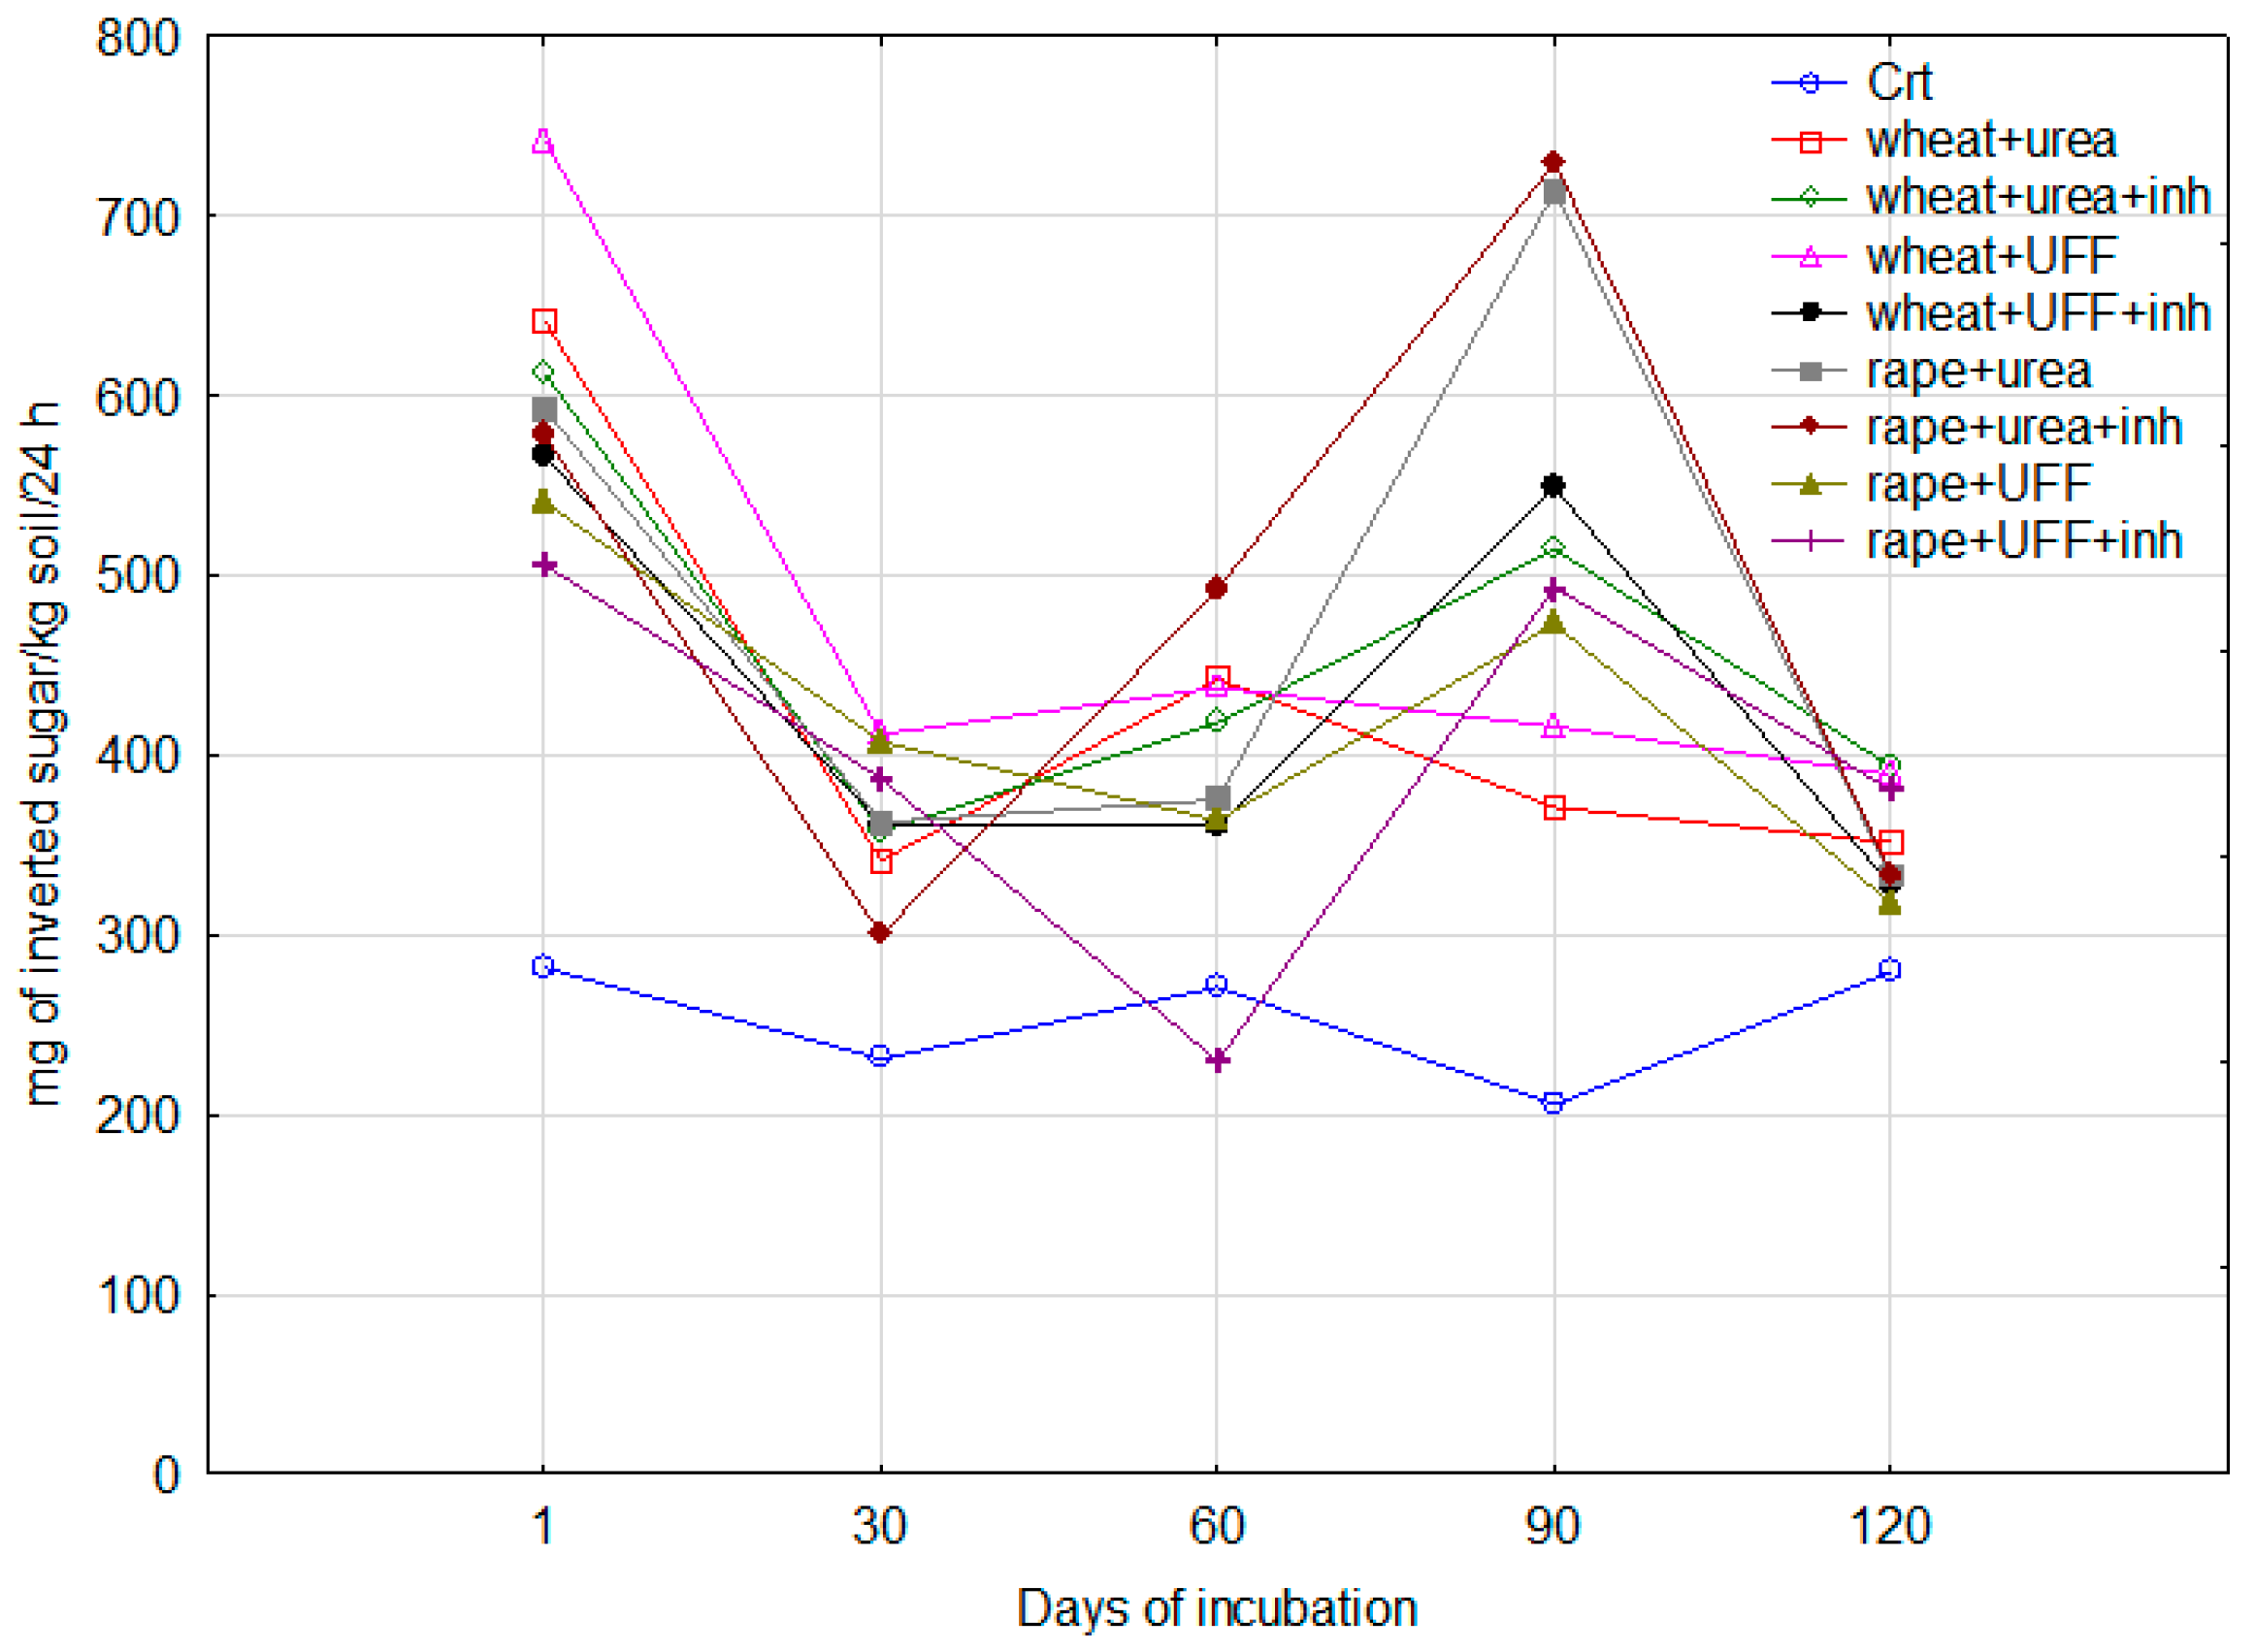
3.2.2. Invertase Activity

Similarly to the DHA, the Inv activity was also the lowest in the Crt treatment, independent of the day of the experiment. The highest activity of this enzyme occurred on the first day in wheat + UFF (742.5 mg of inverted sugar kg−1 soil over 24 h), followed by the wheat + urea, wheat + urea + inh and wheat + UFF + inh treatments (Figure 3). In the other treatments, the highest Inv activity was noted on the 90th day of the experiment, where it amounted to 729.9 and 713.8 mg of inverted sugar kg−1 soil over 24 h, respectively, for rape + urea and rape + urea + inh (Figure 3 and Figure A2). In the rape + UFF and rape + UFF + inh treatments, the Inv activity measured on the 90th day was comparable to that measured at the beginning of the experiment (Day 1). A certain increase in this enzyme activity was also observed in the wheat + urea and rape + urea + inh treatments on the 60th day of the experiment. On the other days (30th and 120th), the Inv activity was low for all treatments, with not much difference between them.
Both time, treatment and their interaction had a significant effect on Inv activity, with time being the most important factor (F = 115, p = 0.000). However, the effect of the treatment on the Inv activity was only slightly less important, with F = 69.753 at p = 0.000. The R2 adjusted (=0.897) confirmed a good explanation for the Inv activity by the studied factors (Table 4).

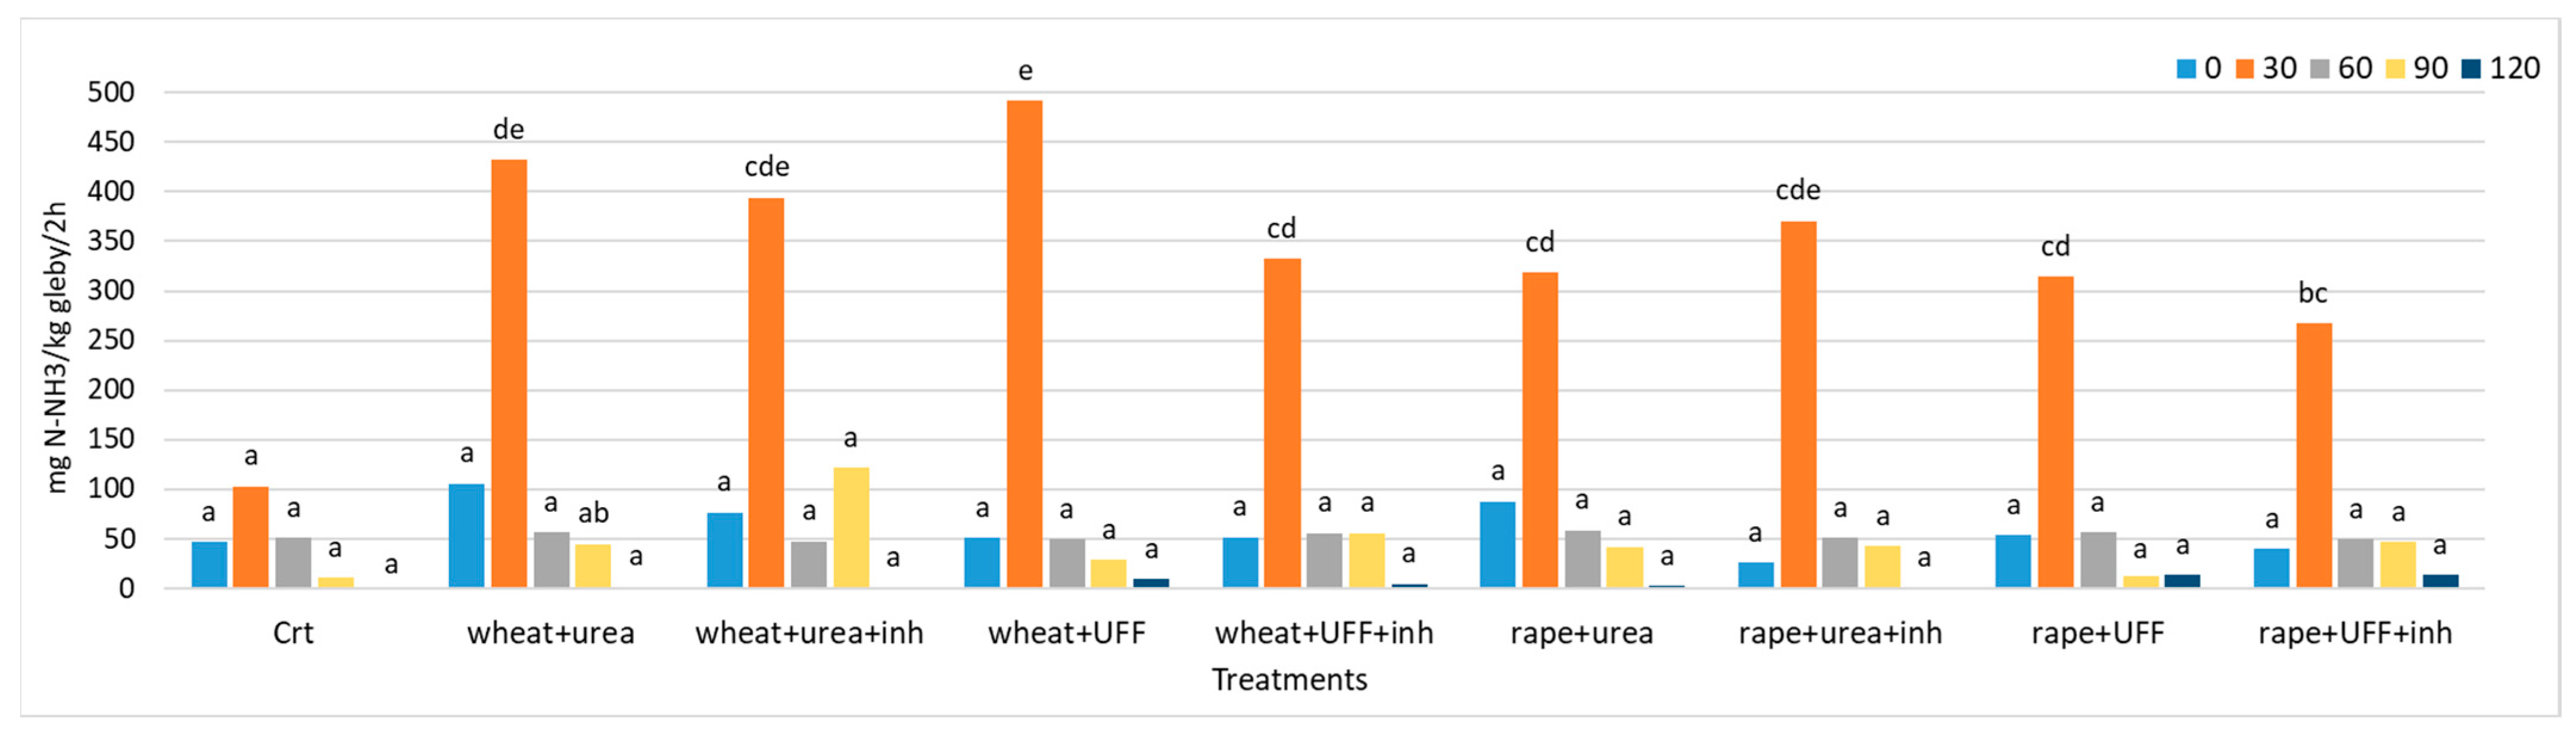
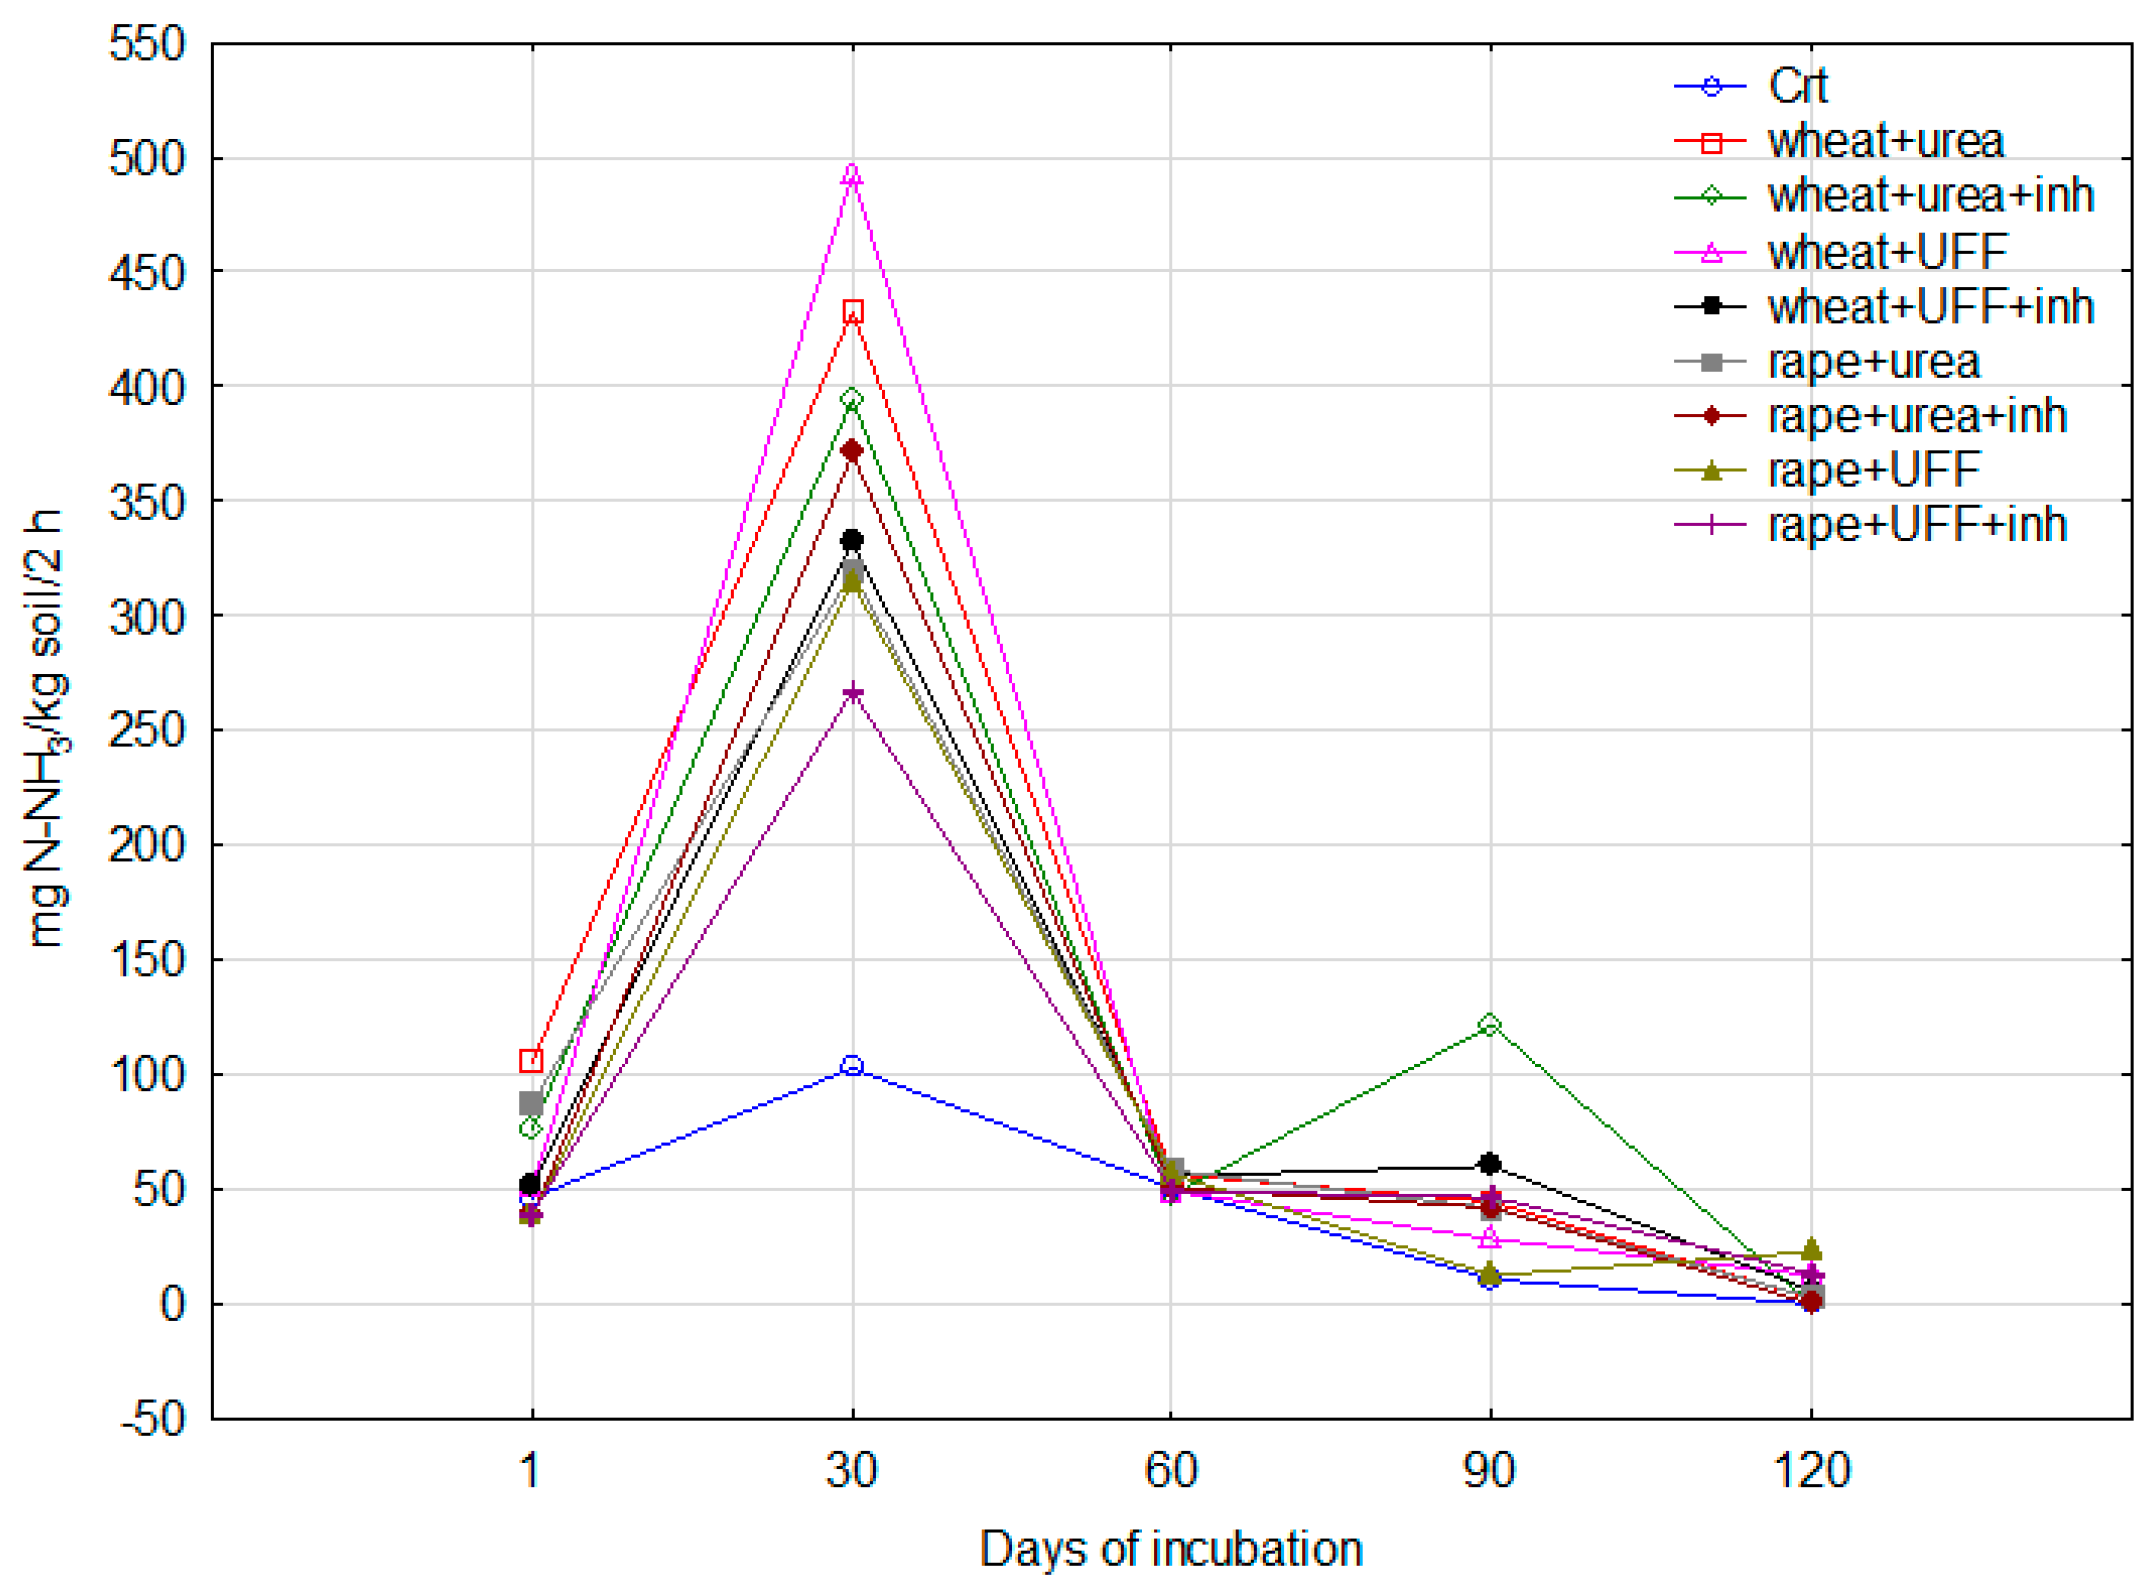
3.2.3. Urease Activity

The Ure activity reached its highest values, and was the most diversified among the treatments on the 30th day of the experiment, with values ranging from 102.81 mg N-NH3 kg−1 soil/2 h in the Crt to 492.0 mg N-NH3 kg−1/2 h in the wheat + UFF treatment. It was similar and the lowest for all days in the Crt, but was also low and at a similar level with the other treatments. On the 120th day of the experiment, the Ure activity was close to 0 (Figure 4 and Figure A3).
Although all factors (day, treatment and their interaction) significantly influenced Ure activity, the effect of the day was most predominant (F = 1050.740, p = 0.000). with treatment and interaction time × treatment having similar and low values of F (F = 14.299 and 10.236), both at p = 0.000. The model describing the effect of time, treatment and their interaction had a very good fit, with adjusted R2 = 0. 961 and a high F value (Table 4).

3.3. Micromorphological Studies

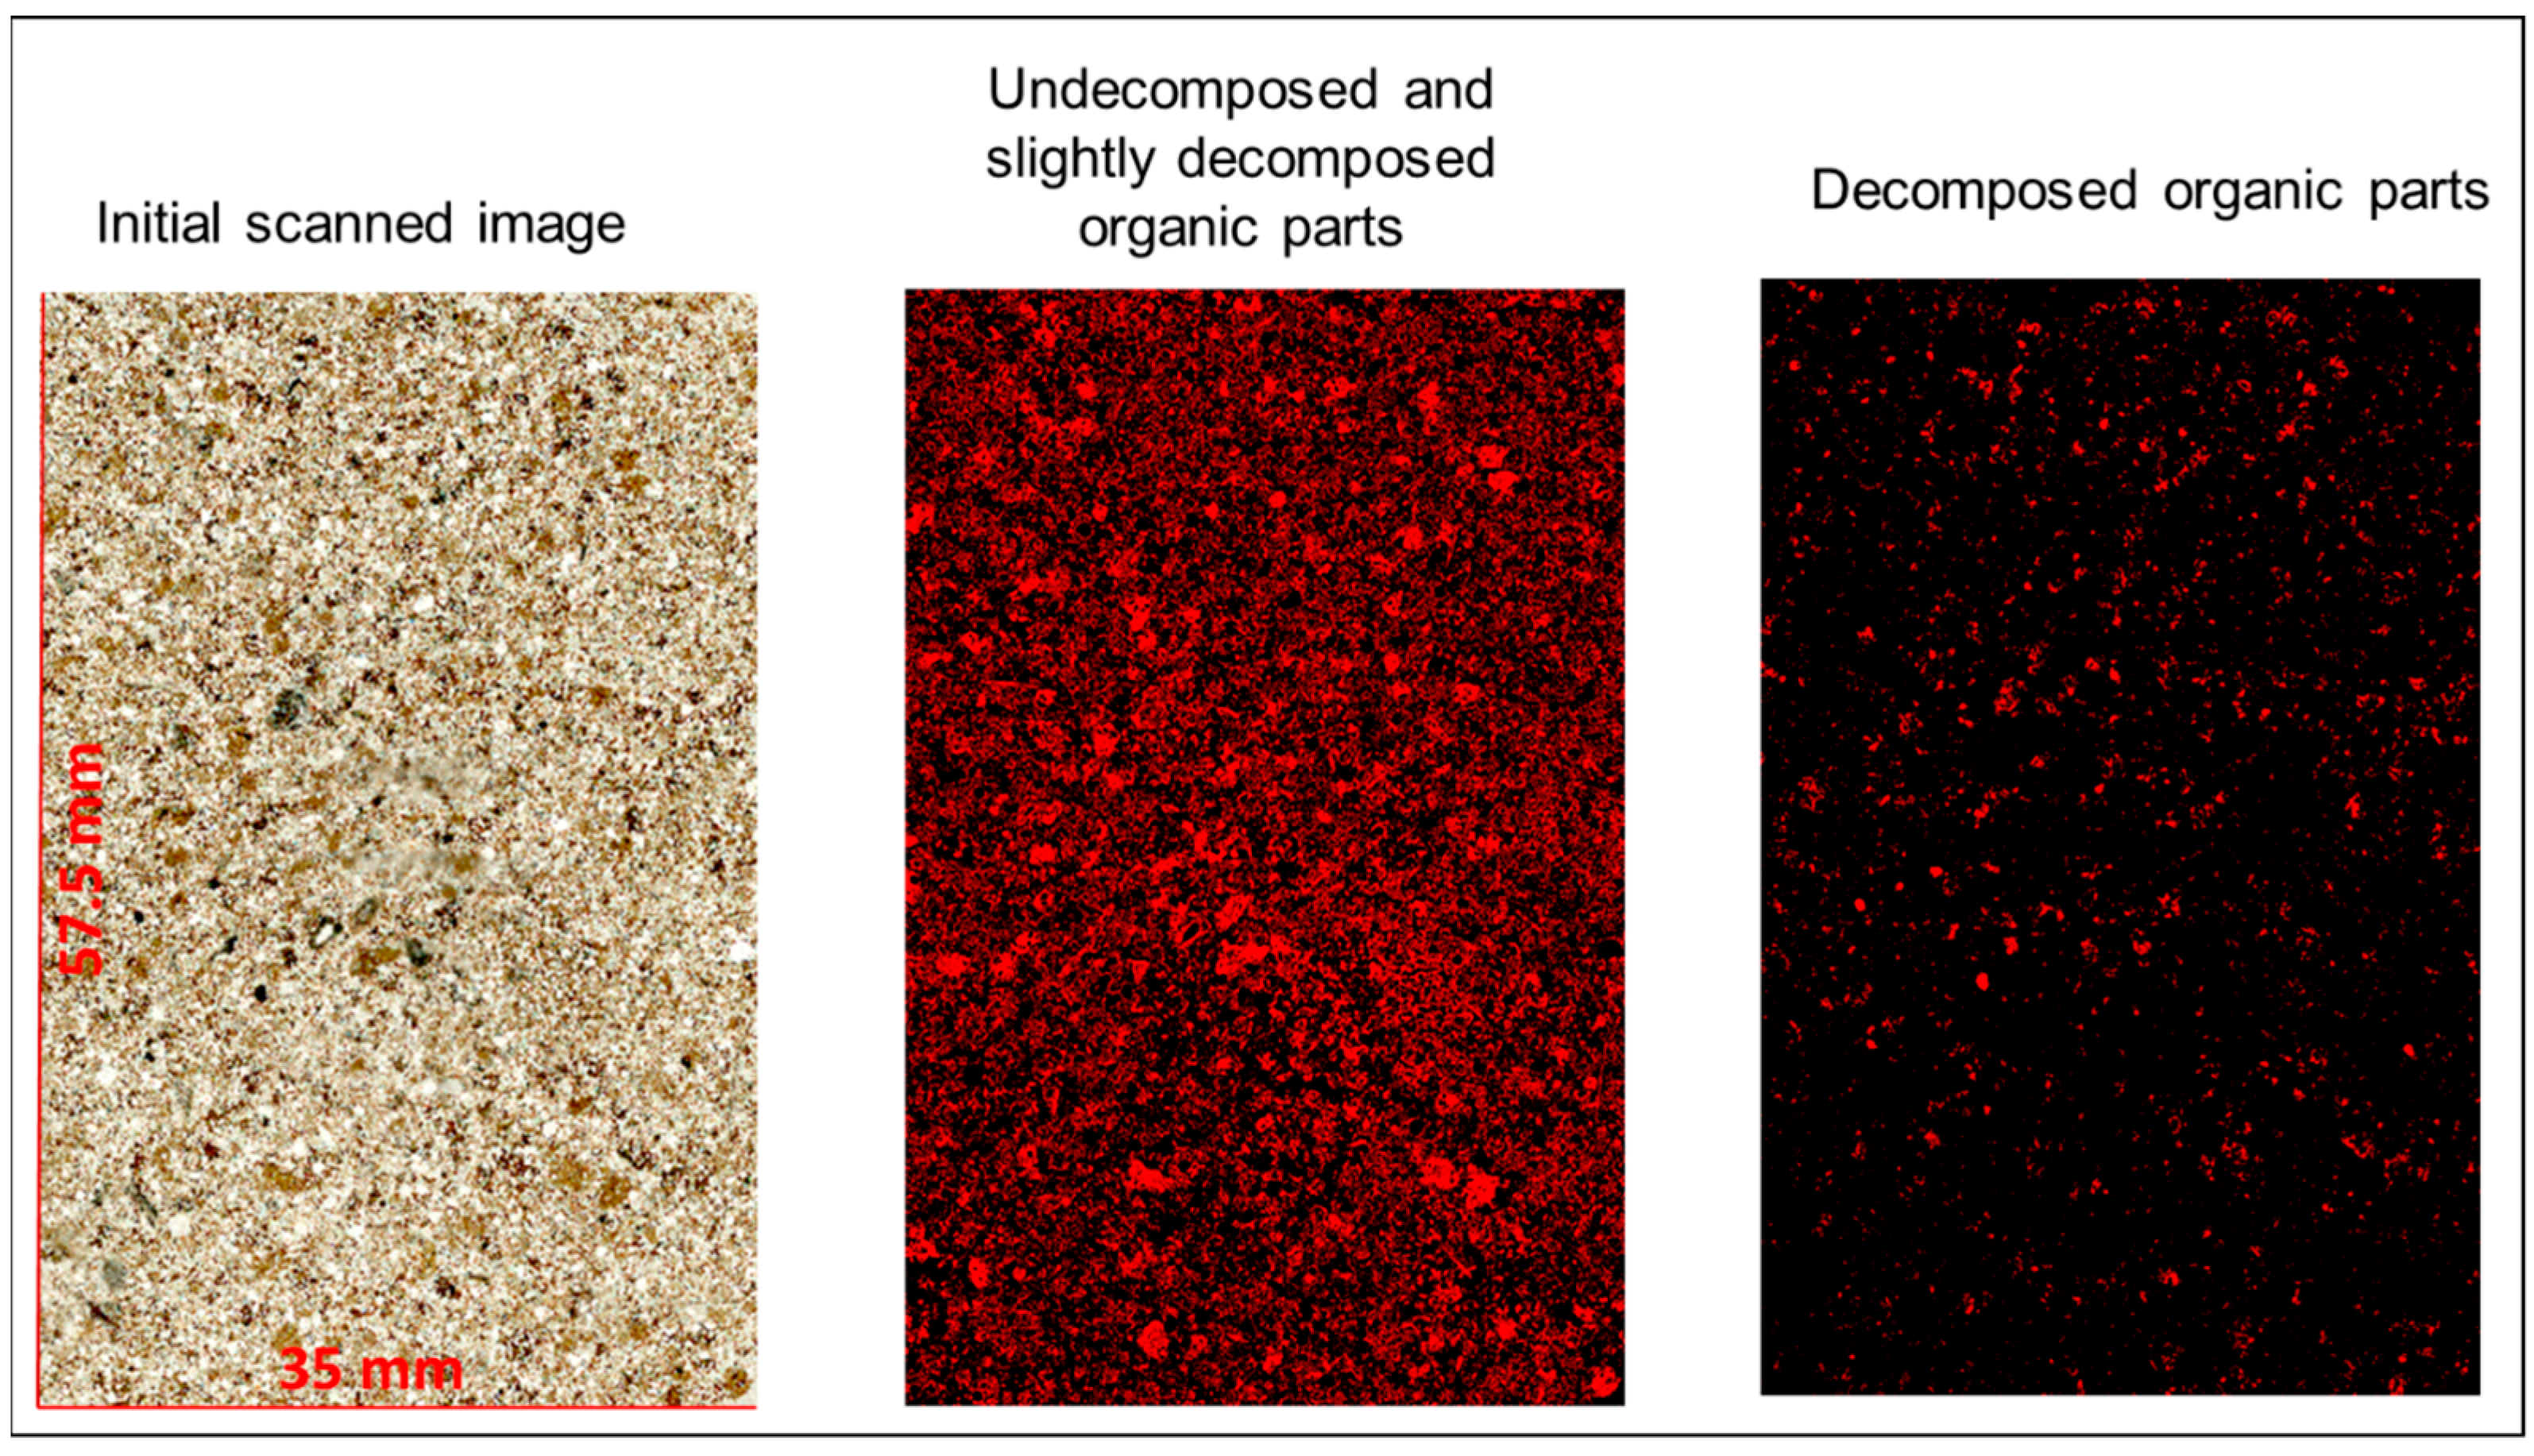
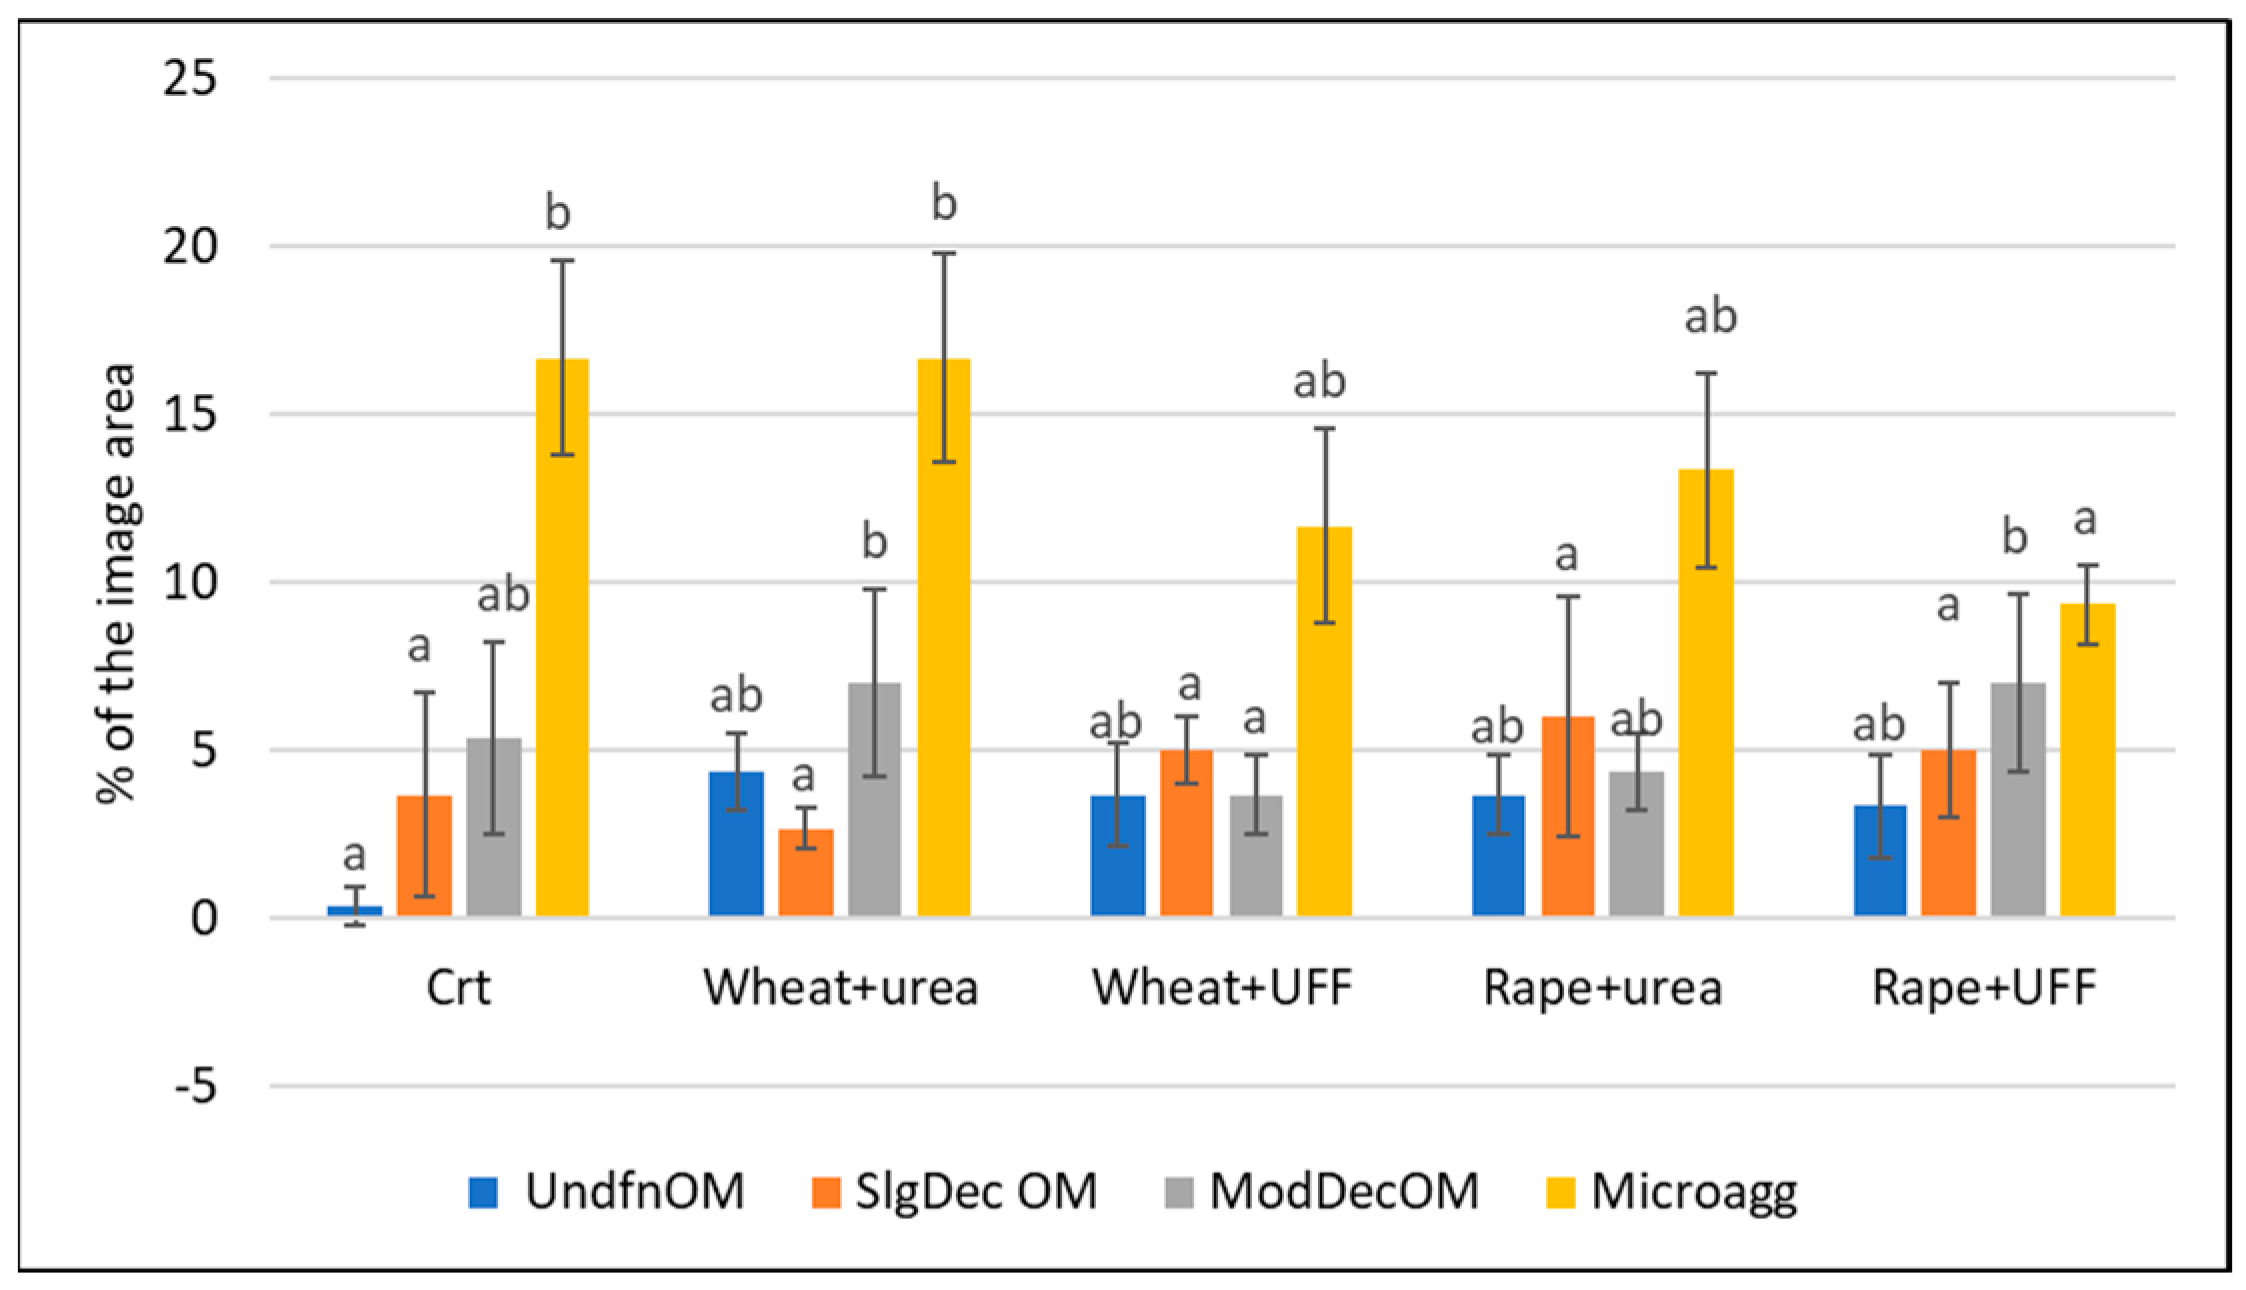
3.3.1. Image Analysis of the Organic Matter

The Und OM and decomposed Macroagg OM were measured as a percentage of the image area. The amount of OM was much lower in the Crt (17.17%) than in the treatments fertilized with urea or UFF and with the straw additions (Table 5). Generally, slightly lower amounts of OM were observed in the treatments with UFF than in those with urea. The Und OM occupied larger areas in the treatments with rape straw fertilized with urea and UFF than with wheat straw, whereas the area of Macroagg was larger in the treatments with wheat straw than in the treatments with rape straw.

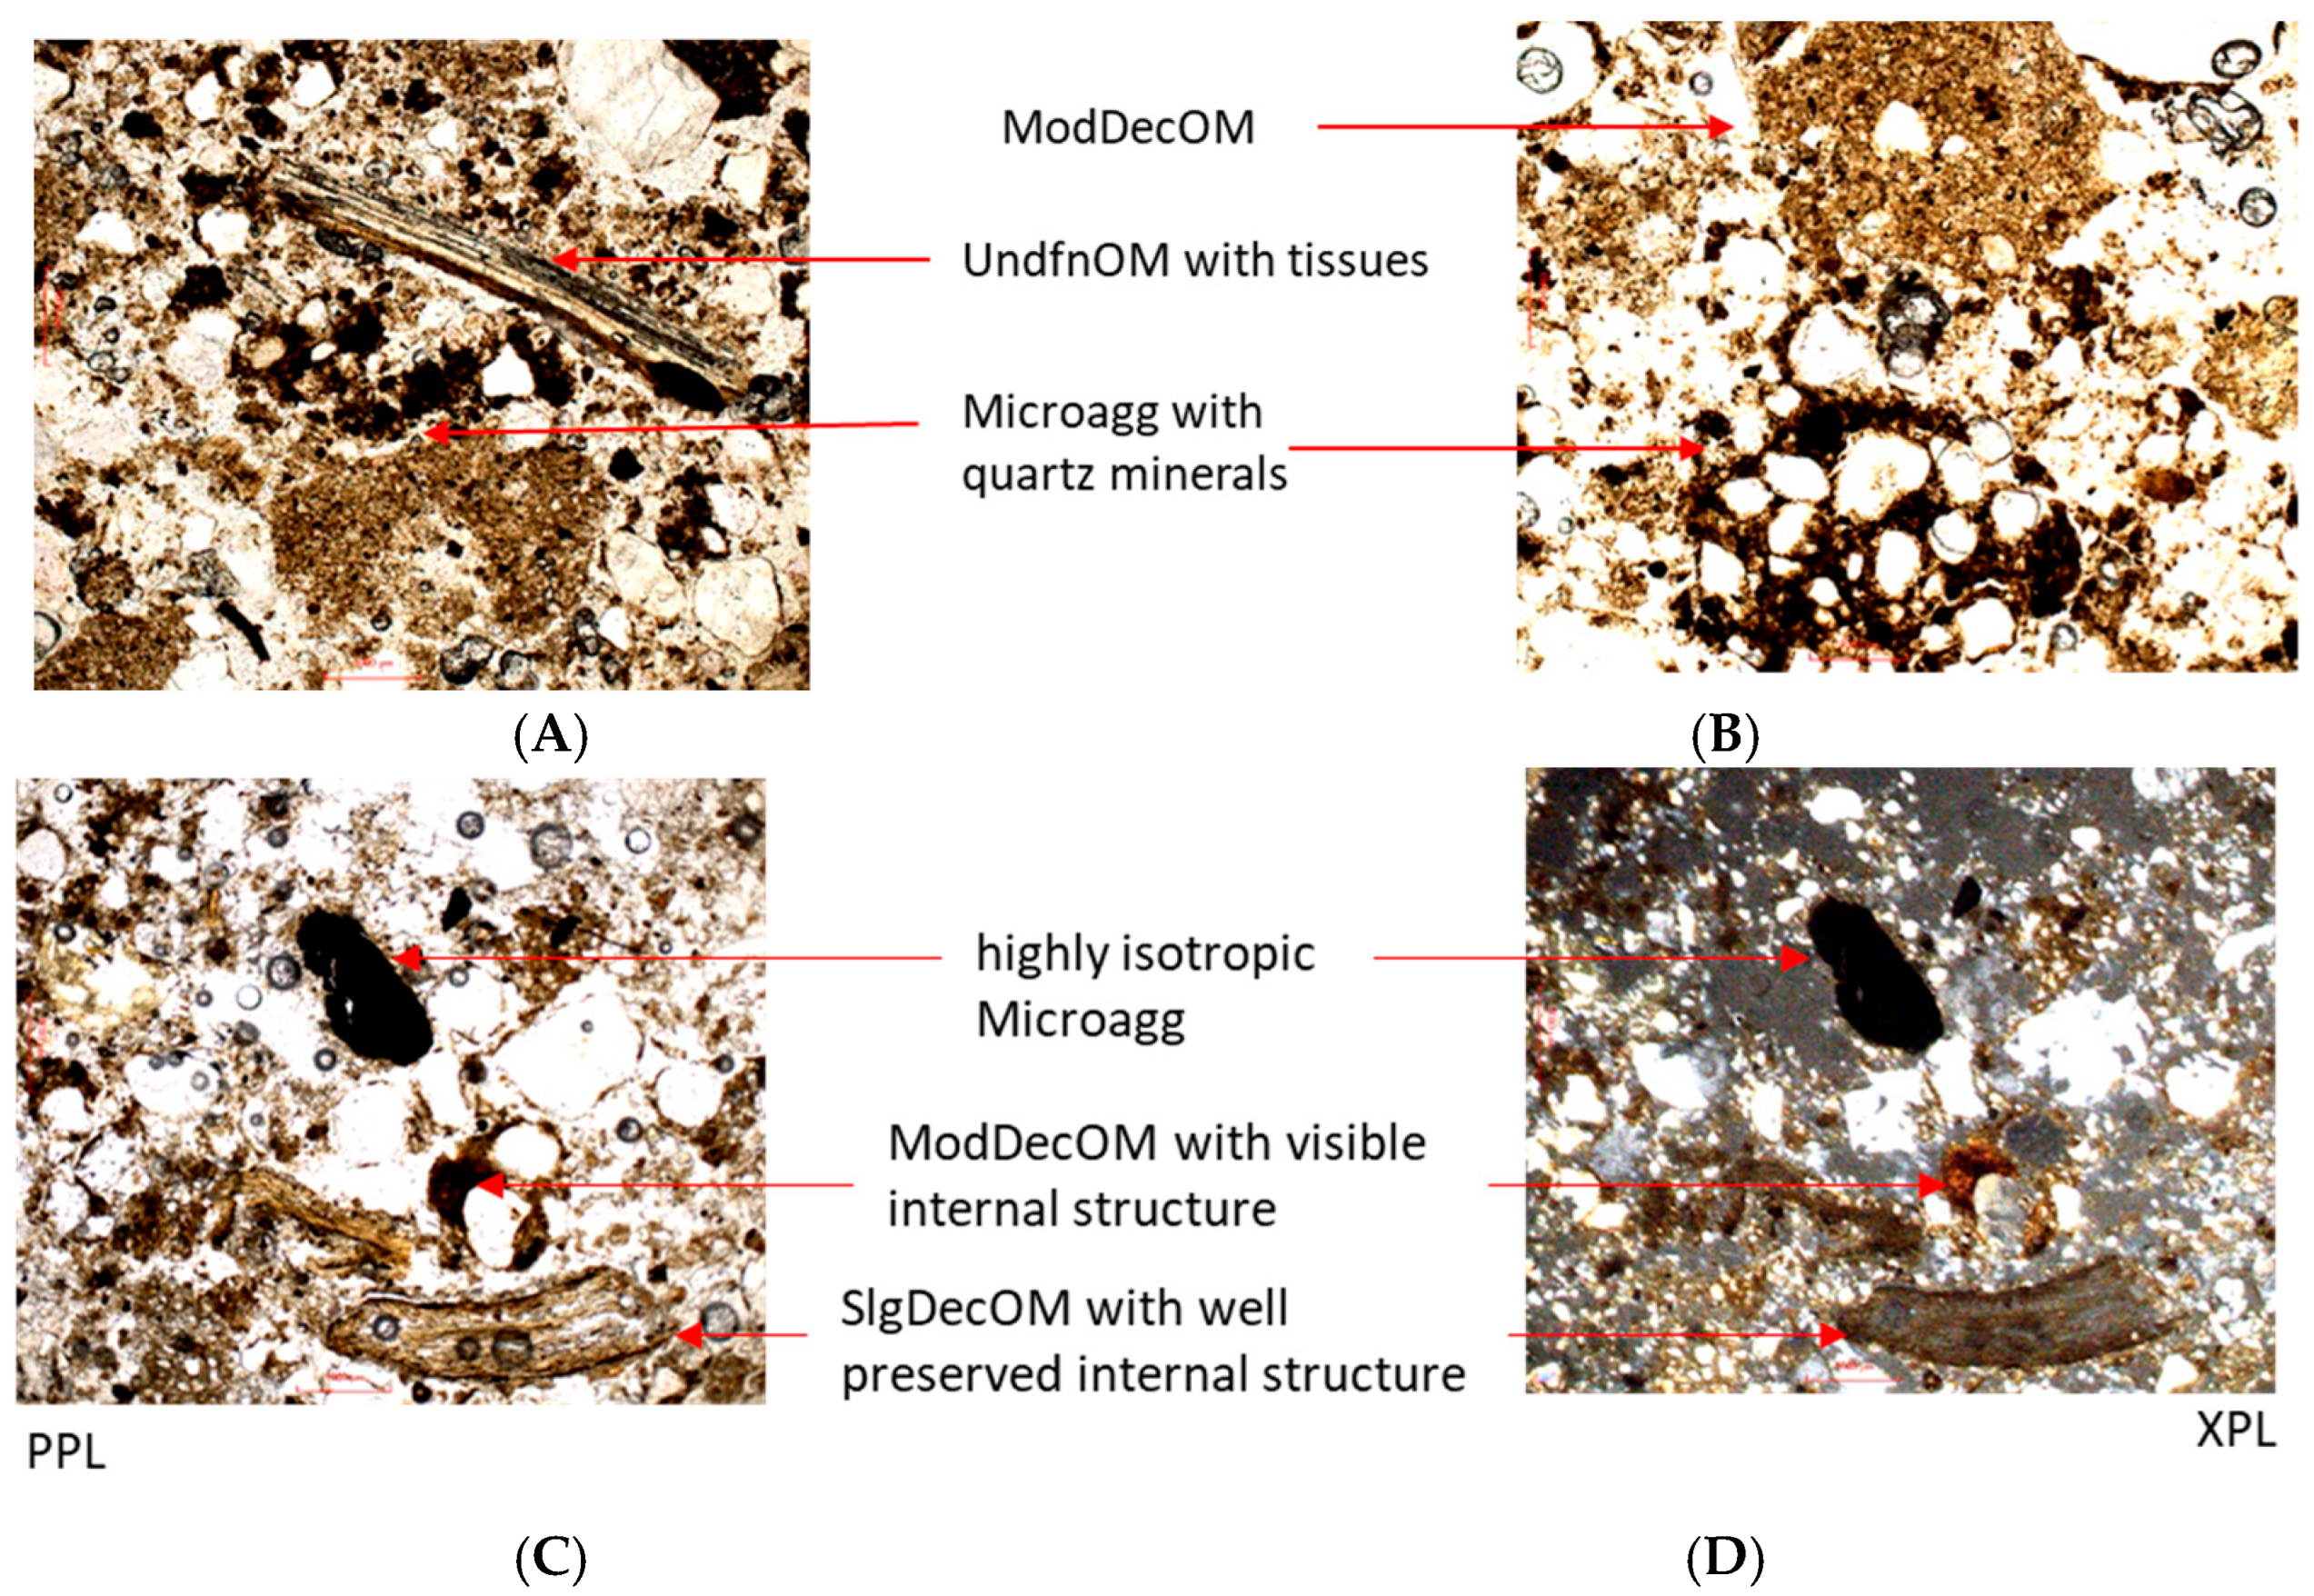
3.3.2. Organic Matter Decomposition Studied Under Optical Microscopy

In all treatments with straw, regardless of the type, similar areas, but higher than in the Crt, were covered by Undfn OM (Figure 5), with this occurring in the form of pieces of straw with well-preserved internal structure (Figure 6A). The areas of the images covered by SlgDecOM (Figure 6C,D) were similar in all treatments, varying between 2.7% (wheat + urea) and 6% (rape + urea).
The ModDecOM covered larger areas (7%) in the wheat + urea and rape + UFF than in the other treatments, in which the areas covered ranged from 3.7% to 5.3% (Figure 5 and Figure 6B–D). The Microagg covered significantly larger areas in the Crt and wheat + urea treatments (more than 16%) than in the other treatments. In the rape + UFF treatment, the area covered by Microagg was the lowest (below 10%) (Figure 5 and Figure 6A–D).

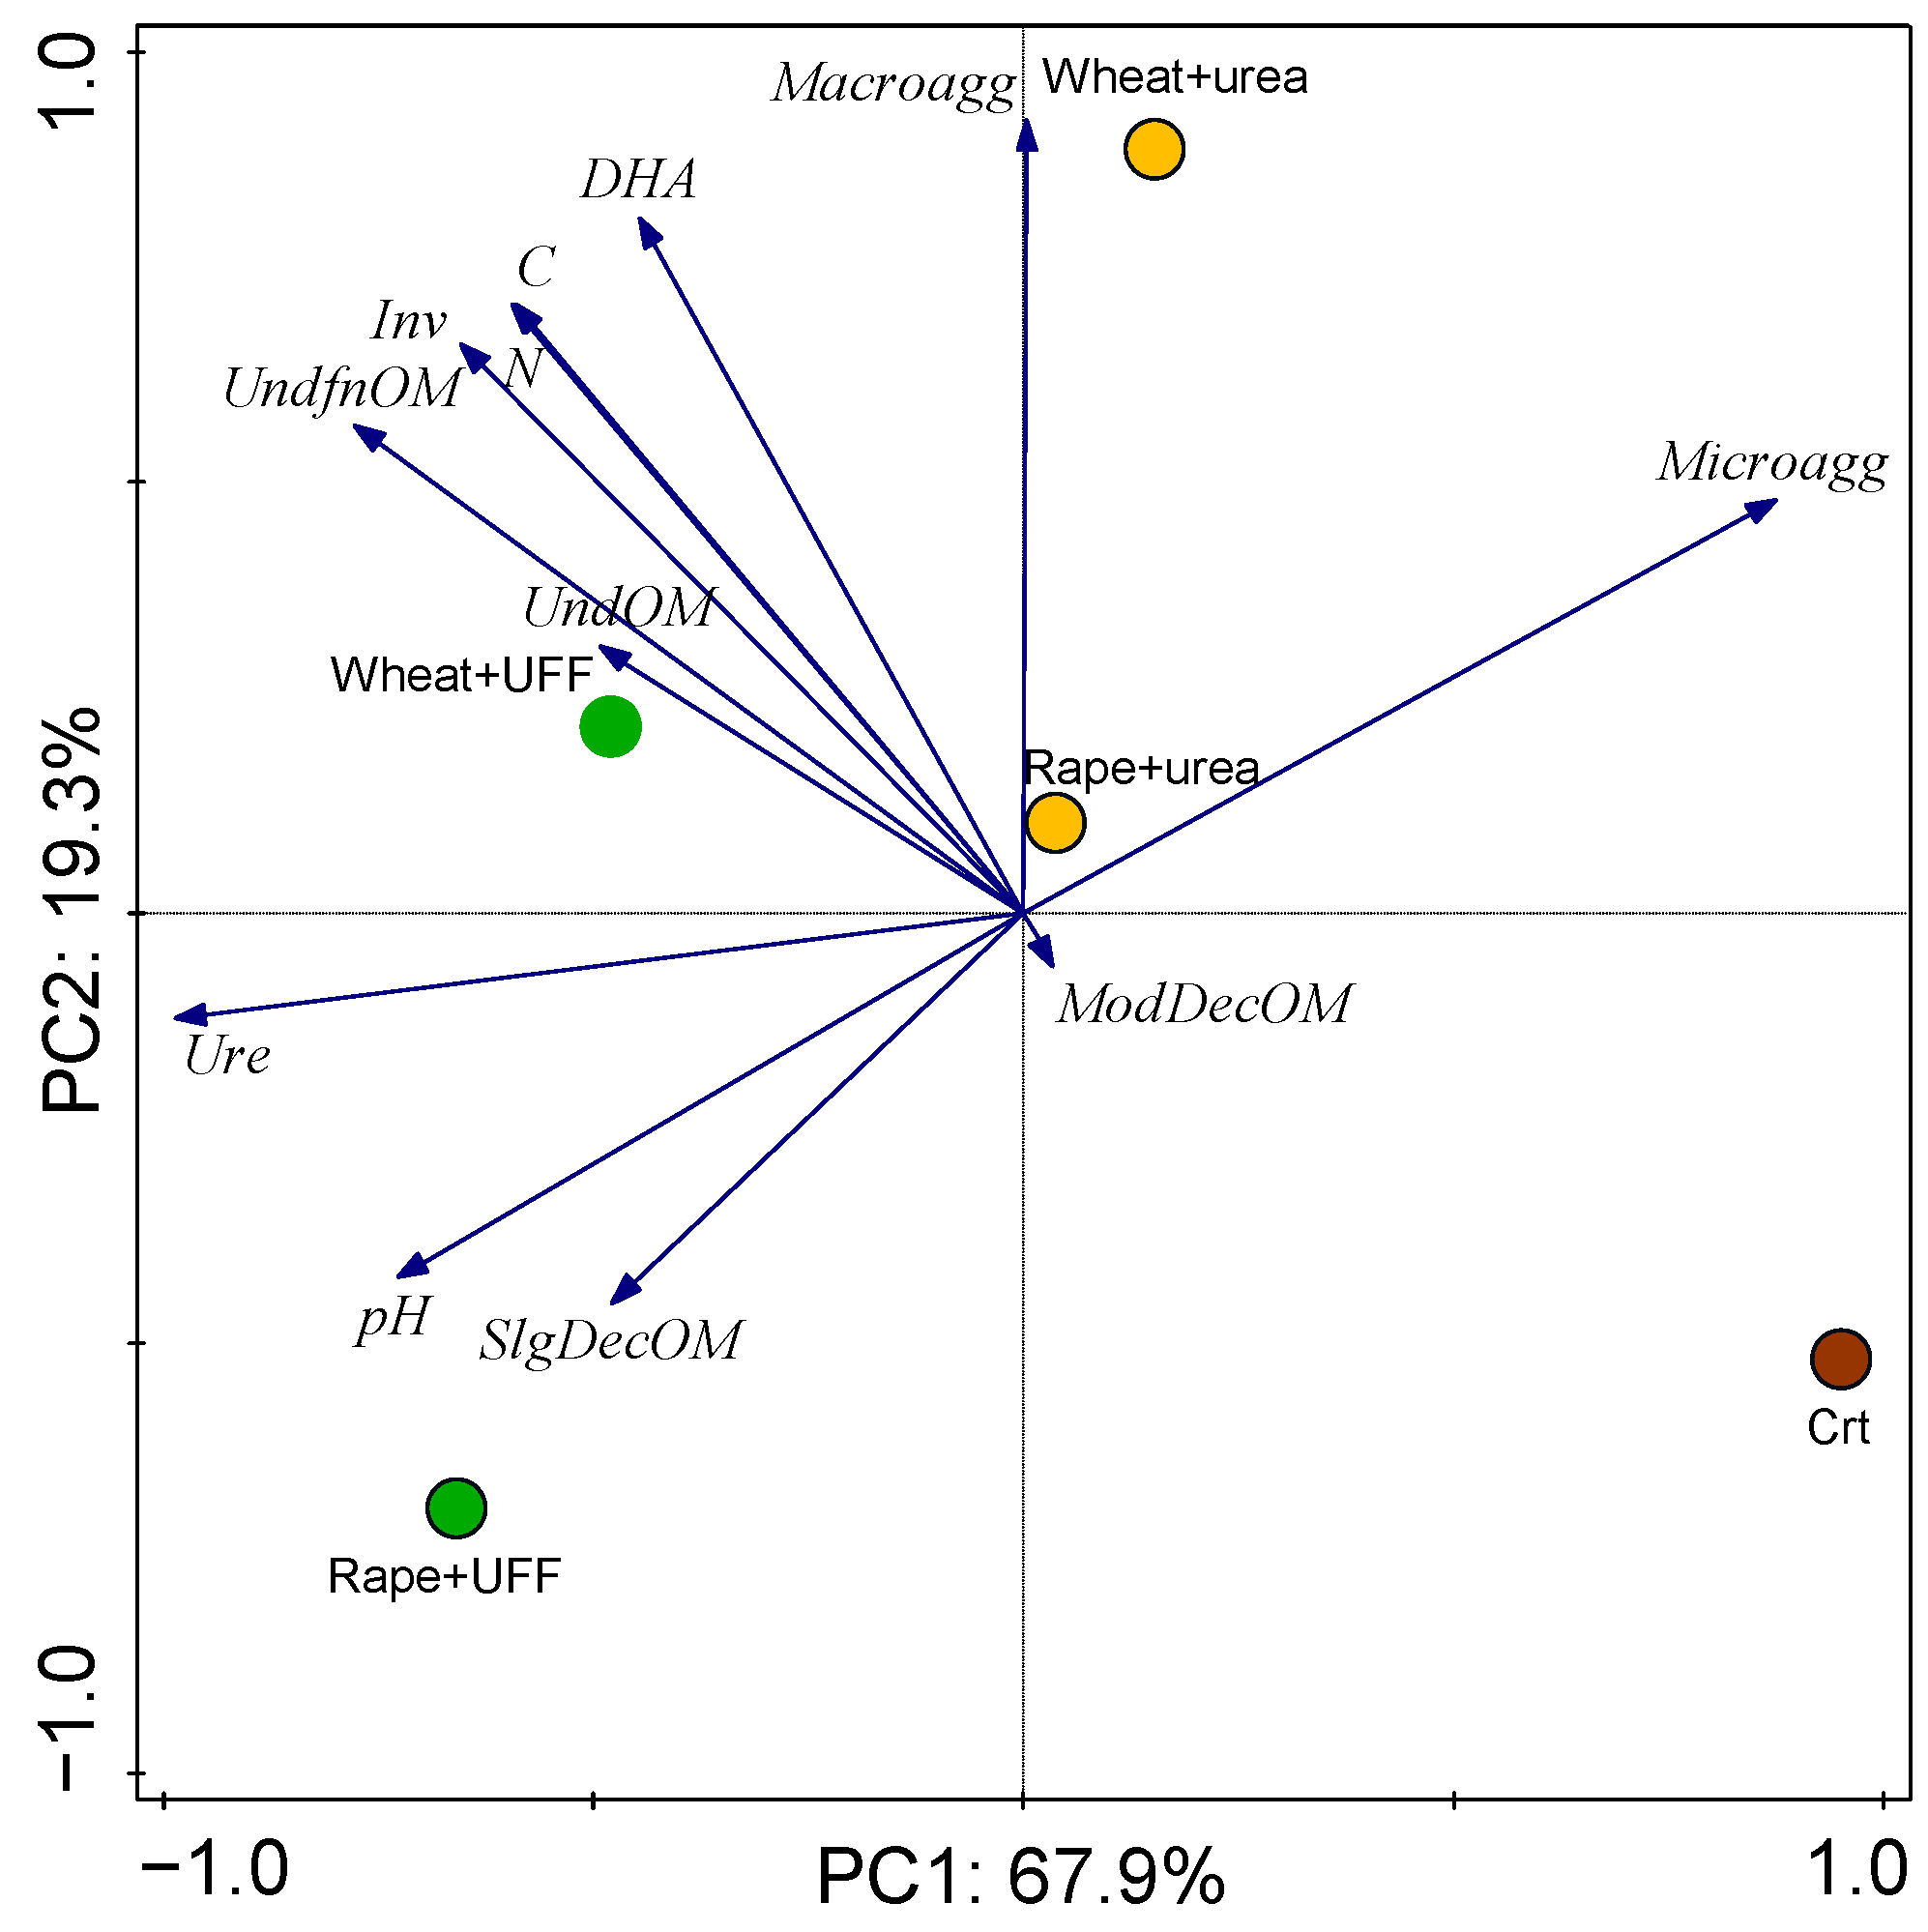
3.3.3. Results of PCA

The PCA explained 87.2% of the variance of the treatment properties at the end of the experiment (Figure 7). The first factor (PC1), which explained 65.9% of the variance, was determined by UndfnOM (97% of the variance), DHA (88% of the variance), Inv (81%), C (97%) and N (97%). PC2 explained 19.3% of the variability and was determined by pH, macroagg and microagg, which explained 84, 83 and 83% of the variance, respectively.

4. Discussion

4.1. Changes in Soil pH and Carbon and Nitrogen Contents and Their Relationship with Enzyme Activity as a Result of Introducing Fertilizer and Straw into the Soil

From the literature, it is understood that, immediately after the application of urea, soil pH values increase slightly, which stimulates the growth of NH3-oxidizing bacteria [35]. Our results support this finding, showing an increase in pH at the beginning of the incubation period compared to the value in the soil prior to the experiment, as a result of both urea and UFF applications, followed by acidification, with stronger acidification resulting from the UFF treatment.
The results regarding the effects of adding straw from various plant species on the soil pH are ambiguous. We found a stronger acidifying effect from wheat straw compared to rape straw, but the difference was not statistically significant. Zhang et al. [36] found no such effect, while Chen et al. [37] found that changes in the pH depend on the initial soil pH value and the rate of dissociation of soluble organic acids after their release into the soil due to the mineralization of the straw used. Yan and Schubert [38] attributed differences in the effect of straw of various plant species on soil pH to the alkaline ion content in the straw and the strength of their binding to organic anions. Therefore, it would be expected that rape straw, containing more alkaline ions than wheat straw, would have a greater de-acidifying effect compared to wheat straw. Factors limiting the increase in soil pH after the use of rape straw could have been the approximately double amount of N content and three times as high S content in this straw compared to wheat straw [39].
Urease inhibitors can reduce urea hydrolysis in a relatively short time by 50–90% when compared to untreated fertilizers and when used together with a fertilizer before sowing; the impact of the inhibitor on the crops is negligible [40,41]. The delay in urea conversion reduces the availability of NH4+, which is a substrate for nitrification. Thus, through indirectly hampering the nitrification process, Ure inhibitors retain more N in the soil in the NH4+ form, which reduces the risk of nitrate (V) leaching [42]. Lower N losses from the soil reduces the risk of environmental pollution, which is important for sustainable management [43]. The consequence of this is an increase in the efficiency of N use from fertilizers containing urea [44]. Lower NH3 emissions mean the formation of nitrates (NO3) is limited, so it would be expected that the addition of a Ure inhibitor would lower soil acidification. However, this effect was noted only after the application of UFF with a Ure inhibitor, regardless of the type of straw used. The use of a Ure inhibitor also contributes to the implementation of the goals of the ‘Agenda 2030 for Sustainable Development’: Goal 13. Actions in harmony with the climate—reduction in greenhouse gas emissions, mainly nitrogen oxide (I) and ammonia.
The progressive acidification of the soil during our experiment might also be reflected in the decreasing DHA noted especially at the end of the experiment, these enzymes being sensitive to the influence of various environmental factors, including pH [45,46]. An optimal soil reaction for DHA would be close to neutral, and with DHA slowing down under acid conditions [47,48].
As DHA shows the presence of living microorganisms in the soil, including decomposers of OM, it can be stimulated by a supply of fresh OM from organic and mineral amendments, such as crop residues, vermicompost or urea [49,50]. In our experiment, the highest DHA was observed in the initial phase of the experiment (Days 1–30). After a 2-month decrease in this activity, it increased again on the 90th day of incubation, but only reached about 30% of the value from the beginning of the experiment. This high initial DHA might have been caused by the respiratory activity of microbes involved in processing the urea and easily decomposable straw compounds, while the small increase in DHA on the 90th day of incubation might have resulted from the decomposition of recalcitrant compounds in the straw. The decrease in DHA might also have been caused by the incubation conditions, possibly resulting in nutrient depletion or the accumulation of microbial activity products, as was reported from another incubation experiment [51]. In addition, in a pot experiment in which the fertilizing effects of UFF and urea were compared, no statistically significant differences were found in the DHA between the beginning and end the experiment [5].
The transformation of N compounds initially present in the soil after adding fertilizer (urea or UFF) and OM (straw) can be traced through the changes in Ure activity, with a significant portion of this enzyme, after being released from microbial cells, being stabilized by association with soil particles, mainly OM [52]. Adding urea increased this enzyme activity on the 30th day of incubation, which was especially high in treatments without a Ure inhibitor. This was followed by a steady decrease, reaching almost zero activity by the end of the experiment for most treatments. In the treatments with wheat straw and a Ure inhibitor, however, there was prolonged Ure activity, with a second small peak observed on the 90th day of incubation. This was probably related to differences in the speed of decomposition of the wheat and rape straw resulting from different C:N ratios (rape = 40–50:1, wheat = 80–95:1) [53]. Another factor causing the small increase in Ure activity was probably the depletion of the Ure inhibitor, which reduced the activity of the enzyme in the earlier stages of the experiment. Usually, the effective life of Ure inhibitors varies from several days to several months, depending on the soil pH, among other things, reaching a peak at around pH 7 [54,55]. The decrease in Ure activity noted at the end of the experiment was probably caused by two factors––low pH values and the presence of NH4+ and/or NO3 ions in the soil, which are the products of the enzyme activity [40].
Straw left in the field after harvest usually increases the C and N contents in the soil, and so its application is of great importance in sustainable agriculture [56,57]. The OM reproduction coefficient for 1 Mg of straw mass ranges, on average, from +0.175 to +0.210. For comparison, for 1 Mg of manure, the coefficient is +0.070, and for 1 m3 of slurry, it is +0.014 to +0.028 [7]. In our experiment, the addition of wheat or rape straw to the soil increased the C content, with a stronger effect recorded in treatments with UFF than with urea. This difference could be the result of the presence of other substances containing C (22% ethyl esters of fatty acid and 5% ethanol) in the UFF, besides urea. With UFF containing 33% N, in order to apply the same dose of N as in urea, the mass of the added UFF had to be higher and, consequently, there was also a higher addition of C compounds. The addition of a Ure inhibitor after the application of urea and wheat straw increased the C content in the soil, but this was not noted after the application of UFF with rape straw and a Ure inhibitor. This could be due to the rape straw containing slightly less fibre than wheat straw, with both types of straw containing comparable amounts of simple carbohydrates, but the rape straw containing about 1.2 times more protein and 1.7 times more fat than the wheat straw [58].
The mineralization processes of OM are influenced by many factors, including the type of OM, soil pH, temperature and humidity. The rate of these processes increases when mineral fertilizers containing N are used, especially urea, because the C:N ratio is narrowed [59,60]. The high activity noted in all the studied enzymes (DHA, Ure and Inv), especially in the early incubation period, indicates the development of microorganisms, which might have caused the immobilization of mineral N. Hence, in our studies, we found no differences in the total N contents.
Because we noted an increase in the C contents with the UFF treatments compared to the urea treatments, but no differences in the N contents, we can only partly confirm our hypothesis concerning the beneficial effects of UFF on C and N accumulation in the soil.

4.2. Implications of the Application of Urea and Straw on the Transformation of Soil Organic Matter

We assumed that the application of UFF to the soil would accelerate straw decomposition and thus nutrient release compared to the urea with straw. Large fragments of straw residues (Und OM), as calculated from the scanned images, occupied smaller areas in the treatments fertilized with UFF compared to those fertilized with urea, indicating the positive effect of UFF on the initial decomposition of the straw. In the further straw decomposition stage, evaluated through the percentage area covered by fine fragments of OM observed under the microscope, there were no statistical differences regarding Undfn OM and SlgDecOM between the urea and UFF treatments. The formation of more recalcitrant OM during the decomposition process is accompanied by the loss of organic C resulting from OM mineralization [61]. Usually, OM mineralization is measured by capturing the CO2 released [62,63]. Because we did not perform this analysis, we evaluated the amount of mineralized OM by comparing the differences in percentage area covered by total and Macroagg OM between treatments. With urea, there were much larger areas of total and Macroagg OM than with UFF. Thus, again we concluded that UFF stimulated OM mineralization over OM stabilization. However, macroaggregates are often considered unstable, easily disaggregating into more stable microaggregates [64]. The lower share of microaggregates (Dec OM and ModDec OM) observed with UFF (about 15%) than with urea (about 21%) proved the weaker effect of UFF on OM stabilization compared to urea. Therefore, the micromorphological and micromorphometric studies confirmed our hypothesis regarding the effect of UFF on straw decomposition through enhanced mineralization, which occurred at the expense of decomposed OM stabilization.
In our experiment, we used wheat and rape straw, which are among the most abundant agricultural residue biomasses in the world, used mainly as litter for livestock or as supplements in agriculture [65]. Both types of straw have similar chemical compositions—cellulose (about 35–40%), hemicelluloses (20–30%) and lignin (15–20%), with small amounts of ash and protein [66]. During the decomposition of straw introduced into soil, interactions between physical (fragmentation) and chemical (reactions between chemical compounds as a result of microbial transformations, including enzyme activity) processes occur [61]. Among the enzymes we studied, Inv activity was the most prevalent in decomposing the straw, but there were different levels of Inv activity between the wheat and rape straw treatments. With the wheat straw, a peak in enzyme activity was recorded on the first day after the straw was introduced, followed by a slow decrease in activity. With the rape straw, there were two peaks in Inv activity: on the first day after the straw was added and then, most notably for the rape + urea treatment, on the 90th day of incubation. Invertase is responsible for the breakdown of water-soluble plant material, and this increase in enzyme activity over time reflects a change in metabolism from low-molecular towards polymetric substrates [67]. The stages of straw decomposition follow a pattern of the breaking down of easily mineralized C fractions (first Inv activity peak), followed by decomposition of the hemicellulose, cellulose and lignin. A prevalence of hemicelluloses containing some water-soluble compounds in the rape straw may have caused the second peak in Inv activity. Wheat straw is often considered to be less decomposable than rape straw because it contains higher proportions of resistant cellulose [58]. However, there are also opinions regarding higher recalcitrance of rape straw than wheat resulting from a very high C/N ratio in rape straw, exceeding 150, and hence containing too much C in relation to N, which may restrict the microorganisms’ activity [68]. Under our experimental conditions, we observed a higher presence of straw residues in the treatments with rape straw than with wheat straw, probably due to factors outside the scope of our study, such as the internal structure of the plants or their biophysical accessibility to decomposers. Our observations were in line with Energies, who attributed a high rape straw resistance to decomposition to the high content of lignin. The presence of lignin can slow down the straw biodegradability, acting as an obstacle limiting the access of hydrolytic enzymes to cellulose and hemicellulose. Moreover, it was found that among microorganisms decomposing straw, fungal community plays a big role, which exhibits different abilities to decompose components of the straw, and some of them are able to degrade cellulose but not lignin [69].

4.3. Main Factors Shaping Treated Soil Properties at the End of the Experiment

The first factor (PC1) differentiated the treatments based on fertilization method (urea versus UFF). Fertilization with UFF produced a larger amount of undecomposed and slightly decomposed OM and higher enzyme activity, whereas treatment with urea produced decomposed OM mostly in the form of aggregates. The increased formation of aggregate with the urea treatment probably resulted from an increase in microorganism biomass in the early stages of the experiment, followed by high necromass production causing physical stabilization of the OM through mineralization, as previously reported by Ling et al. [70] and Hamer and Marschner [71] after urea application.
The second factor (PC2) also correlated positively with undecomposed OM, while Ure was positively correlated with pH and slightly decomposed OM. A similar relationship between enzyme activity and OM components (C and N) was determined by Bielinska and Mocek-Plóciniak [72] under field conditions, in the topsoil layers of a no-till system, where DHA was higher by 50–70% and Ure by 40% compared to an analogous soil in a till system. The authors associated this with the high C and N contents in the no-till soil.
In summary, the PCA placed a greater importance on the type of fertilizer than the type of straw in shaping the soil properties. Moreover, it emphasized the effect of urea on the stabilization of the OM through both macro- and microaggregate formation. However, the effect of the decomposition of OM was also influenced by the type of straw, with the wheat straw decomposing slightly more slowly than the rape straw. Consequently, in the treatments with wheat straw, there was more undecomposed OM compared with the treatments with rape straw.
The results of our experiment indicate that the effect of UFF on the soil properties was, from some aspects, not as good as urea, such as it having less of an effect on organo-mineral aggregate formation. However, in some respects, UFF was better than urea, such as in accelerating the decomposition of newly introduced OM. Under current global conditions, the need for increasingly higher food production requires high doses of N fertilizers. However, according to the rules governing the sustainable management of environmental resources, N fertilizer use must be optimized and NH3 losses limited, and stored C from decomposition needs to be increasingly protected to ensure its long-term persistence [73]. Therefore, N fertilizers must be not only easily available to plants but must also be environmentally friendly, and their contamination of the environment prevented. Another aspect is the reuse of by-products, such as straw, in soil improvement. Being biologically based, these products have less of a negative effect on soil’s biological elements. In light of the above considerations, UFF as a N fertilizer seems to be a good alternative to urea.

4.4. The Practical Application Effect and Cost of UFF in the Field

The effect of Ure inhibitors on yields and N use efficiency is variable and depends on environmental factors. Reference [74] noted that the use of inhibitors increased crop yield by 7.5% and N use efficiency by 12.9%. Zaman et al. [75] showed that the use of urea with a Ure inhibitor increases the dry matter yield from pasture fertilized with a dose of 30 kg N ha−1 by 11.2%, and, after the application of 60 kg N ha−1, by 8.3%, compared to fertilization with urea alone. The efficiency of N use was higher after the application of its lower dose. In light, permeable soils, when high N doses were applied, the efficiency of N use was low and amounted to 30–50% when inhibitors were not used, and increased significantly with the use of inhibitors. When using inhibitors, it should be taken into account that they constitute an additional cost for farmers, which depends on the difference in the price of urea with and without a Ure inhibitor, which is currently about 2%. The price of UFF fertilizer (currently commercially available as UREA Amid 33™ [N]) is about 2.5 times lower than that of urea (commercially available as Pulrea), so the profitability of using UFF is greater due to the fact that the cost of 1 kg of N in UFF fertilizer is about 1.7 times lower than the cost of 1 kg of N in urea. Both the cost of UFF fertilizer and the efficiency of using N from this fertilizer endorse its use in sustainable agriculture, and, in addition, considering its origin as waste, the use of UFF fits into the circular economy assumptions.

5. Conclusions

For the sake of the environment, and in line with the rules of the circular economy, N should be used in by-product from which it is released slowly. One N fertilizer meeting these criteria is UFF, a waste product from the fishing industry. In our experiment, UFF compared favourably with urea (a traditional fertilizer) in its effect on soil, together with the addition of straw. We demonstrated that the application of both urea and UFF fertilizers had an acidifying effect on the soil, which was slightly stronger with UFF. Both fertilizers and straw types slightly increased the total C (at the end of the experiment) and total N (on the first day) contents of the soil compared to the control treatment. Both fertilizers also increased the soil enzyme activity at the beginning of the experiment. However, a gradual decrease in pH values and substrates available for microbes due to straw mineralization caused a decrease in all enzyme activity over time. Under our experimental conditions, the wheat straw decomposed faster than the rape straw, especially when UFF fertilizer was used, which accelerated OM mineralization. Urea application had a more stabilizing effect on the OM, which occurred in form of stable microaggregates. We found similar effects on the studied soil properties from the urea and UFF fertilizers, but each had pros and cons. Ultimately, UFF could be used as slow-release N fertilizer, although further research is needed to verify our findings under field conditions (variable soil moisture dependent on precipitation and the influence of air movement on evapotranspiration), where the reaction of crops to UFF fertilization, in terms of yield quality and quantity, must be evaluated. Due to different climatic and soil conditions in the field, the results of the application of the fertilizer materials used in the incubation experiment may vary.

Author Contributions

Conceptualization, B.F.-M., B.W.-K. and K.C.; methodology, B.F.-M., B.W.-K. and K.C.; software, K.C., B.W.-K., L.W. and B.F.-M.; validation, K.C., B.W.-K., L.W. and B.F.-M.; formal analysis, B.F.-M., B.W.-K., K.C. and L.W.; investigation, B.W.-K., B.F.-M. and K.C.; resources B.W.-K. and B.F.-M.; data curation, B.W.-K., B.F.-M. and K.C.; writing—original draft preparation, B.F.-M., K.C. and B.W.-K.; writing—review and editing, B.F.-M., B.W.-K. and K.C.; visualization, K.C., B.W.-K., L.W. and B.F.-M.; supervision, K.C., B.W.-K. and B.F.-M.; project administration, B.W.-K. and B.F.-M.; funding acquisition, B.F.-M. and B.W.-K. All authors have read and agreed to the published version of the manuscript.

Funding

The research received financial support from the Innovation Center of the University of Agriculture in Krakow Sp. z o. o.

Institutional Review Board Statement

Not applicable.

Informed Consent Statement

Not applicable.

Data Availability Statement

Data are contained within the article.

Acknowledgments

The authors would like to thank Florian Gambuś for the inspiration to undertake the research and Olga Gorczyca, Katarzyna Szczurowska, and Marcin Setlak for participating in the laboratory studies.

Conflicts of Interest

The authors declare no conflicts of interest.

Appendix A

Figure A1. Dehydrogenase activity on all the sampling days grouped according to the experiment treatments. Different letters show statistical differences at p < 0.05.
Sustainability 17 05529 g0a1
Figure A2. Invertase activity on all the sampling days grouped according to the experiment treatments. Different letters show statistical differences at p < 0.05.
Sustainability 17 05529 g0a2
Figure A3. Urease activity on all the sampling days grouped according to the experiment treatments. Different letters show statistical differences at p < 0.05.
Sustainability 17 05529 g0a3

References

  1. Jaworski, T.J.; Grochowska, S. Circular Economy—The criteria for achieving and the prospect of implementation in Poland. Arch. Waste Manag. Environ. Prot. 2017, 19, 13–22. (In Polish) [Google Scholar]
  2. Filipek-Mazur, B.; Pużyńska, K.; Tabak, M.; Pużyński, S. Enzymatic Activity of Soil under Spelt Grown in An Organic Farming System in Poland’s Temperate Climate. Agronomy 2020, 10, 930. [Google Scholar] [CrossRef]
  3. Sawicka, B.; Krochmal-Marczak, B.; Pszczókowski, P.; Bielińska, E.J.; Wójcikowska-Kapusta, A.; Barbaś, P.; Skiba, D. Effect of Differentiated Nitrogen Fertilization on the Enzymatic Activity of the Soil for Sweet Potato (Ipomoea batatas L. [Lam.]) Cultivation. Agronomy 2020, 10, 1970. [Google Scholar] [CrossRef]
  4. ACT of 10 July 2007 on Fertilizers and Fertilization, Journal of Laws of 2024, Item 105; Chancellery of the Parliament of RP: Warszawa, Poland, 2007.
  5. Wiśniowska-Kielian, B.; Filipek-Mazur, B.; Gambuś, F. Possibility of Using the By-Product of Fatty Acid Extraction from Fish in Fertilization as an Element of the Circular Economy. Agronomy 2024, 14, 127. [Google Scholar] [CrossRef]
  6. Chen, W.; He, P.; Zhang, H.; Lü, F. Effects of volatile fatty acids on soil properties, microbial communities, and volatile metabolites in wheat rhizosphere of loess. J. Clean. Prod. 2024, 476, 143798. [Google Scholar] [CrossRef]
  7. Pikuła, D. Wpływ wieloletniego nawożenia słomą na plonowanie roślin i żyzność gleby. Stud. Rap. IUNG-PIB 2015, 45, 85–96. (In Polish) [Google Scholar] [CrossRef]
  8. Duer, I.; Fotyma, M.; Madej, A. (Eds.) Kodeks Dobrej Praktyki Rolniczej; Ministerstwo Rolnictwa i Rozwoju Wsi, Ministerstwo Środowiska: Warszawa, Poland, 2004; p. 98. (In Polish) [Google Scholar]
  9. Gardziuk, P. Gospodarcze Znaczenie i Możliwości Wykorzystania Słomy Na Cele Energetyczne W Polsce; Monografie i Rozprawy Naukowe; IUNG-PIB Puławy: Puławy, Poland, 2015; Volume 45, p. 173. [Google Scholar]
  10. Spöttle, M.; Alberici, S.; Toop, G.; Peters, D.; Gamba, L.; Ping, S.; van Steen, H.; Bellefleur, D. Cereal straw. In Low ILUC Potential of Wastes and Residues for Biofuels; Project no. BIEDE 13386/BIENL12798; ECOFYS Netherlands B.V.: Utrecht, The Netherlands, 2013; pp. 7–48. [Google Scholar]
  11. Harasim, A. Plony słomy wybranych zbóż w zależności od sposobu jej zbioru. Pol. J. Agron. 2016, 26, 34–38. (In Polish) [Google Scholar]
  12. Ludwicka, A.; Grzybek, A. Bilans biomasy rolnej (słomy) na potrzeby energetyki. Probl. Inżynierii Rol. 2010, 2, 101–111. (In Polish) [Google Scholar]
  13. Sun, R.C.; Tomkinson, J. Separation and Characterization of Cellulose from Wheat Straw. Sep. Sci. Technol. 2005, 39, 391–411. [Google Scholar] [CrossRef]
  14. Kuś, A.; Madej, A. Zagospodarowanie słomy a bilans materii organicznej. Zagadnienia Doradz. Rol. 2017, 90, 40–57. (In Polish) [Google Scholar]
  15. Zhao, S.; Li, K.; Zhou, W.; Qiu, S.; Huang, S.; He, P. Changes in soil microbial community, enzyme activities and organic matter fractions under long-term straw return in North-central China. Agric. Ecosyst. Environ. 2016, 216, 82–88. [Google Scholar] [CrossRef]
  16. Chen, J.; Zheng, M.; Pang, D.; Yin, Y.; Han, M.; Li, Y.; Luo, Y.; Xu, X.; Li, Y.; Wang, Z. Straw return and appropriate tillage method improve grain yield and nitrogen efficiency of winter wheat. J. Integr. Agric. 2017, 16, 1708–1719. [Google Scholar] [CrossRef]
  17. Tian, P.; Lian, H.; Wang, Z.; Jiang, Y.; Li, C.; Sui, P.; Qi, H. Effects of deep and shallow tillage with straw incorporation on soil organic carbon, total nitrogen and enzyme activities in Northeast China. Sustainability 2020, 12, 8679. [Google Scholar] [CrossRef]
  18. Stoops, G. Guidelines for Analysis and Description of Soil and Regolith Thin Sections, 2nd ed.; SSSA: Madison, WI, USA, 2003. [Google Scholar]
  19. Ciarkowska, K. Organic matter transformation and porosity development in non-reclaimed mining soils of different ages and vegetation covers: A field study of soils of the zinc and lead ore area in SE Poland. J. Soils Sediments 2017, 17, 2066–2079. [Google Scholar] [CrossRef]
  20. Zaiets, O.; Poch, R.M. Micromorphology of organic matter and humus in Mediterranean mountain soils. Geoderma 2016, 272, 83–92. [Google Scholar] [CrossRef]
  21. PN-R-04032; Soil and Mineral Materials—Sampling and Determination of Particle Size Distribution. Polish Committee for Standardization: Warsaw, Poland, 1998.
  22. IUSS Working Group WRB. World Reference Base for Soil Resources. In International Soil Classification System for NAMING Soils and Creating Legends for Soil Maps, 4th ed.; International Union of Soil Sciences (IUSS): Vienna, Austria, 2022. [Google Scholar]
  23. Tan, K.T. Soil Sampling, Preparation and Analysis; Taylor & Francis Group: Boca Raton, FL, USA, 2005. [Google Scholar]
  24. Elementar Analysensysteme GmbH. Operating Instructions Vario MAX Cube Analyzer; Version 12.11.2013; Elementar Analysensysteme GmbH: Langenselbold, Duitsland, 2013. [Google Scholar]
  25. Ostrowska, A.; Gawliński, S.; Szczubiałka, Z. Metody Analizy i Oceny Właściwości Gleb i Roślin; Katalog; Instytut Ochrony Środowiska: Warsaw, Poland, 1991. [Google Scholar]
  26. Gorlach, E.; Mazur, T. Agricultural chemistry. In Basics of Nutrition and Principles of Fertilization; PWN: Warszawa, Poland, 2001; p. 347. (In Polish) [Google Scholar]
  27. Thalmann, A. Methods of dehydrogenase activity determination with triphenyltetrazoliumchlorid (TTC). Landwirtsch. Forsch. 1968, 21, 249–258. [Google Scholar]
  28. Kandeler, E.; Gerber, H. Short-term assay of soil urease activity using colorimetric determination of ammonium. Biol. Fertil. Soils 1988, 6, 68–72. [Google Scholar] [CrossRef]
  29. Frankenberger, W.T., Jr.; Johanson, J.B. Factors affecting invertase activity in soils. Plant Soil 1983, 74, 313–323. [Google Scholar] [CrossRef]
  30. Otsu, N. A threshold selection method from grey-level histograms. IEEE Trans. Syst. Man Cybern. 1979, 9, 62–66. [Google Scholar] [CrossRef]
  31. Food and Agriculture Organization. Guidelines for Soil Description; Food and Agriculture Organization: Rome, Italy, 2006; ISBN 92-5-105521-1. [Google Scholar]
  32. González-Vargas, T.; Gutiérrez-Castorena, M.D.C. Brightness values-based discriminant functions for classification of degrees of organic matter decomposition in soil thin sections. Span. J. Soil Sci. 2022, 12, 10348. [Google Scholar] [CrossRef]
  33. Statistica (Data Analysis Software System); StatSoft Inc.: Tulsa, OK, USA, 2019.
  34. ter Braak, C.J.F.; Smilauer, P. Canoco Reference Manual and User’s Guide: Software for Ordination, version 5.1; Wageningen University & Research: Wageningen, The Netherlands, 2012. [Google Scholar]
  35. Ghaly, A.E.; Ramakrishnan, V.V. Nitrification of Urea and Assimilation of Nitrate in Saturated Soils Under Aerobic Conditions. Am. J. Agric. Biol. Sci. 2013, 8, 330–342. [Google Scholar] [CrossRef]
  36. Zhang, Y.; Ju, S.; Wang, W.; Wu, F.; Pan, K. Effects of decomposed and undecomposed straw of three crops on clubroot disease of Chinese cabbage and soil nutrients. Sci. Rep. 2024, 14, 22990. [Google Scholar] [CrossRef]
  37. Chen, L.; Sun, S.; You, B.; Peng, Y.; Gao, C.; Qin, T.; Zhau, Y.; Sun, C.; Quan, W. Effects of straw return and straw biochar on soil properties and crop growth: A review. Front. Plant Sci. 2020, 13, 986763. [Google Scholar] [CrossRef]
  38. Yan, F.; Schubert, S. Soil pH changes after application of plant shoot materials of faba bean and wheat. Plant Soil 2000, 220, 279–287. [Google Scholar] [CrossRef]
  39. Karcz, H.; Kantorek, M.; Grabowicz, M.; Wierzbicki, K. Możliwość wykorzystania słomy jako źródła paliwowego w kotłach energetycznych (The feasibility of straw as a fuel source for power generating boilers). Piece Przemysłowe Kotły 2013, XI–XII, 8–15. (In Polish) [Google Scholar]
  40. Abalos, D.; Sanz-Cobena, A.; Misselbrook, T.; Vallejo, A. Effectiveness of urease inhibition on the abatement of ammonia, nitrous oxide and nitric oxide emissions in a non-irrigated Mediterranean barley field. Chemosphere 2012, 89, 310–318. [Google Scholar] [CrossRef] [PubMed]
  41. Kira, O.; Shaviv, A.; Dubowski, Y. Concomitant tracking of NH3, N2O and soil mineral-N using steady-state incubation cells to enhance sustainability of urea fertilization approaches. Geoderma 2021, 404, 115305. [Google Scholar] [CrossRef]
  42. Britto, D.T.; Kronzucker, H.J. NH4+ toxicity in higher plants: A critical review. J. Plant Physiol. 2002, 159, 567–584. [Google Scholar] [CrossRef]
  43. Yin, C.; Li, L.; Zhao, J.; Yang, J.; Zhao, H. Impacts of Returning Straw and Nitrogen Application on the Nitrification and Mineralization of Nitrogen in Saline Soil. Water 2023, 15, 564. [Google Scholar] [CrossRef]
  44. da Fonseca, A.B.; Santos, C.; Nunes, A.P.P.; Oliveira, D.P.; de Melo, M.E.A.; Takayama, T.; Mansur, B.L.; de Jesus Fernandes, T.; do Carmo Alexandrino, G.; Neves Dias, M.A.; et al. Urease inhibitors technologies as strategy to mitigate agricultural ammonia emissions and enhance the use efficiency of urea-based fertilizers. Sci. Rep. 2023, 13, 22739. [Google Scholar] [CrossRef]
  45. Adetunji, A.T.; Ncube, B.; Mulidzi, A.R.; Lewu, F. Potential Use of Soil Enzymes as Soil Quality Indicators in Agriculture. In Frontiers in Soil and Environmental Microbiology, 1st ed.; Nayak, S.K., Mishra, B.B., Eds.; CRC Press-Taylor & Francis Group: Boca Raton, FL, USA, 2020; Chapter 6. [Google Scholar] [CrossRef]
  46. Siwik-Ziomek, A.; Koper, J. Kształtowanie aktywności dehydrogenaz w glebie płowej po zmianie nawożenia. Zesz. Probl. Postępów Nauk. Rol. 2006, 512, 521–527. [Google Scholar]
  47. Gałązka, A.; Gawryjołek, K.; Grządziel, J.; Frąc, M.; Księżak, J. Microbial community diversity and the interaction of soil under maize growth in different cultivation techniques. Plant Soil Environ. 2017, 63, 264–270. [Google Scholar] [CrossRef]
  48. Cenini, V.L.; Fornara, D.A.; Mcmullan, G.; Ternan, N.; Carolan, R.; Crawley, M.J.; Clement, J.C.; Lavorel, S. Linkages between extracellular enzyme activities and the carbon and nitrogen content of grassland soils. Soil Biol. Biochem. 2016, 96, 198–206. [Google Scholar] [CrossRef]
  49. Chang, E.H.; Chung, R.S.; Tsai, Y.T. Effect of different application rates of organic fertilizer on soil enzyme activity and microbial population. Soil Sci. Plant Nutr. 2007, 53, 132–140. [Google Scholar] [CrossRef]
  50. Romero, E.; Fernández-Bayo, J.; Díaz, J.M.C.; Nogales, R. Enzyme activities and diuron persistence in soil amended with vermicompost derived from spent grape marc and treated with urea. Appl. Soil Ecol. 2010, 44, 198–204. [Google Scholar] [CrossRef]
  51. Tabak, M.; Lisowska, A.; Filipek-Mazur, B. Bioavailability of Sulfur from Waste Obtained during Biogas Desulfurization and the Effect of Sulfur on Soil Acidity and Biological Activity. Processes 2020, 8, 863. [Google Scholar] [CrossRef]
  52. Zimmerman, A.R.; Ahn, M.-Y. Organo-Mineral–Enzyme Interaction and Soil Enzyme Activity. In Soil Enzymology. Soil Biology; Shukla, G., Varma, A., Eds.; Springer: Berlin/Heidelberg, Germany, 2011; Volume 22, pp. 271–292. [Google Scholar] [CrossRef]
  53. Reichel, R.; Wei, J.; Islam, M.S.; Schmid, C.; Wissel, H.; Schlöder, P.; Schloter, M.; Brüggemann, N. Potential of wheat straw, spruce sawdust and lignin as high organic carbon soil amendments to improve agricultural nitrogen capacity: An incubation study. Front. Plant Sci. 2018, 9, 900. [Google Scholar] [CrossRef]
  54. Jiang, D.; Jiang, N.; Jiang, H.; Chen, L. Urease inhibitors increased soil ureC gene abundance and intracellular urease activity when extracellular urease activity was inhibited. Geoderma 2023, 430, 116295. [Google Scholar] [CrossRef]
  55. Liu, Y.; He, N.; Xu, L.; Tian, J.; Gao, Y.; Zheng, S.; Wang, Q.; Wen, X.; Xu, X.; Yakov, K. A new incubation and measurement approach to estimate the temperature response of soil organic matter decomposition. Soil Biol. Biochem. 2019, 138, 107596. [Google Scholar] [CrossRef]
  56. Liu, L.; Cheng, M.; Jin, J.; Fu, M. Effects of different nitrogen applications and straw return depth on straw microbial and carbon and nitrogen cycles in paddy fields in the cool zone. Sci. Rep. 2024, 14, 6424. [Google Scholar] [CrossRef]
  57. Jin, Z.; Shah, T.; Zhang, L.; Liu, H.; Peng, S.; Nie, L. Effect of straw returning on soil organic carbon in rice–wheat rotation system: A review. Food Energy Secur. 2020, 9, e200. [Google Scholar] [CrossRef]
  58. Skonecki, S.; Potręć, M.; Laskowski, J. Physical and chemical properties of agricultural wastes/Właściwości fizyczne I chemiczne odpadów rolniczych. Acta Agrophysica 2011, 18, 443–455. (In Polish) [Google Scholar]
  59. Cassity-Duffey, K.; Cabrera, M.; Franklin, D.; Gaskin, J.; Kissel, D. Effect of soil texture on nitrogen mineralization from organic fertilizers in four common southeastern soils. Soil Sci. Soc. Am. J. 2020, 84, 534–542. [Google Scholar] [CrossRef]
  60. Uddin, S.; Islam, M.R.; Jahangir, M.M.R.; Rahman, M.M.; Hassan, S.; Hassan, M.M.; Abo-Shosha, A.A.; Ahmed, A.F.; Rahman, M.M. Nitrogen Release in Soils Amended with Different Organic and Inorganic Fertilizers under Contrasting Moisture Regimes: A Laboratory Incubation Study. Agronomy 2021, 11, 2163. [Google Scholar] [CrossRef]
  61. Müller, R.; Zahorka, A.; Holawe, F.; Inselsbacher, E.; Glatzel, S. Incubation of ombrotrophic bog litter and mixtures of Sphagnum, Betula and Calluna results in the formation of single litter-specific decomposition patterns. Geoderma 2023, 440, 116702. [Google Scholar] [CrossRef]
  62. Sánchez-Rodríguez, A.R.; del Campillo, M.C.; Torrent, J.; Cooledge, E.C.; Chadwick, D.R.; Jones, D.L. Phosphorus fertilization promotes carbon cycling and negatively affects microbial carbon use efficiency in agricultural soils: Laboratory incubation experiments. Geoderma 2024, 450, 117038. [Google Scholar] [CrossRef]
  63. Xing, H.; Wang, E.; Smith, C.J.; Rolston, D.; Yu, Q. Modelling nitrous oxide and carbon dioxide emission from soil in an incubation experiment. Geoderma 2011, 167–168, 328–339. [Google Scholar] [CrossRef]
  64. de Carvalho, M.; Ciarkowska, K.; Wojnar, L. Contribution of the Soil Macro- and Microstructure to Organic Matter Stabilisation in Natural and Post-Mining/Industrial Soils under Temperate Climatic Conditions. Sustainability 2024, 16, 2747. [Google Scholar] [CrossRef]
  65. Kim, S.; Dale, B.E. Global Potential bioethanol Production from Wasted Crops and Crop Residues. Biomass Bioenergy 2004, 26, 361–375. [Google Scholar] [CrossRef]
  66. Carvalheiro, F.; Silva-Fernandes, T.; Duarte, L.C.; Gírio, F.M. Wheat Straw Autohydrolysis: Process Optimization and Products Characterization. Appl. Biochem. Biotechnol. 2009, 153, 84–93. [Google Scholar] [CrossRef]
  67. Luxhøi, J.; Magid, J.; Tscherko, D.; Kandeler, E. Dynamics of invertase, xylanase and coupled quality indices of decomposing green and brown plant residues. Soil Biol. Biochem. 2002, 34, 501–508. [Google Scholar] [CrossRef]
  68. Witaszek, K.; Kupryaniuk, K.; Kupryaniuk, J.; Panasiewicz, J.; Czekała, W. Optimization of Straw Particle Size for Enhanced Biogas Production: A Comparative Study of Wheat and Rapeseed Straw. Energies 2025, 18, 1794. [Google Scholar] [CrossRef]
  69. Kabuyah, R.N.T.M.; van Dongen, B.E.; Bewsher, A.D.; Robinson, C.H. Decomposition of lignin in wheat straw in a sand-dune grassland. Soil Biol. Biochem. 2012, 45, 128–131. [Google Scholar] [CrossRef]
  70. Ling, J.; Dungait, J.A.J.; Delgado-Baquerizo, M.; Ciu, Z.; Zhou, R.; Zhang, W.; Gao, Q.; Chen, Y.; Yue, S.; Kuzyakov, Y.; et al. Soil organic carbon thresholds control fertilizer effects on carbon accrual in croplands worldwide. Nat. Commun. 2025, 16, 3009. [Google Scholar] [CrossRef]
  71. Hamer, U.; Marschner, B. Priming effects in soils after combined and repeated substrate additions. Geoderma 2005, 128, 38–51. [Google Scholar] [CrossRef]
  72. Bielińska, E.J.; Mocek-Płóciniak, A. Impact of the tillage system on the soil enzymatic activity. Arch. Environ. Prot. 2012, 38, 75–82. [Google Scholar] [CrossRef]
  73. Motasim, A.M.; Samsuri, A.W.; Nabayi, A.; Akter, A.; Haque, M.A.; Sukor, A.S.A.; Adibah, A.M. Urea application in soil: Processes, losses, and alternatives—A review. Discov. Agric. 2024, 2, 42. [Google Scholar] [CrossRef]
  74. Abalos, D.; Jeffery, S.; Sanz-Cobena, A.; Guardia, G.; Vallejo, A. Meta-analysis of the effect of urease and nitrification inhibitors on crop productivity and nitrogen use efficiency. Agric. Ecosyst. Environ. 2014, 189, 136–144. [Google Scholar] [CrossRef]
  75. Zaman, M.; Zaman, S.; Adhinarayanan, C.; Nguyen, M.L.; Nawaz, S.; Dawar, K.M. Effects of urease and nitrification inhibitors on the efficient use of urea for pastoral systems. Soil Sci. Plant Nutr. 2013, 59, 649–659. [Google Scholar] [CrossRef]
Figure 1. The example of the image acquisition and segmentation (rape + UFF treatment).
Sustainability 17 05529 g001
Figure 2. DHA changes in the treatments during the incubation expressed as unweighted means (time × treatment).
Sustainability 17 05529 g002
Figure 3. Inv changes in the treatments during the incubation expressed as unweighted means (time × treatment).
Sustainability 17 05529 g003
Figure 4. Ure changes in the treatments during the incubation expressed as unweighted means (time × treatment).
Sustainability 17 05529 g004
Figure 5. Stages of OM decomposition estimated in thin sections using the scheme of description after González-Vargas and Gutiérrez-Castorena (2022) [32] are given in Table 1. UndfnOM: undecomposed OM, SlgDecOM: slightly decomposed OM, ModDecOM: moderately decomposed organic matter, Microagg: decomposed fine OM. Different letters show statistical differences at p < 0.05.
Sustainability 17 05529 g005
Figure 6. Microphotographs representing stages of OM decomposition: (A): fragments of Undfn OM pieces of straw with well-preserved tissues and a group of small aggregates on example of wheat + UFF treatment in plane polarized light, (B): an aggregate composed of decomposed OM and quartz crystals and an aggregate of moderately decomposed OM in plane polarized light in rape + UFF treatment, (C,D): highly isotropic microagg, ModDecOM and SlgDecOM in wheat + urea treatment, in plane polarized and cross polarized lights.
Sustainability 17 05529 g006
Figure 7. Principal component analysis (PCA) showing the relationship between the examined variables (selected soil parameters) and the selected treatments. Abbreviations for treatments are given in Table 1. In PCA, the following soil parameters were included: pH, total C content (C), total N content (N), dehydrogenase activity (DHA), invertase activity (inv) and urease activity (ure), as well as stages of OM decomposition: UndOM—undecomposed OM, Macroagg—decomposed OM in aggregated form—both calculated from scanned images, Microagg—fine aggregates of decomposed OM, UnfnOM—undecomposed fine parts of OM, SlgDecOM—slightly decomposed OM, ModDecOM—moderately decomposed OM—all results of microscopic observation. Detailed description of fine OM forms is in Table 2.
Sustainability 17 05529 g007
Table 1. Scheme of the incubation experiment.
TreatmentsAcronym
Control—soil without any additivesCrt
Soil + wheat straw + ureawheat + urea
Soil + wheat straw + urea + urease inhibitorwheat + urea + inh
Soil + wheat straw + UFFwheat + UFF
Soil + wheat straw + UFF + urease inhibitorwheat + UFF + inh
Soil + raped straw + urearape + urea
Soil + raped straw + urea + urease inhibitorrape + urea + inh
Soil + raped straw + UFFrape + UFF
Soil + raped straw + UFF + urease inhibitorrape + UFF + inh
Table 2. Optical properties of OM decomposition stages.
ClassPPLXPL
ColourOpacityInternal Structure (%)BirefringenceIsotropy
1. Non-decomposed fine organic partslight brown-75–100high-
(UndfnOM)
2. Slightly decomposed fine organic partsyellowish brown-50–75low-
(SlgDecOM)
3. Moderately decomposed fine organic partsreddish brown to dark brownmedium25–50-high
(ModDecOM)
4. Decomposed fine organic partsdark brown to blackhigh--high
(Microagg)
Slightly modified after González-Vargas and Gutiérrez-Castorena [32].
Table 3. Soil pH values, total carbon and nitrogen contents during the incubation experiment.
TreatmentspHH2OCN
g·kg−1 d.m.
Days of Incubation
112011201120
Crt6.89 c *6.10 b13.87 ab13.27 a1.29 a1.30 ab
wheat + urea7.27 d5.99 ab15.13 ab14.53 ab1.43 ab1.42 ab
wheat + urea + inh7.24 d5.93 a15.30 ab14.63 ab1.43 ab1.44 ab
wheat + UFF7.20 d5.93 a15.83 ab14.47 ab1.48 b1.42 ab
wheat + UFF + inh7.20 d6.00 ab15.67 ab14.17 ab1.44 ab1.38 ab
rape + urea7.18 d6.09 b16.10 b14.63 ab1.43 ab1.43 ab
rape + urea + inh7.17 d6.04 ab15.73 ab14.00 ab1.45 ab1.37 ab
rape + UFF7.19 d6.05 ab14.13 ab13.93 ab1.39 ab1.37 ab
rape + UFF + inh7.17 d6.09 b14.80 ab14.17 ab1.43 ab1.40 ab
Univariate tests of significance
timeF944119.483.50
p0.00000.00000.069
treatmentF62.954.48
p0.00010.01210.001
Time × treatmentF200.670.53
p0.00000.71660.829
Squares sum test for the full model vs. squares sum for residuals
R2 corrected0.9950.3720.333
F567.562.8472.563
p0.0000.0040.009
* mean values marked with the same letters do not differ statistically significantly at the significance level of p < 0.05.
Table 4. One-dimensional significance tests for the enzyme activity. Results of two-way analysis.
EffectDHAInvUre
timeF237.796115.9911050.740
p0.0000.0000.000
treatmentF11.86669.75314.299
p0.0000.0000.000
Time × treatmentF3.6879.44610.236
p0.0010.0000.000
R values for the full models
R2 adjusted0.8930.8970.961
F26.45727.40576.029
p0.0000.0000.000
Table 5. Results of the image analysis performed on scanned images.
TreatmentUndOMMacroaggSum
%
Crt11.225.9517.17
wheat + urea23.1116.3039.41
wheat + UFF15.5613.5729.13
rape + urea30.546.8637.40
rape + UFF23.394.0027.39
UndOM—undecomposed organic matter (residues of plants with the internal structure), Macroagg—decomposed, isotropic organic matter.
Disclaimer/Publisher’s Note: The statements, opinions and data contained in all publications are solely those of the individual author(s) and contributor(s) and not of MDPI and/or the editor(s). MDPI and/or the editor(s) disclaim responsibility for any injury to people or property resulting from any ideas, methods, instructions or products referred to in the content.

