Article

Unravelling Landscape Evolution and Soil Erosion Dynamics in the Xynias Drained Lake Catchment, Central Greece: A GIS and RUSLE Modelling Approach

by
Nikos Charizopoulos
1,*,
Simoni Alexiou
1,
Nikolaos Efthimiou
2,
Emmanouil Psomiadis
1 and
Panagiotis Arvanitis
3
1
Department of Natural Resources & Agricultural Engineering, Laboratory of Mineralogy-Geology, Agricultural University of Athens, Iera Odos 75, 118 55 Athens, Greece
2
Faculty of Environmental Sciences, Czech University Life Sciences Prague, 165 00 Prague, Czech Republic
3
Geological and Research Services, Panagiotis Arvanitis, Ypsilantou 55, 351 31 Lamia, Greece
*
Author to whom correspondence should be addressed.
Sustainability 2025, 17(12), 5526; https://doi.org/10.3390/su17125526
Submission received: 18 April 2025 / Revised: 7 June 2025 / Accepted: 10 June 2025 / Published: 16 June 2025

Abstract

Understanding a catchment’s geomorphological and erosion processes is essential for sustainable land management and soil conservation. This study investigates the Xynias drained lake catchment in Central Greece using a twofold geospatial modelling approach that combines morphometric analysis with the Revised Universal Soil Loss Equation (RUSLE) to evaluate the area’s landscape evolution, surface drainage features, and soil erosion processes. The catchment exhibits a sixth-order drainage network with a dendritic and imperfect pattern, shaped by historical lacustrine conditions and the carbonate formations. The basin has an elongated shape with steep slopes, high total relief, and a mean hypsometric integral value of 26.3%, indicating the area is at an advanced stage of geomorphic maturity. The drainage density and frequency are medium to high, reflecting the influence of the catchment’s relatively flat terrain and carbonate formations. RUSLE simulations also revealed mean annual soil loss to be 1.16 t ha−1 y−1 from 2002 to 2022, along with increased erosion susceptibility in hilly and mountainous areas dominated by natural vegetation. In comparison to these areas, agricultural regions displayed less erosion risk. These findings demonstrate the effectiveness of combining GIS with remote sensing for detecting erosion-prone areas, informing conservation initiatives. Along with the previously stated results, more substantial conservation efforts and active land management are required to meet the Sustainable Development Goals (SDGs) while considering the monitored land use changes and climate parameters for future catchment management.

1. Introduction

Geomorphology aims to understand the origin, form, and behavior of the Earth’s surface, with geomorphological analysis being key to interpreting catchment dynamics [1,2,3]. This includes quantitative aspects—such as size, shape, drainage density, stream order, and patterns—and qualitative ones, like geological structure and tectonic activity, which influence permeability, water flow, and infiltration [1]. Morphometric characteristics are especially important for understanding hydrological responses during heavy rainfall, including runoff, flooding, erosion, and sedimentation processes [4].
Since the late 1980s, the availability of digital data from various sources has transformed surveying practices [5]. RS and GIS technologies have become essential tools in geomorphology, offering valuable input for morphometric analysis and soil erosion modelling. Numerous studies have utilized these tools to classify basins and investigate the relationship between their physical features and hydrological or erosion processes [6,7,8]. Techniques such as Horton’s regression statistics [9,10,11] and Strahler’s stream ordering [12,13] are commonly applied—often using DEMs—to evaluate landform, drainage, maturity stage, and other basin characteristics in GIS environments [14]. This type of analysis provides essential insights into geomorphic processes and erosion levels, aiding in effective watershed management [15,16,17].
According to the EU Soil Health Dashboard, 60–70% of soils in the EU are currently unhealthy [18]. Soil erosion is the main form of land degradation globally, with high erosion rates (>2 t/ha/y) affecting 24% of EU land, 70% of which is agricultural. The average soil loss rate (2.46 t/ha/y) leads to a total displacement of 970 × 106 t of soil per year [18]. This process significantly impacts the landscape and reduces soil quality, productivity, etc. The phenomenon’s mechanism comprises the disaggregation, detachment, and mobilization of particles from the soil matrix, reshaping the landscape through the forces of [19,20] water [21,22,23], wind [24,25], and gravity [26,27]. Several soil erosion models, such as the EPM, ANSWERS, WEPP, SWAT, PESERA, and G2, are of varying degrees of complexity. [28,29,30,31,32,33,34]. One of the most commonly used tools for measuring sheet and rill erosion is the empirical USLE, developed by Wischmeier and Smith in 1965 [35]. USLE was initially formulated primarily to estimate soil erosion at croplands or features of mild topography. Its revised version, namely the Revised Universal Soil Loss Equation (RUSLE), followed a few years after [36]. The RUSLE is a commonly used empirical water erosion model employed in several national [37,38,39,40,41,42] and international studies [43,44,45,46,47]. Its broad applicability derives from the fact that it is a flexible, reliable, user-friendly tool with standardized input data [48]. The model can simulate sheet, rill, and inter-rill erosion [49] at different spatiotemporal scales [50,51]. It can predict erosion potential on a cell-by-cell basis, a time- and labor-efficient approach in large-scale applications. Due to its simplicity and data availability, the RUSLE method has also been used for ecosystem service mapping and quantification, as found in recent studies [39,42]. Modern GIS tools support targeted analysis, helping identify the influence of specific variables on regional erosion risk [8]. The RUSLE model estimates gross soil loss using five factors: rainfall erosivity (R), soil erodibility (K), slope length and steepness (LS), cover management (C), and conservation practices (P).
Until now, erosion modelling has required tools that are accurate, flexible, user-friendly, and based on standardized data. Today, models must also be calibrated to local conditions and validated where direct erosion measurements are limited. Significant efforts have addressed this, such as the calibration of RUSLE parameters by Panagos et al. (2015) [23]. Additionally, concerns are raised regarding the quality of data input [52]. In Greece, studies by Polykretis et al. (2020) and Efthimiou et al. (2022) [53,54] have focused on adjusting the R and C factors to reflect local landscape conditions. These efforts are vital for improving RUSLE’s reliability in regional applications and supporting sustainable land management.
Conventional (field) methods to assess soil erosion risk are costly and time-consuming, and impractical for large-scale applications. Using soil erosion models, field data, and RS images in a GIS environment promotes advanced research. RS provides data over vast regions, can repeatedly map the same area, and deliver regional erosion risk assessment by employing/underpinning appropriate indices [55]. In a nutshell, the contemporary datasets and state-of-the-art technologies offer profound spatial and temporal accuracy, ultimately leading to improved/more realistic soil erosion analysis [56,57].
Topography plays a key role in erosion processes, and morphometric parameters like drainage density, relief ratio, basin circularity, elongation ratio, and hypsometric integral are crucial for understanding watershed characteristics and their impact on soil erosion. Although RUSLE considers factors like rainfall and slope to estimate soil erosion, it doesn’t directly include them in its formulation. However, morphometric analysis enhances RUSLE by refining the LS factor, which accounts for slope length and steepness. Studies show that slope gradient and relief ratio influence soil loss predictions [58,59].
Integrating morphometric analysis with soil erosion studies is a well-established approach to assess and prioritize sub-watersheds for conservation efforts. In the Megech River Catchment (Ethiopia), Jothimani et al. [60] used ASTER-DEM and Landsat-8 data to delineate sub-watersheds and identify WS-3 as highly susceptible to erosion. In the Manot River Catchment (India), SRTM data and GIS techniques revealed sub-watershed 13, affected by lithological contrasts, as a priority area for intervention [61]. A multi-criteria approach combining WSA, SPR, and AHP-TOPSIS was implemented by Kumar et al. [62] in the Mandakini Basin (India), successfully identifying erosion-prone zones. In Wadi Kerak (Southern Jordan), morphometric parameters integrated with the RUSLE model classified 50% of the watersheds as moderate to high risk [63,64] and applied PCA and WSA on 19 morphometric variables in the Wyra River Basin (India), emphasizing the role of relief and drainage features in erosion susceptibility. Similar approaches have been applied in Crete (Greece), where morphometric analysis supported erosion modeling by linking drainage characteristics to landscape patterns [41].
The present study innovates by introducing joint geomorphological analysis and soil erosion modelling using a GIS-based approximation. This powerful toolset was used to assess the catchment’s morphometric characteristics and soil erosion processes in the study area, the Xynias drained lake catchment in Central Greece. Previous studies have addressed several aspects of this area. Palynological research by Bottema [65], Harrison and Digerfeldt [66], and Yu and Harrison [67] examined the development of the former lake, while Digerfeldt et al. [68] explored the area’s paleogeographical and paleoclimatological conditions. Recent efforts have focused on assessing water balance and surface water quality [69], simulating hydrologic processes [70] conducting hydrogeological investigations [71]. However, none of these studies have examined landscape evolution or soil erosion dynamics in the region, highlighting the need for the present research to offer a new framework for similar Mediterranean landscapes.
This study investigates the interplay between geomorphological characteristics and soil erosion processes within the Xynias drained lake catchment in Central Greece. The goals are to (a) analyze the geomorphological and morphometric characteristics of the Xynias catchment using GIS and remote sensing, (b) improve the LS factor of RUSLE using detailed topographic parameters, (c) identify erosion-prone areas to inform sustainable land management, (d) fill a research gap by linking landscape evolution with erosion processes in the region and (e) support EU goals (Green Deal) on soil health and Sustainability Development Goals (SDGs).

2. Study Area Characteristics

The study area is the Xynias drained lake catchment in Central Greece (Figure 1b). The basin has a NW-SE orientation, situated between 39°08′ N to 39°00′ N and 22°07′ E to 22°19′ E. Xynias Lake was an internal Pleistocene Lake created from tectonic activity along faults, leading to a local depression that was eventually filled with alluvial and land deposits [72]. The lake covered an area of 32 km2 with a maximum depth of 5.5 m. The draining process commenced in 1936 and was finalized in 1946 with the construction of an extensive drainage ditch diverting the water to the Onochonos River. Today, the trench outflows into the Onochonos and the Rentiniotis Rivers, supplying water to the Smokovos Lake reservoir. The catchment has a mean annual temperature of 14.8 °C, and the precipitation is estimated at 594.1 mm. Coarse sand fractions, primarily sandy loam and loamy sand, are the dominant soil types, exhibiting high levels of organic matter content [73]. The land use/cover consists mainly of crops (51.4%) and irrigated land (44.27%) in the basin’s lowland area, supported by a well-developed drainage system. The mountainous part consists of forest and scrubland, occupying 44.26% of the basin surface, while 4.33% is covered by settlements, construction sites, mineral extraction sites, etc. (Figure 2).
The catchment is part of the broader mountain area of Pindos and Othrys. Regarding its geological background, the main element is the large ophiolitic masses, called the ‘Ophiolites Zone’ or ‘Othrys Zone’ [74]. It consists of thrust sheets as a sequence emplaced onto the Triassic-Jurassic carbonate platform [74,75]. In terms of bedrock, the catchment is characterized by complexity, given the presence of diverse rock formations and other deposits, influencing local morphometry and the ongoing erosional processes. The bedrock and the margins consist mainly of peridotites and Upper Cretaceous limestones. The stratigraphic sequence from the youngest to the oldest formations includes (i) alluvial and diluvial deposits consisting of clay, sand, gravel, pebbles lateral scree, and lacustrine deposits of peat and clay, (ii) Molassic sediments composed of conglomerate sandstone with gravels, (iii) Flysch consisting of clay, clay sandstone, and schist, (iv) Schist rocks composed of cherts schist, with ophiolites and serpentinites, (v) Ophiolites that comprise almost all the ophiolitic rocks: Peridotites, dunite with chromites, serpentinites, diavases, dolerites, and tofu basic igneous rocks (Figure 3) [73]. In the NW part of the basin, there is a fault zone in the form of long tectonic joints, generally oriented NW-SE, which delimits the western Thessalian dip to SW. The general NW-SE direction of this zone, in combination with the general direction of tensile strain on the broader region of Thessaly and Sterea Ellada, shows that the above discontinuity zone (or the part of it that functions as a neotectonic fault zone) is expected to exhibit lateral-normal kinematic character, with a left-side oblique slip component [76].

3. Materials and Methods

3.1. Input Data

The raw input data utilized for the study purposes include (a) topographic maps from the Hellenic Military Geographical Service (HMGS—scale 1:50,000 and 1:5000, contour interval 20 m and 4 m, respectively; https://www.gys.gr/hmgs-geoindex.html, (accessed on 28 January 2024) and geological maps from the Institute of Geology and Mineral Exploration, [77,78]. Detailed topographic maps (scale 1:5000) were used for the delineation of the drainage network as they provide more thorough and accurate information about the actual shape and length of the streams (especially for the definition of the starting points of the first-order streams and the flow paths at the meandering part in the flat plain area. The extracted drainage network was cross-checked and validated using very detailed orthophoto maps of the region (spatial resolution equal to 1 m) and those that automated extracted from the DEM; (b) a 30 m Digital Elevation Model (DEM), acquired from the Shuttle Radar Topography Mission (SRTM) dataset that provided by the United States Geological Survey (https://earthexplorer.usgs.gov/; (accessed on 13 October 2023). The SRTM 1 Arc-Second Global elevation data were processed from raw C-band radar satellite data [4]. The SRTM DEM was resampled in 25 m and used as a supplementary dataset for the validation in all the other analyses; (c) Meteorological data from the Hellenic Ministry of Environment and Energy (YPEN) for the gauging stations of Scopia, Domokos, Anavra, Loutropigi, and Rentina for the period 2002 to 2022; (d) topsoil samples retrieved from the Land Use and Cover Area frame Survey (LUCAS) database (https://esdac.jrc.ec.europa.eu/content/lucas-2018-topsoil-data; accessed on 15 February 2024) [79,80], the Greek National Agricultural Research Foundation (NAGREF) and the authors’ fieldwork [73], and (e) land use/land cover data deriving from the Corine Land Cover 2018 vector file derived from the Copernicus Land Monitoring Service (Copernicus Land Monitoring, https://land.copernicus.eu/en/products/corine-land-cover/clc2018; accessed on 29 January 2024).
DEM pre-processing involved correcting errors, e.g., filling depressions. The workflow included sink filling using the Planchon and Darboux algorithm (SAGA software, v.9.5.1, QGIS) to eliminate artificial depressions and ensure proper flow modeling. Visual inspection and statistical filtering corrected errors such as spikes and voids [81]. Handling DEM depressions is essential for reliable hydrological analysis. Then, using the SRTM-DEM and GIS raster operations, the water divides, the estimation of the morphological features, and the DEM-derived geospatial characteristics (e.g., slope angle, slope aspect, etc.) were extracted. All inputs were spatially referenced according to the GCS_WGS_1984 coordinate system (EPSG:4326). The collected maps (geological and hydrographic network) and point data (precipitation stations) were digitized utilizing the ArcGIS platform (suite v. 10.8.2, Environmental Systems Research Institute-ESRI, Redlands, CA, USA). To overcome the obstacles of different data analyses, the data were resampled to 20 m, avoiding overstretching to obtain the most representative result without visual distortions and inaccurate representation of the observable characteristics.

3.2. Geomorphological Variables

3.2.1. Framework

The stream hierarchy was defined according to Strahler’s classification system [12]. The number of streams, the length, the mean length per hierarchical order, and the total number of streams and their lengths were calculated according to Horton’s first and second laws (Figure 3) [9,10,11]. The application of Horton’s first law revealed valuable information regarding the relationship between the number of stream segments and the ordering of the drainage network. The law states that while stream order increases, the stream number decreases [1]. Deviations from their linear relationship imply that other parameters, such as tectonics and geological background, affect the drainage network development by influencing stream order evolution [82,83].
The bifurcation, mean bifurcation ratio, the theoretically expected number of streams and mean length of streams (indicated as ideal values), and the drainage density and channel frequency were also calculated based on Horton’s laws. The minimum, maximum, and mean altitudes and the perimeter of the catchment were computed, providing inputs for the calculation of relief ratio, circularity, elongation ratio and hypsometric integral (Table 1) using the formulas proposed by Schumm (1956) [84] and Keller and Pinter (2002) [85], respectively. The hypsometric curve was also generated using the ArcGIS software’s Hypsometry Toolbox (v. 10.8).

3.2.2. Basic Principles

Horton’s first law states that the number of stream segments of each order forms an inverse geometric sequence with the order number [10]. Horton’s second law indicates that each successive order’s mean stream length segments tend to approximate a direct geometric series, with stream length increasing towards a higher order of streams [10]. According to Horton [9], drainage density (D) is the total length of streams of all orders per drainage area. It provides information about the spacing and closeness of channels within the catchment. The value of D is influenced by various factors like climate, types of rocks, relief, infiltration capacity, vegetation cover, surface roughness, and runoff intensity [88]. Low drainage density leads to coarse drainage texture, while high drainage density leads to fine drainage texture [89].
Stream frequency (F) is the total number of stream orders per unit area [9]. The F is a quantitative measure that mainly depends on the catchment’s lithology and reflects the drainage channels’ texture [89]. High stream frequency often indicates impermeable or resistant rock types, which limit infiltration and increase surface runoff; frequently combined with high drainage density, which indicates a high degree of dissection and a young, actively eroding landscape. Moreover, regions with high precipitation typically have higher stream frequencies due to greater runoff, while lowland areas have lower stream frequencies [90].
The relief ratio (Rh) is a dimensionless fraction that describes the steepness or ruggedness of the terrain and is defined as the ratio between total catchment relief and catchment length, measured as the longest dimension of the drainage catchment [84]. The Rh indicates the overall slope of the watershed surface [13], and measures the erosion process’s intensity operating on the slope of the catchment, as well as the flood risk and sediment transport [89,91].
Circularity (Cu) is the ratio of the catchment to the area of a circle with the same perimeter as the catchment [86]. Circularity provides information about the dendritic stage of a catchment, which is influenced by factors such as stream length, stream frequency, and lithology [92]. Circular basins with high Cu values (close to 1) are more likely to experience uniform runoff and quicker peak discharge during rainfall events [93] and are often associated with youthful stages of basin evolution or tectonic uplift.
The Elongation ratio (Er) is the ratio between the diameter of the circle of the same area as the catchment and the maximum length of the catchment [84]. The Er values can vary from 0.6 to 1.0 depending on the climatic and geological characteristics of the area. Catchments with very low relief typically have Er values close to 1.0, while catchments with high topographic relief and steep slopes tend to have Er values ranging from 0.6 to 0.8 [94]. The Er values can be grouped into three categories: (a) circular (>0.9), (b) oval (0.9−0.8), and (c) less elongated (<0.8) [92].
The hypsometric integral (Hi) is the area below the hypsometric curve, representing the relative proportion of the watershed area below (or above) a given height. It can be used, as well as the hypsometric curve, to measure a landscape’s evolutionary stage and relative maturity [12,84]. The Hi is a valuable metric for assessing a catchment’s morphological characteristics and stage of development by a single value. According to the classification of Strahler (1957) [13], different ranges of Hi values correspond to various stages of catchment development. Hi values above 60% indicate a youthful stage, while 35% to 60% suggest an equilibrium or mature phase. Hi values below 35% are characteristic of a monadnock phase, which indicates an even more mature stage than the equilibrium phase [13].

3.3. The Revised Universal Soil Loss Equation (RUSLE)

The RUSLE estimates soil loss as the linear product of five individual factors (Equation (9)).
A = R × K × LS × C × P
where A is the estimated soil loss in t ha−1 y−1, R is the rainfall erosivity factor (R-factor, in MJ mm ha-1 h-1 y-1), K is the soil erodibility factor (K-factor, in t ha h ha−1 MJ−1 mm−1), LS is the topographic factor (LS-factor, dimensionless), C is the cover management factor (C-factor, dimensionless), and P is the conservation practice factor (P-factor, dimensionless), accounting for the effect of climate, soil vulnerability, topography [combined slope length (L-factor) and slope steepness (S-factor) effect], land use/land cover and anthropogenic actions (conservation measures) on soil erosion, respectively.
The empirical van der Knijff et al. equation [95] determined the point R-factor per rainfall station. The formula was used due to the absence of detailed rainfall records. Here, the static rating coefficient “a” (assumes a non-temporal relationship between the R-factor and rainfall dynamics) was replaced by Erosivity Density (ED), considering the variable’s spatial and seasonal variations. Subsequently, the R-factor was spatially reduced using the ordinary co-kriging method, with elevation as a covariate. This 25 m resolution was considered appropriate for the study due to the local landscape characteristics and the number, distance, and distribution of the pluviometric stations. To assess the accuracy of the generated surface, different statistical measures [Mean Error (ME), Root Mean Square Error (RMSE), Root Mean Square Standardized Error (RMSSE), and Average Standard Error (ASE) [96] and variogram parameters (nugget, sill, range, and lag distance) were considered. These results and the prediction map’s smoothness confirm the simulated surface’s reliability. The rainfall events with the highest erosive impact generally yield elevated R-factor values.
The K-factor was estimated based on available soil samples using the nomograph of Wischmeier et al. [97]. The process involved categorizing the samples according to their granulometric composition [98], grouping them into larger textural categories, and assigning structure (b) and permeability (c) index codes following the guidelines of Rawls et al. [99]. An upper limit of 4% was imposed for samples with organic matter content exceeding 4%, complying with the nomograph’s restrictions. The Inverse Distance Weighing (IDW) method was employed to determine the spatial distribution of the K-factor, as described by Angulo-Martinez et al. [100] and Panagos et al. [101]. Soils with higher K-factor values are generally more prone to erosion. Analogously, erosion-prone formations, such as flysch, alluvial deposits, and molassic sediments, display the highest K-factor values, whereas the most resistant formations, mainly located close to the catchment outlet, display the lowest.
Among the six input layers, the composite LS factor significantly influences soil loss [102]. The topographic factor was first derived from a locally developed 25 m DEM created explicitly for this study. The calculations were performed using the Desmet and Govers [103] equation, utilizing the System for Automated Geoscientific Analyses (SAGA) software package available on the QGIS platform. The results were cross-evaluated against Panagos et al.’s 25 m pan-European map. [102]. Both attempts showed similar results, i.e., mean LS-factor values of 2.1 and 1.97 for our approach and Panagos et al. [23]. Eventually, considering the morphology of the Xynias basin, Panagos et al. [23] were selected for this simulation because it implements a cut-off value to exclude rough morphological features and high-slope slopes (>44 deg.).
For consistency reasons, a static approach was selected to calculate the C-factor, disregarding the influence of the temporal variations of vegetation. The parameter was assigned a mean static value for each land cover category using literature data on crop types [24,104,105,106]. The P-factor was derived from the pan-European study of Panagos et al. [107].

4. Results and Discussion

4.1. Geomorphological Analysis

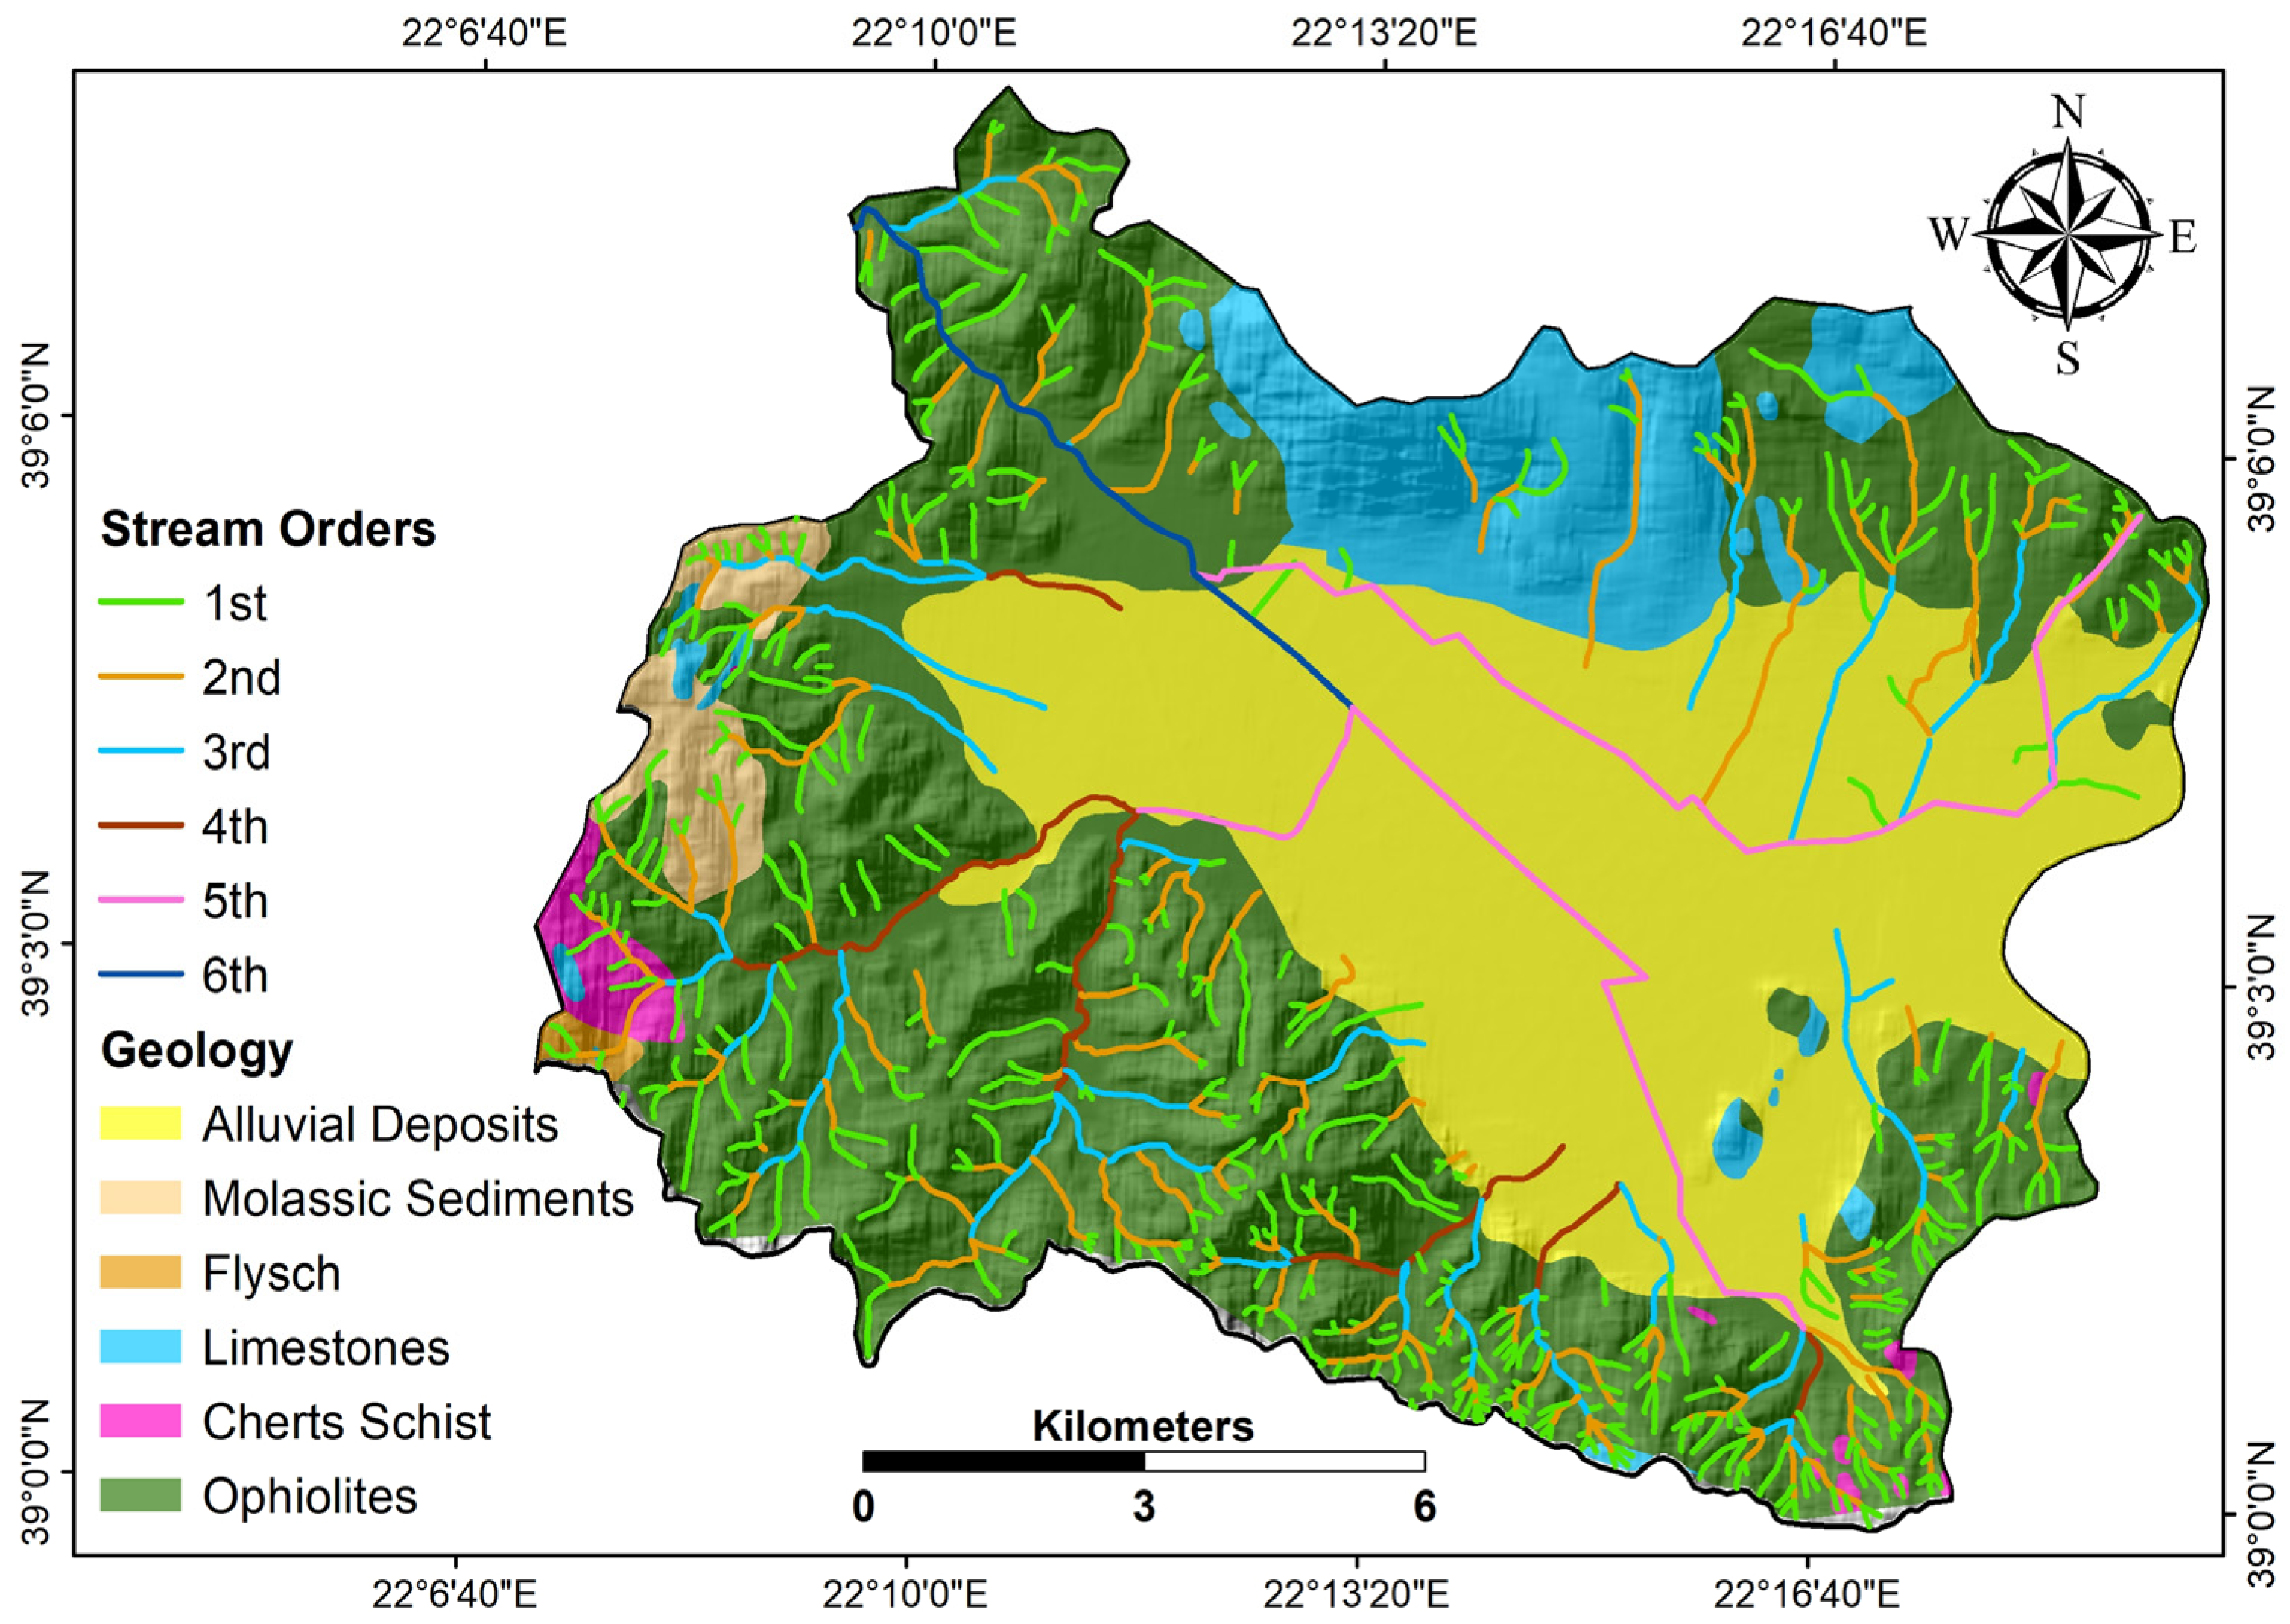
The Xynias basin is considered a medium-sized catchment, covering an area of 167.9 km2 with a perimeter of 66.2 km, a length of 19.8 km, and a width of 8.5 km (Table 2). The average altitude is 540 m, ranging from 384 m at its outlet to 977 m at its highest peak in the northern part of the catchment at Mt. Xerovouni (Figure 1). The main thalweg is of the 6th order [13], with a dendritic and parallel at-site pattern (Figure 3). The total number of streams is 539, and their total length is 340.7 km (Table 3).

4.1.1. Horton’s First Law

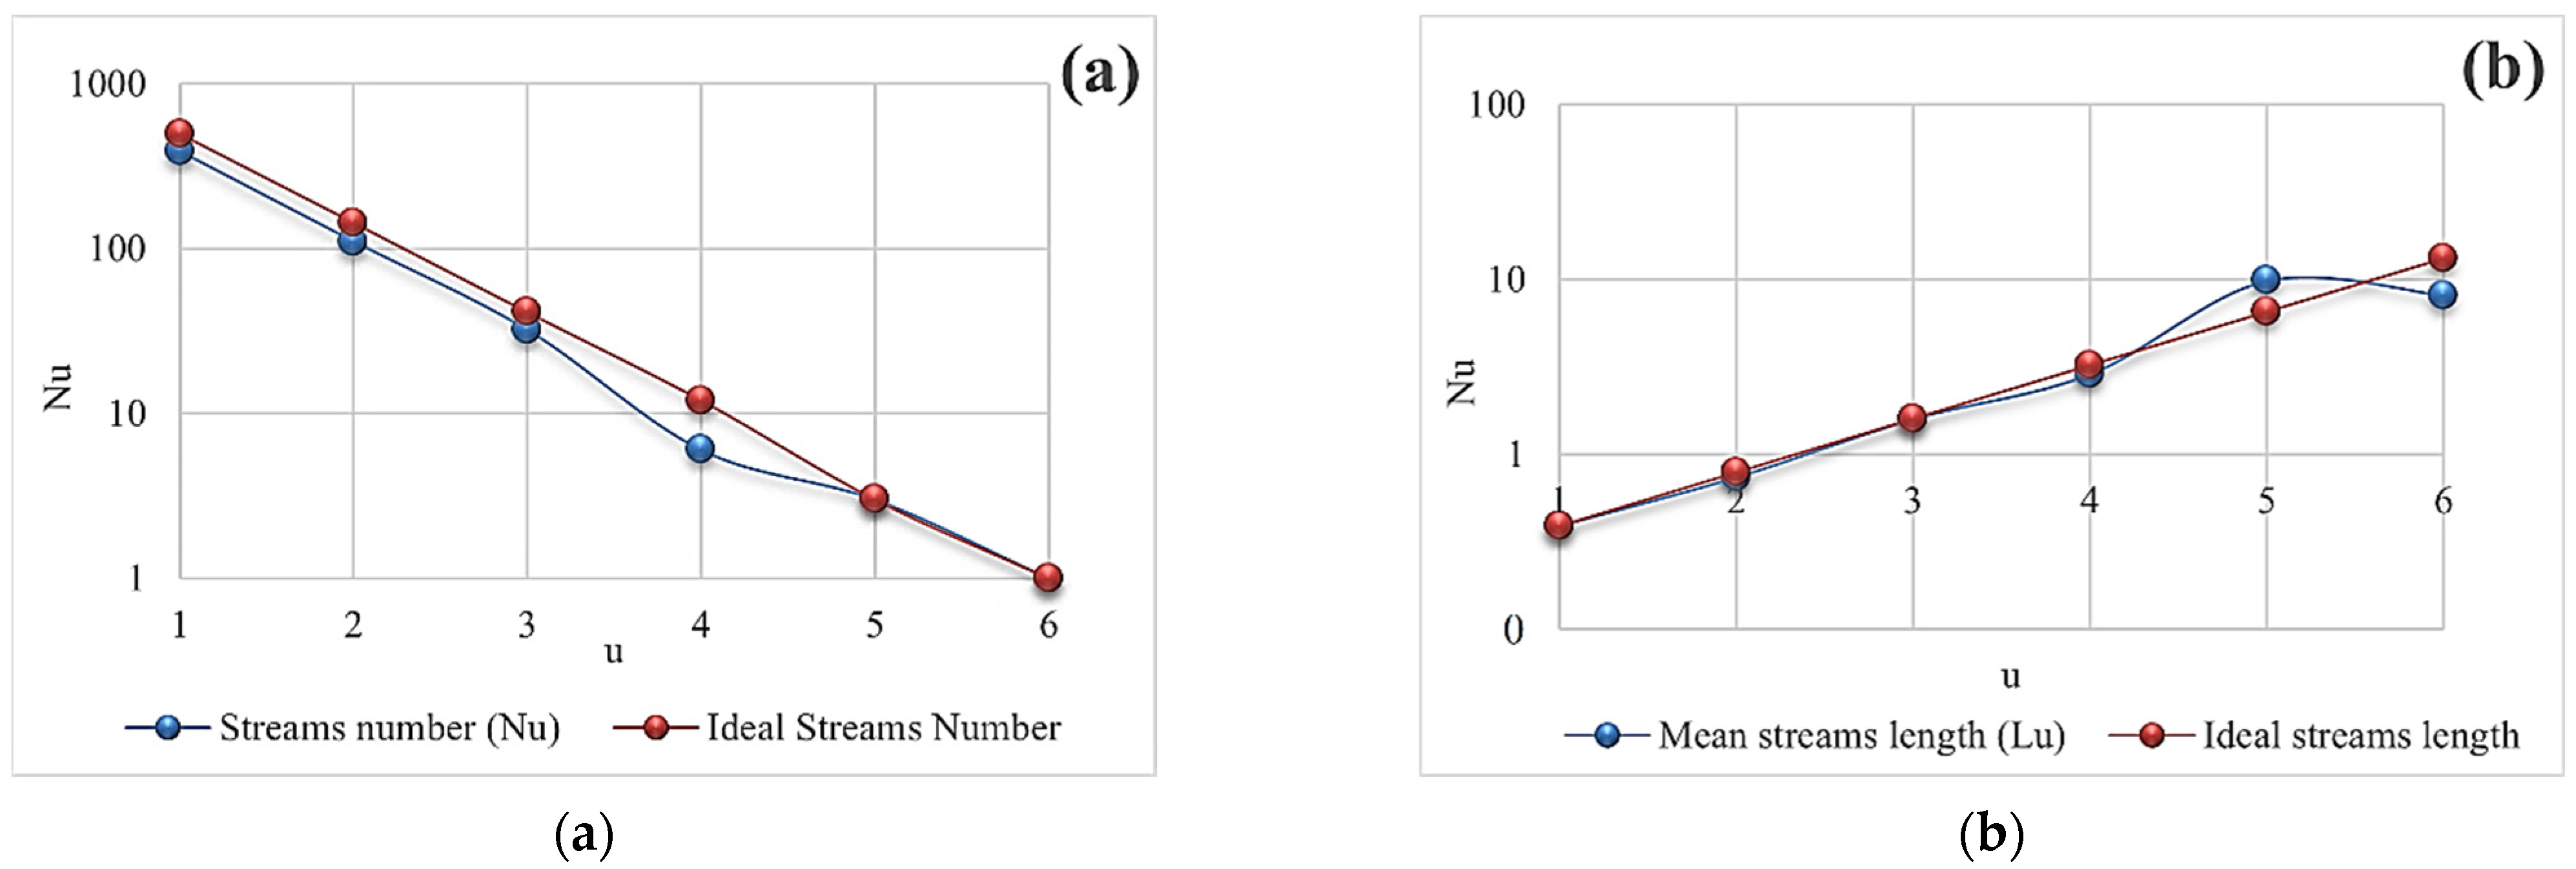
The application of Horton’s first law shows that the bifurcation ratio (Rb) values range from 2 to 5.33 (Table 3), indicating the degree of ramification or branching within the hydrographic network [92]. In our study site, the highest Rb value indicates a strong structural control in the drainage pattern, whereas the lowest Rb value indicates structural disturbances [94]. The mean bifurcation ratio R b _ has a value of 3.46 (Table 3). According to Verstappen [88], in areas where geological structures have little influence on the hydrographic network, the R b _ value typically range between 3.0 and 5.0. This indicates that, overall, the hydrographic network of Xynias is not strongly controlled or influenced by the underlying geological structures. Additionally, the R b _ value of 3.46 is lower than the “theoretical” value of 4.00 proposed by Leopold and Langbein [108]. The hydrographic networks with an R b _ value lower than or approximately equal to the “theoretical” one are in a dynamic equilibrium state [108,109]. Furthermore, the negative deviation of stream numbers from the ideal values of the first to fourth order streams suggests that they are still in development progress, deviating from the ideal characteristics or patterns expected based on theoretical principles (Figure 4).

4.1.2. Horton’s Second Law

Horton’s second law for stream lengths presents negative deviations from all orders’ ideal mean stream length values (Figure 4). According to Cooper et al. [110], the presence of carbonate rocks in the area contributes to these deviations [4,111].

4.1.3. Drainage Density (D)

Drainage density acquired a low value of 2.02, a fact assigned to the combination of the (mostly) flat terrain, the fact that a lake used to occupy a significant portion of the catchment, and the presence of carbonate rocks in the northern part of the area, which affects drainage patterns [110].

4.1.4. Drainage Frequency (F)

Drainage frequency received a value of 3.21 km−2. This relatively low value is due to the former presence of the currently drained lake and the carbonate rocks in the area, which limit the formation of a dense hydrographic network [110].

4.1.5. Relief Ratio (Rh)

The calculated Rh value is 2.98%. This low value indicates a relatively low degree of erosion processes occurring on the slopes of the catchment [94]. Areas with similar characteristics often exhibit moderate relief ratios, as Pareta and Pareta [112] reported.

4.1.6. Circularity (Cu)

Cu is calculated as 0.48. This relatively low value, falling within the range of 0.40–0.50 [113], indicates the basin’s elongated shape.

4.1.7. Elongation Ratio (Er)

The calculated Er value is 0.74, indicating that the Xynias basin is less elongated, which is associated with its drainage efficiency. Circular catchments are generally more efficient in terms of discharge compared to elongated catchments [114].

4.1.8. Hypsometric Integral (Hi)

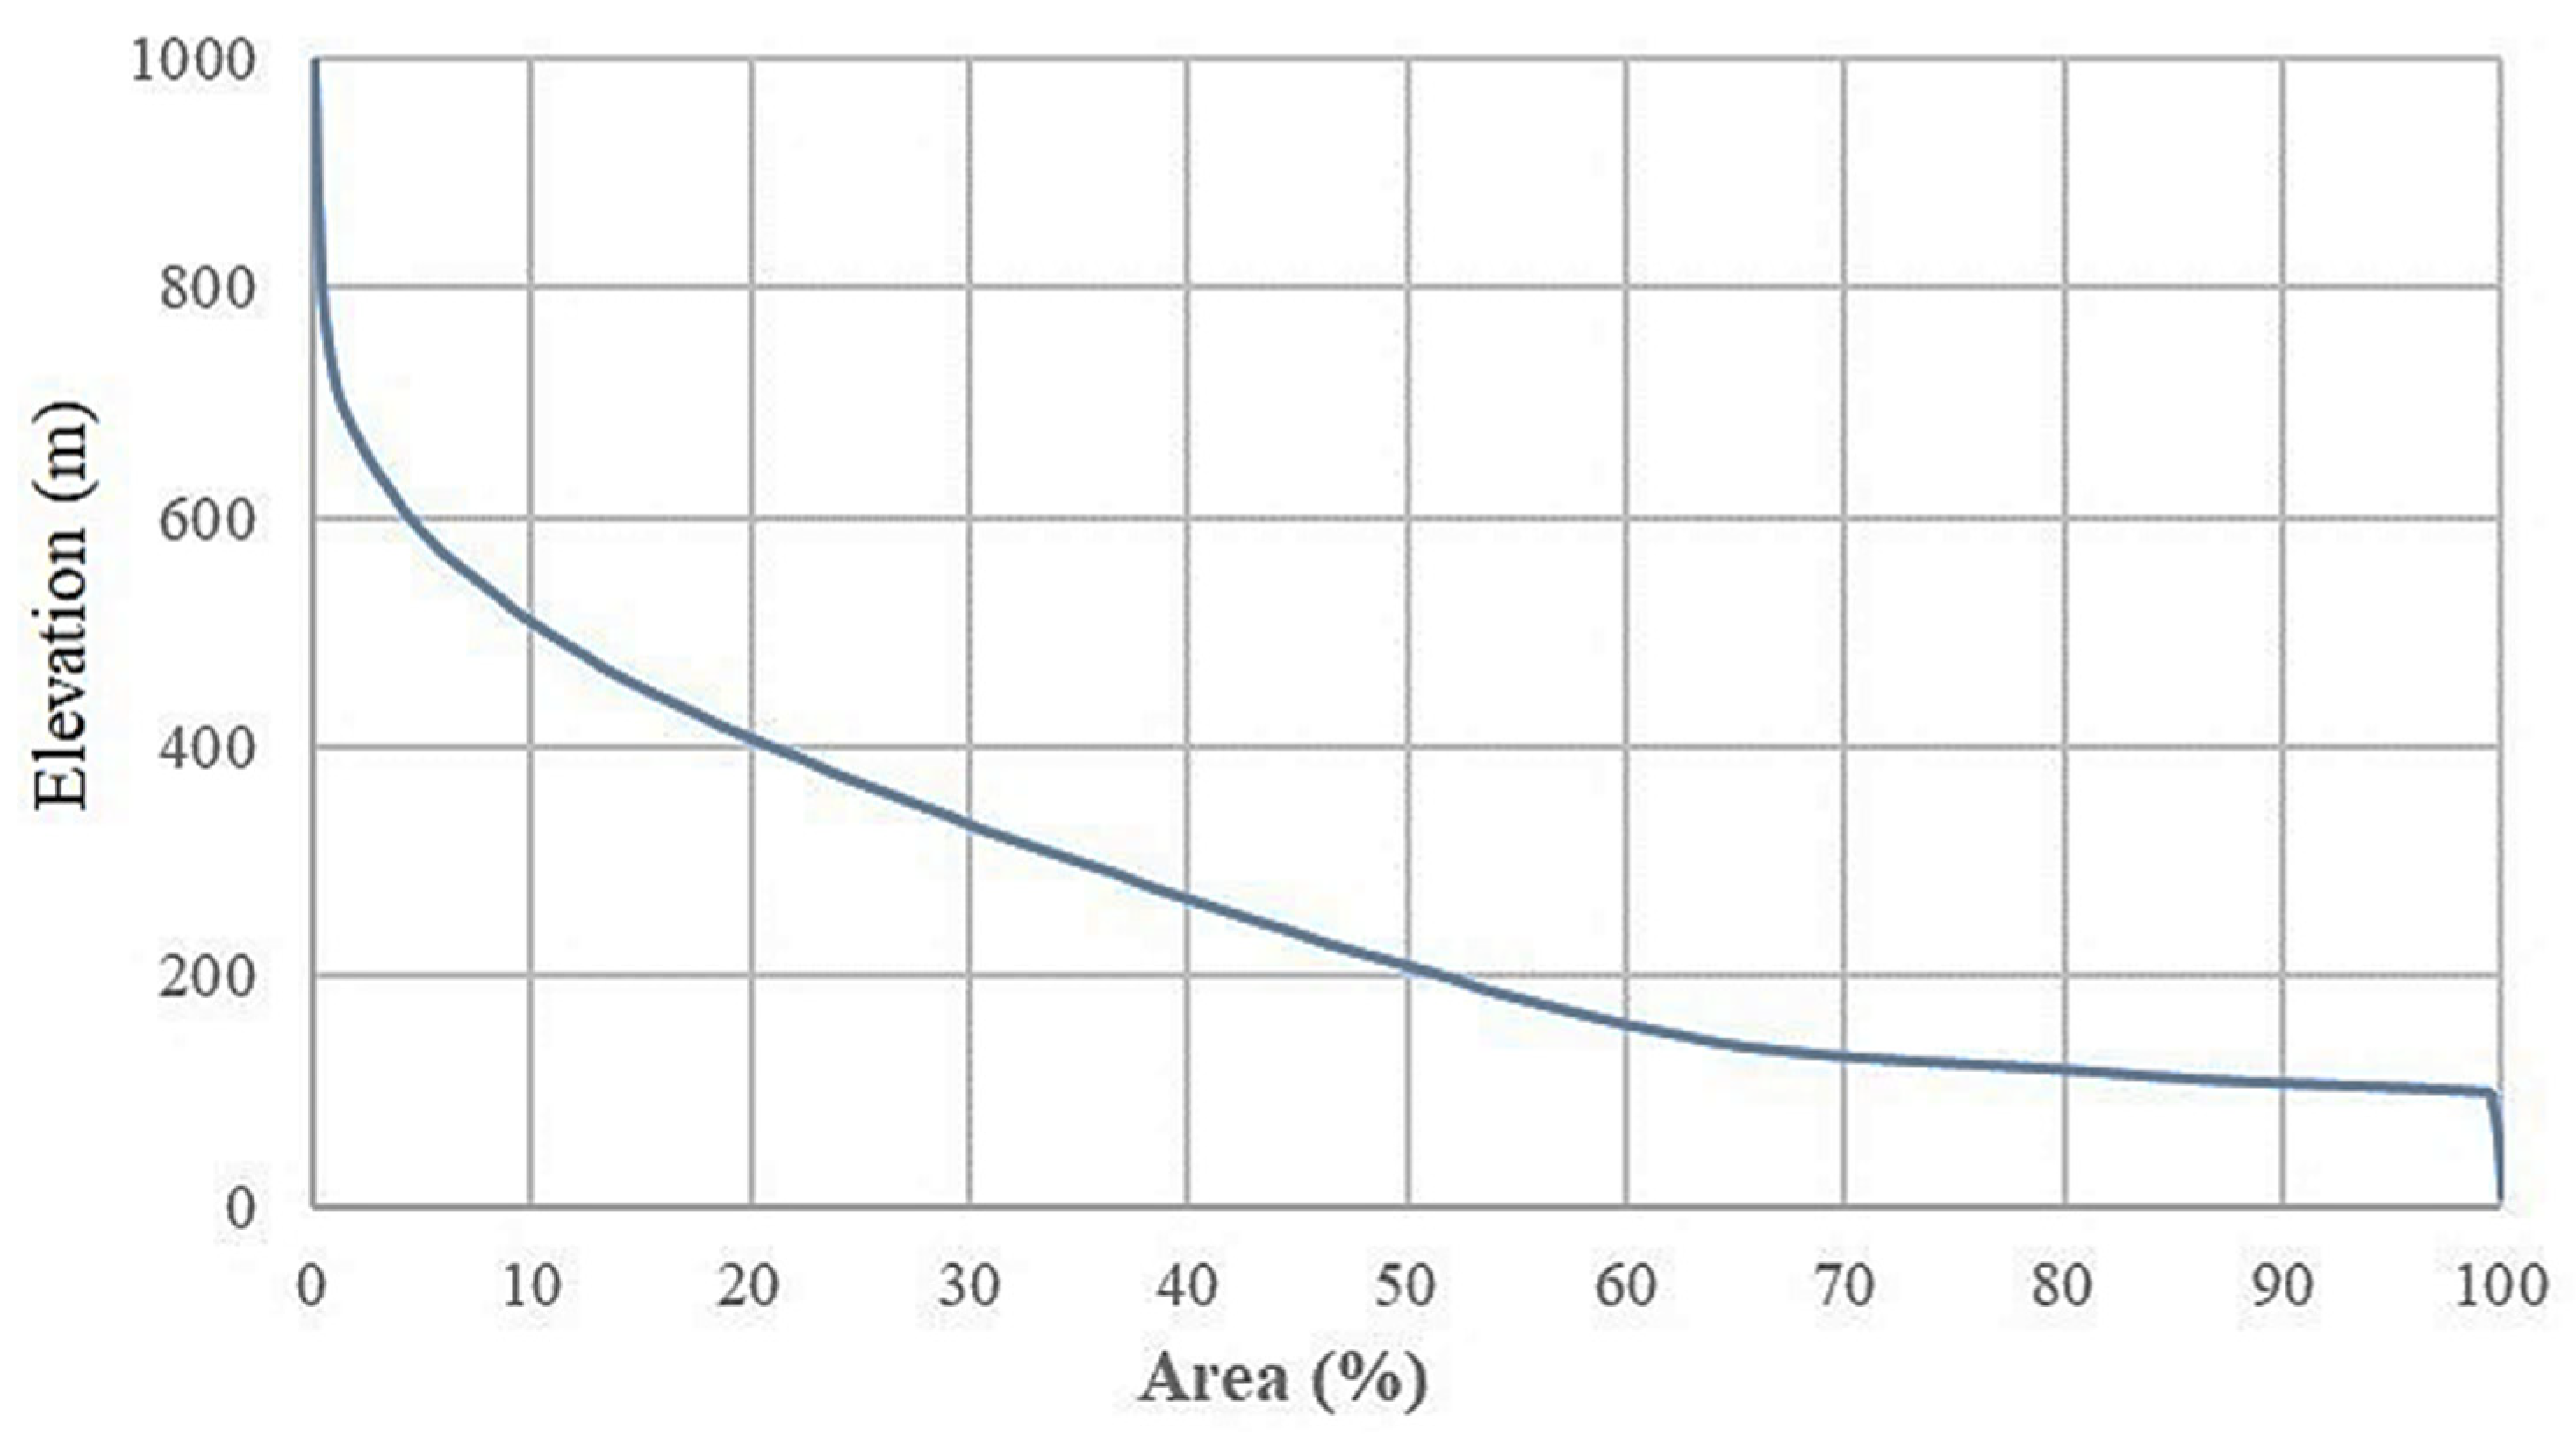
The computed Hi value of 26.3% and the hypsometric curve suggest that the Xynias catchment is in the monadnock phase of landscape development, according to the classification of Strahler (1957) [13]. This indicates a relatively advanced stage of maturity in the catchment’s evolution. Although this value means that erosion has moved 73.7% of the catchment’s mass (Figure 5), this does not apply to all regions. According to Strahler (1952) [12], this low hypsometric integral value indicates an area that may present the form of the maturity stage but is in a transition stage (monadnock phase).
The morphometric analysis, particularly the computed hypsometric integral (Hi = 26.3%) and its corresponding curve, provides strong evidence that the Xynias catchment is in a late stage of geomorphic evolution, classified as the “monadnock phase” by Strahler (1957). This low Hi value, indicating that over 70% of the original surface has been eroded, suggests a landscape undergoing significant denudation and stabilization over geological time. This is further supported by the low circularity (0.48) and moderate elongation ratio (0.74), reflecting an elongated catchment that facilitates distributed drainage and slower runoff, consistent with advanced fluvial maturity. The geomorphic maturity is also evidenced by the drainage density (2.02 km/km2) and the bifurcation ratio deviations, which, in conjunction with the carbonate bedrock and tectonic setting, point to a landscape shaped by both ancient lacustrine conditions and structural controls. The drained lake’s history and infill dynamics likely influenced sediment redistribution and basin leveling, contributing to the current geomorphological stability. These indicators offer an integrated view of how long-term tectonic, hydrological, and erosional processes have converged to shape the present-day landscape, thus fulfilling the study’s objective of unravelling landscape evolution alongside erosion dynamics.

4.2. Soil Erosion Analysis

Horton’s regression statistics and Strahler’s stream ordering methodology provided critical insights into the morphometric characteristics, drainage network organization, hydrological behavior, and geomorphic evolution of the Xynias catchment. The quantitative analysis of morphometric parameters allowed for a comprehensive classification of the watershed’s structural and erosional dynamics. Stream ordering, as per Strahler’s classification, further elucidated the hierarchical arrangement of the fluvial system, offering a clearer understanding of runoff distribution and sediment transport mechanisms. While the hypsometric integral and hypsometric curve analyses are valuable tools for assessing the relative stage of landscape evolution and the erosional maturity of the basin, they primarily provide qualitative insights rather than precise quantifications of soil displacement.
Given these limitations, the RUSLE model was employed to simulate and quantify soil erosion rates within the Xynias catchment. This model integrates critical factors such as rainfall erosivity (R), soil erodibility (K), topographic influences (LS), land cover management (C), and conservation practices (P) to generate a more accurate estimation of soil loss (Figure 6). High-resolution spatial layers with a 25 m grid size were utilized to enhance the precision of model outputs, ensuring a detailed assessment of erosion-prone zones. The integration of morphometric analysis with RUSLE-based soil loss modeling provides a more holistic approach to understanding the spatial variability of erosion processes, aiding in the development of targeted soil conservation strategies and sustainable watershed management practices.
In this model, P (mm) denotes the average annual precipitation at a specific location, while a is a coefficient indicating the erosivity per rainfall unit. This method [99] is widely applied in Southern Europe, including Greece. Originally derived from data in Tuscany, Italy, the equation is considered appropriate for regions with comparable climatic conditions due to their proximity. It was chosen for its straightforwardness, climatic applicability, and proven reliability. The mean R-factor was calculated as 549.28 MJ mm ha−1 y−1, ranging from 379.57–811.17 MJ mm ha−1 y−1 (Figure 6a). The average K-factor was calculated as 0.022 t h MJ−1 mm−1, varying from 0.009 to 0.035 t h MJ−1 mm−1 (Figure 6c). Based on each land cover category (as shown in Table 4), and using literature data on crop types [24,104,105,106], the C-factor was calculated, ranging from 0.001 to 0.3. The highest values, indicating greater susceptibility, were observed in arable land areas (Figure 6d). The coefficient values ranged from 0.6 to 1.
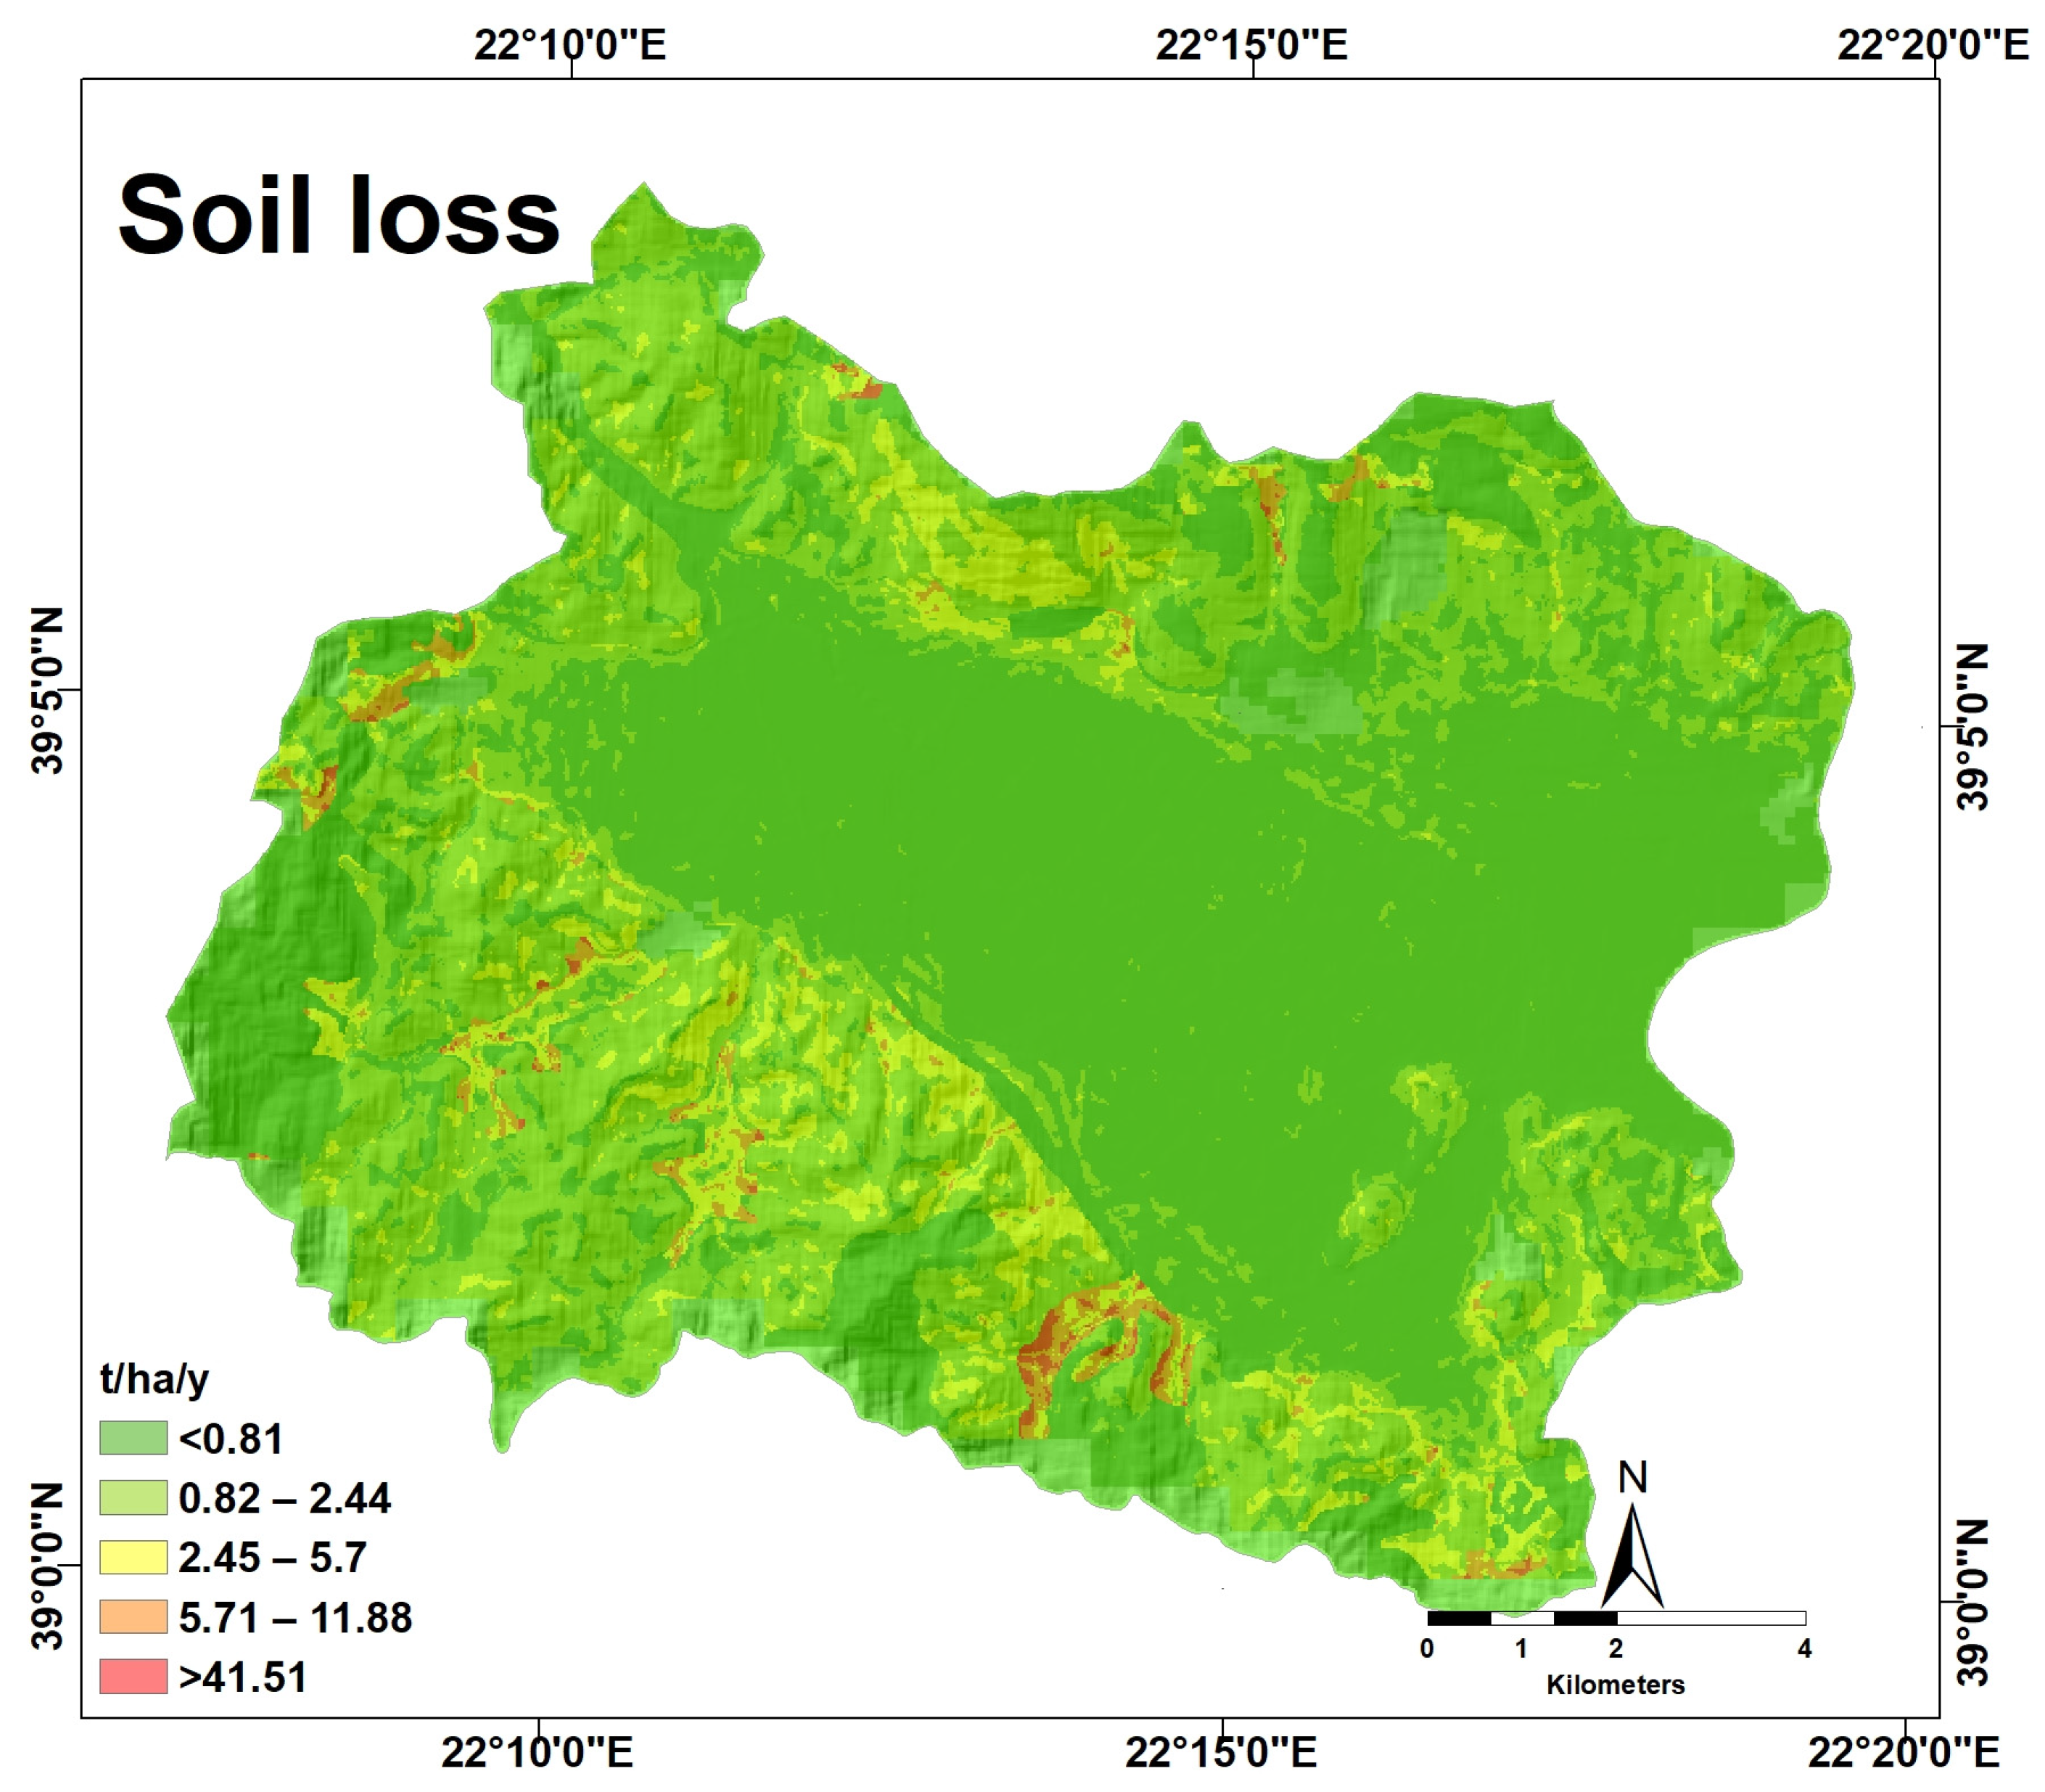
Finally, the mean annual soil loss for 2002 to 2022 was estimated (Figure 7) by applying the RUSLE model in the Xynias catchment. Gross erosion was estimated as 1.15 t ha−1, showing a variability range of 0.0006–41.51 t ha−1.
Most of the basin exhibits a low erosion risk, denoting the relatively stable conditions throughout the catchment. Contrary to what was expected, the most vulnerable sites are located in the hilly and mountainous regions primarily covered by natural vegetation. This observation deviates from the anticipated trend of higher erosion risks in agricultural lands in the central part of the catchment. The unexpected vulnerability of these natural regions can be attributed to the complex topography and steep slopes that characterize the broader study area, which amplifies surface runoff and soil displacement (Figure 7).
Our results are similar to those of Samarinas et al. [115], who reported a mean soil erosion value of 1.76 t/ha/yr in the Imathia Regional Unit (northern Greece). The same researchers indicate that 6% of the agricultural land is subject to severe erosion, reaching up to 11 t/ha/yr—a value comparable to those reported in the Apennines by Borelli et al. Our average erosion rate of 1.15 t/ha/yr is considered very low, even lower than the pan-European average of 2.46 t/ha/yr [23]. Notably, erosion-prone areas are associated with geological formations, slopes, and agricultural land use (Stefanidis et al. [42] applied the RUSLE model in mountainous areas, reporting very low average soil erosion values of 4.8 t/ha/yr in Varympompi, 9.8 t/ha/yr in Olympia-Gortynia, and 11.6 t/ha/yr in the Schinos region.
This analysis highlights the critical role of terrain and vegetation cover in shaping erosion dynamics, providing valuable insights for sustainable land management and erosion mitigation strategies.

4.3. Policy and Methodological Implications for Soil Health and Sustainability Goals

The findings of this study aim to support scientists, policymakers, and stakeholders in designing and applying effective strategies for mitigating soil erosion. These strategies are intended to promote sustainable land management, protect soil resources, and preserve the geomorphological character of the Xynias catchment area.
Beyond the local scale, this work contributes meaningfully to the European Green Deal and supports the United Nations Sustainable Development Goals (SDGs), such as SDG 2: Zero Hunger—soil fertility and agricultural sustainability; SDG 3: Good Health and Well-being—prevention of soil degradation and food and water supply poisoning; SDG 12: Responsible Consumption and Production—land stewardship and resource efficiency; SDG 13: Climate Action—prevention of erosion-fueled carbon loss and climate-resilient landscapes stewardship; and SDG 15: Life on Land—conservation of ecosystem and soil biodiversity.
To implement these contributions, the research proposes several policy and methodological changes: (a) Incorporation of erosion risk analysis into agricultural zoning spatial planning within regional and local planning schemes; (b) Promotion of agroecological practices that enhance soil organic matter and soil structure to more active facets of soil conservation; (c) Promotion of participatory adaptive co-management approaches that combine ecological and socio-economic frameworks with adaptive solutions design; (d) Incorporating advanced Earth Observation Technology and in situ monitoring into national soil information systems to enhance automated, continuous decision-making; (e) Promotion of soil restoration activities under the Common Agricultural Policy (CAP) and climate expenditures within the EU Green Deal.
These policies capture the essence of more impactful frameworks to implement and operationalize soil and soil information system technologies in the context of modern scientific advancements to address emerging soil concerns.

5. Conclusions

This study assessed the morphometric characteristics and erosion processes of the Xynias drained lake catchment by integrating GIS-based geomorphological analysis with the RUSLE model.
The findings revealed that the hydrographic network is classified as a sixth-order with dendritic and imperfect patterns, characterized by a relatively low number of streams and shorter stream lengths, shaped by carbonate lithology and the presence of the former lake. The catchment possesses an elongated form, steep slopes, high total relief, and a relatively elevated mean altitude. The drainage density (2.02 km/km2) and frequency (3.21 km−2) were moderate, influenced by the catchment’s relatively flat terrain and carbonate formations. The calculated hypsometric integral value of 26.3% and the associated hypsometric curve indicate that the Xynias catchment has reached an advanced stage of geomorphic maturity.
Soil erosion modelling using RUSLE predicted an average annual soil loss of 1.15 t/ha/year between 2002 and 2022. Most of the catchment is at low risk of erosion; however, steeper vegetated upland areas were at greater risk of erosion than cultivated lowlands, indicating the predominance of topography and lithology over land use in this instance. Combining GIS-based geomorphological analysis with the RUSLE model provided a deeper understanding of the morphometric and erosion dynamics within the Xynias drained lake catchment. These insights offer a valuable foundation for developing sustainable land management and soil conservation strategies that are specifically tailored to the region’s geomorphological and hydrological context. By integrating these approaches, the study supports more informed and effective watershed management practices that balance environmental protection with human activities.
Future studies should examine higher-resolution terrain data and time-series land use mapping to enhance model precision. Integrating dynamic inputs, such as climate trends, vegetation phenology, and soil moisture, will facilitate more adaptive and scenario-based erosion risk assessments.

Author Contributions

Conceptualization, N.C., and E.P.; methodology, N.C., S.A., N.E., and E.P.; software, N.C., S.A., and N.E.; data analysis, N.C., S.A., and N.E.; resources, N.C., S.A., N.E., E.P., and P.A.; writing—original draft preparation, N.C., S.A., N.E., and E.P.; supervision, N.C., S.A., N.E., and E.P.; and fieldwork, N.C., and P.A. All authors have read and agreed to the published version of the manuscript.

Funding

This research received no external funding.

Institutional Review Board Statement

Not applicable.

Informed Consent Statement

Not applicable.

Data Availability Statement

The geospatial data supporting reported results can be found in the following links: https://earthexplorer.usgs.gov/; https://land.copernicus.eu/en/products/corine-land-cover/clc2018; https://esdac.jrc.ec.europa.eu/content/lucas-2018-topsoil-data (accessed on 13 October 2023, 29 January 2024, and 15 February 2024, respectively).

Conflicts of Interest

The authors declare no conflict of interest.

References

  1. Psomiadis, E.; Charizopoulos, N.; Soulis, K.X.; Efthimiou, N. Investigating the Correlation of Tectonic and Morphometric Characteristics with the Hydrological Response in a Greek River Catchment Using Earth Observation and Geospatial Analysis Techniques. Geosciences 2020, 10, 377. [Google Scholar] [CrossRef]
  2. Prakash, K.; Rawat, D.; Singh, S.; Chaubey, K.; Kanhaiya, S.; Mohanty, T. Morphometric Analysis Using SRTM and GIS in Synergy with Depiction: A Case Study of the Karmanasa River Basin, North Central India. Appl. Water Sci. 2019, 9, 13. [Google Scholar] [CrossRef]
  3. Psomiadis, E.; Migiros, G.; Antoniou, V. Geomorphological Quantitative Analysis of Sperchios River Basin Area (Central Greece) Utilizing Geographical Information Systems. Bull. Geol. Soc. Greece 2013, 47, 325. [Google Scholar] [CrossRef]
  4. Psomiadis, E. Research of Geomorphological and Environmental Changes in the Sperchios’ River Basin Utilizing New Technologies. Ph.D. Thesis, Agricultural University of Athens, Athina, Greek, 2010. (In Greek). [Google Scholar]
  5. Tucker, G.E.; Hancock, G.R. Modelling Landscape Evolution. Earth Surf. Process. Landforms 2010, 35, 28–50. [Google Scholar] [CrossRef]
  6. Charizopoulos, N.; Mourtzios, P.; Psilovikos, T.; Psilovikos, A.; Karamoutsou, L. Comptes Rendus-Geoscience Morphometric Analysis of the Drainage Network of Samos Island (Northern Aegean Sea): Insights into Tectonic Control and Fl Ood Hazards. Comptes Rendus-Geosci. 2019, 351, 375–383. [Google Scholar] [CrossRef]
  7. Waikar, M.L.; Nilawar, A.P. Morphometric Analysis of a Drainage Basin Using Geographical Information System: A Case Study. Int. J. Multidiscip. Curr. Res. 2014, 2, 179–184. [Google Scholar]
  8. Ganasri, B.P.; Ramesh, H. Assessment of Soil Erosion by RUSLE Model Using Remote Sensing and GIS-A Case Study of Nethravathi Basin. Geosci. Front. 2016, 7, 953–961. [Google Scholar] [CrossRef]
  9. Horton, R.E. Drainage-basin Characteristics. Eos Trans. Am. Geophys. Union 1932, 13, 350–361. [Google Scholar] [CrossRef]
  10. Horton, R.E. An Approach Toward a Physical Interpretation of Infiltration-Capacity. Soil Sci. Soc. Am. J. 1941, 5, 399–417. [Google Scholar] [CrossRef]
  11. Horton, R.E. Erosional Development of Streams and Their Drainage Basins; Hydrophysical Approach to Quantitative Morphology. GSA Bull. 1945, 56, 275–370. [Google Scholar] [CrossRef]
  12. Strahler, A.N. Hypsometric (Area-Altitude) Analysis of Erosional Topography. GSA Bull. 1952, 63, 1117–1142. [Google Scholar] [CrossRef]
  13. Strahler, A.N. Quantitative Analysis of Watershed Geomorphology. Eos Trans. Am. Geophys. Union 1957, 38, 913–920. [Google Scholar] [CrossRef]
  14. Dapin, I.G.; Ella, V.B. GIS-Based Soil Erosion Risk Assessment in the Watersheds of Bukidnon, Philippines Using the RUSLE Model. Sustainability 2023, 15, 3325. [Google Scholar] [CrossRef]
  15. Mantilla, R.; Gupta, V.K. A GIS Numerical Framework to Study the Process Basis of Scaling Statistics in River Networks. IEEE Geosci. Remote Sens. Lett. 2005, 2, 404–408. [Google Scholar] [CrossRef]
  16. Cao, Q.; Miao, Y.; Li, F.; Gao, X.; Liu, B.; Lu, D.; Chen, X. Developing a New Crop Circle Active Canopy Sensor-Based Precision Nitrogen Management Strategy for Winter Wheat in North China Plain. Precis. Agric. 2017, 18, 2–18. [Google Scholar] [CrossRef]
  17. Harsha, J.; Ravikumar, A.S.; Shivakumar, B.L. Evaluation of Morphometric Parameters and Hypsometric Curve of Arkavathy River Basin Using RS and GIS Techniques. Appl. Water Sci. 2020, 10, 86. [Google Scholar] [CrossRef]
  18. Panagos, P.; Borrelli, P.; Jones, A.; Robinson, D.A. A 1 Billion Euro Mission: A Soil Deal for Europe. Eur. J. Soil Sci. 2024, 75, e13466. [Google Scholar] [CrossRef]
  19. Pandey, A.; Himanshu, S.K.; Mishra, S.K.; Singh, V.P. Physically Based Soil Erosion and Sediment Yield Models Revisited. CATENA 2016, 147, 595–620. [Google Scholar] [CrossRef]
  20. Covelli, C.; Cimorelli, L.; Pagliuca, D.N.; Molino, B.; Pianese, D. Assessment of Erosion in River Basins: A Distributed Model to Estimate the Sediment Production over Watersheds by a 3-Dimensional LS Factor in RUSLE Model. Hydrology 2020, 7, 13. [Google Scholar] [CrossRef]
  21. Poesen, J.W.; Torri, D.; Bunte, K. Effects of Rock Fragments on Soil Erosion by Water at Different Spatial Scales: A Review. CATENA 1994, 23, 141–166. [Google Scholar] [CrossRef]
  22. Smets, T.; Poesen, J.; Bochet, E. Impact of Plot Length on the Effectiveness of Different Soil-Surface Covers in Reducing Runoff and Soil Loss by Water. Prog. Phys. Geogr. 2008, 32, 654–677. [Google Scholar] [CrossRef]
  23. Panagos, P.; Borrelli, P.; Poesen, J.; Ballabio, C.; Lugato, E.; Meusburger, K.; Montanarella, L.; Alewell, C. The New Assessment of Soil Loss by Water Erosion in Europe. Environ. Sci. Policy 2015, 54, 438–447. [Google Scholar] [CrossRef]
  24. Borrelli, P.; Märker, M.; Panagos, P.; Schütt, B. Modeling Soil Erosion and River Sediment Yield for an Intermountain Drainage Basin of the Central Apennines, Italy. CATENA 2014, 114, 45–58. [Google Scholar] [CrossRef]
  25. Funk, R.; Völker, L.; Deumlich, D. Landscape Structure Model Based Estimation of the Wind Erosion Risk in Brandenburg, Germany. Aeolian Res. 2023, 62, 100878. [Google Scholar] [CrossRef]
  26. Zhou, Y.; Zhang, Y.; Vaze, J.; Lane, P.; Xu, S. Impact of Bushfire and Climate Variability on Streamflow from Forested Catchments in Southeast Australia. Hydrol. Sci. J. 2015, 60, 1340–1360. [Google Scholar] [CrossRef]
  27. Shroder, J.F.; Bishop, M.P. Mass Movement in the Himalaya: New Insights and Research Directions. Geomorphology 1998, 26, 13–35. [Google Scholar] [CrossRef]
  28. Kirkby, M.J.; Irvine, B.J.; Jones, R.J.A.; Govers, G.; Boer, M.; Cerdan, O.; Daroussin, J.; Gobin, A.; Grimm, M.; Le Bissonnais, Y.; et al. The PESERA Coarse Scale Erosion Model for Europe. I.—Model Rationale and Implementation. Eur. J. Soil Sci. 2008, 59, 1293–1306. [Google Scholar] [CrossRef]
  29. Dragičević, N.; Karleuša, B.; Ožanić, N. A Review of the Gavrilović Method (Erosion Potential Method) Application. Gradjevinar 2016, 68, 715–725. [Google Scholar] [CrossRef]
  30. Flanagan, D.C.; Gilley, J.E.; Franti, T.G. Water Erosion Prediction Project (WEPP): Development History, Model Capabilities, and Future Enhancements. Trans. ASABE 2007, 50, 1603–1612. [Google Scholar] [CrossRef]
  31. De Roo, A.P.J.; Hazelhoff, L.; Burrough, P.A. Soil Erosion Modelling Using ‘Answers’ and Geographical Information Systems. Earth Surf. Process. Landforms 1989, 14, 517–532. [Google Scholar] [CrossRef]
  32. Neitsch, S.L.; Arnold, J.G.; Kiniry, J.R.; Williams, J.R. Soil and Water Assessment Tool Theoretical Documentation Version 2005. 2005. Available online: https://swat.tamu.edu/media/1292/swat2005theory.pdf (accessed on 1 February 2025).
  33. Laflen, J.M.; Lane, L.J.; Foster, G.R. WEPP: A New Generation of Erosion Prediction Technology. J. Soil Water Conserv. 1991, 46, 34–38. [Google Scholar] [CrossRef]
  34. Karydas, C.G.; Panagos, P. The G2 Erosion Model: An Algorithm for Month-Time Step Assessments. Environ. Res. 2018, 161, 256–267. [Google Scholar] [CrossRef] [PubMed]
  35. Wischmeier, W.H.; Smith, D.D. Predicting Rainfall Erosion Losses: A Guide to Conservation Planning; United States Science, Education Administration, Purdue University Agricultural Experiment Station, Eds.; USDA Publications, Department of Agriculture, Science and Education Administration, U.S. Government Printing Office: Washington, DC, USA, 1978. [Google Scholar]
  36. Renard, K.G.; Foster, G.R.; Weesies, G.A.; Porter, J.I. RUSLE Revised Universal Soil Loss Equation; United States Department of Agriculture (USDA), Agricultural Research Service (ARS): Beltsville, MD, USA, 1991. [Google Scholar]
  37. Kouli, M.; Soupios, P.; Vallianatos, F. Soil Erosion Prediction Using the Revised Universal Soil Loss Equation (RUSLE) in a GIS Framework, Chania, Northwestern Crete, Greece. Environ. Geol. 2009, 57, 483–497. [Google Scholar] [CrossRef]
  38. Alexiou, S.; Efthimiou, N.; Karamesouti, M.; Papanikolaou, I.; Psomiadis, E.; Charizopoulos, N. Measuring Annual Sedimentation through High Accuracy UAV-Photogrammetry Data and Comparison with RUSLE and PESERA Erosion Models. Remote Sens. 2023, 15, 1339. [Google Scholar] [CrossRef]
  39. Efthimiou, N.; Psomiadis, E.; Panagos, P. Fire Severity and Soil Erosion Susceptibility Mapping Using Multi-Temporal Earth Observation Data: The Case of Mati Fatal Wildfire in Eastern Attica, Greece. CATENA 2020, 187, 104320. [Google Scholar] [CrossRef]
  40. Efthimiou, N.; Lykoudi, E.; Karavitis, C. Comparative Analysis of Sediment Yield Estimations Using Different Empirical Soil Erosion Models. Hydrol. Sci. J. 2017, 62, 2674–2694. [Google Scholar] [CrossRef]
  41. Brini, I.; Alexakis, D.D.; Kalaitzidis, C. Linking Soil Erosion Modeling to Landscape Patterns and Geomorphometry: An Application in Crete, Greece. Appl. Sci. 2021, 11, 5684. [Google Scholar] [CrossRef]
  42. Stefanidis, S.P.; Proutsos, N.D.; Solomou, A.D.; Michopoulos, P.; Bourletsikas, A.; Tigkas, D.; Spalevic, V.; Kader, S. Spatiotemporal Monitoring of Post-Fire Soil Erosion Rates Using Earth Observation (EO) Data and Cloud Computing. Nat. Hazards 2024, 121, 2873–2894. [Google Scholar] [CrossRef]
  43. González Bonorino, G.; Osterkamp, W.R.; Colombo Piñol, F. An Averaging Procedure for Applying the Revised Universal Soil Loss Equation (RUSLE) to Disturbed Mountain Watersheds. Geogaceta 2002, 33, 51–54. [Google Scholar]
  44. Bircher, P.; Liniger, H.P.; Prasuhn, V. Comparison of Long-Term Field-Measured and RUSLE-Based Modelled Soil Loss in Switzerland. Geoderma Reg. 2022, 31, e00595. [Google Scholar] [CrossRef]
  45. Getu, L.A.; Nagy, A.; Addis, H.K. Soil Loss Estimation and Severity Mapping Using the RUSLE Model and GIS in Megech Watershed, Ethiopia. Environ. Chall. 2022, 8, 100560. [Google Scholar] [CrossRef]
  46. Demir, S.; Dursun, İ. Assessment of Pre- and Post-Fire Erosion Using the RUSLE Equation in a Watershed Affected by the Forest Fire on Google Earth Engine: The Study of Manavgat River Basin. Nat. Hazards 2024, 120, 2499–2527. [Google Scholar] [CrossRef]
  47. Nourizadeh, M.; Naghavi, H.; Omidvar, E. Correction to: The Effect of Land Use and Land Cover Changes on Soil Erosion in Semi-Arid Areas Using Cloud-Based Google Earth Engine Platform and GIS-Based RUSLE Model. Nat. Hazards 2024, 120, 8095–8099. [Google Scholar] [CrossRef]
  48. Gupta, S.; Ojha, C.S.P.; Singh, V.P.; Adeloye, A.J.; Jain, S.K. Pixel-Based Soil Loss Estimation and Prioritization of North-Western Himalayan Catchment Based on Revised Universal Soil Loss Equation (RUSLE). Sustainability 2023, 15, 15177. [Google Scholar] [CrossRef]
  49. Kinnell, P.I.A. Event Soil Loss, Runoff and the Universal Soil Loss Equation Family of Models: A Review. J. Hydrol. 2010, 385, 384–397. [Google Scholar] [CrossRef]
  50. Li, P.; Zang, Y.; Ma, D.; Yao, W.; Holden, J.; Irvine, B.; Zhao, G. Soil Erosion Rates Assessed by RUSLE and PESERA for a Chinese Loess Plateau Catchment under Land-cover Changes. Earth Surf. Process. Landforms 2020, 45, 707–722. [Google Scholar] [CrossRef]
  51. Kaffas, K.; Pisinaras, V.; Al Sayah, M.J.; Santopietro, S.; Righetti, M. A USLE-Based Model with Modified LS-Factor Combined with Sediment Delivery Module for Alpine Basins. CATENA 2021, 207, 105655. [Google Scholar] [CrossRef]
  52. De Vente, J.; Poesen, J.; Verstraeten, G.; Govers, G.; Vanmaercke, M.; Van Rompaey, A.; Arabkhedri, M.; Boix-Fayos, C. Predicting Soil Erosion and Sediment Yield at Regional Scales: Where Do We Stand? Earth-Sci. Rev. 2013, 127, 16–29. [Google Scholar] [CrossRef]
  53. Polykretis, C.; Alexakis, D.D.; Grillakis, M.G.; Manoudakis, S. Assessment of Intra-Annual and Inter-Annual Variabilities of Soil Erosion in Crete Island (Greece) by Incorporating the Dynamic “Nature” of R and C-Factors in RUSLE Modeling. Remote Sens. 2020, 12, 2439. [Google Scholar] [CrossRef]
  54. Efthimiou, N.; Psomiadis, E.; Papanikolaou, I.; Soulis, K.X.; Borrelli, P.; Panagos, P. A New High Resolution Object-Oriented Approach to Define the Spatiotemporal Dynamics of the Cover-Management Factor in Soil Erosion Modelling. CATENA 2022, 213, 106149. [Google Scholar] [CrossRef]
  55. Psomiadis, E.; Papazachariou, A.; Soulis, K.X.; Alexiou, D.S.; Charalampopoulos, I. Landslide Mapping and Susceptibility Assessment Using Geospatial Analysis and Earth Observation Data. Land 2020, 9, 133. [Google Scholar] [CrossRef]
  56. Sidi Almouctar, M.A.; Wu, Y.; Zhao, F.; Dossou, J.F. Soil Erosion Assessment Using the RUSLE Model and Geospatial Techniques (Remote Sensing and GIS) in South-Central Niger (Maradi Region). Water 2021, 13, 3511. [Google Scholar] [CrossRef]
  57. Ghosh, A.; Rakshit, S.; Tikle, S.; Das, S.; Chatterjee, U.; Pande, C.B.; Alataway, A.; Al-Othman, A.A.; Dewidar, A.Z.; Mattar, M.A. Integration of GIS and Remote Sensing with RUSLE Model for Estimation of Soil Erosion. Land 2022, 12, 116. [Google Scholar] [CrossRef]
  58. Liu, B.Y.; Nearing, M.A.; Risse, L.M. Slope Gradient Effects on Soil Loss for Steep Slopes. Trans. Am. Soc. Agric. Eng. 1994, 37, 1835–1840. [Google Scholar] [CrossRef]
  59. Michalopoulou, M.; Depountis, N.; Nikolakopoulos, K.; Boumpoulis, V. The Significance of Digital Elevation Models in the Calculation of LS Factor and Soil Erosion. Land 2022, 11, 1592. [Google Scholar] [CrossRef]
  60. Jothimani, M.; Mulualem, W. Drainage Morphometric Characterization of Megech River Watershed, North Western Ethiopia, Using Geospatial Tools. Ethiop. J. Nat. Comput. Sci. 2021, 1, 37–52. [Google Scholar] [CrossRef]
  61. Gajbhiye, S.; Mishra, S.K.; Pandey, A. Prioritizing Erosion-Prone Area through Morphometric Analysis: An RS and GIS Perspective. Appl. Water Sci. 2013, 4, 51–61. [Google Scholar] [CrossRef]
  62. Kumar, A.; Singh, S.; Pramanik, M.; Chaudhary, S.; Negi, M.S. Soil Erodibility Mapping Using Watershed Prioritization and Morphometric Parameters in Conjunction with WSA, SPR and AHP-TOPSIS Models in Mandakini Basin, India. Int. J. River Basin Manag. 2024, 22, 143–165. [Google Scholar] [CrossRef]
  63. Farhan, Y.; Anbar, A.; Al-Shaikh, N.; Mousa, R.; Farhan, Y.; Anbar, A.; Al-Shaikh, N.; Mousa, R. Prioritization of Semi-Arid Agricultural Watershed Using Morphometric and Principal Component Analysis, Remote Sensing, and GIS Techniques, the Zerqa River Watershed, Northern Jordan. Agric. Sci. 2016, 8, 113–148. [Google Scholar] [CrossRef]
  64. Shekar, P.R.; Mathew, A.; Abdo, H.G.; Almohamad, H.; Abdullah Al Dughairi, A.; Al-Mutiry, M. Prioritizing Sub-Watersheds for Soil Erosion Using Geospatial Techniques Based on Morphometric and Hypsometric Analysis: A Case Study of the Indian Wyra River Basin. Appl. Water Sci. 2023, 13, 160. [Google Scholar] [CrossRef]
  65. Bottema, S. Pollen Analytical Investigations in Thessaly (Greece). Palaeohistoria 1979, 21, 19–40. [Google Scholar]
  66. Harrison, S.P.; Digerfeldt, G. European Lakes as Palaeohydrological and Palaeoclimatic Indicators. Quat. Sci. Rev. 1993, 12, 233–248. [Google Scholar] [CrossRef]
  67. Yu, G.; Harrison, S.P. Holocene Changes in Atmospheric Circulation Patterns as Shown by Lake Status Changes in Northern Europe. Boreas 1995, 24, 260–268. [Google Scholar] [CrossRef]
  68. Digerfeldt, G.; Sandgren, P.; Olsson, S. Reconstruction of Holocene Lake-Level Changes in Lake Xinias, Central Greece. Holocene 2007, 17, 361–367. [Google Scholar] [CrossRef]
  69. Charizopoulos, N.; Stamatis, G.; Psilovikos, A. Water Balance and Temporal Changes of the Surface Water Quality in Xynias Basin (SW Thessaly). In Advances in the Research of Aquatic Environment; Springer: Berlin/Heidelberg, Germany, 2011; pp. 275–281. [Google Scholar] [CrossRef]
  70. Charizopoulos, N.; Psilovikos, A. Hydrologic Processes Simulation Using the Conceptual Model Zygos: The Example of Xynias Drained Lake Catchment (Central Greece). Environ. Earth Sci. 2016, 75, 777. [Google Scholar] [CrossRef]
  71. Charizopoulos, N.; Zagana, E.; Stamatis, G. Hydrogeochemical Investigations in a Drained Lake Area: The Case of Xynias Basin (Central Greece). Environ. Monit. Assess. 2016, 188, 480. [Google Scholar] [CrossRef]
  72. Karmis, P.; Karmis, P. Electromagnetic Geophysical Survey Survey in the Area of Drained Lake Xyniada; Report Series; Institute of Geology and Mineral Exploration: Athens, Greece, 2010. [Google Scholar]
  73. Charizopoulos, N. Investigation on Mechanisms of Quantitative and Qualitative Deterioration of Water and Soil Recourses in Domokos Basin by Natural an Anthropogenic Process. Ph.D. Thesis, Agricultural Unversity of Athens, Athens, Greece, 2013. (In Greek). [Google Scholar]
  74. Mountrakis, D. Geology of Greece; Scientific Research Publishing: Irvine, CA, USA, 1985. (In Greek) [Google Scholar]
  75. Hynes, A.J.; Nisbet, E.G.; Smith, G.A.; Welland, M.J.P.; Rex, D.C. Spreading and Emplacement Ages of Some Ophiolites in the Othris Region (Eastern Central Greece). Z. Deutsch. Geol. Ges. 1972, 123, 455–468. [Google Scholar] [CrossRef]
  76. Caputo, R.; Pavlides, S. Late Cainozoic Geodynamic Evolution of Thessaly and Surroundings (Central-Northern Greece). Tectonophysics 1993, 223, 339–362. [Google Scholar] [CrossRef]
  77. Marinos, G.; Anastopoulos, J.; Maratos, N.; Melidonis, N.; Andronopoulos, B. Geological Map of Greece, Sheets Anavra and Domokos, 1:50,000; Hellenic Survey of Geology & Mineral Exploration: Athens, Greece, 1957; 1 Sheet. [Google Scholar]
  78. Marinos, G.; Anastopoulos, J.; Maratos, N.; Melidonis, N.; Andronopoulos, B. Geological Map of Greece, Sheet Leontarion, 1:50,000; Hellenic Survey of Geology & Mineral Exploration: Athens, Greece, 1962; 1 sheet. [Google Scholar]
  79. Tóth, G.; Jones, A.; Montanarella, L. The LUCAS Topsoil Database and Derived Information on the Regional Variability of Cropland Topsoil Properties in the European Union. Environ. Monit. Assess. 2013, 185, 7409–7425. [Google Scholar] [CrossRef]
  80. Orgiazzi, A.; Ballabio, C.; Panagos, P.; Jones, A.; Fernández-Ugalde, O. LUCAS Soil, the Largest Expandable Soil Dataset for Europe: A Review. Eur. J. Soil Sci. 2018, 69, 140–153. [Google Scholar] [CrossRef]
  81. Planchon, O.; Darboux, F. A Fast, Simple and Versatile Algorithm to Fill the Depressions of Digital Elevation Models. CATENA 2002, 46, 159–176. [Google Scholar] [CrossRef]
  82. Argyriou, A.V.; Teeuw, R.M.; Soupios, P.; Sarris, A. Neotectonic Control on Drainage Systems: GIS-Based Geomorphometric and Morphotectonic Assessment for Crete, Greece. J. Struct. Geol. 2017, 104, 93–111. [Google Scholar] [CrossRef]
  83. Babu, K.J.; Sreekumar, S.; Aslam, A. Implication of Drainage Basin Parameters of a Tropical River Basin of South India. Appl. Water Sci. 2016, 6, 67–75. [Google Scholar] [CrossRef]
  84. Schumm, S.A. Evolution of Drainage Systems and Slopes in Badlands at Perth Amboy, New Jersey. Geol. Soc. Am. Bull. 1956, 67, 597–646. [Google Scholar] [CrossRef]
  85. Keller, E.A. Active Tectonics: Earthquakes, Uplift, and Landscape, 2nd ed.; Prentice Hall: Upper Saddle River, NJ, USA, 2002; ISBN 0130882305. [Google Scholar]
  86. Miller, V.C. A Quantitative Geomorphic Study of Drainage Basin Characteristics in the Clinch Mountain Area, Virginia and Tennessee; Technical Report 3; Columbia University Department of Geology: New York, NY, USA, 1953. [Google Scholar]
  87. Apollov, B.A. A Study of Rivers; Moscow University: Moscow, Russia, 1963. [Google Scholar]
  88. Verstappen, H. The Applied Geomorphology; International Institute for Aerial Survey and Earth Science (I.T.C): Enschede, The Netherlands, 1983. [Google Scholar]
  89. Kumar, A.; Samuel, S.K.; Vyas, V. Morphometric Analysis of Six Sub-Watersheds in the Central Zone of Narmada River. Arab. J. Geosci. 2015, 8, 5685–5712. [Google Scholar] [CrossRef]
  90. Farhan, Y.; Anbar, A.; Enaba, O.; Al-shaikh, N. Quantitative Analysis of Geomorphometric Parameters of Wadi Kerak, Jordan, Using Remote Sensing and GIS. J. Water Resour. Prot. 2015, 7, 456–475. [Google Scholar] [CrossRef]
  91. Pike, R.J.; Wilson, S.E. Elevation-Relief Ratio, Hypsometric Integral, and Geomorphic Area-Altitude Analysis. Bull. Geol. Soc. Am. 1971, 82, 1079–1083. [Google Scholar] [CrossRef]
  92. Magesh, N.S.; Chandrasekar, N. GIS Model-Based Morphometric Evaluation of Tamiraparani Subbasin, Tirunelveli District, Tamil Nadu, India. Arab. J. Geosci. 2014, 7, 131–141. [Google Scholar] [CrossRef]
  93. Morisawa, M. Rivers: Form and Process; Clayton, K.M., Ed.; Geomorphology Texts 7; Longman: Harlow, UK, 1985; ISBN 0582489822. [Google Scholar]
  94. Strahler, A.N. Quantitative Geomorphology of Drainage Basin and Channel Networks; Chow, V., Ed.; Handbook of Applied Hydrology; McGraw Hill, Open Access Library: New York, NY, USA, 1964. [Google Scholar]
  95. Van Der Knijff, J.M.; Jones, R.J.A.; Montanarella, L.; European Soil Bureau. Soil Erosion Risk Assessment Italy, Soil Erosion Risk Assessment in Europe; European Commission Directorate General, Joint Research Center, Space Applications Institute: Rome, Italy.
  96. Fox, D.G. Judging Air Quality Model Performance. A Summary of the AMS Workshop on Dispersion Model Performance. B. Am. Meteorol. Soc. 1981, 62, 599. [Google Scholar] [CrossRef]
  97. Wischmeier, W.H.; Johnson, C.B.; Cross, B.W. A Soil Erodibility Nomograph for Farmland and Construction Sites. J. Soil Water Conserv. 1971, 26, 189–193. [Google Scholar]
  98. Ditzler, C.; Scheffe, K.; Monger, H. Soil Survey Manual; Soil Science Division Staff, Ed.; Agriculture Handbook No. 18; United States Department of Agriculture: Washington, DC, USA, 2017. [Google Scholar]
  99. Rawls, W.J.; Brakensiek, C.L.; Saxton, K.E. Estimation of Soil Water Properties. Trans.-Am. Soc. Agric. Eng. 1982, 25, 1316–1320. [Google Scholar] [CrossRef]
  100. Angulo-Martínez, M.; López-Vicente, M.; Vicente-Serrano, S.M.; Beguería, S. Mapping Rainfall Erosivity at a Regional Scale: A Comparison of Interpolation Methods in the Ebro Basin (NE Spain). Hydrol. Earth Syst. Sci. 2009, 13, 1907–1920. [Google Scholar] [CrossRef]
  101. Panagos, P.; Meusburger, K.; Alewell, C.; Montanarella, L. Soil Erodibility Estimation Using LUCAS Point Survey Data of Europe. Environ. Model. Softw. 2012, 30, 143–145. [Google Scholar] [CrossRef]
  102. Panagos, P.; Borrelli, P.; Meusburger, K. A New European Slope Length and Steepness Factor (LS-Factor) for Modeling Soil Erosion by Water. Geosciences 2015, 5, 117–126. [Google Scholar] [CrossRef]
  103. Desmet, P.J.J.; Govers, G. A GIS Procedure for Automatically Calculating the USLE LS Factor on Topographically Complex Landscape Units. J. Soil Water Conserv. 1996, 51, 427–433. [Google Scholar] [CrossRef]
  104. de Vente, J.; Poesen, J.; Govers, G.; Boix-Fayos, C. The Implications of Data Selection for Regional Erosion and Sediment Yield Modelling. Earth Surf. Process. Landforms 2009, 34, 1994–2007. [Google Scholar] [CrossRef]
  105. Wang, G.; Wente, S.; Gertner, G.Z.; Anderson, A. Improvement in Mapping Vegetation Cover Factor for the Universal Soil Loss Equation by Geostatistical Methods with Landsat Thematic Mapper Images. Int. J. Remote Sens. 2002, 23, 3649–3667. [Google Scholar] [CrossRef]
  106. Efthimiou, N. Object-oriented Soil Erosion Modelling: A Non-Stationary Approach towards a Realistic Calculation of Soil Loss at Parcel Level. CATENA 2023, 222, 106816. [Google Scholar] [CrossRef]
  107. Panagos, P.; Borrelli, P.; Meusburger, K.; van der Zanden, E.H.; Poesen, J.; Alewell, C. Modelling the Effect of Support Practices (P-Factor) on the Reduction of Soil Erosion by Water at European Scale. Environ. Sci. Policy 2015, 51, 23–34. [Google Scholar] [CrossRef]
  108. Leopold, L.B.; Langbein, W.B. The Concept of Entropy in Landscape Evolution; Professional Paper; United States Government Printing Office: Washington, DC, USA, 1962; pp. A1–A20. [CrossRef]
  109. Shreve, R.L. Statistical Law of Stream Numbers. J. Geol. 1966, 74, 17–37. [Google Scholar] [CrossRef]
  110. Cooper, A.H.; Farrant, A.R.; Price, S.J. The Use of Karst Geomorphology for Planning, Hazard Avoidance and Development in Great Britain. Geomorphology 2011, 134, 118–131. [Google Scholar] [CrossRef]
  111. Parcharidis, I.; Psomiadis, E.; Stamatis, G. Using Landsat TM Images to Study the Karstic Phenomenon. Int. J. Appl. Earth Obs. Geoinf. 1998, 1998, 118–123. [Google Scholar]
  112. Pareta, K.; Pareta, U. Quantitative Morphometric Analysis of a Watershed of Yamuna Basin, India Using ASTER (DEM) Data and GIS. Int. J. Geomatics Geosci. 2011, 2, 248–269. [Google Scholar]
  113. Chow, V.T. Handbook of Applied Hydrology: A Compendium of Water-Resources Technology; McGraw-Hill book Co.: New York, NY, USA, 1964. [Google Scholar]
  114. Singh, S.; Singh, M.C. Morphometric Analysis of Kanhar River Basin. Natl. Geogr. J. India 1997, 43, 31–43. Available online: https://www.scirp.org/reference/referencespapers?referenceid=1451679 (accessed on 21 January 2025).
  115. Samarinas, N.; Tsakiridis, N.L.; Kalopesa, E.; Zalidis, G.C. Soil Loss Estimation by Water Erosion in Agricultural Areas Introducing Artificial Intelligence Geospatial Layers into the RUSLE Model. Land 2024, 13, 174. [Google Scholar] [CrossRef]
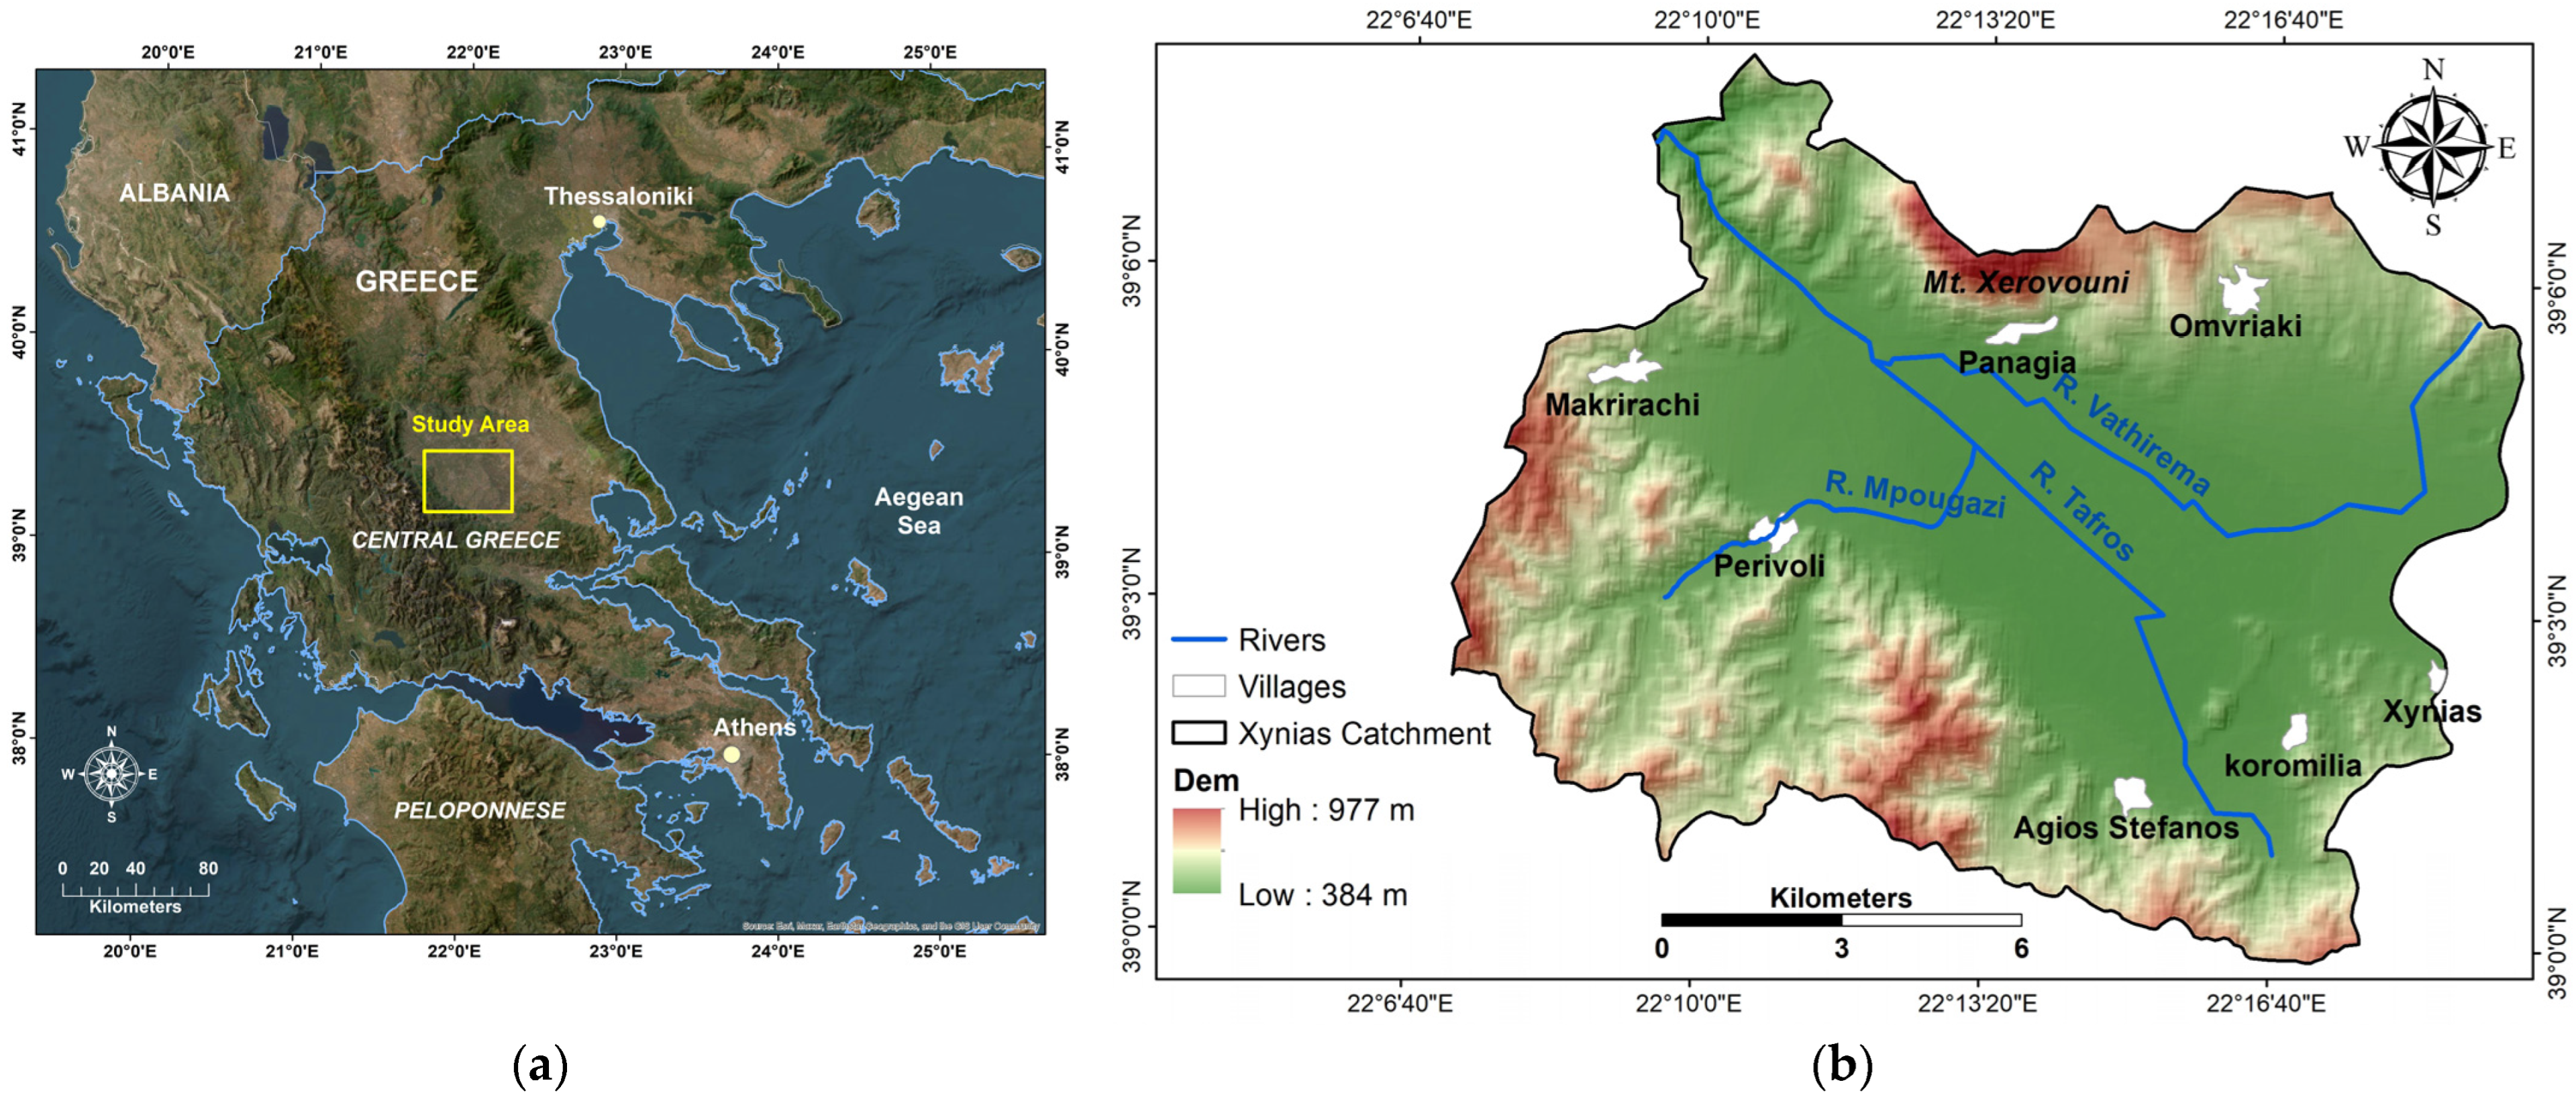
Figure 1. (a) The geographical location of the Xynias catchment; (b) the geomorphological setting map of the Xynias drained lake catchment.
Sustainability 17 05526 g001
Figure 2. The land cover map for the Xynias catchment (Corine Land Cover 2018).
Sustainability 17 05526 g002
Figure 3. The hydrographic network classification of the study area, according to [13] οver the geological formations.
Sustainability 17 05526 g003
Figure 4. (a) Deviation from the ideal stream number per order according to Horton’s first law. (b) Deviation from the ideal mean stream length per order according to Horton’s second law.
Sustainability 17 05526 g004
Figure 5. The hypsometric integral of the Xynias drained lake catchment.
Sustainability 17 05526 g005
Figure 6. The RUSLE application. (a) R-factor; (b) LS-factor; (c) K-factor; (d) C-factor; (e) P-factor.
Sustainability 17 05526 g006
Figure 7. Mean annual soil erosion (t−1 ha−1 y−1) for the 20-year RUSLE simulation.
Sustainability 17 05526 g007
Table 1. Morphometric parameters of the study area.
ParameterFormulaDescriptionReferences
Horton’s first law of stream numbers N u = R b _   K u (1)The numbers of streams of successively lower orders in each catchment tend to form a geometric progression[10]
Horton’s second law of stream lengths Σ L u _ = L 1 _   R L _   u 1 (2)The mean stream length segments of each of the successive orders tend to approximate a direct geometric series, with stream length increasing towards a higher order of streams[10]
Drainage density, D (km−1) D = Σ L A (3)The aggregate length of streams per unit area[9,11]
Channel frequency, F (km−2) F = Σ N u A (4)The total number of streams per unit area[9,11]
Relief ratio, Rh (%) R h = H Lbu max (5)The ratio of basin relief to basin length[84]
Circularity R c = 4 π A P 2 (6)Circularity is defined as the ratio of the catchment to the area of a circle having the same perimeter as the catchment[86]
Elongation ratio R e = 1.129 ( A ) 0.5 Lbu max (7)The elongation ratio is the ratio between the diameter of the circle of the same area as the catchment and the maximum length of the catchment[84]
Hypsometric integral, Hi (%) H i = H m H min H max H min (8)The area below the hypsometric curve, which represents the relative proportion of the watershed area below (or above) a given height[85]
Where Σ L u _ = L 1 _ R L _ u 1 N u = Ideal value for the number of streams of order u, R b _ = Mean bifurcation ratio (Rb = Nu/Nu+1, where N u is the number of streams of order u), K = The maximum order of the streams, u = Streams of a given order, Σ L u _ = Ideal value for channels mean length of order u, L 1 _ = The mean channel length of the first order, R L _ = Mean length ratio ( R L _ = L u _ / L u _ 1 ,   w h e r e   L u _ : mean channels length of order u), ΣL = Total channels length (km), A = Catchment area (km2), ΣNu = Total number of streams, H = Hmax − Hmin (m), Lbumax = The maximum length of the catchment (km) [87], P = Perimeter (km), Hm = Mean altitude of the catchment (m), Hmin = Minimum altitude of the catchment (m), Hmax = Maximum altitude of the catchment (m).
Table 2. Results of morphometric analysis of the study area.
Morphometric ParametersValues
Area (km2)167.9
Drainage density (km/km2)2.02
Drainage frequency (n/km2)3.21
The maximum length of the catchment (km)19.8
Catchment width (km)8.5
Perimeter (km)66.2
Maximum Elevation Hmax (m)977
Minimum Elevation Hmin (m)384
Total relief (m)593
Mean Elevation—Hmean (m)540
Relief ratio (%)2.98
Circularity0.48
Elongation ratio0.74
Hypsometric integral (%)26.3
Table 3. Horton’s first and second laws for the Xynias drained lake catchment area hydrographic network.
Stream Order (u)Stream Number (Nu)Bifurcation Ratio
( R b )
Mean Bifurcation Ratio
R b ¯
Ideal Stream NumberDeviation (%)Stream Length (Lu)Mean Stream Length
L u ¯
Length Ratio
( R L )
Mean Length Ratio
( R L ¯ )
Ideal Mean Stream LengthDeviation (%)
1387 3.46495−21.81152.90.39 2.020.390.0
21103.52143−23.0882.20.741.890.79−6.33
3323.4441−21.9550.81.592.151.60−0.62
465.3312−50.0017.22.871.803.23−11.15
5323029.59.833.426.5250.77
613108.18.10.8213.17−38.50
ΣNu = 539 ΣLu = 340.7 (km)
Table 4. The static C factor assigned to each land use type (CLC18).
Land Use TypeCORINE LU CodeC Factor
Discontinuous urban fabric 0.001
Construction sites1330.01
Non-irrigated arable land2110.3
Permanently irrigated land2120.15
Complex cultivation patterns2420.18
Land occupied by agriculture2430.07
Broad-leaved forest3110.003
Coniferous forest3120.002
Natural grassland3210.05
Sclerophyllous vegetation3230.03
Transitional woodland shrub3240.02
Disclaimer/Publisher’s Note: The statements, opinions and data contained in all publications are solely those of the individual author(s) and contributor(s) and not of MDPI and/or the editor(s). MDPI and/or the editor(s) disclaim responsibility for any injury to people or property resulting from any ideas, methods, instructions or products referred to in the content.