1. Introduction
As global energy demand rises dramatically, traditional fossil fuel combustion releases significant pollutants and greenhouse gases that intensify climate change and extreme weather events [
1]. Rising temperatures, melting glaciers, and sea level increases demonstrate that emissions threaten both sustainable development and human survival [
2]. In response, nations worldwide prioritize carbon emission control, with “carbon peaking” and “carbon neutrality” emerging as central sustainability concepts. Carbon peaking occurs when emissions reach maximum levels before sustained decline [
3], while carbon neutrality achieves net-zero emissions through balanced release and removal [
4].
Major economies lead global reduction initiatives, with developed nations already reaching emission peaks: the EU (1990), US and Canada (2007), and Japan and South Korea (2013) [
5]. China, transitioning from manufacturing to services and technology, committed to peak emissions by 2030 [
6], supporting global net-zero goals.
Regional integrated energy systems have emerged as crucial solutions, coupling multiple energy sources and seamlessly integrating electricity, natural gas, and thermal energy across production, transmission, conversion, storage, and consumption [
7,
8]. Unlike traditional single-source approaches, these systems convert heterogeneous energy forms through coupling devices, delivering coordinated operations that meet diverse regional demands for electricity, gas, and heat [
9]. All-electric energy stations represent innovative integrated supply systems, providing efficient, clean, intelligent services through strategic technology integration [
10], typically incorporating substations, photovoltaics, wind turbines, EV charging, energy storage, smart lighting, and monitoring systems for optimal resource utilization [
11].
Current academic research on integrated energy systems spans both domestic and international contexts, focusing on two primary dimensions. The first addresses the construction of large-scale integrated energy systems that interconnect diverse energy sources, including wind, solar, hydro, and thermal energy [
12]. The second explores the establishment of integrated energy systems at user terminals designed to meet various electricity, heating, and cooling demands, thereby achieving comprehensive energy utilization and interconnection [
13]. Regarding large-scale integrated energy system construction on the supply side, Wang et al. [
14] provided a comprehensive analysis of steady-state challenges, including energy flow, planning, and optimization within energy internet systems. Their research introduced an innovative approach based on multi-energy complementarity and energy hub concepts. Stephen et al. [
15] investigated the interconnection between electricity and natural gas networks, specifically examining how different power-to-gas conversion processes impact the operation of electricity and gas transmission infrastructure. Martinez-Mares [
16] advanced the field by developing a robust optimization model for integrated energy systems that incorporate operational constraints from natural gas, coal, and electricity networks while accounting for wind power uncertainties. On the user terminal side, Tekena Craig Fubara’s [
17] influential study of UK energy supply systems demonstrated that implementing micro-cogeneration systems could enhance natural gas energy supply efficiency by 3% to 10%. Men et al. [
18] developed a sophisticated multi-energy complementary system for user terminals alongside an energy storage optimization model to maximize efficiency. Zhou et al. [
19] contributed to the industrial application domain by proposing an optimization design methodology specifically tailored for integrated energy systems in industrial parks.
Eastern China is constructing a southern energy corridor to establish sustainable integrated energy systems. This initiative creates a low-carbon energy innovation system in the Yangtze River Delta region with high clean energy self-sufficiency. The project supports China’s national goal of building a robust energy center in central and eastern regions while facilitating the regional energy structure transition [
20]. Regional integrated energy companies are promoting centralized energy stations in development zones, focusing on zero-carbon and low-carbon solutions. These stations use environmentally friendly technologies, green building standards, and digital systems for enhanced efficiency. The goal is to achieve zero-carbon solutions, improve energy utilization efficiency, and support integrated energy services [
21]. Internationally, various approaches to regional energy systems have been developed based on local conditions. In the United Kingdom, wind power has become a major component of renewable energy generation, reflecting the country’s abundant wind resources and commitment to reducing carbon emissions [
22]. In China, regional approaches to energy systems vary significantly by climate zone. In cold regions, the three most common heating methods include combined heat and power (CHP), boiler heating, and innovative ground-source heat pump systems [
23]. In regions with hot summers and cold winters, areas with cooling and heating demands typically employ chilled water units combined with thermal energy storage; locations with low gas prices or subsidies often utilize combined cooling, heating, and power (CCHP) systems, while areas with high gas prices generally prefer heat pump systems for heating needs. Krause T clarified the concept of integrated energy systems, defining them as energy systems that achieve deep integration and close interaction among sources, networks, and loads [
24]. Sahin C conducted an in-depth analysis of the interactions between the natural gas and power systems in the United States, covering topics such as the impact of natural gas price fluctuations and pipeline failures on power security, power generation unit optimization considering natural gas pipeline operational constraints, power risk assessment, and the coordinated optimization of gas and power systems [
25]. The German RegModHarz project coordinates wind energy, solar energy, biomass energy, and pumped storage power stations, striving for the optimal cyclic utilization of renewable energy. The American energy management company OPower differs from other comprehensive energy service providers by not directly interacting with users. Instead, it sells cloud computing software to power companies, offering demand-side data to help them analyze consumer behavior and provide energy usage recommendations, thereby enhancing the marketing service level of these power companies. The business model of Japan’s Tokyo Electric Power Company involves segmenting users into large-scale users and residential users, providing targeted services based on their needs. In addition, the company offers solutions, equipment maintenance, energy-saving diagnostics, and operational management for energy conservation services. In regions characterized by hot summers and warm winters, where cooling is the primary year-round demand, mainstream regional energy systems predominantly use chilled water units integrated with ice storage systems [
26]. Resource assessments conducted in Eastern China reveal that electricity is abundant, with a standardized 10 kV electricity pricing structure throughout the region that implements time-of-use rates. Summer peak, standard, and off-peak rates are 0.916, 0.567, and 0.213 CNY/kWh respectively, creating a peak-to-valley price differential of approximately four times. This pricing structure makes thermal energy storage technologies particularly advantageous, as they can both reduce peak demands on the power grid and significantly lower operational and regional energy supply costs [
27]. Natural gas is primarily delivered through pipeline infrastructure with season-dependent pricing—4.02 CNY/Nm
3 during winter months and 3.82 CNY/Nm
3 during non-winter periods—without any discounts for distributed natural gas supply [
28]. From an environmental perspective, the electricity emission factor is 0.42 kg CO
2/kWh [
29], while the natural gas emission factor is 21.84 t CO
2 per 10,000 Nm
3 [
30]. By synthesizing domestic and international best practices with local resource conditions, Eastern China has strategically chosen to implement an electricity-cantered energy system complemented by thermal energy storage technologies, ultimately developing a low-carbon all-electric energy station supply scheme that aligns with both economic considerations and environmental objectives.
The primary objective of this study is to conduct a comprehensive technical and economic analysis and environmental assessment of the operational area of Eastern China’s all-electric energy station. This evaluation aims to demonstrate the sustainability and environmental economic benefits that the energy station provides to the region. Implementing a thorough techno-economic assessment (TEA) of the Eastern China all-electric energy station enables the quantification of both its economic viability and technical performance metrics [
31]. Techno-economic analysis serves multiple critical functions. First, it establishes the economic feasibility and long-term sustainability of the project, providing stakeholders with concrete data on investment returns and operational efficiency. Beyond purely economic considerations, this analytical approach evaluates the broader environmental and social impacts of the energy station, thereby supporting holistic sustainable development goals. This comprehensive evaluation framework is particularly valuable in the context of Eastern China’s ambitious climate targets and energy transition strategy [
32]. As market conditions and regulatory environments continue to evolve rapidly in China’s energy sector, this techno-economic analysis will provide valuable insights that can help operating companies promptly adjust their technical strategies and operational approaches to adapt to changing market demands. This adaptive capability is essential for maintaining the economic viability and environmental performance of innovative energy systems in dynamic urban environments like Eastern China [
33].
There exists a significant gap in the global research landscape regarding all-electric energy stations, with few operational examples worldwide and a notable absence of comprehensive techno-economic analyses in this emerging field. This paper addresses this critical knowledge gap by conducting a pioneering economic and technical analysis of the first fully operational all-electric energy station developed by regional integrated energy providers. The study provides a multidimensional examination of the station’s performance across technical, economic, and environmental domains.
2. Systems and Scenario Definition
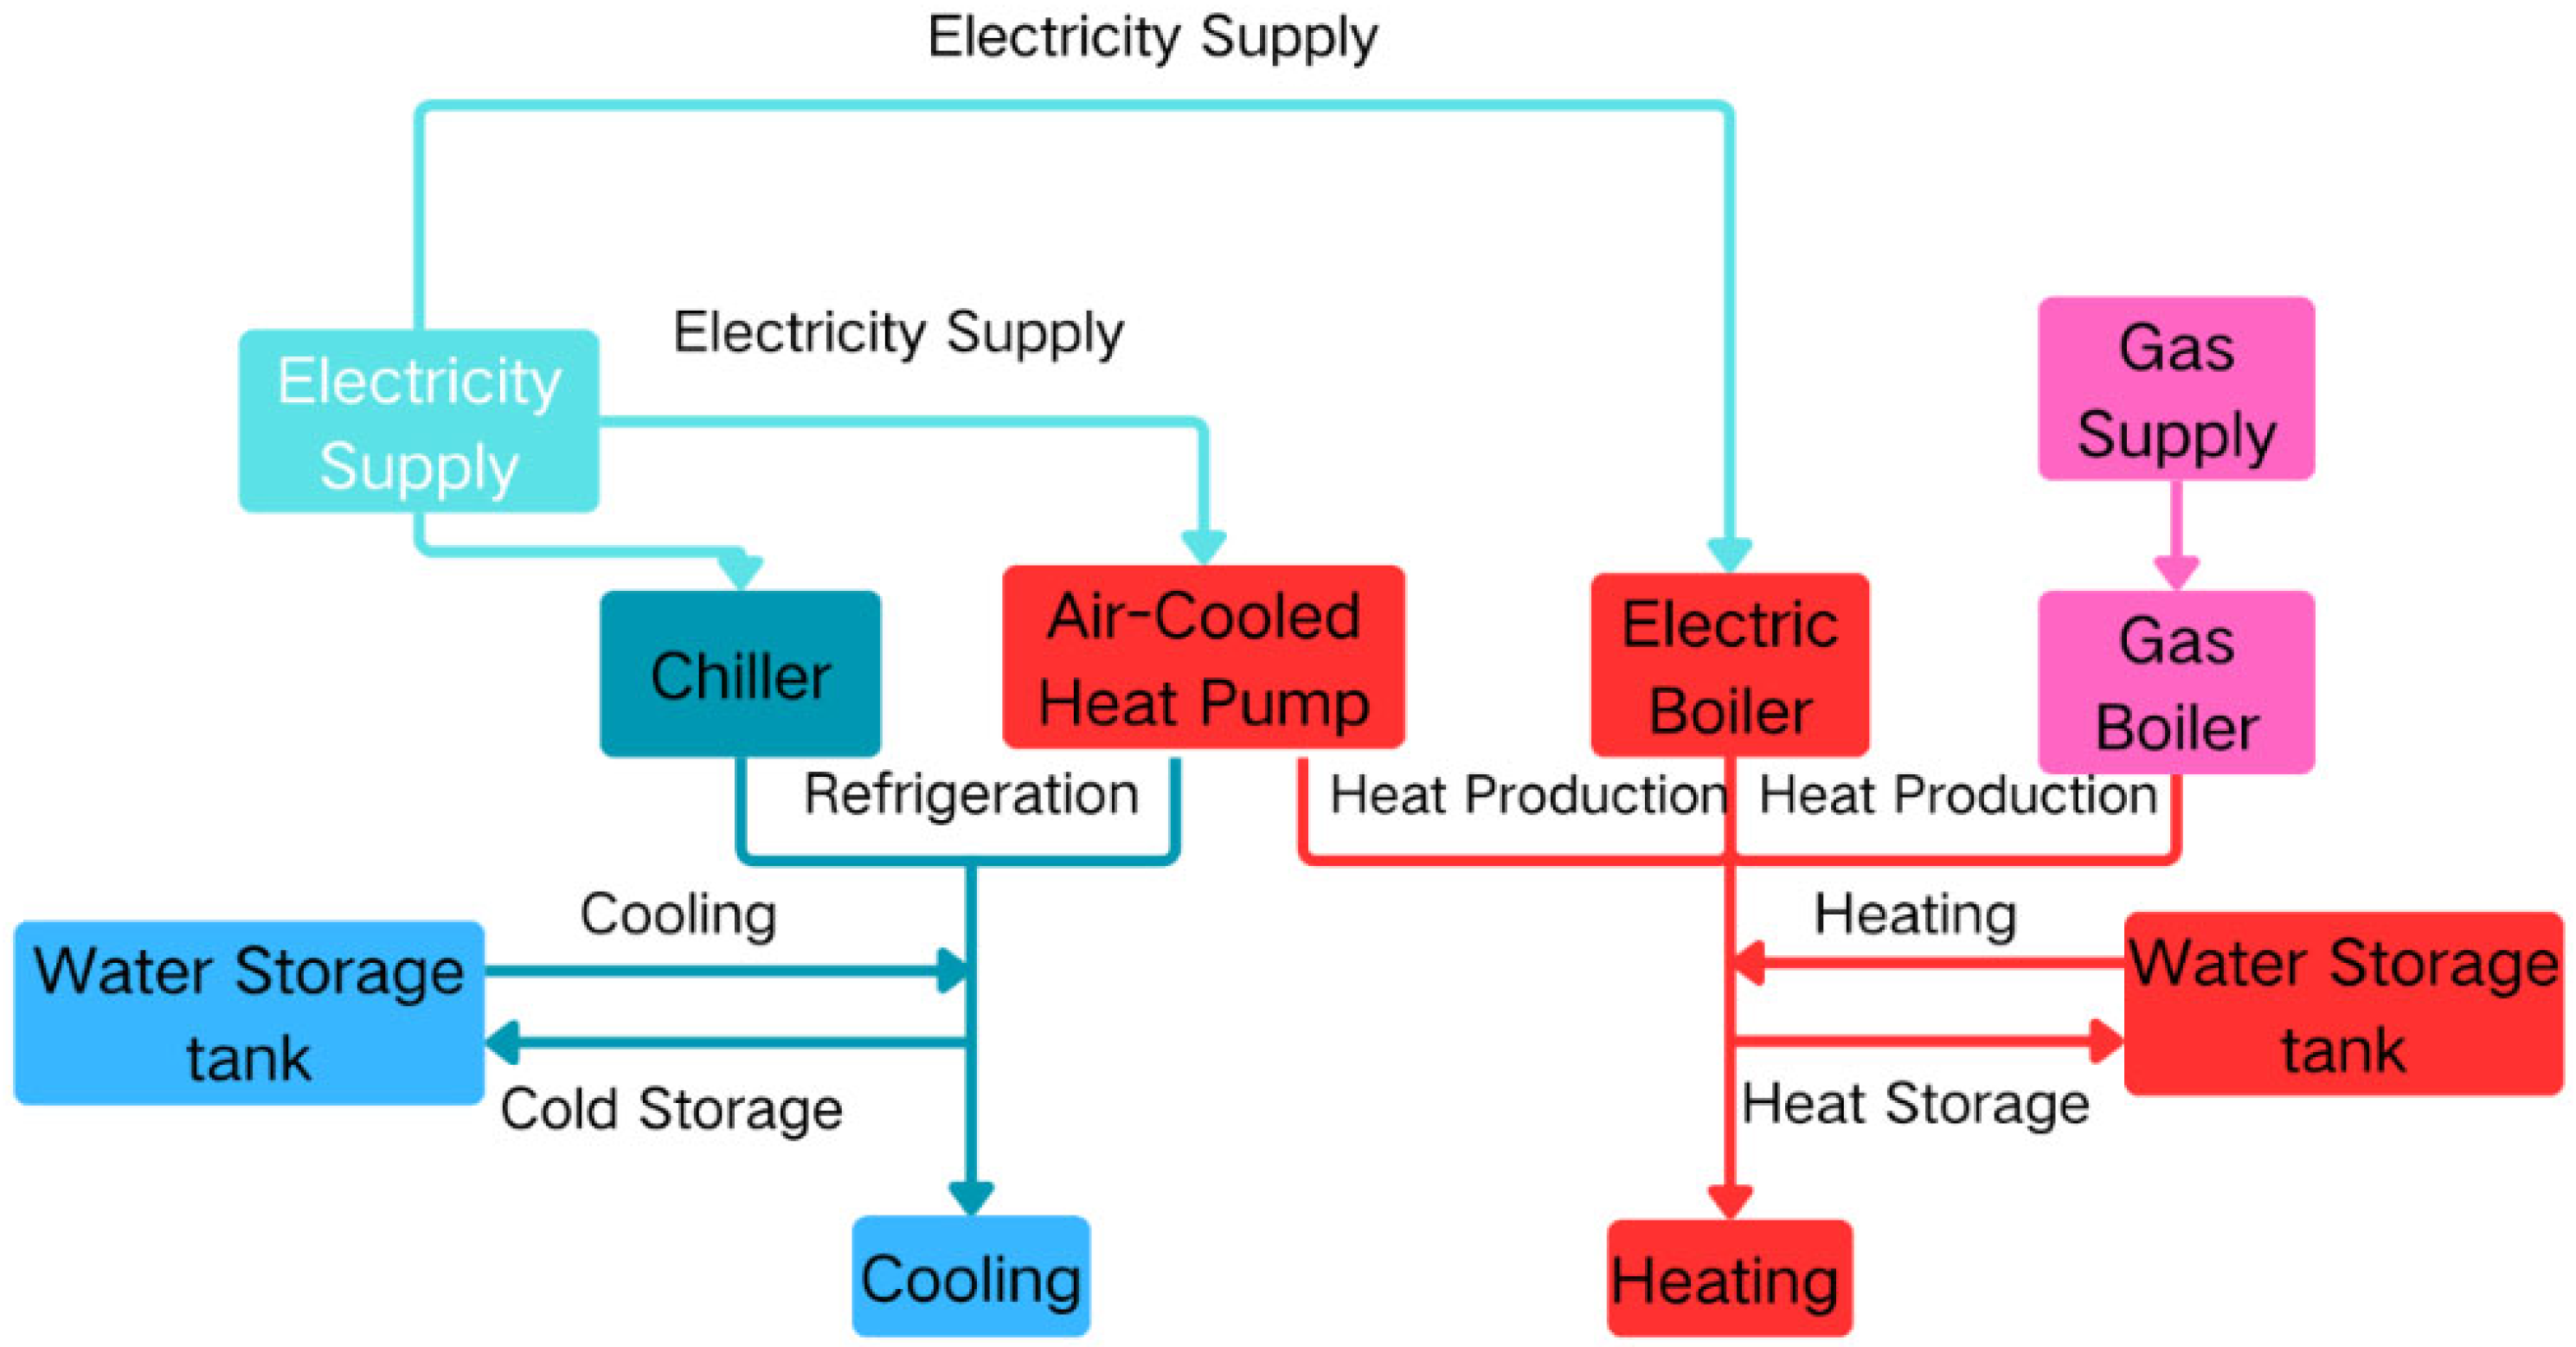
The all-electric energy station integrates chillers, air-source heat pumps, electric boilers, water thermal storage, and gas boilers to deliver comprehensive cooling and heating services. This innovative system achieves green, low-carbon electrification, reducing direct carbon dioxide emissions by approximately ten thousand tons annually per million square meters of energy supply area.
Unlike conventional systems where air conditioning and domestic hot water rely on natural gas and fossil fuel combustion in gas boilers—generating direct carbon emissions—electricity represents indirect emissions with a continuously improving environmental profile. As the national grid increasingly incorporates renewable energy sources such as wind, hydro, and solar power, the carbon intensity of electricity continues to decrease—potentially reaching zero—ultimately achieving minimal or zero carbon emissions [
34]. Consequently, the energy station electrifies heating and domestic hot water components by deploying off-peak electric boilers and heat pumps as replacements for traditional gas boilers.
The all-electric energy station leverages intelligent and efficient technologies, featuring high-performance equipment with heating efficiency exceeding 2.5—significantly surpassing the 0.95 efficiency of conventional gas boilers. The system incorporates advanced high-efficiency chillers, sophisticated air-source heat pumps (maintaining heating efficiencies above 2.5), and compact tri-generation units (achieving primary energy utilization efficiency of 85%). Through digital technology integration, the system enhances heating efficiency by approximately 40%, substantially reducing both operating costs and carbon emissions.
By utilizing cost-effective off-peak electricity for nighttime thermal storage, the station enables strategic release of cooling or heating during peak daytime hours. This approach reduces required installed capacity for power systems, chillers, and air-source heat pumps while facilitating flexible adjustments to variable cooling and heating loads—significantly enhancing the energy station’s supply security and reliability. From a grid perspective, this methodology reduces capacity costs, increases load factors for generating units, decreases coal consumption for power generation, and improves overall operational efficiency—making meaningful contributions to broader societal carbon neutrality objectives.
Figure 1 provides a comprehensive overview of the energy station system model.
The refined system design features a complex air conditioning configuration, incorporating multiple integrated components. Two base load chillers (each with a capacity of 1000 tons) operate with a supply water temperature of 5 °C and a return water temperature of 12 °C, supplemented by three thermal storage chillers (each with a capacity of 2000 tons). In cooling mode, the air conditioning supply water temperature is maintained at 5 °C and the return water temperature at 12 °C, whereas in thermal storage mode, the supply water temperature is 4 °C and the return water temperature is 11 °C. The system also integrates ten advanced air-source heat pumps with dual functionality (cooling capacity of 1303 kW/heating capacity of 1338 kW). These are designed to maintain a supply water temperature of 5 °C and a return water temperature of 12 °C during cooling operations, and a supply water temperature of 42 °C and a return water temperature of 49 °C during heating operations. The cooling water temperature is set at 20 °C. The boundary scope of the system encompasses the complete process from energy input to final energy output. Overall, the system starts from upstream power and gas supply, receiving external electricity and gas as driving energy sources. Subsequently, electricity powers the chiller units for cooling, with part of the generated cooling directly used for cooling purposes and another part stored in the cooling tank for subsequent cooling needs. Simultaneously, electricity also drives the air-source heat pump, which can both cool and heat. The cooling generated during cooling and the heating generated during heating are integrated with the corresponding energy outputs of the chiller units and heating equipment (electric boilers and gas boilers). The heat produced by the heat pump, along with the heat generated by the electric and gas boilers, serves dual purposes: part is used directly for heating, while the remainder is stored in the thermal storage tank for future heating requirements. Throughout the process, the cooling tank and thermal storage tank function as storage and regulation units for cooling and heating, balancing the supply and demand of the system. Ultimately, the system delivers processed and regulated cooling and heating in a stable and continuous manner, providing users with a complete and reliable supply of heating and cooling. The system’s boundary includes all key stages and interconnections from the energy input point to the final heating and cooling output point.
Central to this all-electric power station’s efficiency in Shanghai’s Lingang New Area is a substantial 20,000 m
3 thermal storage tank with a 140,000-kWh storage capacity at a temperature differential of 7 °C. The power station has a design lifetime of 30 years. The system serves commercial buildings across a total coverage area of 732,000 m
2, with spatial optimization placing cooling towers and air-source heat pumps on building rooftops throughout the district. The design incorporates three free-cooling plate heat exchangers that enable significant energy conservation for the commercial building complex; when ambient temperatures are sufficiently low to produce approximately 10 °C cooling water, the system automatically deactivates chillers and activates cooling towers, substantially reducing cooling energy consumption across the entire 732,000 m
2 service area.
Table 1 provides comprehensive operational specifications for each component within the all-electric energy station.
In summer operations, thermal storage chillers function nocturnally to accumulate cooling capacity while delivering daytime cooling services. Base-load chillers manage nighttime foundational demands, while the system strategically prioritizes cooling from the thermal storage tank during daytime hours to minimize chiller operation during peak electricity pricing periods, thereby maximizing cost efficiencies from thermal storage. To address peak cooling requirements, the system implements a comprehensive strategy integrating thermal storage chillers, base-load chillers, air-source heat pumps, and thermal storage tanks for optimized cooling demand management.
Winter operations follow a complementary approach: base-load air-source heat pumps manage nighttime foundational demands, while supplementary air-source heat pumps accumulate thermal energy overnight and provide heating during daytime hours. Electric boilers serve exclusively for nighttime thermal storage purposes. The system prioritizes daytime heating from the thermal storage reservoir to minimize operational units during peak pricing periods, further maximizing thermal storage economic benefits. During peak heating demands, the system deploys an integrated strategy combining air-source heat pumps, electric boilers, and thermal storage tanks for comprehensive load management.
Table 2 presents detailed operational performance data for the all-electric energy station across representative days during summer, transitional seasons, and winter periods.
3. Methodology
The Technical Economic Assessment (TEA) serves as a comprehensive methodology for quantifying both economic and technical performance metrics of systems, including processes, products, or services. The TEA process initiates with the identification and mapping of sequential steps, processes, or activities essential for system realization [
35]. This sophisticated modelling approach encompasses estimating material and energy flows across each process component, determining associated capital and operational expenditures, and conducting thorough revenue assessments.
While the systematic enumeration of steps required for system creation provides valuable insights into technical performance from a design perspective, the analysis of costs and revenues simultaneously enables rigorous evaluation of economic performance. Economic assessments typically incorporate time value of money calculations and generate critical performance indicators such as payback period and return on investment metrics. To enhance decision-making capabilities, the assessment framework often includes sensitivity and uncertainty analyses that account for potential variations in prices, revenues, and other influential factors.
Figure 2 presents the comprehensive TEA framework implemented in this study (adapted from reference [
30]).
Economic benefits are influenced by a multifaceted array of price factors, including annualized capital costs, total annual capital expenditures (CAPEX), and a spectrum of direct, indirect, and general costs—collectively comprising operating expenses (OPEX). Within a fully electric energy station, the cost structure encompasses equipment acquisition, fixed asset investments, equipment maintenance regimens, electricity consumption, carbon tax obligations, and various additional expenditures.
The total capital investment cost (
TCC) is calculated through the following comprehensive formula:
where:
TDC is the total direct cost, CNY;
TIC is the total indirect cost, CNY;
CF is the contractor’s fee, CNY;
OMC is the operational maintenance cost, CNY;
PC is the purchase cost of equipment, CNY; and
AF is the auxiliary facilities, CNY.
In the Eastern China region, the electricity pricing structure follows a tiered model: 0.9958 CNY/kWh during peak demand periods, 0.6509 CNY/kWh during standard demand periods, and 0.3634 CNY/kWh during off-peak periods. The economic evaluation methodology further incorporates environmental impacts by translating them into quantifiable external costs. This approach enables the conversion of estimated environmental impacts derived from electricity emission factors into monetary values, facilitating the internalization of social, ethical, and political costs associated with the bioenergy system within the comprehensive economic analysis framework. The
TCC amounts to 240 million CNY, representing the actual total investment from the energy station. The proportions of expenses such as
TDC,
TIC, Contractor’s fee, O&M, and start-up costs are assumed based on a comparison of costs during the actual establishment of the station and costs of similar types of stations. The indirect emissions factor for electricity purchased from external sources in Eastern China is established at 0.42 kg CO
2/kWh [
36], with an applied carbon tax rate of 0.3 CNY/kg, enabling precise monetization of environmental impacts.
Table 3 presents additional cost components relevant to the analysis.
Net Present Value (
NPV) and Internal Rate of Return (IRR) serve as sophisticated financial metrics that transcend mere profitability assessment to provide precise quantification of potential profit generation [
37]. In this paper’s analysis of the all-electric energy station, these complementary metrics form the foundation for a comprehensive economic feasibility evaluation. The analytical framework applies established
NPV and IRR methodologies, with calculations systematically executed according to Formula (4).
where
Ct represents the cash flow at time
t (with
t = 0 typically denoting the initial investment as a negative value, and
t > 0 signifying the net cash inflows for subsequent periods as positive values), CNY;
γ indicates the discount rate (8%), representing the cost of capital or minimum required rate of return; n refers to the operational duration of the fully electric energy station or the number of discrete time points at which cash flows occur;
t designates the specific temporal point at which each cash flow materializes; and
C0 represents the initial capital investment, CNY. The Internal Rate of Return (IRR) value was calculated as the precise discount rate at which the Net Present Value (
NPV) of the entire system reaches zero.
The payback period stands as a critical financial indicator that quantifies the velocity of investment recovery within a project framework. It further functions as an essential metric for evaluating a project’s financial profitability, solvency capacity, and overall economic efficiency [
38]. For computational simplicity and clarity, this analysis employs the static payback period methodology. The mathematical representation for calculating the payback period is expressed as:
where
N is the payback period for an investment, year;
C0 represents the initial investment cost, CNY, and
is the annual net cash flow, CNY.
4. Results and Discussion
4.1. Energy Balance
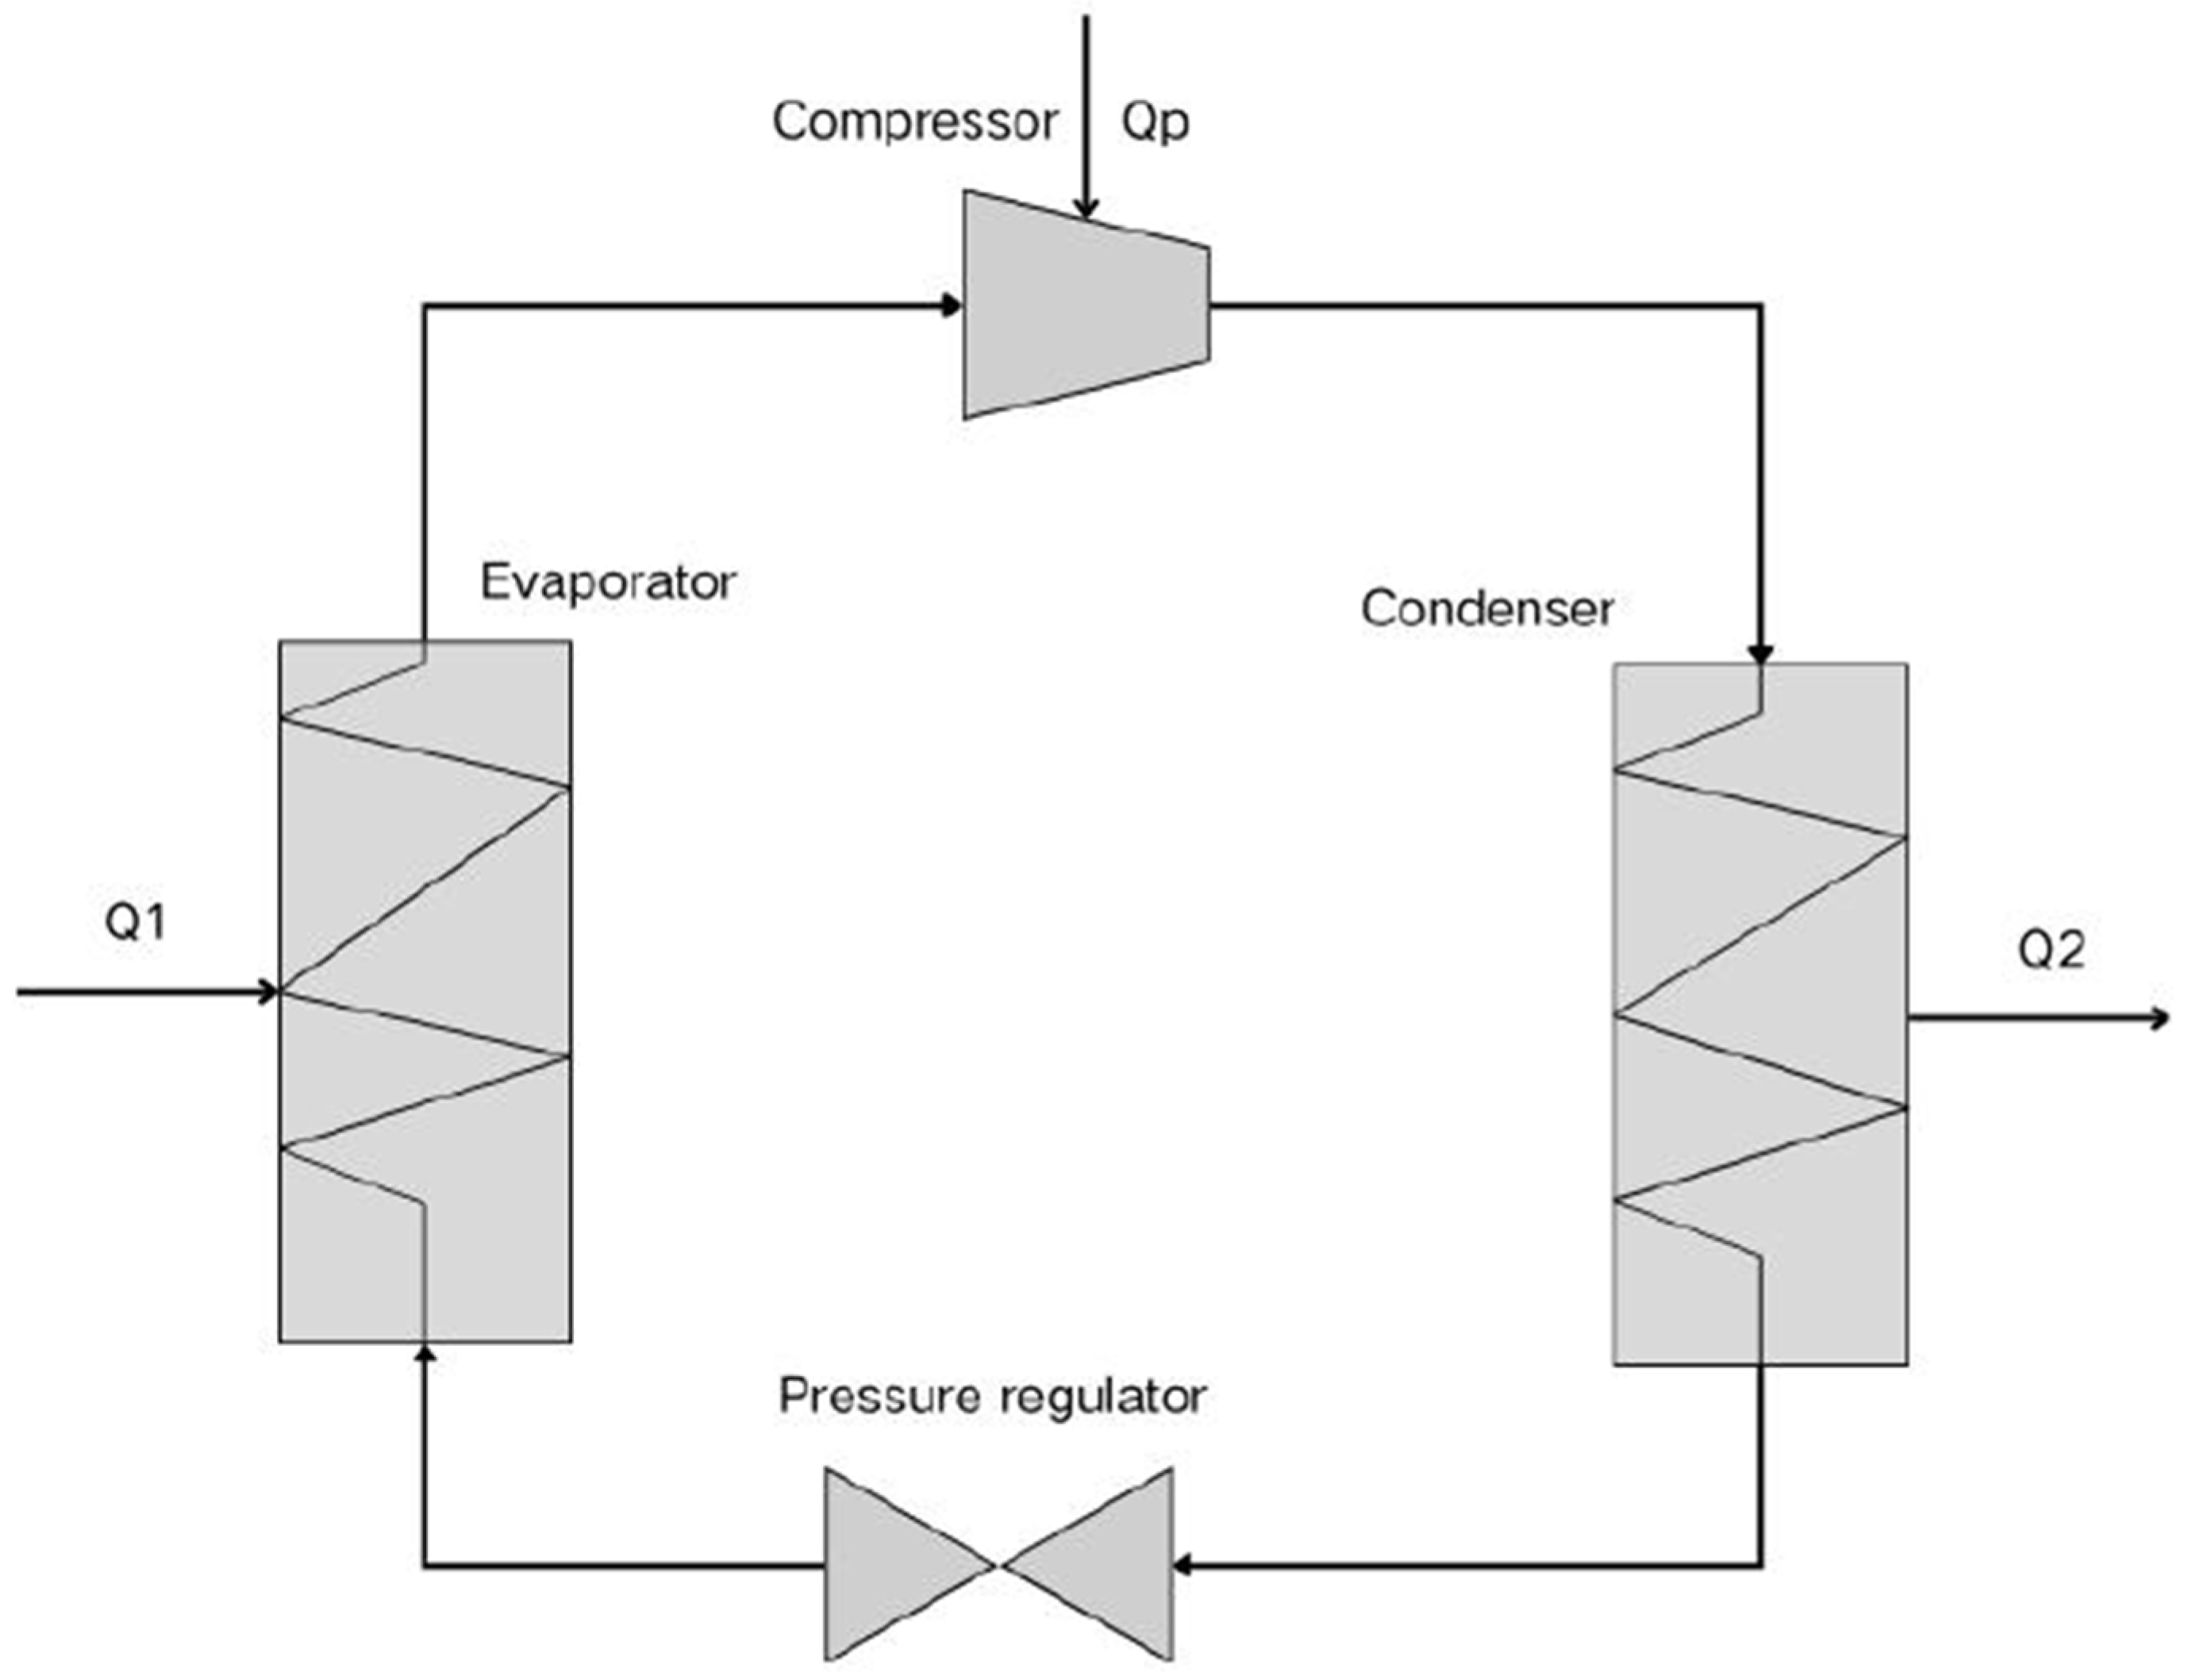
The energy cycle of the Eastern China all-electric energy station is illustrated in
Figure 3. The energy balance can be described by the following equations:
where:
Q1: Cooling/heating capacity, kWh
Qp: Input power, kWh
Q2: Dissipation of heat, kWh
Here,
Q1 refers to the cooling/heating capacity, kWh;
C/
H represents the operational cooling/heating capacity, kW; and
t is the working time, hour.
In this equation,
Qp represents the power consumption, kWh;
P is the power, kW; and
t is the working time, hour.
The Coefficient of Performance (
COP) for cooling/heating reflects the efficiency of the cooling/heating process.
Q1 represents the cooling/heating capacity, kWh; and
Qp is the input electrical power, kWh.
Here, C/H is the operational cooling/heating capacity, kW; and t represents the working time, hour.
The energy balance data for the all-electric energy station across different seasons is summarized in
Table 4.
The all-electric energy station consumes 100,518 kWh of electricity daily during the summer, with a cooling capacity of 454,807 kWh, resulting in a COP of 4.52. During the transition seasons, it consumes the same amount of electricity (100,518 kWh) but provides a cooling capacity of 454,807 kWh, yielding a COP of 4.52. In winter, the daily electricity consumption increases to 155,036 kWh, with a heating capacity of 374,940 kWh and a COP of 2.42.
In contrast, the electric-gas energy system still uses electricity for cooling during the summer and transition seasons but relies on gas for heating in winter. It burns 39,845 Nm3 of gas daily, generating 374,941 kWh of heat, of which only 319,678 kWh is used for heating, resulting in an efficiency of 85.26%. The energy utilization rate of the electric-gas system is significantly lower than that of the all-electric energy station.
Given the annual distribution of 259 days for summer and transition seasons and 106 days for winter, combined with the electricity and natural gas emission factor differences presented in
Table 3, calculations indicate that the all-electric energy station offers significant environmental benefits, achieving an 11.5% reduction in annual carbon emissions compared to the electricity-gas hybrid system.
4.2. Capital Investment and Income
The annual financial outflows for the all-electric energy station primarily consist of electricity costs, operation and maintenance (O&M) costs, and carbon taxes. These can be calculated using the following formulas:
The electricity costs are determined by:
where:
PC: Power consumption, kWh
EP: Electricity price, CNY/kWh
t: Time period, hour
The total carbon tax is calculated as:
For the all-electric energy station, the annual financial outflows mainly include electricity costs and carbon taxes. In contrast, the integrated electricity-gas energy station incurs additional gas expenses alongside electricity costs and carbon taxes. Under the condition of equal cooling and heating output, the annual financial outflows, inflows, net cash flow, and carbon tax for both the all-electric energy station and the integrated electricity-gas energy station are recorded, as shown in
Table 5.
The data in
Table 5 highlight that the all-electric energy station has lower annual financial outflows compared to the electricity-gas energy system, particularly during the winter season. This is primarily due to the absence of gas expenses in the all-electric system, which relies solely on electricity for heating. Additionally, the all-electric system benefits from lower carbon taxes, further enhancing its financial viability. By leveraging the differences in peak and off-peak electricity prices and utilizing energy storage technologies, the all-electric energy station effectively reduces operational costs, especially during peak electricity demand periods. This results in significant cost savings and improved financial performance compared to the traditional electricity-gas energy system.
4.3. Income
The income generated by the all-electric energy station is derived from cooling and heating services provided to users. The revenue calculations are based on the following formulas:
The revenue generated by the all-electric energy station is compared with that of the electricity-gas energy system in
Table 6. Both systems provide the same cooling and heating capacities, resulting in identical revenue streams. However, the net cash flow differs due to variations in operational costs and carbon taxes.
The data in
Table 6 show that while both energy systems generate the same revenue from cooling and heating services, the all-electric energy station achieves a higher net cash flow. This is primarily due to its lower operational costs and reduced carbon taxes, as discussed in the previous section.
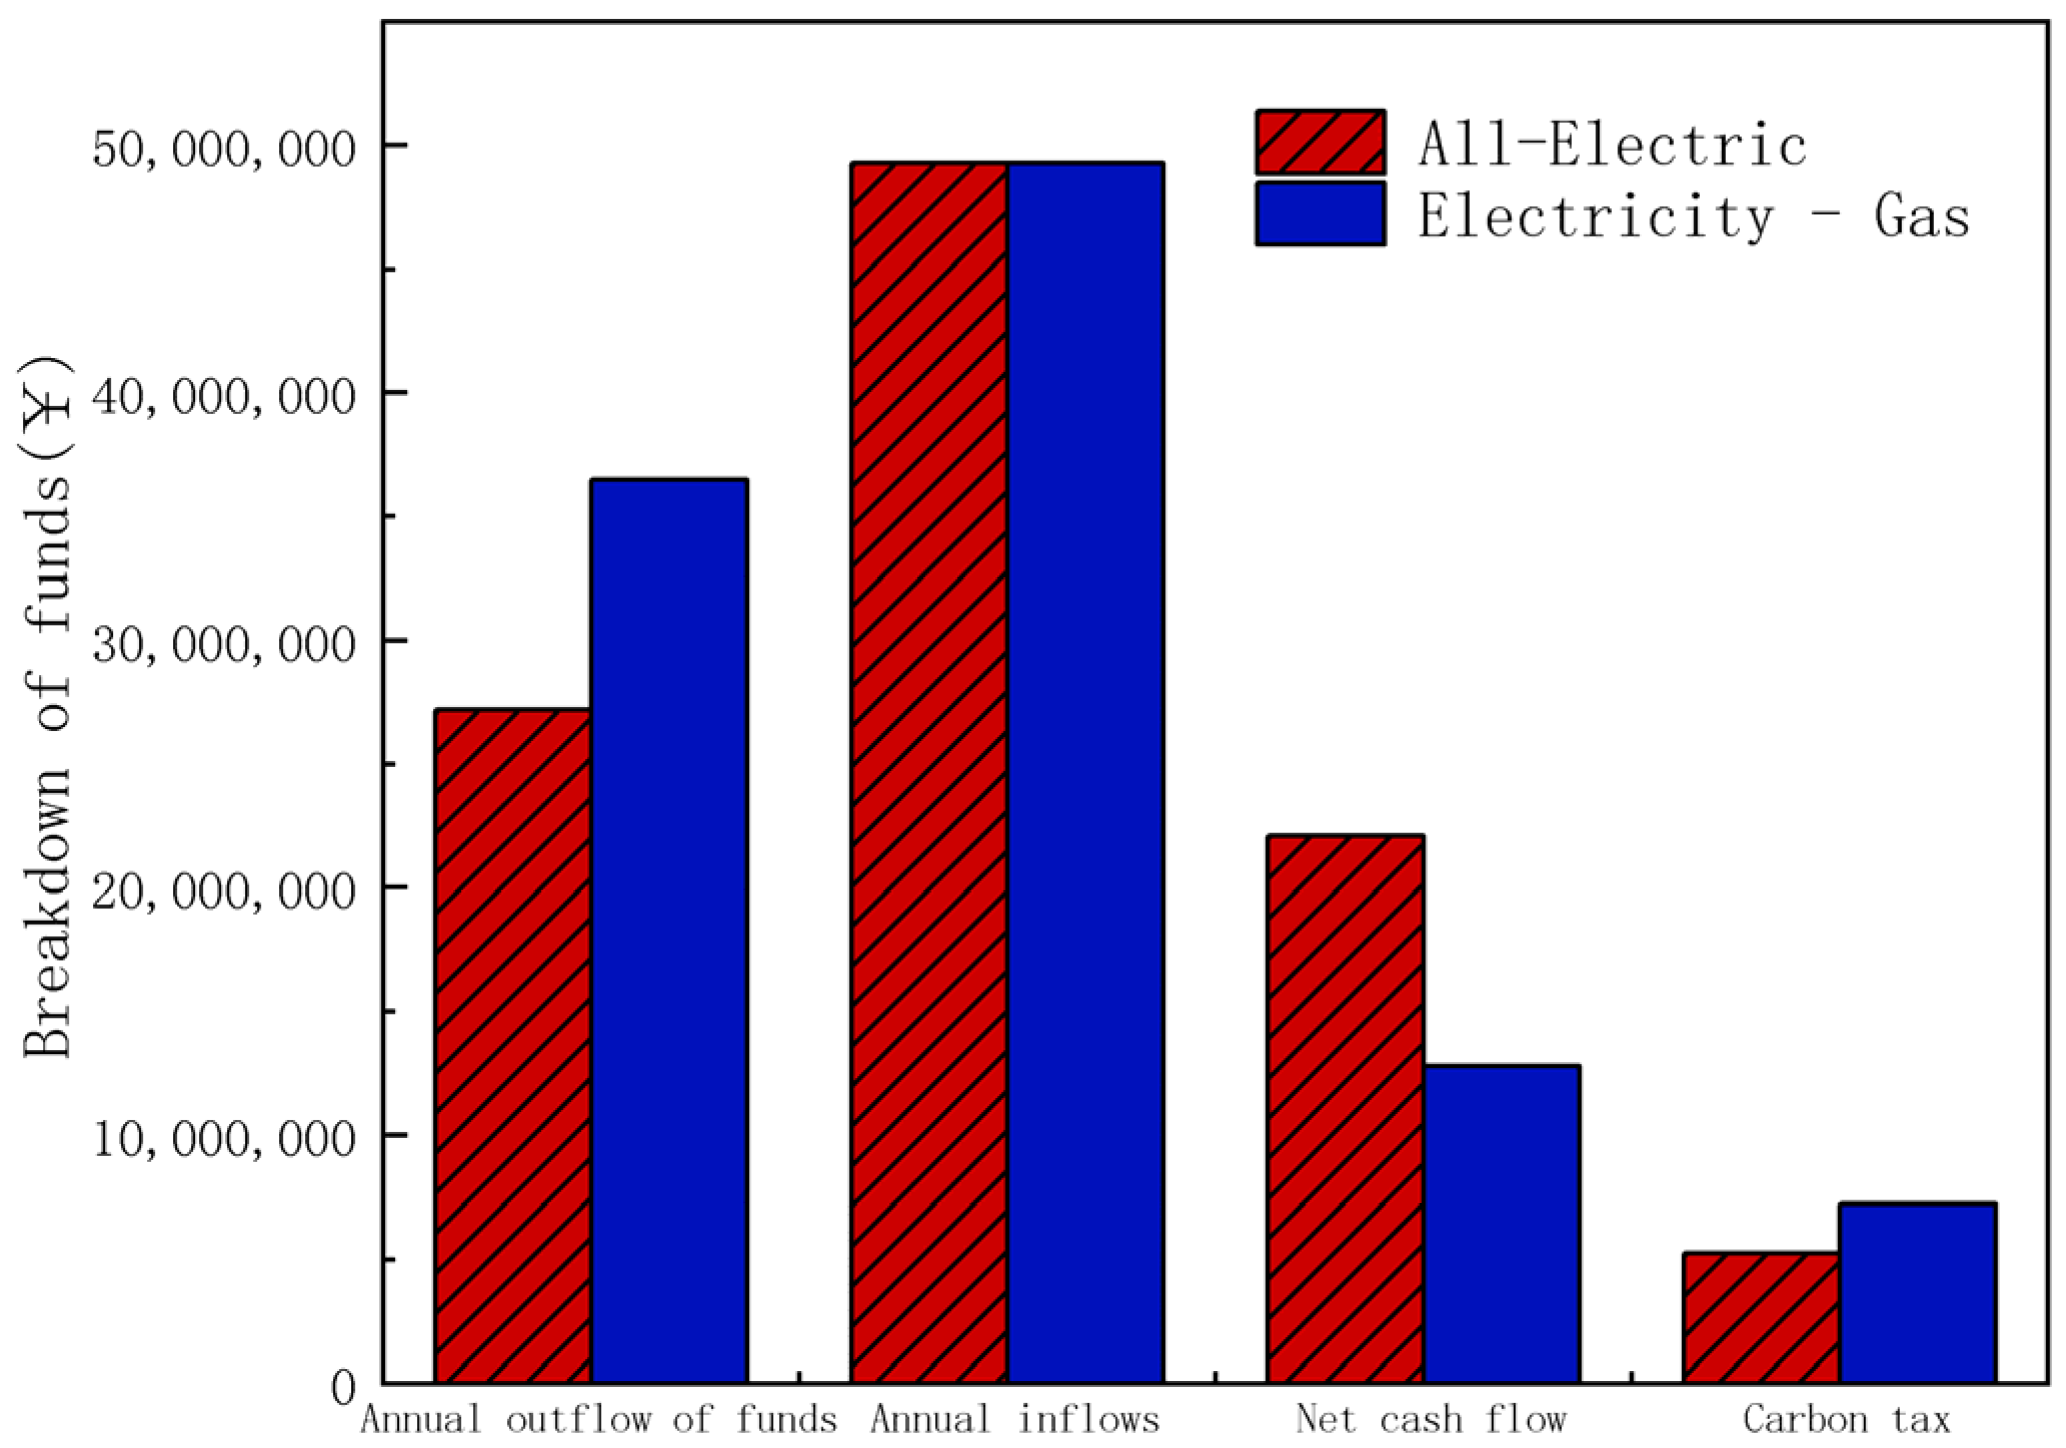
To provide a clearer comparison,
Figure 4 illustrates the financial inflows and outflows for both the all-electric and electricity-gas energy systems. As shown in the figure, the all-electric energy station has lower financial outflows, resulting in a significantly higher net cash flow compared to the electricity-gas system.
The higher net cash flow of the all-electric energy station underscores its economic advantages. By minimizing operational costs and leveraging energy storage technologies, the all-electric system not only enhances its financial performance but also contributes to environmental sustainability by reducing carbon emissions. This dual benefit makes the all-electric energy station a more viable and attractive option for future energy systems.
4.4. Economic Analysis
The economic performance of the all-electric energy station is evaluated using key financial indicators such as the payback period, net present value (NPV), and internal rate of return (IRR). These metrics provide a comprehensive assessment of the project’s profitability and financial feasibility. The results are compared with those of the traditional electricity-gas energy system to highlight the economic advantages of the all-electric approach.
The data in
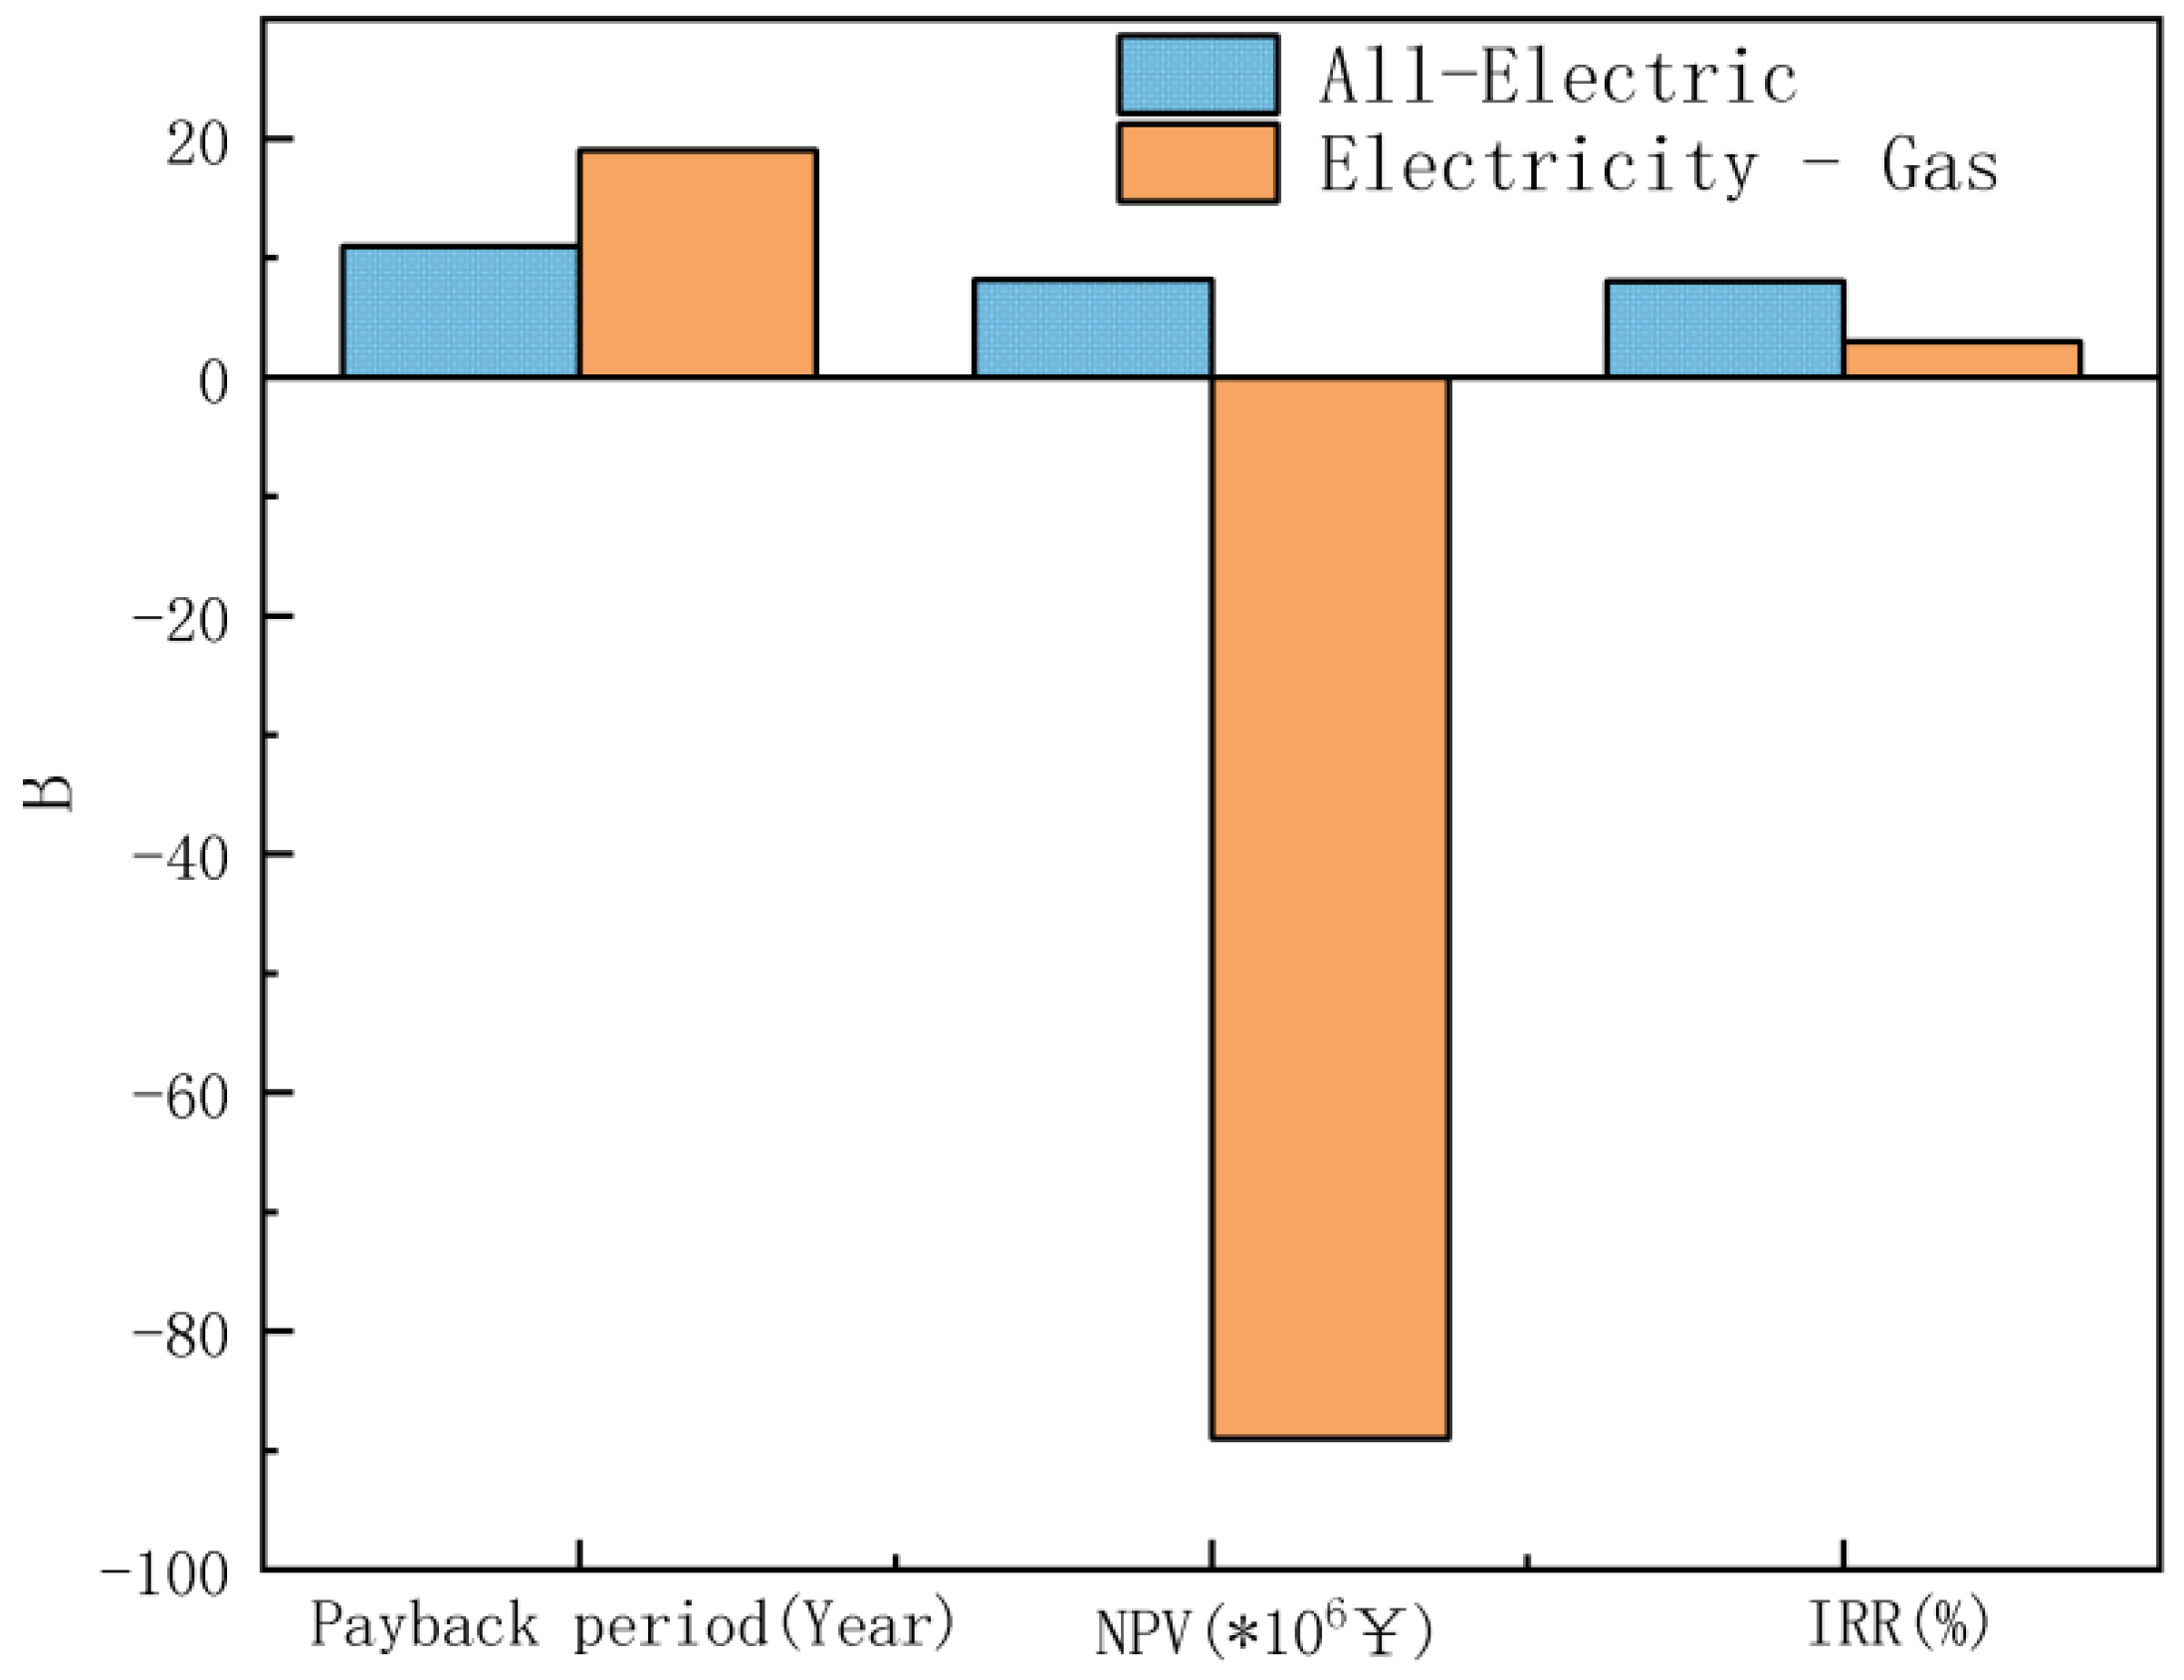
Table 7 reveal that the all-electric energy station outperforms the electricity-gas system across all economic indicators. The payback period for the all-electric energy station is 11 years, significantly shorter than the 19 years required for the electricity-gas system. This indicates that the all-electric system recovers its initial investment much faster, enhancing its financial attractiveness. Moreover, the all-electric energy station has a positive
NPV of 8.69 million CNY, suggesting that the project is expected to generate returns that exceed its capital costs. In contrast, the electricity-gas system has a negative
NPV of −96.12 million CNY, indicating that it is not financially viable under the given conditions. The IRR for the all-electric energy station is 8%, which is substantially higher than the 3% IRR for the electricity-gas system. A higher IRR reflects a greater return on investment, further underscoring the economic feasibility of the all-electric approach.
Figure 5 provides a visual comparison of the economic outcomes between the all-electric and electricity-gas energy systems. The shorter payback period, positive
NPV, and higher IRR of the all-electric energy station clearly demonstrate its superior economic performance.
In summary, the all-electric energy station not only offers significant environmental benefits but also delivers strong economic advantages. Its shorter payback period, positive NPV, and higher IRR make it a more financially viable and sustainable option compared to the traditional electricity-gas energy system. These findings highlight the potential of all-electric energy stations to play a crucial role in the transition towards more sustainable and economically efficient energy systems.
4.5. Sensitive Analysis
The sensitivity analysis yields significant insights into the financial dynamics of both energy station options, revealing crucial factors that drive their economic viability.
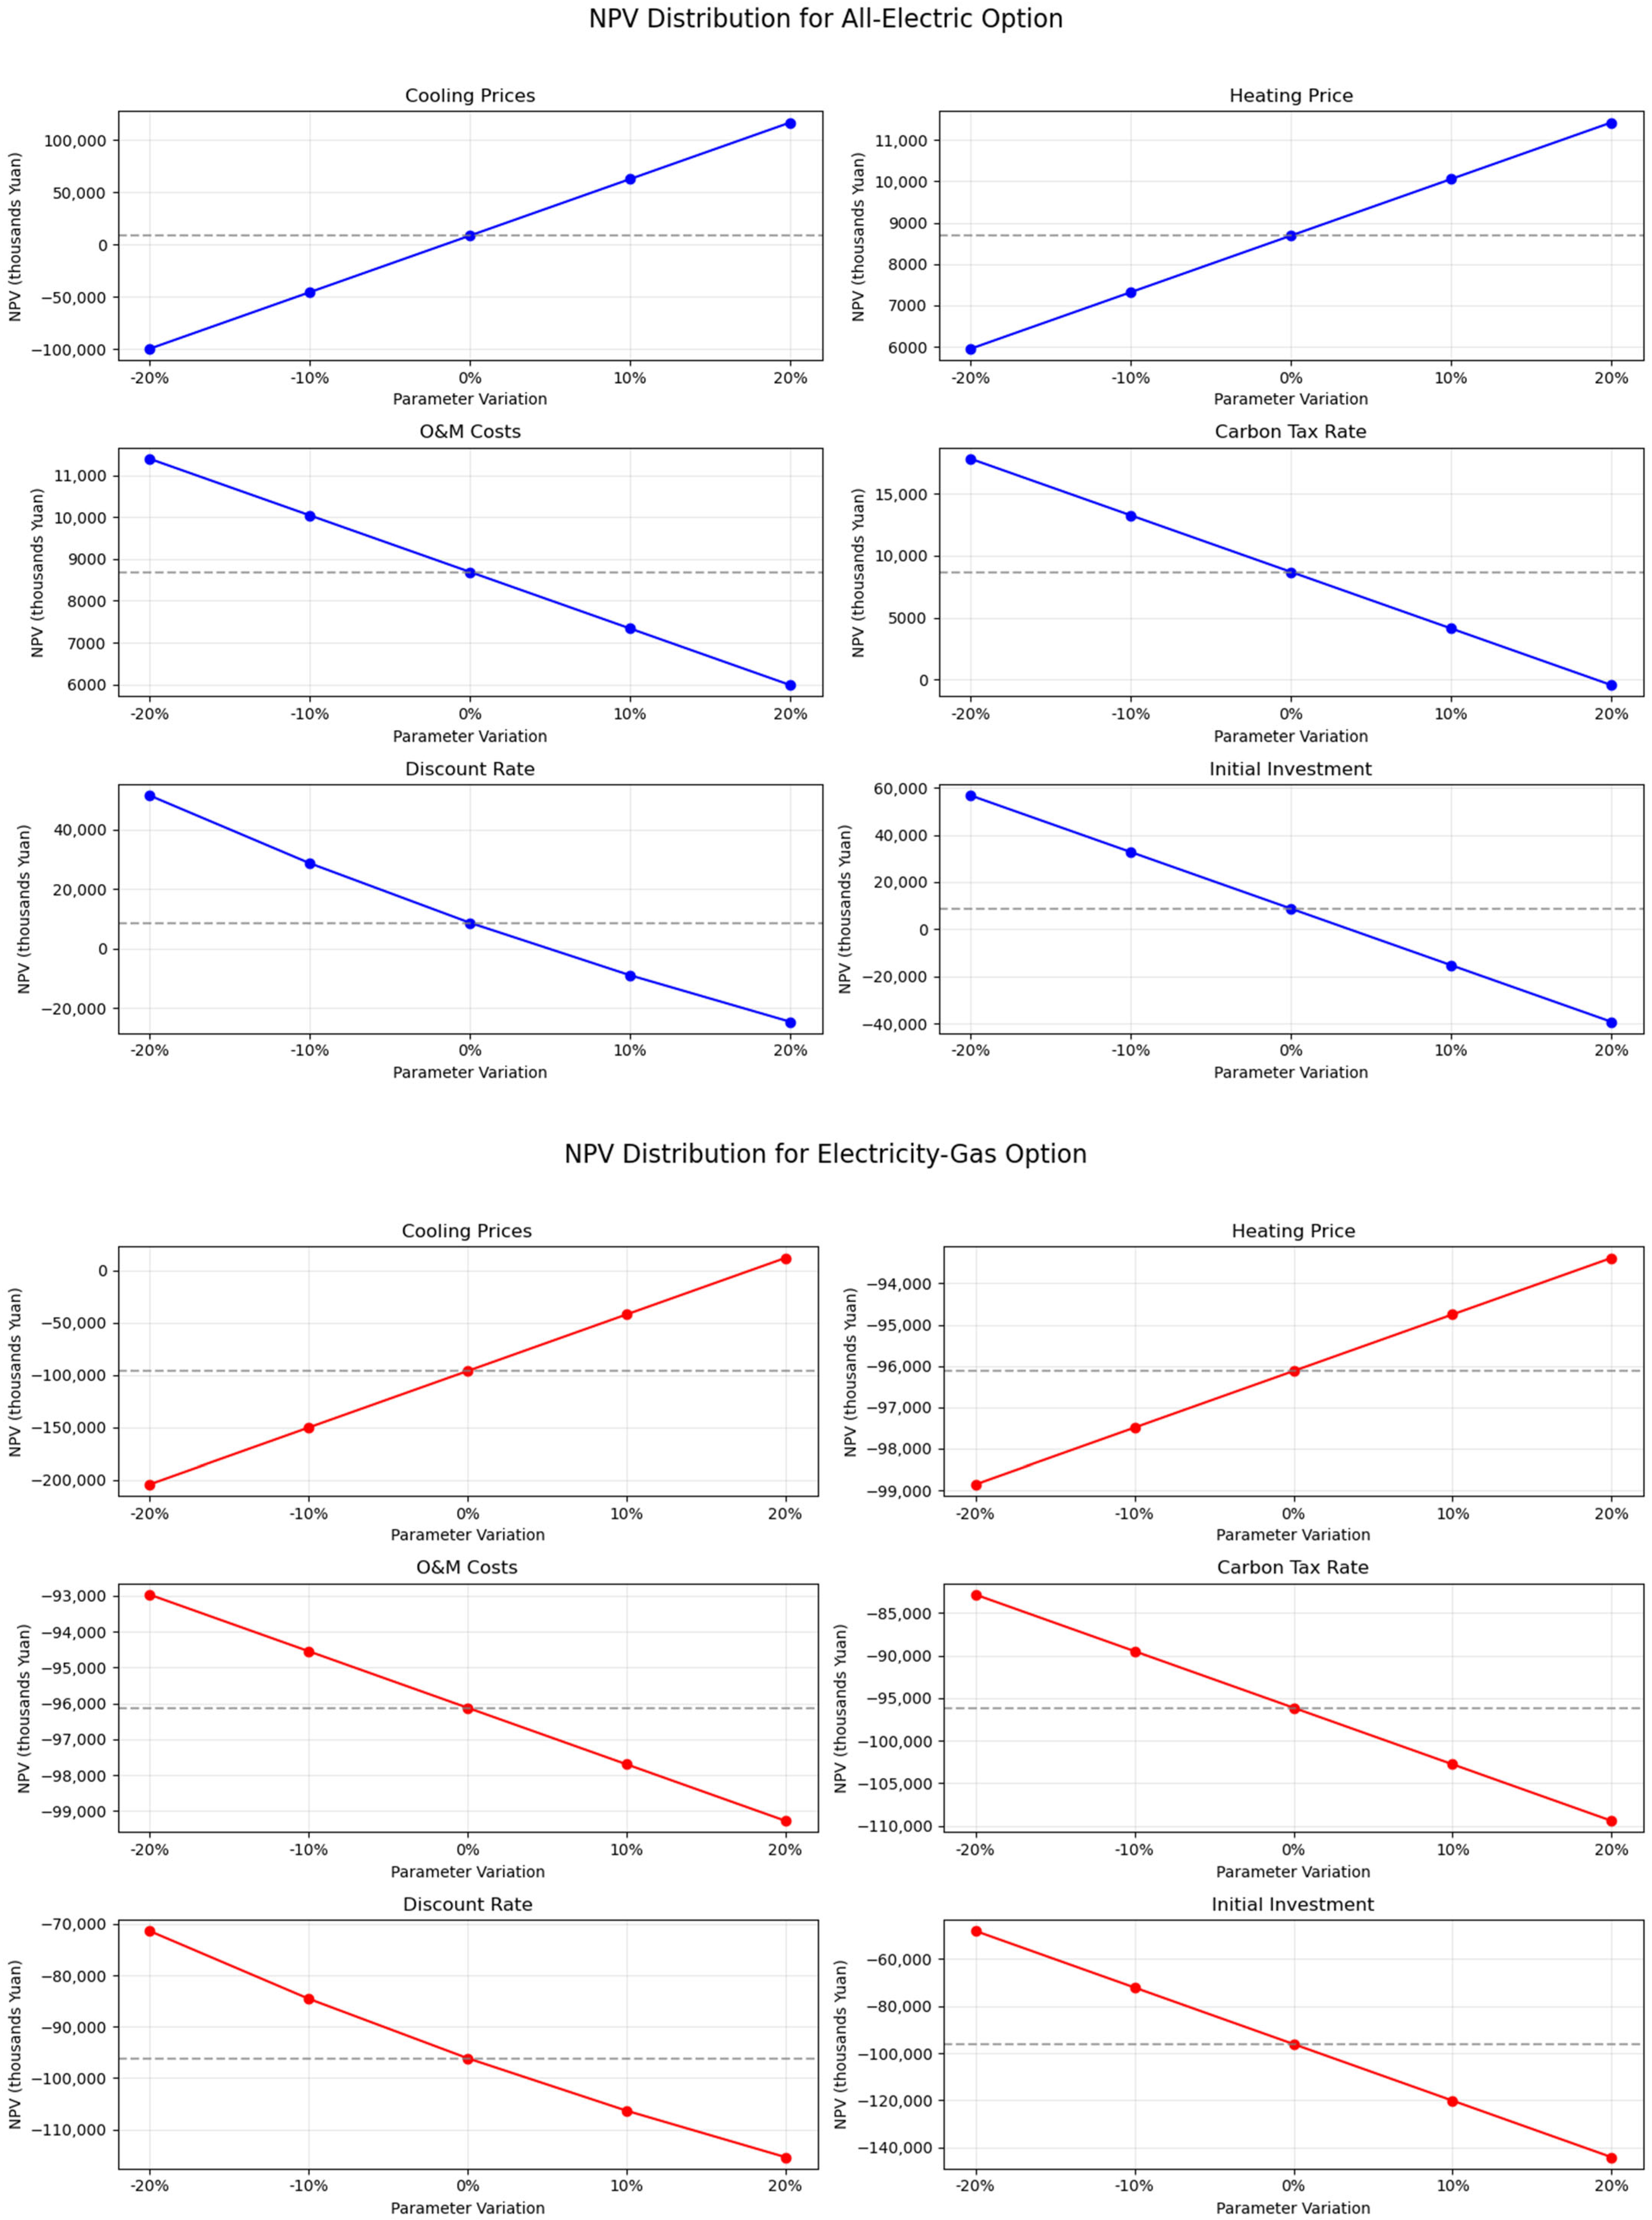
Figure 6 and
Figure 7 illustrated the sensitivity coefficients and
NPV distribution for the All-Electric option and Electricity-Gas cases. The results demonstrate that the discount rate and initial investment have the strongest negative impact on
NPV for both configurations, indicating that securing favourable financing terms and optimizing capital expenditure should be prioritized. Cooling prices show the most substantial positive influence, particularly for the All-Electric option, suggesting that revenue optimization through cooling services offers significant upside potential. It should be noted that the All-Electric configuration exhibits greater sensitivity to parameter variations overall, with its
NPV responding more dramatically to changes in cooling prices and discount rate than the Electricity-Gas alternative. This higher sensitivity represents both increased opportunity and risk.
The significance of this sensitivity analysis extends beyond merely identifying influential parameters; it provides strategic decision-making guidance unique to each case. For the All-Electric option, the analysis highlights its superior financial potential under favourable conditions, but also its greater vulnerability to parameter fluctuations. This suggests that while the All-Electric configuration may offer better returns, it requires more rigorous risk management strategies and contingency planning. Conversely, the Electricity-Gas option demonstrates more modest responses to parameter changes, indicating greater stability and predictability in financial outcomes, but with possibly lower maximum returns.
These findings emphasize that project success hinges primarily on three factors: maximizing cooling revenue, minimizing initial investment, and securing the lowest possible discount rate. The analysis enables stakeholders to quantify risk exposure and develop targeted mitigation strategies for each configuration. For instance, the All-Electric option might benefit from revenue guarantee contracts for cooling services, while the Electricity-Gas alternative might focus on negotiating better equipment financing terms. Furthermore, this comparative sensitivity understanding allows decision-makers to align their choice with their risk tolerance and strategic objectives—whether they prioritize higher potential returns with greater variability (All-Electric) or more consistent, predictable performance (Electricity-Gas). The differential sensitivity to parameter changes revealed in this analysis offers a substantive basis for strategic investment choices in energy infrastructure development
5. Conclusions
This study conducted a comprehensive techno-economic analysis of the Eastern China all-electric energy station, evaluating its feasibility and sustainability compared to the traditional electricity-gas energy system. The results demonstrate significant advantages for the all-electric system across economic, environmental, and energy efficiency metrics. The all-electric energy station exhibits superior economic performance with a shorter payback period of 11 years compared to 19 years for the electricity-gas system. It achieves a positive net present value (NPV) of 8.69 million CNY, indicating financial viability and expected returns exceeding capital costs. In contrast, the electricity-gas system has a negative NPV, making it economically unfeasible. The all-electric system also boasts a higher internal rate of return (IRR) of 8% compared to 3% for the electricity-gas system. By leveraging peak and off-peak electricity price differences and utilizing energy storage technologies, the all-electric station significantly reduces operational costs, particularly during peak demand periods. Sensitivity analysis reveals that the discount rate and initial investment are critical determinants of NPV, while cooling prices offer significant revenue potential. The all-electric configuration shows heightened sensitivity to these parameters, emphasizing the need for robust financial planning and risk mitigation strategies. At the macro level, the all-electric energy station demonstrates substantial environmental advantages, reducing annual carbon emissions by 11.5% compared to the electricity-gas system—a reduction that, when scaled across multiple installations, could contribute significantly to national carbon reduction targets. As the regional grid increasingly incorporates renewable energy sources, the indirect carbon emissions of the all-electric system are expected to decrease further, creating a multiplier effect that amplifies environmental benefits across the broader energy network. The findings of this study suggest that the all-electric energy station is not only economically feasible but also plays a crucial role in advancing carbon neutrality and promoting green energy development. As technology continues to evolve and policy support strengthens, all-electric energy stations are expected to see broader application, driving the global energy transition and fostering sustainable development. In conclusion, the Eastern China all-electric energy station, through its integration of advanced technologies and economic advantages, demonstrates its feasibility and sustainability in terms of energy efficiency, cost-effectiveness, and environmental protection. It serves as a valuable reference for the future development of regional integrated energy systems and contributes significantly to the global effort to achieve a low-carbon future.


