Article

Evaluation of Personal Ecological Footprints for Climate Change Mitigation and Adaptation: A Case Study in the UK

Faculty of Engineering and Technology, Civil Engineering and Built Environment, Liverpool John Moores University, Liverpool L3 3AF, UK
*
Author to whom correspondence should be addressed.
Sustainability 2025, 17(12), 5415; https://doi.org/10.3390/su17125415
Submission received: 18 February 2025 / Revised: 17 May 2025 / Accepted: 29 May 2025 / Published: 12 June 2025

Abstract

Climate change is one of our most critical challenges, requiring urgent and comprehensive action across all levels of society. Individual actions and their roles in mitigating and adapting to climate change remain underexplored, despite global efforts. Under this context, this study was conducted to evaluate the ecological footprint of individuals for climate change mitigation. A structured online survey was designed and distributed through email lists, social media platforms, and community organisations to over 200 potential participants in the northwest of the UK. Due to the anonymous nature of the survey, only 83 individuals from diverse demographics completed the questionnaire. A carbon footprint calculator using conversion factors has been employed, based on energy consumption, travel, and material goods use. Participants are categorised into four groups based on their annual CO2 emissions, ranging from less than 2 tonnes to over 10 tonnes. Personalised recommendations provided by the calculator focus on practical strategies, including adopting renewable energy, minimising unnecessary consumption, and opting for sustainable transportation. Results showed that only 5.5% of participants who employed advanced technologies and smart home technologies, 1.8% were implementing water-saving practices and 65.4% preferred to use their own car over other modes of transportation. In addition, the study found that 67.3% of participants had no or only a very limited knowledge of renewable energy technologies, indicating a need for education and awareness campaigns. The findings also highlight the importance of addressing demographic differences in ecological footprints, as these variations can provide insights into tailored policy interventions. Overall, despite the study’s limited sample size, this research contributes to the growing body of evidence on the importance of individual action in combating climate change and provides actionable insights for policymakers and educators aiming to foster a more sustainable lifestyle. Future studies with larger samples are recommended to validate and expand upon these findings.

1. Introduction

There is no doubt that climate change poses one of the most significant challenges of our time, having far-reaching effects on ecosystems, economies, and human societies. From international agreements to individual actions, mitigation and adaptation to climate change require a concerted effort at many levels.
In order to understand and address the multifaceted challenge of climate change mitigation, ecological footprint analysis is essential. A method for quantifying how much natural resources individuals, communities, or nations consume compared to how much the Earth can regenerate. A study of ecological footprints provides crucial insights into the sustainability of current practices and areas for improvement to mitigate climate change [1].
Mitigating climate change involves reducing or preventing greenhouse gases (GHGs) to limit their adverse effects on the environment. Ecological footprints are helpful for identifying GHG emissions sources, such as fossil fuel combustion, deforestation, and industrial processes, so policymakers can target the biggest contributors to global warming. A more comprehensive understanding of these sources can lead to more effective strategies for reducing emissions and enhancing carbon sequestration.
In particular, the burning of fossil fuels like coal, oil, and natural gas contributes significantly to the ecological footprint. These activities release significant amounts of carbon dioxide (CO2), methane (CH4), and nitrous oxide (N2O) into the atmosphere, which exacerbates global warming. A study of the ecological footprint can help measure progress in this transition, in terms of carbon emissions reduction and growth in the adoption of renewable energy sources [2]).
A crucial role is played by ecological footprint analysis in the transportation sector as well. Fossil fuel-powered vehicles contribute substantially to GHG emissions [3]. Identifying opportunities to promote public transit, cycling, walking, and electric vehicles (EVs) can be achieved by analysing the ecological footprint of transportation. A major contribution to mitigating climate change can be made by encouraging the development of sustainable transportation infrastructure and implementing policies that reduce the use of fossil fuel-powered vehicles.
The ecological footprint is also significantly affected by industrial processes, including manufacturing and construction. The activities involved in these processes are often energy-intensive and produce greenhouse gases. In order to become more efficient, industries can analyse their ecological footprints to identify their most significant sources of emissions within their supply chains and operations. Changing to renewable energy sources, adopting cleaner technologies, and improving energy efficiency can reduce industries’ ecological footprint. Circular economy practices like recycling and waste reduction can also reduce raw materials consumption and environmental impacts [3].
According to [4], agriculture and land use changes contribute significantly to ecological footprints, including deforestation, soil degradation, and livestock methane emissions. The analysis helps highlight the environmental impact of various agricultural practices and changes in land use, which enables better practices to be developed. Several approaches can reduce the ecological footprint of food production, including agroecology, sustainable land management, and regenerative agriculture. By improving soil health, increasing biodiversity, and improving carbon sequestration, these practices mitigate climate change [4].
The expansion of built environments and urbanisation also substantially contributes to ecological footprint growth. Cities consume a large amount of energy and resources and emit a large amount of greenhouse gases. Urban planners and policymakers can use ecological footprint analysis to promote energy-efficient buildings, green spaces, and low-carbon transportation options in order to design more sustainable cities. Ecological footprint analysis can also provide data-driven insights into urban sustainability for smart city initiatives, which integrate advanced technologies to enhance efficiency and reduce environmental impact [5].
The use of water is also a critical aspect of the ecological footprint, particularly when it comes to climate change. Water availability and distribution are affected by changes in precipitation patterns, droughts, and glacier melting caused by global warming. An ecological footprint analysis is useful when assessing water use sustainability and identifying opportunities for conservation and efficiency improvement. Climate change resilience can be enhanced through sustainable water management practices such as rainwater harvesting, wastewater recycling, and protection of watersheds [6].
Changes in behaviour and lifestyle choices play a significant role in determining the ecological footprint. Energy use patterns, dietary preferences, and consumer habits all have an effect on the environment. Analysing ecological footprints can raise awareness about environmental consequences and encourage more sustainable behaviours among individuals and communities. Sustainable living practices, such as reducing energy consumption, minimising waste, and choosing low-impact diets, can contribute to climate change mitigation.

What Is Different About This Study?

This study offers a comprehensive approach to assessing personal ecological footprints in the context of climate change mitigation and adaptation through a unique combination of calculations and surveys.
Its innovative calculation method is a key aspect of the study’s uniqueness. Individuals’ ecological footprints are calculated by assessing their lifestyle choices, consumption habits, and resource use. Participants receive personalised feedback, as well as actionable recommendations, as part of the approach. Through these insights, individuals can make informed decisions and adopt more sustainable behaviours to reduce their environmental impact.
Additionally, the study includes a survey designed to assess the level of awareness and understanding of personal ecological footprints and climate change within the targeted population. Unlike traditional knowledge surveys, this survey examines the key factors influencing individual behaviours in critical areas like energy consumption, water usage, transportation choices, and broader consumption habits. In order to encourage sustainable practices, the study seeks to identify where educational initiatives and policy changes might be most effective.
With this combination, the study not only measures environmental impacts but also explores psychological and behavioural aspects. This dual approach offers a more holistic understanding of individual contributions to climate change. A significant contribution to environmental research is the study’s methodological approach, which allows a deeper understanding of factors that drive sustainable behaviour.

2. Literature Review

2.1. Understanding Ecological Footprints: A Basic Introduction

Mathis Wackernagel and William Rees introduced the ecological footprint concept in the early 1990s [7]. Essentially, it measures the amount of land and water required to produce the resources consumed and to assimilate the wastes generated by human activities. In essence, it translates the consumption of resources and the production of waste into the amount of global hectares (gha) required to accommodate these activities.
Ecological footprints were developed in response to growing concerns about human activities’ impact on the planet [1]. With the growth of populations and industrialisation, the strain on natural resources and ecosystems grew more evident. Developing the ecological footprint responded to the need for an indicator of human activity’s environmental impact that could be understood and communicated by policymakers, scientists, and the public in an accessible way.
According to [8], several key components make up an ecological footprint, each representing a different category of resource usage or waste production. The carbon footprint is the largest component and measures how much carbon dioxide is released from fossil fuel consumption, electricity, heating, and transportation. The food footprint includes both crop and livestock production, which uses land and water resources. The housing footprint includes the land occupied by homes and the resources used for their construction and maintenance. The goods and services footprint measures how many resources are used to produce goods and services. Lastly, the forest footprint includes the demand for forest products, such as timber and paper, as well as the required forested land to absorb CO2 emissions [2].
There are several steps involved in calculating the ecological footprint. The first step is to gather data on a population’s resource consumption and waste production [9]. Using yield factors and equivalence factors, the data are converted into the amount of bio productive area required. The yield factor is based on the productivity of different land types, while the equivalent factor is based on the varying productivity of different biomes. Finally, the ecological footprint is calculated by adding the different components together.
Various scales can be used to calculate ecological footprints, such as the scales at which individuals and households live, as well as cities, regions, countries, and even the entire world. The ecological footprint of humanity has exceeded the Earth’s biocapacity since the 1970s—nature’s ability to regenerate resources and absorb waste. “Ecological overshoot” is the term used to describe this phenomenon [10]. Refers to ecosystems’ ability to generate useful biological materials and absorb waste materials generated by humans, under current management practices. The ecological footprint of a population exceeds its biocapacity, leading to the depletion of natural capital and unsustainable living conditions. Just like the ecological footprint, biocapacity is measured in global hectares and varies by region based on factors such as climate, soil quality, and land management. When a population’s ecological footprint exceeds its biocapacity, an ecological deficit occurs [11].
Ecological footprints are used in a variety of ways. Governments utilise ecological footprint analyses to inform resource management, environmental regulations, and sustainable development policies. In order to increase sustainable business practices, businesses use the ecological footprint to assess their operations and supply chains. Environmental educators and non-governmental organisations use ecological footprints to increase awareness of sustainability and promote behaviour change [12].
Although the ecological footprint is a powerful tool for communicating human impact on the environment, it has its limitations. Footprints reduce complex environmental impacts to one metric, potentially simplifying the issues. An accurate footprint calculation depends on the quality and availability of data, both of which can vary significantly.
In addition, the footprint does not take into account the dynamic nature of ecosystems and technological advancements that can affect the use of resources and the generation of waste. While it emphasises consumption patterns, it fails to capture the nuances of production processes and efficiencies [13].
The ecological footprint methodology has been improved, and complementary indicators have been developed in response to these criticisms. A hybrid approach integrates the ecological footprint with other indicators, such as the Human Development Index (HDI) and Genuine Progress Indicator (GPI), to provide a more holistic view of sustainability. From production to disposal, lifecycle assessments consider the environmental impacts of products and services. Dynamic modelling accounts for changes over time in technology, resource availability, and environmental conditions [14].
As a tool for assessing sustainability, the ecological footprint will continue to evolve. It may be possible to improve footprint calculations by using remote sensing and big data analytics in the future. Incorporating ecological footprint analysis into global sustainability frameworks, such as the SDGs, will align the analysis with international policy objectives. Engaging the public in footprint reduction through educational campaigns, incentives, and participatory approaches will also be important.

2.2. Human Ecological Footprints and the Crisis of Biodiversity

Biodiversity loss is an issue that is rapidly escalating and has significant implications for the ecosystem and the well-being of humans. This crisis has been significantly fuelled by human activities, especially those related to consumption patterns and resource use. By understanding and addressing the impact of these activities on biodiversity, human ecological footprints provide a valuable framework. Ecological footprints measure the demands on natural resources and ecosystems as a result of human consumption and waste generation. The comprehensive metric can help illuminate the ways in which human actions are responsible for biodiversity loss and emphasise the necessity of mitigating these impacts.
The term biodiversity describes the variety of life on Earth, which includes species, ecosystems, and genetic variation within species. It is crucial that ecosystems maintain diversity and resilience in order to provide ecosystem services that humans rely upon, such as pollination, water purification, and climate regulation. It is estimated that species extinction rates are now 1000 times higher than natural background rates because of human activities. There are several factors contributing to biodiversity loss, including habitat destruction, overexploitation of species, pollution, climate change, and the introduction of invasive species, all of which are closely tied to human ecological footprints [15].
One of the most significant contributors to the biodiversity crisis is habitat destruction. The expansion of human populations and the intensification of industrial activities are causing natural habitats to be converted into agricultural lands, urban areas, and infrastructure. It results in the fragmentation of habitats that are vital to the survival of many species. Tropical rainforests have been deforested by logging, agriculture, and cattle ranching, resulting in the loss of critical habitats for countless species, many of which are endemic. This type of activity has a substantial ecological footprint, as it not only consumes large areas of land but also damages soil, disrupts the water cycle, and emits greenhouse gases [16].
A further contributing factor to biodiversity loss is overexploitation through activities such as hunting, fishing, and harvesting wild plants. Many species are exploited at unsustainable levels, which results in population declines and, in some cases, extinctions. As a result of overexploitation, marine ecosystems have suffered from depleted fish stocks and disrupted food chains. Additionally, coral reefs, which host a huge diversity of species, are severely damaged by overfishing, as well as destructive fishing practices such as trawling and blasting [17].
According to [18], another critical factor driving the biodiversity crisis is pollution. Air, water, and soil are contaminated by industrial activities, agriculture, and urbanisation. Pesticides and heavy metals can be toxic to wildlife, causing death, reproductive failures, and alterations in behaviour and physiology.
Neonicotinoid pesticides, for example, have been linked to declines in bee populations, which pollinate many crops and wild plants. Plankton and whales are particularly at risk from plastic pollution in marine environments since ingesting or becoming entangled in plastic debris can lead to injury or death. Climate change, caused by human activities releasing greenhouse gases into the atmosphere, is also a major contributor to biodiversity loss. Changes in precipitation patterns, rising temperatures, and more frequent and severe weather events alter habitats and ecosystems, causing species to migrate, adapt, or die out.

2.3. The Impact of Human Activity on Global Ecological Change

The Earth’s ecosystems and natural processes have been dramatically altered by human activity. As a result of these changes, global ecological conditions have changed significantly in the modern era, particularly since the Industrial Revolution.
According to [19], a profound transformation in human societies began with the Industrial Revolution. In the transition from agrarian to industrial economies, fossil fuels such as coal, oil, and natural gas have been used exponentially more. In the combustion of these fuels, large quantities of carbon dioxide (CO2) and other (GHGs) are released into the atmosphere. As a result of such GHG emissions, global temperatures are rising, precipitation patterns are changing, and extreme weather events are occurring more frequently and intensely. Globally, climatic shifts impact ecosystems, biodiversity, and human societies.
Land use patterns have also been altered globally by urbanisation and industrialisation. As cities and infrastructure expand, natural landscapes are transformed into built environments, and natural habitats are reduced. Buildings and roads in urban areas are impermeable, increasing surface runoff and reducing groundwater recharge. This can reduce freshwater ecosystems, increase flooding, and cause water scarcity. Furthermore, urbanisation often creates urban heat islands, in which temperatures in cities are significantly higher than those in nearby rural areas, adding to global warming [20].
Global ecological change is profoundly affected by agricultural practices. With the arrival of high-yield crop varieties, synthetic fertilisers, pesticides, and irrigation techniques in the middle of the 20th century, food production increased dramatically. It has helped feed a growing global population, but it has also degraded the environment. Soil erosion and loss of fertility occur as a result of intensive agriculture. Using chemical fertilisers and pesticides causes soil and water contamination, which affects non-target species and results in the decline of pollinators and other beneficial insects. Further, agricultural expansion often leads to the conversion of forests, wetlands, and grasslands into croplands, decreasing habitats and biodiversity.
Human activity also negatively impacts water resources. Biological diversity and human well-being depend on freshwater ecosystems, such as rivers, lakes, and wetlands. They are, however, increasingly threatened by overextraction, pollution, and climate change. Rivers and aquifers are depleted as a result of water diverted for agricultural irrigation, industrial processes, and domestic use. Freshwater systems are contaminated by industrial effluents, agricultural runoff, and untreated sewage, making them unfit for human consumption. Changing precipitation patterns and increasing droughts and floods are exacerbated by climate change, further stressing water resources [11].
An integrated and coordinated approach is required to address global ecological changes caused by human activities. Mitigation strategies must reduce greenhouse gas emissions, protect and restore natural habitats, promote sustainable land and water use practices, and implement circular economies that minimise waste and maximise resource efficiency.
Several international agreements provide frameworks for global cooperation in addressing these challenges, including the Paris Agreement [21] on climate change and the Convention on Biological Diversity. A successful implementation, however, requires political will, adequate funding, and participation from all stakeholders, including governments, businesses, and civil society organisations.
Mitigating climate change requires reducing greenhouse gas emissions. Transitioning from fossil fuels to renewable energy sources like solar, wind, and hydroelectric power is one way to do this. Improving building insulation, improving public transportation, and promoting energy-efficient appliances can also significantly reduce emissions. Incentives like carbon taxes and cap-and-trade systems encourage investment in low-carbon technologies and reduce emissions. Moreover, protecting and restoring forests and other natural ecosystems can enhance their role as carbon sinks, allowing them to offset other sources of carbon emissions [22].

2.4. Ecological Footprint Analysis for the UK as a Developed Country

Due to its high levels of industrialisation and economic development, the United Kingdom typically has a large ecological footprint. It is due primarily to the consumption of energy, food, and goods, as well as to the significant amount of waste generated. There are several factors that shape the UK’s ecological footprint, including its use of fossil fuels, extensive use of natural resources, and its advanced industrial and service sectors. The substantial ecological demands are also influenced by high living standards and consumer culture.
A major component of the UK’s ecological footprint is energy consumption. The UK still relies heavily on fossil fuels for heating, electricity, and transportation, despite significant investments in renewable energy sources. There is a substantial carbon footprint associated with the country’s energy consumption, contributing to its overall ecological footprint. Policies promoting energy efficiency, adoption of cleaner technologies, and carbon pricing mechanisms have helped the UK reduce carbon emissions. Despite this, the transition to a low-carbon economy remains a challenge [23].
It is also important to note that the UK’s food consumption patterns significantly contribute to its ecological footprint. As a result of importing a large proportion of its food, the country not only increases its carbon footprint due to transportation emissions, but also externalises some of the impacts of those emissions to the countries that produce that food. Due to the extensive land, water, and energy requirements of livestock production, high meat and dairy consumption further exacerbate the ecological footprint. It is crucial to reduce these impacts by promoting sustainable diets, such as encouraging plant-based consumption [24].
In the UK, housing and infrastructure also contribute to the ecological footprint. In the construction and maintenance of buildings, substantial resources are required, and considerable waste and emissions are generated. Natural habitats are being reduced as a result of urbanisation and the expansion of built environments. Reduced ecological footprints can be achieved through sustainable urban development, energy-efficient buildings, and green infrastructure [25].
With high levels of car ownership and use in the UK, transportation has a significant impact on the environment. Although public transportation is available, cars remain the dominant mode of transportation, contributing to carbon emissions and air pollution. To reduce the transportation footprint, it is vital to support public transportation, enhance cycling and walking, and encourage the adoption of electric vehicles. Sustainable consumption, energy efficiency, and the transition to renewable energy sources are necessary in developed countries like the UK to reduce the ecological footprint. Policies that promote resource efficiency, reduce waste, and promote sustainable lifestyles are essential [26].

3. Methods

The study focused on Liverpool, a UK city in the northwest of England that has a dense, multicultural population and cold, heavy rainfall weather. Liverpool’s cultural practices, particularly those within domestic buildings, can significantly impact the city’s ecological carbon footprint. This impact stems from various factors, including energy consumption for heating (gas fire boiler), traditional lighting, the choice of building materials, and the way buildings are designed and used (no insulation for some properties results in heat loss during operation of the heating system). This is in addition to the large amount of waste produced and daily commuting using a mix of private cars and public transport. There is little use of renewable energies like solar photovoltaic and heat pumps in domestic buildings.
To consider a different range of people, the following methodology was employed in this region:

3.1. Survey

Data collection methods are essential to ensure accurate and reliable assessment of personal ecological footprints, which must be carefully designed. Ref. [27] has been used as the primary tool for conducting the online survey and analysing the results. Using Google Forms for data collection is an effective, convenient, and user-friendly method that offers numerous advantages, making it an ideal solution for this type of study. In addition to being easy to use, it is widely recognised for its usefulness both to researchers and to respondents.
The survey can be easily accessed via a web link, which can be shared by email, social media, or embedded into a website. The efficiency of Google Forms in collecting and managing data is one of the most compelling reasons to choose it. The responses are automatically tracked and organised in a Google Sheets spreadsheet that can be easily accessed and analysed. The real-time data collection technique allows the researchers to monitor responses as they arrive, allowing them to identify any problems quickly and adjust the survey accordingly. To ensure the privacy and protection of respondent data, Google Forms provides robust security measures. Various data protection regulations are complied with on the platform, including the General Data Protection Regulation (GDPR). Besides requiring sign-in with a Google account, survey creators can also limit the number of responses per person, enhancing the security and integrity of the collected data. By providing these features, respondents can feel more confident that they will be treated with responsibility and confidentiality, which can enhance response rates and data quality.
A multifaceted justification exists for using an online survey methodology, such as Google Forms. First of all, the research evaluation of personal ecological footprints requires a diverse and potentially large sample size to capture behavioural and attitude variation across different demographics. Unlike traditional paper surveys, online surveys can reach a wide audience quickly and cost-effectively, eliminating geographical barriers. The broader reach of the study is crucial to collecting data that is representative of the population and for making general conclusions about the environmental footprint of individuals.

3.2. Online Calculator

The second methodology used for this research is the [9]. Using this tool, the ecological footprint of individuals who participated in this study was calculated. This widely recognised tool illustrates a comprehensive view of how individuals utilise biologically productive space, thereby providing critical information about their environmental footprint.
This calculator measures a person’s consumption habits, resource usage, and other lifestyle choices. A series of detailed questions covers these areas, allowing the calculator to estimate participants’ ecological footprint accurately. It measures how much biologically productive land and water an individual needs to produce the materials they consume and to absorb the waste they generate, expressed in global hectares.
The calculator provides an easy way to translate complex data into a format that can be easily understood.
The calculator uses a simple calculation method; for example, the equation for calculating the carbon emissions from energy consumption is
CO2e from Energy = Energy Consumption (kWh) × Emission Factor (kg CO2e/kWh)
The carbon footprint for driving a car is calculated using the following formula:
CO2e from Transport = Distance (km) × Fuel Efficiency (L/km) × Emission Factor of Fuel (kg CO2e/L)
This tool not only calculates an individual’s ecological footprint, but also provides insights into their carbon footprint. This is a crucial part of measuring climate change impacts and understanding climate change’s direct and indirect contributions.
Data security is also noteworthy. With robust privacy measures in place to protect sensitive information, users’ personal data are kept secure. In a world where data privacy concerns are paramount, this is particularly important. With the help of the calculator, participants in this study were able to evaluate their ecological footprint comprehensively. Detailed feedback has been provided on each participant’s ecological footprint based on their responses. Four distinct groups of data have been categorised as a Climate Hero, Friend, Consumer, and Villain.

3.3. The Methodology Adopted and Its Linkage to Research Objectives

Research objectives are intrinsically linked to the use of Google Forms as an online survey tool. Additionally, it ensures that the survey is distributed to a broader audience, which is crucial to achieving the research objectives.
This study’s first objective is to assess baseline awareness and understanding of environmental footprints and climate change among the target population. Since Google Forms is capable of handling large volumes of data efficiently, it is well suited for this purpose. A variety of question types can be created on the platform, including multiple-choice and Likert scale questions, which are essential for measuring awareness and understanding. Having an online survey ensures accessibility, enabling a wide range of respondents to participate and providing a comprehensive overview of baseline awareness levels.
With regard to the second objective, which aims to identify key factors that influence individual behaviour in terms of energy consumption, water use, transportation choices, and consumption patterns, Google Forms provides the flexibility to design detailed and specific questions that focus on these factors. It is possible to collect both quantitative data and qualitative insights by combining closed and open-ended questions. The mixed-method approach is crucial for understanding how different factors affect individual behaviour. Data collected from this study can be easily analysed to identify patterns and correlations, thus shedding light on the determinants of sustainable behaviour.
The third objective examines the barriers and challenges that prevent individuals from adopting sustainable behaviours and climate-friendly practices. The ability to incorporate open-ended questions into Google Forms proves invaluable in this situation. Using these questions, respondents are able to provide rich qualitative data on their experiences and views.
Qualitative data are essential to understanding individuals’ nuanced and complex barriers. Moreover, the platform’s real-time data collection allows for the timely identification of emerging trends and issues that can be further explored with follow-up questions as needed.
In the final objective, recommendations are developed based on survey results so that policymakers, educators, and community organisers can effectively engage and empower individuals to mitigate climate change and adapt to it. These recommendations are based on comprehensive data collected through Google Forms. Analysis tools on the platform, such as response summaries and charts, help identify key insights from the data. Empirical evidence can then be translated into practical and actionable recommendations.
A comprehensive and effective methodology for meeting these objectives included the ecological footprint calculator. The ecological footprint calculator has been chosen as the primary tool for calculating individuals’ ecological footprints. As a result of its systematic evaluation of different aspects of human lifestyle that have an impact on the environment, such as energy use, transportation, dietary choices, and waste generation, this calculator is well suited for the task. Participants are asked specific, targeted questions to determine their ecological footprint, expressed as global hectares. The quantitative data are crucial for determining the extent of each individual’s impact on the planet’s biologically productive space. In order to calculate ecological footprints accurately, detailed questions are included in the calculator to obtain specific information. Another important aspect of the methodology is the secure handling of participant data. Data security concerns are addressed by robust privacy measures built into the calculator. Keeping participant trust and ensuring the integrity of the collected data are essential. The methodology supports the objective of conducting a reliable and ethical study by prioritising data security.

3.4. Data Collection Tools and Implementation

In the UK, the survey link was sent to students and staff of Liverpool John Moores University (LJMU), colleagues at work, and members of the local community. The responses of all participants were completely anonymous. Participants must be 18 or older to participate. At LJMU, the survey has been distributed to the appropriate email groups. By email and phone, others from the workplace and community have been contacted. The approach successfully captured a diverse range of responses across ethnicities, age groups, employment statuses, and genders.
WhatsApp and email were chosen as the primary distribution channels because they were effective in reaching a diverse group of respondents quickly and efficiently. The combination of these channels also increased the likelihood that different segments of the target population would participate.
Survey links were distributed through official university communication channels, such as staff and student mailing lists. Response rates were significantly enhanced by leveraging existing communication infrastructure and trust associated with university communications.
The survey link was also shared with community members. A broader demographic range was captured through this step, including people of various ethnicities, ages, and employment statuses. Furthermore, WhatsApp enabled follow-up messages and reminders, which increased response rates and ensured a sufficient number of surveys were completed.
Data protection measures and the importance of privacy were explained to respondents. Respondents were anonymously surveyed, and only the necessary information was collected in the survey. It built trust with participants, which encouraged them to answer honestly and accurately. The use of the calculator exclusively for data collection represents a strategic approach to assessing individual ecological footprints. A precision data input process was conducted to ensure that the calculator’s results are accurate and reflect participant lifestyle choices. This calculator provides detailed reports, including a total ecological footprint, carbon footprint, and specific areas where participants can reduce their environmental impact. The reports were then compiled and analysed to draw broader conclusions about the impact of different lifestyle choices on the environment. This approach relies on the calculator’s efficiency, accuracy, and scalability, as well as its ability to provide standardised ecological footprint assessments.

3.5. Purpose of Data Collection

The survey and calculator collect a broad range of data related to individual behaviours, household characteristics, and consumption patterns that contribute to ecological footprints. Key types of data include the following:
  • Demographic Information:
    Questions about gender and age group provide context for analysing ecological footprint variations across different demographic groups.
  • Employment and Transportation Patterns:
    Questions regarding employment status, workplace location, and modes of transportation help assess carbon emissions related to commuting and professional activities.
  • Household Energy and Utility Consumption:
    Participants are queried about the size and type of their residence, heating sources, monthly utility expenses (gas, electricity, and water), and insulation upgrades. These inputs are critical for understanding home energy efficiency and carbon footprints.
  • Consumption and Waste Management:
    Questions about food habits, plastic use, and recycling behaviours reveal the participants’ level of engagement with sustainable consumption practices.
  • Travel and Mobility:
    Information on car ownership, miles driven, vehicle type, and usage of public transport and flights helps estimate transportation-related emissions.
  • Awareness, Cultural Norms, and Economic Factors:
    Participants are asked about cultural influences, social norms, and economic conditions that impact their adoption of sustainable behaviours.
  • Renewable Energy and Energy-Saving Practices:
    The survey and calculator include questions about familiarity with and willingness to adopt renewable energy technologies, such as solar panels and heat pumps.
Collecting this data serves multiple purposes:
  • Carbon Footprint Calculation:
    By examining transportation, housing, and consumption patterns, the survey enables the estimation of individuals’ carbon footprints.
  • Behavioural Insights:
    Understanding participants’ willingness to adopt sustainable practices and barriers to such adoption provides valuable insights for policy recommendations.
  • Awareness Assessment:
    Questions about participants’ familiarity with renewable technologies and sustainable behaviours help gauge the effectiveness of public awareness initiatives.
  • Targeted Sustainability programmes:
    The data can guide the development of tailored programmes to reduce ecological footprints, promote energy efficiency, and encourage sustainable lifestyles.

4. Results and Discussion

4.1. Identification of Key Factors Influencing Individual Behaviours

The data collected through Google Forms and the online calculator is evaluated within the UK region (Liverpool). In the research, 83 participants completed a thorough survey. A major objective of the study was to provide insights into how individuals perceive and engage with their ecological impacts, as well as identify areas for personal and collective improvement towards climate sustainability. Demographic data collected from this survey are crucial for contextualising the findings and ensuring the results reflect a diverse sample of participants.
There was a nearly equal gender distribution among survey respondents, with 50.9% identifying as male and 49.1% identifying as female. Due to this balance, both genders’ perspectives and experiences are adequately represented in the study, allowing for a more nuanced understanding of ecological footprints across demographic groups. It is especially valuable for the research to have a near-equal representation of men and women, since gender can play a role in ecological behaviour and attitudes toward climate change.
As shown in Figure 1, there was a wide range of age distribution among participants, providing a broader understanding of generational differences. The youngest age group of participants, ages 18 to 25, accounted for 3.8% of the participants. A unique perspective is often expressed by this group, representing emerging adults, due to their recent educational experiences and developmental stages in their careers. 11.3% of participants were in the 25 to 34 age group. Those in this group are typically in the early to mid-career phase and may face different ecological and economic challenges.
There were 49.1% of respondents between the ages of 35 and 44. Considering this significant proportion, it is likely that many participants were balancing career responsibilities with family commitments. As a result of its substantial representation, this age group can offer important insights into the ecological footprints of individuals whose lifestyles and consumption patterns have already been established. A total of 20.8% of the survey participants were aged 45 to 54, providing a perspective from people with more experience and a greater focus on long-term sustainability. On the other hand, 55 to 64-year-olds and those 65 and older accounted for 11.3% and 3.8% of respondents, respectively. Groups like these can offer valuable insight into how climate action affects the behaviours of ageing people as well as the changes in attitudes related to climate change.
A person’s employment status also plays a crucial role in understanding ecological footprints, as it can affect their income levels, lifestyle choices, and access to climate-friendly practices. In total, 67.9% worked full-time. According to this majority, individuals with a steady income and likely more stable consumption patterns have a larger impact on the ecological footprints considered in the study. Among respondents, 24.5% were part-time employees, a substantial minority that might represent individuals with more flexible schedules, but with less disposable income. Unemployment, comprising 7.5% of participants, highlights how economic constraints influence ecological choices. These demographics enrich the findings by reflecting the diversity of age, gender, and employment status among participants. Based on the different backgrounds and life stages of participants, a comprehensive analysis of personal ecological footprints can be conducted. According to the research objectives, these demographic details establish the groundwork for a deeper thematic discussion of the findings.

4.1.1. Energy Consumption

Participants in the survey reported significant differences in their electricity and gas bills, as well as their energy consumption habits for heating and cooling their homes. The differences between these groups provide a nuanced understanding of the factors that influence energy use behaviours, highlighting potential intervention areas.
In terms of the average monthly gas bill, Figure 2 shows that 40.7% of participants fall within the £51 to £100 range, while a smaller percentage falls within the lower and higher extremes. 11.1% of participants reported spending between £0 and £25, 9.3% between £26 and £50, 22.2% between £101 and £150, and 16.7% over £150. The data suggest a wide range of gas consumption habits as well as varying levels of energy efficiency and household size.
Similar to the electricity bill data, Figure 3 shows that 44.4% of participants spend between £0 and £100 per month, the largest group. Following this, 24.4% spent £101 to £250, 9.3% spent £250 to £750, and 1.9% spent over £1000. According to the distribution of electricity bills, there is a significant variance in the amount of electricity consumed, which could be due to household practices, appliance efficiency, or even socioeconomic factors.
An individual’s energy consumption for heating or cooling the house provides further insight into their behaviour. In Figure 4, 20.4% of participants used heating and cooling systems extensively without taking any additional energy-saving measures. Approximately 55.6% of people use moderate energy-saving measures like fans and opening windows in summer. A smaller segment of homeowners, 18.5%, use energy-efficient appliances and programmable thermostats. The final 5.5% of participants have installed solar panels, used smart home technology, and optimised energy usage. A range of engagement with energy-saving practices was found, ranging from minimal to highly proactive. Participants with lower monthly energy bills may have financial limitations that prevent them from using more energy or investing in energy-efficient technologies. In contrast, people with higher energy expenditures might have a larger household or a larger disposable income. Access to technology and awareness also appear to have an effect on energy-saving practices. There is a small but significant number of participants who use advanced methods such as solar panels and smart homes, who are likely more aware of their environmental and economic benefits.
Considering these findings in light of the research objective highlights the need for targeted interventions that promote energy-efficient behaviours. Education and awareness campaigns can play an important role in educating individuals about energy-saving practices. Using programmable thermostats and energy-efficient appliances, for example, would help those who make minimal efforts to reduce their energy consumption. Furthermore, financial incentives and subsidies could facilitate the adoption of solar panels and smart home technologies throughout a broader population. In analysing these findings critically, socioeconomic factors are evidently important influences on energy consumption. A household with a higher energy bill could benefit from tailored advice on reducing consumption without sacrificing comfort, while a household with a lower bill might need assistance obtaining and affording energy-efficient technologies. In accordance with existing literature, the results of the study highlight the complex interaction between economic factors, environmental awareness, and technology access when it comes to shaping energy consumption behaviours. Moreover, the findings highlight the need for policies that address these multifaceted influences to foster more sustainable energy consumption.

4.1.2. Water Usage Habits

The study evaluated water usage in particular as a way of understanding individual behaviours affecting climate change adaptation and mitigation. Participants were asked about their monthly water bills and water usage habits. The results of the study revealed insightful patterns and provided a foundation for discussing the broader implications.
Monthly water bills indicate a wide range of water expenditures among participants. Figure 5 shows that 13% of respondents reported monthly water bills between 0 and 25 pounds. A majority of respondents, 42.6%, fall within the 26 to 50 pounds range, which indicates that this is the most common range. Furthermore, 37% of participants spend 51 to 100 pounds on water, showing that a significant number of people have higher water expenses. There is a smaller segment of 5.6% with a monthly bill between 101 and 150 pounds, and an even smaller segment, 1.9%, with a bill exceeding 150 pounds. Based on this distribution, most participants incur moderate water expenses, with fewer individuals facing very high or very low expenses.
In terms of water consumption habits, the data shows that most participants are aware of their water consumption, but the extent to which they take proactive measures varies.
It is evident from Figure 6 that around 29.1% of respondents rarely think about water use, which emphasises the need for increased awareness and education on water conservation. In total, 52.7% of people occasionally take shorter showers and turn off the water when brushing their teeth, indicating a basic awareness of water conservation. A more committed approach to water conservation is reflected by 16.4% of respondents who regularly install low-flow fixtures and appliances. Only 1.8% of survey respondents use rain barrels for gardening, practice water-efficient landscaping, and use water-efficient appliances, showing the highest dedication to reducing water consumption. Several critical factors influence individual behaviours related to water use, based on the analysis of these results. It appears that economic factors play a significant role in water consumption patterns based on the range of monthly water bills. Higher water bills may be associated with bigger households or less efficient water use. In contrast, individuals with lower bills may already be using less water or living in smaller households. In addition, the data indicate that most people are making some efforts to conserve water, but only a small number are fully committed to comprehensive water-saving practices.
Several implications can be drawn from these findings. Firstly, the significant proportion of those who rarely consider water usage shows that water conservation campaigns have a considerable opportunity to raise awareness. People can reduce their water footprint by fixing leaks, installing low-flow fixtures, and adopting water-efficient landscaping through environmental education programmes. Further, the results highlight the importance of economic incentives and policies encouraging water conservation. To provide financial incentives for reducing water usage, tiered water pricing could be widely implemented. When water consumption increases, such pricing structures charge higher rates, encouraging households to lower their bills by reducing water consumption.
In addition, the small percentage of participants who practice comprehensive water-saving measures illustrates the potential impact of community programmes that promote best practices. Rain barrel demonstrations and community gardens that use water-efficient landscaping can serve as practical examples and inspire more people to adopt them. There is also room for innovation in water-saving technologies, according to the findings. A partnership between the public and private sectors could focus on developing and promoting water-saving products for households. Smart home technologies that monitor and detect leaks in real-time, for example, can significantly reduce water waste.

4.1.3. Transportation Methods

According to Figure 7, 65.4% of the participants preferred car usage over any other mode of transportation. Among the other modes of transportation, public buses are the most popular choice at 15.4%, followed by trains or subways at 9.6%, bicycles at 3.8%, and walking at 5.8%.
Despite increasing awareness of environmental impacts, a substantial majority still prefers driving to other modes of transportation. There are several reasons for this preference, including convenience, comfort, perceived time savings, and possible inadequacies in public transportation systems. Public transportation cannot match the flexibility of cars, especially in areas with limited or unreliable public transit options. Moreover, societal norms and urban planning in many areas have historically favoured car travel, making it a hard habit to break.
The relatively low usage of public buses, trains, and subways suggests that public transportation may not meet the needs of the population. It could be due to a variety of factors, such as limited coverage, infrequent service, overcrowding, or concerns about safety and cleanliness. The lower percentages for bicycles and walking suggest that these modes of transport are less preferred, likely due to the perceived inconvenience, longer travel times, lack of infrastructure such as bike lanes or safe pedestrian pathways, and perhaps the climate does not encourage these modes of travel.
The high dependency on cars from a sustainability perspective is concerning because of the associated carbon emissions. A significant shift towards more sustainable transportation options is needed to mitigate climate change. The key to achieving this goal is not only to improve the infrastructure and services for public transportation, but also to change the public’s attitude and behaviour towards environmentally friendly modes of transportation.
These data are consistent with the existing literature, which indicates that convenience and infrastructure significantly influence transportation choices. Studies have shown that cities with well-developed public transportation systems use public transportation more frequently. In cities with more developed subway systems, such as New York and London, a higher percentage of residents use public transportation.
In addition, promoting active transportation modes such as walking and cycling requires adequate infrastructure and addressing safety concerns. There is evidence that cities with comprehensive networks of bike lanes and pedestrian-friendly pathways have higher rates of cycling and walking. Amsterdam and Copenhagen, for instance, have heavily invested in bicycle infrastructure, which has resulted in some of the highest bike usage rates in the world. For policymakers and urban planners, these findings have significant implications. It is important to take a multifaceted approach to reducing the ecological footprint of transportation. There is a need to increase public transportation coverage, increase service frequency, ensure reliability, and enhance safety through infrastructure investments. Environmental education and the promotion of sustainable modes of transportation can help shift public preferences. To discourage car usage, subsidies for public transportation passes, tax breaks for bicycle purchases, or even congestion charges in city centres can be effective incentives.
Furthermore, improving accessibility for people with disabilities and ensuring affordability are essential to enhancing public transportation use. It is important that transportation planning takes into account the diverse needs of the population, as described in the literature.
Despite the strong preference for car usage according to current data, targeted interventions and infrastructure improvements could lead to change. A shift towards more sustainable modes of transportation can be encouraged by addressing the factors that influence transportation choices. Toward reducing the ecological footprint of transportation, this research stressed the importance of establishing a comprehensive approach that improves public transportation, enhances active transportation infrastructure, and changes public attitudes.

4.1.4. Ethnic and Cultural Norms

Based on the results of the survey, a nuanced understanding of ethnic, social, and cultural norms has emerged. In light of the data gathered from participants, cultural values and societal pressures play a significant role in influencing individuals’ environmental behaviour and decision-making.
As shown in Figure 8, about 17% of participants reported that social norms actively discourage sustainable practices within their communities. In this subset of respondents, peer pressure contributes to the adoption of unsustainable behaviours. These pressures may manifest in a variety of ways, including cultural expectations around consumption patterns, waste disposal habits, and the adoption of energy-intensive lifestyles. Being environmentally responsible might be seen as deviant or out of alignment with societal expectations, making eco-conscious choices difficult without risking social ostracism. Some communities disregard environmental concerns due to deep-rooted economic priorities or traditional beliefs that place short-term convenience before long-term ecological well-being.
The majority of participants, 49.1%, indicated some awareness of sustainability, though their communities still value convenience over sustainability. Despite sustainability awareness increasing, it is still not reaching a critical mass that is capable of changing community behaviours at large. A fast-paced modern lifestyle may contribute to convenience-oriented practices, where time constraints and the availability of inexpensive, yet environmentally harmful, products limit individuals’ ability to embrace sustainable alternatives. The affordability and accessibility of convenience items like single-use plastics and fast fashion often make them a more attractive option than their eco-friendly counterparts, for instance. Findings such as these highlight the gap between knowledge and practical application of sustainability. Some individuals may recognise that sustainability is important, but their actions are still influenced by the ease and availability of unsustainable options, especially when these are normalised within their social circles.
Intriguingly, 26.4% of respondents indicated that their communities support sustainable behaviours, despite some traditional norms still standing in their way. This group represents a transitional phase in which environmental awareness is increasing, but older cultural practices may still obstruct full engagement in sustainable behaviours. Some of these barriers may be religious or historical practices that focus on resource use without considering environmental impact, or deeply ingrained attitudes about waste and consumption. There is, however, an encouraging sign in this community that sustainability is becoming increasingly accepted. In light of these findings, with sustained effort and targeted interventions, cultural barriers may eventually be overcome, allowing more widespread adoption of environmentally responsible behaviour.
In a smaller sample of participants, 7.5%, sustainability is strongly emphasised in their communities. In such cases, social and cultural norms actively support eco-friendly practices. Individuals in these communities may be deeply committed to reducing ecological footprints, with sustainability deeply embedded in their values. A range of initiatives could contribute to this, including widespread use of renewable energy, water conservation, or sustainable agriculture. As these minority respondents demonstrate, cultural norms can enable rather than hinder sustainable behaviour. Sustainable living is not just an individual choice, but a value that is reinforced through social networks, community events, and shared goals within these communities.
According to the distribution of responses across these four categories, some communities are moving toward sustainability, while others still face significant challenges. There is a wider societal challenge to promoting climate-friendly behaviours that can be seen in the fact that nearly 50% of respondents still face norms that favour convenience over sustainability. Positively, sustainability is being supported in an increasing number of communities, indicating that awareness raising, and behaviour change efforts are beginning to have an impact.
This varying attitude toward sustainability is likely influenced by cultural and ethnic differences. In indigenous or rural communities, where people have long maintained close ties to their natural environments, traditional practices can provide valuable insights into sustainable living. Others, especially those in urbanised or industrialised societies, may still place a higher priority on economic growth, consumption, and convenience than on environmental stewardship. When designing interventions or policies aimed at promoting sustainability, different cultural perspectives should be carefully considered, since one-size-fits-all solutions are unlikely to be effective.

4.2. Access to Knowledge About Sustainable Behaviour Among Participants

Based on the collected data, distinct patterns emerge regarding participants’ awareness of and access to sustainable behaviours. According to Figure 9, 16.7% of participants were not informed about sustainable behaviours and had difficulty accessing reliable information. Initially, adopting sustainable behaviours is difficult due to a lack of awareness and access to accurate, comprehensive information. People are unlikely to make informed decisions or change their behaviours without foundational knowledge, underscoring the need for widespread, accessible education. Nearly half of the participants, 44.4%, are somewhat informed but have trouble finding reliable sources of information. Those in this group understand sustainable practices but are hindered by the quality and consistency of information available. Messages that conflict or sources that are unreliable can lead to confusion and misinformation, further preventing sustainable behaviour adoption. In order to facilitate a better understanding and implementation of sustainable practices, it is crucial to improve the clarity, consistency, and reliability of publicly accessible information. In addition, 27.8% of participants are well-informed about most sustainable practices, but sometimes find it difficult to locate reliable or up-to-date information. There is still a barrier related to staying up to date with the latest information, even among those with a higher awareness level. It highlights the dynamic nature of sustainability knowledge and the need for continuing education and access to credible information. This suggests that sustainable practices should not only be educated but also continuously updated and improved.
The remaining 11.1% of participants are very well informed and regularly access and understand reliable information. However, this group represents a minority, suggesting that high levels of understanding and easy access to reliable information are not yet common. As an example of best practices in education and information dissemination, this group demonstrates that high levels of awareness and understanding can be achieved with the right resources and strategies.
It is clear from these findings that addressing access to knowledge for sustainable behaviour adoption requires a multifaceted approach. The educational initiatives should be tailored to different levels of awareness, ensuring that those who are uninformed receive foundational knowledge and those who are already aware receive consistent and updated information. Information about sustainable behaviours should be made more accessible and reliable through public information campaigns. In addition, these findings suggest a collaboration between educators and environmental organisations to create a coherent and reliable information environment. Communication of sustainable practices across various platforms can help mitigate confusion caused by inconsistent or unclear information sources.

4.3. Investigation of Participants’ Beliefs in Renewable Energies

Based on the data collected in Figure 10, half of the participants support renewable energy sources, citing their lower emissions and use of renewable energy sources as primary reasons. There is a significant portion of the population that recognises the environmental benefits of renewable energy and actively integrates it into their lifestyles. Their positive attitude suggests they will adopt and advocate for renewable energy solutions, reducing carbon footprints and fostering a culture of sustainability. The enthusiasm for renewable energy systems can be attributed to climate change awareness, technological advancements, and successful implementation stories.
However, 18.2% of participants expressed reservations about renewable energies, primarily due to their high initial costs and complexity in installation. A critical barrier to the widespread adoption of renewable energy technologies is highlighted in this segment. Even though individuals recognise the benefits of renewable energy in the long run, the upfront investment and technical challenges prevent them from switching. The findings highlight the need for policy interventions, subsidies, and financial incentives to ease the economic burden and simplify the adoption process. In addition, public education campaigns could demystify installation processes and emphasise environmental benefits and long-term savings.
A significant percentage of participants, 31.8%, support renewable energy, but believe that their effectiveness is maximised when combined with other energy-saving measures. An integrative approach to energy management is crucial in this regard. It is likely that these participants recognise that renewable energy strategies are critical for reducing carbon emissions, but their impact is enhanced when they are integrated with broader energy efficiency policies. As a result, this perspective aligns with contemporary energy management practices that advocate for renewable energy, energy conservation, and energy efficiency improvements. An approach like this maximises environmental benefits while also enhancing energy systems’ reliability and resilience.
There was no scepticism expressed by any of the participants with regard to the efficiency and reliability of renewable energies. The lack of scepticism indicates a broad acceptance of renewable technologies, possibly reflecting successful awareness campaigns, technological advancements, and positive experiences shared by early adopters. There is no outright opposition to renewable energy, suggesting that the primary challenges lie in addressing practical and economic concerns related to their adoption rather than convincing the public of their efficacy.
In conclusion, the survey results provide a nuanced understanding of public beliefs regarding renewable energies and highlight key factors influencing individual behaviours.

4.4. Participants’ Knowledge About Recent Technologies in Renewable Energy

Taking into account participants’ knowledge about renewable energy technologies, insightful data can be gathered from Figure 11 for analysis and discussion. Various levels of familiarity with renewable energy technologies are revealed by the survey results. A significant percentage, 27.3%, of participants were not familiar with these technologies. There is a significant knowledge gap that may impede individuals’ efforts to mitigate climate change through renewable energy adoption. In total, 40% of the participants indicated they were only slightly familiar with renewable energy technologies. Even though this demonstrates marginal awareness, it still highlights the need for education and outreach. 22.7% of participants reported moderate familiarity with renewable technologies, suggesting a moderate level of understanding and a higher likelihood of integrating them into daily life. Finally, 9.1% of respondents claimed to be well aware of recent advancements. With their knowledge and practices, this group is likely to be able to leverage new technologies to significantly reduce their ecological footprints and potentially influence others.
There is a very high percentage of participants who are unfamiliar or only slightly familiar with renewable energy technologies, which highlights an important barrier to widespread adoption. Several factors might contribute to this lack of familiarity, such as an inadequate education system, a lack of media coverage, or a perception of the complexity and cost of renewable energy solutions. Based on these findings, interventions that increase knowledge and familiarity with renewable energy technologies could have great value.
The integration of renewable energy education into school curricula and community programmes, for instance, could increase awareness and engagement in renewable energy. More individuals could be encouraged to explore and adopt renewable technologies by targeted campaigns that demystify the technology and demonstrate its practical and economic benefits. There is a small percentage of participants who are very familiar with renewable energy technologies and can play a pivotal role in driving societal change. Individuals such as these can be ambassadors for renewable energy, sharing their knowledge and experience.
By encouraging these individuals to take part in outreach and education efforts, renewable energy technologies could become more easily understood and adopted by a wider audience. The moderate familiarity reported by 22.7% of participants indicates that a foundation of awareness already exists. These groups might already be implementing renewable energy solutions and would benefit from in-depth information and support in order to fully adopt these solutions. This moderate familiarity could be converted into active adoption with tailored interventions that provide detailed guidance, resources, and incentives.

4.5. Participants’ Willingness to Adopt Technologies in Their Houses

Based on the survey results in Figure 12, insightful patterns emerge regarding individuals’ adoption of technologies intended to reduce their personal ecological footprints. These findings align with the objective of this research to understand key factors influencing participants’ willingness to adopt these technologies. The collected data provide a nuanced insight into participants’ attitudes and behaviours about such technologies, and shed light on their willingness to adapt and change in response to climate change. According to the survey, 36.4% of participants are “very likely” to adopt new technologies supporting sustainability. In this group, a high level of willingness can be attributed to their pre-existing commitment to sustainability, indicating an intrinsic motivation towards ecological practices. Having a strong alignment with their values and environmental goals explains their willingness to integrate sustainable technologies. It is likely that this demographic views these technologies not only as additions to their homes but as integral components that are compatible with their larger commitment to reducing their ecological impact. Their eagerness to embrace innovations that support their sustainability ethos may stem from a growing awareness of the environmental benefits and a proactive stance on climate change.
On the other hand, 40.9% of participants are “somewhat likely” to adopt these technologies, depending on the ease of installation. The majority of survey respondents are from this group, which points to the importance of practicality and ease of integration as factors influencing technology adoption. It is important to recognise that convenience and perceived complexity are common barriers to technology adoption. These participants are less concerned with ideological commitment than with the practical aspects of implementation. Even though they may be open to adopting sustainable technologies, their willingness is heavily influenced by practical concerns. Therefore, simplifying the installation process and improving user experience could greatly boost adoption rates.
Only 4.5% of participants are unlikely to adopt new technologies due to their preference for traditional heating systems. It appears that this group is resistant to change, favouring established systems over newer, possibly unfamiliar ones. There are several factors that could explain their reluctance to adopt new technologies, including scepticism about their effectiveness, comfort with existing systems, or a perceived lack of value. In order to overcome resistance, targeted strategies are needed to address concerns and demonstrate the benefits of new technologies. For individuals in this category to change their attitudes, educational efforts and demonstrations that highlight the benefits and efficiency of these technologies might be necessary.
The remaining 18.2% are neutral, meaning they would like more information before making a decision. There is a significant segment of the population in this group who are not committed, nor opposed, but are in an uncertain state. It reflects a lack of knowledge or understanding of the technologies involved. By providing comprehensive, accessible information about these technologies’ benefits, functionality, and impacts, it could influence their decisions. Communication and education outreach are essential in bridging the information gap and facilitating informed decisions.

4.6. Calculation of Individuals’ Ecological Impact Through an Online Survey
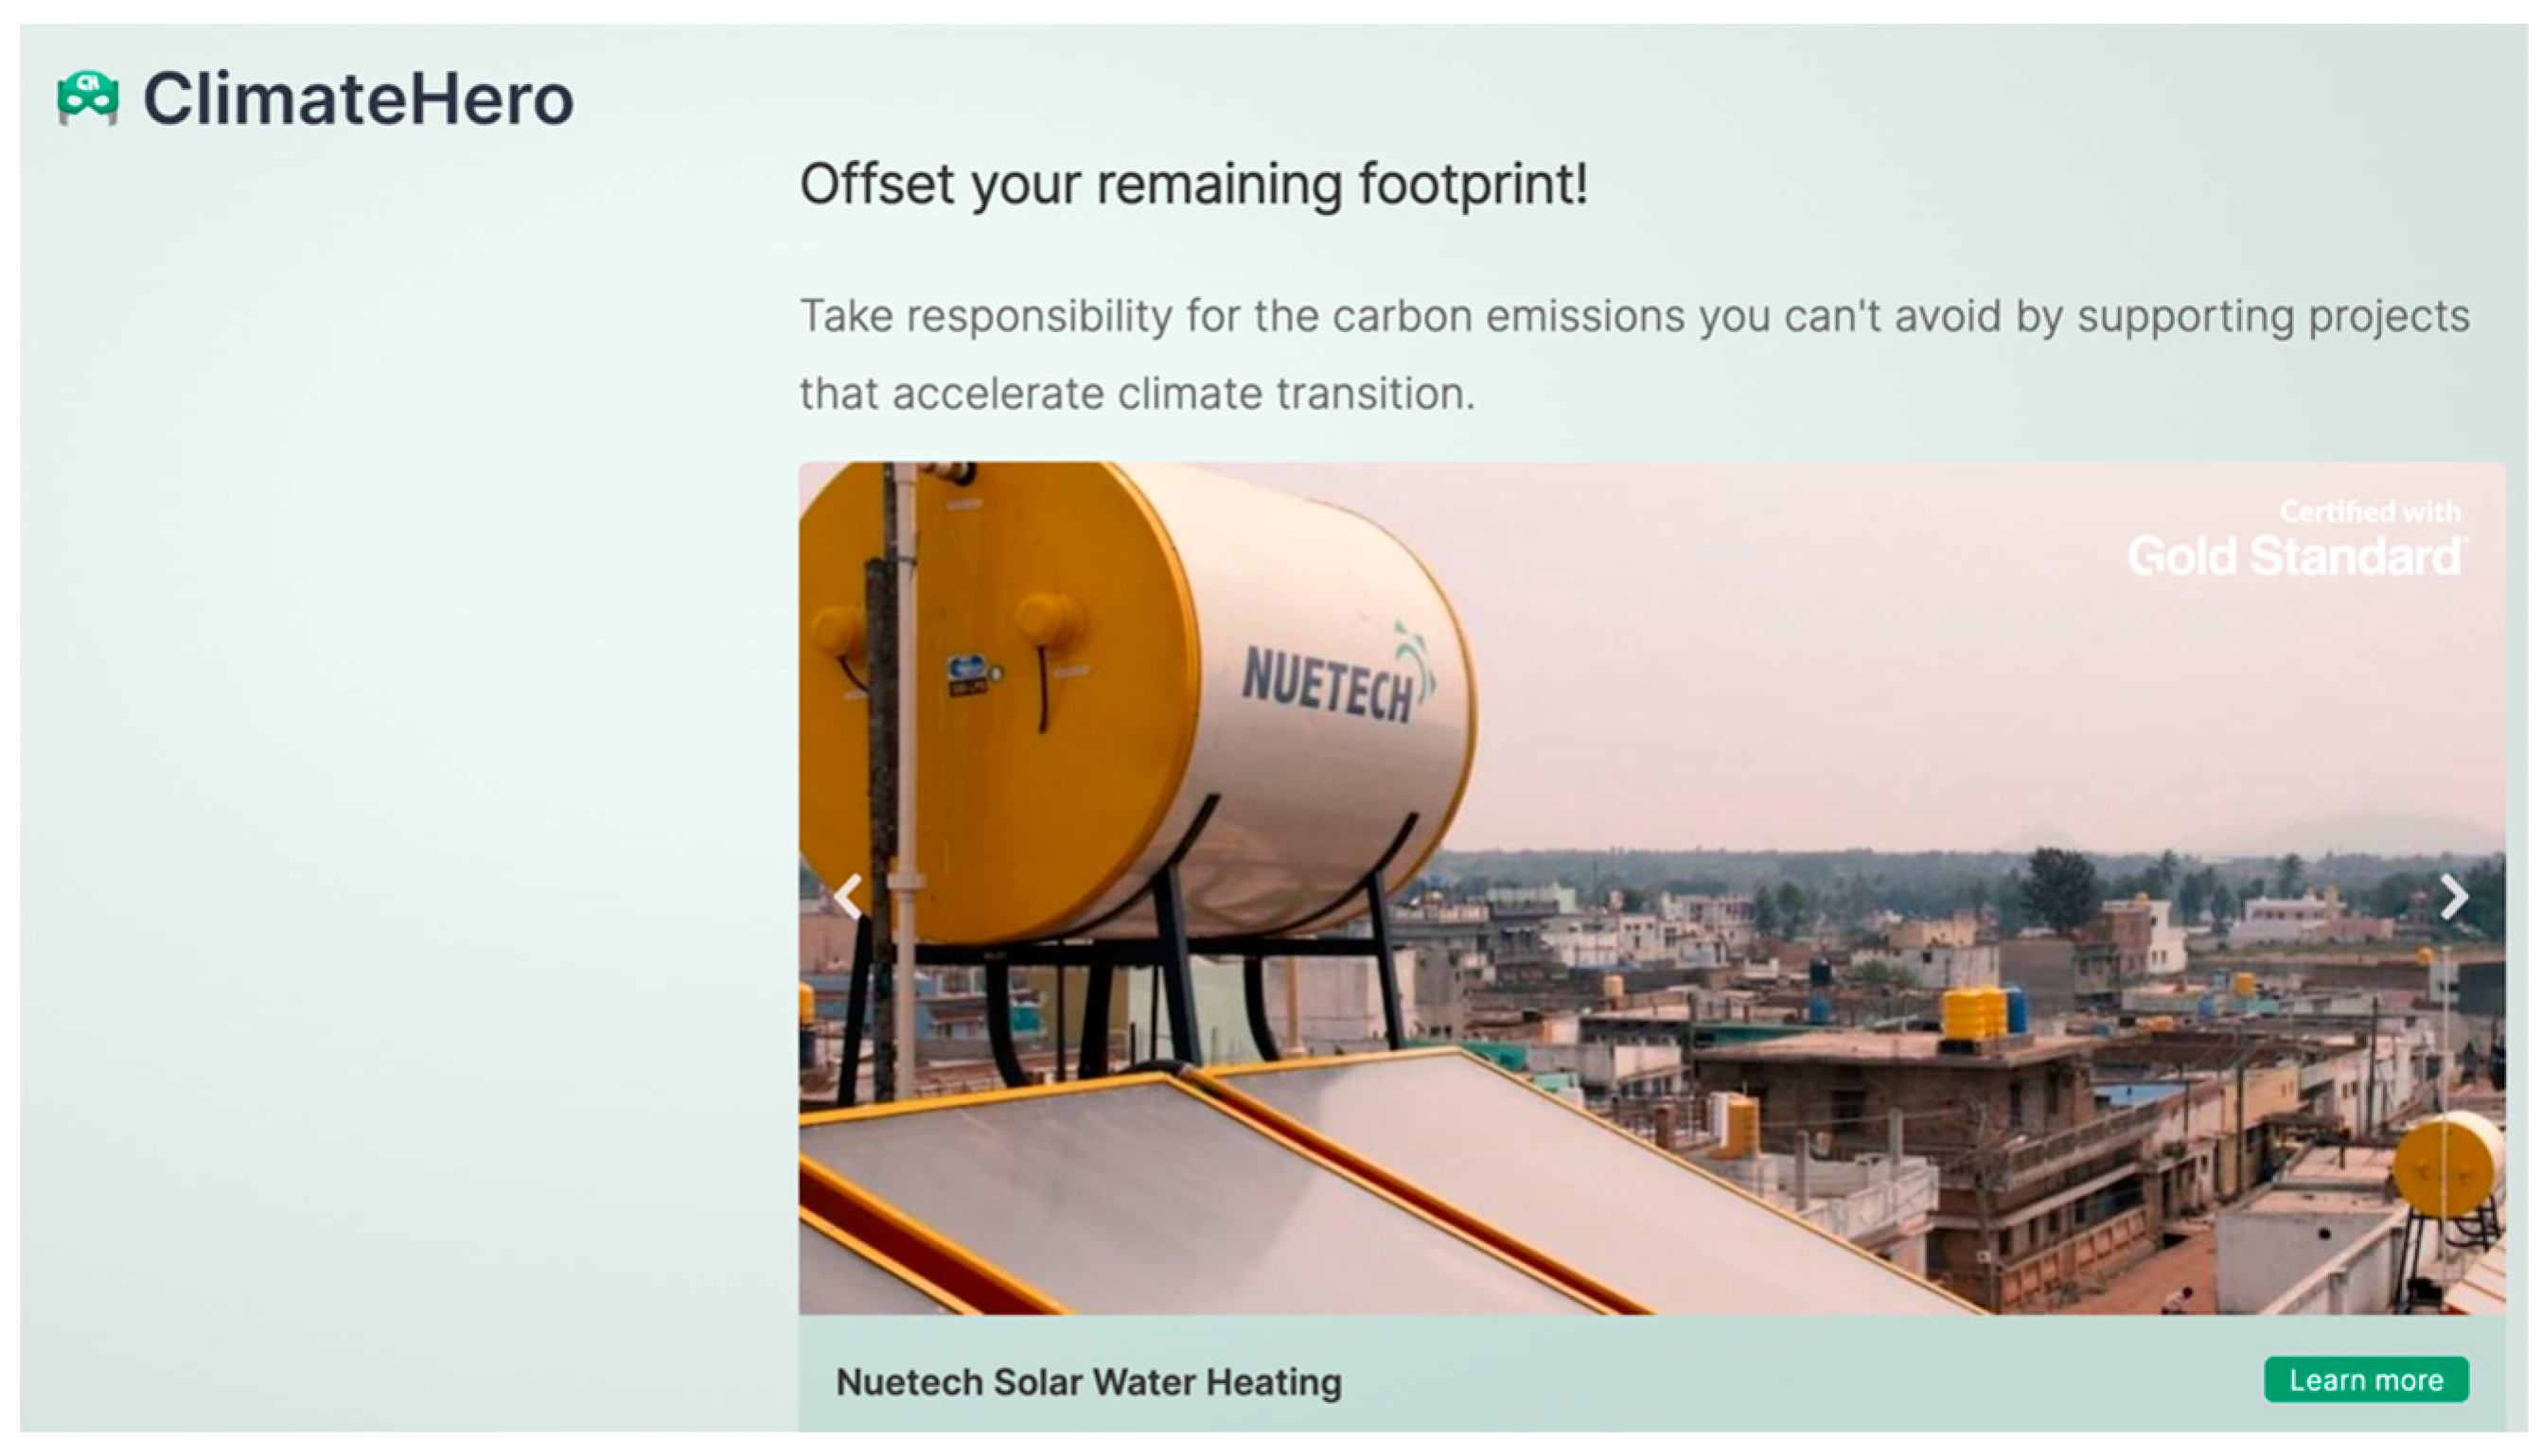
In order to evaluate the survey results, an online calculator tool was used to analyse the collected data. The objective of this research is to assess an individual’s ecological footprint by examining their lifestyle choices, consumption habits, and resource use, and then provide tailored feedback and recommendations to mitigate its effects.
The four carbon consumption data groups presented are distributed based on the participants’ survey responses and analysed using the online calculator. These categories, Climate Hero, Friend, Consumer, and Villain, reflect varying levels of carbon footprints, ranging from less than 2 tons to over 10 tons of CO2e per year. The influencing factors remain lifestyle choices such as energy usage, travel, and consumption patterns. Notably, personalised recommendations from the calculator highlighted key areas for improvement, such as adopting renewable energy, reducing unnecessary consumption, and choosing sustainable transportation options. These insights underscore the effectiveness of tailored interventions in promoting sustainable lifestyle changes.

4.6.1. Climate Hero

In the “Climate Hero” category, as shown in Figure 13, participants produce less than 2 tons of CO2e per year, a very low carbon footprint. This participant’s personalised feedback from the calculator highlighted the benefits of using environmentally friendly heating sources over oil or gas. With this switch, the carbon footprint of heating alone can be reduced by at least 80%. As well, participants who produce their own electricity were commended for completely eliminating their footprint from energy usage.
Participants in this category received specific recommendations to further reduce their environmental impact. Figure 14 illustrates how their 1.7 tons of CO2e per year are split among three main areas: home 0.3, travel 0.1, and consumption 1.3. Participants were encouraged to focus on the most impactful areas. As an example, reducing gadgets and clothing purchases by 20% could reduce their carbon footprint by 0.3 tons annually, as 15% of their carbon footprint comes from these purchases.
In addition, the calculator provided options for offsetting the remaining carbon footprint. In Figure 15, it is recommended to support projects that accelerate climate transition, such as the Nuetech solar water heating project, which costs around 6 pounds per month. Participating in this option allows participants to offset their carbon emissions even further.
The analysis of these results suggests that individuals in the “Climate Hero” category are already making significant strides in minimising their carbon footprint. However, their environmental impact can always be improved and further reduced. Participants can reduce their carbon footprints even more by following the recommendations provided by the calculator, such as reducing unnecessary consumption and supporting renewable energy initiatives.
In light of existing literature, a critical analysis of these findings reveals several key insights. Contemporary research advocates tailored approaches to environmental sustainability that emphasise personalised feedback. Studies have shown that customised recommendations promote behavioural change more effectively than generic advice. Literature also supports the use of online calculators to provide real-time feedback, as they leverage technology to engage individuals in understanding and managing their environmental impact.

4.6.2. Climate Friend

Participants in the “Climate Friend” category, as shown in Figure 16, had carbon footprints between 2 and 5 tons of CO2 equivalent. As compared to the average, these individuals had a relatively low carbon footprint. In the calculator’s feedback, the impact of dietary choices on carbon footprint was emphasised. A significant reduction in one’s carbon footprint can be achieved by avoiding beef and lamb, which are high-methane-emitting ruminants. Compared to carbon dioxide, methane has a much higher global warming potential. It is estimated that one kilogram of methane has the same greenhouse gas effect as 28 kg of carbon dioxide. Thus, selecting a vegetarian diet can nearly halve the CO2e footprint associated with food, which currently averages around 1.7 tons per year in Western diets.
Participants received personalised feedback from the calculator, as shown in Figure 17, encouraging them to adopt more environmentally friendly eating habits, such as eating more vegetarian meals. Choosing eco-friendly transport methods is also recommended as a practical step to reducing their carbon footprint. Participants were advised to book taxis and bike or walk whenever feasible, as well as to choose environmentally friendly cars when booking taxis. Among the recommendations was reducing reliance on fossil fuel-powered vehicles in order to reduce the carbon footprint. Additionally, participants had the option of supporting a variety of climate transition projects to offset their remaining carbon footprint. Figure 18 illustrates one such project: the Guangdong Methane Digesters, which could be supported for six pounds a month. Using this project will reduce methane emissions, thus reducing atmospheric concentrations of greenhouse gases.

Critical Discussion

According to the “Climate Friend” results, dietary habits and transportation methods play a crucial role in determining a person’s carbon footprint. The results of the calculator are in agreement with existing literature that emphasises the benefits of plant-based diets to the environment. Studies have shown that reducing meat consumption, particularly red meat, can significantly reduce greenhouse gas emissions.
Ruminant animals, including cows and sheep, produce a significant amount of methane during digestion, which contributes to global warming.
Studies suggest that a shift towards a plant-based diet can have substantial environmental benefits. According to a study published in [28], adopting a plant-based diet could reduce greenhouse gas emissions related to food by up to 70%. Furthermore, reducing fossil fuel consumption is an important method of mitigating climate change, according to various studies. Bicycles and walking reduce carbon emissions and offer health benefits, contributing to overall well-being.
Using climate transition projects as an offset to reduce carbon footprints is a pragmatic approach to reducing emissions that cannot be eliminated entirely by changing lifestyles. The implementation of carbon offsetting projects, such as methane digesters and renewable energy installations, is an essential component of comprehensive climate change strategies. The projects assist with the transition to a low-carbon economy by balancing unavoidable emissions.
Although the calculator provides beneficial recommendations, there are also challenges and limitations to consider. Making significant lifestyle changes is challenging because of the feasibility and willingness of individuals. In particular, dietary habits are deeply ingrained and influenced by cultural, social, and economic factors. Plant-based food options that are affordable and appealing can be used to encourage people to adopt vegetarian diets or reduce meat consumption.
In the same way, the adoption of environmentally friendly transportation methods is dependent on many factors, such as infrastructure, convenience, and individual circumstances. The choice of eco-friendly transportation is easier in urban areas with well-developed public transportation and cycling infrastructure. People may find it difficult to reduce their reliance on cars in regions with limited infrastructure.
Moreover, the effectiveness of carbon offsetting projects is dependent on their quality and integrity. The projects supported must be verified and provide genuine benefits to the environment. In order to maintain trust in carbon offsetting and to achieve the desired impact, transparency and accountability are essential.

4.6.3. Climate Consumer

In the Climate Consumer category shown in Figure 19, participants’ carbon footprints were calculated at 6.9 tons CO2e. Personal feedback emphasised the importance of reducing food waste. According to the data, 40% of all food produced ends up as waste, half of which occurs during production or distribution, and the other half during consumption. In this category, individuals could potentially decrease their carbon footprint from waste by 10% if they reduced food waste by half. Providing participants with a tangible and actionable step aligns with broader efforts to minimising environmental impacts related to food production and consumption.
Figure 20 shows there are three main areas that contribute to the 6.9 tons CO2e that Climate Consumers produce each year: home (1.3 tons), travel (3.3 tons), and consumption (2.3 tons). Based on this distribution, travel contributes the most to their carbon footprint, followed by consumption, and then home-related emissions. It has been recommended that participants should focus on areas with the greatest impact in order to achieve the most significant reductions. In order to significantly reduce travel-related emissions, for example, people should reduce their reliance on personal vehicles, opt for public transportation, carpool, or even choose more eco-friendly options.
In addition, Figure 21 shows the recommendations for participants to reduce plastic consumption that addresses the environmental impact of plastic production and disposal. Due to the fact that plastic is primarily derived from fossil fuels, and each kilogram of plastic produces 3–6 kg of CO2e emissions, reducing plastic use can significantly reduce carbon footprints. To minimise reliance on conventional plastic products, participants are encouraged to seek alternatives such as bioplastics or recycled plastics. Plastic consumption per person averages about 50 kg per year, resulting in a climate footprint of 150–300 kg per year.
In addition to offering options to offset remaining carbon footprints, the calculator included climate transition investment options. As shown in Figure 22, a solar power project in India was one example of a project that participants could get involved with for a six-pound monthly fee. Through this option, individuals can contribute to larger-scale efforts to reduce greenhouse gas emissions. People can offset their remaining emissions by participating in such offset programmes, which align their actions with global climate goals.
The results of these studies suggest that personalised feedback and recommendations provided by the calculator play an important role in guiding individuals towards more sustainable lifestyle choices. Participants are offered clear and actionable steps, such as reducing food waste, minimising plastic use, and changing travel habits. The recommendations not only generate an understanding of the environmental impact of daily activities but also empower individuals to make changes that are meaningful.
Various lifestyle choices have a cumulative effect on an individual’s carbon footprint, as demonstrated in the Climate Consumer category results. This calculator helps participants identify key areas for improvement by breaking down their carbon footprint into distinct categories. Providing customised feedback and recommendations aligns with the research objective of giving participants relevant, personalised advice.
Additionally, the option to offset remaining carbon footprints by supporting renewable energy projects, like India’s solar power initiative, emphasises the importance of collective action to tackle climate change. In addition to individual efforts, contributing to larger-scale projects can amplify the impact of smaller actions. By reducing personal emissions and supporting broader initiatives, a comprehensive strategy for climate change mitigation and adaptation can be developed.

4.6.4. Climate Villain

Those categorised as Climate Villains, as shown in Figure 23, emitted an average of 10.5 tons of CO2e per year. As a result of this designation, significant lifestyle changes are urgently needed to reduce their environmental impact. These participants received specific feedback from the calculator, emphasising the importance of generating their own electricity. As a result of producing their own electricity, participants could reduce their dependency on fossil fuels, thereby reducing their overall carbon footprint and improving their energy security. As a result of this recommendation, household emissions can be significantly reduced by using renewable energy sources, such as solar panels.
Climate Villains also recommended switching to more environmentally friendly vehicles. Transitioning to electric, plug-in hybrid, or biofuel vehicles was suggested as a practical solution, since car rides constituted a large portion of their carbon footprint. Considering the growing concerns over vehicular emissions and their contribution to global warming, this recommendation is particularly pertinent. Participants could contribute to broader climate goals by adopting cleaner transportation options.
Participants’ carbon footprints were further broken down into three categories as shown in Figure 24: housing (2.5 tons CO2e), travel (4.6 tons CO2e), and consumption (3.4 tons CO2e). Through this detailed breakdown, participants identified specific areas for improvement. As an example, participants could explore strategies to reduce their reliance on high-emission modes of transportation by focusing on travel-related emissions. Actionable recommendations included reducing purchases of clothing and gadgets by 20%, which would reduce CO2 emissions by 0.3 tons. The advice focused on the benefits of consuming less and prioritising quality over quantity for the environment. By choosing durable products over cheap, short-lived items, participants could reduce waste and reduce their carbon footprint. In line with sustainable consumption principles, this recommendation calls for a more mindful and resource-efficient lifestyle.
The calculator also offered participants options to offset their remaining carbon footprint in addition to personalised feedback and recommendations. As shown in Figure 25, one option for offsetting was to support wind power projects in India. Through monthly contributions of 12 pounds shown in Figure 26, participants can assist initiatives promoting renewable energy and accelerating the transition to a low-carbon economy. By utilising this option, not only were climate benefits generated immediately, but they also contributed to the establishment and maintenance of sustainable projects, amplifying the impact of individual efforts.
A holistic approach to sustainability is emphasised, where individuals make informed decisions across a variety of aspects of their lives, including housing, travel, and consumption. A personalised feedback mechanism proved to be an effective tool for raising awareness of individual contributions to climate change and providing practical mitigation solutions. Based on these findings, it is evident that reducing personal carbon footprints requires a combination of behavioural changes, technological adoption, and supportive policies. Climate Villains’ recommendations provide a microcosm of broader societal changes required to combat climate change. Efforts to reduce greenhouse gas emissions can be seen in the push towards renewable energy and cleaner transportation, for instance. Reduced consumption and a preference for quality over quantity are principles that align with those of the circular economy, which advocates minimization of waste and maximisation of resource efficiency. The internalisation of these principles can contribute to a sustainable and resilient environment. As a result, the options for offsetting remaining emissions emphasise the importance of collective action in tackling climate change. In addition to offsetting individual emissions, renewable energy projects contribute to the global effort to transition to a low-carbon economy.

5. Conclusions

The conclusions presented below provide a comprehensive overview of the study’s findings, with which the original aims and objectives are closely aligned. The researcher found awareness and understanding of ecological footprints among individuals, factors that influence their behaviour, barriers they face, and a readiness to adopt sustainable practices and renewable technologies. These conclusions illustrate how individual actions, when properly guided and supported, can contribute significantly to global efforts to mitigate and adapt to climate change.
  • The study’s findings on the age distribution of respondents provide concrete conclusions about how generational differences shape ecological footprints and attitudes toward climate change. The largest demographic group, participants aged 35 to 44 (49.1%), offers significant insights due to their substantial representation. This age group is likely to balance career responsibilities with family commitments, resulting in larger homes and higher energy consumption for heating, cooling, and lighting. Their established lifestyles and consumption patterns make them key contributors to understanding household energy use and sustainability challenges. These findings underscore the importance of tailoring climate action strategies to different generational needs. For instance, middle-aged adults might benefit from policies or incentives promoting energy-efficient homes, while younger and older generations might respond better to education or support for sustainable behaviours;
  • The study reveals that 67.9% of respondents worked full-time, highlighting the significant role employment status plays in shaping ecological footprints. Full-time employment, associated with steady incomes and established consumption patterns, enables individuals to engage in higher levels of consumption, such as frequent use of personal vehicles, increased energy demands for larger homes, and higher purchasing power for goods and services. These behaviours collectively contribute to larger ecological footprints. However, this demographic also possesses the financial capacity to adopt sustainable practices, such as investing in renewable energy, energy-efficient appliances, or electric vehicles, which could mitigate their environmental impact. These findings underline the importance of tailoring climate action strategies to accommodate different employment statuses. For example, policies targeting full-time workers could focus on incentivising the adoption of low-carbon technologies and sustainable transportation options, leveraging their financial stability. At the same time, providing accessible and affordable eco-friendly solutions for part-time or unemployed individuals could ensure inclusivity in climate mitigation efforts. By reflecting on the interplay between employment status, income, and lifestyle choices, the study establishes a robust foundation for understanding and addressing the complex drivers of ecological footprints;
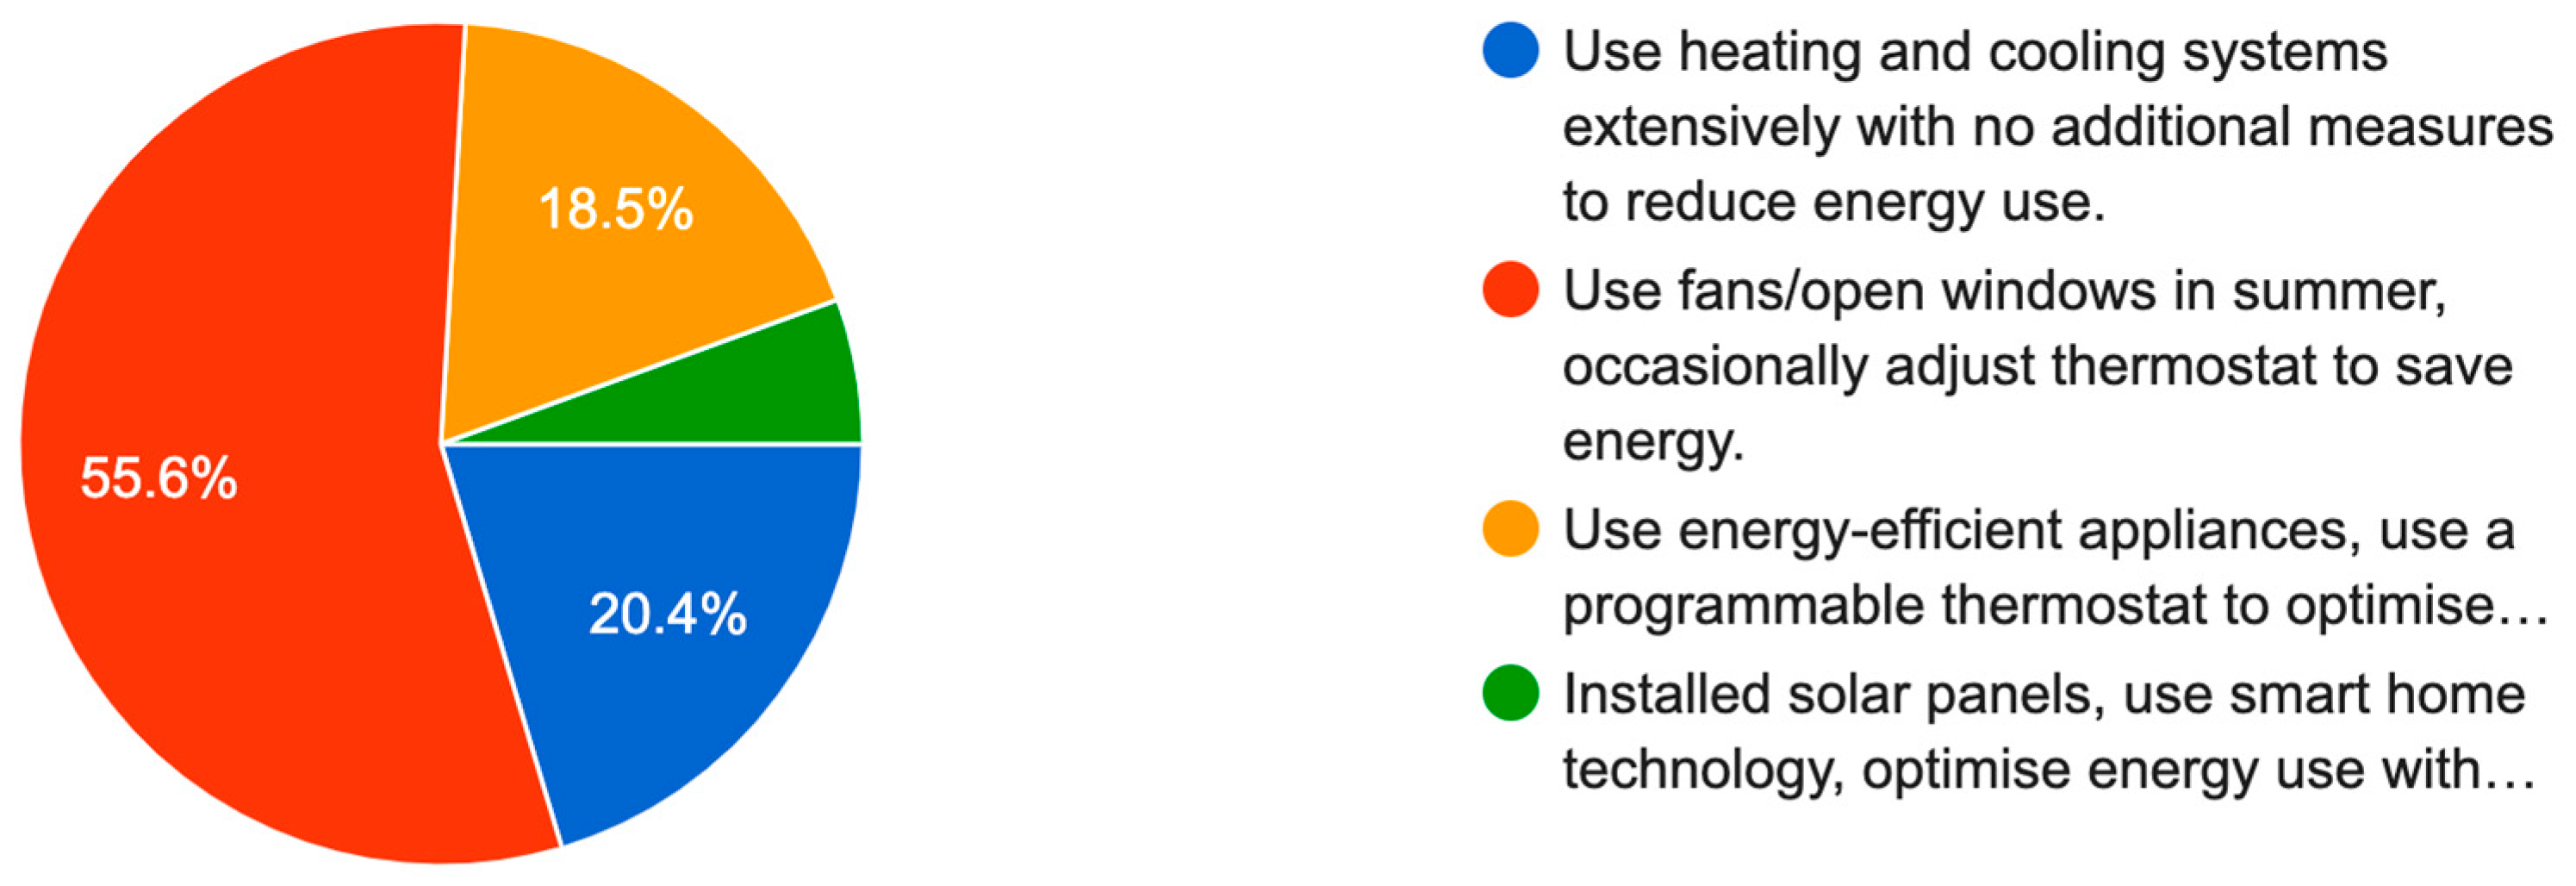
  • The study highlights a small but significant portion of participants who have adopted advanced energy-saving technologies such as solar panels and smart home systems. These participants likely represent early adopters of innovative solutions that optimise energy consumption and contribute to long-term sustainability. Their engagement serves as a benchmark for broader adoption across diverse socioeconomic groups. These findings underscore the need for comprehensive policies to promote sustainable energy practices. Financial incentives and subsidies for solar panels, programmable thermostats, and smart home technologies could make these innovations more accessible to a broader population.
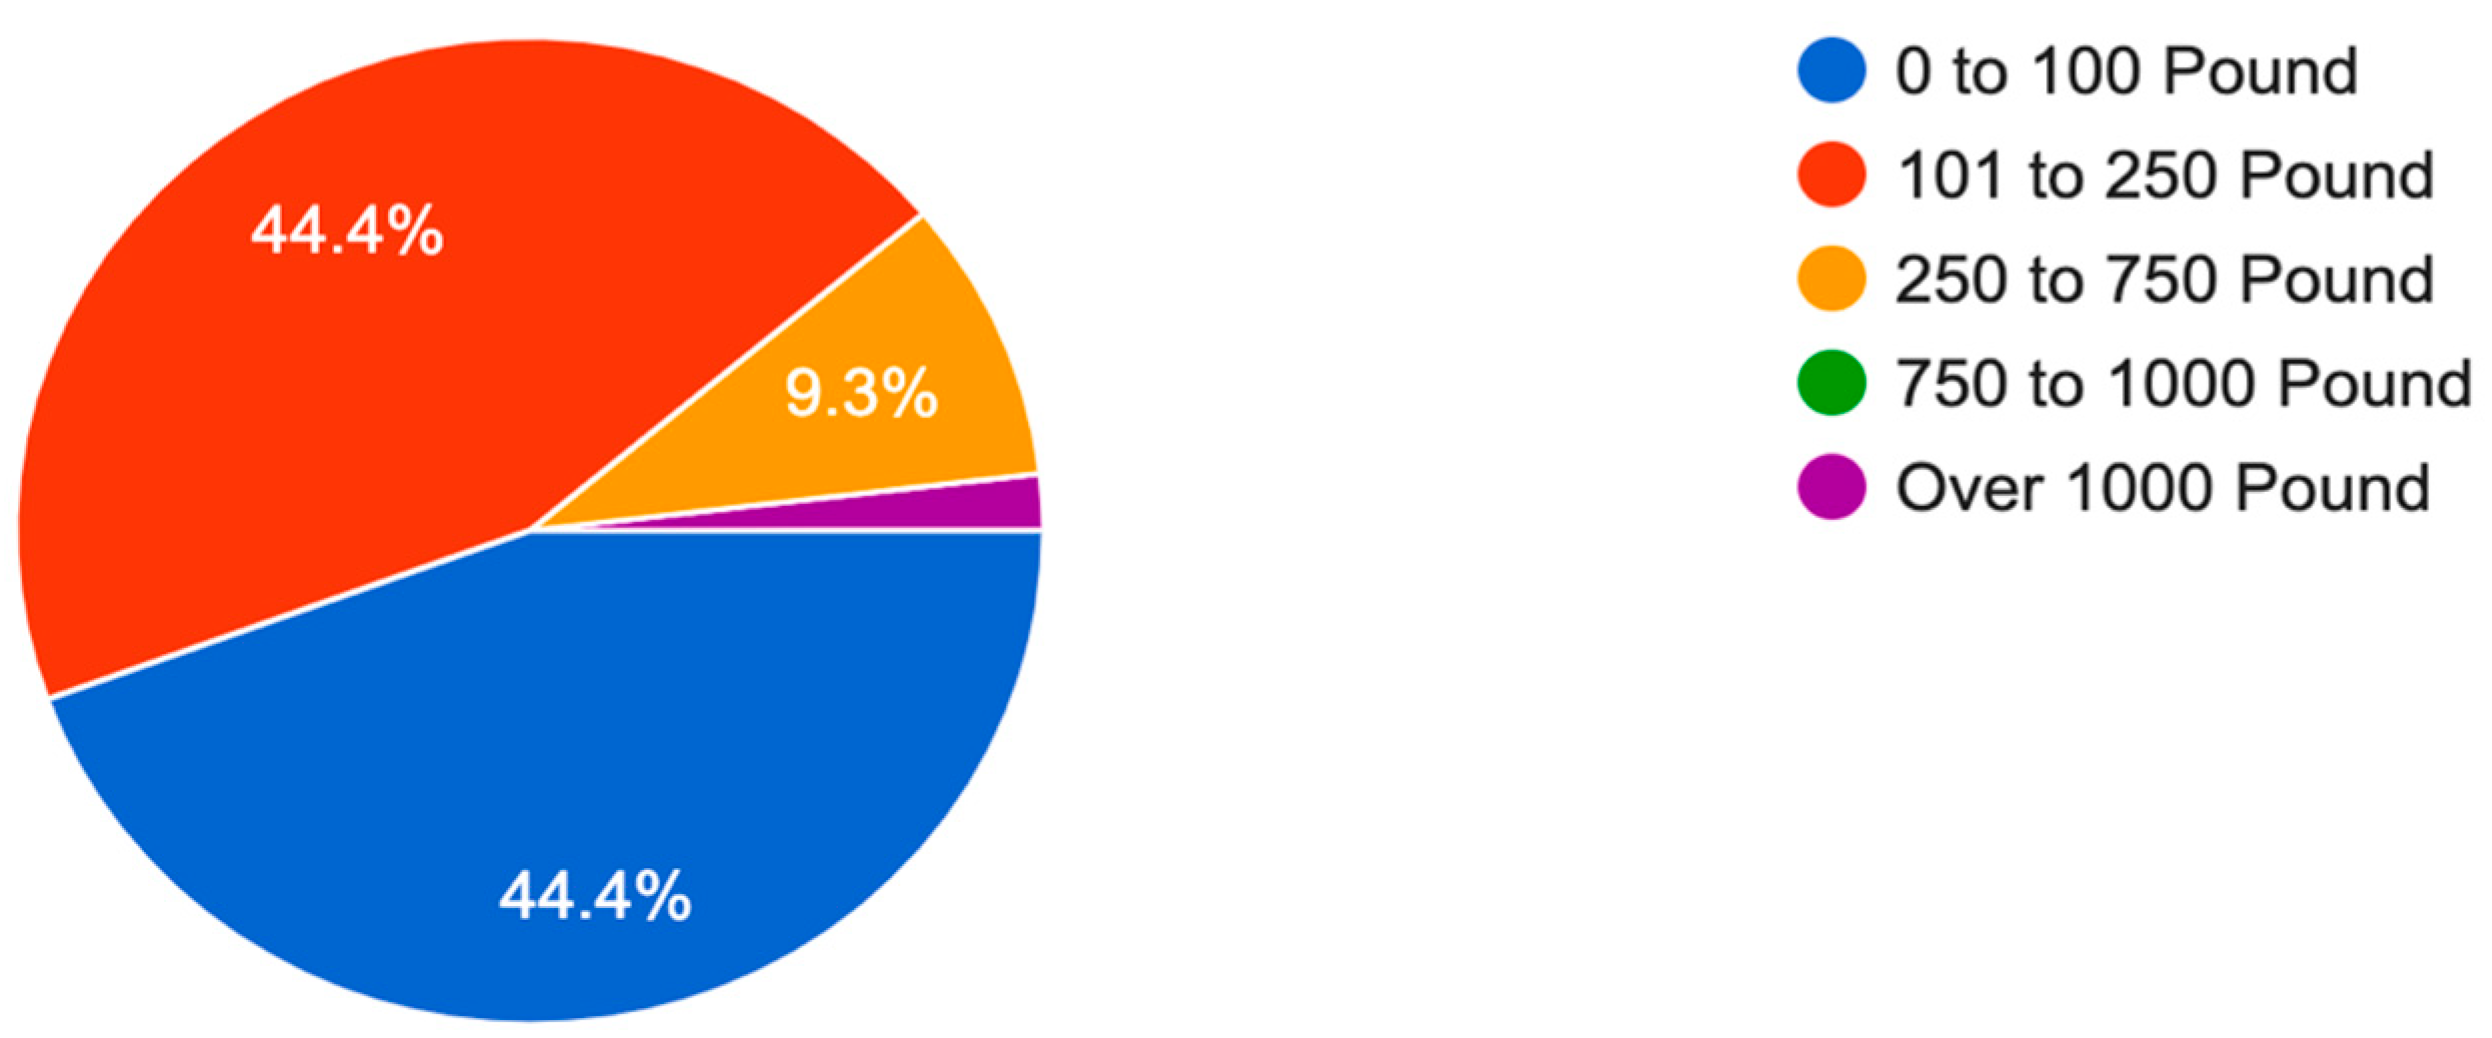
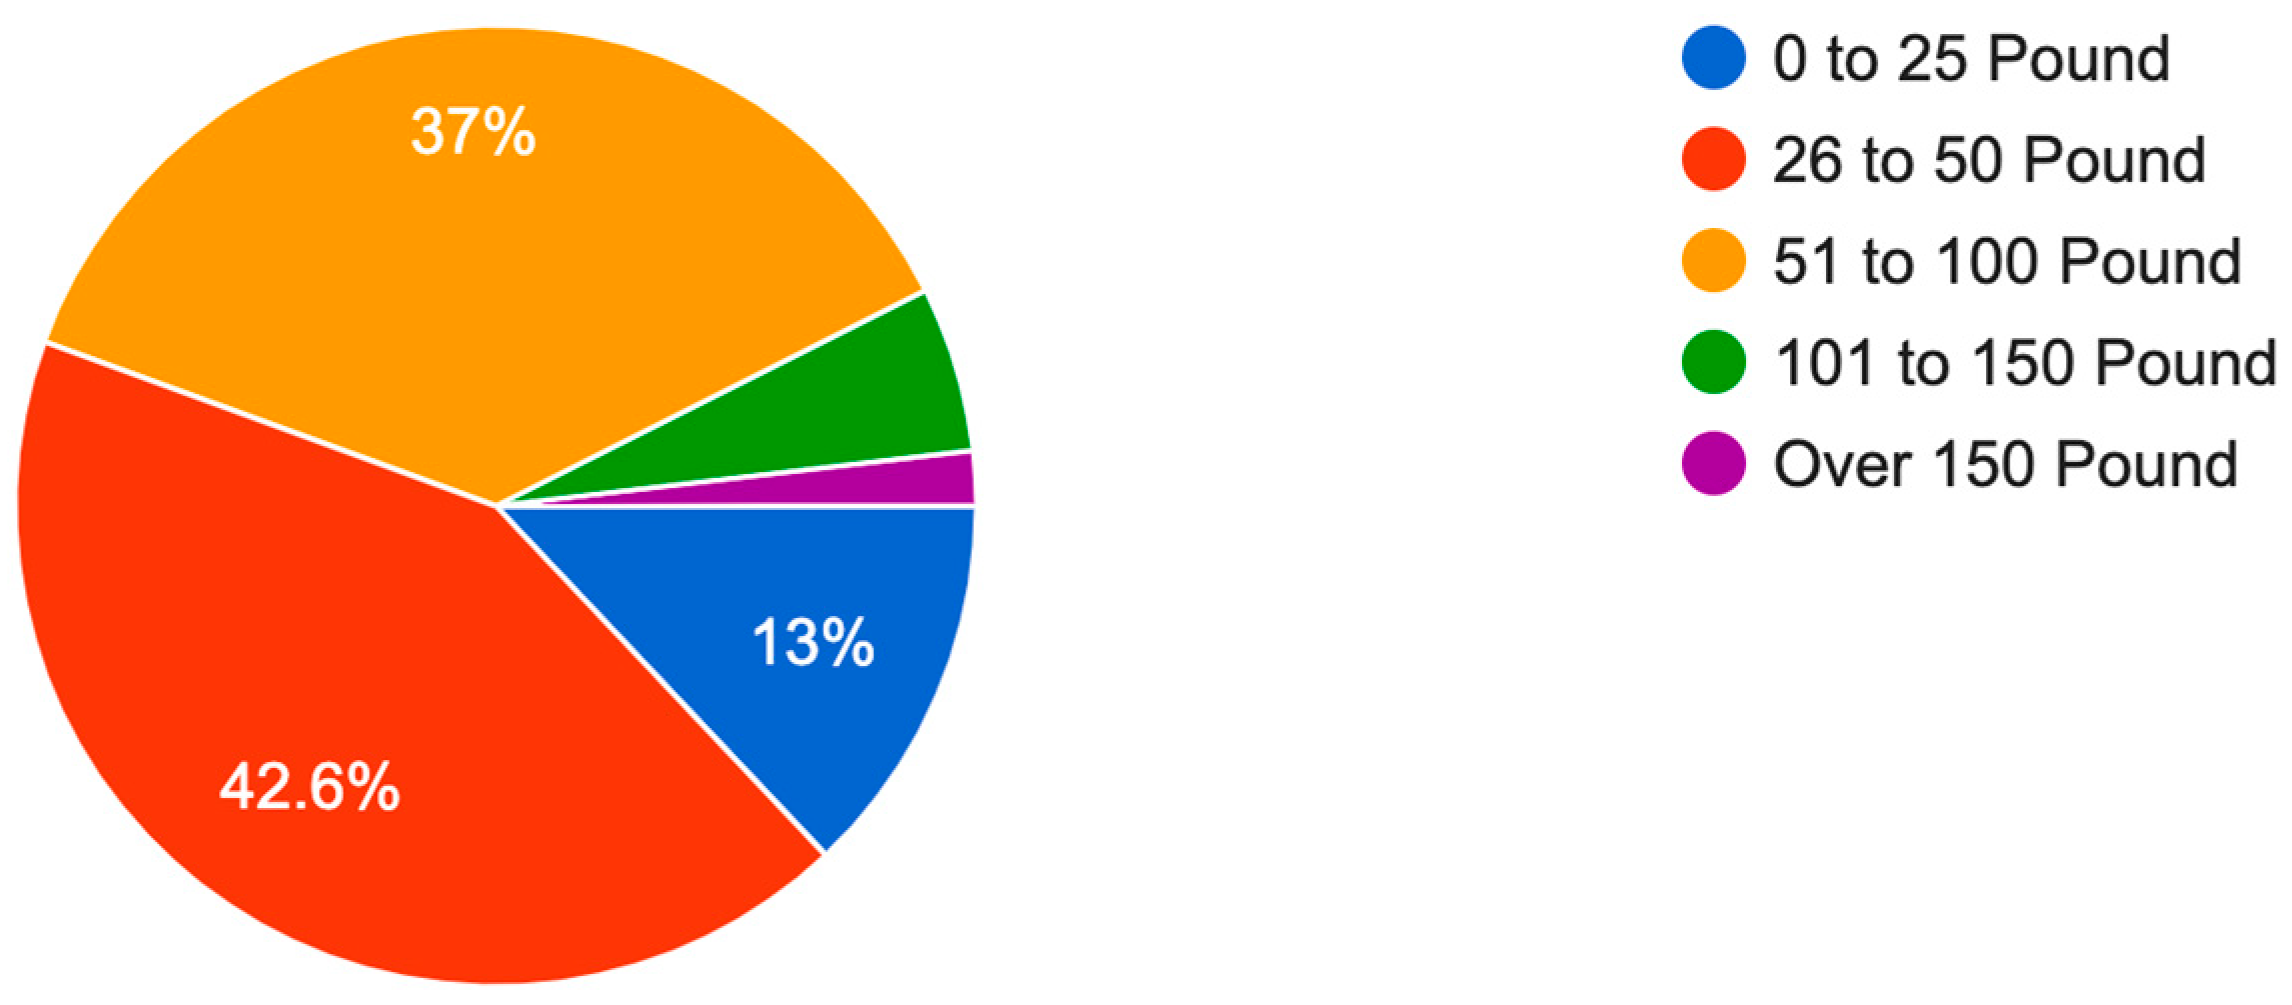
  • The study reveals that while most participants demonstrate some level of awareness regarding water conservation, there remains significant variation in the extent of their proactive efforts. However, only 16.4% adopt advanced measures like installing low-flow fixtures, and a mere 1.8% practice comprehensive strategies such as using rain barrels and water-efficient landscaping. Economic and household factors appear to influence water consumption patterns significantly. Households with higher water bills may reflect inefficient practices or larger family sizes, while smaller households or those with lower water usage may naturally have reduced bills. However, the low adoption rate of comprehensive conservation practices underscores the need for targeted interventions. Awareness campaigns could focus on empowering individuals with actionable knowledge, such as fixing leaks and adopting water-saving landscaping techniques. Economic incentives, like tiered water pricing, could further encourage conservation by increasing the financial benefits of reducing consumption. Community-level programmes such as rain barrel workshops or demonstration gardens could provide practical examples of advanced conservation methods, inspiring broader participation. These findings suggest that addressing both behavioural and systemic barriers is critical to fostering widespread adoption of water-saving practices. By implementing a multi-pronged strategy that includes education, economic incentives, and technological innovation, significant strides can be made toward sustainable water consumption practices;
  • The study revealed that 65.4% of participants preferred car usage over other modes of transportation, reflecting a heavy dependency on private vehicles. The relatively low adoption of public transportation suggests that current systems may not adequately meet the needs of the population. Issues such as infrequent schedules, overcrowding, safety concerns, and poor accessibility undermine the appeal of buses, trains, and subways. Similarly, the limited use of bicycles and walking can be attributed to factors such as insufficient infrastructure (bike lanes and pedestrian pathways), perceived inconvenience, and potential climate-related barriers. These challenges highlight the intersection of urban planning, societal behaviours, and infrastructure limitations in shaping transportation choices. From a sustainability perspective, the high reliance on cars is a significant concern due to their carbon emissions and environmental impact. Shifting towards more sustainable modes of transportation, such as public transit, walking, or cycling, requires addressing both systemic barriers and behavioural preferences. Cities with well-developed and reliable public transportation systems, such as London and New York, demonstrate higher public transit usage, underscoring the importance of infrastructure investments in influencing behaviour. Similarly, cities like Amsterdam and Copenhagen, with extensive bike lane networks and pedestrian-friendly urban designs, highlight how infrastructure improvements can promote active transportation. To address these issues, policymakers and urban planners should adopt a multifaceted approach. Investments in expanding and improving public transportation systems, such as increasing service coverage, frequency, and safety are critical. Promoting active transportation modes like walking and cycling through dedicated infrastructure and addressing safety concerns can also encourage broader adoption. Additionally, targeted incentives, such as subsidies for public transit passes, tax breaks for bicycle purchases, or congestion charges in urban centers, can help shift preferences away from car usage. Environmental education campaigns can further support these efforts by fostering awareness about the ecological and health benefits of sustainable transportation. Special consideration must also be given to affordability and accessibility, ensuring that public transit systems meet the diverse needs of all population segments, including individuals with disabilities or lower-income households;
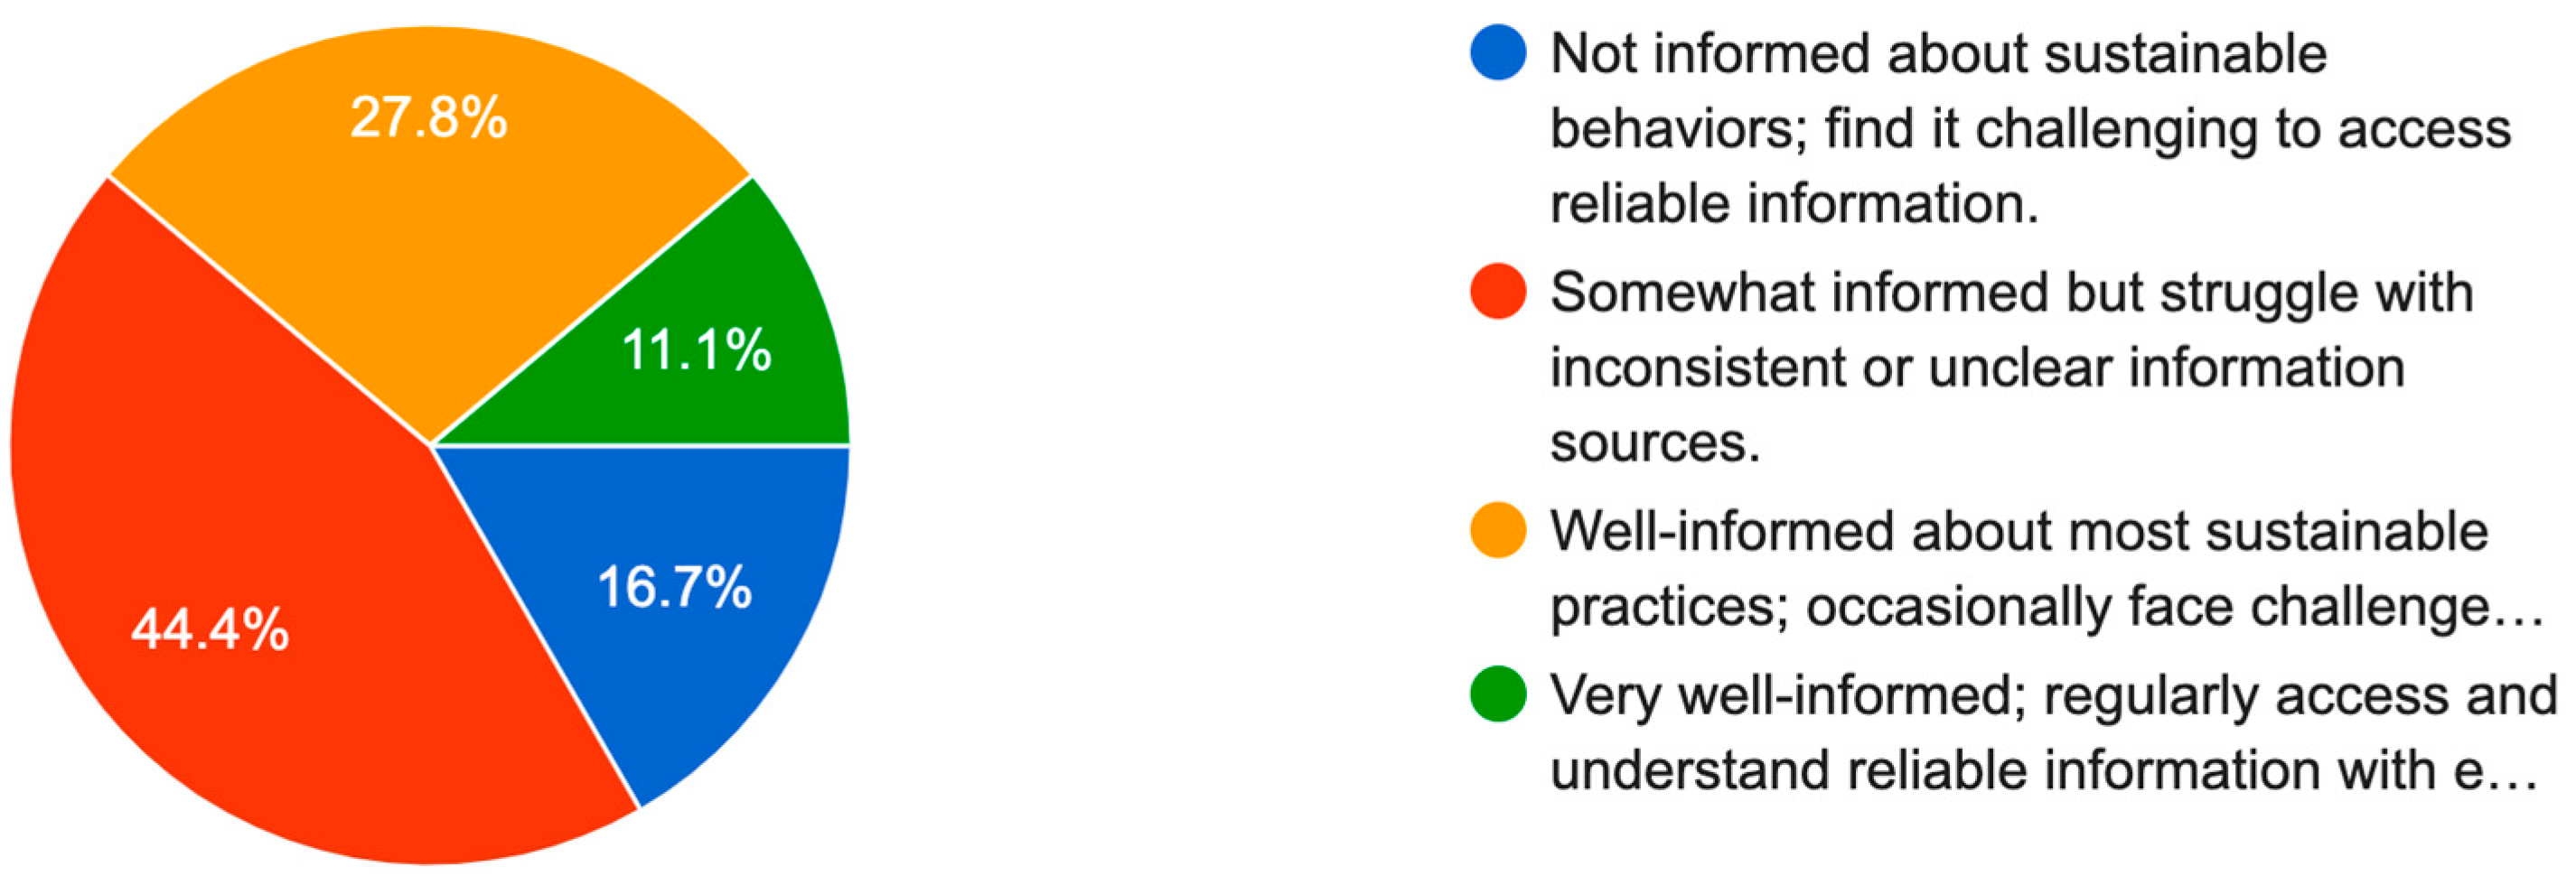
  • The survey findings reveal that 16.7% of participants are uninformed about sustainable behaviours and struggle to access reliable information, highlighting a significant barrier to adopting sustainable practices. This lack of foundational knowledge, coupled with difficulty in accessing accurate and consistent information, underscores the need for a more robust approach to education and information dissemination. For those with some awareness but limited access to trustworthy sources, the confusion caused by conflicting messages exacerbates the challenge, preventing informed decision-making and action. Additionally, even individuals who are relatively well-informed face difficulties staying up to date with evolving sustainability practices, indicating the need for continuous education and periodic updates. To address these challenges, educational initiatives must be tailored to different awareness levels, ensuring that those who are uninformed receive basic knowledge, while others receive updated, reliable information. Collaboration between educators, environmental organisations, and other stakeholders is crucial to creating a coherent, accessible information environment that promotes clarity and consistency across platforms, ultimately fostering greater adoption of sustainable behaviours;
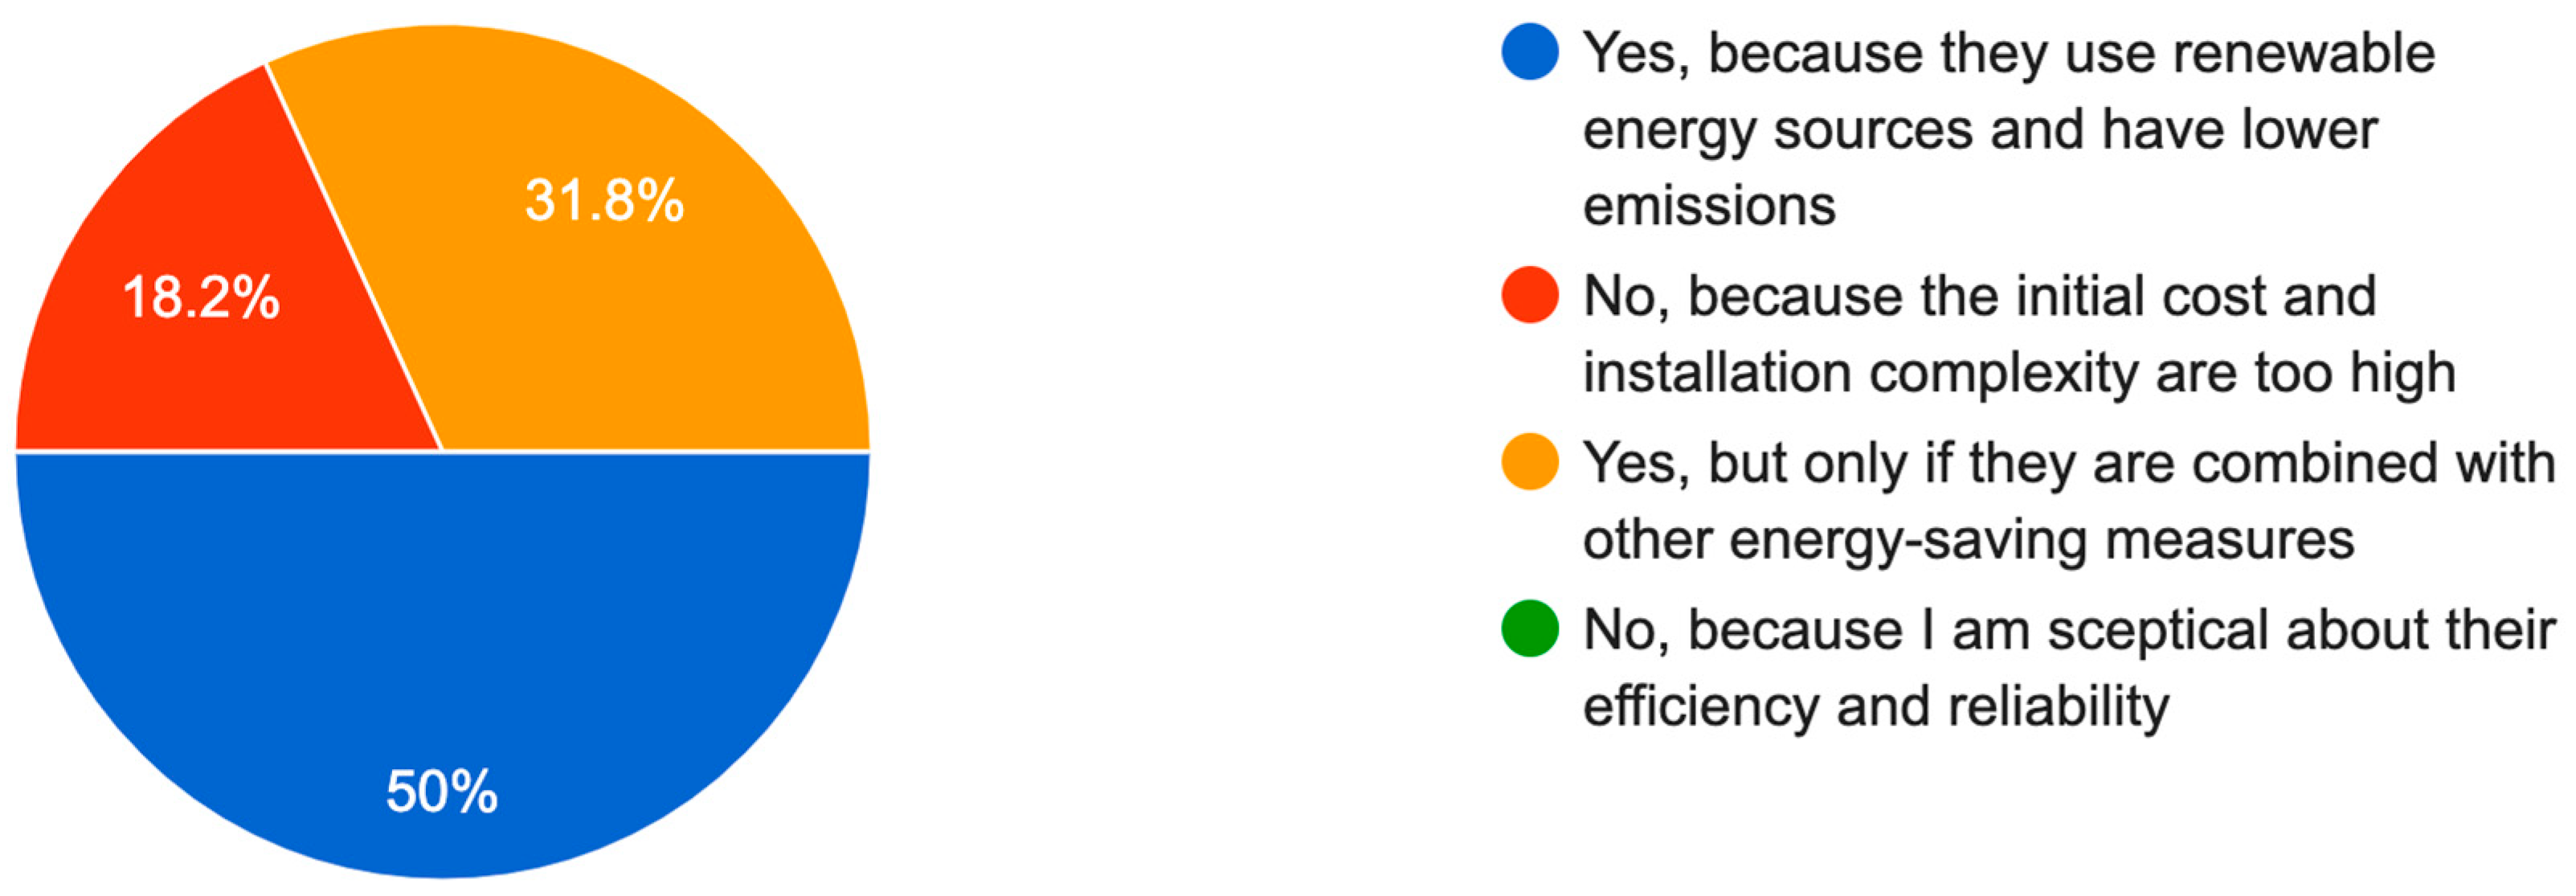
  • The survey results reveal a clear and widespread acceptance of renewable energy technologies, with no participants expressing scepticism about their efficiency or reliability. This indicates that the primary challenge to the adoption of renewable energy does not stem from doubts about their efficacy, but rather from practical and economic barriers. The lack of scepticism towards renewable energy underscores the success of awareness campaigns and technological advancements in shaping public perceptions. However, it also points to the fact that overcoming the practical and economic barriers to adoption remains the key challenge. To accelerate the transition to renewable energy, it is crucial to address the affordability and accessibility issues through targeted policies, financial support, and continuous public education. By focusing on these areas, the widespread acceptance of renewable energy can be translated into broader adoption, helping to reduce carbon footprints and foster a culture of sustainability;
  • The survey reveals a concerning gap in the public’s familiarity with renewable energy technologies, with 40.9% of participants reporting only slight familiarity or none at all. This highlights a significant barrier to the widespread adoption of renewable energy, suggesting that many individuals are either unaware of the technologies or lack the knowledge necessary to engage with them meaningfully. Several factors may contribute to this lack of familiarity, including an inadequate education system, limited media coverage, and the perception that renewable energy solutions are too complex or expensive to implement. Additionally, the lack of consistent and comprehensive media coverage around renewable energy advancements may contribute to the public’s limited exposure to these technologies. As a result, many individuals might view renewable energy as too technical or costly, reinforcing misconceptions and discouraging adoption. To address these challenges, integrating renewable energy education into school curricula and community programmes is crucial. By introducing renewable energy concepts early and providing continuous education, individuals may become more familiar with the practical and economic benefits of these technologies;
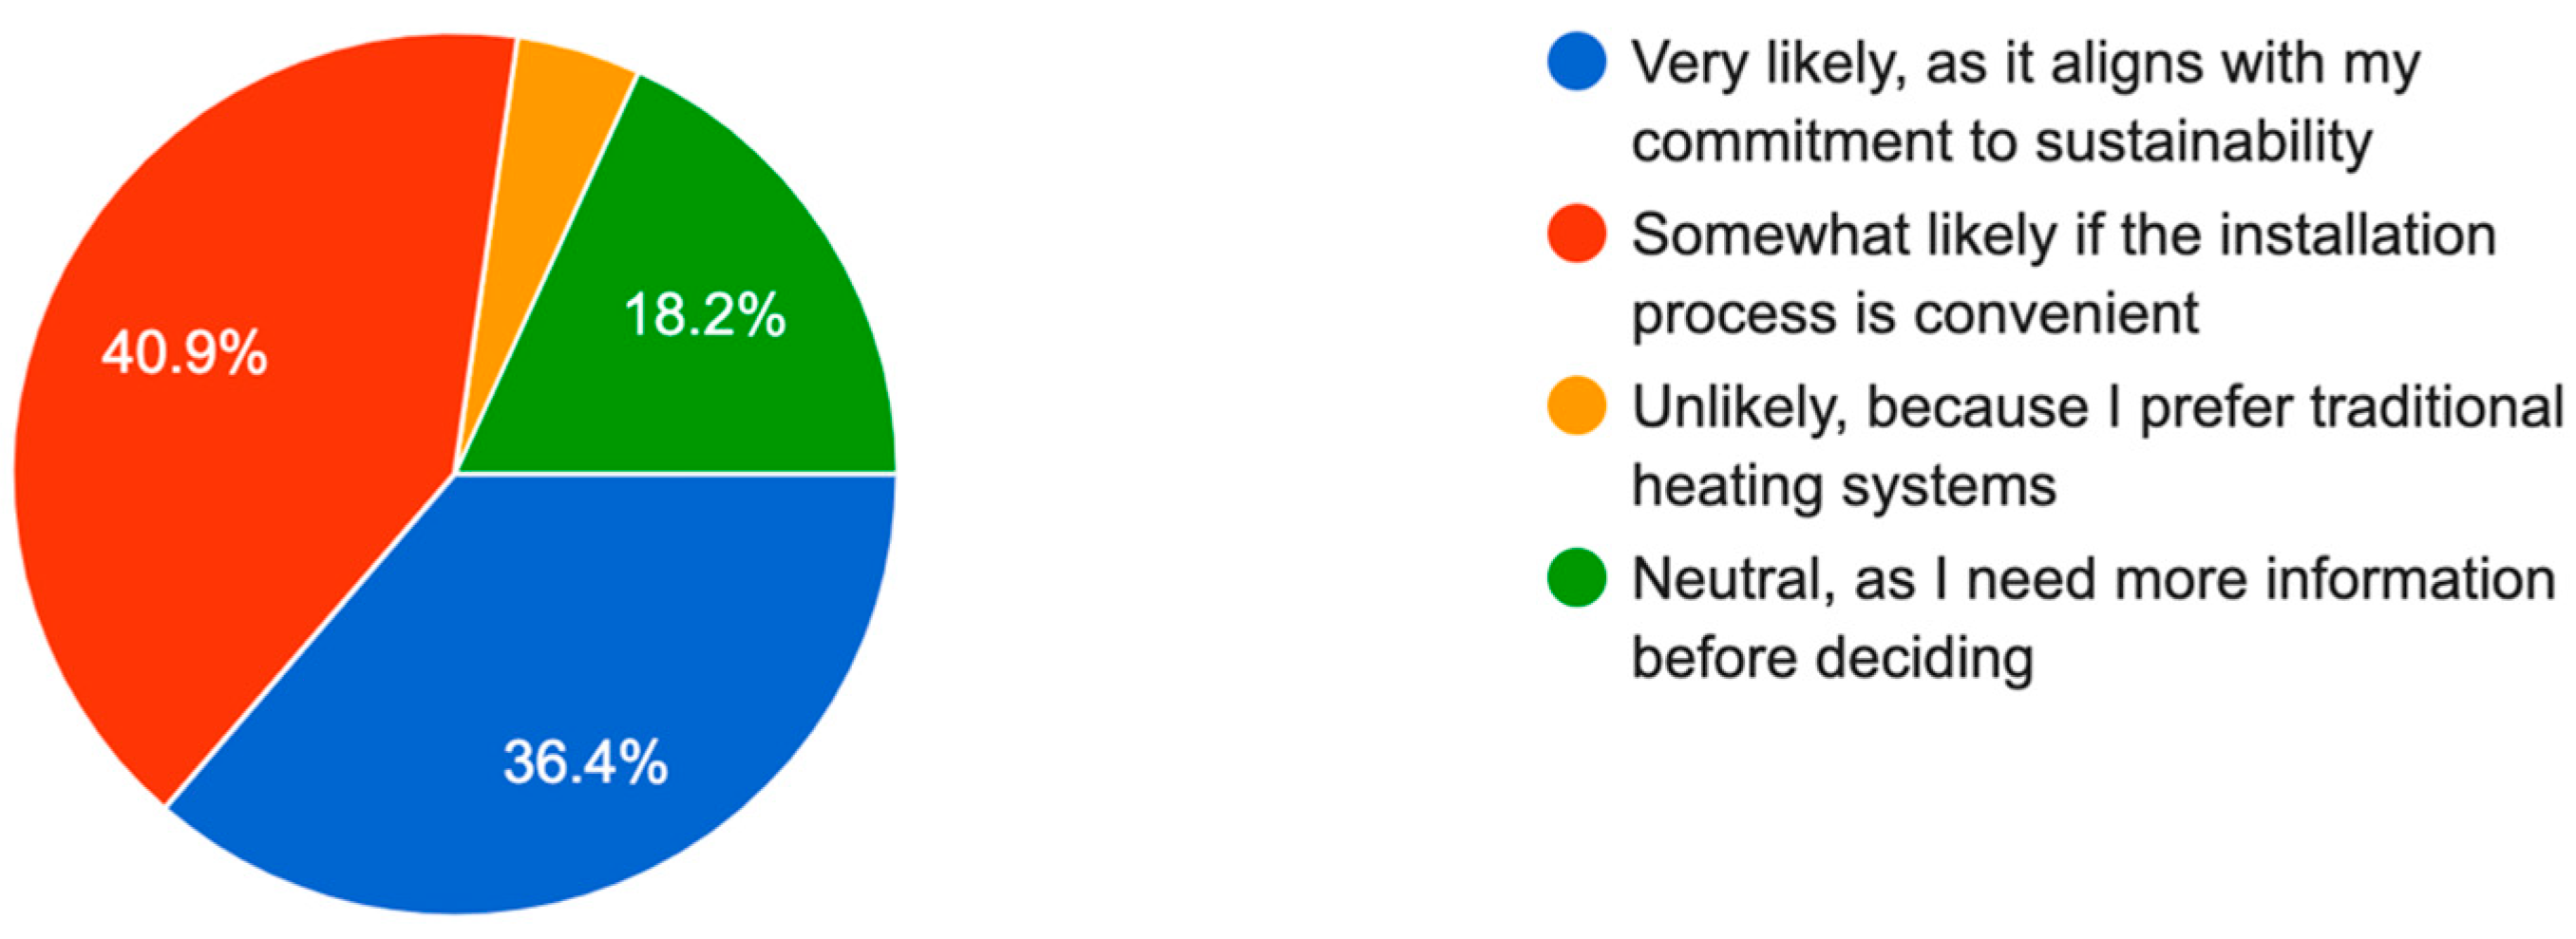
  • The 4.5% of participants who prefer traditional heating systems and are unlikely to adopt new technologies represent a small but significant group resistant to change. Overcoming their reluctance would require targeted strategies, such as demonstrating tangible benefits like cost savings, efficiency, and environmental impact. However, the cost-effectiveness of such efforts should be critically evaluated given their small size. For instance, intensive educational campaigns or tailored incentives might yield low returns on investment if these individuals remain entrenched in their preferences. The likelihood of success depends on addressing deeply rooted barriers such as scepticism, comfort with existing systems, and perceived risks associated with new technologies. While this group’s adoption would contribute incrementally to climate change mitigation, the broader impact might be marginal compared to the efforts required to convince them. Given the strong commitment of 36.4% of participants already willing to adopt sustainable technologies and the openness of the 40.9% who prioritise practicality, focusing resources on these more receptive groups may deliver greater environmental benefits. Thus, while targeted measures could be considered for this resistant minority, they should not detract from broader initiatives aimed at groups with higher adoption potential.
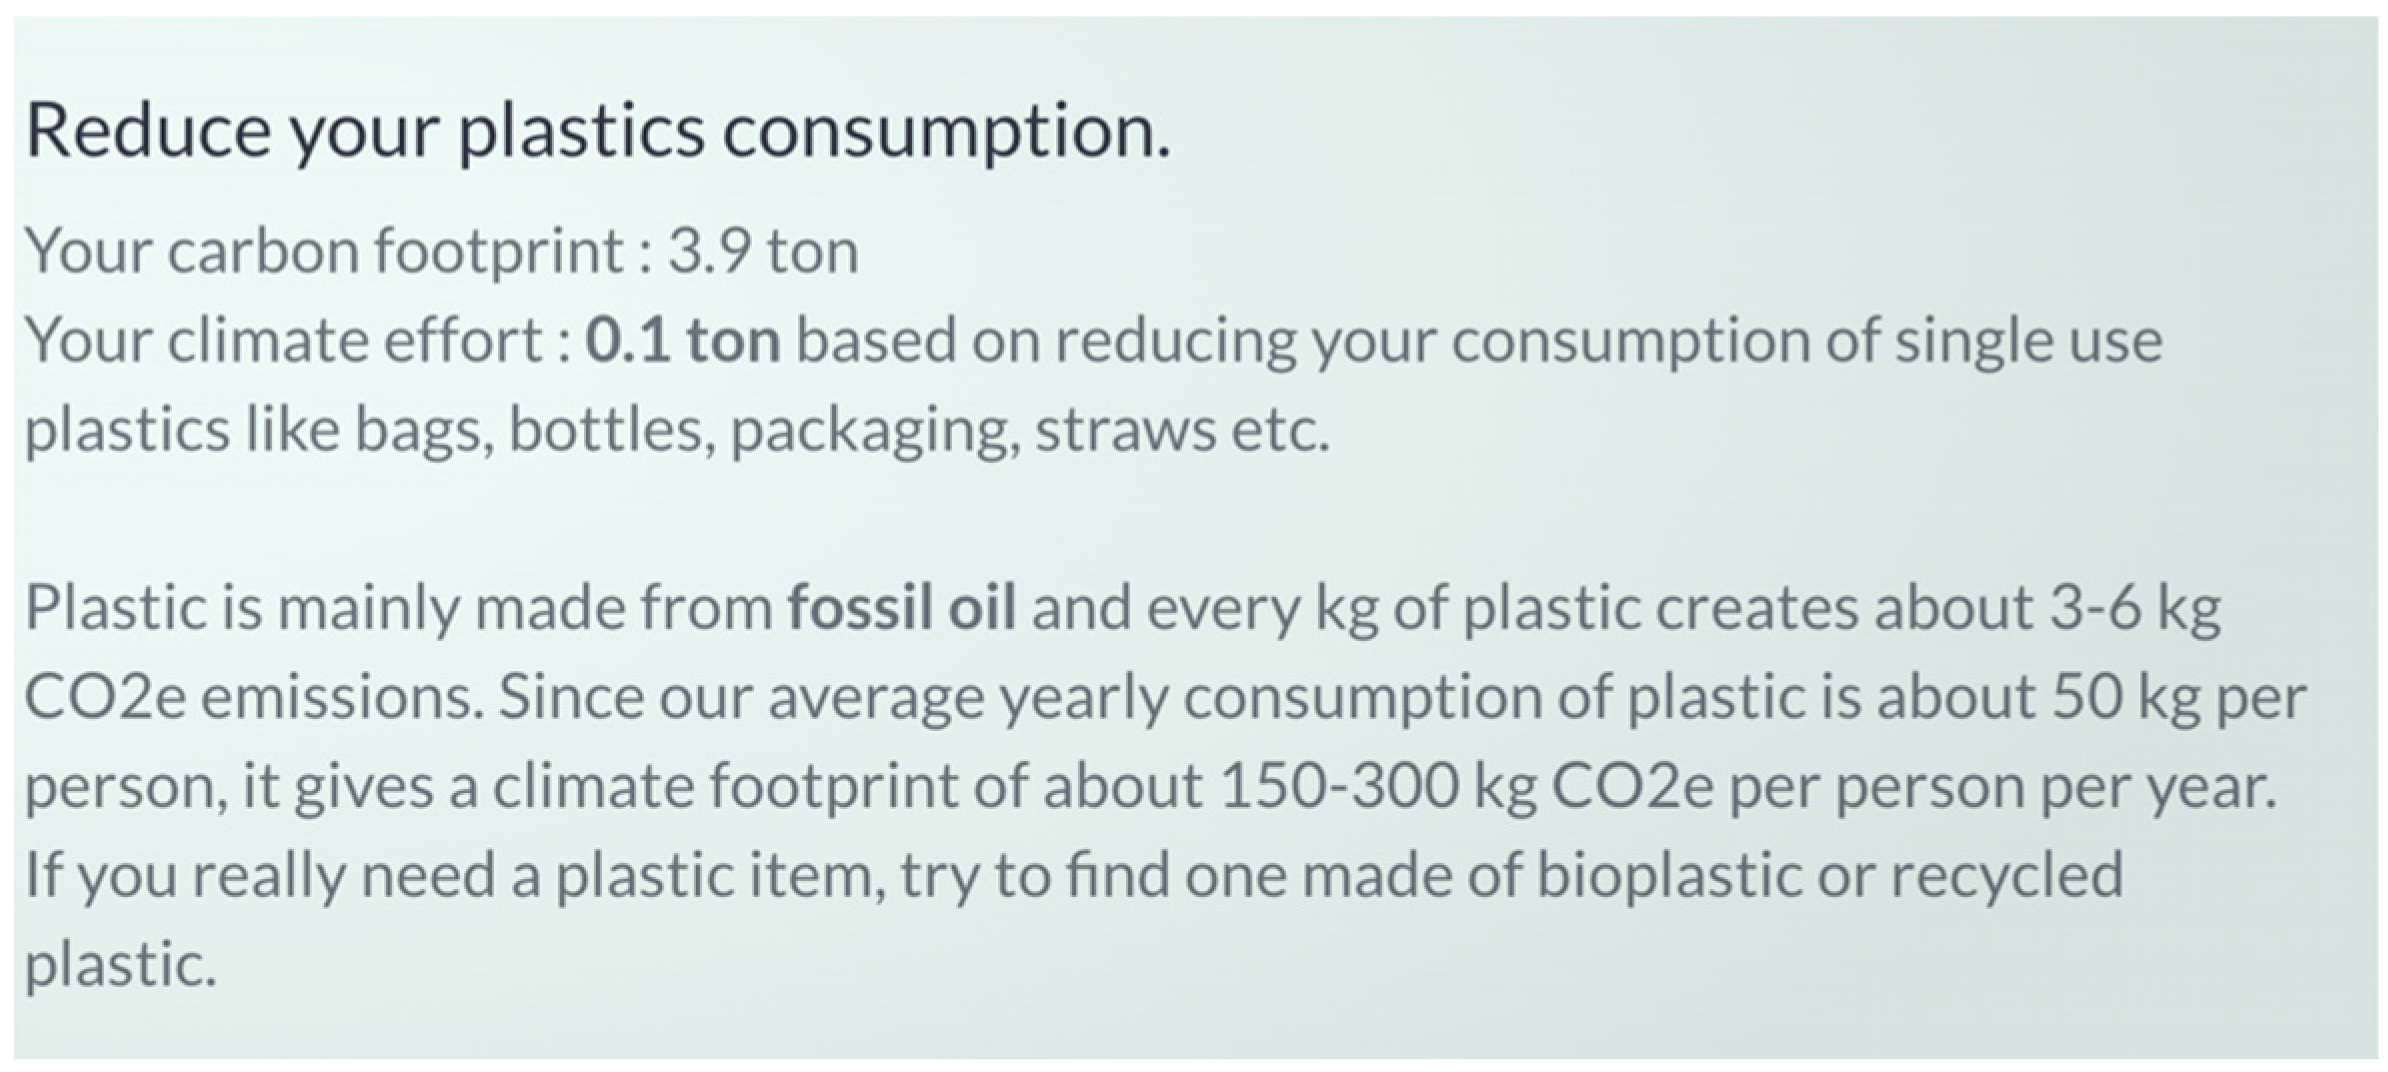
  • It is evident that the calculator’s personalised feedback and recommendations play an imperative role in guiding individuals towards more sustainable lifestyle choices. Participants were given clear and actionable steps to reduce food waste, minimise plastic use, and change their travel habits.

5.1. Limitations

This study aimed to conduct a comprehensive survey and interview on perceptions and behaviours related to ecological footprints across a distinct cultural and economic context of the United Kingdom. This would reveal how national contexts influence people’s perception and response to environmental challenges. During the research, a significant limitation was identified. Researchers cannot travel abroad for research purposes unless they are officially sanctioned by the university. Because of this restriction, the researcher was unable to conduct the in-person surveys and fieldwork that were vital to gathering the necessary data for the comparative analysis. Therefore, the research was limited to a single location.
The small sample size of 83 participants was a limitation of this study, influenced by the anonymous nature of the survey, which made it impossible to track or enforce responses, and the time constraints associated with report submission. Although the survey was distributed through multiple channels, such as university email lists reaching over 200 individuals, only 83 responses were received. This limited sample could constrain the findings but still provides valuable insights into individual ecological footprints and behaviours. The employment status breakdown reveals that only 7.5% of respondents were unemployed, suggesting limited representation of this demographic. While addressing climate change may rank lower on the priority list for unemployed individuals due to economic constraints, the study’s methodology did not specifically explore correlations between employment status and being a “climate villain”.

5.2. Recommendations

The researcher recommends that future studies prioritise obtaining permissions and official support for international fieldwork. It would be particularly valuable to examine how different levels of economic development, cultural practices, and environmental policies affect individual ecological footprints.
Moreover, future work should broaden the scope of the research to include a more diverse range of countries, both developed and developing. This would allow a more comprehensive understanding of how environmental behaviours differ based on social context.
In addition, the researcher suggests that future studies with larger, more diverse samples and targeted analysis of employment status could better assess such correlations between employment status and being a climate villain. Furthermore, future studies should combine quantitative surveys with qualitative interviews or focus groups. It would provide context to the statistical data collected by exploring the reasons behind individuals’ ecological behaviours. In-depth interviews can reveal the underlying motivations, barriers, and cultural factors that shape people’s perceptions and actions regarding environmental issues. Taking this approach would enhance the results of the research and provide a more holistic understanding of ecological footprints.

Author Contributions

Conceptualization, A.A. and M.A.; methodology, A.A., M.A. and L.B.; software, A.A., M.A. and A.A.B.; formal analysis, A.A.; investigation, A.A.; data curation, A.A.; supervision, M.A., A.A.B. and L.B.; writing—original draft preparation, A.A.; writing—review and editing, A.A., M.A., A.A.B. and L.B. All authors have read and agreed to the published version of the manuscript.

Funding

This research received no specific grant from any funding agency.

Institutional Review Board Statement

The study was conducted in accordance with the Declaration of Helsinki, and approved by the Institutional Review Board (Ethics Committee) of Liverpool John Moores University (protocol code: PGT/22/744 and date of approval: 26 June 2024).

Informed Consent Statement

Informed consent was obtained from all subjects involved in the study.

Data Availability Statement

The original contributions presented in this study are included in the article material. Further inquiries can be directed to the corresponding author.

Conflicts of Interest

The authors declare no conflict of interest.

References

  1. Baus, D. Overpopulation and the Impact on the Environment. Master’s Thesis, The Graduate Centre, City University of New York, New York, NY, USA, 2017. Available online: https://academicworks.cuny.edu/cgi/viewcontent.cgi?article=2929&context=gc_etds (accessed on 30 July 2024).
  2. Zhai, J.; Han, B.; Li, H.; Ren, W.; Xue, B. Accounting for the nitrogen footprint of food production in Chinese provinces during 1998–2018. J. Clean. Prod. 2023, 389, 136011. [Google Scholar] [CrossRef]
  3. Lian, M. The impact of cleaner energy sources, advanced technology firms, and economic expansion on ecological footprints is critical in sustainable development. Heliyon 2024, 10, e31100. [Google Scholar] [CrossRef] [PubMed]
  4. Klugesherz, J.; Sanderson, M. Good for the soil, but good for the farmer? Addiction and recovery in transitions to regenerative agriculture. J. Rural. Stud. 2023, 103, 103123. [Google Scholar] [CrossRef]
  5. Wang, L.; Li, L.; Cheng, K.; Pan, G. A Comprehensive evaluation of environmental footprints of regional crop production: A case study of Chizhou City, China. Ecol. Econ. 2019, 164, 106360. [Google Scholar] [CrossRef]
  6. Furumai, H. Rainwater and reclaimed wastewater for sustainable urban water use. Phys. Chem. Earth Parts A/B/C 2008, 33, 340–346. [Google Scholar] [CrossRef]
  7. Wackernagel, M.; Rees, W. Our Ecological Footprint: Reducing Human Impact on the Earth; New Society Publishers: Gabriola Island, BC, Canada, 1999. [Google Scholar] [CrossRef]
  8. Kibria, G. Ecological Footprint in Bangladesh: Identifying the Intensity of Economic Complexity and Natural Resources. Heliyon 2023, 9, e14747. [Google Scholar] [CrossRef] [PubMed]
  9. ClimateHero. Ecological Footprint Calculator. 2022. Available online: https://ecological-footprint-calculator.climatehero.org/ (accessed on 17 July 2024).
  10. WWF. Living Planet Report. Bending the Curve of Biodiversity Loss. 2020. Available online: https://livingplanet.panda.org/en-us/ (accessed on 16 August 2024).
  11. Rees, W. Ecological Footprint, Concept of. In Elsevier Reference Collection in Life Sciences; University of British Columbia: Vancouver, BC, Canada, 2017. [Google Scholar] [CrossRef]
  12. Carmona, P.; Stef, N.; Jabeur, S.; Zaied, Y. Climate change and government policy: Fresh insights from complexity theory. J. Environ. Manag. 2023, 338, 117831. Available online: https://www.sciencedirect.com/science/article/pii/S0301479723006199 (accessed on 20 July 2024). [CrossRef] [PubMed]
  13. Walsh, C.; McLoone, A.; Oregan, B.; Moles, R. The application of the ecological footprint in two Irish urban areas: Limerick and Belfast. Ir. Geogr. 2006, 39, 1–21. Available online: https://www.tandfonline.com/doi/abs/10.1080/00750770609555863 (accessed on 18 July 2024). [CrossRef]
  14. Balsalobre, D.; Nur, T.; Topaloglu, E.; Evcimen, C. Assessing the impact of the economic complexity on the ecological footprint in G7 countries: Fresh evidence under human development and energy innovation processes. Gondwana Res. 2024, 127, 226–245. Available online: https://www.sciencedirect.com/science/article/pii/S1342937X23000941 (accessed on 20 July 2024). [CrossRef]
  15. Chenet, H. Climate change and biodiversity loss: New territories for financial authorities. Curr. Opin. Environ. Sustain. 2024, 68, 101449. Available online: https://www.sciencedirect.com/science/article/pii/S1877343524000368 (accessed on 22 July 2024). [CrossRef]
  16. National Geographic. Newsroom. The Global Impacts of Habitat Destruction. 2019. Available online: https://news.nationalgeographic.org/the-global-impacts-of-habitat-destruction/ (accessed on 22 July 2024).
  17. National Wildlife Federation. Overexploitation. Wildlife at Risk. 2008. Available online: https://www.nwf.org/Educational-Resources/Wildlife-Guide/Threats-to-Wildlife/Overexploitation (accessed on 24 July 2024).
  18. Rosa, L. Defenders of Wildlife. Pollution, One of the Five Drivers of Biodiversity Loss. 2022. Available online: https://defenders.org/blog/2022/12/pollution-one-of-five-drivers-of-biodiversity-loss (accessed on 24 July 2024).
  19. Opoku, E.; Boachie, M. Energy Policy Environmental Impact of Industrialization and Foreign Direct Investment. 2022. Available online: https://www.sciencedirect.com/science/article/abs/pii/S0301421519307645 (accessed on 25 July 2024).
  20. Peterson, J.; Volder, A. The Urban Physical Environment: Temperature and Urban Heat Islands. Urban Ecosyst. Ecol. 2010, 55, 29–56. [Google Scholar] [CrossRef]
  21. United Nations. Paris Agreement. 2015. Available online: https://unfccc.int/process-and-meetings/the-paris-agreement/the-paris-agreement (accessed on 30 July 2024).
  22. Centre for Climate and Energy Solution. Carbon Prising. Carbon Tax Basics. 2024. Available online: https://www.c2es.org/content/carbon-tax-basics/ (accessed on 1 August 2024).
  23. Andersson, F. Economic inequality and the ecological footprint: Time-varying estimates for four developed economies, 1962–2021. Ecol. Econ. 2024, 220, 108185. Available online: https://www.sciencedirect.com/science/article/pii/S092180092400082X (accessed on 10 August 2024). [CrossRef]
  24. Angelo, C.; Gloinson, E.; Draper, A.; Guthrie, S. Rand Europe. In Food Consumption in the UK; RAND: Santa Monica, CA, USA, 2020; Available online: https://www.rand.org/pubs/research_reports/RR4379.html (accessed on 10 August 2024).
  25. Holmes, G.; Hay, R.; Davies, E.; Hill, J.; Barrett, J.; Style, D.; Vause, E.; Brown, K. Committee on Climate Change UK Housing: Fit for the Future? 2019. Available online: https://www.theccc.org.uk/wp-content/uploads/2019/02/UK-housing-Fit-for-the-future-CCC-2019.pdf (accessed on 10 August 2024).
  26. BBC. Smart Guide to Climate Change. How Our Daily Travel Harms the Planet. 2020. Available online: https://www.bbc.com/future/article/20200317-climate-change-cut-carbon-emissions-from-your-commute (accessed on 10 August 2024).
  27. Google Forms Get Insights Quickly, with Google Forms. 2008. Available online: https://www.google.com/forms/about/ (accessed on 22 August 2024).
  28. Bunge, A.C.; Mazac, R.; Clark, M.; Wood, A.; Gordon, L. Sustainability benefits of transitioning from current diets to plant-based alternatives or whole-food diets in Sweden. Nat. Commun. 2024, 15, 951. [Google Scholar] [CrossRef] [PubMed]
Figure 1. Percentage breakdown of participant age groups.
Sustainability 17 05415 g001
Figure 2. Percentage breakdown of participants’ monthly gas bills.
Sustainability 17 05415 g002
Figure 3. Percentage breakdown of participants’ monthly electricity bills.
Sustainability 17 05415 g003
Figure 4. Percentage distribution of participants’ energy use for heating and cooling.
Sustainability 17 05415 g004
Figure 5. Percentage breakdown of participants’ monthly water bills.
Sustainability 17 05415 g005
Figure 6. Percentage breakdown of participants’ water usage habits.
Sustainability 17 05415 g006
Figure 7. Percentage breakdown of participants’ primary transportation methods.
Sustainability 17 05415 g007
Figure 8. Percentage breakdown of participants’ ethnic and cultural norms.
Sustainability 17 05415 g008
Figure 9. Access to knowledge about sustainable behaviour: percentage distribution among participants.
Sustainability 17 05415 g009
Figure 10. Participants’ beliefs in renewable energies: percentage distribution.
Sustainability 17 05415 g010
Figure 11. Participants’ knowledge about renewable energies: percentage distribution.
Sustainability 17 05415 g011
Figure 12. Participants’ willingness to adopt technologies: percentage distribution.
Sustainability 17 05415 g012
Figure 13. Participant recognised as a climate hero (<2 ton CO2e).
Sustainability 17 05415 g013
Figure 14. Climate hero carbon emission breakdown (1.7 ton CO2e/year).
Sustainability 17 05415 g014
Figure 15. Nuetech solar water heating offset project.
Sustainability 17 05415 g015
Figure 16. Participant recognised as a climate friend (2–5 ton CO2e).
Sustainability 17 05415 g016
Figure 17. Example of participants’ personalized feedback displayed.
Sustainability 17 05415 g017
Figure 18. Guangdong methane digesters offset project.
Sustainability 17 05415 g018
Figure 19. Participant recognised as a climate consumer (5–10 ton CO2e).
Sustainability 17 05415 g019
Figure 20. Climate consumer carbon emission breakdown (6.9 ton CO2e/year).
Sustainability 17 05415 g020
Figure 21. Visual guide to participants’ suggestions for cutting plastic use.
Sustainability 17 05415 g021
Figure 22. India solar power offset project.
Sustainability 17 05415 g022
Figure 23. Participant recognised as a climate villain (>10 ton CO2e/year).
Sustainability 17 05415 g023
Figure 24. Climate villain carbon emission breakdown.
Sustainability 17 05415 g024
Figure 25. India wind power offset project.
Sustainability 17 05415 g025
Figure 26. Visual overview of participants’ carbon footprint balance cost.
Sustainability 17 05415 g026
Disclaimer/Publisher’s Note: The statements, opinions and data contained in all publications are solely those of the individual author(s) and contributor(s) and not of MDPI and/or the editor(s). MDPI and/or the editor(s) disclaim responsibility for any injury to people or property resulting from any ideas, methods, instructions or products referred to in the content.

