Article

Identifying and Assessing Vulnerable Micro-Enterprises in Lithuania

by
Viktorija Bobinaite
*,
Eimantas Neniskis
,
Inga Konstantinaviciute
and
Dalius Tarvydas
Lithuanian Energy Institute, Breslaujos Str. 3, LT-44403 Kaunas, Lithuania
*
Author to whom correspondence should be addressed.
Sustainability 2025, 17(12), 5405; https://doi.org/10.3390/su17125405
Submission received: 16 April 2025 / Revised: 23 May 2025 / Accepted: 25 May 2025 / Published: 11 June 2025

Abstract

:
The aim of this research was to clarify the concept of vulnerable micro-enterprises (MEs) and develop a set of indicators for identifying and analyzing developments in vulnerable MEs in “catching up” economies in the context of the regulation on the Social Climate Fund (SCF). The case of Lithuania is studied. A retrospective analysis of business structure research indicators during the period from 2010 to 2023 was carried out. The method of the median was applied to determine thresholds of indicators above (below) which a ME is considered vulnerable. Absolute and relative business structure research indicators were calculated to provide estimates of the number of vulnerable MEs and reveal their role in the economy. The results revealed the number and share of vulnerable MEs which experienced high fuel expenditure (above the median (1M), 1.5M, or 2M). Historically, these MEs created a share of added value and provided employment opportunities. The share was found to vary in accordance with economic activity and the Lithuanian municipality, suggesting that the distribution of financing from the SCF should consider aspects of economic activity and regionality. A number of MEs had an essential share of fuel expenditure in their total operating costs. Vulnerable MEs demonstrate low or negative profitability, and may be insolvent; therefore, they cannot invest in building renovation or environmentally friendly transport. Thus, the research results indicate the need for discussions regarding financing vulnerable MEs in Lithuania.

1. Introduction

The European Union (EU) announced its most ambitious climate- and energy-related package “Fit for 55”, with the aim of reducing net greenhouse gas (GHG) emissions by at least 55% by 2030 and achieving climate neutrality by 2050 [1]. Among other commitments, the “Fit for 55” package supports the strengthening of the EU Emissions Trading System (EU-ETS) by extending it to road transport and heating and cooling systems for buildings from 2027 (EU-ETS2) [2], thus helping the EU Member States (MSs) to achieve their emission reduction targets in line with the Effort Sharing Regulation (ESR) [3]. So far, emission reductions in those sectors have been inadequate in terms of reaching the EU’s 2050 climate neutrality goal. In response to this issue, the new carbon pricing system EU-ETS2 will cover carbon dioxide (CO2) emissions from fuel combustion in buildings, road transport, and small industries not covered by the existing EU-ETS. By setting a carbon price on emissions for the regulated entities, which are the fuel suppliers, EU-ETS2 is expected to provide a market incentive for investments in building renovations and low-emission mobility. Therefore, fossil fuel consumption will be reduced, and CO2 emissions will decrease by 42% by 2030 compared with 2005 [4]. This is also relevant in the context of resiliency to crises, such as the effects of Russia’s war against Ukraine and the COVID-19 pandemic [5].
Alongside EU-ETS2, in accordance with Regulation 2023/955 [6], the Social Climate Fund (SCF) was developed to pool revenue from the auctioning of emission allowances from EU-ETS2 and 50 million allowances from the existing EU-ETS. The aim of the SCF is to eventually provide funding to the most affected vulnerable groups, such as households experiencing energy or transport poverty and micro-enterprises (MEs) with no means to renovate buildings or purchase zero- or low-emission vehicles. Each EU MS is obliged to submit its Social Climate Plan (SCP) to the European Commission (EC), explaining how it will help groups vulnerable to EU-ETS2 impacts. The SCP should include definitions, indicators, and estimates of vulnerable households, transport users, and MEs affected by EU-ETS2 along with proposed measures to support these groups. This is important for Lithuania, which is characterized as a developing EU country [7], a “catching up” EU economy [8], and an economy in transition [9]. The country has understood the complexity of SCP preparation in line with the SCF regulation [6] and, alongside nine other EU MSs, has requested technical support in accordance with the EC’s Technical Support Instrument (TSI).
The authors of this study observed that the scientific literature covering vulnerability is very wide. It mainly focuses on vulnerable households [10,11,12,13,14,15,16,17,18], and the vulnerability of other groups is rarely addressed [19,20,21,22,23,24,25,26,27,28]. Furthermore, the vulnerability of SMEs is better explored than that of MEs [29,30,31,32,33,34,35,36,37,38,39,40,41,42,43,44,45,46,47,48,49,50]. There is limited research related to the vulnerability of the targeted groups of the SCF regulation [51,52,53,54,55,56,57,58,59,60] and a complete lack of scientific literature on vulnerable MEs in the context of the SCF regulation. Specifically, there is a gap in the literature discussing the concept of vulnerable MEs and proposing a set of indicators facilitating the EU MSs not only in implementing the EU‘s SCF regulation [6], but also in understanding its relevance.
The present research was carried out in this area in response to the practical need arising from the EU‘s SCF regulation [6] and the identified scientific gaps. It seeks to answer the scientific question of “how to quantitatively assess the number of MEs vulnerable to EU-ETS2 impacts.”
The aim of this research was to identify the number of vulnerable MEs and ascertain their role in the Lithuanian economy from 2010 to 2023, thus indicating the necessity for policymakers to consider policies and measures supporting vulnerable MEs in the “catching up” economy after the EU-ETS2 expansion to the building and road transport sectors.
The novelty of this research study is as follows: Firstly, the concept of the vulnerability of MEs to EU-ETS2 impacts is adapted to the Lithuanian context, showing a variety of legal forms of MEs, their economic activities, and the Lithuanian municipalities which could be significantly impacted by the EU regulations. Secondly, a broad set of indicators to identify the number of vulnerable MEs was constructed, and this is proposed as a means of determining different aspects of MEs’ vulnerability. Thirdly, official data suppliers are introduced with a set of indicators requested for the implementation of the SCF regulation [6] on the MEs’ side. Fourthly, the number of vulnerable MEs is quantified in accordance with different indicators reflecting various factors of MEs’ vulnerability, and the relevance of the SCF regulation [6] is justified. Fifthly, the role of vulnerable MEs in the Lithuanian economy is disclosed.
The remainder of this paper is organized as follows: In Section 2, the results of the literature review are presented. Section 3 describes the objective, subject, data, and research period of this study; the vulnerability factors of MEs; and a set of vulnerability indicators and impact indicators. Section 4 introduces the research results, including the number of vulnerable MEs in accordance with the indicators considered, the most vulnerable economic sectors and Lithuanian municipalities, and the impact of vulnerable MEs on the national economy. Section 5 provides theoretical and practical implications. Finally, Section 6 presents the conclusions.

2. Literature Review

The literature on vulnerability is rich and mainly addresses vulnerable households. In detail, it discusses households’ energy vulnerability in different energy transition contexts [10], investigates the energy transition and energy poverty nexus, studies the effects of decarbonization policies on relative prices and households, establishes the link between population aging and energy vulnerability [11], investigates climate change mitigation policies addressing energy poverty [12], explores the household strategies for coping with energy poverty [13], studies determinants and indicators of energy poverty [14], investigates long-lasting impacts of financial crises on households [15], examines how digitalization affects income inequality in households [16], reviews transport poverty [17], proposes transport poverty vulnerability index [18], and so on.
The topic of vulnerable MEs is not well researched. The majority of current research on the topic has analyzed different sources of vulnerability, including the entrepreneur’s competence gap [19], the triggering role of natural disasters [20], and low income [21]. Other topics dealing with vulnerabilities of MEs are related to the effectiveness of different support measures in reducing financial risks [21,22], the willingness to take credit for business development [23], and the role of organizational structure in managing the MEs’ vulnerability deriving from exogenous shocks [24,25]. Other sources of vulnerability for MEs could arise from inadequate regulation and corruption [26]. Social peripheralization and gender bias could also be considered sources of the increase in the vulnerability of MEs [27]. Support for the establishment of MEs to address social issues—for example, women in poverty [27] and youth employment [28]—facilitates an increase in vulnerable small and medium enterprises (SMEs). The majority of the researchers studying the vulnerability of MEs relayed data from developing countries [19,20,21,22,23,27,28].
Different aspects of SME vulnerabilities have been studied more effectively than those related to MEs. In detail, in [29], different risk factors and vulnerabilities of SMEs in comparison to large companies were classified. In [30,31,32], the authors considered the aftermath of the global banking crisis of 2008. They found that small enterprises were particularly vulnerable during periods of economic downturn and financial crisis. In this context, [30] defined vulnerability as the ability of SMEs to resist external shocks. Researchers in [30] proposed that the vulnerability of SMEs to shocks was not seen by policymakers as a sign of permanent decline. They stated that vulnerability can be managed through strategic and operational actions; therefore, small enterprises are able to recover from a major shock to the economy. In [31], researchers argued that “…because of a combination of resource-related constraints, low bargaining power in relation to a variety of stakeholders and a tendency to rely on bank credit on those occasions when external finance is used…”, smaller enterprises could find themselves particularly vulnerable. In [32], the authors estimated that the growth in total factor productivity in European micro-, small-, and medium-sized enterprises differed from that of large enterprises. The largest difference was quantified for MEs. The difference was larger for enterprises with more severe credit supply shocks. In [33], it was observed that the average SME had a higher probability of being financially constrained and forced to rely more on non-banking financing alternatives. The impact of the COVID-19 pandemic on the risk increase in SMEs was analyzed in [34], while the authors of [35] considered vulnerability in terms of the dependence on the sector the SME operates within. SMEs were found to be more vulnerable to disruption of the payment flow, which could negatively affect the SMEs’ ability to access financing [36,37]. Climate change also increases the vulnerability of SMEs [38] and can impact a company’s cost of capital and access to finance [39], resulting in higher costs of debt due to increased risks perceived by the investors. In recent years, cybersecurity has emerged as a critical risk for SMEs. This digital vulnerability was analyzed in [40,41]. In [42], climate policy uncertainty was linked to increased digitization. The authors found a two-way relationship. Increased climate uncertainty had a positive effect on digital transformation, and an increased digitization had a positive effect on environmental performance and financial resilience. A systematic literature review by the authors of [43] considered the entrepreneurs behind the SMEs and analyzed the different aspects, measures, and the level of financial stress. The authors of [44] explored the adaptive capacity of MEs and entrepreneurial resilience during crises and challenges. Reference [39] emphasized the importance of financial management in SMEs, highlighting challenges such as financial literacy, cash flow management, and financial risk management which could result in increased vulnerability. The European Central Bank (ECB) concluded, based on the SAFE data [45], that the increase in vulnerability in the second and third quarters of 2023 was mainly driven by the enterprises in industry, construction, and trade. The increase in vulnerability was more significant for the SMEs than for larger enterprises [46]. The ECB found that the age of the enterprise was a very important vulnerability factor. Climate change has a profound effect on MEs and SMEs, affecting their vulnerability. In [38], a significant positive impact of climate change on SMEs’ innovation potential was observed based on data from 443 SMEs in 14 developing countries. In [47], the importance of public policy and funding in facilitating sustainable adaptation to the current climate variability, leading to better preparation from climate change, was stressed. In [48], after studying 15,265 firms in 71 countries, the authors suggested that climate vulnerability directly increased the cost of debt and reduced access to finance, but the impact on the cost of equity was minimal. The authors of [49] argued that while SMEs are vital for climate change adaptation and mitigation, they are often neglected by policymakers and other governance actors. Climate adaptation could have a positive impact on SMEs by reducing their vulnerability to major crises. The authors of [50] argued that environmentally friendly companies, especially small- and medium-sized businesses, were less affected by the COVID-19 pandemic based on a sample of 4888 companies from the EU-28. Regarding vulnerability in SMEs, the focus is tilted more towards enterprises of the EU and other developed countries [30,31,33,34,36,40,41].
The are few studies on the vulnerability of targeted groups in the context of SCF regulation. The literature addresses only the SCF’s role in the EU green legislation as a part of the support measures or as a part of the Recovery and Resilience Facility [51], discussing the legal framework [52,53], implementation of the “Green Deal” [54], social justice [55], or competition law [56]. Several relevant scientific papers have been published in this area, but they address households’ vulnerability to rising fossil energy costs in relation to the EU-ETS2 [57], indicators to estimate energy and transport vulnerabilities in households [58], and related impacts [59,60].
While the literature on vulnerable households is emerging, there is a gap when it comes to the analysis of vulnerable MEs. The literature on the concept of vulnerable MEs was found to be limited to established key vulnerability factors, while indicators remained unknown due to data collection issues. The issue deepens when the SCF regulation context is considered and calls for scientific focus and research.

3. Research Methodology

3.1. Objective of Research Methodology

The research methodology was developed with the objectives of understanding SCF regulation [6] with regard to a sample of vulnerable MEs, developing a set of indicators identifying MEs vulnerable to EU-ETS2 impacts and revealing their significance to the national economy, as well as suggesting official data sources and ascertaining their customization possibilities in the context of the SCF regulation [6].

3.2. Subject and Sample Size

The subject of this research is Lithuanian MEs, which are a constituent category of SMEs. The scientific literature review showed that MEs have mainly been studied in the context of SMEs. This group had not been widely studied separately.
MEs are defined as a category of SMEs with up to 10 employees and a turnover or balance sheet total of up to EUR 2 million. The sample of Lithuanian MEs was formed from a list of Lithuanian SMEs, considering the established ME definition. The category of MEs in Lithuania contains different legal forms of very small enterprises, including joint-stock companies, closed joint-stock companies, cooperative companies, economic partnerships, state and municipal enterprises, agricultural companies, branches of foreign legal entities, public institutions, small partnerships, individual enterprises, and natural persons (self-employed). In 2023, 337,791 economic entities met the definition of MEs, from which 95,240 had the status of companies and 242,551 were natural persons and are the subject of this research.
The SCF regulation [6] addresses a category of vulnerable MEs, which “…are significantly affected by the price impacts of the inclusion of greenhouse gas emissions from buildings or road transport within the scope of Directive 2003/87/EC and that, for the purpose of their activity, lack the means either to renovate the building they occupy, or to purchase zero- and low-emission vehicles or to switch to alternative sustainable modes of transport, including public transport, as relevant…”. In line with SCF regulation [6], in Lithuania, vulnerable MEs are defined as MEs that are particularly affected by the cost implications of the inclusion of GHG from the buildings or road transport sectors in the scope of the EU-ETS and that do not have the resources to renovate the building in which they are located for their operational purposes, to purchase low- and zero-emission vehicles, or to switch to alternative sustainable modes of transport, including public transport. As observed from the definition, in Lithuania, the vulnerability of MEs is related to the poor performance of the buildings they occupy and old, inefficient vehicles they own. MEs in Lithuania are registered and/or operate in different types of buildings [61] and own various vehicles with differing fuel requirements [62].
In Table 1, the distribution of Lithuanian building stock by building group and energy performance class is presented.
From the 342,160 residential buildings and 78,175 non-residential buildings, it is not yet possible to identify the number of buildings owned by MEs; thus, it is not possible to directly link a vulnerable ME to the building with the lowest energy performance class (which is ≤D in Table 1).
Similarly, the Regitra [62] database contains information on vehicles registered in Lithuania (Figure 1).
At the beginning of 2025, Lithuania had 1.8 million passenger cars (M1) and 80.1 thousand light freight vehicles (N1). A total of 67% of them used diesel, and 32% used gasoline. Electricity-based vehicles accounted for 0.9%. The average age of passenger cars was 16.7 years, and that of light freight vehicles was 13.3 years. Thus far, it is not possible to identify the number of vehicles owned by MEs by fuel type. Again, the link between a vulnerable ME and an old, inefficient fossil fuel-based vehicle has not been established yet.

3.3. Data and Period

Without direct links between the State Enterprise Centre of Registers [63] and Regitra [62] databases, which were assumed to be the most relevant to the research, we used other data sources and their managed data. Thus, the data used to identify, monitor, and later analyze vulnerable MEs in Lithuania were collected by a relevant official data supplier, the State Data Agency of Lithuania. The State Data Agency of Lithuania [64] was a single data supplier from 2010 to 2023. The personnel collected historical developments in requested indicators from the managed Business Structure Research Indicators dataset. The managed dataset contains many absolute (in EUR) and relative (% or coefficients) indicators representing various economic and financial aspects of enterprises. Data for only MEs were requested for the purpose of this research.
The State Data Agency of Lithuania collects detailed data for MEs with company status. No data were available for individual enterprises or natural persons (self-employed); therefore, the data were collected and analyzed for the category “companies”. The estimates were not tailored or extrapolated to the whole sample to ensure the accuracy and robustness of the research. Therefore, we acknowledge that the research has limitations in relation to the types of entities considered.
The authors of this research and the Ministry of Environment of Lithuania submitted to the State Data Agency two separate Individual Requests Regarding Data Collection for MEs in autumn 2024 and winter 2025. The Individual Requests included data provision by economic activity at the section level of NACE from A to S95_S96 and Lithuanian municipalities to identify the most vulnerable economic activities and determine the regional disparities. The Individual Requests included data on the manufacturing industry at the division level of NACE from C10 to C33. Data were requested for 60 of the country’s municipalities in total. Individual Requests differed in the vulnerability indicators requested by each party; nonetheless, both sets of vulnerability indicators were prepared by researchers of this study in accordance with the vulnerability factors.

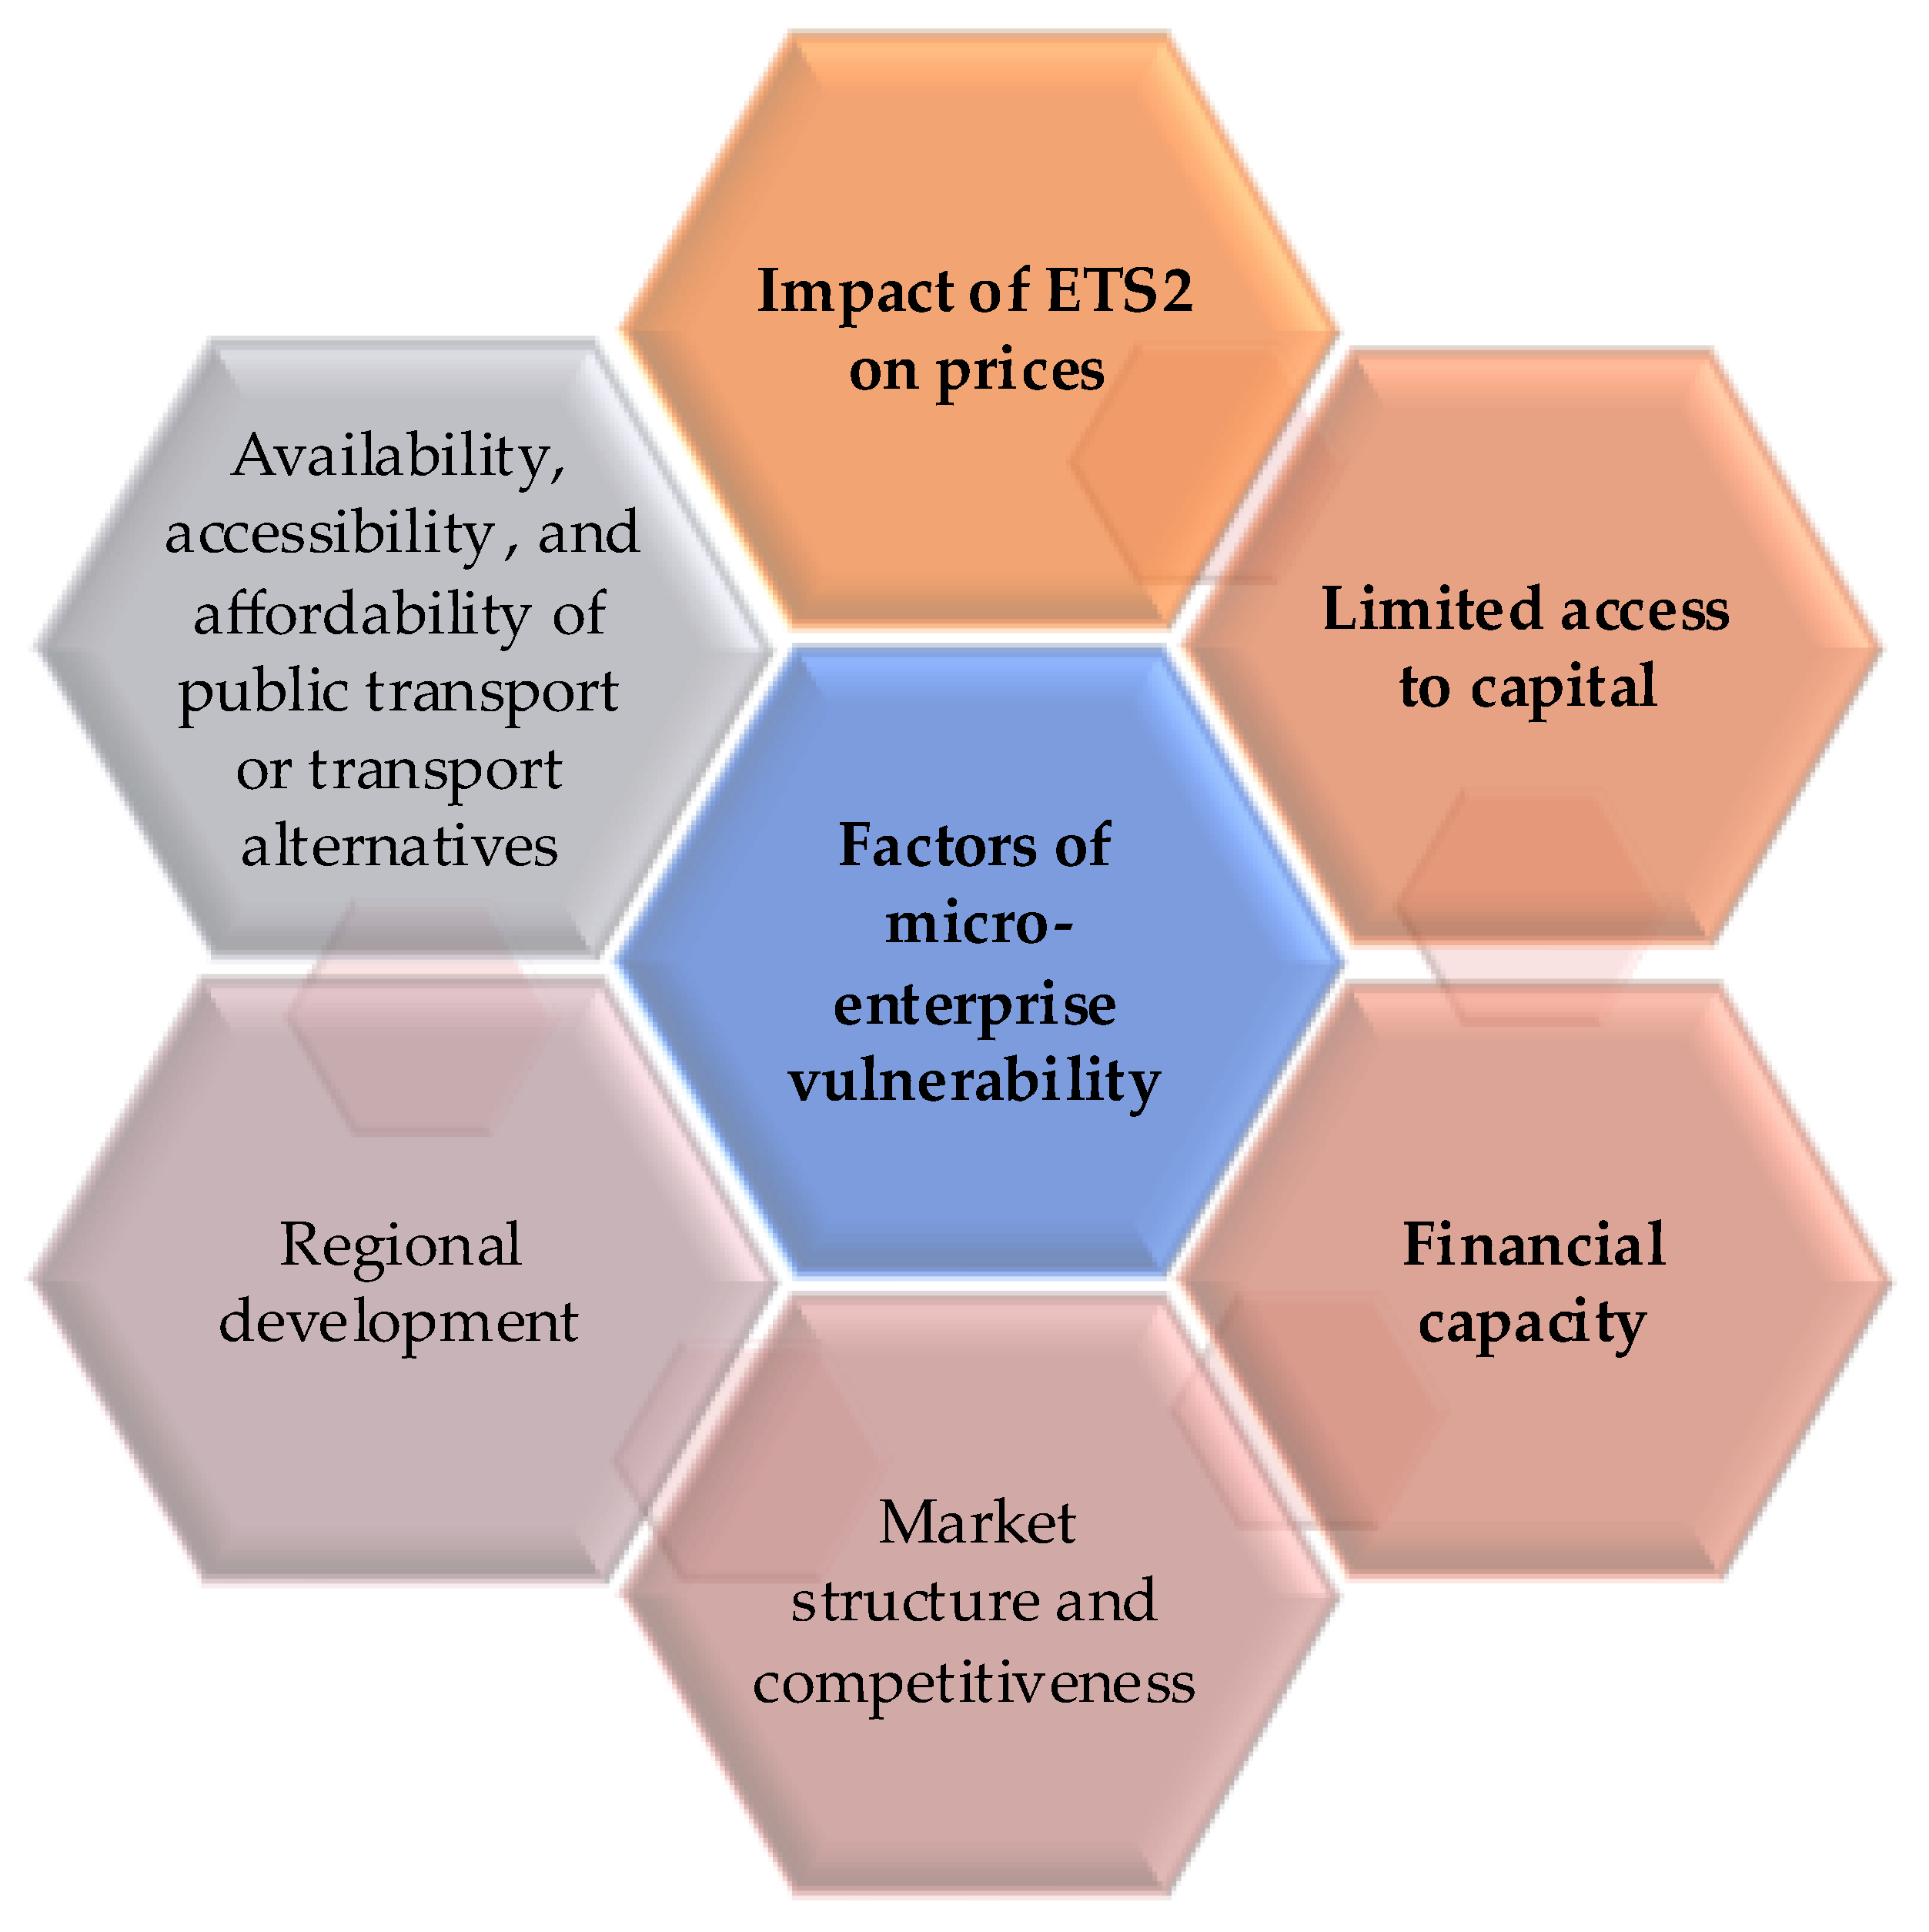
3.4. Vulnerability Factors

Two sets of indicators were provided to the State Data Agency of Lithuania for relevant data collection. The indicators were formed in accordance with the factors of vulnerable MEs, which were developed in the framework of Project “Support to the Preparation of Social Climate Plans” financed by the EU via the TSI in 2024 [65] (Figure 2).
As shown in Figure 2, six relevant factors make the ME vulnerable in the context of the SCF regulation [6]. Vulnerability factors originated from the definition of vulnerable MEs [6,31]. Specifically, in [31], various common problems of SME development were identified, including economic structure, access to finance and markets, disparities in local and regional development, and so on. Accordingly, vulnerability factors of limited access to capital, financial capacity, market structure, and regional development were chosen. When dealing with vulnerable MEs, by definition [6], vulnerability factors of price impact and criteria for public transport and its alternatives became important. Therefore, two additional vulnerability factors of the impact of EU-ETS2 on price and the availability, accessibility, and affordability of public transport or transport alternatives were selected. As data on vulnerability factors were limited and some data sharing was restricted in accordance with the Ministry of Environment of Lithuania, only three vulnerability factors were addressed in the research. These are the EU-ETS2 impact on prices of goods and services, the limited access to capital, and the insufficient financial capacity of MEs. Nevertheless, vulnerability factors respond well to key aspects of the definition of ME vulnerability (i.e., not having the resources to renovate buildings, purchase zero-emission and low-emission vehicles, or switch to alternative sustainable transport modes, including public transport).

3.5. Vulnerability Indicators

At least one vulnerability indicator was developed for each selected vulnerability factor (Table 2). In many cases, vulnerability indicators were constructed by applying the median approach with a predefined threshold of the median (1M), 1.5M, or 2M of the industry or national average. Thresholds allowed the most vulnerable MEs to be selected.
In this research, we present vulnerability indicators which are unrestricted by the Ministry of Environment of Lithuania. Specifically, regarding the EU-ETS2 impact on prices, the fuel expenditure higher than the median (1M), 1.5M, and 2M of the industry (economic activity) and a share of fuel expenditure in total operating costs higher than the median (1M), 1.5M, and 2M of the industry were found to be relevant. Energy expenditure was not considered in this research as EU-ETS covers electricity and heat. All MEs with a fuel expenditure of EUR 0 were excluded. Then, the number of MEs with fuel expenditure higher than 1M, 1.5M, and 2M of the industry and with a share of fuel expenditure in total operating costs was collected according to economic activity and Lithuanian regions. Usually, financial capacity is assessed based on neutral financial indicators (liquidity, financial autonomy, solvency, and profitability) [66]. The net profit (net loss) of the MEs was considered in this study to show the financial capacity of the MEs. The number of MEs with net profit below the industry’s median (1M), 1.5M, and 2M or negative was collected. Banks assess enterprises’ financial situation when granting loans, including their equity-to-liabilities ratio, which is preferred to be 2 or higher. Enterprises with a low ratio (i.e., 0.5 or below) are considered to be in a bad situation. Regarding the theoretical threshold of the vulnerability indicator, the number of MEs with an equity-to-liabilities ratio of 0.5 or less and 1.0 or less was analyzed. Low profitability and low solvency may be the primary reasons for halting ME investment with the aim of improving energy efficiency and the wider use of renewable energy sources; therefore, in the context of the SCF regulation [3], these MEs are considered vulnerable.
An advantage of using the Ministry’s restricted Individual Request is that it solved the issues of a set of indicators submitted to the State Data Agency by the researchers of this study. In detail, the Ministry’s indicators focused on the variable median approach, which was either the median of the national economy or the median of a specific industry. This allowed the most vulnerable MEs to be identified. Then, a broader list of indicators was prepared to explore various areas of MEs’ vulnerability. Further, more stringent filters were applied to the set of vulnerability indicators, integrating 2–3 indicators. This allowed us to determine the lowest threshold for the number of vulnerable MEs.
The State Data Agency personnel programmed vulnerability indicators for two Individual Requests as it does not store and publish data of the requested kind for the purpose of identifying MEs and ascertaining their role in the economy.

3.6. Impacts

Value added and the number of employees of vulnerable MEs was calculated and supplied by the State Data Agency with the aim of elucidating the role of vulnerable MEs in the Lithuanian economy. Value added was calculated with Equation (1) [67]:
V A = T R + C P + O O I G o D P o I + C h S + S u O T ,
where VA—value added, million EUR; T R —turnover, million EUR; C P —capitalized production, million EUR; OOI—other operating income, million EUR; GoD—gains on disposals, million EUR; PoI—purchases of inventories (goods) and services (adjusted), million EUR; ChS—change in stocks, million EUR; Su—subsidies to products and production, million EUR; OT—operating taxes, million EUR.
The number of employees was calculated using Equation (2):
E = A o E + W O ,
where E—number of employees; AoE—average annual number of employees; WO—number of working owners.

4. Results

4.1. Fuel Expenditure and Share of Fuel Expenditure in Total Operating Costs

MEs consume different amounts of fuel in carrying out their economic activities, which affects their fuel expenditure and the share of fuel expenditure in total operating costs (Table 3).
As is shown in Table 3, a ME that provides transportation and storage services or is engaged in agriculture, forestry, and fishing activity has the highest fuel expenditure. From 2010 to 2023, these costs increased four-fold to EUR 17,216 and two-fold to EUR 9431, respectively. The share of fuel expenditure in the total operating costs in a ME participating in these activities is also significant. In 2023, it was 24.96% in a ME engaged in transportation and storage and 12.73% in agriculture, forestry, and fishing services, making these MEs the most vulnerable. However, agriculture, forestry, and fishing activities in Lithuania do not fall within the scope of the SCF regulation; therefore, they were not included in further assessments. Fuel expenditure in MEs providing water supply; sewerage, waste management, and remediation; construction, professional, scientific, and technical services; financial and insurance services; wholesale and retail trade; and accommodation and food services is also relevant (EUR 1000–4000), but its share in total operating costs is moderate (1.2–4.2%), suggesting that a ME could be less vulnerable. A ME engaged in other economic activities spends relatively little on fuel. The case of electricity, gas, steam, and air conditioning supply is worth mentioning as at the beginning of the period, the fuel expenditure of a ME in this sector was very high (EUR 10,065 or 22.77% in total operating costs in 2010). After the implementation of energy efficiency measures, fuel expenditure and its share decreased significantly, and today the fuel expenditure of a ME operating in this sector is among the lowest.
The number of vulnerable MEs was calculated considering the median values of fuel expenditure and its share in total operating costs presented in Table 3.

4.2. Number of Vulnerable Micro-Enterprises

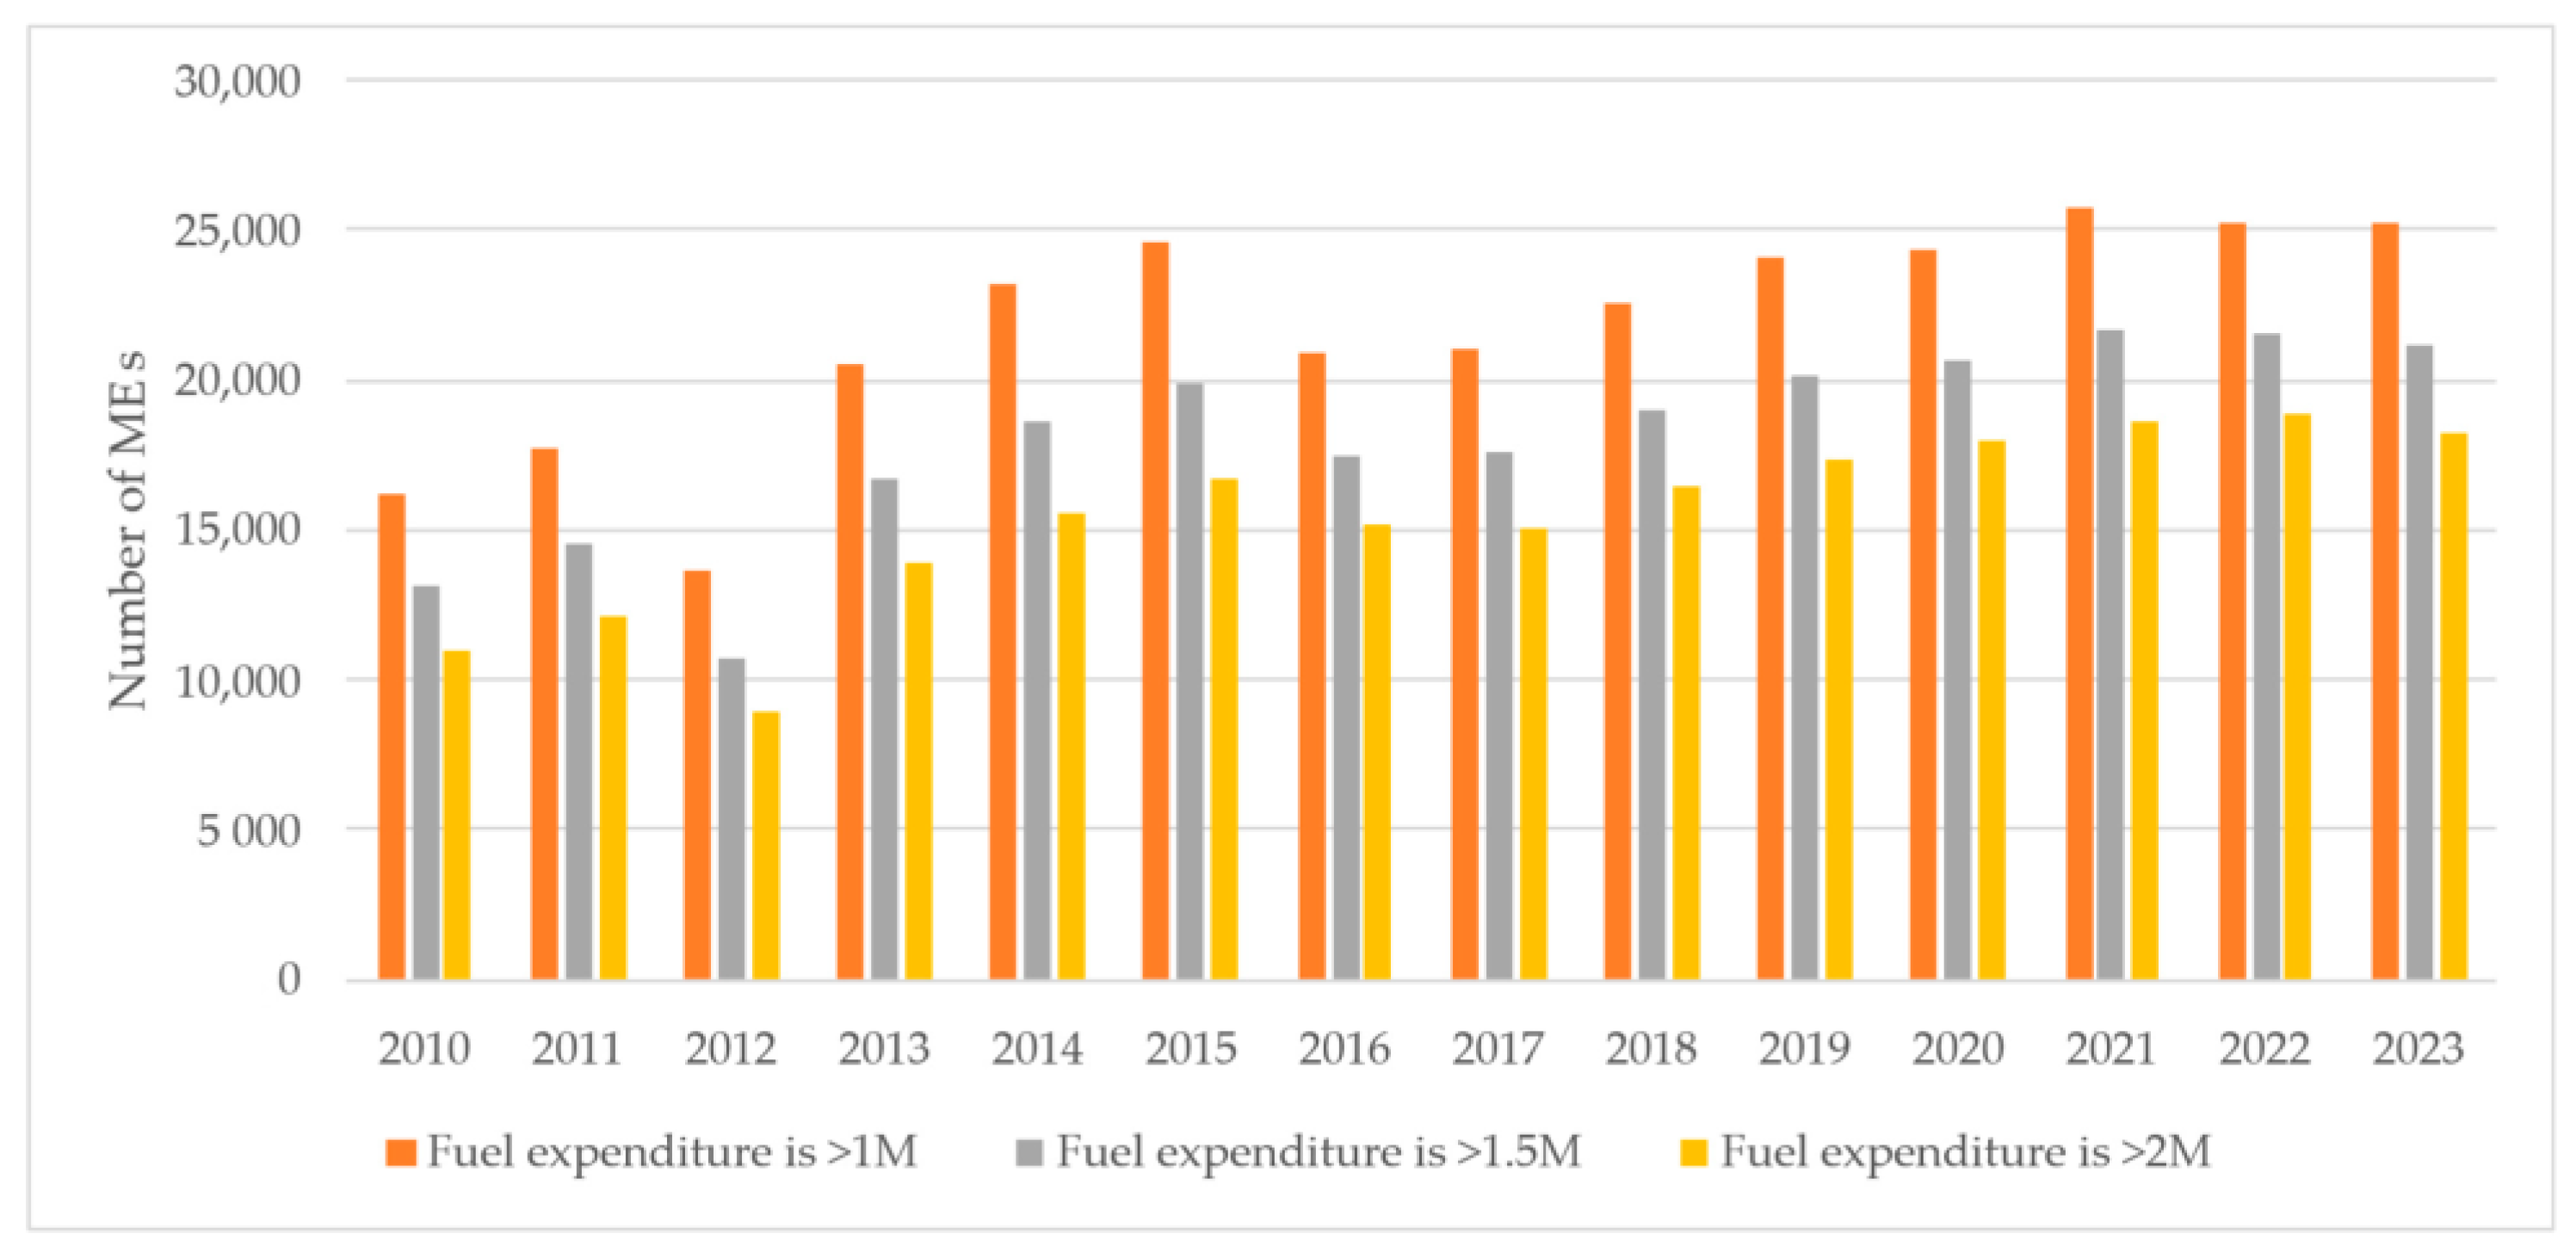
4.2.1. Number of Micro-Enterprises with High Fuel Expenditure

The developments in the number of vulnerable MEs experiencing high fuel expenditure (>1M, >1.5M, and >2M) are presented in Figure 3.
As shown in Figure 3, overall, the number of MEs experiencing high fuel expenditure increased by 60%, although it wavered over the period. In 2023, there were over 18,000 MEs with fuel expenditure higher than 2M and over 25,000 MEs with fuel expenditure above 1M. This accounted for 15–26% of all MEs operating in the country. In comparison, there were over 11,000 MEs with fuel expenditure higher than 2M and over 16,000 MEs with fuel expenditure above 1M in 2010. With the start of a new EU structural funding period for 2021–2027, support for improving energy efficiency and the broader use of renewable resources was renewed, and the number of MEs with a high fuel expenditure decreased by up to 3% (from 200 to 600 MEs) per year.

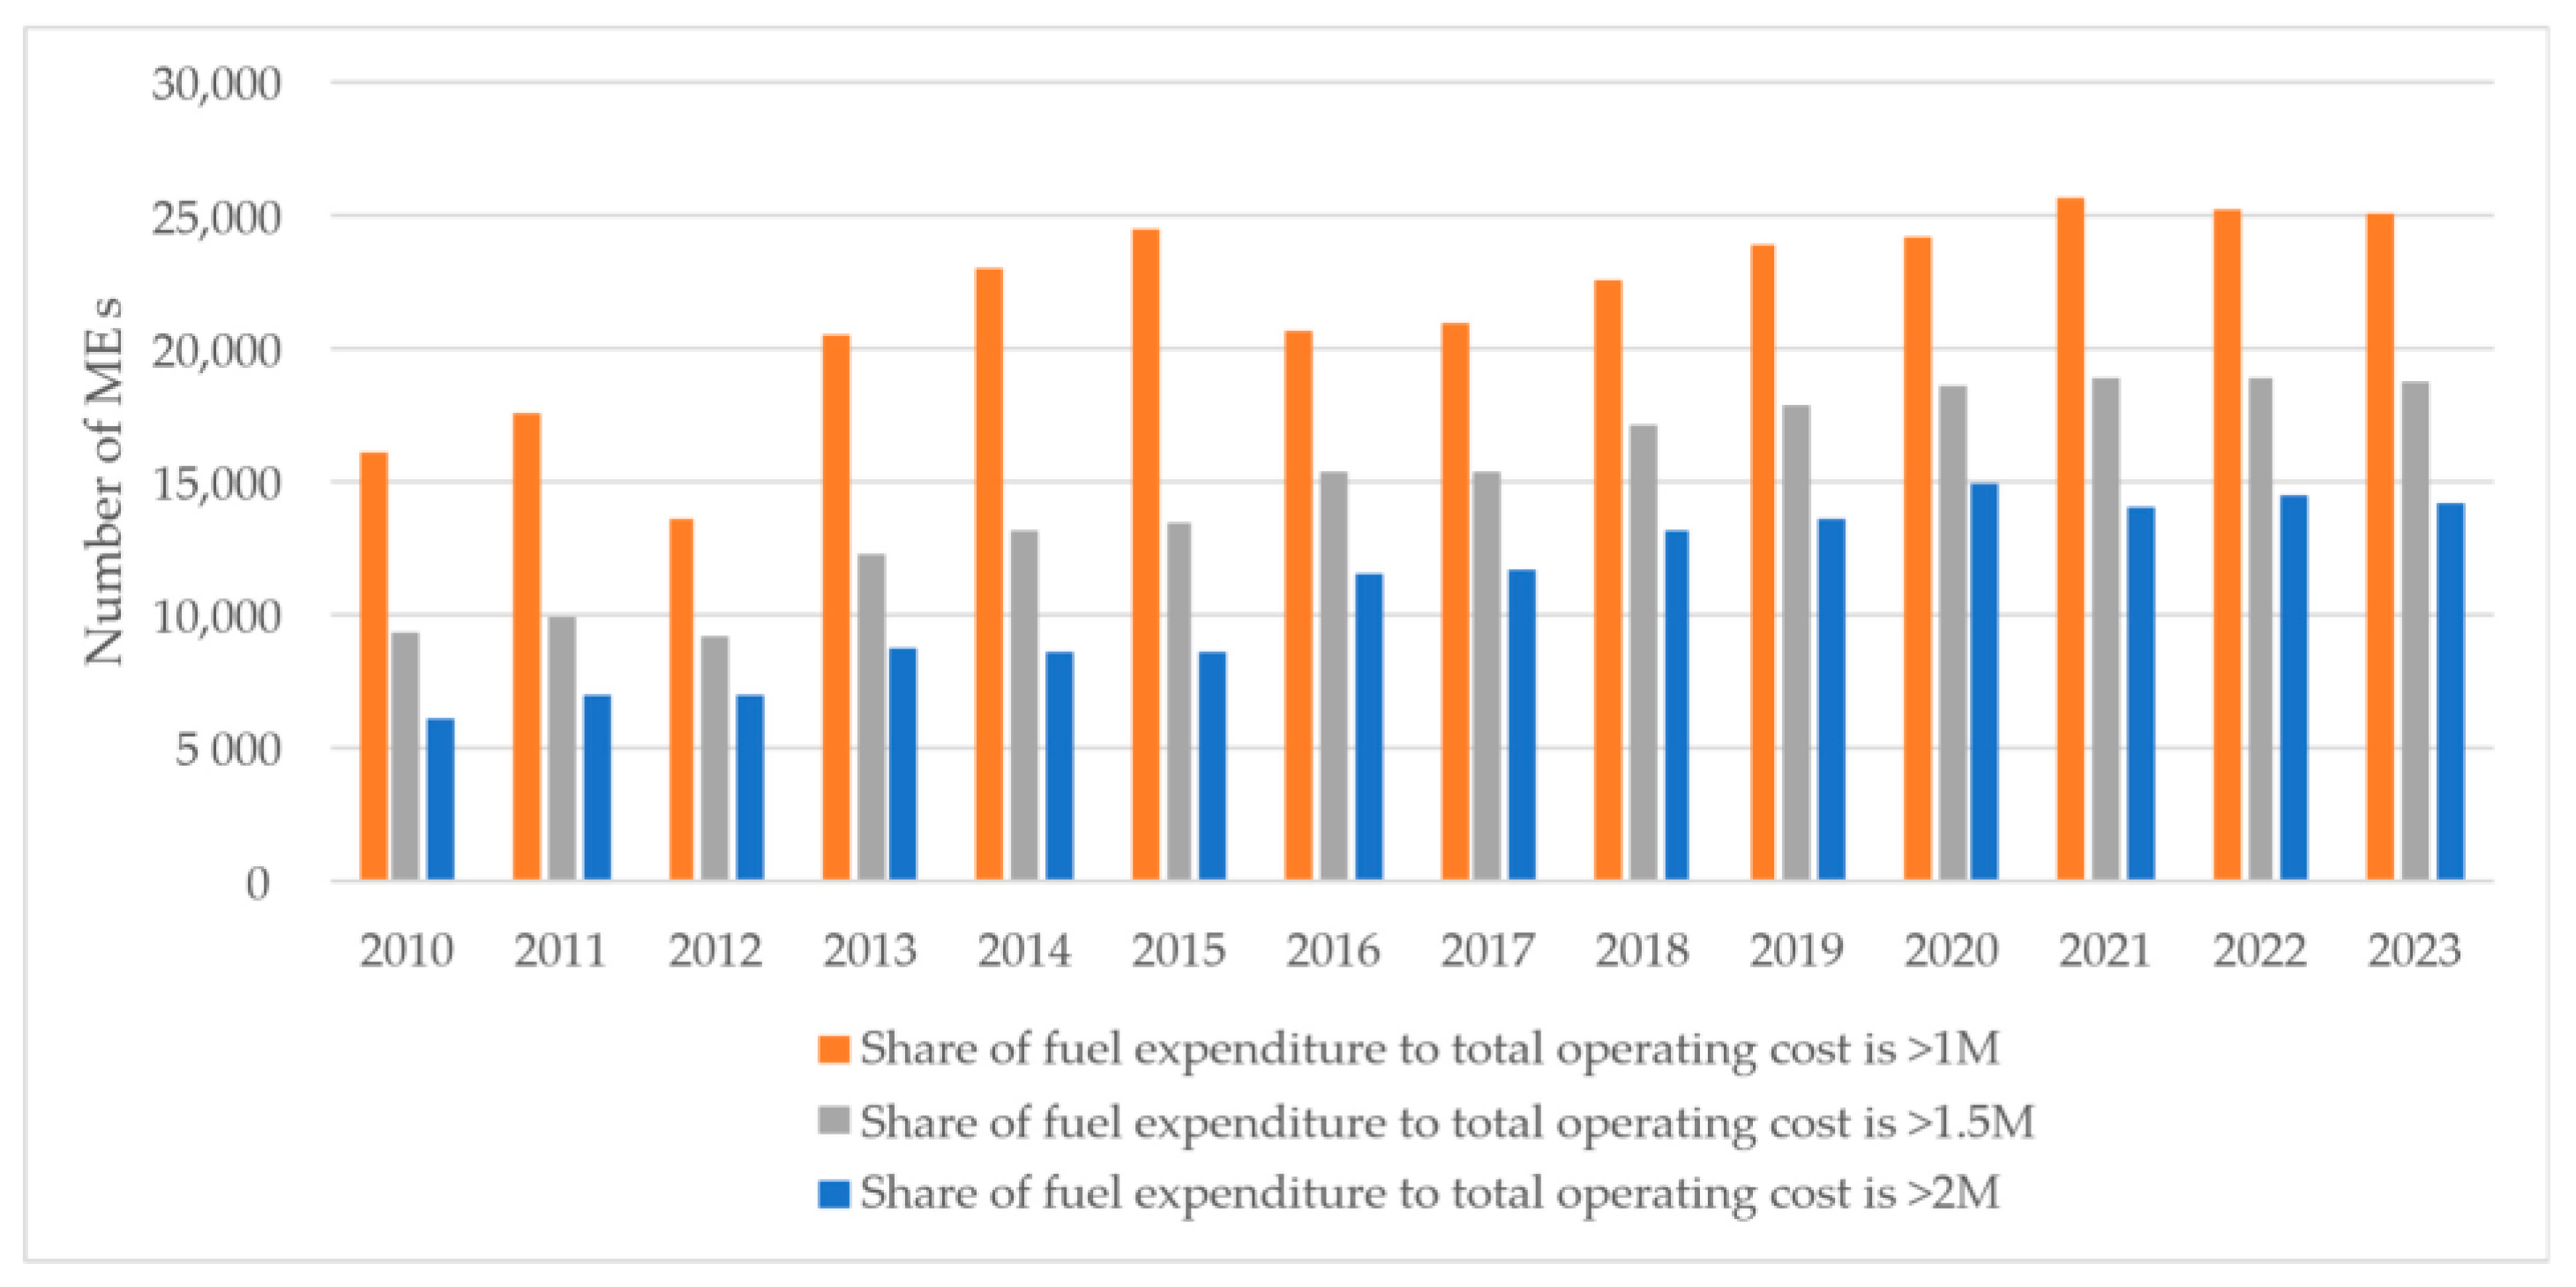
4.2.2. Number of Micro-Enterprises with a High Share of Fuel Expenditure in Total Operating Costs

It seems that from 2010 to 2023, the number of MEs in which fuel expenditure accounted for a significant share of total operating costs increased to a greater extent than the number of MEs experiencing high fuel expenditure (Figure 4).
As shown in Figure 4, the number of MEs with a share of fuel expenditure to total operating costs exceeding 1M increased by 55%, from 16,155 MEs in 2010 to 25,125 MEs in 2023, but it increased two-fold considering the share of fuel expenditure to total operating costs exceeding 2M (i.e., from 6215 MEs in 2010 to 14,231 MEs in 2023). Considering the share of fuel expenditure in total operating costs above 2M, every fifth ME operating in Lithuania was vulnerable in 2023, and taking into account the share of fuel expenditure to total operating costs above 1M, every fourth ME was vulnerable in the country in that year.

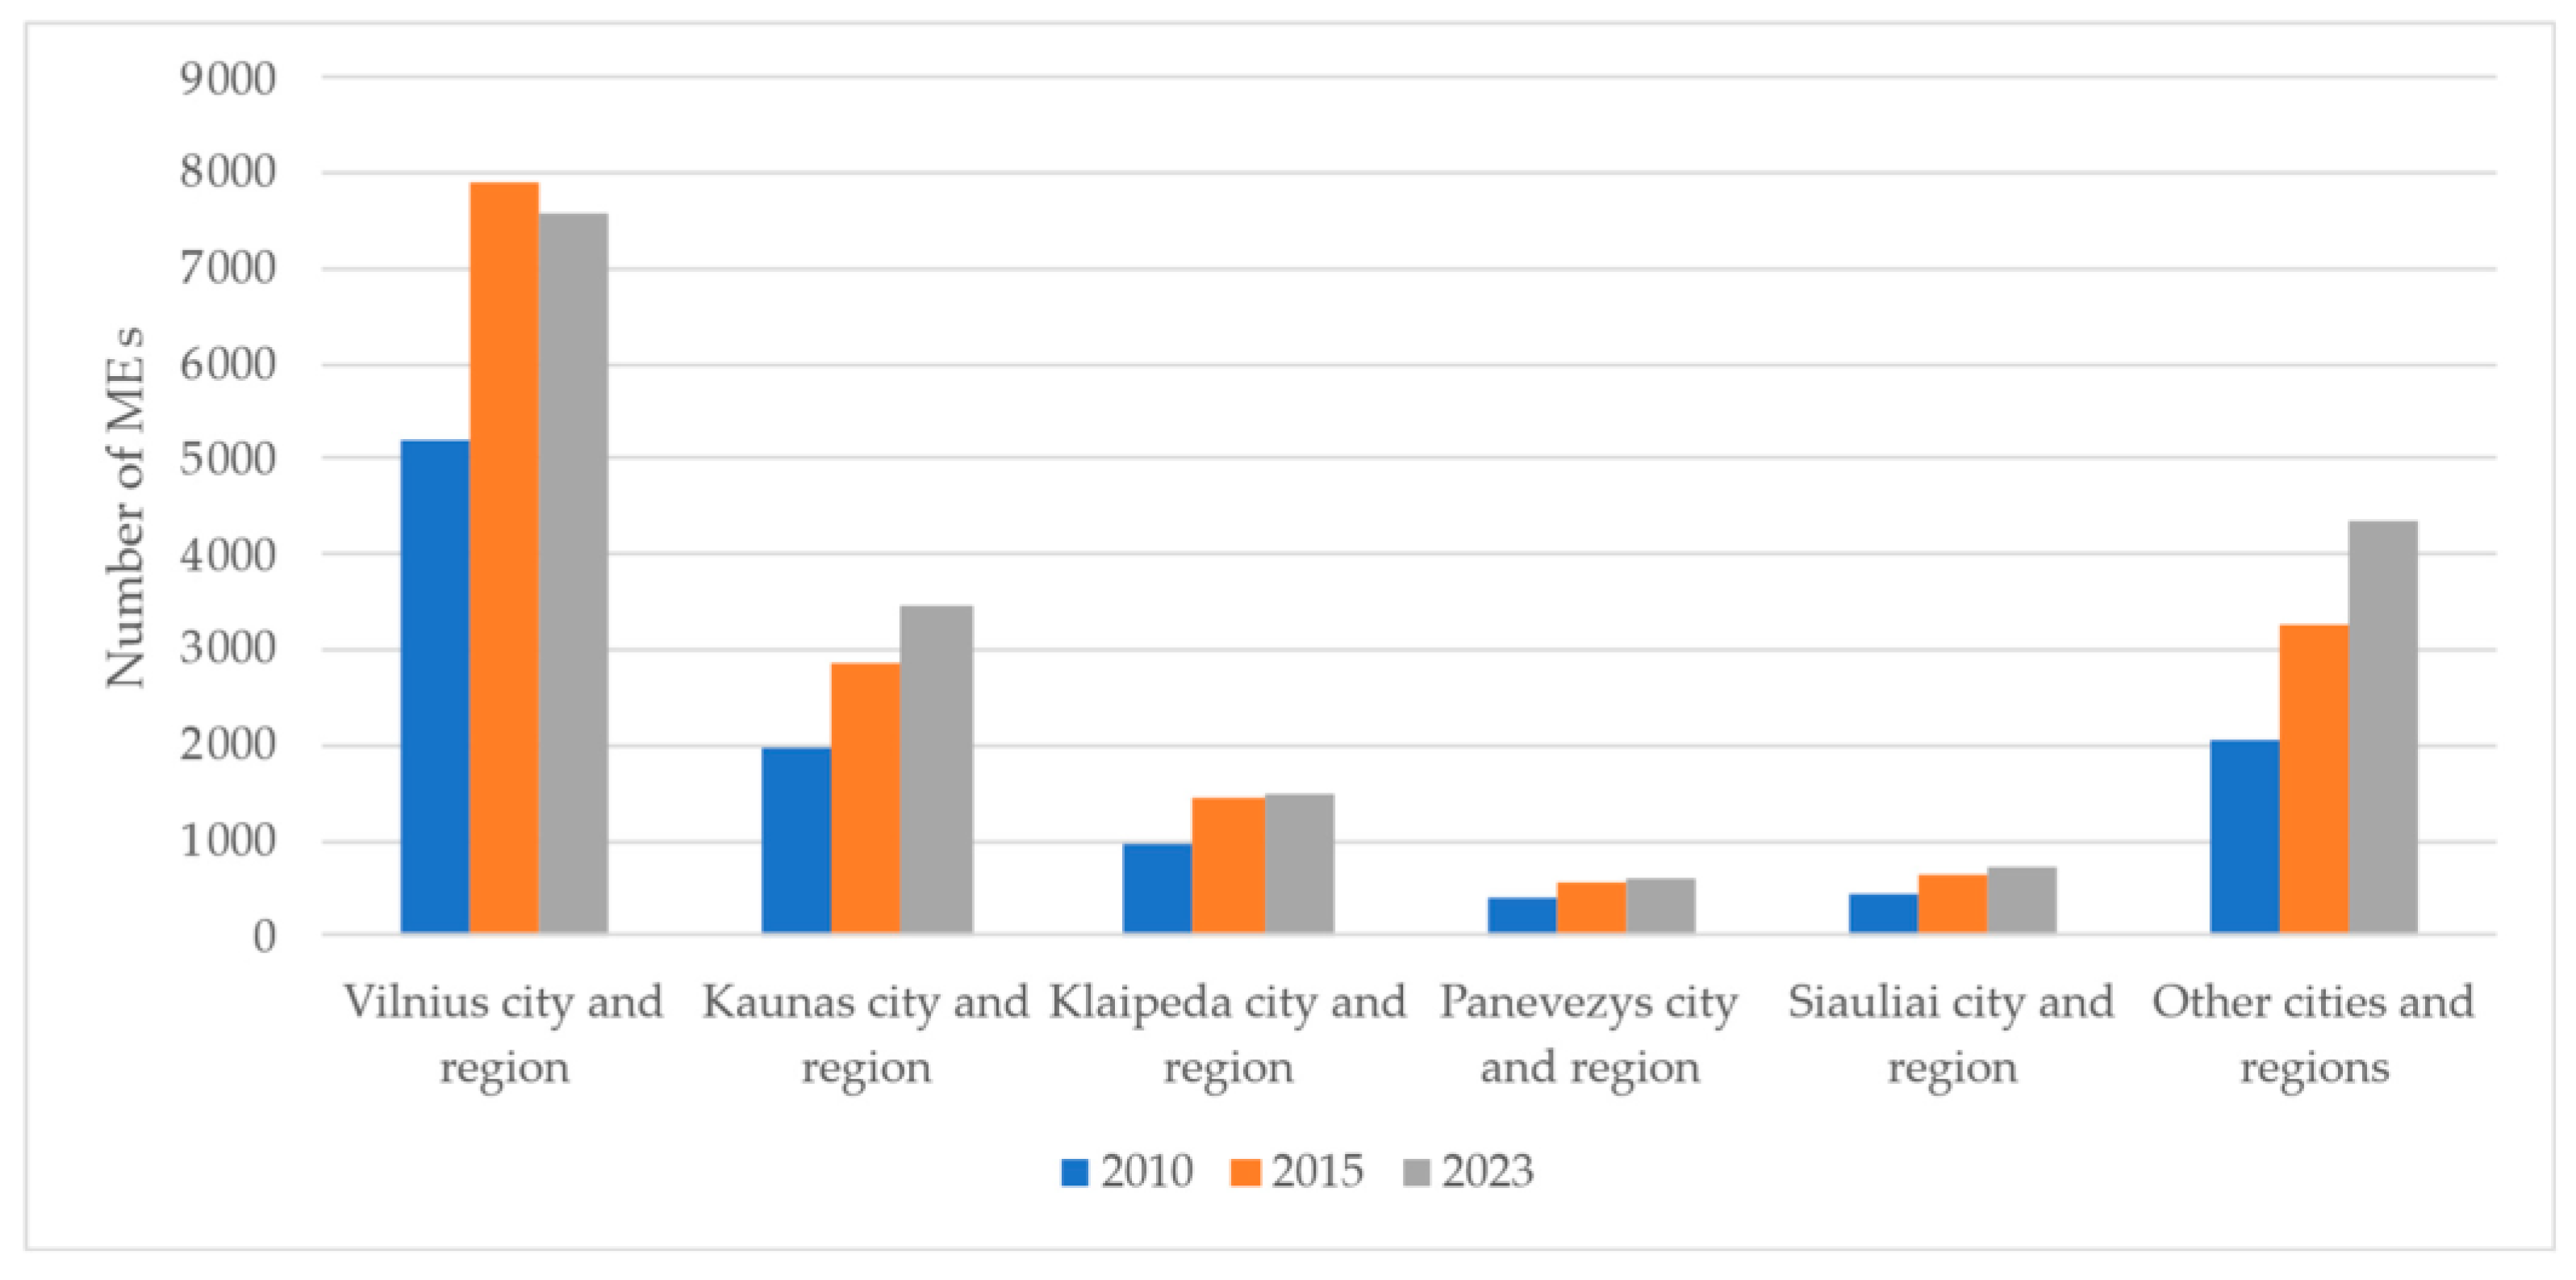
4.2.3. The Most Vulnerable Lithuanian Municipalities

The calculations revealed that MEs carrying out economic activities in the five largest Lithuanian cities and their regions were the most vulnerable (Figure 5).
As shown in Figure 5, the most vulnerable MEs were operating in the capital of Lithuania and its region (7598 MEs or 42% of the total vulnerable MEs in 2023). The number of vulnerable MEs increased by 2417 MEs in Vilnius City and its region over the period. Kaunas City and its region was the second largest area and had a great number of vulnerable MEs (3486 MEs or 19% of the total vulnerable MEs in 2023). The area is notable for having the fastest growth rate (4.5% per year) of vulnerable MEs among all the regions in Lithuania. Klaipeda City and its region accounted for 8% of the total vulnerable MEs in 2023. Up to 4% of the total vulnerable MEs were located in other cities and regions, including Panevezys and Siauliai, in 2023.
Considering the ratio of the number of vulnerable MEs to total MEs in the city and its region, in 2023, 34% of MEs operating in other cities and regions were vulnerable, demonstrating that every third ME was vulnerable in these areas. There were twice as many MEs in Vilnius City and its region (i.e., 19% in 2023), showing that every fifth ME was vulnerable in the area. The smallest share of vulnerable MEs was in Siauliai and Panevezys (i.e., 12% each or every eighth ME operating in the area).

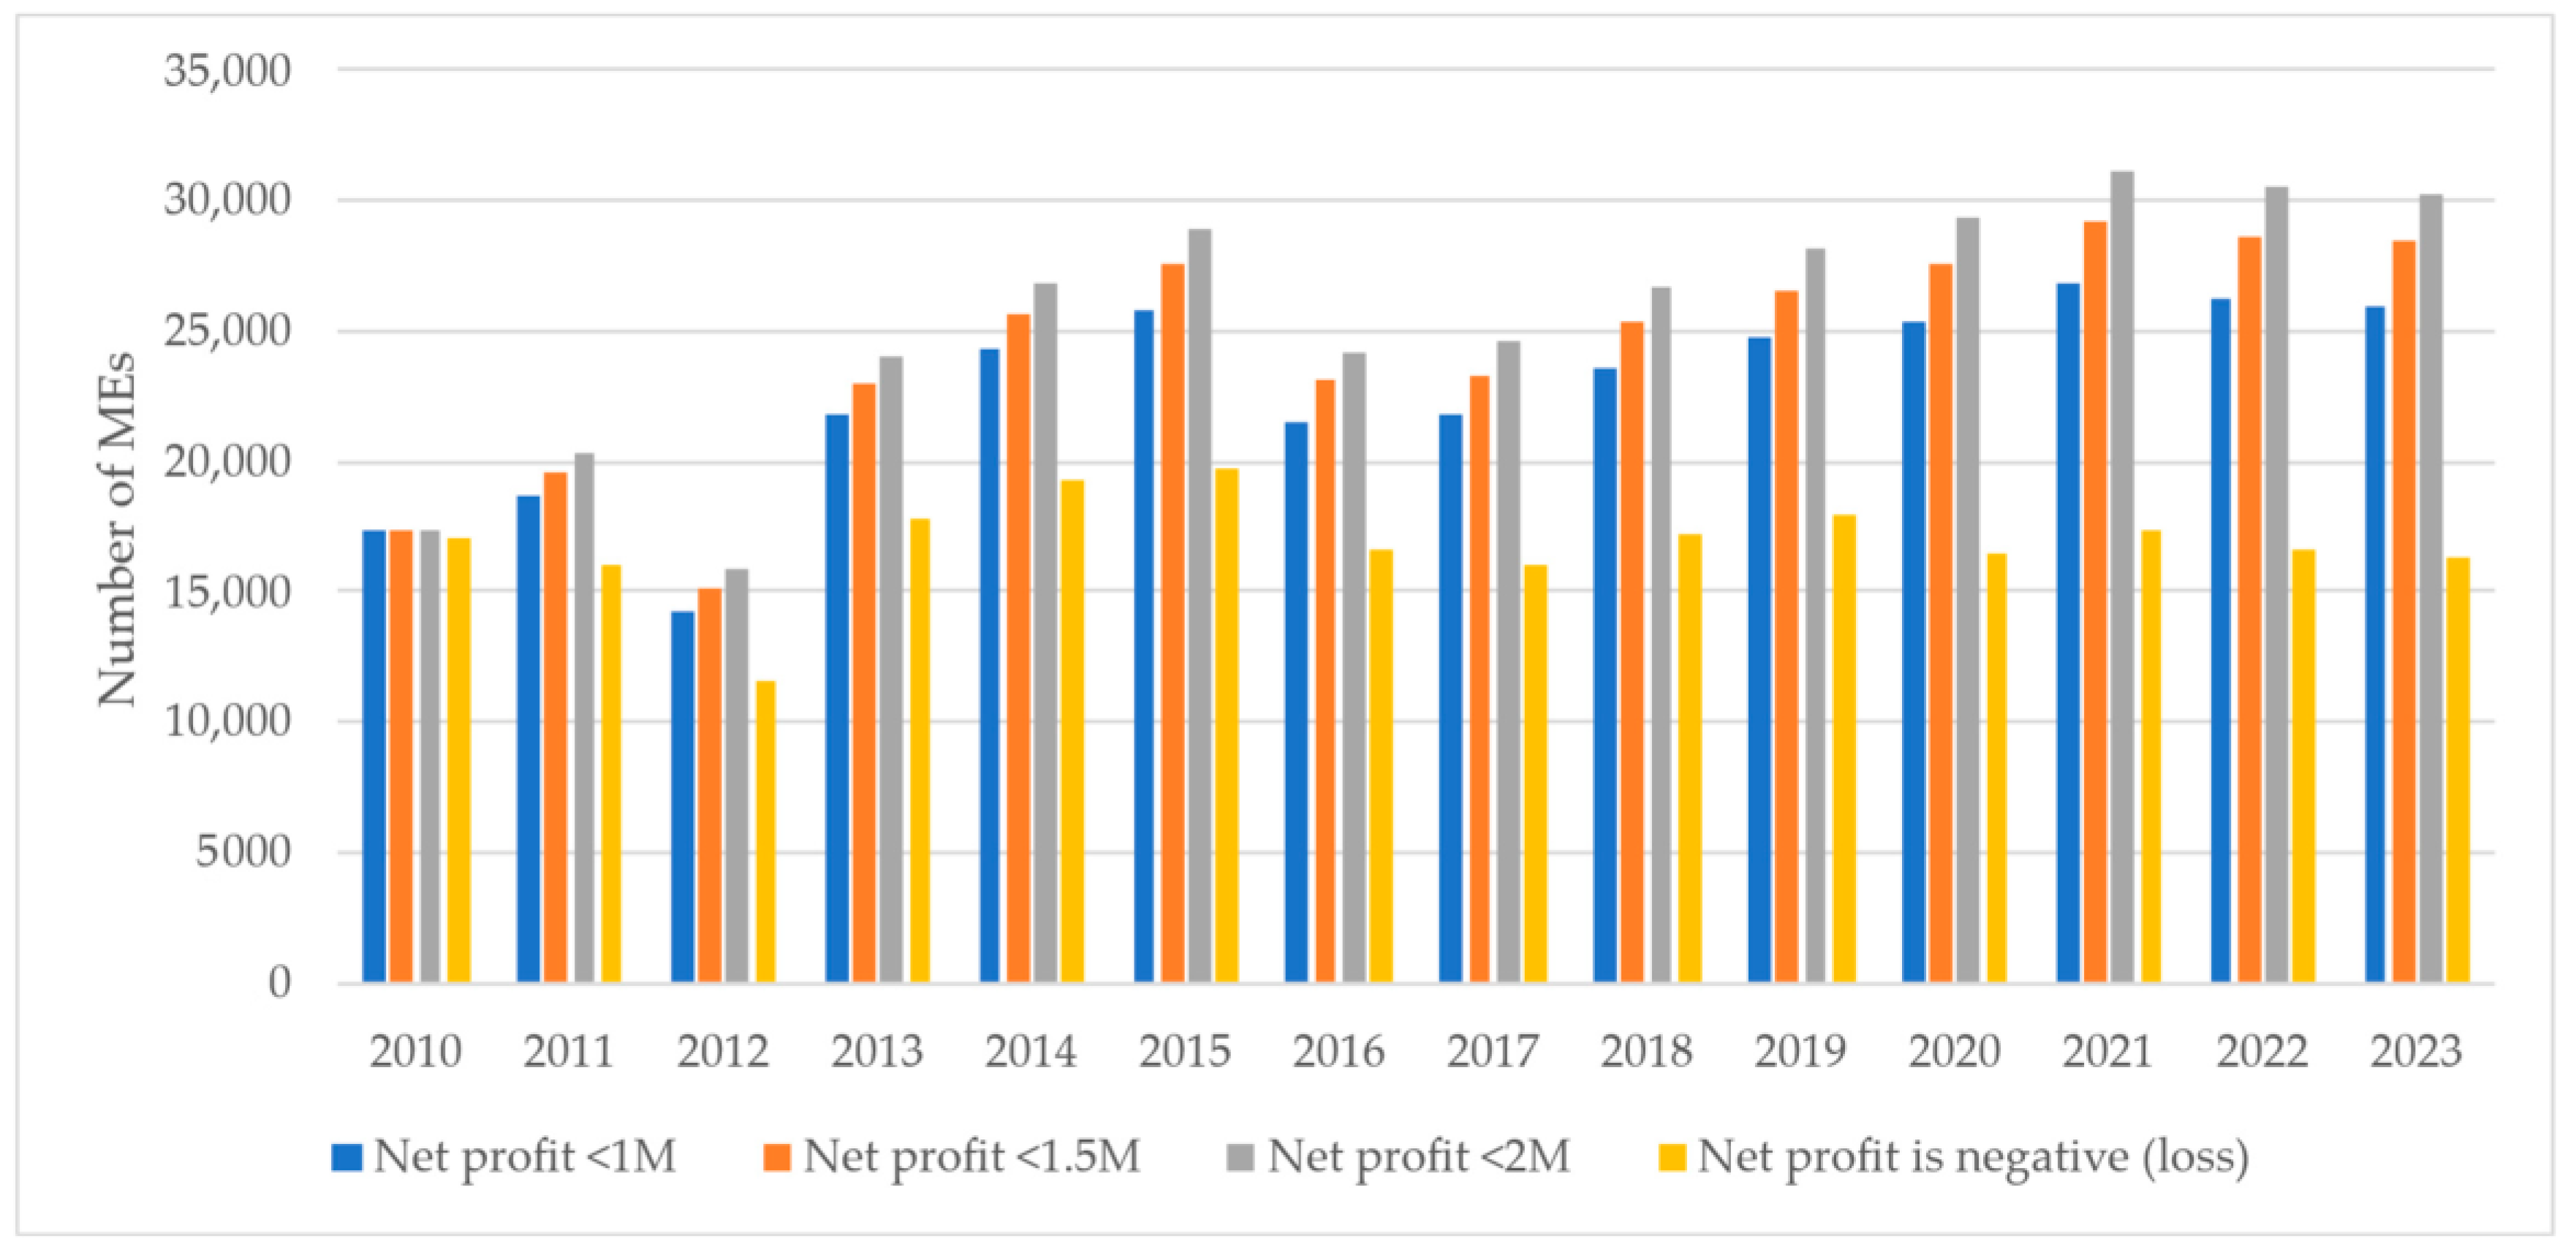
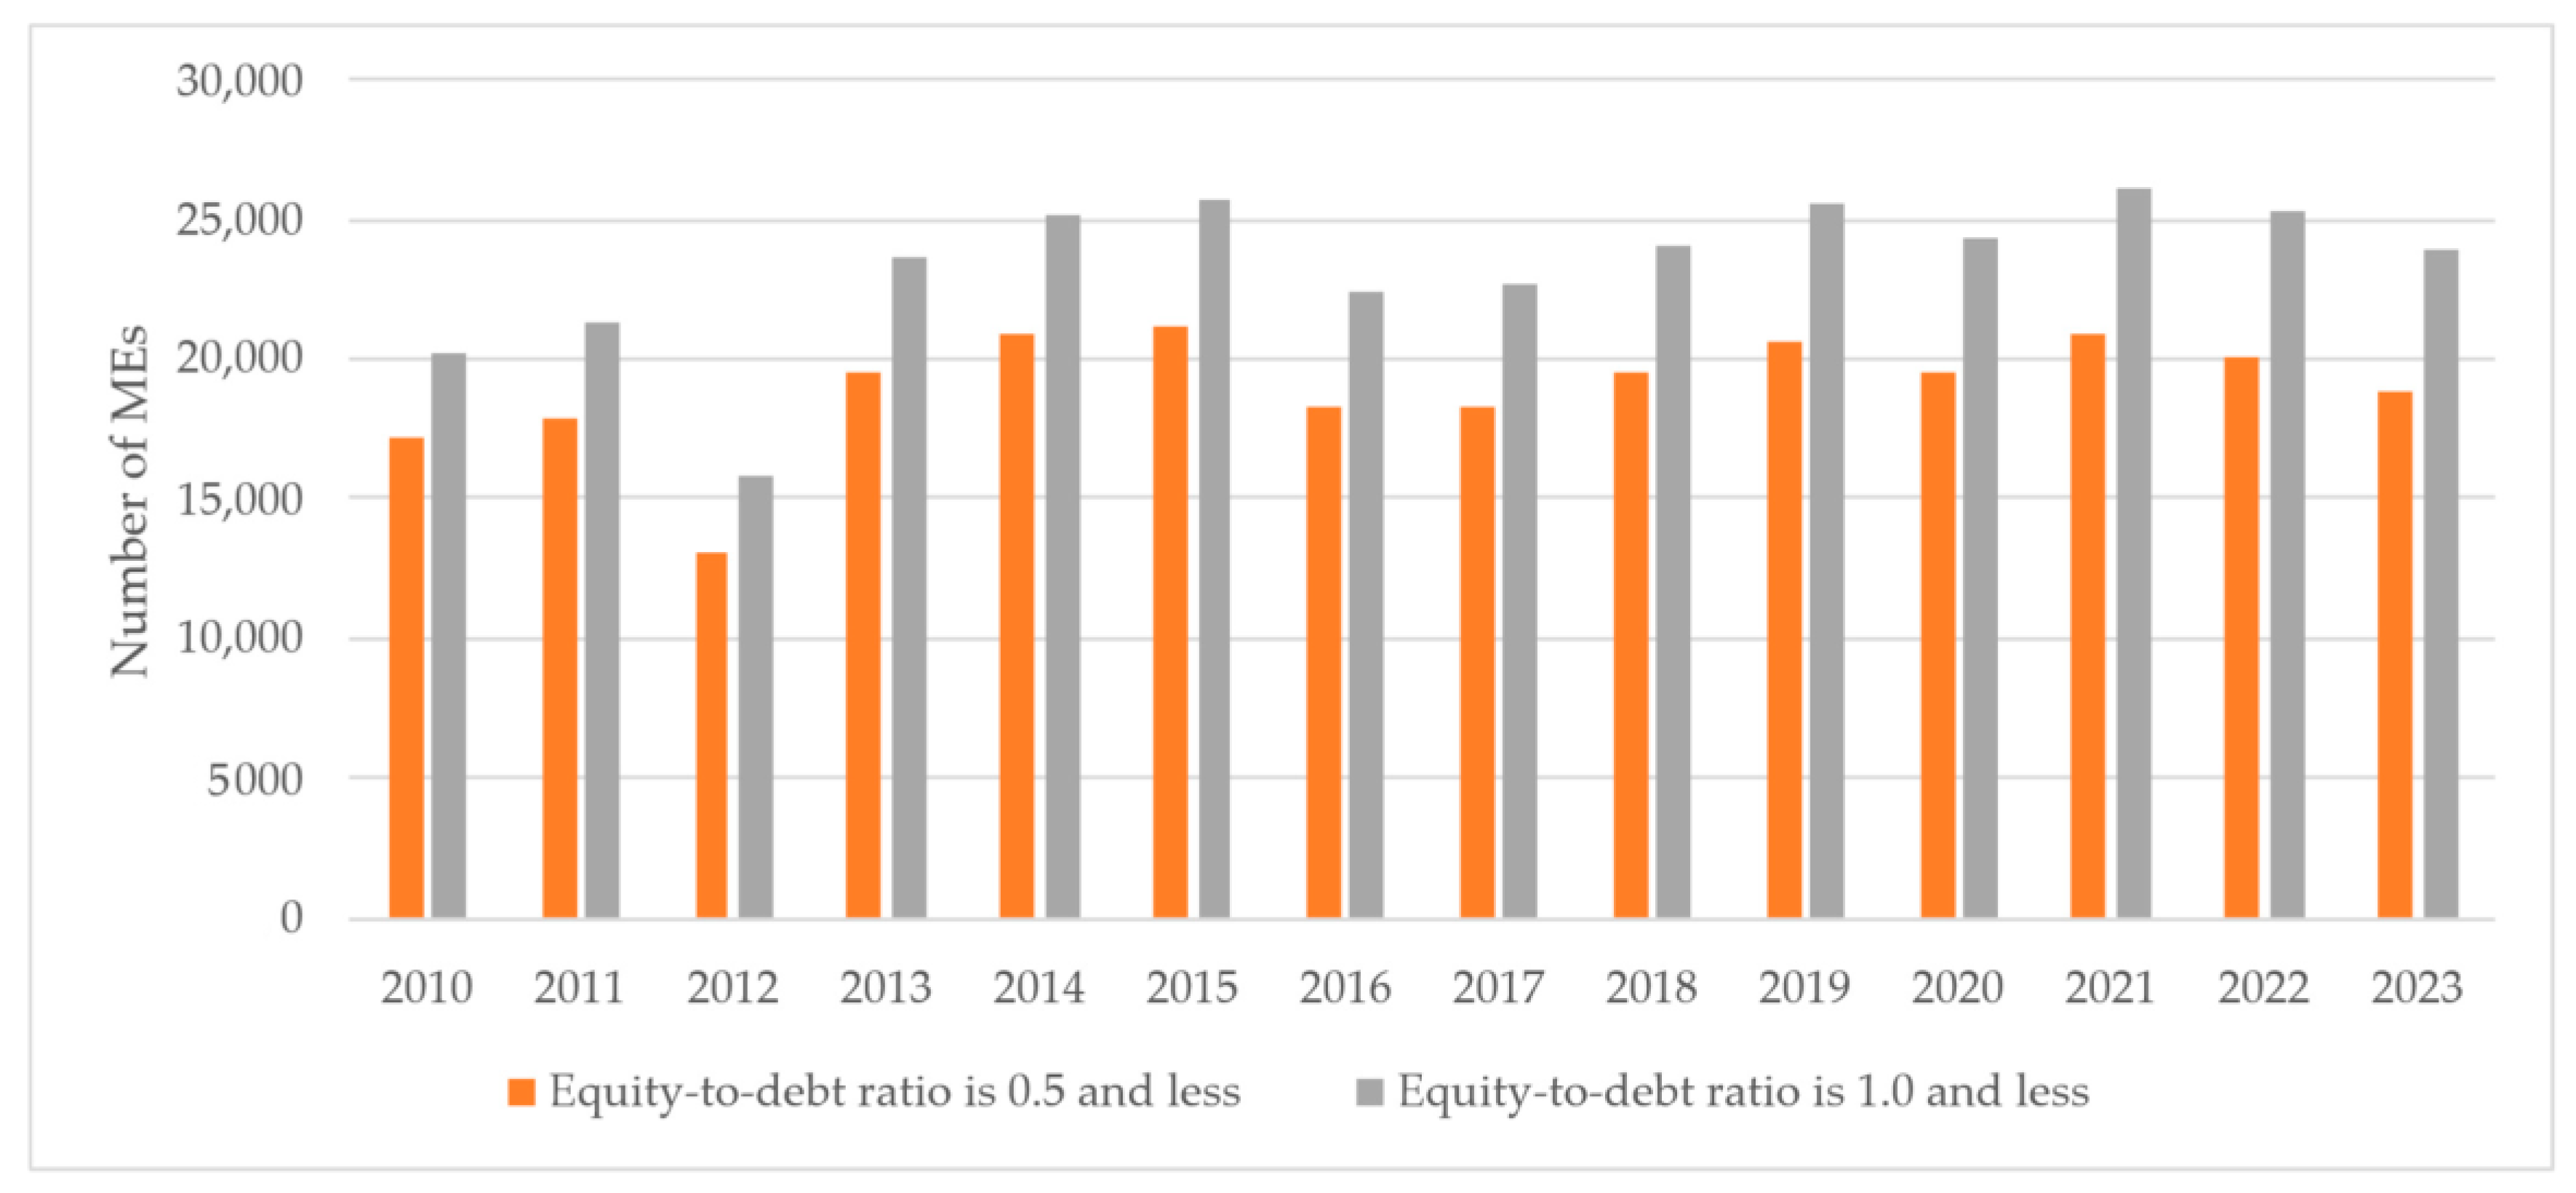
4.2.4. Number of Low-Profit and Low-Solvency Micro-Enterprises

In Lithuania, a significant number of MEs earn low net profit, suffer losses (Figure 6), or are low-solvency MEs (Figure 7).
As shown in Figure 6, in Lithuania, more than 16,000 (about 17%) MEs suffered losses, and 26,000 (net profit <1M), 28,000 (net profit <1.5M), and 30,000 (net profit < 2M) MEs earned a low profit in 2023. While the number of loss-making MEs decreased by 0.3% per year, the number of low-profit MEs tended to increase over the period. Namely, the number of MEs earning the lowest net profit (<2M) grew the most (i.e., by 4.4% per year), while the number of MEs earning net profit below the median value (<1M) increased by 3.2% per year. This likely demonstrates that fewer MEs were unable to make any investments, and more MEs could have been short of the finances required to implement energy-efficiency-related projects independently and, therefore, required assistance from the EU structural funds or the banking sector.
The number of insolvent MEs with a very low estimated equity-to-liabilities ratio (0.5 or less) was about 19,000 in 2023, 10% more than in 2010 (Figure 7).
After increasing the threshold of the estimated equity-to-liabilities ratio to 1.0, the number of insolvent MEs increased by 5145 to 23,958 in 2023, suggesting that from the sample of insolvent MEs, 79% of them face a very bad situation and 21% face a bad situation.

4.3. Developments in Economic Outcome of Vulnerable Micro-Enterprises
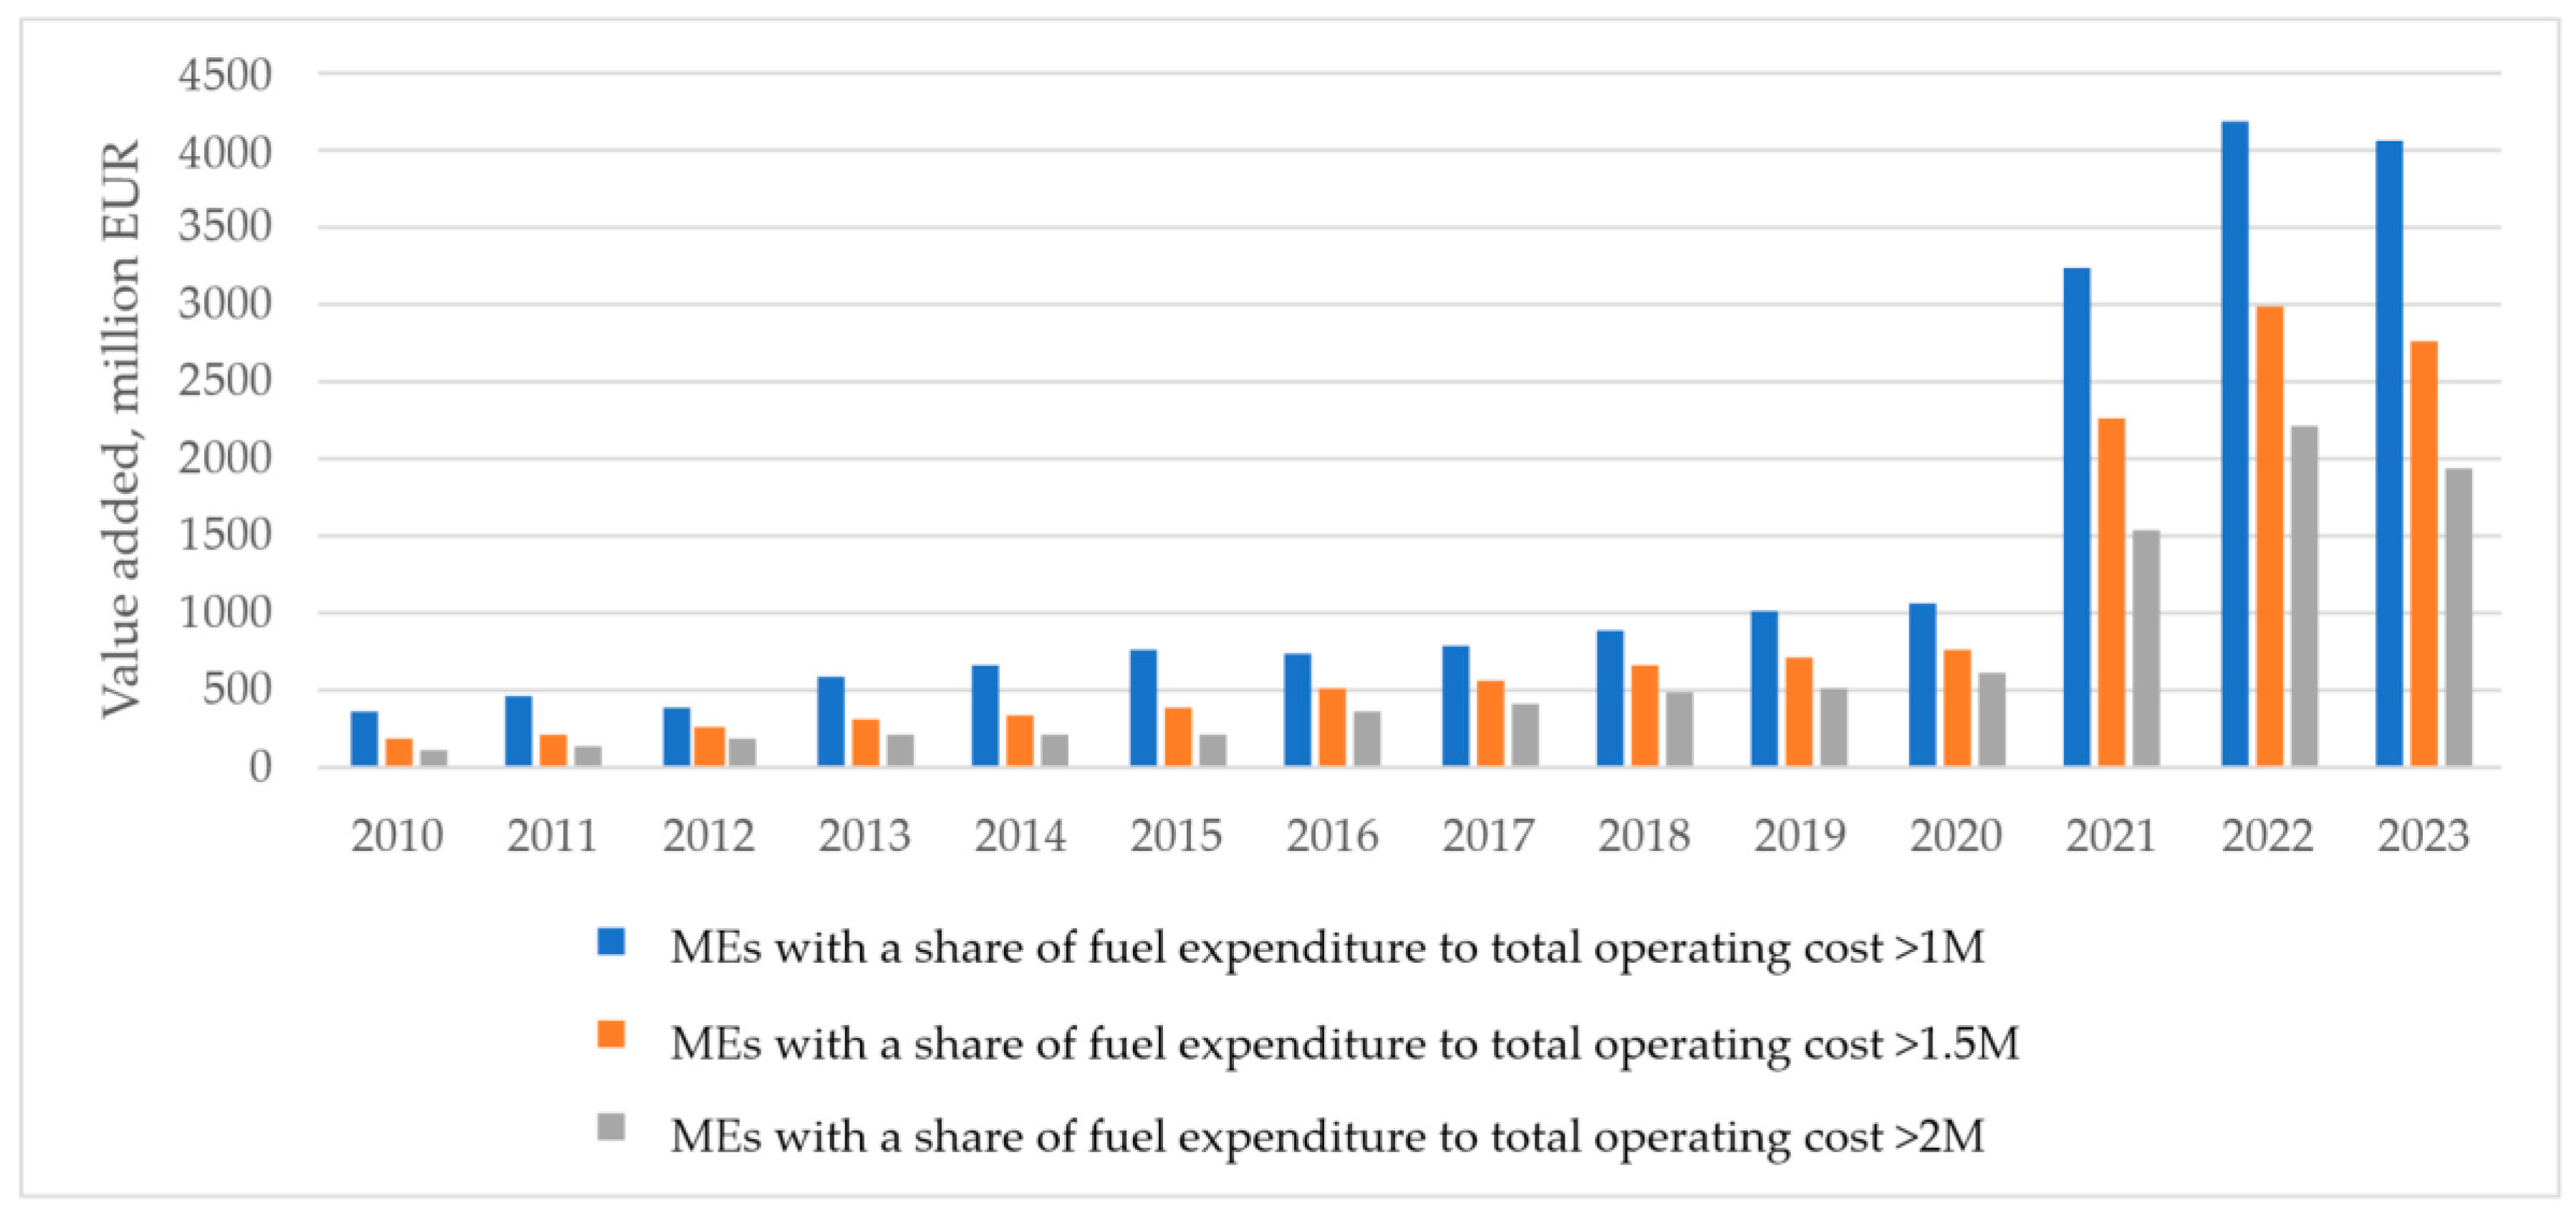
4.3.1. Value Added

Vulnerable MEs played an increasing role in economy in terms of value added (Figure 8).
As shown in Figure 8, from 2010 to 2020, the value added in MEs with a share of fuel expenditure to total operating costs above 1M grew by 11% per year, reaching EUR 1066 million in 2020. In MEs with fuel expenditure total operating costs above 1.5M and 2M, faster increase rates of 15% and 19% per year were observed, reaching EUR 767 million and 604 million in 2020, respectively. Value added later grew by three- to four-fold. In 2023, between 5% (EUR 1945 million) and 11% (EUR 4074 million) of total value added in Lithuania was created by vulnerable MEs, in comparison to between 1% (EUR 105 million) and 4% (EUR 365 million) in 2010.

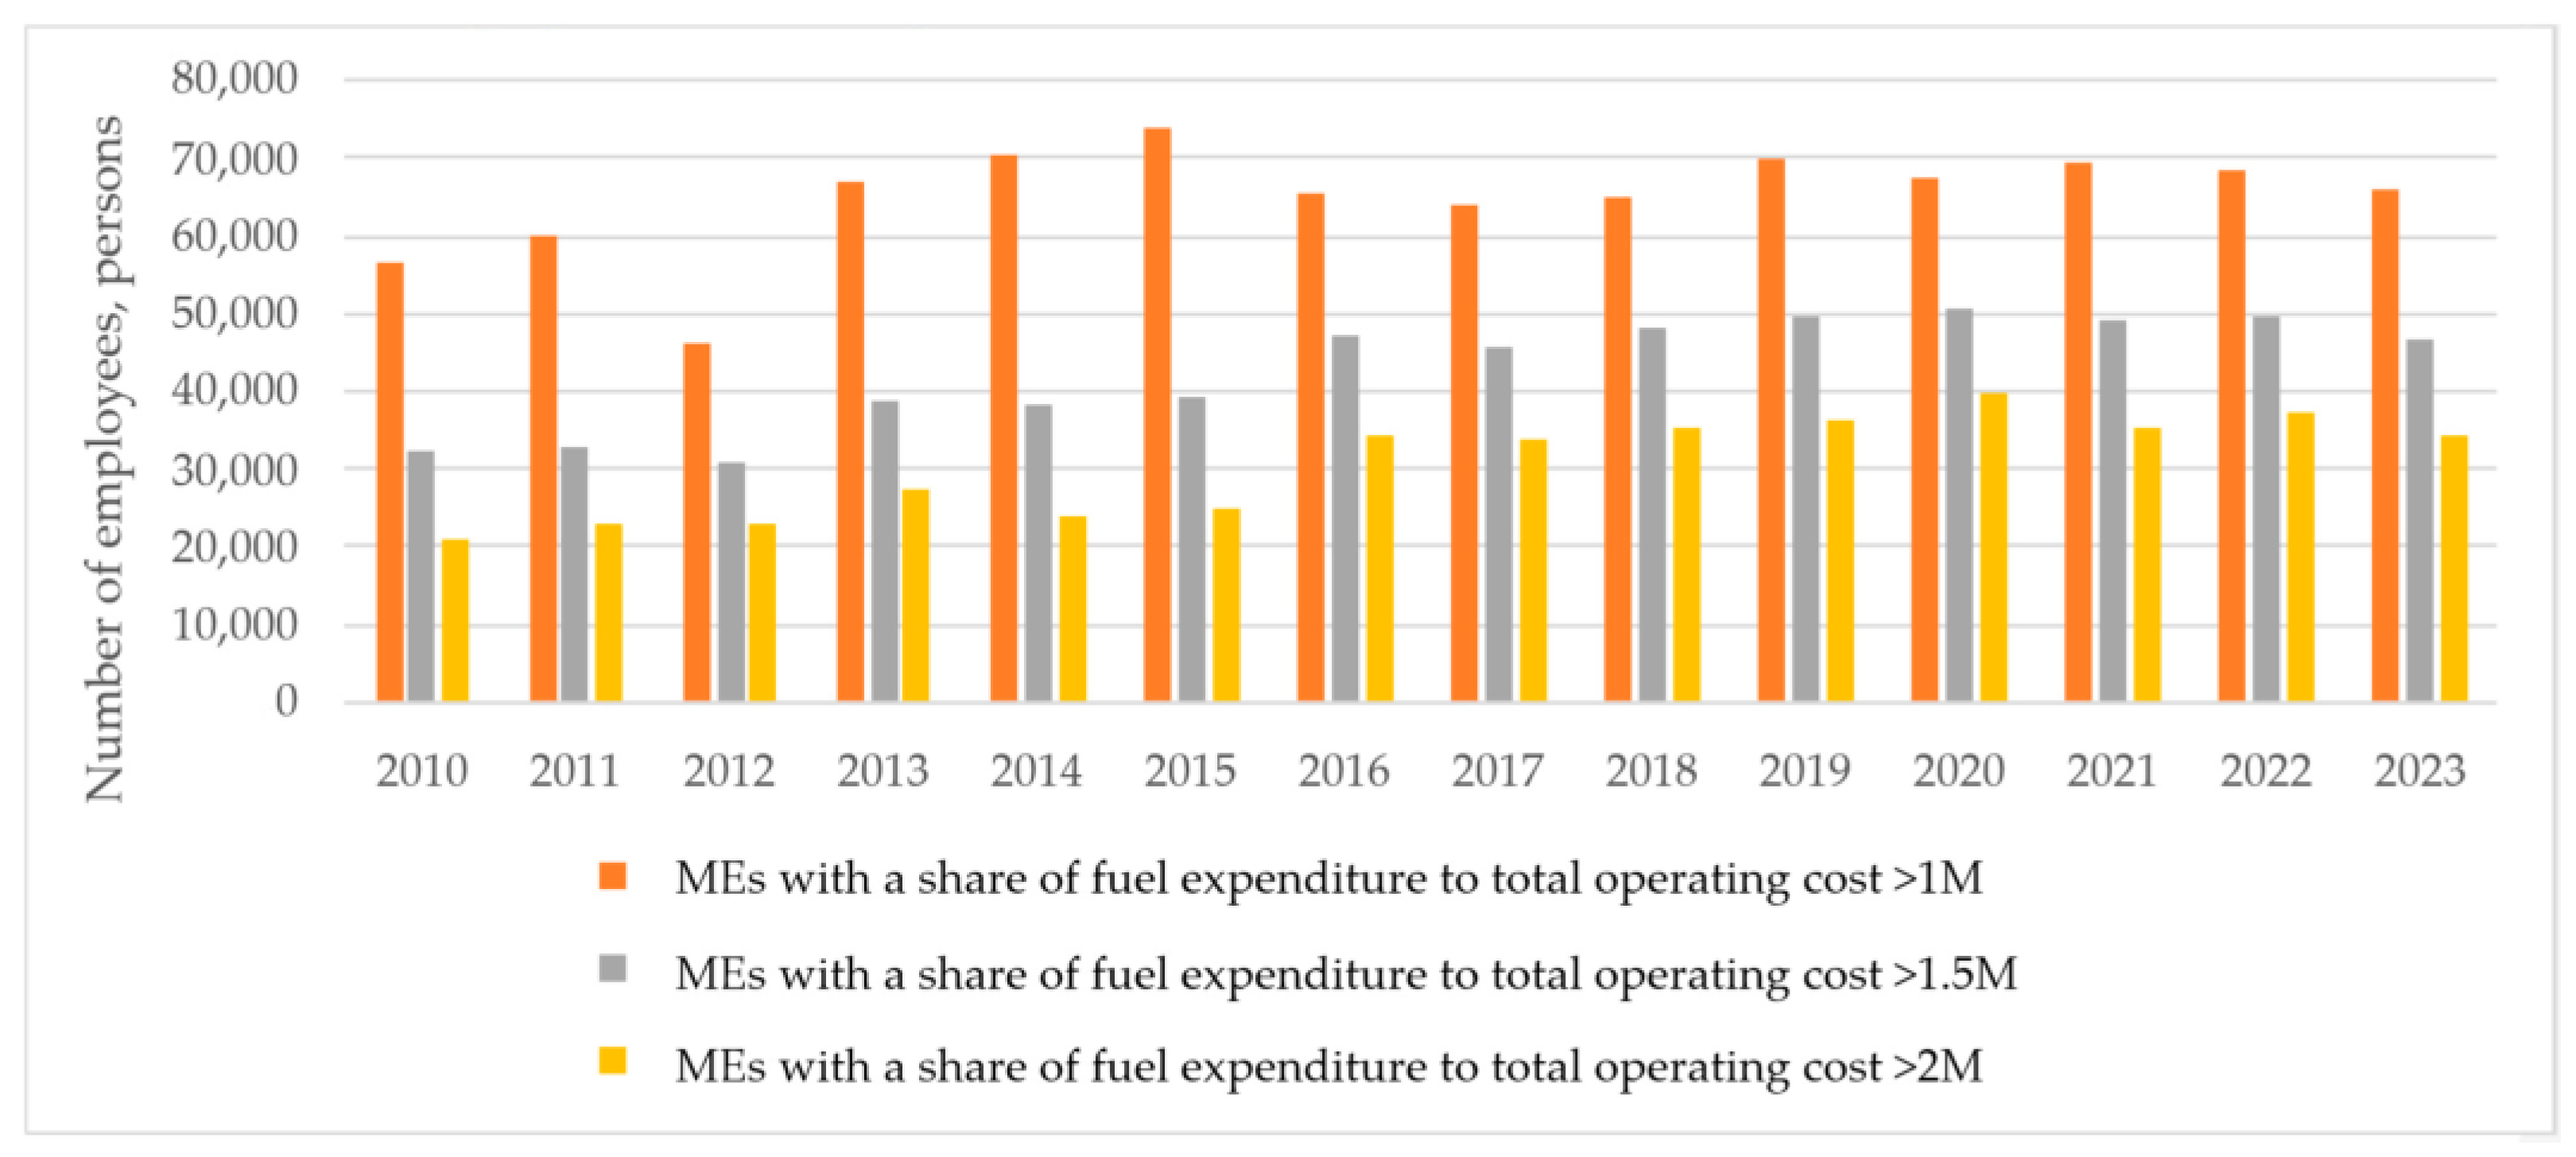
4.3.2. Number of Employees

In 2023, around 35,000 employees worked in vulnerable MEs experiencing a share of fuel expenditure to total operating costs >2M (Figure 9). These were 3.3% of the total employees or 17% of people employed in MEs. In comparison to 2010, the number of employees increased by 60%.
Vulnerable MEs with a share of fuel expenditure to total operating costs >1M employed more than 66,000 persons or 6.4% of the total economy in 2023 and demonstrated a 1.2% increase per year. Vulnerable MEs with a share of fuel expenditure to total operating costs > 1.5M employed nearly 47,000 persons or 4.5% of the total economy in 2023.

5. Discussion

5.1. Practical Implications

Implementing the EU SCF regulation 2023/955 [6] represents a significant advancement in the EU’s climate policy moving forward with the European Green Deal, “Fit for 55”, and REPowerEU packages. The extension of EU-ETS to road transport and building sectors recognizes the socioeconomic impacts and unbearable weight that this policy may impose on vulnerable MEs and households. As a counterweight, the SCF regulation [6] calls for the allocation of dedicated funds to support vulnerable groups to ensure that the green transition does not put additional financial burdens on weaker entities, reinforcing public acceptance and social cohesion. This is especially crucial considering recent political events in which part of the developed world has shown resistance to climate policies perceived as regressive or unjust, and have moved back towards fossil fuels.
With this research, we help Lithuanian policymakers to prepare for the implementation of regulation regarding the expansion of the EU-ETS into new economic sectors in the country. Specifically, by proposing a set of indicators to identify the vulnerability of MEs according to various criteria, we create value for policymakers because we enable them to identify the number of vulnerable MEs in a country by economic activity and region based on the estimates to evaluate impacts and subsequently plan the allocation of funds for the implementation of policy measures. This includes grants for purchasing electric cars and non-polluting vehicles and subsidies for the implementation of energy efficiency measures based on energy audit reports. In the case of Lithuania, the research results are significant for the preparation of the country’s SCP. Among other things, we provide estimates of the number of vulnerable MEs in Lithuania from a historical perspective and determine the role of these MEs in the Lithuanian economy. This provides insights into value added and employment opportunities that were historically created by vulnerable MEs and are now at risk due to the expansion of the EU-ETS. The methodology of our research is also significant for EU MSs in preparing their national SCP as it introduces various data sources, and vulnerability factors and indicators should be considered.

5.2. Theoretical Implications

During the research, we found that access to primary data sources, the existence of direct links between them, and data availability are relevant for all stakeholders when seeking to implement the SCF regulation [6] and subsequently monitor its effectiveness.
We have noted that it is appropriate to determine the number of vulnerable MEs using real estate [63] and road transport [62] registration databases. In detail, information about MEs registered or located in the lowest performance class of building stock and owning old fossil fuel-based road vehicles must be accessible. Thus far, this has not been possible due to data integrity and the lack of interconnection between different databases. In conditions of shortages in data and its sources, it is necessary to use other means. The official database of the State Data Agency of Lithuania [64] is highly important as it collects business structure research indicators of all types of enterprises, excluding individual companies and natural persons (self-employed). These individuals require greater attention from statisticians as there is insufficient business structure research information about them in the official database. Once statisticians have collected business structure indicators for individual companies and natural persons, it will be possible to refine the method of determining the number of vulnerable MEs in Lithuania. It is understood that the number will increase from the current estimates. We observed that regardless of which indicators we use to describe the vulnerability of MEs, the estimates of the number of vulnerable MEs are very similar. Therefore, it can be said that vulnerability indicators do not have a significant impact on the quality of the SCP. However, we have noticed that differences appear with regard to which MEs are considered vulnerable and eligible for SCF funding. Regarding the selection of MEs belonging to the SCF regulatory area, the selection of indicators is particularly important for Lithuanian policymakers. Therefore, considering the Lithuanian context and after discussion of the results with the active stakeholders, it is finally proposed to adapt the following vulnerability indicators from the list of more than 20 to quantify the number of vulnerable MEs in Lithuania in the context of SCF regulation:
A share of fuel cost in total operating costs higher than the industry’s 2M. When the industry’s 2M is higher than the national 2M, then the indicator is calculated from the national 2M;
Net profitability lower than the industry’s 2M. When the industry’s 2M is lower than the national 2M, then the indicator is calculated from the national 2M;
The equity-to-liabilities ratio of the ME is 0.5 or less;
Fuel intensity is higher than the industry’s 2M. When the industry’s 2M is higher than the national 2M, then the indicator is calculated from the national 2M.
We link vulnerability in MEs to business structure research indicators; for this purpose, a quantitative assessment method is applied. Thus far, such dimensions of vulnerable MEs as innovation capacity, digitalization, market access limitations, entrepreneurial competencies, gender aspects of vulnerable MEs, and so on, remain unexplored. However, their inclusion could refine the method of determining the number of vulnerable MEs in Lithuania and will be addressed in the future by developing a more holistic vulnerability profile, which will also consider qualitative assessment aspects. The results could be applied in future research to study the impacts of EU-ETS2 implementation from a long-term perspective and the selection of national measures to manage vulnerability in MEs.

5.3. Comparison of Research Results with Global Findings

Despite the significance of the EU SCF regulation [6], there is a noticeable scarcity of peer-reviewed scientific studies analyzing its implementation in detail. As the regulation only came into effect recently and is still in its transitional phase, much of the existing discourse is limited to policy briefs, institutional reports, and legal analyses produced by NGOs, think tanks, or governmental bodies. Key challenges facing its implementation also lie in the limited and granular data and lack of tested methodologies to guide the EU MSs in designing an effective and equitable SCP. This lack of a solid empirical foundation risks reducing the SCF’s potential to deliver on its dual social protection and climate action objectives.

6. Conclusions

The aim of this research was to understand SCF regulation with regard to a sample of vulnerable MEs, develop a set of indicators to identify the number of MEs and show their significance to the national economy, as well as to propose data sources and assess their customization possibilities.
The historical developments in the vulnerable MEs and their role in the Lithuanian economy were assessed considering the vulnerability factors of the ETS2’s impact on prices of goods and services, the limited access to capital, and the insufficient financial capacity of MEs and key economic variables, including value added and employment, in the context of restricted access to full datasets.
The analysis of fuel expenditure and share of fuel expenditure to total operating costs showed that MEs involved in transportation, and storage activities had the highest fuel expenditure (EUR 17,200) and share of fuel expenditure in total operating costs (24.96%) in 2023, making these economic activities the most vulnerable to EU-ETS2. Fuel expenditure, and the share of fuel expenditure in total operating costs significantly reduced (from EUR 10,000 (22.77%) in 2010 to 900 (2.7%) in 2023) in electricity, gas, steam, and air conditioning supply activities due to the implementation of measures improving energy efficiency and increasing the use of renewable energy sources. This resulted in significantly reduced vulnerability in MEs involved in these sectors.
The analysis demonstrated that the number of vulnerable MEs tended to increase in Lithuania from 2010 to 2023, irrespective of the vulnerability factor, related indicator, and vulnerability threshold considered. Overall, at the highest threshold (2M) of fuel expenditure and share of fuel expenditure in total operating costs, there were 14,000–18,000 vulnerable MEs in Lithuania in 2023. Subject to a reduced vulnerability threshold from 1.5M to 1.0M, the number of vulnerable MEs could have increased to 19,000–25,000 in 2023, demonstrating that every seventh to every fourth ME was vulnerable in the country. Looking at the number of vulnerable MEs from the perspective of low financial capacity, it can be seen that, due to losses and very low net profits (<2M), there could be 16,000–30,000 vulnerable MEs in the country and 19,000 MEs if insolvencies are considered.
The results of analysis of the role of vulnerable MEs revealed that they play an essential role in the economy by providing jobs and creating added value. In 2023, 34,000–66,000 persons were employed in vulnerable MEs. They created value added of EUR 2–4 billion, or 5–11% of total value added generated by the economy.
The results indicate the necessity for policymakers to consider policies and measures supporting vulnerable MEs in the context of the expansion of the EU-ETS2 to building and road transport sectors. This could include grants for purchasing electric cars and non-polluting vehicles and subsidies for the implementation of energy efficiency measures based on energy audit reports.

Author Contributions

Conceptualization: V.B.; methodology: V.B.; investigation: V.B. and E.N.; supervision: V.B.; writing and review: V.B., E.N., D.T. and I.K. All authors have read and agreed to the published version of the manuscript. All the authors have read and agreed to the published version of this manuscript.

Funding

This study received funding in accordance with the Service Agreement No SP/1387/4 between ECORYS Polska Spółka z ograniczoną odpowiedzialnością and Lithuanian Energy Institute for Project “TSIC-RoC-25400 Support to the Preparation of Social Climate Plans”.

Institutional Review Board Statement

Not applicable.

Informed Consent Statement

Not applicable.

Data Availability Statement

Data are available in a publicly accessible repository that does not issue DOIs. Publicly available datasets were analyzed in this study. These data can be found at https://osp.stat.gov.lt/ (accessed on 12 September 2024); https://www.regitra.lt/lt/atviri-duomenys/ (accessed on 8 April 2025).

Conflicts of Interest

The authors declare no conflicts of interest.

References

  1. European Commission. Completion of Key ‘Fit for 55’ Legislation. 2023. Available online: https://ec.europa.eu/commission/presscorner/detail/en/ip_23_4754 (accessed on 8 April 2025).
  2. European Commission. About the EU ETS. Available online: https://climate.ec.europa.eu/eu-action/eu-emissions-trading-system-eu-ets/about-eu-ets_en (accessed on 8 April 2025).
  3. European Commission. Effort Sharing 2021–2030: Targets and Flexibilities. 2025. Available online: https://climate.ec.europa.eu/eu-action/effort-sharing-member-states-emission-targets/effort-sharing-2021-2030-targets-and-flexibilities_en (accessed on 23 May 2025).
  4. European Commission. ETS2: Buildings, Road Transport and Additional Sectors. 2025. Available online: https://climate.ec.europa.eu/eu-action/eu-emissions-trading-system-eu-ets/ets2-buildings-road-transport-and-additional-sectors_en (accessed on 23 May 2025).
  5. Wettengel, J. EU ETS Must Be Reformed to Make It More Resilient to Crises—Analysis. Clean Energy Wire. 2024. Available online: https://www.cleanenergywire.org/news/eu-ets-must-be-reformed-make-it-more-resilient-crises-analysis (accessed on 23 May 2025).
  6. The European Parliament and the Council of the European Union. Regulation (EU) 2023/955 of the European Parliament and of the Council of 10 May 2023 Establishing a Social Climate Fund and Amending Regulation (EU) 2021/1060. 10 May 2023. Available online: https://eur-lex.europa.eu/legal-content/EN/TXT/?uri=CELEX%3A32023R0955 (accessed on 8 April 2025).
  7. Ginevičius, R. The efficiency of municipal waste management systems in the environmental context in the countries of the European Union. J. Int. Stud. 2022, 15, 63–79. [Google Scholar] [CrossRef]
  8. Miškinis, V.; Galinis, A.; Konstantinavičiūtė, I.; Bobinaitė, V.; Niewierowicz, J.; Neniškis, E.; Norvaiša, E.; Tarvydas, D. Key Determinants of Energy Intensity and Greenhouse Gas Emission Savings in Commercial and Public Services in the Baltic States. Energies 2025, 18, 735. [Google Scholar] [CrossRef]
  9. Lazdinis, M.; Carver, A.; Tõnisson, K.; Silamikele, I. Innovative use of forest policy instruments in countries with economies in transition: Experience of the Baltic States. For. Policy Econ. 2005, 7, 527–537. [Google Scholar] [CrossRef]
  10. Lukkarinen, J.P.; Das, R.R.; Laakso, S.; Martiskainen, M. Using energy vulnerability framework to understand household agency in sustainability transitions: Experiences from Canada and Finland. Environ. Innov. Soc. Transit. 2024, 52, 100892. [Google Scholar] [CrossRef]
  11. Bardazzi, R.; Grazia, M. Vulnerable Households in the Energy Transition. Energy Poverty, Demographics and Policies; Studies in Energy, Resource and Environmental Economics; Springer: Berlin/Heidelberg, Germany, 2023. [Google Scholar] [CrossRef]
  12. Streimikiene, D.; Lekavičius, V.; Baležentis, T.; Kyriakopoulos, G.L.; Abrhám, J. Climate Change Mitigation Policies Targeting Households and Addressing Energy Poverty in European Union. Energies 2020, 13, 3389. [Google Scholar] [CrossRef]
  13. López, I.; García-Valdecasas, J.I.; Lasierra, C.M. Household strategies for coping with energy poverty: Technological and socio-familial dilemmas. Energy Build. 2025, 329, 115117. [Google Scholar] [CrossRef]
  14. Szczygieł, O.; Harbiankova, A.; Manso, M. Where Does Energy Poverty End and Where Does It Begin? A Review of Dimen-sions, Determinants and Impacts on Households. Energies 2024, 17, 6429. [Google Scholar] [CrossRef]
  15. Faulkner, J.P.; Murphy, E.; Scott, M. Rural household vulnerability a decade after the great financial crisis. J. Rural. Stud. 2019, 72, 240–251. [Google Scholar] [CrossRef]
  16. Tian, S.; Wu, Y.; Zhou, W. Digitalization and Income Inequality: Evidence from Households; Asian Development Bank: Mandaluyong City, Philippines, 2025. [Google Scholar] [CrossRef]
  17. Dorantes, L.M.; Murauskaite-Bull, I. Revisiting transport poverty in Europe through a systematic review. Transp. Res. Procedia 2023, 72, 3861–3868. [Google Scholar] [CrossRef]
  18. Primc, K.; Zabavnik, D.; Slabe-Erker, R.; Dominko, M. Transport poverty vulnerability index: Making use of standardised databases. Energy Res. Soc. Sci. 2025, 123, 104041. [Google Scholar] [CrossRef]
  19. Mamun, A.A.; Fazal, S.A.; Zainol, N.R. Economic Vulnerability, Entrepreneurial Competencies, and Performance of Informal Micro-Enterprises. J. Poverty 2019, 23, 415–436. [Google Scholar] [CrossRef]
  20. Caraka, R.E.; Kurniawan, R.; Nasution, B.I.; Jamilatuzzahro, J.; Gio, P.U.; Basyuni, M.; Pardamean, B. Micro, Small, and Medium Enterprises’ Business Vulnerability Cluster in Indonesia: An Analysis Using Optimized Fuzzy Geodemographic Clustering. Sustainability 2021, 13, 7807. [Google Scholar] [CrossRef]
  21. Mustapa, W.N.b.W.; Al Mamun, A.; Ibrahim, M.D. The Effect of Economic Vulnerability on the Participation in Development Programs and the Socio-Economic Well-Being of Low-Income Households. Societies 2018, 8, 60. [Google Scholar] [CrossRef]
  22. Zainol, N.R.; Al Mamun, A.; Hassan, H.; Muniady, R. Examining the effectiveness of micro-enterprise development programs in Malaysia. J. Int. Stud. 2017, 10, 292–308. [Google Scholar] [CrossRef]
  23. Pearlman, S. Too Vulnerable for Microfinance? Risk and Vulnerability as Determinants of Microfinance Selection in Lima. J. Dev. Stud. 2012, 48, 1342–1359. [Google Scholar] [CrossRef]
  24. Suarez Ambriz, D.; Sánchez-Garcia, J.Y.; Núñez-Ríos, J.E. An Organizational Framework for Microenterprises to Face Exogenous Shocks: A Viable System Approach. Adm. Sci. 2024, 14, 315. [Google Scholar] [CrossRef]
  25. Lo, A.Y.; Liu, S.; Chow, A.S.Y.; Pei, Q.; Cheung, L.T.O.; Fok, L. Business vulnerability assessment: A firm-level analysis of micro- and small businesses in China. Nat. Hazards 2021, 108, 867–890. [Google Scholar] [CrossRef]
  26. Safavian, M.S.; Graham, D.H.; Gonzalez-Vega, C. Corruption and Microenterprises in Russia. World Dev. 2001, 29, 1215–1224. [Google Scholar] [CrossRef]
  27. Ehlers, T.B.; Main, K. WOMEN AND THE FALSE PROMISE OF MICROENTERPRISE. Gend. Soc. 1998, 12, 424–440. [Google Scholar] [CrossRef]
  28. Abisuga-Oyekunle, O.A.; Fillis, I.R. The role of handicraft micro-enterprises as a catalyst for youth employment. Creat. Ind. J. 2016, 10, 59–74. [Google Scholar] [CrossRef]
  29. Garagorri, I. SME Vulnerability Analysis: A Tool for Business Continuity. In Competitive Strategies for Small and Medium Enterprises; North, K., Varvakis, G., Eds.; Springer: Cham, Switzerland, 2016. [Google Scholar] [CrossRef]
  30. Monsson, C.K. Chapter 4: Vulnerability and adaptability: Post-crisis resilience of SMEs in Denmark. In Creating Resilient Economies; Edward Elgar Publishing Ltd.: Cheltenham, UK, 2017. [Google Scholar] [CrossRef]
  31. Dallago, B.; Guglielmetti, C. The Consequences of the International Crisis for European SMEs; Routledge: London, UK, 2014. [Google Scholar] [CrossRef]
  32. Chen, S.; Lee, D. Small and vulnerable: SME productivity in the great productivity slowdown. J. Financ. Econ. 2023, 147, 49–74. [Google Scholar] [CrossRef]
  33. Heller, D.; Karapanagiotis, P.; Nilsen, Ø.A. Small and vulnerable during crises? Firm size and financing constraint dynamics. Small Bus. Econ. 2025, 1573-0913. [Google Scholar] [CrossRef]
  34. Erdiaw-Kwasie, M.O.; Abunyewah, M.; Yusif, S.; Arhin, P. Small and medium enterprises (SMEs) in a pandemic: A systematic review of pandemic risk impacts, coping strategies and resilience. Heliyon 2023, 9, e20352. [Google Scholar] [CrossRef]
  35. Dua, A.; Ellingrud, K.; Mahajan, D.; Silberg, J. Which Small Businesses Are Most Vulnerable to COVID-19—And When. McKinsey. 18 June 2020. Available online: https://www.mckinsey.com/featured-insights/americas/which-small-businesses-are-most-vulnerable-to-covid-19-and-when (accessed on 11 April 2025).
  36. Kaya, O. The impact of late payments on SMEs’ access to finance: Evidence from credit rationing and loan terms. Econ. Model. 2024, 141, 106896. [Google Scholar] [CrossRef]
  37. Udell, G. SME Access to Finance and the Global Financial Crisis. J. Financ. Manag. Mark. Inst. 2020, 8, 2040003. [Google Scholar] [CrossRef]
  38. Alam, A.; Du, A.M.; Rahman, M.; Yazdifar, H.; Abbasi, K. SMEs respond to climate change: Evidence from developing countries. Technol. Forecast. Soc. Change 2022, 185, 122087. [Google Scholar] [CrossRef]
  39. Nkwinika, E.; Akinola, S. The importance of financial management in small and medium-sized enterprises (SMEs): An analysis of challenges and best practices. Technol. Audit Prod. Reserves 2023, 5, 12–20. [Google Scholar] [CrossRef]
  40. Hojnik, B.; Huđek, I. Small and Medium-Sized Enterprises in the Digital Age: Understanding Characteristics and Essential Demands. Information 2023, 14, 606. [Google Scholar] [CrossRef]
  41. Pugnetti, C.; Casián, C. Cyber Risks and Swiss SMEs. An Investigation of Employee Attitudes and Behavioral Vulnerabilities 2021. ZHAW School of Management and Law, Winterthur. Available online: https://digitalcollection.zhaw.ch/server/api/core/bitstreams/4346e5a4-a78b-4e8f-bf48-e3615fa09d25/content (accessed on 11 April 2025).
  42. Fan, L.; Sun, Y.; Wu, T.-J. Is climate policy uncertainty an angel or a devil? Empirical evidence from corporate digital transformation. Int. Rev. Financ. Anal. 2025, 103, 104135. [Google Scholar] [CrossRef]
  43. Jayasekara, B.E.A.; Fernando, P.N.D.; Ranjani, R.P.C. A Systematic Literature Review on Financial Stress of Small and Medium Entrepreneurs. Appl. Econ. Bus. 2020, 4, 45–59. [Google Scholar] [CrossRef]
  44. Alshebami, A.S. Crisis Management and Customer Adaptation: Pathways to Adaptive Capacity and Resilience in Micro- and Small-Sized Enterprises. Sustainability 2025, 17, 3759. [Google Scholar] [CrossRef]
  45. European Commission. Internal Market, Industry, Entrepreneurship and SMEs. Data and Surveys—SAFE. Available online: https://single-market-economy.ec.europa.eu/access-finance/data-and-surveys-safe_en (accessed on 10 April 2025).
  46. European Central Bank. Corporate Vulnerabilities as Reported by Firms in the SAFE. 2024. Available online: https://www.ecb.europa.eu/press/economic-bulletin/focus/2024/html/ecb.ebbox202401_05~cc7bcaa7e2.en.html (accessed on 11 April 2025).
  47. Crick, F.; Eskander, S.M.; Fankhauser, S.; Diop, M. How do African SMEs respond to climate risks? Evidence from Kenya and Senegal. World Dev. 2018, 108, 157–168. [Google Scholar] [CrossRef]
  48. Kling, G.; Volz, U.; Murinde, V.; Ayas, S. The impact of climate vulnerability on firms’ cost of capital and access to finance. World Dev. 2021, 137, 105131. [Google Scholar] [CrossRef]
  49. Hampton, S.; Blundel, R.; Eadson, W.; Northall, P.; Sugar, K. Crisis and opportunity: Transforming climate governance for SMEs. Glob. Environ. Change 2023, 82, 102707. [Google Scholar] [CrossRef]
  50. Zhang, D.; Fang, Y. Are environmentally friendly firms more vulnerable during the COVID-19 pandemic? J. Clean. Prod. 2022, 355, 131781. [Google Scholar] [CrossRef] [PubMed]
  51. European Commission. The Recovery and Resilience Facility. Available online: https://commission.europa.eu/business-economy-euro/economic-recovery/recovery-and-resilience-facility_en (accessed on 8 April 2025).
  52. Fabbrini, F. The recovery and resilience facility as a new legal technology of European governance. J. Eur. Integr. 2024, 47, 85–103. [Google Scholar] [CrossRef]
  53. Lupo, N. The Recovery and Resilience Facility and Its Effects on the Rule of Law Conditionality: A (Potentially) Well-Functioning Connection. In EU Rule of Law Procedures at the Test Bench. Palgrave Studies in European Union Politics; Fasone, C., Dirri, A., Guerra, Y., Eds.; Palgrave Macmillan: Cham, Switzerland, 2024. [Google Scholar] [CrossRef]
  54. Famà, R. Beyond ‘Fit for 55’: The emergence of the ‘Do No Significant Harm’ principle in EU law and EU funding mechanisms. Rev. Eur. Comp. Int. Environ. Law 2025, 34, 62–75. [Google Scholar] [CrossRef]
  55. Mezei, M. Transitional justice through the social fund for climate. Juris Gradibus 2024, 4, 56–83. [Google Scholar] [CrossRef]
  56. Rimšaitė, L. Energy Sector Specific Regulation. In The Crossroads of Competition Law and Energy Regulation; Springer: Cham, Switzerland, 2024; pp. 43–121. [Google Scholar] [CrossRef]
  57. Schumacher, K.; Noka, V.; Cludius, J. Identifying and Supporting Vulnerable Households in Light of Rising Fossil Energy Costs; Interim Report; German Environment Agency: Dessau-Roßlau, Germany, 2025. [Google Scholar] [CrossRef]
  58. Oikonomou, V.; Livraghi, S.; Karalaiou, K.; Rogulj, I.; Spyridakos, S.; Tourkolias, C. How to Distinguish Income Indicators of Energy and Transport Vulnerability—A Case Study of Greece. Sustainability 2025, 17, 4275. [Google Scholar] [CrossRef]
  59. Reina, J.C.R.; Volt, J.; Toleikyte, A.; Carlsson, J. Impact of the New EU Emissions Trading System on Households. CYTEF 2024. Available online: https://revistas.innovacionumh.es/index.php/cytef2024/article/view/2681/2192 (accessed on 25 May 2025).
  60. Strambo, C.; Xylia, M.; Dawkins, E.; Suljada, T. The Impact of the New EU Emissions Trading System on Households. How Can the Social Climate Fund Support a Just Transition? SEI Report; Stockholm Environment Institute: Stockholm, Sweden, 2022. [Google Scholar] [CrossRef]
  61. Government of the Republic of Lithuania. Lithuanian Long-Term Buildings Renovation Strategy. 31 March 2021. Available online: https://energy.ec.europa.eu/system/files/2021-08/lt_2020_ltrs_en_0.pdf (accessed on 14 November 2024).
  62. Regitra. Database. Available online: https://www.regitra.lt/lt/atviri-duomenys/ (accessed on 18 November 2024).
  63. State Enterprise Centre of Registers. Database of Real Estate Cadastre and Register. Available online: https://www.registrucentras.lt/turtas/ (accessed on 26 November 2024).
  64. State Data Agency of Lithuania. Database of Business Structure Research Indicators. Available online: https://osp.stat.gov.lt/ (accessed on 16 December 2024).
  65. European Commission. Support to the Preparation of Social Climate Plans. Funded by European Union via Technical Support Instrument (2024–2025). ID—TSIC-RoC-25400. Available online: https://reform-support.ec.europa.eu/what-we-do/green-transition/support-preparation-social-climate-plans_en (accessed on 15 April 2025).
  66. Dominguez, J.G. Financial Capacity Assessment in Horizon Europe: What to Expect? 2023. Available online: https://getpolite.eu/financial-capacity-assessment-in-horizon-europe-what-to-expect/ (accessed on 15 April 2025).
  67. State Data Agency. Methodology on Business Structure Research Indicators. Available online: https://osp.stat.gov.lt/documents/10180/677335/SVSTM_metodika.pdf/e515bccf-fc20-4b12-bfb8-c7b135737877 (accessed on 25 September 2024).
Figure 1. Number of passenger cars (M1) and light freight vehicles (N1) in Lithuania in 2025 [62].
Sustainability 17 05405 g001
Figure 2. Factors of vulnerable micro-enterprises in accordance with project “Support to the Preparation of Social Climate Plans” (2024) [65].
Sustainability 17 05405 g002
Figure 3. Number of micro-enterprises with a high fuel expenditure in Lithuania from 2010 to 2023.
Sustainability 17 05405 g003
Figure 4. Number of micro-enterprises with a high share of fuel expenditure in Lithuania from 2010 to 2023.
Sustainability 17 05405 g004
Figure 5. Distribution of the number of micro-enterprises with a high fuel expenditure (>2M) by Lithuanian cities and regions in 2010, 2015, and 2023.
Sustainability 17 05405 g005
Figure 6. Number of micro-enterprises with low net profit and loss in Lithuania from 2010 to 2023.
Sustainability 17 05405 g006
Figure 7. Number of low-solvency micro-enterprises in Lithuania from 2010 to 2023.
Sustainability 17 05405 g007
Figure 8. Value added in vulnerable micro-enterprises in Lithuania from 2010 to 2023.
Sustainability 17 05405 g008
Figure 9. Number of employees in vulnerable micro-enterprises in Lithuania from 2010 to 2023.
Sustainability 17 05405 g009
Table 1. Lithuanian building stock by energy performance class, units [61].
GroupEnergy Performance ClassTotalTotal, %
≤DCBAA+A++
1. Residential buildings342,160176,11643,305807783719570,51386
1.1. Private houses311,020170,96938,912781476512529,49280
1.2. Multi-apartment buildings31,1405146439326372741,0216
2. Non-residential buildings78,17560595689713125990,77014
2.1. Industrial buildings44,5522091192017829548,7757
2.2. Administrative buildings90856895058117010,3772
Educational buildings3743634322115047150.7
Trading buildings712952686510335287601.3
Health care buildings142218922142118390.3
Cultural facilities44741066109524618169001.0
Accommodation buildings202915514773023410.4
Service facilities41214114387811050590.8
Other buildings162019817655020040.3
Table 2. The set of vulnerability indicators developed (own work).
Vulnerability FactorVulnerability IndicatorIndicator Restricted for Sharing: Ministry’s Set of IndicatorsIndicator Not Restricted for Sharing: Researchers’ Set of Indicators
Impact of ETS2 on prices
Number of MEs with fuel and energy costs higher than the national median (1M), 1.5M, and 2M.
Number of MEs with fuel expenditure higher than the industry median (1M), 1.5M, and 2M.
Number of MEs with fuel expenditure higher than the industry median (1M), 1.5M, and 2M. When the industry’s 1M, 1.5M, and 2M are higher than the national 1M, 1.5M, and 2M, then the indicator is calculated from the national 1M, 1.5M, and 2M.
Number of MEs with fuel and energy costs as a share of turnover higher than the national median (1M), 1.5M, and 2M. MEs with fuel and energy costs of EUR 0 are excluded as they are not affected by EU-ETS2.
Number of MEs with a share of fuel expenditure in total operating costs higher than the industry’s median (1M), 1.5M, and 2M.
Number of MEs with a share of fuel cost in total operating costs higher than the industry’s median (1M), 1.5M, and 2M. When the industry’s 1M, 1.5M, and 2M are higher than the national 1M, 1.5M, and 2M, then the indicator is calculated from the national 1M, 1.5M, and 2M. MEs with fuel costs of EUR 0 are excluded as they are not affected by the EU-ETS2.
Limited access to capital
Number of MEs with an equity-to-liabilities ratio of 0.5 or less and 1.0 or less.
Financial capacity
Number of MEs with net profit below the industry’s median (1M), 1.5M, and 2M or negative.
Number of MEs with net profit lower than the industry’s median (1M), 1.5M, and 2M or negative. When the industry’s median (1M), 1.5M, and 2M is lower than the national median (1M), 1.5M, and 2M, then the indicator is calculated from the national median (1M), 1.5M, and 2M.
Number of MEs with net profitability lower than the industry’s median (1M), 1.5M, and 2M. When the industry’s median (1M), 1.5M, and 2M is lower than the national median (1M), 1.5M, and 2M, then the indicator is calculated from the national median (1M), 1.5M, and 2M.
Number of MEs with a return on equity lower than the industry’s median (1M), 1.5M, and 2M. When the industry’s median (1M), 1.5M, and 2M is lower than the national median (1M), 1.5M, and 2M, then the indicator is calculated from the national median (1M), 1.5M, and 2M.
Market structure and competitiveness
Number of MEs with a share of fuel expenses per EUR 1 of export value higher than the industry’s median (1M), 1.5M, and 2M. When the industry’s median (1M), 1.5M, and 2M are higher than the national median (1M), 1.5M, and 2M, then the indicator is calculated from the national median (1M), 1.5M, and 2M.
Number of MEs with fuel intensity (fuel expenditure divided by value added in ME) higher than the industry’s median (1M), 1.5M, and 2M. When the industry’s median (1M), 1.5M, and 2M are higher than the national median (1M), 1.5M, and 2M, then the indicator is calculated from the national median (1M), 1.5M, and 2M.
Regional developmentThe aforementioned indicators for Lithuanian regions.
Availability, accessibility, and affordability of public transport or transport alternativesThe vulnerability factors are covered in detail by the category “vulnerable households”; therefore, they are not considered as part of the category of “vulnerable MEs”. No primary and precise data on transport in MEs are available.N/AN/A
Mixed vulnerability indicator
Number of MEs with fuel cost higher than the national median (1M), 1.5M, and 2M but net profitability lower than the national median (1M), 1.5M, and 2M.
Number of MEs with fuel cost higher than the national median (1M), 1.5M, and 2M but labor productivity (value added per hour) lower than the national median (1M), 1.5M, and 2M.
Number of MEs with fuel and energy costs higher than the national median (1M), 1.5M, and 2M but value added per 1 employee lower than the national median (1M), 1.5M, and 2M.
Number of MEs with fuel cost higher than the national median (1M), 1.5M, and 2M but net profitability lower than the national median (1M), 1.5M, and 2M and a debt-to-equity ratio higher than 1.0.
Table 3. Median of fuel expenditure (EUR) and fuel expenditure in total operating costs (%) by economic activity in a micro-enterprise in Lithuania in 2010, 2015, and 2023 (created by the authors).
Economic ActivityMedian of Fuel Expenditure, EURMedian of Fuel Expenditure in Total Operating Costs, %
201020152023201020152023
Agriculture, forestry, and fishing4209401194318.939.5312.73
Manufacturing2013284160.530.720.67
Electricity, gas, steam, and air conditioning supply10,06578189222.773.962.70
Water supply; sewerage, waste management, and remediation activities2052184636622.963.644.21
Construction70070518771.871.433.05
Wholesale and retail trade1010130710841.532.480.62
Transportation and storage4760592617,21612.9317.1724.96
Accommodation and food service activities20537010220.710.981.18
Publishing, broadcasting, and content production and distribution activities1131344620.390.520.77
Financial and insurance activities17620213480.560.621.52
Real estate activities2032598630.861.222.32
Professional, scientific, and technical activities31032519321.151.23.43
Public administration and defense; compulsory social security4038608282,14.484.20
Education1592116400.730.751.55
Human health and social work activities1882249161.071.161.82
Arts, sports, and recreation2543967171.251.852.62
Disclaimer/Publisher’s Note: The statements, opinions and data contained in all publications are solely those of the individual author(s) and contributor(s) and not of MDPI and/or the editor(s). MDPI and/or the editor(s) disclaim responsibility for any injury to people or property resulting from any ideas, methods, instructions or products referred to in the content.

