Abstract
Climate change and intensified human activities have increasingly threatened the sustainability of groundwater resources, especially in ecologically fragile karst regions. To address these challenges, this study proposes a karst spring discharge prediction model that integrates BiLSTM (Bidirectional Long Short-Term Memory) and the Transformer Encoder. The BiLSTM component captures both forward and backward information in spring discharge data, extracting trend-related features. The Transformer’s attention mechanism is employed to identify key precipitation factors influencing spring discharge. A patching preprocessing strategy divides monthly scale sequences into annual segments, reducing input length while enabling local modeling and global interaction. Experiments on Shentou Spring discharge show that the BiLSTM–Transformer Encoder outperforms other deep learning models across multiple evaluation metrics, with notable advantages in short-term forecasting. The patching strategy effectively reduces model parameters and improves efficiency. Attention visualization further confirms the model’s ability to capture critical hydrological drivers. This study not only provides a novel approach to sustainable water management in karst spring basins but also demonstrates an effective use of deep learning for long-term hydrological sustainability.
1. Introduction
Karst topography is a distinctive geological landscape formed through the dissolution of soluble rocks by water. Karst regions are rich in groundwater resources and are one of the world’s most important sources of fresh water, supplying drinking water for over 25% of the world’s population [1]. These water resources not only support regional socio-economic development but also sustain unique ecosystems, playing a vital role in maintaining ecological balance and biodiversity. Karst springs are the natural outflow of karst groundwater flowing out of the surface under pressure, and their flow dynamics reflect the recharge, runoff, and discharge characteristics of the karst groundwater system. However, under the combined effects of climate change and intensified human activities, the groundwater level in many karst regions has dropped, the flow of karst springs has decreased, and some springs have even dried up [2]. Therefore, accurate prediction of karst spring discharge is of paramount importance for ensuring the sustainable development and utilization of groundwater in karst regions.
Some traditional methods have already been employed to deal with spring discharge forecasting. Early studies primarily relied on statistical analysis techniques. For example, Mirzavand et al. utilized autoregressive models to examine precipitation and runoff trends in specific regions [3]. Reghunath et al. applied the moving average method to analyze long-term trends in groundwater table fluctuations in the Nethravathi Basin [4]. Miao et al. employed wavelet transform techniques to investigate the relationship between groundwater discharge and precipitation data in karst regions [5]. Similarly, Niu et al. identified preferential runoff belts in the Jinan Spring Basin by applying cross wavelet transform and Pearson correlation analysis to hydrological time-series [6]. However, traditional statistical analysis methods are inherently limited by their insufficient data-fitting capabilities, making it difficult to accurately capture the nonlinear and non-stationary characteristics inherent in spring discharge prediction.
Deep learning models, through the combination of multiple layers of nonlinear transformations, establish hierarchical nonlinear mappings between input and output data, and possess strong capabilities in modeling complex nonlinear relationships. In recent years, several spring discharge forecasting models based on deep learning have been proposed. Cheng et al. utilized a recurrent neural network (RNN) to model the relationship between rainfall and spring discharge for the Longzici karst spring in North China [7]. Zhou et al. employed an RNN-based model to predict Hueco Spring discharge using rainfall data from the Camp Mabry weather station in Austin [8]. Compared with traditional statistical analysis methods, RNNs exhibit superior predictive performance by recursively updating hidden states to capture short-term dependencies in time series data. However, RNNs suffer from limitations in selectively retaining relevant historical context. Moreover, the backpropagation gradients of long sequences result in exponential decay due to repeated multiplications, which hinders the model’s ability to learn long-term dependencies [9,10,11].
To address these challenges, researchers have turned to Long Short-Term Memory (LSTM) networks for karst spring discharge prediction. Song et al. proposed an LSTM-based approach to model the complex relationship between precipitation and discharge at the Niangziguan spring domain, identifying a 12-month effective time window for precipitation–discharge interactions [12]. The LSTM model significantly improved spring discharge prediction accuracy. Similarly, Fang et al. used LSTM to model rainfall-runoff dynamics in the Han River Basin in a karst region, achieving high predictive accuracy during both flood and non-flood seasons and successfully capturing peak and trough events [13]. Compared with RNN, LSTM model introduces gating mechanisms to dynamically regulate information flow, and achieves stable transmission of long-term memory through the constant linear propagation of cell state, which enhances performance on long-sequence data and alleviates the vanishing gradient problem. However, when modeling multi-decadal time series spanning several decades, LSTM models still face challenges such as memory degradation and ineffective capture of long-range dependencies.
To further improve model performance for ultra-long sequences, some researchers have proposed using Transformer models. These models are capable of capturing global dependencies and modeling interactions between any two positions in a sequence. Zhou et al. introduced a hybrid method combining Ensemble Empirical Mode Decomposition (EEMD) with the Transformer model to predict spring discharge at Barton Springs in Austin, Texas [14]. Their model outperformed baseline models over extended forecasting horizons with more stable performance. Anna Pölz et al. compared Transformer and LSTM models for predicting spring discharge at three karst springs in Austria, finding that the Transformer model outperformed LSTM in regions with deeper aquifers or more complex karst fracture systems [15]. Jiang et al. conducted a comparative study on the prediction of spring discharge at Xianrendong in Panzhou City, Guizhou Province, China, utilizing both the iTransformer model based on self-attention mechanisms and the LSTM model. The experimental results demonstrated that although models employing self-attention exhibit strong capabilities in capturing long-range temporal dependencies, they are more prone to overfitting when applied to small-scale datasets [16]. The attention mechanism in Transformers facilitates the capture of long-term dependencies in input sequences. While the Transformers demonstrate superior ability in capturing long-term trends through self-attention, its mechanism distributes attention across all positions in the sequence, potentially reducing sensitivity to abrupt short-term changes in discharge.
The prediction of karst spring discharge involves forecasting spring discharge time series based on decades-long precipitation time series collected from multiple observation stations in karst regions. Due to the fact that the precipitation sequence spans a long time period, and short-term rainfall recharge, long-term climatic change, and human activities jointly influence the dynamic changes in karst spring flow, when using deep learning models to predict karst spring discharge, the models must not only be adept at capturing short-term local features of the observed data, but also be capable of perceiving and interpreting long-term change trends embedded within the observations.
Although LSTM and Transformer models have significantly improved the accuracy of hydrological forecasting, karst spring discharge prediction presents unique challenges in multi-temporal scale modeling. These models must both capture the effects of short-term rainfall events and the complex impacts of long-term environmental changes. The LSTM model, due to its gated mechanism, can effectively capture patterns within a 12-month time window [12]. However, its ability to model long-span climate trends is limited by gradient decay. The Transformer model, leveraging self-attention mechanisms, excels at capturing global dependencies but struggles with modeling local temporal features. Furthermore, due to the complexity of the Transformer model, it requires a large amount of training data, which often conflicts with the current reality of sparse data collection situation.
To characterize the spatiotemporal interactions between short-term dynamics and long-term trends in hydrological data and improve the accuracy of karst spring discharge forecasting, this study proposes a novel deep learning model that combines BiLSTM and Transformer Encoder architectures. We first preprocess the time series of karst spring discharge and precipitation data from various regions by segmenting monthly scale sequences into temporal patches. BiLSTM is then employed to capture both past and future feature information in the discharge data through bidirectional information flow. Simultaneously, a linear projection method is used to extract features from the precipitation time series at multiple observation stations. Finally, the Transformer Encoder utilizes its global context modeling and self-attention capabilities to adaptively identify key spatiotemporal features. The feature extraction of the model exhibits the characteristics of local modeling within temporal blocks and global interaction across blocks, enabling the capture of multi-scale temporal patterns. Our work offers a promising solution for time series forecasting under complex spatiotemporal dependency scenarios.
In the following sections, we present a detailed introduction to the architecture and experimental setup of the BiLSTM–Transformer Encoder model, demonstrating how it models multi-scale temporal features and addresses the challenges of karst spring discharge forecasting. The main content includes the following:
(1) An overview of the Shentou Spring discharge prediction problem in China, including analysis of the precipitation and discharge time series collected from ten observation stations; (2) a proposal of a deep learning model that combines BiLSTM and the Transformer Encoder to capture the interactive features of short-term dynamics and long-term trends; (3) experimental results applying the model to Shentou Spring discharge forecasting, illustrating its performance in terms of prediction accuracy and generalization ability; (4) an in-depth discussion of the research findings.
2. Problem Description
Shentou Spring is located in Shentou Town, northeast of Shuozhou City in Shanxi Province, China. It belongs to a typical karst spring system in the north. The spring group covers Shuozhou, Xinzhou, and Datong, and is mainly distributed along the riverbed of Yuanzihe River and its banks. It is an important water supply source for the local area. The total area of the karst region where Shentou Spring is situated is 5316 square kilometers, including both recharge area and saturated flow zones. The recharge area is mainly located in the northern and western parts, where there are more exposed limestone outcrops, allowing precipitation to infiltrate the surface and recharge the aquifers.
The primary aquifers in the Shentou Spring catchment consist of Cambrian and Ordovician karstic limestone and Quaternary porous sediments. Due to regional geological conditions, these aquifers are not well connected with the Quaternary aquifers. However, in local leakage areas, the Quaternary sediments overlying the limestone can facilitate the transfer of karst groundwater to shallow groundwater systems [17]. In this region, karst water resources are the main form of groundwater, and are highly susceptible to climate change. Precipitation is the primary source of groundwater recharge, especially in the areas where limestones are exposed. When rainfall infiltrates and enters the subsurface aquifer, it gradually contributes to the surface water system through spring discharge. Given that northern Shanxi is a semi-arid region, precipitation in this region follows a distinct seasonal pattern, with most of it concentrated in just a few summer months, which leads to uneven time distribution of precipitation and significant changes in hydrological status and poses challenges for accurate water resource forecasting [17]. Figure 1 shows the distribution of observation stations in the Shentou Spring area, where red dots represent ten precipitation observation stations, and the blue dot denotes spring discharge observation station.
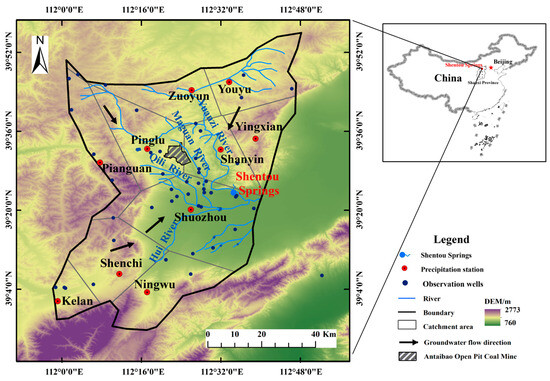
Figure 1.
Distribution of observation stations in the Shentou Spring catchment.
The observation stations in the Shentou Spring catchment have recorded detailed monthly precipitation and spring discharge data over several decades. This study uses data collected from 1958 to 2020 as the primary dataset. Figure 2 displays monthly precipitation collected from 1958 to 2020 at ten observation stations, namely Kelan, Ningwu, Pianguan, Pinglu, Shanyin, Shenci, Shuozhou, Yingxian, Youyu, and Zuoyun. As shown in Figure 2, the monthly precipitation in each region exhibits periodic characteristics, with July to August being the rainy season across the study area, during which precipitation increases significantly.
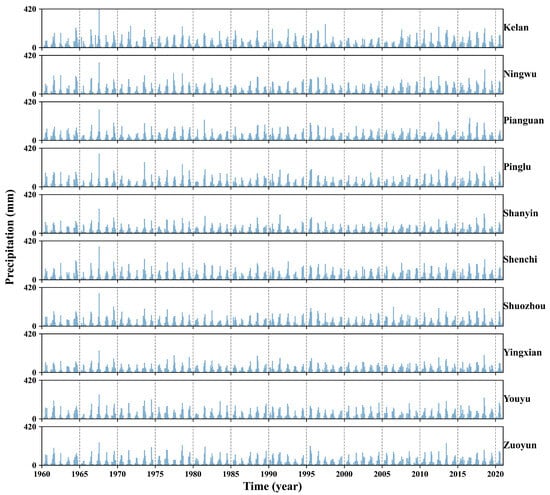
Figure 2.
Monthly precipitation data from ten observation stations from 1958 to 2020.
To further investigate the spatial characteristics of rainfall across different regions, we conducted a statistical analysis of the mean and variance of monthly precipitation. Figure 3 presents the mean and variance of monthly precipitation for the ten observation points. Due to the significant topographical variability in the Shentou Spring catchment and the spatial dispersion of the observation stations, the average monthly precipitation in different regions generally ranges from 30 mm to 40 mm. However, there are notable differences in variance. For instance, in Kelan, both the mean and variance are relatively high, indicating unstable rainfall and a greater likelihood of extreme weather events. In contrast, other regions like Shanyin show lower average precipitation and smaller variance, suggesting relatively stable rainfall conditions. Consequently, the monthly precipitation exhibits pronounced spatial differences across the Shentou Spring catchment, and the contributions of precipitation in different regions to spring flow vary.
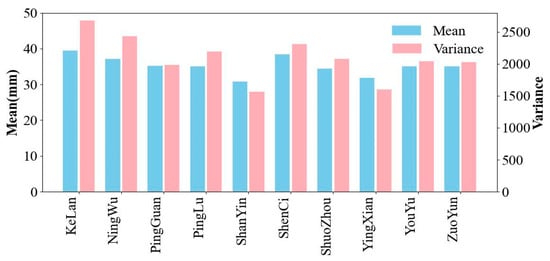
Figure 3.
Mean and variance of monthly precipitation at ten observation stations in the Shentou Spring catchment.
Figure 4 presents the spring discharge data collected at the Shentou Spring observation stations from 1958 to 2020. The spring discharge showed an increasing trend from 1958 to 1964, followed by a steady decline from 1964 to 1984. A sharp decrease occurred between 1984 and 1993, while a slight recovery was observed from 1993 to 1998. From 1998 to 2016, the discharge exhibited a fluctuating downward trend. These trends align with key milestones in regional economic development, such as increased demand for groundwater due to activities like building power plants and implementing well irrigation, as well as the implementation of local government measures to protect water resources [18].
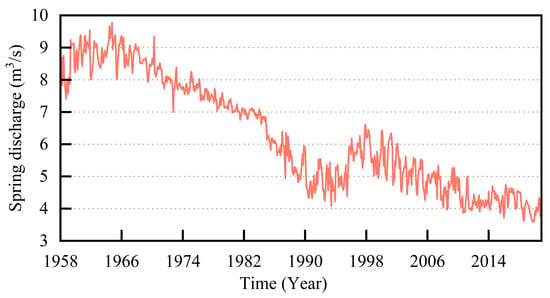
Figure 4.
Spring discharge data of Shentou Spring from 1958 to 2020.
The above discussion indicates that the Shentou Spring catchment is a region characterized by significant topographical variations. Temporal and spatial changes in precipitation affect spring discharge, while human activities also play a crucial role in influencing the flow. Therefore, the spring discharge prediction model must be capable of distinguishing short-term features and long-term climate trends from regional precipitation time series, as well as capturing the temporal dependencies within the discharge data. We propose a novel deep learning network model that integrates BiLSTM and the Transformer Encoder architectures for karst spring discharge prediction. The structure of the proposed model is illustrated in Figure 5.
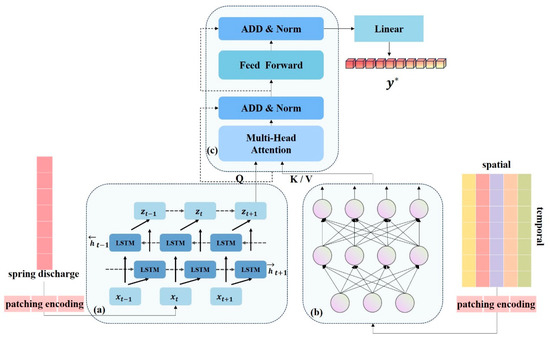
Figure 5.
The BiLSTM–Transformer Encoder (BiLSTM-TE) spring discharge prediction model. (a) The BiLSTM module, which utilizes both forward and backward information of the spring discharge data to extract trend features. (b) The linear transformation module, which extracts seasonal features from precipitation data observed in different regions. (c) The Transformer Encoder module, which combines trend and seasonal features to predict spring discharge. represents the spring discharge for either single-step or multi-step prediction.
3. Model Structure
This chapter introduces the structure of the BiLSTM–Transformer Encoder model (as shown in Figure 5), data preprocessing, bidirectional spring discharge feature analysis, and the Transformer Encoder model.
3.1. Methodological Flowchart
To better illustrate the workflow of this study, the model process is shown in Figure 6. It consists of four main components: data input and preprocessing, feature extraction, feature fusion and modeling, and prediction output.
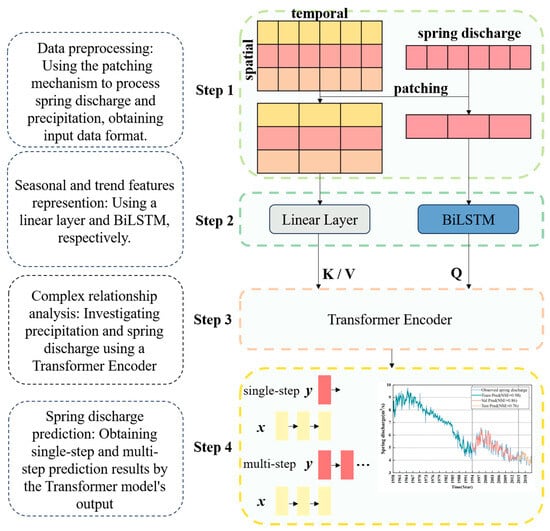
Figure 6.
Flow chart for this research. The plot on the right side of Step 4 shows the comparison between the model’s predicted results and the actual observed data, used to demonstrate the single-step prediction performance. The grey solid lines in the figure indicate the dataset division boundaries, which separate the training, validation, and testing periods.
The input includes monthly precipitation data from multiple observation stations and spring discharge data for the target spring. A patching preprocessing strategy is applied to address the challenges posed by long-term sequences. This strategy segments the original monthly time series into annual blocks, reducing the sequence length, lowering computational complexity, and enabling localized modeling within patches and global interaction across patches.
In the feature extraction stage, spring discharge data is processed by a Bidirectional Long Short-Term Memory (BiLSTM) network. This structure captures both forward and backward dependencies, allowing the model to learn temporal trend features from both past and future perspectives. In parallel, precipitation data from different regions is transformed through a linear projection layer to extract seasonal characteristics.
The feature fusion and modeling stage employs a Transformer Encoder. Trend features from BiLSTM serve as query vectors, while seasonal features from precipitation data act as key and value vectors. Through the self-attention mechanism, the model learns the complex spatiotemporal relationships between regional precipitation and spring discharge, supporting global temporal dependency modeling across blocks.
Finally, the fused features are transformed and passed through the prediction layer to predict spring discharge. The bottom-right section of the flowchart illustrates the actual predictive performance, showing the model’s capability to align well with observed data, particularly in short-term forecasting tasks.
3.2. Data Preprocessing
For the monthly precipitation data spanning several decades from 1958 to 2020, the time series exhibit long-term characteristics. We employ a patching preprocessing strategy to partition the original monthly sequence into annual segments, as shown in Figure 7. This preprocessing step aims to reduce the length of the input sequence and lower the computational complexity of the model. At the same time, it enables the decoupled modeling of interannual fluctuations and long-term trends through intra-block local modeling and inter-block global interaction.
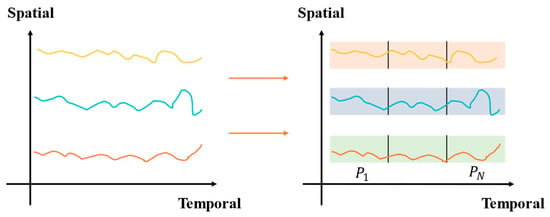
Figure 7.
Patching preprocessing. Different colors in the figure represent data from different regions, including both regional precipitation and the spring discharge at Shentou Spring.
3.3. Bidirectional Spring Discharge Feature Analysis
Accurately modeling trend changes in the time series is crucial for spring discharge prediction. Unidirectional time series modeling may overlook the potential contribution of future information to the current spring discharge. For example, karst spring discharge is influenced by historical discharge data, while the backward features of discharge can also reflect trend changes from earlier periods. Therefore, this study introduces a method, which is capable of simultaneously capturing both forward and backward dynamic features in the sequence, to improve the understanding and predictive ability of flow trend changes.
To capture the trend in spring discharge, this study employs a Bidirectional Long Short-Term Memory network (BiLSTM) to extract bidirectional spring discharge features. The BiLSTM consists of two LSTM layers, with the forward LSTM reading the spring discharge in chronological order and the backward LSTM reading it in reverse. This architecture ensures that both past and future spring discharge information are integrated at each time step. Figure 5a provides a detailed illustration of the BiLSTM structure used in the karst spring discharge prediction model.
LSTM is a type of recurrent neural network that introduces gating mechanisms. Through the collaborative design of forget gates, input gates, output gates, and cell states, LSTM addresses the problem of long-term information storage and retrieval. Currently, LSTM has been widely applied in time series forecasting. An et al. applied it to precipitation and spring discharge modeling in karst regions and achieved promising results in spring discharge prediction tasks [19].
The working principle of LSTM is as follows (Equation (1)):
Equation (1) describes the function of the forget gate. Information from earlier time has a minimal impact on the prediction at the current time step. The forget gate reduces the influence of such information through a lower value of . represents the input of the Shentou spring discharge at the current time step t, and represents the spring discharge features at the previous time step t − 1. and represent the weight and bias matrices, respectively.
Equation (2) describes the role of the input gate, which determines which important information is received at the current time step t and is added to the model’s internal state.
where represents the hyperbolic tangent function. Equation (3) describes how the model integrates the current spring discharge information with the spring discharge features from the previous time step t − 1 to obtain the candidate spring discharge feature .
Equation (4) updates the spring discharge trend. First, it combines , the spring discharge trend at time step t − 1, multiplied by , which is the forget gate result at time step t and then multiplies , which is the input gate result at time step t, with the candidate spring discharge feature obtained at time step t. Finally, both are added together to obtain the spring discharge trend at the current time step t.
where represents the activation function. Equation (5) describes the output gate’s function, which uses the spring discharge trend feature at time step t − 1, , and the current time step’s input to jointly determine the output gate result .
Equation (6) indicates that based on the output gate result and the spring discharge trend , the spring discharge feature for time step t is calculated for prediction the next time step.
Assuming that represents the forward spring discharge feature and represents the backward spring discharge feature, the output of BiLSTM is as follows:
Equation (7) represents the concatenation of the forward and backward spring discharge feature vectors and to form the bidirectional spring discharge feature result at time step t. The BiLSTM processes the input sequence’s forward and backward temporal information through two independent LSTM layers, allowing feature extraction with full temporal context awareness. This enables the extraction of cross-annual trend features using both forward and backward spring discharge data.
3.4. Transformer Encoder
The Transformer model is one of the cutting-edge models currently used for time series forecasting [20]. Among its components, the Transformer Encoder (TE) is an essential part of the Transformer model [21], and its structure is illustrated in Figure 5c.
We innovatively combine BiLSTM with the Transformer Encoder to predict karst spring discharge. Attention mechanisms essentially perform weighted summation, assigning different weights based on the importance of various positions to capture the complementary relationship between trend and seasonal features, and analyzing the complex relationship between precipitation and spring discharge at different time points. The attention mechanism in the Transformer Encoder is represented by Equation (8).
where Q represents query vectors, K represents key vectors, V represents value vectors, and is the dimension of the keys and queries. Specifically, the trend features of spring discharge extracted by the BiLSTM are used as the query vector Q for the Transformer Encoder, enabling the model to focus more on the goal of predicting spring discharge. The seasonal features of precipitation from different regions are used as the key vector K and the value vector V for the Transformer Encoder. These query vectors Q, key vectors K, and value vectors V are then passed into a multi-head attention module.
After attention calculation, the model performs residual connections and normalization on the overall features of spring discharge, resulting in the final feature vector of the spring discharge. This vector is then flattened into a one-dimensional form through a final linear layer, yielding the predicted spring discharge .
3.5. Evaluation Metrics
To assess the performance of our model, we use several metrics to evaluate prediction accuracy, including the Nash–Sutcliffe Efficiency (NSE) [22], Mean Absolute Percentage Error (MAPE) [23], Mean Absolute Error (MAE) [24], Root Mean Square Error (RMSE) [24] and confidence interval (CI) [25]. The formulas for these metrics are shown in Equations (9) to (12):
where N represents the total amount of data, represents the actual observed values, represents the predicted values from the model, represents the mean of all actual observed values, represents the confidence interval for the i-th predicted value, and represents the critical value from the two-tailed t-distribution with n − 1 degress of freedom at a significance level of .
4. Experiment
4.1. Experimental Setup
This study utilizes a dataset that covers monthly precipitation and spring discharge data from January 1958 to December 2020. We used the data from January 1958 to December 1993 as the training set, from January 1994 to December 2014 as the validation set, and from January 2015 to December 2020 as the test set. After training the BiLSTM–Transformer Encoder model, the final key parameters are shown in Table 1.

Table 1.
Model parameters.
4.2. Effectiveness of Single-Step Spring Discharge Prediction
We first use the model to predict the spring discharge for the next month. Table 2 shows the prediction accuracy of the model in terms of NSE, RMSE, MAE, and MAPE during the training, validation, and test periods.

Table 2.
Performance of single-step spring discharge prediction.
The results of NSE, RMSE, MAE, and MAPE for the training period (1958–1993) are 0.98, 0.20, 0.14, and 2.14, respectively. For the validation period (1994–2014), the results are 0.86, 0.23, 0.18, and 3.14, and for the test period (2015–2020), the results are 0.76, 0.15, 0.12, and 2.98. These results indicate that the model performs with high prediction accuracy during training, validation, and testing periods and demonstrates good generalization ability. The model not only fits historical data well but also makes accurate predictions for future data.
Figure 8 visually compares the actual observed spring discharge and the single-step predicted values for the training, validation, and test periods. The light blue curve represents the actual observed spring discharge, the dark blue curve indicates the predicted spring discharge during the training period, the red curve represents the predicted spring discharge during the validation period, and the yellow curve shows the predicted spring discharge during the test period. The grey solid lines indicate the dataset division boundaries, which separate the training, validation, and testing periods. Although in a few cases the predicted values deviate from the actual observed values, the predicted values generally show high consistency with the actual observations, indicating that our proposed model has good predictive capabilities.
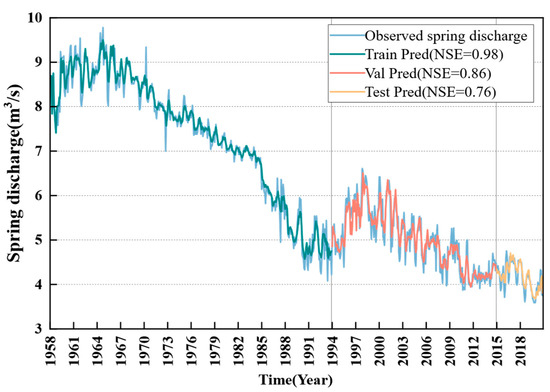
Figure 8.
Observed vs. predicted spring discharge from 1958 to 2020.
Figure 9 shows the values for the training set, validation set, and test set as 0.98, 0.86, and 0.76, respectively. The red shaded area represents the 95% confidence interval, meaning that within this area, there is 95% confidence that the predicted results are in agreement with the observed values. From the evaluation metric, we can see that the predicted spring discharge values in the scatter plot are very close to the diagonal line, indicating a high consistency between the model’s predictions and the actual observed values. This result validates the effectiveness of the proposed model.
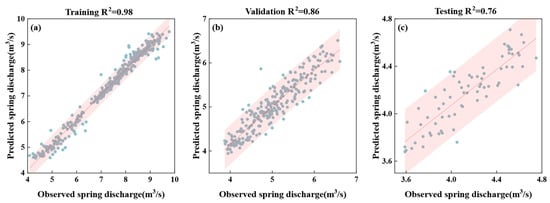
Figure 9.
Comparison of observed and predicted spring discharge during training (a), validation (b), and testing (c).
4.3. Effectiveness of Multi-Step Flow Prediction
To further explore the model’s effectiveness in long-term prediction tasks, we conducted multi-step prediction experiments on spring discharge. Specifically, the prediction range was extended from forecasting the next month’s spring discharge to predicting the spring discharge for the next six months. Figure 10 describes the model’s performance in predicting the spring discharge for the next 1 to 6 months on the test dataset. Each sub-graph in Figure 10 shows the prediction effect of NSE, RMSE, MAE, and MAPE on 1 to 6 months.
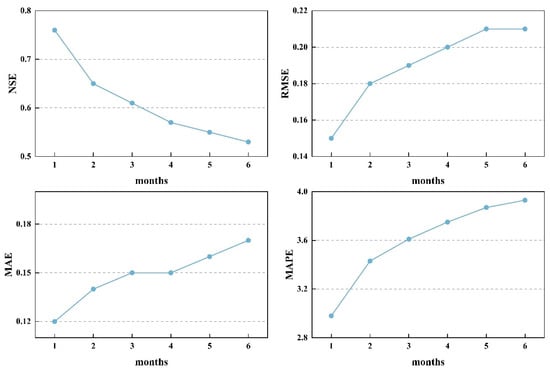
Figure 10.
Performance of multi-step spring discharge prediction.
From Figure 10, it can be observed that as the model’s prediction time span increases, the NSE gradually decreases from 0.76 to 0.53, showing a clear decline in the prediction performance. This indicates that with the increase in time span, the prediction accuracy of multi-step forecasts is generally lower than that of short-term predictions due to the influence of various uncertainties. This result aligns with the expectation that as the forecast length increases, predicting spring discharge becomes more challenging. Shanxi Province has a temperate continental monsoon climate, where after the end of summer, temperatures gradually decrease, and precipitation patterns undergo significant changes. These seasonal factors lead to more complex groundwater recharge and flow patterns, thereby increasing the difficulty of spring discharge prediction. As the time span extends, the prediction of spring discharge must account for a broader range of climate factors and uncertainties brought by surface changes, such as human activities affecting groundwater resources. These influences are difficult to accurately capture in long-term forecasts. Therefore, while short-term predictions can relatively accurately reflect the fluctuations of groundwater, when the time span is extended to several months or even half a year, the accuracy of predictions is inevitably affected by the complex interplay of seasonal changes and human factors, leading to a gradual decline in model performance.
Furthermore, the relatively stable MAE between months 3 and 4 in Figure 10 reflects the model’s retained capability to capture discharge trends during mid-range forecasting. Benefiting from the combination of Transformer’s global modeling and BiLSTM’s local memory mechanisms, the model effectively suppresses the amplification of cumulative errors at this stage. In contrast, RMSE and MAPE continue to increase, indicating higher sensitivity to outliers and relative error fluctuations. Overall, the model demonstrates solid stability and robustness in forecasting spring discharge over a six-month horizon.
4.4. Model Parameter Sensitivity Analysis
To investigate the robustness and adaptability of the proposed BiLSTM-TE model under different parameters, we conducted a model parameter sensitivity analysis. Specifically, we varied the input lengths of the spring discharge and precipitation sequences, as well as the patch length used in the preprocessing step. The results, as presented in Table 3, reveal clear performance differences under different parameter combinations.

Table 3.
Sensitivity analysis of different parameters.
The results show that the model achieves optimal performance when using a 36-month spring discharge input, a 12-month precipitation input, and a patch length of 4, with an NSE of 0.76 and the lowest RMSE, MAE and MAPE. This indicates that longer discharge history provides better trend learning, while one year of precipitation is sufficient to capture seasonal variation.
When the input lengths are shortened, particularly the discharge sequence, the model’s performance decreases significantly. This is likely because short sequences limit the model’s ability to capture long-term hydrological dependencies. This is due to the annual cyclicality of precipitation, where extending the input length beyond 12 months may dilute the seasonal signals and hinder the model’s ability to capture them effectively.
Patch length also affects the results. A shorter patch (with a length of 4) shows better performance in most cases, as it enhances local temporal feature extraction. Longer patches tend to average out finer-scale variations, reducing the model’s sensitivity to recent fluctuations.
In summary, the model benefits most from a long spring discharge sequence, a concise seasonal precipitation window, and a moderate patch length, which together balance global trend learning and short-term pattern recognition.
4.5. Long-Term Prediction for Spring Discharge
To evaluate long-term prediction performance, the forecasting horizon was extended to 12–24 months under more challenging conditions. As shown in Table 4, the performance metrics gradually decline: NSE drops from 0.38 to 0.28, and RMSE, MAE, and MAPE also increase. This indicates that longer prediction horizons introduce greater uncertainty, possibly due to the accumulation of environmental variability and reduced temporal correlation.

Table 4.
Long-term prediction results.
5. Analysis and Discussion
5.1. Comparison with Other Deep Learning Models
To assess the performance and potential value of the model we proposed, we compared it with several other deep learning models under the same experimental conditions on spring discharge prediction. These models include LSTM [9], GRU (Gated Recurrent Unit) [26], RNN [26], MLP (Multilayer Perceptron) [27], and GCN (Graph Convolutional Network) [28]. We also compared it with traditional hydrological models, including ARIMA [29] and DRCF [30]. The experimental results are shown in Table 5.

Table 5.
Performance comparison of different deep learning models.
The experimental results in Table 5 show that among various deep learning models, our model achieved the best prediction performance. While traditional models such as ARIMA and DRCF provide a useful baseline, their performance—particularly ARIMA, with a MAPE of 5.1%—lags significantly behind that of deep learning methods. The NSE values of LSTM, GRU, and RNN are all below 0.5, while the NSE of MLP reaches 0.64. The BiLSTM-TE model yields the best prediction results with an NSE of 0.76. These results highlight the effectiveness of BiLSTM-TE in capturing complex temporal patterns in spring discharge prediction.
5.2. The Role of the Patching Preprocessing Method
To validate the effectiveness of the patching preprocessing method in our model, we conducted a comparative experiment. Under identical parameter settings, we compared the spring discharge prediction performance with and without the patching preprocessing strategy. The specific performance on the test set for different approaches on the test set is shown in Table 6. We observed that when the patching preprocessing strategy was not used, the model’s NSE dropped to 0.70, whereas the model with the patching preprocessing strategy achieved an NSE of 0.76. This result indicates that the proposed patching preprocessing strategy significantly improves the prediction performance of the model.

Table 6.
Effectiveness of the patching preprocessing strategy.
The patching preprocessing strategy compresses the sequence length by partitioning the original sequence into patches, which reduces the number of parameters in the input-related modules. We compared the parameter counts between the models using and not using the patching preprocessing strategy, as shown in Table 7.

Table 7.
Comparison of the number of parameters.
From Table 7, it is clear that the model using the patching preprocessing strategy has 1,230,000 parameters, while the model without the patching preprocessing strategy has as many as 1,460,000 parameters. This result validates that using the patching preprocessing strategy in our model effectively reduces the number of parameters. The reduction in parameters decreases the model’s sensitivity to noise in training data and also contributes to enhancing the generalization ability of the prediction model.
5.3. The Role of the Attention Mechanism
The built-in attention mechanism in the model allows for dynamic weight allocation to capture the temporal dependencies in the precipitation sequence, with the corresponding attention scores representing the influence of the input sequence on the spring discharge, as given by Equation (8). Figure 11 provides a visualization of the average precipitation for each month of the year and the corresponding average attention scores, demonstrating the model’s ability to capture the temporal dependencies in the precipitation sequence.
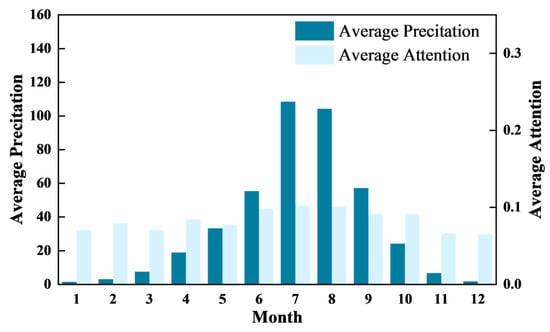
Figure 11.
Attention visualization results.
From the attention visualization results in Figure 11, it can be observed that there is a correlation between precipitation and attention values. Specifically, in July and August of each year, precipitation significantly increases, leading to a rise in attention values to a higher level. In contrast, from January to March and November to December, when precipitation is relatively scarce, the attention values remain low. This indicates that our model can dynamically adjust its focus on the input information based on the characteristics of precipitation during different time periods through the attention mechanism, thereby better capturing the critical influence of precipitation on spring discharge.
6. Conclusions
This study proposes a novel model combining BiLSTM and the Transformer Encoder. By employing the patching preprocessing strategy, we effectively reduce the length of the input sequence, while also supporting for intra-block local feature modeling and inter-block global information interaction. The experimental results show that the BiLSTM–Transformer Encoder model significantly enhances the ability to predict spring discharge, with the following key conclusions:
- By considering both forward and backward information of spring discharge, the model effectively integrates both historical and future data. This allows the predicted spring discharge to be based not only on past data but also on capturing global trends. This demonstrates a significant advantage in long-term spring discharge time series modeling. Compared to unidirectional LSTM, bidirectional spring discharge modeling has a stronger contextual awareness for trend extraction.
- The visual analysis of the attention mechanism reveals that the model assigns higher attention values during months with more precipitation (July and August), and lower attention values during seasons with less precipitation. The experimental results demonstrate that the model is interpretable and validates the hydrological rule that spring discharge is driven by precipitation.
- The model employing the patching preprocessing strategy reduces the number of parameters, addressing the issue of sparse data collection. Additionally, the model maintains accurate trend predictions even when forecasting multiple future time steps, indicating that the proposed model not only accurately predicts spring discharge but also improves its generalization ability.
The successful application of this model to the prediction of spring discharge at Shentou Spring not only validates the effectiveness of combining BiLSTM and the Transformer Encoder, but also provides a new approach for tackling the complexity of karst hydrological systems. This model is of significant practical importance for understanding the impact of human activities and natural factors on water resources, particularly in the fields of water resource management and ecological protection. In the future, we will further optimize the model structure and explore more universally applicable deep learning methods to enhance the accuracy and robustness of spring discharge prediction.
Author Contributions
Conceptualization, Y.L. and S.G.; methodology, C.M. and Y.L.; software, S.G.; validation, Y.L., C.M. and Y.H.; formal analysis, Y.L.; investigation, Y.L.; resources, C.M. and Y.H.; data curation, S.M.; writing—original draft preparation, Y.L., S.G. and C.M.; writing—review and editing, Y.L.; visualization, H.H., J.Z. and X.W.; supervision, C.M. and Y.L.; project administration, Y.L. and C.M.; funding acquisition, Y.H. All authors have read and agreed to the published version of the manuscript.
Funding
The work of Yonghong Hao is partially supported by the National Natural Science Foundation of China, grant number U2244214, 42072277, 41272245, 40972165, 42307088, and 40572150. Chunmei Ma is partially supported by the Scientific Research Project of the Tianjin Education Commission under Grant (No.2021KJ186).
Institutional Review Board Statement
Not applicable.
Informed Consent Statement
Not applicable.
Data Availability Statement
The data used for this study is available upon request from the corresponding author.
Acknowledgments
The authors thank the editor and the anonymous reviewer for their helpful comments and suggestions.
Conflicts of Interest
The authors declare no conflicts of interest.
Abbreviations
The following abbreviations are used in this manuscript:
| RNN | Recurrent Neural Network |
| LSTM | Long Short-Term Memory |
| BiLSTM | Bidirectional Long Short-Term Memory network |
| TE | Transformer Encoder |
| NSE | Nash–Sutcliffe Efficiency |
| RMSE | Mean Absolute Percentage Error |
| MAE | Mean Absolute Error |
| MAPE | Root Mean Square Error |
| GRU | Gated Recurrent Unit |
| MLP | Multilayer Perceptron |
| GCN | Graph Convolutional Network |
References
- Ford, D.; Williams, P.D. Karst Hydrogeology and Geomorphology; John Wiley & Sons: New York, NY, USA, 2007. [Google Scholar]
- Luo, Z.; Hu, C.; Hao, Y. Review and prospect of the karst spring. J. Water Resour. Water Eng. 2005, 1, 56–59. [Google Scholar]
- Mirzavand, M.; Ghazavi, R. A stochastic modelling technique for groundwater level forecasting in an arid environment using time series methods. Water Resour. Manag. 2015, 29, 1315–1328. [Google Scholar] [CrossRef]
- Reghunath, R.; Murthy, T.S.; Raghavan, B. Time series analysis to monitor and assess water resources: A moving average approach. Environ. Monit. Assess. 2005, 109, 65–72. [Google Scholar] [CrossRef]
- Miao, J.; Liu, G.; Cao, B.; Hao, Y.; Chen, J.; Yeh, T.C.J. Identification of strong karst groundwater runoff belt by cross wavelet transform. Water Resour. Manag. 2014, 28, 2903–2916. [Google Scholar] [CrossRef]
- Niu, S.; Shu, L.; Li, H.; Xiang, H.; Wang, X.; Opoku, P.A.; Li, Y. Identification of Preferential Runoff Belts in Jinan Spring Basin Based on Hydrological Time-Series Correlation. Water 2021, 13, 3255. [Google Scholar] [CrossRef]
- Cheng, S.; Qiao, X.; Shi, Y.; Wang, D. Machine learning for predicting discharge fluctuation of a karst spring in North China. Acta Geophys. 2021, 69, 257–270. [Google Scholar] [CrossRef]
- Zhou, R.; Zhang, Y. On the role of the architecture for spring discharge prediction with deep learning approaches. Hydrol. Process. 2022, 36, e14737. [Google Scholar] [CrossRef]
- Hochreiter, S.; Schmidhuber, J. Long short-term memory. Neural Comput. 1997, 9, 1735–1780. [Google Scholar] [CrossRef]
- Ribeiro, A.H.; Tiels, K.; Aguirre, L.A.; Schön, T. Beyond exploding and vanishing gradients: Analysing RNN training using attractors and smoothness. In Proceedings of the International Conference on Artificial Intelligence and Statistics, Palermo, Italy, 26–28 August 2020; pp. 2370–2380. [Google Scholar]
- Kag, A.; Zhang, Z.; Saligrama, V. RNNs incrementally evolving on an equilibrium manifold: A panacea for vanishing and exploding gradients? In Proceedings of the International Conference on Learning Representations, Addis Ababa, Ethiopia, 26–30 April 2020. [Google Scholar]
- Song, X.; Hao, H.; Liu, W.; Wang, Q.; An, L.; Yeh, T.-C.J.; Hao, Y. Spatial-temporal behavior of precipitation driven karst spring discharge in a mountain terrain. J. Hydrol. 2022, 612, 128116. [Google Scholar] [CrossRef]
- Fang, L.; Shao, D. Application of long short-term memory (LSTM) on the prediction of rainfall-runoff in karst area. Front. Phys. 2022, 9, 790687. [Google Scholar] [CrossRef]
- Zhou, R.; Wang, Q.; Jin, A.; Shi, W.; Liu, S. Interpretable multi-step hybrid deep learning model for karst spring discharge prediction: Integrating temporal fusion transformers with ensemble empirical mode decomposition. J. Hydrol. 2024, 645, 132235. [Google Scholar] [CrossRef]
- Pölz, A.; Blaschke, A.P.; Komma, J.; Farnleitner, A.H.; Derx, J. Transformer versus LSTM: A comparison of deep learning models for karst spring discharge forecasting. Water Resour. Res. 2024, 60, e2022WR032602. [Google Scholar] [CrossRef]
- Jiang, F.; Li, Q.; Sun, G.; Wu, Q.; Liu, S.; Jiqin, K.; Wang, R.; Liu, H.; Hu, W. Long-term prediction for karst spring discharge and petroleum substances concentration based on the combination of LSTM and Transformer models. Water Res. 2025, 274, 123148. [Google Scholar] [CrossRef]
- Ma, T.; Wang, Y.; Guo, Q. Response of carbonate aquifer to climate change in northern China: A case study at the Shentou karst springs. J. Hydrol. 2004, 297, 274–284. [Google Scholar] [CrossRef]
- Zhao, Y. Discussion on Water Resources Management and Protection in Shentou Spring Region of Shanxi Province. Shanxi Water Resour. 2020, 36, 6–7. [Google Scholar]
- An, L.; Hao, Y.; Yeh, T.-C.J.; Liu, Y.; Liu, W.; Zhang, B. Simulation of karst spring discharge using a combination of time–frequency analysis methods and long short-term memory neural networks. J. Hydrol. 2020, 589, 125320. [Google Scholar] [CrossRef]
- Wen, Q.; Zhou, T.; Zhang, C.; Chen, W.; Ma, Z.; Yan, J.; Sun, L. Transformers in time series: A survey. In Proceedings of the Thirty-Second International Joint Conference on Artificial Intelligence, Macao, China, 19–25 August 2023. [Google Scholar]
- Vaswani, A.; Shazeer, N.; Parmar, N.; Uszkoreit, J.; Jones, L.; Gomez, A.N.; Kaiser, Ł.; Polosukhin, I. Attention is all you need. In Proceedings of the 31st International Conference on Neural Information Processing Systems, Long Beach, CA, USA, 4–9 December 2017; Volume 30. [Google Scholar]
- Nash, J.E.; Sutcliffe, J.V. River flow forecasting through conceptual models part I—A discussion of principles. J. Hydrol. 1970, 10, 282–290. [Google Scholar] [CrossRef]
- Makridakis, S. Accuracy measures: Theoretical and practical concerns. Int. J. Forecast. 1993, 9, 527–529. [Google Scholar] [CrossRef]
- Willmott, C.J.; Matsuura, K. Advantages of the mean absolute error (MAE) over the root mean square error (RMSE) in assessing average model performance. Clim. Res. 2005, 30, 79–82. [Google Scholar] [CrossRef]
- James, G.; Witten, D.; Hastie, T.; Tibshirani, R. An Introduction to Statistical Learning; Springer: Amsterdam, The Netherlands, 2013; Volume 112. [Google Scholar]
- Cho, K.; Van Merriënboer, B.; Gulcehre, C.; Bahdanau, D.; Bougares, F.; Schwenk, H.; Bengio, Y. Learning phrase representations using RNN encoder-decoder for statistical machine translation. In Proceedings of the 2014 Conference on Empirical Methods in Natural Language Processing (EMNLP), Doha, Qatar, 25–29 October 2014. [Google Scholar]
- Rumelhart, D.E.; Hinton, G.E.; Williams, R.J. Learning representations by back-propagating errors. Nature 1986, 323, 533–536. [Google Scholar] [CrossRef]
- Kipf, T.N.; Welling, M. Semi-supervised classification with graph convolutional networks. In Proceedings of the 5th International Conference on Learning Representations, Toulon, France, 24–26 April 2017. [Google Scholar]
- Ren, H.; Cromwell, E.; Kravitz, B.; Chen, X. Using long short-term memory models to fill data gaps in hydrological monitoring networks. Hydrol. Earth Syst. Sci. 2022, 26, 1727–1743. [Google Scholar] [CrossRef]
- Zhang, P.; Jia, Y.; Gao, J.; Song, W.; Leung, H. Short-term rainfall forecasting using multi-layer perceptron. IEEE Trans. Big Data 2018, 6, 93–106. [Google Scholar] [CrossRef]
Disclaimer/Publisher’s Note: The statements, opinions and data contained in all publications are solely those of the individual author(s) and contributor(s) and not of MDPI and/or the editor(s). MDPI and/or the editor(s) disclaim responsibility for any injury to people or property resulting from any ideas, methods, instructions or products referred to in the content. |
© 2025 by the authors. Licensee MDPI, Basel, Switzerland. This article is an open access article distributed under the terms and conditions of the Creative Commons Attribution (CC BY) license (https://creativecommons.org/licenses/by/4.0/).