Article

Comprehensive Statistical Analysis for Characterizing Water Quality Assessment in the Mekong Delta: Trends, Variability, and Key Influencing Factors

1
Hydro-Meteorology and Water Resource Faculty, Ho Chi Minh City University of Natural Resources and Environment, Ho Chi Minh City 70000, Vietnam
2
Faculty of Water Resources Engineering, Thuyloi University, 175 Tay Son, Dong Da, Hanoi 10000, Vietnam
3
Faculty of Environment & Natural Resources, Ho Chi Minh City University of Technology (HCMUT), 268 Ly Thuong Kiet Street, District 10, Ho Chi Minh City 70000, Vietnam
4
Vietnam National University Ho Chi Minh, Linh Trung Ward, Ho Chi Minh City 70000, Vietnam
5
Laboratory of Water Environment Engineering, Division of Bioproduction Environmental Sciences, Department of Agro-Environmental Sciences, Faculty of Agriculture, Kyushu University, 744 Motooka, Nishi-ku, Fukuoka 819-0395, Japan
6
The Institute of Civil Engineering, University of Transport Ho Chi Minh City, Ho Chi Minh City 70000, Vietnam
*
Authors to whom correspondence should be addressed.
Sustainability 2025, 17(12), 5375; https://doi.org/10.3390/su17125375
Submission received: 2 April 2025 / Revised: 31 May 2025 / Accepted: 4 June 2025 / Published: 11 June 2025

Abstract

:
The Mekong Delta, an important agricultural and economic hub in Vietnam, has suffered from severe water quality issues caused by both natural and anthropogenic forces. This paper aims to conduct a rational statistical approach to evaluate the current situation of surface water quality in the Mekong Delta, applying Factor Analysis (FA), Principal Component Analysis (PCA), and Agglomerative Hierarchical Clustering (AHC) to a database of 3117 samples collected by national and provincial monitoring stations. The results revealed significant contamination with organic pollutants (BOD5: 3.50–172.870 mg/L, COD: 6.493–472.984 mg/L), pesticides (e.g., DDTs: n.d to 1.227 mg/L), trace metals (As: 0.006–0.046 mg/L, Cr: n.d–1.960 mg/L), and microbial indicators (Coliforms: n.d–45,100 MPN/100 mL), often higher than the WHO drinking water threshold. PCA/AHC analysis identified the following five major pollution components: (1) organic pollution and sewage/industrial and deposited chemicals (PCA1—23.08% variance); (2) pesticide and agricultural runoff derived contamination with Hg (PCA2—15.44%); (3) microbial pollution of the water was found to correlate positively with Zn and Cu content (PCA3—8.90%); (4) salinity was found to mobilize As and Cr (PCA4—8.00%); (5) nutrient/microbial pollution presumably from agricultural and sewage inputs (PCA5—7.22%). AHC showed some spatial variability that grouped samples in urban/industrial (Cluster 1), rural/agricultural (Cluster 2), and a highly contaminated one, where water was toxic and presented with microbial and Cd contamination (Cluster 3). Levels of pesticides, Cr, and microbial pollution were higher than reported in previous Mekong Delta studies and exceeded regional trends. These results emphasize the importance of holistic water management strategies, including better wastewater treatment, pesticide control, sustainable farming, and climate-adaptive measures to reduce saltwater intrusion and safeguard drinking water quality for the Mekong Delta.

1. Introduction

Globally, the degradation of water quality is of growing concern, especially in areas experiencing the most rapid increase in population, urbanization, industrialization, and agricultural intensification [1,2,3,4]. Multivariate statistical techniques, including PCA, Agglomerative Hierarchical Clustering (AHC), cluster analysis (CA), and water quality index (WQI), have become essential tools to evaluate water quality, allowing identification of underlying pollution symptoms, key influencing factors, and input to corrective actions [5,6,7,8,9,10,11]. These techniques have been successfully utilized to study surface and groundwater systems in Asia [8,11,12,13,14], Africa [15,16,17,18], Europe [5,6,7,19,20,21], and America [22,23]. They demonstrate their usefulness in providing practical information to environmental scientists and engineers to improve our understanding and sustainable management of these systems. For instance, a PCA-CA approach was used to estimate the water quality of the Piabanha River based on 54 water samples obtained from nine stations [22]. This approach allowed the identification of the principal pollutants, mainly sewage discharge, and provided the configuration of the monitoring network. For example, Memet Varol (2020) [21] adopted multivariate statistical techniques (MSTs) and water quality index (WQI) in evaluating the water quality of the Sürgü Stream in the Euphrates River, Turkey, which is used for drinking, agricultural purposes, and trout farming. Through sampling monthly 16 parameters in five stations during the one-year study, the results showed a crucial spatial gradient and temporal variation due to numerous types of stress, such as wastewater effluents, aquaculture effluents, and agricultural run-off. The WQI reflected “good” to “excellent” water quality, with a cluster and discriminant analysis of the relative importance of factors for spatial and temporal variation. PCA/FA indicated that suspended solids, soluble salts, and anthropogenic nutrients were the primary drivers of water quality dynamics. In addition, Ziming Wang et al. (2020) [14] applied multivariate statistical techniques (MSTs) and the Water Quality Index (WQI) to assess surface water quality in the Yuqiao Reservoir watershed, China. Monitoring 15 variables across 10 sites (2015–2016), they found overall acceptable quality, though COD, TN, TP, and chlorophyll-a exceeded allowable limits. Cluster analysis revealed three seasonal patterns, while PCA/FA identified seven pollution sources linked to upstream, urban, and rural inputs. The absolute principal component scores and multiple linear regression (APCS & MLR) indicated upstream pollution as the dominant source and outperformed positive matrix factorization (PMF) in source apportionment. The study highlights the value of MSTs for managing complex environmental data and supporting informed governance. These cases also illustrate the international scope and applicability of multivariate methods in a world where data content is more complex and has a greater impetus for more thoughtful environmental governance.
Water quality degradation is a critical environmental and socio-economic problem in the Vietnamese Mekong Delta (VMD) [24,25]. Covering an area of 40,000 km2 with a population of around 21% of the Vietnamese population, VMD also serves as the country’s main agricultural and aquaculture area. But it is primarily dependent on the supply of good-quality surface water. The area has drastically changed over the last decades due to the intensified rice and shrimp cultivation practices [26,27,28]. Farming intensity has grown since the Green Revolution started in the mid-1980s. Three-crop rice cultivations (a year), plus shrimps everywhere, have turned hyper-intense in many places. Although these technological gains have increased yields, they have also come with significant environmental tradeoffs in nutrient leaching, pesticide runoff, and organic loading of freshwater systems. Aquaculture is a substantial source of wastewater discharge, accompanied by high nitrogen, phosphorus, antibiotics, and microbial pathogens [29,30,31,32]. This has hastened the process of eutrophication, or the over-fertilization of water, and oxygen depletion in canals and rivers across the delta.
On the other hand, the expansion of industry has outstripped the investments in infrastructure, and many export zones and industrial parks are releasing untreated or partially treated effluents into the natural watercourses [33,34]. These discharges are often replete with toxic metals and organohalogenated compounds. Urbanization compounds these effects, spiking pollution from household trash, storm drain runoff, and plastics in the water column [35]. Though the proportion of water supply systems has increased rapidly in recent years [36], many rural areas are still dependent on surface water for household activities and irrigation. This fact is in combination with a lack of basic sanitation, putting further pressure on the water quality. Although the proportion of water supply systems has increased rapidly in recent years, many rural areas still rely on surface water for household activities and irrigation. This reliance, combined with the lack of basic sanitation facilities, continues to pose profound constraints on water quality issues.
These anthropogenic activities are additional pressures to those related to climate change impacts. With rising sea levels, fresh water supplies for irrigation, aquaculture, and potable water are becoming less and less suitable. Simultaneously, heightened drought frequency and erratic rainfall patterns disturbed hydrological balance and water scarcity, contributing to pollution concentration during low-flow periods. These paired challenges of human influence and climatic stress require a synchronized, data-driven approach to water management. While several studies have addressed water quality in the Mekong Delta, most have been superficial, with short-term measures and concentrating on individual types of pollutants, isolated timeframes, or even limited spatial scales. For instance, Nguyen and Huynh (2021) [37] used cluster and discriminant analysis in a province, whereas Tran and Nguyen (2022) [38] evaluated the surface water of the upstream.
Nevertheless, a comprehensive assessment of multivariable water quality parameters over time and space is still inadequate. In addition, the various pollution sources (e.g., agriculture, industry, urban runoff, salinity intrusion) frequently remain poorly documented. To fill the identified knowledge gaps, this study performs a large-scale, multi-year statistical assessment of surface water quality in the Vietnamese Mekong Delta. The PCA, AHC, and WQI methods are used in this study based on a data set of 3117 samples presenting monthly monitoring of the 13 delta provinces between 2016 and 2022 for the following purposes: (1) examining long-term trends and variability in surface water quality; (2) identifying significant physical, chemical, and biological variables affecting water quality; (3) addressing the principal sources of pollution and patterns of regional contamination; (4) proposing recommendations based on sound evidence for improvement and management of water quality.
Importantly, by adopting a multidisciplinary approach that combines advanced statistical modeling with spatial analysis, this study aims to enhance our understanding of surface water quality dynamics in the Mekong Delta. The findings will contribute to the development of effective water resource management strategies that ensure sustainable water consumption for agriculture, aquaculture, and domestic uses. Additionally, the study will provide valuable insights to support evidence-based policymaking for environmental protection and climate adaptation in the region.

2. Materials and Methods

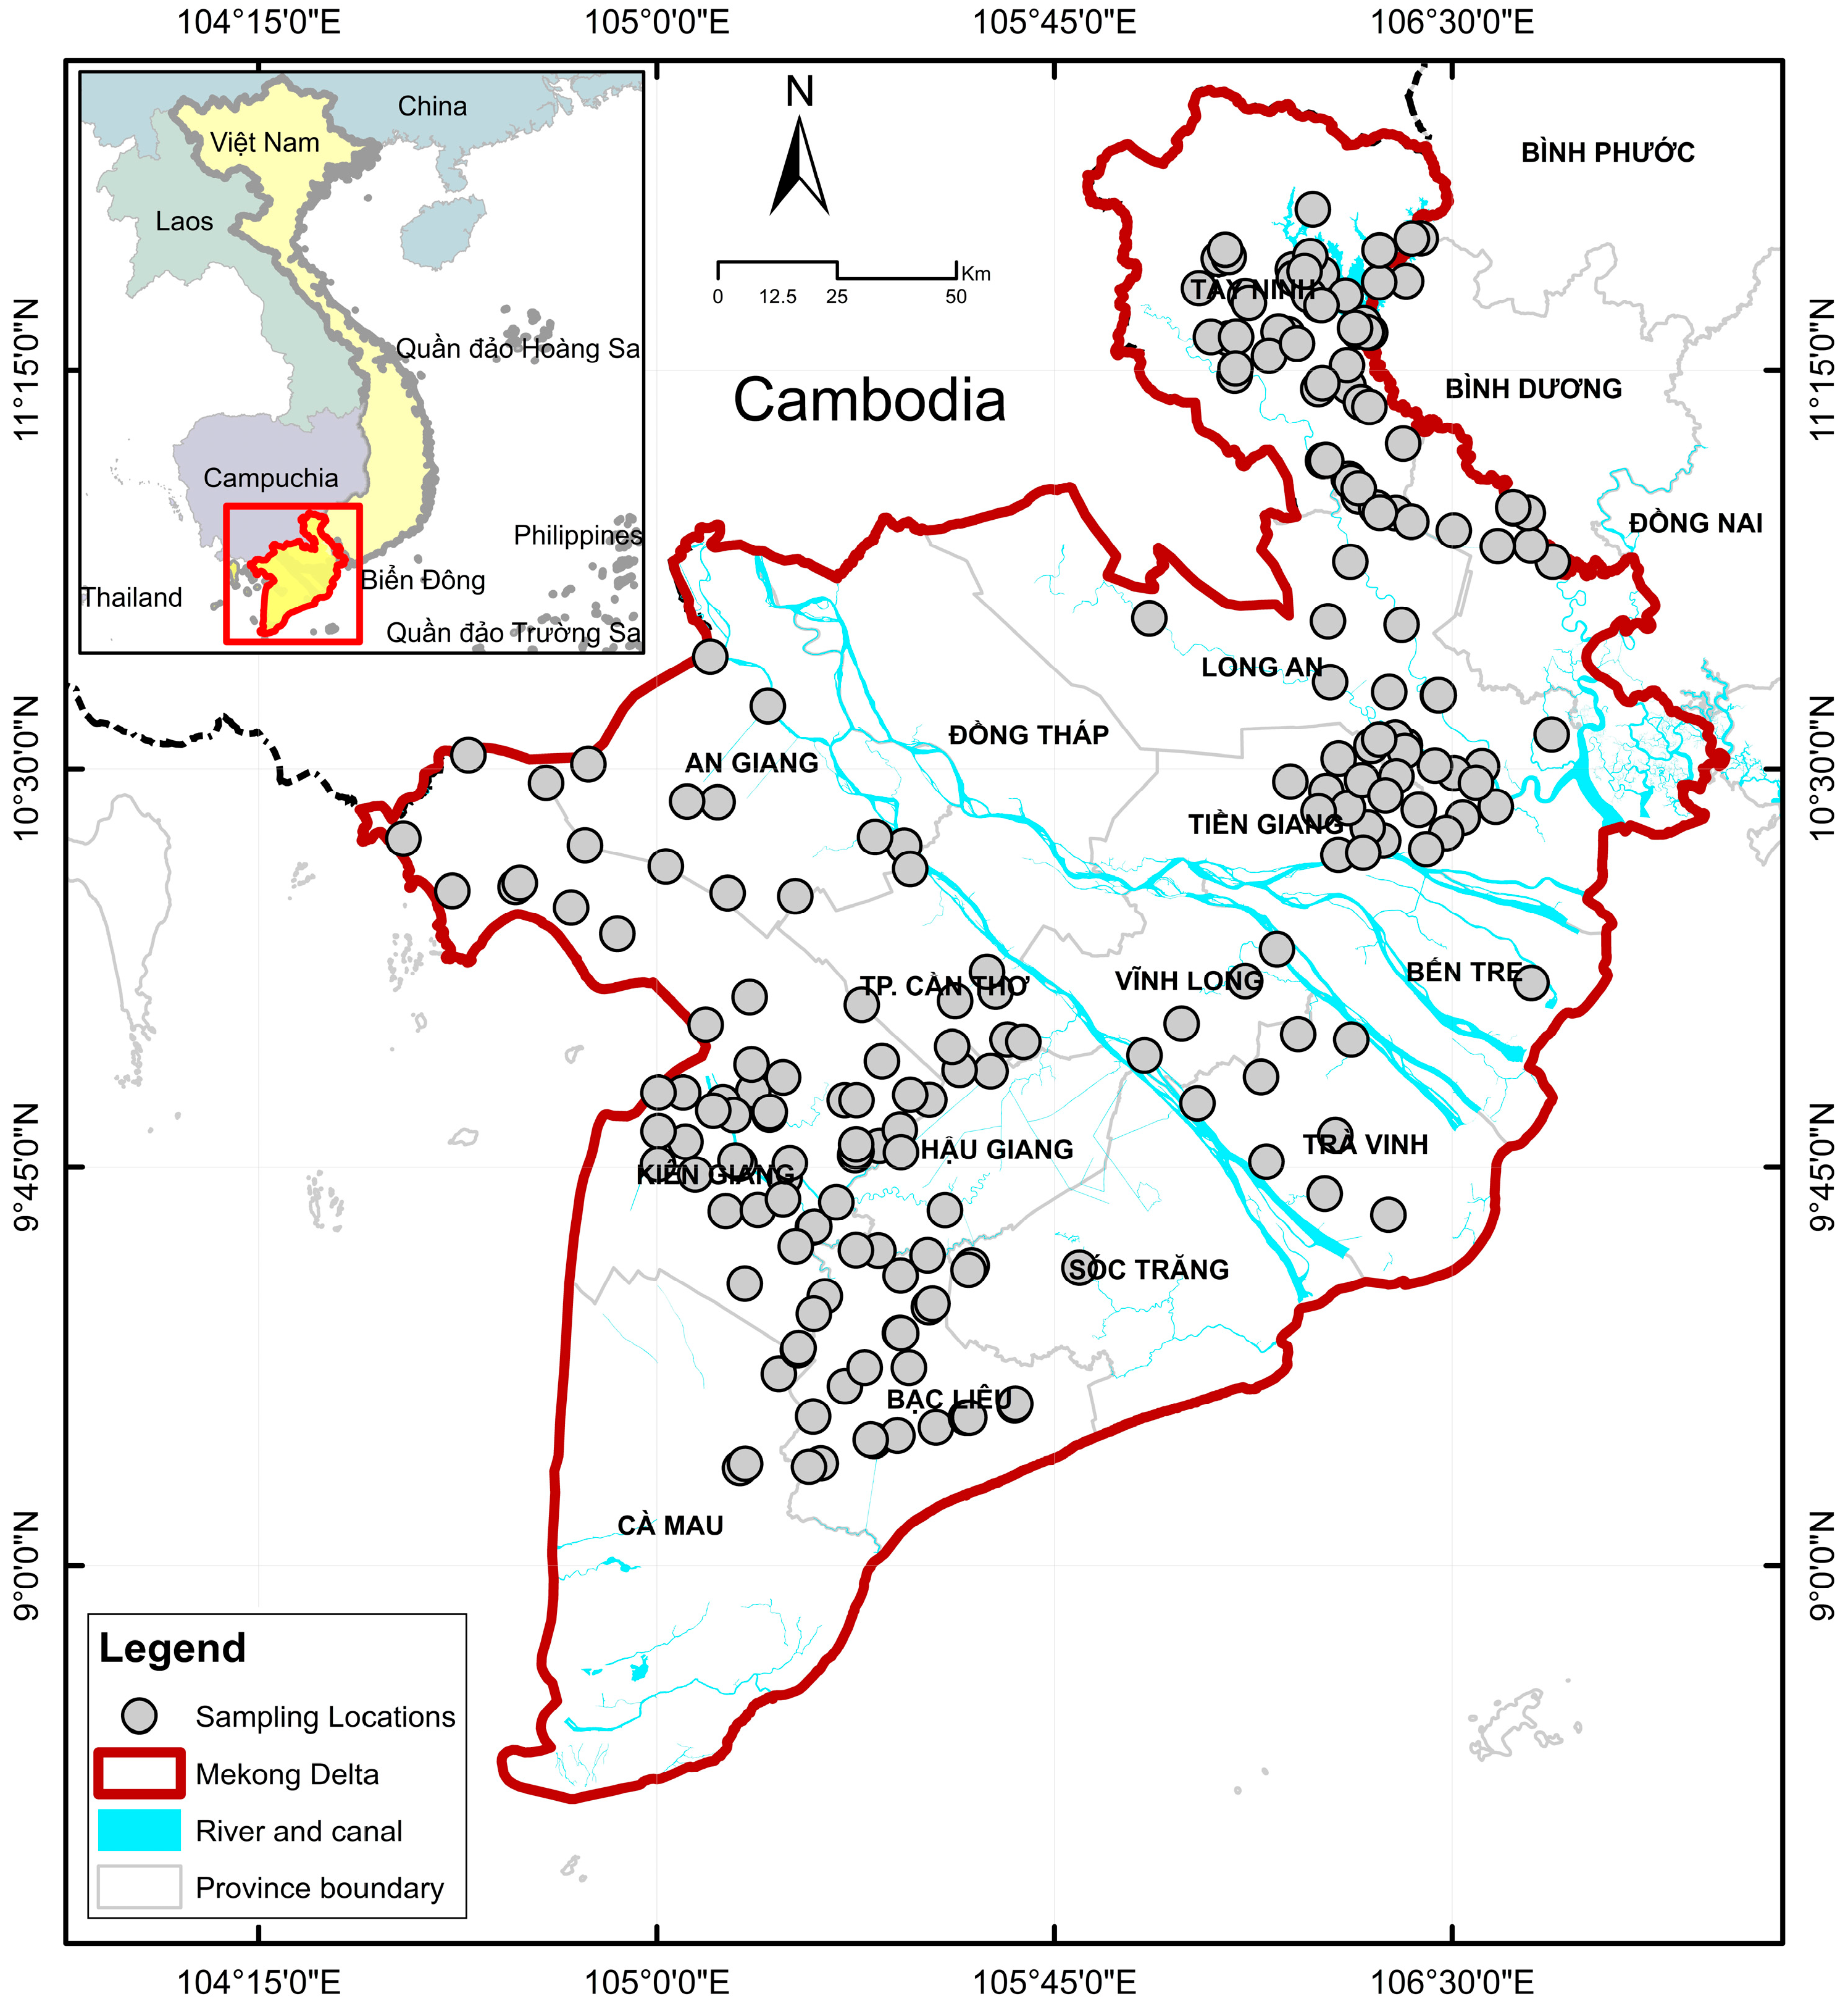
2.1. Study Area and Data Collection

This study focuses on the Vietnamese Mekong Delta (VMD), a critical region for agriculture and aquaculture, covering 40,000 km2. In this study, we collected water quality data of 3117 water samples, which are from the entire Mekong Delta, crossing different irrigation zones, with both physical and chemical parameters. These data were collected from different monitoring agencies and institutions, including the Ministry of Natural Resources and Environment (MONRE), the Ministry of Agriculture and Rural Development (MARD), and the Department of Natural Resources and Environment (DONRE) of 13 provinces in the Mekong Delta between 2016 and 2022. The locations of water samples are shown in Figure 1.
The parameters measured included physiochemical indicators (pH, temperature, total suspended solids [TSS], and dissolved oxygen [DO]), biological oxygen demand [BOD], chemical oxygen demand [COD], ammonium [NH4+], nitrate [NO3], phosphate [PO43−], heavy metals [e.g., Cd, Pb]), pesticides (Aldrin, BHC-Benzene Hexachloride; Dieldrin, DTTs consisting of Dichlorodiphenyl dichloroethylene (DDE) and Dichlorodiphenyldichloroethane (DDD), Heptachlor, Heptachlorepoxide), and microbial indicators (Coliform, E. coli). Sampling frequency varied from monthly to quarterly in order to capture seasonal variations.
It should be noted that the sampling sites are not evenly spatially distributed in the whole delta. This non-uniform distribution is representative of practical constraints, including site accessibility, availability of monitoring infrastructure, and data sharing with provincial agencies. Consequently, there will be less observation data in specific sub-regions, particularly remote or highly underdeveloped areas. This restriction could affect the resolution and soundness of the subsequent determination of the extent of spatial variability. We have taken into consideration this limitation in our interpretation through multivariate statistical tools, especially in identifying pollution clusters and regional trends.

2.2. Data Processing and Analysis

Raw data were screened for outliers using the interquartile range (IQR) method, and missing values were computed using mean substitution for continuous variables or mode for categorical data, as outlined by Vinutha et al. (2018) [39]. Data normality was assessed via the Shapiro–Wilk test, and non-normal variables were log-transformed to meet statistical assumptions [39,40]. All analyses were conducted using R (version 4.3.1) and XLSTAT 2024.4.1.1425.
Principal Component Analysis (PCA)was applied to reduce data dimensionality and identify key variables driving water quality variations [41,42,43,44,45,46]. Using the prcomp() function in R, standardized data (zero mean and unit variance) were subjected to PCA with varimax rotation to enhance interpretability. Eigenvalues > 1 determined the number of principal components (PCs), following the Kaiser criterion [47,48].
Let X R n × p be the data for the matrix, where n is the number of time points and p is the number of original water quality parameters. The PCA procedure involves the following steps:
  • Step 1—Standardization
The data is first standardized to zero mean and unit variance:
Z i j = x i j x ¯ j s j
where x ¯ j and s j   are the mean and standard deviation of the variable j, respectively.
  • Step 2—Covariance Matrix Computation
The covariance matrix C of the standardized data is calculated as follows:
C = 1 n 1 Z T Z
  • Step 3—Eigen Decomposition
PCA performs eigen decomposition of the covariance matrix:
C v k = λ k v k
where v k is the kth eigenvector (principal component) and λ k   is the corresponding eigenvalue, representing the amount of variance explained by v k .
  • Step 4—Principal Components and Dimensionality Reduction
The eigenvectors are sorted in descending order of their eigenvalues. The first m principal components (with the largest λ ) are selected to form a reduced-dimensional dataset:
Z r e d u c e d = Z V m
where V m R p × m contains the first mmm eigenvectors. This transformation retains most of the variance in the original data while reducing the number of dimensions from p to m (with m < p m ).
Agglomerative Hierarchical Clustering (AHC) was adopted to group sampling sites based on water quality similarity, using Ward’s method and Euclidean distance in R’s hclust() function [49,50,51]. The Hartigan index determined optimal cluster numbers, validated by silhouette scores. The primary steps for conducting AHC include:
  • Step 1—Distance Matrix Calculation
A distance matrix DDD is computed between all pairs of observations. The Euclidean distance is most commonly used and is defined as follows:
d i j = k = 1 p ( x i k x j k ) 2
where x i k   and x j k are the values of the kth variable for observations i and j, respectively.
  • Step 2—Linkage Criteria
AHC uses a linkage criterion to determine the distance between clusters. In this study, Ward’s method was applied, which minimizes the total within-cluster variance. At each step, the pair of clusters with the smallest increase in total within-cluster variance after merging is combined. The increase in variance (Ward’s linkage) for clusters A and B when merged into cluster C is calculated as:
E = n A n B n A + n B X A ¯ X B ¯ 2
where n A and n B are the number of observations in clusters A and B, and X A ¯ and X B ¯ are the centroids of these clusters.
  • Step 3—Dendrogram Construction
The clustering process is represented as a dendrogram, a tree-like diagram that illustrates the arrangement of the clusters and the level at which they are merged. The vertical axis of the dendrogram indicates the distance or dissimilarity at which clusters are joined.
  • Step 4—Cluster Selection
The optimal number of clusters can be determined by visually inspecting the dendrogram (looking for large vertical jumps), or by applying statistical criteria such as the silhouette coefficient, cophenetic correlation coefficient, or gap statistic. This spatial clustering analysis helps highlight regional pollution patterns, such as industrial versus agricultural impacts [49].

3. Results

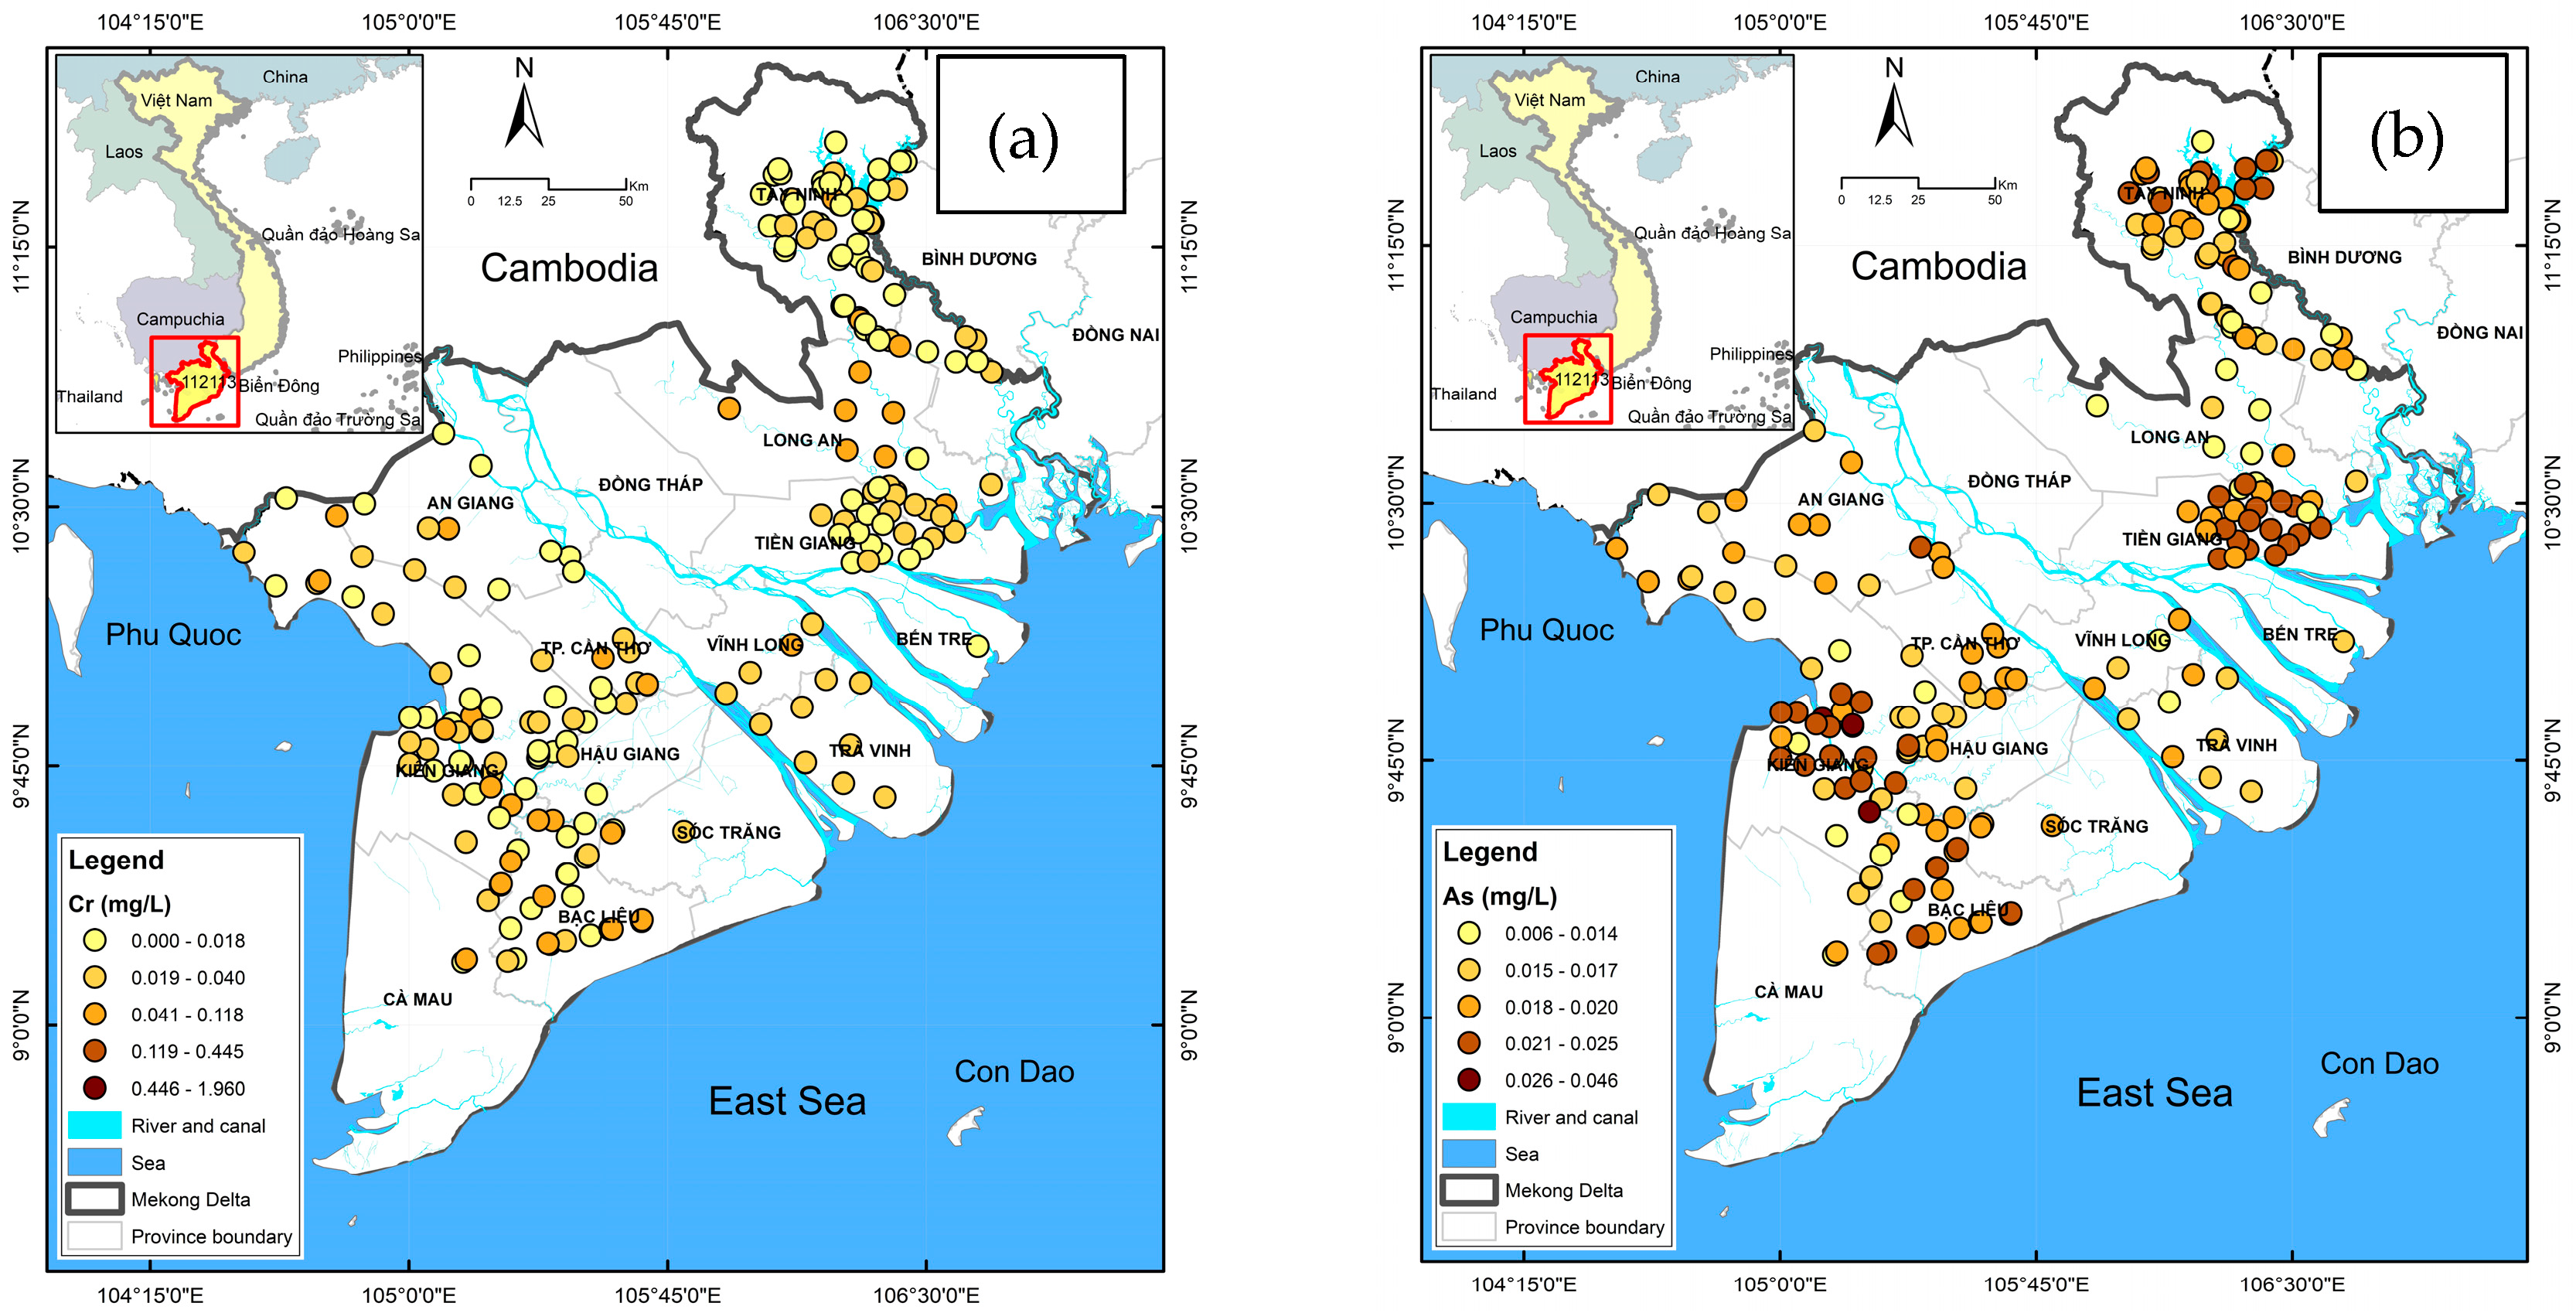
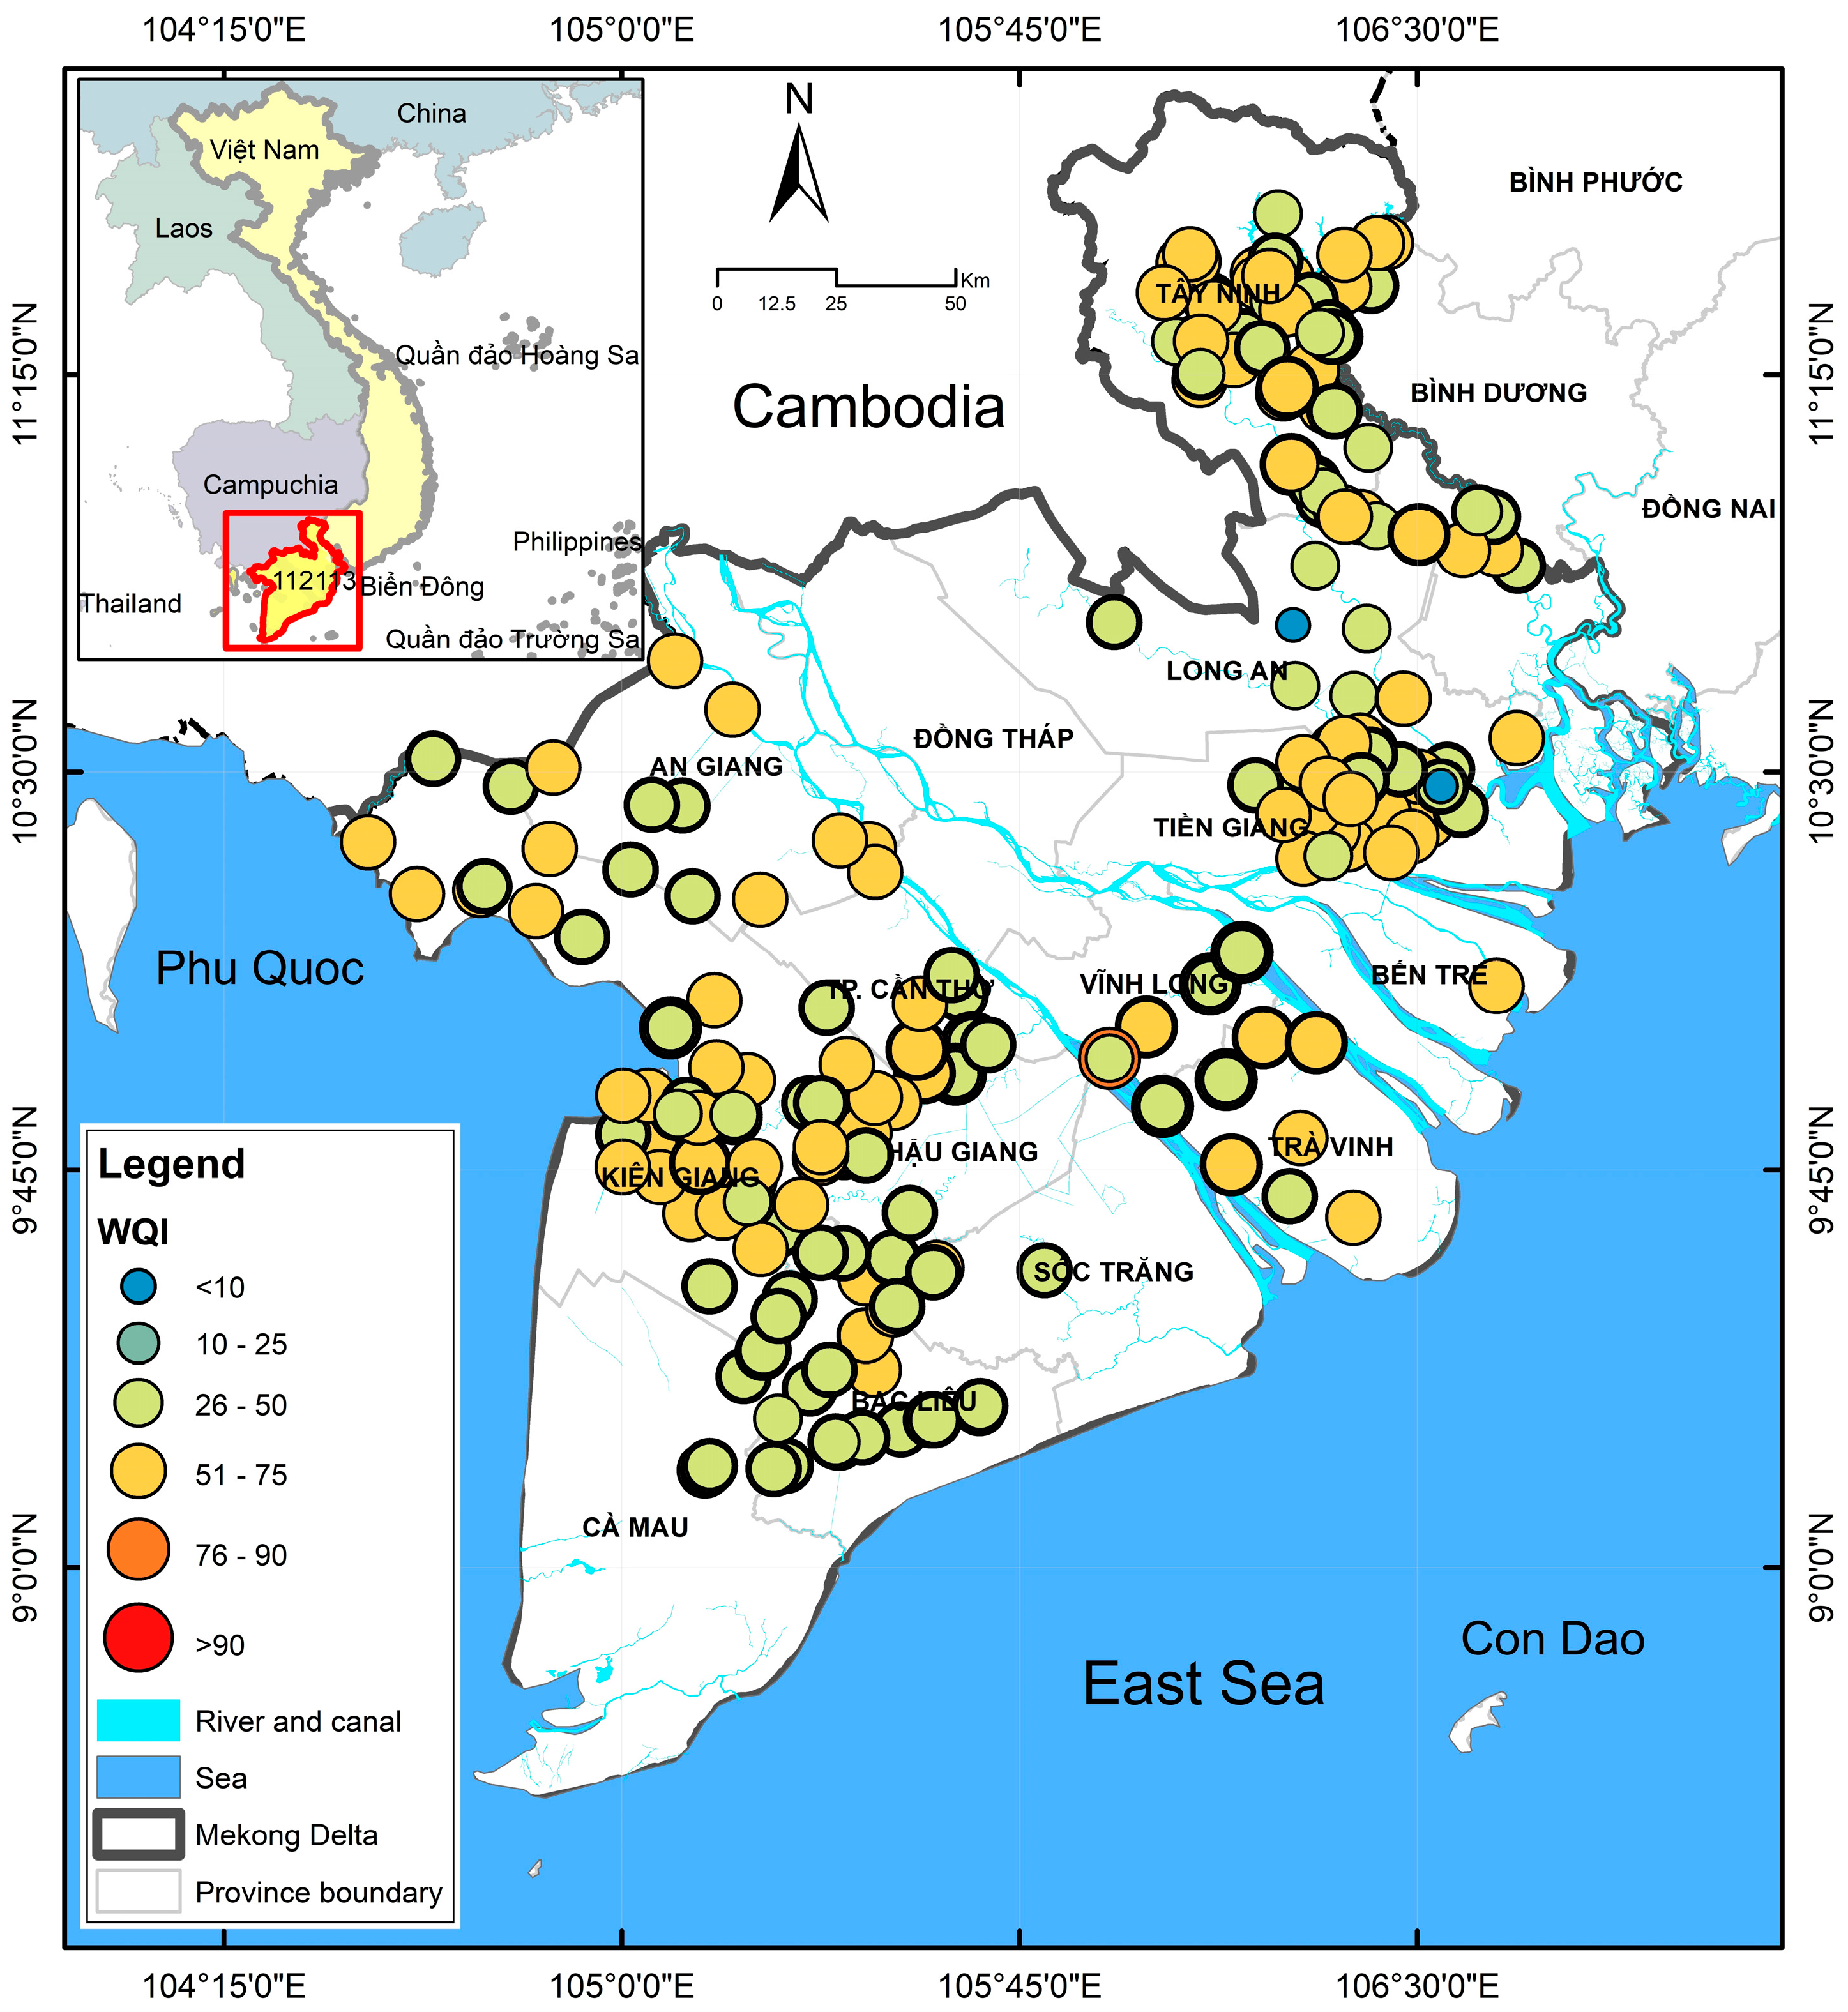
3.1. Chemical Characteristics

The chemical characteristics of surface water in the Mekong Delta indicate contamination of multiple parameters, many of which surpassed the allowable values of the WHO guideline for drinking water, as evidenced by a large dataset of 3117 observations as presented in Table 1. Key parameters are pH, DO, BOD5, COD, TOC, nutrients (N-NH4+, N-NO3, N-NO2, P-PO43), heavy metals (As, Cd, Pb, Cr6+, Cu, Zn, Hg), pesticides (Aldrin, BHC, Dieldrin, DDTs, Heptachlor, Heptachlorepoxide), and microbial indicators (Coliform, E. coli).
The surface water quality investigations showed a complex pollution situation. The pH values vary from 3.050 to 9.490 (mean: 6.998, SD: 0.588), with most of them (6.5 to 8.5) within the acceptable range of WHO, except some samples that represent potential acidification or the possibility of alkalinity (See Table S1). Oxygen levels (2.135–15.200 mg/L, mean: 5.780 mg/L, S.D: 1.130) present broad variability, with those below 5 mg/L reflecting oxygen depletion and possible overloading of organic matter. BOD5 (3.500–172.870 mg/L) and COD (6.493–472.984 mg/L) show very high maxima, implying a heavy organic pollution resulting from anthropogenic factors.
Nutrient concentrations (e.g., N-NH4+; mean: 0.489 mg/L) in the surface water are frequently close to or above the 0.5 mg/L criterion, posing a potential risk for eutrophication. N-NO3 ranged from 0.100 to 1.975 mg/L with an average of 0.390 mg/L, and SD: 0.255. N-NO2 values were from 0.100 to 1.00 mg/L with an average of 0.377 mg/L and SD: 0.241, also meeting the WHO standard (N-NO3 < 50 mg/L, N-NO2 < 3 mg/L) but with some significant variability, potentially indicating localized nitrification. P-PO43− (n.d–45.800 mg/L, avg: 1.585 mg/L, s.d.: 4.572) indicates a high risk of eutrophication due to high-P levels. Heavy metal pollutants pose a high health risk. For example, Arsenic (As: 0.006–0.046 mg/L, mean: 0.017 mg/L, SD: 0.003) frequently exceeds the WHO guideline of 0.01 mg/L—implying chronic exposure hazards. Meanwhile, Cadmium (Cd: n.d.-0 mg/L, mean: 0.010 mg/L, SD: 0.022) exceeds the WHO limit of 0.003 mg/L in specific samples, indicating toxicity issues. Lead (Pb: n.d–0.020 mg/L) and chromium (Cr: n.d–1.960 mg/L, mean 0.023 mg/L; SD 0.048) demonstrate the exceedance of WHO values (Pb < 0.01 mg/L; Cr < 0.05 mg/L), and the high Cr is a cancer risk [8]. Copper (Cu) and Zinc (Zn) are maintained within WHO acceptable (Cu < 2 mg/L; Zn < 3 mg/L) but Mercury (Hg: 0.0001–0.190 mg/L; mean: 0.004 mg/L; SD: 0.018) nears the limit imposed by the WHO of 0.00016 mg/L, which is of concern for bioaccumulation.
It was noted that legacy contaminants and POPs are of special concern in the Mekong Delta. Aldrin, Dieldrin, and Heptachlor (all organochlorine pesticides banned or restricted in several countries) were detected at maximum levels of 0.991, 0.983, and 1.031 mg/L, respectively, well above the WHO permissible values (all ≤0.00003 mg/L). The concentrations of DDTs were also detected (up to 1.227 mg/L, mean: 0.021 mg/L), indicating historical environmental persistence. Mean concentrations of BHC and Heptachloropoxide were almost at the same levels (0.022 and 0.018 mg/L), which are much higher than the WHO thresholds (0.002 and 0.0002 mg/L, respectively). These results emphasized the ongoing environmental impact of forbidden pesticides and the potential risk of bioaccumulation and ecological toxicity. The large standard deviations also suggest both spatial heterogeneity and episodic contamination events.
The results reveal a substantial multi-pollutant burden in surface water bodies, including conventional pollutants (e.g., organic matter, nutrients, and heavy metals) and toxic micropollutants (e.g., pesticides and persistent organic compounds). This contamination poses serious risks to drinking water safety, disrupts aquatic ecosystem functions, and threatens public health in the region.

3.2. Multi-Statistical Analysis

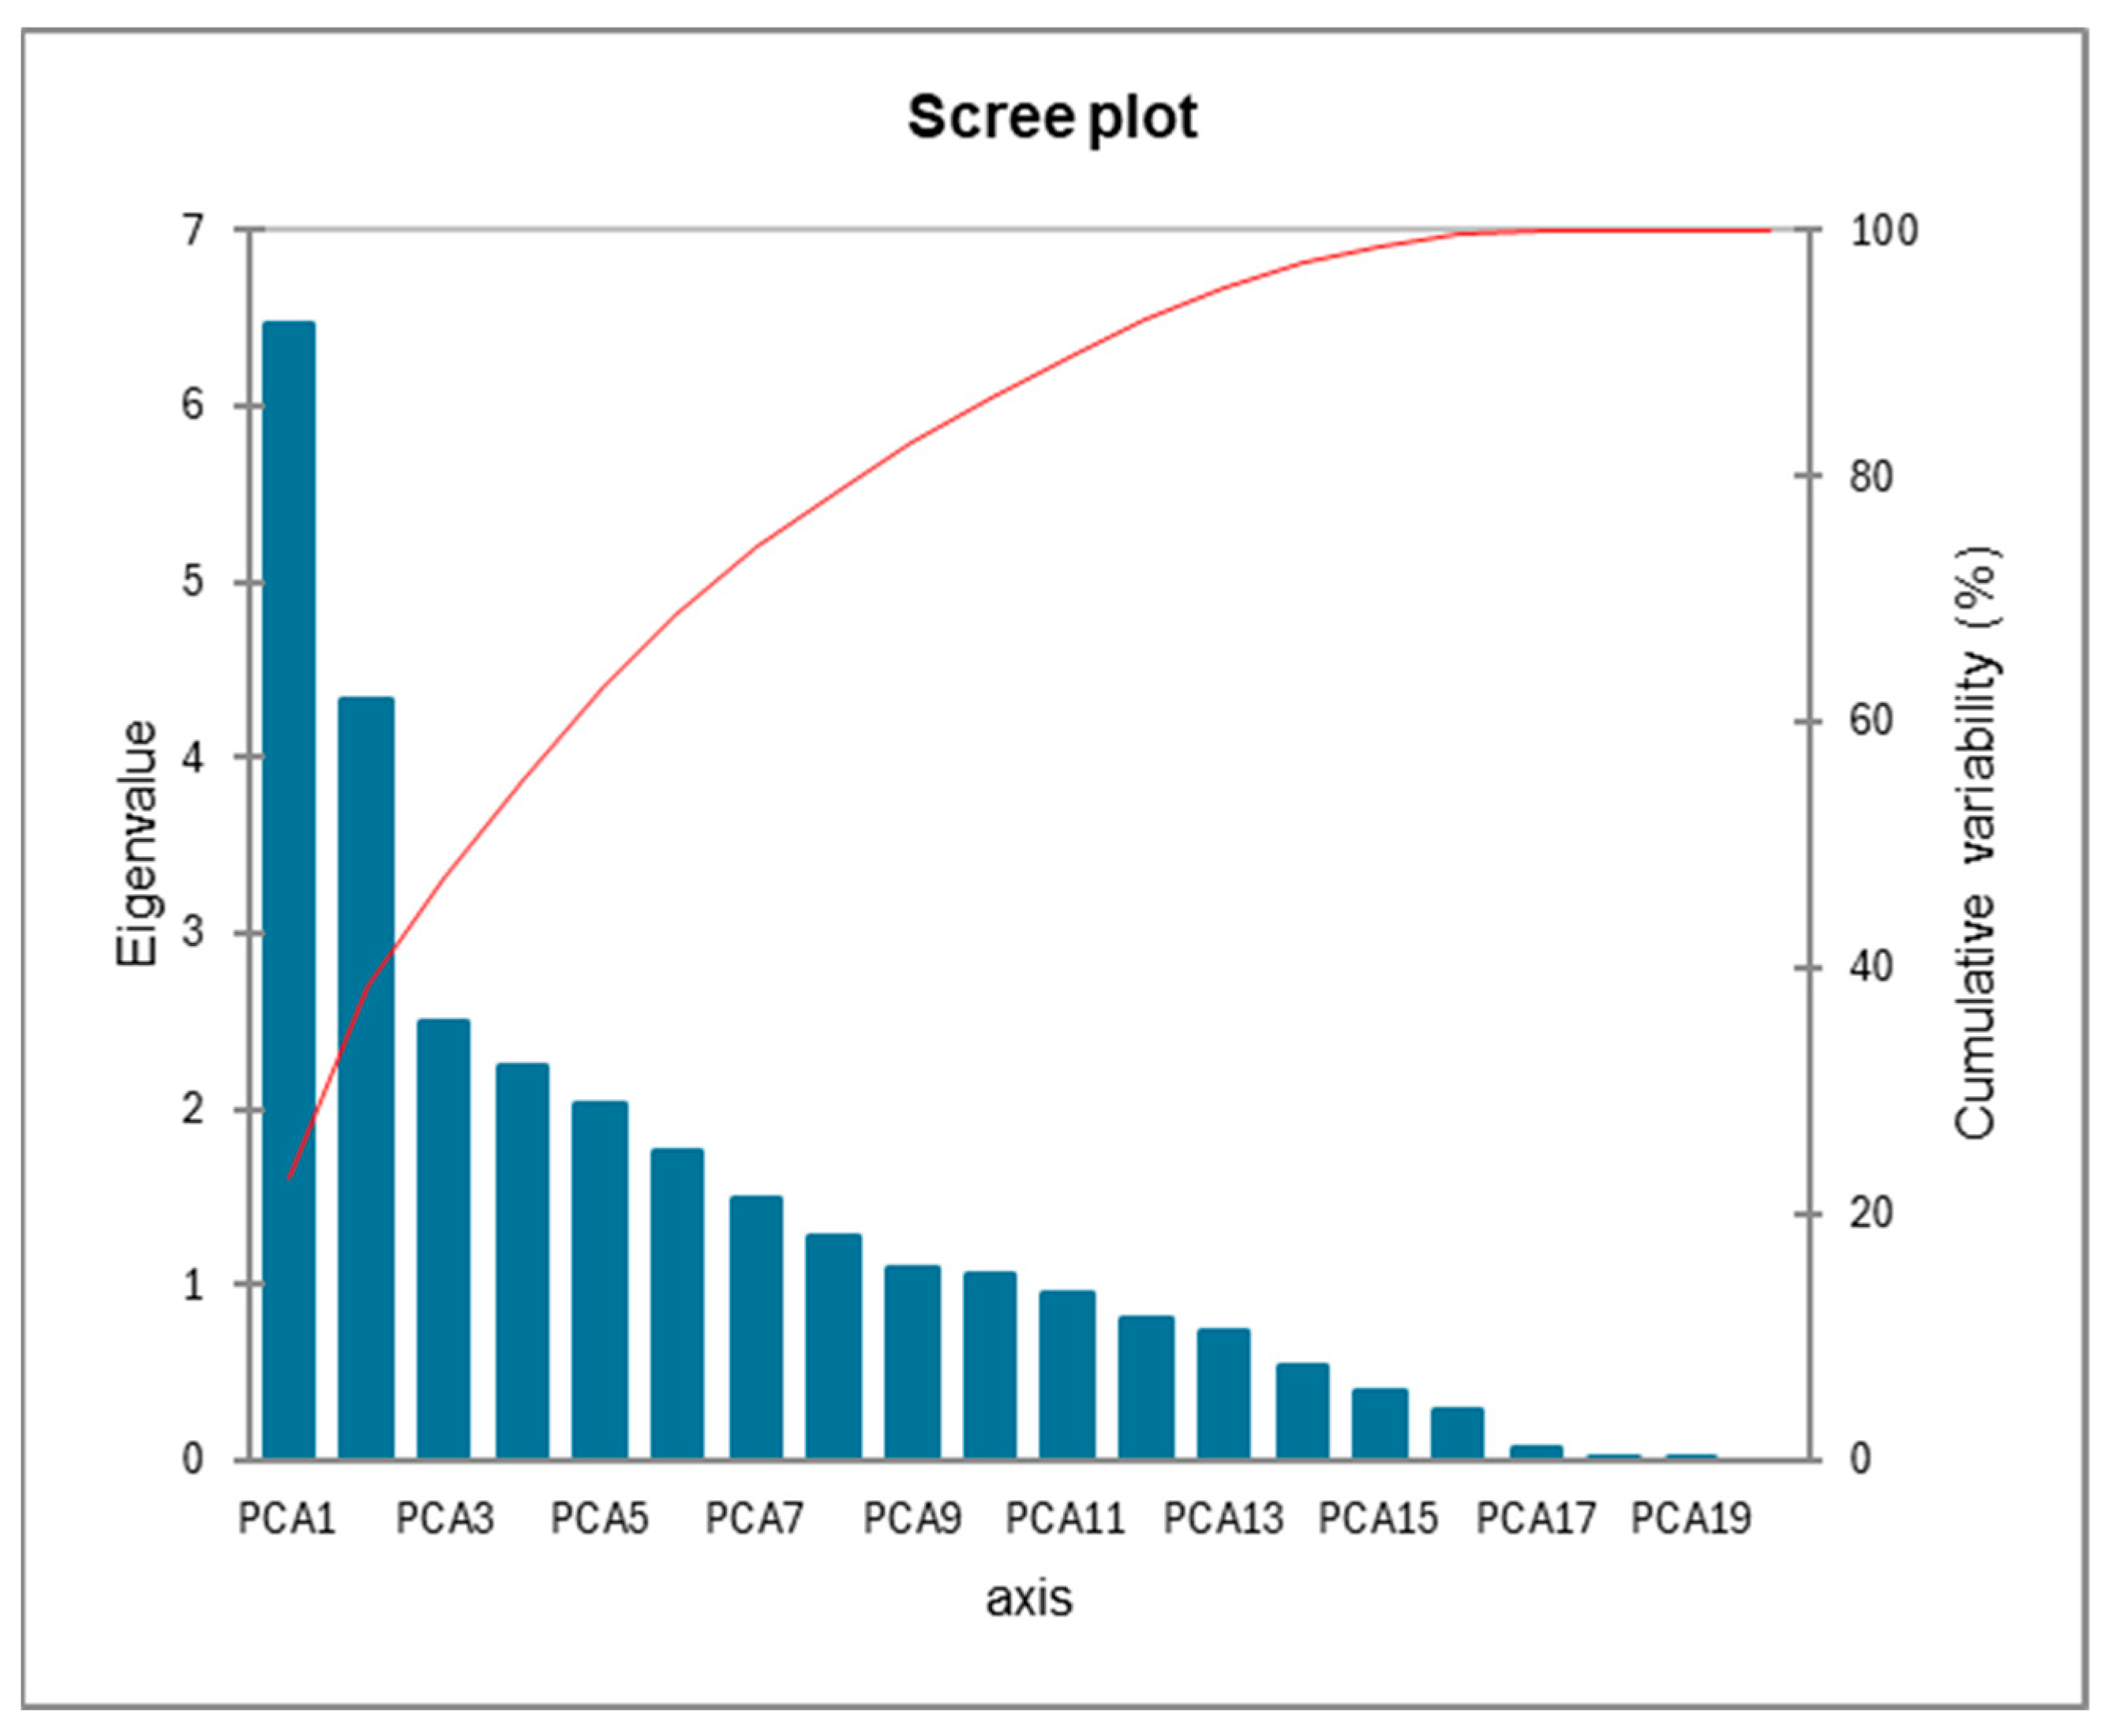
3.2.1. Principal Component Analysis (PCA)

The Principal Component Analysis (PCA) results provide valuable insights into the sources and types of water pollution in the Mekong Delta. PCA identified five key components explaining the variance in water quality parameters, as shown in Table 2 and Table 3 and Figure 2.
PCA1 explains 23.08% of the total variations, dominated by organic pollution indicators (e.g., BOD5, COD, TOC, Cd) highly correlated with these variables (e.g., BOD5: 0.61, COD: 0.63, TOC: 0.63), indicating heavy accumulation of untreated sewage and industrial effluent influence in surface water. Its high correlation with BOD5 (r = 0.942) suggests that organic contamination originates from urban wastewater. PCA2 accounts for 15.44% of the variance, which is characterized by Aldrin-like, BHC-like, and mercury-like substances, which indicate the agricultural runoff as a primary source of contamination; a strong relationship between pesticides (e.g., Aldrin-BHC: r = 0.975) confirms this observation. The contribution of PCA3 is 8.90%, and it shows microbial contamination indicators (E. coli (0.84), Coliform) and HMs such as Zn (0.84), likely fecal contamination from sewage/slurry. PCA4 accounts for 8.00% of the variance, is related to salinity, As, and Cr, indicating seawater intrusion and the mobilization of geogenic heavy metals associated with salinization in the Mekong Delta and aggravated by the increase in sea level due to climate change. At last, PCA5 7.22% of variance can be attributed to agricultural and sewage inputs, it is highly loaded on the nutrients (N-NO3) and the microbial indicators such as Coliform and heavy metals even the Pb content, with both loading factors that indicate the combined impact between the agricultural surface runoff and fecal contamination. These PCA results underscore the complexity and relationship of water pollution along the Mekong Delta caused by organic, agricultural, industrial, and microorganisms, as well as the role of climate change as an aggravating factor in increasing seawater intrusion.

3.2.2. Agglomerative Hierarchical Clustering (AHC)

HCA, using Euclidean distance and Ward’s method, grouped the water samples into three clusters, revealing spatial patterns of pollution as shown in Figure 3.
Cluster 1 consists of 68% total of observation in which a representative sample is S1070, exhibiting high organic pollution (BOD5: 4.05–5.86 mg/L, mean: 4.83 mg/L; COD: 9.60–12.61 mg/L, mean: 11.85 mg/L) and moderate heavy metal levels (Pb: 0.0014–0.003 mg/L, mean: 0.002 mg/L; Cd: 0.0012–0.0037 mg/L, mean: 0.0021 mg/L), aligning with urban/industrial influences (PCA1 and PCA4). Cluster 2 contains 28% total of samples with a representative sample of S2632, showing elevated pesticide levels (Aldrin: 0.030–0.040 mg/L, mean: 0.034 mg/L; DDTs: 0.024–0.039 mg/L, mean: 0.030 mg/L) and metals like Cr (0.030–0.052 mg/L, mean: 0.037 mg/L), reflecting agricultural runoff and industrial influence (PCA2). Cluster 3 was in 5% of total observations representing by S86, which had high Coliform contents (up to 45,100 MPN/100 mL, mean: 4392 MPN/100 mL) and Cd (0.003–0.006 mg/L, mean: 0.004 mg/L), indicating areas with poor sanitation and intensive agricultural practices (PCA3, PCA5).

4. Discussion

4.1. Trends in Water Quality Parameters

The patterns of water quality parameters in the Mekong Delta demonstrate an area under tremendous pressure from various pollutants. The repeated violations of WHO recommendations in terms of organic pollutants (BOD5, COD, and TOC) and the high variability observed for these parameters (e.g., COD SD: 1.81) Showing that the organic matter in these limnetic systems is likely to have complex sources, indicating occasional inputs by untreated sewage and industrial discharges in urban areas (Cluster 1). Such high levels of pesticides, significantly higher than the WHO’s recommended values, indicate agricultural contamination, as observed in cluster 2 of this village. The differing concentrations of pesticides (e.g., Aldrin SD: 0.00017) indicated spatial variation in the types of farming activities, with places of high rural concentration for such an intensive rice-growing area. Virtually all (99%; Coliform mean: 4392 MPN/100 mL, SD: 3026) wells have some level of microbial contamination, the variability of which is very high due to poor infrastructure of sanitation, notably in Cluster 3, representing poorly managed wastewater that further aggravates the concentration of fecal contamination.
Heavy metal trends, particularly for As and Cr, indicate a growing concern, with As levels consistently above WHO limits and Cr showing localized spikes (e.g., S1758: 0.076 mg/L) as presented in Figure 4. The low variability in As (SD: 0.00012 mg/L) suggests a uniform impact of saltwater intrusion across coastal areas (PCA4), while the higher variability in Cr (SD: 0.013 mg/L) implies to specific industrial hotspots, areas close to urban centers and municipalities such as Can Tho, Rach Gia, My Tho, and Ca Mau cities. Nutrient trends (e.g., N-NH4 and P-PO4) show moderate variability, with exceedances in N-NH4 (e.g., S1702: 0.9 mg/L) indicating agricultural runoff and sewage inputs, consistent with PCA5. The overall WQI trend (mean: 65.37, SD: 13.01) reflects a broad range of water quality conditions, with poorer quality in rural areas (Cluster 3) due to combined agricultural and microbial pollution, as shown in Figure 5.

4.2. Variability and Spatial Patterns

The variability in water quality parameters is driven by a combination of natural and anthropogenic factors, as revealed by PCA and AHC. Organic pollution (PCA1) shows high variability (e.g., BOD5 SD: 0.73), reflecting the inconsistent discharge of untreated sewage and industrial effluents, particularly in urban areas (Cluster 1). The strong correlations among BOD5, COD, and TOC (e.g., BOD5-COD r = 0.942) suggest a common source, with urban centers contributing to fluctuating organic loads. Pesticide variability (PCA2) is notable, with rural areas (Cluster 2) showing higher concentrations due to intensive farming practices. The high correlations among pesticides (e.g., Aldrin-BHC r = 0.975) indicate uniform agricultural impacts, though the variability in concentrations (e.g., DDTs SD: 0.00018) suggests differences in pesticide application rates or degradation processes.
Microbial pollution (PCA3, PCA5) exhibits the highest variability, with Coliform levels ranging widely (SD: 3026), driven by poor sanitation infrastructure in rural areas (Cluster 3). The association with Cu (r = 0.994) suggests co-occurrence in sewage discharges, with variability reflecting differences in sanitation practices across the Delta. Saltwater intrusion (PCA4) shows relatively low variability (salinity SD: 0.02), indicating a consistent impact on coastal areas, mobilizing As and Cr. Nutrient variability (e.g., N-NO3 SD: 0.17) reflects diverse agricultural inputs, with higher levels in Cluster 3, where farming is intensive. The HCA clustering analysis highlights spatial patterns, with urban areas (Cluster 1) showing organic and industrial pollution, rural and agricultural zones (Cluster 2) exhibiting pesticide and heavy metal contamination, and areas with poor sanitation facilities (Cluster 3) suffering from severe microbial and nutrient pollution.

4.3. Key Influencing Factors

The main forces of intuition discovered by PCA and AHC are human activities and climate events. PCA1 showed organic pollution and Cd contamination, mainly associated with untreated sewage and industrial effluents. Urban activities such as Can Tho, Rach Gia, My Tho, and Ca Mau cities also had large organic components.
The significant impact of this factor (23.08% of variation) highlights that there is no ongoing wastewater treatment system in the Mekong Delta. Agricultural runoff (PCA2) is a key signature (15.44% variance), and pesticides and Hg are important pollutants (Aldrin: 13.17% contributions) due to heavy reliance on rice farming in the region, and continued use of banned organochlorine pesticides. Microbiological contamination (PCA3, PCA5) is shaped as a function of unsanitary and livestock waste facilities, with the most significant contribution derived from E. coli (28.51%) and Coliform (12.58% in PCA5), indicating that controlling practices of contamination in rural areas is urgently required.
Climate change-driven sea level rise and over-withdrawals of surface water contribute significantly to saltwater intrusion (PCA4), which strongly impacts As and Cr concentrations (contributions to the variations of 17.03% and 0.04%, respectively). The uniformity of this factor’s effect in coastal zones (Cluster 2) aligns with previous findings about salinity in the Lower Mekong Delta region. The nutrient pollution (PCA5) induced by agricultural runoff and sewage discharges is closely related to the risk of eutrophication, dominated by N-NO3 and Pb (34.20% and 34.21% obviously). The combination of urban sewage, agriculture, inadequate sanitation, and climate change adds up to a messy pollution problem, which takes on local manifestations to exacerbate threats to water quality, cascading across the Delta.
Previous studies in the Mekong Delta support these findings, though they indicated evolving trends. T. G. Nguyen et al. 2021 [52] reported similar organic pollution levels (BOD5: 1.6–48.8 mg/L, COD: 8.0–91.0 mg/L) in surface water along Hau and Tien rivers consistent with Cluster 1, but noted lower pesticide levels (DDTs: 0.0001–0.0005 mg/L) compared to this study (0.0005–0.050 mg/L), suggesting an increasing trend in pesticides contamination. A high arsenic (As) concentrations in surface water of this study (0.006–0.046 mg/L) attributed to not omly saltwater intrusion but also affected by industrial activities aligning with PCA4. However, Cr and Pb levels in the study area are up to 1.960 and 0.02 mg/L, respectively, higher than previously reported (0.01–0.03 mg/L by T. G. Nguyen et al. (2023) [24], indicating a rise in industrial pollution sources. Microbial contamination (Coliform: n.d–45,100 MPN/100 mL) surpasses the levels reported by previous studies [38,48] (2620–12,000 MPN/100 mL), which claimed a worsening trend due to deteriorating sanitation conditions, particularly in Cluster 3.
Comparatively, studies in other deltaic regions show similar patterns. In the Jie river delta, Jin et al. (2024) [53] reported As levels (0.01–0.05 mg/L) slightly higher than those in this study, caused by highly contaminated sediments from regions near sewage outlets, suggesting less agricultural contamination than in the Mekong Delta. In Bangladesh, F. Parvin et al., 2022 [54] exhibited comparable microbial pollution (Coliform: 1000–10,000 MPN/100 mL), but higher nutrient levels (N-NO3: 1–5 mg/L), reflecting greater fertilizer use. Zhao et al. (2018) reported Cr levels (0.022–0.315 mg/L) in the Pearl River Delta [55], which is similar to this study, driven by industrial sources, but lower organic pollution (BOD5: 2–5 mg/L) [56], likely due to better wastewater treatment. These comparisons indicate the fact that the unique and shared challenges different deltaic systems faced, emphasizing the need for targeted policy interventions to improve water quality management in the Mekong Delta.

4.4. Implications for Water Quality Management

Results from this study indicate different pollution situations in the Mekong Delta, primarily influenced by various anthropogenic and climate-related factors. To deal with these challenges properly, here, we provide a series of targeted and data-driven management practices according to the five primary polluting sources (PS) categorized by PCA and AHC, including:
PS1-Organic Pollution and Cadmium from Urban Sewage and Industrial Wastewater: Higher BOD5, COD, and Cd concentrations are observed in urban and peri-urban areas (e.g., Can Tho, Rach Gia). Centralized and decentralized wastewater treatment systems should be enlarged according to discharge standards for industrial effluents. It is also essential to motivate innovative eco-industrial models. Modernizing outdated sewage systems and increasing the frequency of monitoring in industrial areas is also imperative.
PS2-Toxic Pollution from Pesticides and Mercury from Agricultural Runoff: Regions with intensive rice-shrimp farming, rural areas have high levels of banned organochlorine pesticides & mercury. We advocate for the enforcement of pesticide laws, the encouragement of IPM, the support of organic farming programs, farmer training in the safe use of chemicals, and alternatives to them.
PS3-Microorganisms and Related Heavy Metals (Zn, Cu): High coliform and E. coli contamination, especially in Cluster 3, indicates unsatisfactory sanitation conditions and poor management of animal waste. Immediate measures include improving the sanitation of household latrines, building new rural wastewater treatment facilities, separating stormwater and sewage, and managing livestock waste.
PS4-Saltwater intrusion mobilizing arsenic and chromium: Coastal regions are subjected to salinization, which leads to the mobilization of heavy metals (As and Cr are commonly observed in the delta). Some long-term solutions are integrated management of groundwater and surface water, reducing excessive groundwater extraction, constructing interception works and sluice gates, and enhancing aquifer recharge technologies (such as managed aquifer recharge -MAR).
PS5-Agriculture and Domestic Combined Waste Nutrient and Microbial Pollution: Too much nitrogen and phosphorus from fertilizers and wastewater raise risks of eutrophication. Suggested control measures include using nutrient budgeting in agriculture, creating buffer strips and wetlands, developing biogas in rural households, and educating farmers on appropriate fertilizer applications.
This should be structured into a broader integrated water quality management framework integrating science-based monitoring with policy enforcement, stakeholder involvement, climate change adaptation planning, etc. Furthermore, spatial prioritization of these results through cluster analysis can support resource allocation and management mechanisms towards the most critical regions. Improvements in temporal monitoring can assist in tracking pollution trends and evaluating management performance.

5. Conclusions

An integrated analysis of the surface water quality of the Mekong Delta over 6 years (2016–2022), using Principal Component Analysis (PCA) and Agglomerative Hierarchical Clustering (AHC) is reporting herein to unearth the primary pollution sources, the spatial variations as well as the potential risks of water quality crossing the investigated sites. These results point out several important issues, which can be enumerated as follows:
(1)
Widespread exceedance of water quality standards:
Major parameters include organic pollutants (e.g., BOD5: 172.870 mg/L, COD: 472.984 mg/L), nutrients (e.g., N-NH4+, N-NO3), heavy metals (e.g., Cr: 1.960 mg/L, As, Cd, Pb, Hg), pesticides (e.g., DDTs: 1.227 mg/L), and microbial indicators (Coliform, E. coli) which occasionally exceed WHO drinking water standards. The current state of water quality underscores the urgent need for proactive measures to prevent potential risks to human health and environmental issues in the Mekong Delta.
(2)
Source apportionment of the five primary pollution sources (PS)
PCA and AHC further summarized five major pollution patterns (i) PS1: Organic and Cd pollution from untreated sewage and industrial wastewater; (ii) PS2: Pesticide and Hg pollution by agricultural exudates; (iii) PS3: Microbial pollution and associated heavy metals (Zn, Cu) from fecal sources; (iv) PS4: Saltwater intrusion mobilizing geogenic metals (As, Cr), exacerbated by climate change and over-extraction, and (v) PS5: Combined nutrient and microbial pollution from agricultural and domestic inputs.
(3)
Spatial clustering reveals regional pollution characteristics
AHC grouped water samples into three distinct clusters, including (i) Cluster 1: Urban/industrial zones with high organic loads (e.g., Can Tho, Rach Gia); (ii) Cluster 2: Rural zones with elevated pesticide and heavy metal levels, and (iii) Cluster 3: Severely polluted areas with extreme microbial and Cd contamination, linked to poor sanitation and intensive agriculture.
(4)
Comparative trends indicate increasing levels of pesticides and chromium
Although previous examinations in the Mekong Delta had also reported organic and arsenic contamination, our research revealed increased pesticide and Cr levels related to increased agricultural and industrial activities. Pesticide pollution in the Mekong Delta is unusually high relative to other deltaic systems (Ganges, Nile, and Pearl River), indicating the continued use of banned organochlorines.
(5)
Importance of integrated water management
The combined effects of an absence of wastewater treatment, agricultural effluent, and saltwater intrusion driven by climate change demand immediate attention. Key recommendations include (i) There is a trend towards installing both centralised and decentralized wastewater treatment systems; (ii) Tighter enforcement of pesticide use regulations and the encouragement of integrated pest management; (iii) Improvement of rural sanitary devices; (iv) Utilization of aquifer recharge and groundwater conservation methods, and (v) Such focused actions are critical to sustaining public health, assisting in ecological balance, and ensuring the long-term sustainability of the Mekong Delta water supply.

Supplementary Materials

The following supporting information can be downloaded at: https://www.mdpi.com/article/10.3390/su17125375/s1, Table S1: Description of Water Quality Parameters, Abbreviations, WHO Guideline Limits, and Units.

Author Contributions

Conceptualization, D.A.T., V.T.D., N.A.T. and C.C.L.; methodology, D.A.T., V.T.D., H.V.T.L., P.L.V., T.T.H.V. and H.V.N.; software, H.V.N. and H.V.T.L.; validation, C.C.L., P.L.V., T.T.H.V. and D.A.T.; formal analysis, D.A.T., P.L.V. and T.T.H.V.; investigation, H.V.T.L. and T.T.H.V.; resources, D.A.T.; data curation, T.T.H.V. and H.V.N.; writing—original draft preparation, V.T.D., C.C.L., N.A.T. and D.A.T.; writing—review and editing, D.A.T., P.L.V. and T.T.; visualization, H.V.N.; supervision, D.A.T. and N.A.T.; project administration, N.A.T.; funding acquisition, V.T.D., C.C.L. and T.T. All authors have read and agreed to the published version of the manuscript.

Funding

This research was funded by the Ministry of Science and Technology (MOST), Vietnam, through two projects: “Study on the Mechanism of Transport, Accumulation, and Dispersion of Pollutants in Coastal Waters from Vung Tau to Kien Giang” (Project Code: ĐTĐL.CN-57/21), and “Study on the Development of Characteristic Lines of Meteoric, Surface, and Groundwater to Determine the Contribution Ratio of Upstream Water Sources to the Mekong Delta” (Project Code: ĐTĐL.CN-54/22). The support provided by MOST was instrumental in facilitating data collection, analysis, and interpretation, contributing significantly to the completion of this study.

Institutional Review Board Statement

Not applicable.

Informed Consent Statement

Not applicable.

Data Availability Statement

All data generated or analyzed during this study are available from the corresponding author on reasonable request.

Acknowledgments

The authors would like to thank the Mekong Delta Data Center (MKDC), Southern Environmental Monitoring Center in the South region, for the data provision. Additionally, we extend our gratitude to Thuyloi University for their logistical support and to the Ministry of Science and Technology (MOST), Vietnam, for generously providing essential materials used in the experiments. Last but not least, we would like to thank the Ho Chi Minh City University of Technology (HCMUT) for its support of time and facilities. Their invaluable contributions played a crucial role in the successful completion of this study.

Conflicts of Interest

The authors declare no conflict of interest.

References

  1. Adu, J.T.; Kumarasamy, M.V. Assessing Non-Point Source Pollution Models: A Review. Pol. J. Environ. Stud. 2018, 27, 1913–1922. [Google Scholar] [CrossRef] [PubMed]
  2. Ardila, A.; Rodriguez, M.J.; Pelletier, G. Spatiotemporal Optimization of Water Quality Degradation Monitoring in Water Distribution Systems Supplied by Surface Sources: A Chronological and Critical Review. J. Environ. Manag. 2023, 337, 117734. [Google Scholar] [CrossRef] [PubMed]
  3. Shakya, B.M.; Nakamura, T.; Shrestha, S.; Pathak, S.; Nishida, K.; Malla, R. Tap Water Quality Degradation in an Intermittent Water Supply Area. Water Air Soil Pollut. 2022, 233, 81. [Google Scholar] [CrossRef]
  4. Sor, R.; Ngor, P.B.; Soum, S.; Chandra, S.; Hogan, Z.S.; Null, S.E. Water Quality Degradation in the Lower Mekong Basin. Water 2021, 13, 1555. [Google Scholar] [CrossRef]
  5. Horvat, M.; Horvat, Z.; Pastor, K. Multivariate Analysis of Water Quality Parameters in Lake Palic, Serbia. Environ. Monit. Assess. 2021, 193, 410. [Google Scholar] [CrossRef]
  6. Mamun, M.; Kim, J.Y.; An, K.G. Multivariate Statistical Analysis of Water Quality and Trophic State in an Artificial Dam Reservoir. Water 2021, 13, 186. [Google Scholar] [CrossRef]
  7. Gyimah, R.A.A.; Gyamfi, C.; Anornu, G.K.; Karikari, A.Y.; Tsyawo, F.W. Multivariate Statistical Analysis of Water Quality of the Densu River, Ghana. Int. J. River Basin Manag. 2021, 19, 189–199. [Google Scholar] [CrossRef]
  8. Pratama, M.A.; Immanuel, Y.D.; Marthanty, D.R. A Multivariate and Spatiotemporal Analysis of Water Quality in Code River, Indonesia. Sci. World J. 2020, 2020, 8897029. [Google Scholar] [CrossRef]
  9. Muniz, D.H.F.; Oliveira-Filho, E.C. Multivariate Statistical Analysis for Water Quality Assessment: A Review of Research Published between 2001 and 2020. Hydrology 2023, 10, 196. [Google Scholar] [CrossRef]
  10. Horvat, Z.; Horvat, M.; Pastor, K.; Bursić, V.; Puvača, N. Multivariate Analysis of Water Quality Measurements on the Danube River. Water 2021, 13, 3634. [Google Scholar] [CrossRef]
  11. Pairan, M.A.; Zamri, N.; Ismail, A. Assessment of Water in Terengganu River, Malaysia Using Multivariate Statistical Techniques and Fuzzy DEMATEL. Int. J. Adv. Sci. Eng. Inf. Technol. 2023, 13, 1225–1234. [Google Scholar] [CrossRef]
  12. Wang, Y.; Wang, P.; Bai, Y.; Tian, Z.; Li, J.; Shao, X.; Mustavich, L.F.; Li, B.L. Assessment of Surface Water Quality via Multivariate Statistical Techniques: A Case Study of the Songhua River Harbin Region, China. J. Hydro-Environ. Res. 2013, 7, 30–40. [Google Scholar] [CrossRef]
  13. Oleiwi, A.S.; Al-Dabbas, M. Assessment of Contamination along the Tigris River from Tharthar-Tigris Canal to Azizziyah, Middle of Iraq. Water 2022, 14, 1194. [Google Scholar] [CrossRef]
  14. Wang, Z.; Jia, D.; Song, S.; Sun, J. Assessments of Surface Water Quality through the Use of Multivariate Statistical Techniques: A Case Study for the Watershed of the Yuqiao Reservoir, China. Front. Environ. Sci. 2023, 11, 1107591. [Google Scholar] [CrossRef]
  15. Elumalai, V.; Brindha, K.; Lakshmanan, E. Human Exposure Risk Assessment Due to Heavy Metals in Groundwater by Pollution Index and Multivariate Statistical Methods: A Case Study from South Africa. Water 2017, 9, 234. [Google Scholar] [CrossRef]
  16. Ngamlana, Z.; Malherbe, W.; Gericke, G. Association of Coal Fired Power Plants with River Water Quality in South Africa. Limnologica 2024, 104, 126140. [Google Scholar] [CrossRef]
  17. Andati, P.; Majiwa, E.; Ngigi, M.; Mbeche, R.; Ateka, J. Determinants of Adoption of Climate Smart Agricultural Technologies among Potato Farmers in Kenya: Does Entrepreneurial Orientation Play a Role? Sustain. Technol. Entrep. 2022, 1, 100017. [Google Scholar] [CrossRef]
  18. Mangadze, T.; Taylor, J.C.; Froneman, W.P.; Dalu, T. Water Quality Assessment in a Small Austral Temperate River System (Bloukrans River System, South Africa): Application of Multivariate Analysis and Diatom Indices. S. Afr. J. Bot. 2019, 125, 353–359. [Google Scholar] [CrossRef]
  19. Lin, Y.I.; Pan, S.Y.; Chang, H.H.; Yu, M.S.; Lin, W.L. Will Extreme Drought Impact the Reservoir Water Quality? A 30-Year Observational Study. Agric. Water Manag. 2023, 289, 108574. [Google Scholar] [CrossRef]
  20. Lawson, T.; Lycett, G.W.; Ali, A.; Chin, C.F. Characterization of Southeast Asia Mangoes (Mangifera indica L.) According to Their Physicochemical Attributes. Sci. Hortic. 2019, 243, 189–196. [Google Scholar] [CrossRef]
  21. Varol, M. Use of Water Quality Index and Multivariate Statistical Methods for the Evaluation of Water Quality of a Stream Affected by Multiple Stressors: A Case Study. Environ. Pollut. 2020, 266, 115417. [Google Scholar] [CrossRef] [PubMed]
  22. de Andrade Costa, D.; Soares de Azevedo, J.P.; dos Santos, M.A.; dos Santos Facchetti Vinhaes Assumpção, R. Water Quality Assessment Based on Multivariate Statistics and Water Quality Index of a Strategic River in the Brazilian Atlantic Forest. Sci. Rep. 2020, 10, 22038. [Google Scholar] [CrossRef] [PubMed]
  23. Barrie, A.; Agodzo, S.K.; Frazer-Williams, R.; Awuah, E.; Bessah, E. A Multivariate Statistical Approach and Water Quality Index for Water Quality Assessment for the Rokel River in Sierra Leone. Heliyon 2023, 9, e16196. [Google Scholar] [CrossRef] [PubMed]
  24. Giao, N.T.; Nhien, H.T.H.; Anh, P.K.; Thuptimdang, P. Groundwater Quality Assessment for Drinking Purposes: A Case Study in the Mekong Delta, Vietnam. Sci. Rep. 2023, 13, 4380. [Google Scholar] [CrossRef]
  25. Tuu, N.T.; Lim, J.; Kim, S.; Tri, V.P.D.; Kim, H.; Kim, J. Surface Water Resource Assessment of Paddy Rice Production under Climate Change in the Vietnamese Mekong Delta: A System Dynamics Modeling Approach. J. Water Clim. Change 2020, 11, 514–528. [Google Scholar] [CrossRef]
  26. Leigh, C.; Stewart-Koster, B.; Van Sang, N.; Van Truc, L.; Hiep, L.H.; Xoan, V.B.; Tinh, N.T.N.; An, L.T.; Sammut, J.; Burford, M.A. Rice-Shrimp Ecosystems in the Mekong Delta: Linking Water Quality, Shrimp and Their Natural Food Sources. Sci. Total Environ. 2020, 739, 139931. [Google Scholar] [CrossRef]
  27. Be, T.T.; Dung, L.C.; Brennan, D. Environmental Costs of Shrimp Culture in the Rice-growing Regions of the Mekong Delta. Aquac. Econ. Manag. 1999, 3, 31–42. [Google Scholar] [CrossRef]
  28. Dang, H.D. Sustainability of the Rice-Shrimp Farming System in Mekong Delta, Vietnam: A Climate Adaptive Model. J. Econ. Dev. 2020, 22, 21–45. [Google Scholar] [CrossRef]
  29. Anh, P.T.; Kroeze, C.; Bush, S.R.; Mol, A.P.J. Water Pollution by Pangasius Production in the Mekong Delta, Vietnam: Causes and Options for Control. Aquac. Res. 2010, 42, 108–128. [Google Scholar] [CrossRef]
  30. Thanh, L.T.; Le, H.B.; Dinh, Q.M.; Nguyen, H.X.; Dang, H.T.; Le, T.M.; Dang, N.T.H. Pollution by Wastewater from Aquaculture in Some Coastal Zone in the Mekong Delta, Vietnam. AACL Bioflux 2022, 15, 1520–1530. [Google Scholar]
  31. Minh, H.V.T.; Tri, V.P.D.; Ut, V.N.; Avtar, R.; Kumar, P.; Dang, T.T.T.; Van Hoa, A.; Van Ty, T.; Downes, N.K. A Model-Based Approach for Improving Surface Water Quality Management in Aquaculture Using MIKE 11: A Case of the Long Xuyen Quadangle, Mekong Delta, Vietnam. Water 2022, 14, 412. [Google Scholar] [CrossRef]
  32. Nakayama, T.; Tuyet Hoa, T.T.; Harada, K.; Warisaya, M.; Asayama, M.; Hinenoya, A.; Lee, J.W.; Phu, T.M.; Ueda, S.; Sumimura, Y.; et al. Water Metagenomic Analysis Reveals Low Bacterial Diversity and the Presence of Antimicrobial Residues and Resistance Genes in a River Containing Wastewater from Backyard Aquacultures in the Mekong Delta, Vietnam. Environ. Pollut. 2017, 222, 294–306. [Google Scholar] [CrossRef]
  33. Chapman, A.; Darby, S. Evaluating Sustainable Adaptation Strategies for Vulnerable Mega-Deltas Using System Dynamics Modelling: Rice Agriculture in the Mekong Delta’s An Giang Province, Vietnam. Sci. Total Environ. 2016, 559, 326–338. [Google Scholar] [CrossRef]
  34. Wehrheim, C.; Lübken, M.; Stolpe, H.; Wichern, M. Identifying Key Influences on Surface Water Quality in Freshwater Areas of the Vietnamese Mekong Delta from 2018 to 2020. Water 2023, 15, 1295. [Google Scholar] [CrossRef]
  35. Le, T.H.; Tran, V.T.; Le, Q.V.; Nguyen, T.P.T.; Schnitzer, H.; Braunegg, G. An Integrated Ecosystem Incorporating Renewable Energy Leading to Pollution Reduction for Sustainable Development of Craft Villages in Rural Area: A Case Study at Sedge Mats Village in Mekong Delta, Vietnam. Energy Sustain. Soc. 2016, 6, 21. [Google Scholar] [CrossRef]
  36. Wilbers, G.J.; Sebesvari, Z.; Renaud, F.G. Piped-Water Supplies in Rural Areas of the Mekong Delta, Vietnam: Water Quality and Household Perceptions. Water 2014, 6, 2175. [Google Scholar] [CrossRef]
  37. Nguyen, T.G.; Phan, K.A.; Huynh, T.H.N. Major Concerns of Surface Water Quality in South-West Coastal Regions of Vietnamese Mekong Delta. Sustain. Environ. Res. 2022, 32, 46. [Google Scholar] [CrossRef]
  38. Hong, T.T.K.; Giao, N.T. Analysis of Surface Water Quality in Upstream Province of Vietnamese Mekong Delta Using Multivariate Statistics. Water 2022, 14, 1975. [Google Scholar] [CrossRef]
  39. Vinutha, H.P.; Poornima, B.; Sagar, B.M. Detection of Outliers Using Interquartile Range Technique from Intrusion Dataset. In Information and Decision Sciences; Advances in Intelligent Systems and Computing; Springer: Singapore, 2018; Volume 701. [Google Scholar]
  40. De Souza, R.R.; Toebe, M.; Mello, A.C.; Bittencourt, K.C. Sample Size and Shapiro-Wilk Test: An Analysis for Soybean Grain Yield. Eur. J. Agron. 2023, 142, 126666. [Google Scholar] [CrossRef]
  41. Iticescu, C.; Georgescu, L.P.; Murariu, G.; Topa, C.; Timofti, M.; Pintilie, V.; Arseni, M. Lower Danube Water Quality Quantified through WQI and Multivariate Analysis. Water 2019, 11, 1305. [Google Scholar] [CrossRef]
  42. Islam Khan, M.S.; Islam, N.; Uddin, J.; Islam, S.; Nasir, M.K. Water Quality Prediction and Classification Based on Principal Component Regression and Gradient Boosting Classifier Approach. J. King Saud Univ.—Comput. Inf. Sci. 2022, 34, 4773–4781. [Google Scholar] [CrossRef]
  43. Arslan, O. Spatially Weighted Principal Component Analysis (PCA) Method for Water Quality Analysis. Water Resour. 2013, 40, 315–324. [Google Scholar] [CrossRef]
  44. Dinesh, M.; Prakash, S.; Jadagerimath, A.N. AI-Based Principal Component Analysis (PCA) Approach for the Determination of Key Water Quality Parameters. Int. J. Intell. Syst. Appl. Eng. 2023, 11, 209–218. [Google Scholar]
  45. Jo, C.D.; Kwon, H.G. Temporal and Spatial Evaluation of the Effect of River Environment Changes Caused by Climate Change on Water Quality. Environ. Technol. Innov. 2023, 30, 103066. [Google Scholar] [CrossRef]
  46. Yang, W.; Zhao, Y.; Wang, D.; Wu, H.; Lin, A.; He, L. Using Principal Components Analysis and Idw Interpolation to Determine Spatial and Temporal Changes of Surfacewater Quality of Xin’Anjiang River in Huangshan, China. Int. J. Environ. Res. Public Health 2020, 17, 2942. [Google Scholar] [CrossRef] [PubMed]
  47. Nath Roy, B.; Roy, H.; Rahman, K.S.; Mahmud, F.; Bhuiyan, M.M.K.; Hasan, M.; Bhuiyan, A.A.K.; Hasan, M.; Mahbub, M.S.; Jahedi, R.M.; et al. Principal Component Analysis Incorporated Water Quality Index Modeling for Dhaka-Based Rivers. City Environ. Interact. 2024, 23, 100150. [Google Scholar] [CrossRef]
  48. Nguyen, T.G.; Huynh, T.H.N. Assessment of Surface Water Quality and Monitoring in Southern Vietnam Using Multicriteria Statistical Approaches. Sustain. Environ. Res. 2022, 32, 20. [Google Scholar] [CrossRef]
  49. Jiang, J.J.; Lee, C.L.; Der Fang, M.; Boyd, K.G.; Gibb, S.W. Source Apportionment and Risk Assessment of Emerging Contaminants: An Approach of Pharmaco-Signature in Water Systems. PLoS ONE 2015, 10, e0129410. [Google Scholar] [CrossRef]
  50. El-Rawy, M.; Fathi, H.; Abdalla, F.; Alshehri, F.; Eldeeb, H. An Integrated Principal Component and Hierarchical Cluster Analysis Approach for Groundwater Quality Assessment in Jazan, Saudi Arabia. Water 2023, 15, 1466. [Google Scholar] [CrossRef]
  51. Ibrahim, A.; Ismail, A.; Juahir, H.; Iliyasu, A.B.; Wailare, B.T.; Mukhtar, M.; Aminu, H. Water Quality Modelling Using Principal Component Analysis and Artificial Neural Network. Mar. Pollut. Bull. 2023, 187, 114493. [Google Scholar] [CrossRef]
  52. Giao, N.T.; Nhien, H.T.H. Evaluating Water Quality Variation in the Vietnamese Mekong Delta Area Using Cluster and Discriminant Analysis. Appl. Environ. Res. 2021, 43, 14–27. [Google Scholar] [CrossRef]
  53. Jin, Y.; Zhu, W.; Li, J.; Cui, D.; Zhang, Z.; Sun, G.; Zhu, Y.; Yang, H.; Zhang, X. Arsenic Pollution Concerning Surface Water and Sediment of Jie River: A Pilot Area Where Gold Smelting Enterprises Are Concentrated. Environ. Res. 2024, 249, 118384. [Google Scholar] [CrossRef] [PubMed]
  54. Parvin, F.; Haque, M.M.; Tareq, S.M. Recent Status of Water Quality in Bangladesh: A Systematic Review, Meta-Analysis and Health Risk Assessment. Environ. Chall. 2022, 6, 100416. [Google Scholar] [CrossRef]
  55. Zhao, G.; Ye, S.; Yuan, H.; Ding, X.; Wang, J.; Laws, E.A. Surface Sediment Properties and Heavy Metal Contamination Assessment in River Sediments of the Pearl River Delta, China. Mar. Pollut. Bull. 2018, 136, 300–308. [Google Scholar] [CrossRef]
  56. Zhao, Y.; Song, Y.; Cui, J.; Gan, S.; Yang, X.; Wu, R.; Guo, P. Assessment of Water Quality Evolution in the Pearl River Estuary (South Guangzhou) from 2008 to 2017. Water 2020, 12, 59. [Google Scholar] [CrossRef]
Figure 1. Study area and sampling sites.
Sustainability 17 05375 g001
Figure 2. Scree plot of eigenvalues and cumulative variability based on PCA analysis.
Sustainability 17 05375 g002
Figure 3. Dendrogram results of clustering surface water quality in the Mekong Delta based on AHC analysis.
Sustainability 17 05375 g003
Figure 4. Concentration of (a) Cr and (b) As in surface water in the Mekong Delta.
Sustainability 17 05375 g004
Figure 5. Water quality index (WQI) in the study area.
Sustainability 17 05375 g005
Table 1. Summary of water quality in the Mekong Delta.
ParameterSamplesMinimumMaximumMeanSDWHO Limit
pH31173.0509.4906.9980.5886.5–8.5
DO31172.13515.2005.7801.130≥5
BOD531173.500172.87010.6278.319n/a
COD31176.493472.98425.01418.805n/a
TOC31175.746159.67416.4386.591n/a
N-NH431170.0462.7860.4890.3910.5
N-NO331170.1001.9750.3900.25550
N-NO231170.1001.0000.3770.2413
P-PO43117n.d45.8001.5854.572n/a
Coliform3117n.d45,100.0004408.2082800.8520
E. coli3117n.d95.0003.83314.2940
TSS31171.00912.56035.34039.831n/a
Salinity31170.10039.4003.9288.127n/a
CL31170.1542,185.5001165.4323841.767250
Aldrin31170.0090.9910.0290.0270.00003
BHC31170.0030.9840.0220.0270.002
Dieldrin31170.0020.9830.0190.0260.00003
DDTs3117n.d1.2270.0210.0330.00003
Heptachlor31170.0111.0310.0360.0270.00003
Heptachlorepoxide.31170.0050.5950.0180.0160.0002
As31170.0060.0460.0170.0030.01
Cd3117n.d0.8630.0100.0220.003
Pb3117n.d0.0200.0040.0030.01
Cr63117n.d1.9600.0230.0480.05
Cu3117n.d0.0450.0040.0032
Zn3117n.d0.0760.0030.0113
Hg3117n.d0.1900.0040.0180.001
WQI31172.37685.31447.48614.260n/a
Note: n.d. = not detected; n/a = not available. All parameters are expressed in mg/L, except for pH (unitless), and Coliform and E. coli (reported in MPN/100 mL); SD = standard deviation.
Table 2. Eigenvalues, variance contribution, and cumulative variability of five key components.
FactorPCA1PCA2PCA3PCA4PCA5
Eigenvalue6.4514.2952.3972.1482.001
Variability (%)23.03915.3408.5627.6717.148
Cumulative %23.03938.37946.94254.61261.760
Table 3. Correlations between variables and factors.
VariableComponents
PCA1PCA2PCA3PCA4PCA5
pH0.010.080.180.51−0.16
DO0.270.47−0.020.62−0.10
BOD50.610.650.08−0.22−0.03
COD0.630.660.09−0.21−0.04
TOC0.630.710.08−0.03−0.06
N-NH4+0.020.06−0.01−0.040.09
N-NO30.11−0.020.26−0.180.83
N-NO20.08−0.07−0.040.10−0.05
P-PO43−0.080.16−0.100.250.0001
Coliform0.090.05−0.190.580.50
E. coli0.02−0.240.840.15−0.10
TSS−0.13−0.240.33−0.180.02
Salinity0.120.040.550.21−0.08
Cl0.06−0.010.460.19−0.09
Aldrin0.92−0.29−0.16−0.02−0.01
BHC0.91−0.370.02−0.02−0.03
Dieldrin0.72−0.66−0.010.10−0.03
DDTs0.72−0.66−0.020.11−0.07
Heptachlor0.630.630.10−0.170.04
Heptachlorepoxide0.92−0.29−0.16−0.02−0.01
As0.270.47−0.020.62−0.10
Cd0.610.590.08−0.26−0.04
Pb0.12−0.010.26−0.180.83
Cr0.72−0.62−0.220.03−0.06
Cu0.090.05−0.190.590.50
Zn0.02−0.240.840.15−0.10
Hg0.13−0.090.020.05−0.06
WQI−0.470.08−0.250.16−0.12
Disclaimer/Publisher’s Note: The statements, opinions and data contained in all publications are solely those of the individual author(s) and contributor(s) and not of MDPI and/or the editor(s). MDPI and/or the editor(s) disclaim responsibility for any injury to people or property resulting from any ideas, methods, instructions or products referred to in the content.

