Article

The Dynamic Bidirectional Causality Between Carbon Pricing and Green Technology Innovation in China: A Sub-Sample Time-Varying Approach

1
School of Management, University of Sanya, Sanya 572000, China
2
School of Economics, Qingdao University, Qingdao 266071, China
3
School of Management, Qujing Normal University, Qujing 655000, China
*
Author to whom correspondence should be addressed.
Sustainability 2025, 17(12), 5371; https://doi.org/10.3390/su17125371
Submission received: 1 April 2025 / Revised: 2 June 2025 / Accepted: 6 June 2025 / Published: 11 June 2025

Abstract

:
This study examined the dynamic relationship between China’s carbon pricing (CP) and green technology innovation (GTI) using monthly data from August 2013 to February 2025 through sub-sample rolling-window Granger causality tests. The results revealed a time-varying bidirectional relationship where CP significantly promotes GTI during periods when innovation offset effects dominate (such as from July to October 2021 and October 2023 to March 2024), but inhibits GTI when compliance cost effects prevail (as observed from February to June 2022). Conversely, GTI alternately suppressed CP from June to November 2017 and enhanced it from February to July 2024. These patterns demonstrate that the interaction between CP and GTI is critically shaped by three key factors: policy synergy between carbon markets and complementary environmental regulations, international competitive pressures from carbon border mechanisms, and financial market capacity to support green investments. Based on these findings, we propose a comprehensive policy framework that includes expanding emissions trading to heavy industries, implementing dynamic CP stabilization mechanisms, introducing innovation-linked quota incentives with 1.1 to 1.5 multipliers, and developing integrated green financial instruments. This framework can effectively align CP with GTI to accelerate China’s low-carbon transition while maintaining industrial competitiveness.

1. Introduction

This study employed the sub-sample rolling-window causality test to explore the time-varying causal relationship between carbon pricing (CP) and green technological innovation (GTI) in China. The escalating levels of greenhouse gases in the atmosphere are causing extreme natural disasters and significant socioeconomic losses [1]. The Interagency Working Group’s most recent estimate, based on 2020 emissions, places the social cost of carbon dioxide at USD 50 per ton. Unmitigated climate change is projected to reshape the global economy, reducing average global incomes by approximately 23% by 2100 and exacerbating global income inequality [2]. Industrial enterprises are major contributors to carbon emissions, a key driver of climate change [3]. CP and GTI are widely recognized as effective tools for reducing emissions [4,5,6]. GTI contributes to emission reductions through multiple pathways, including enhancing energy efficiency [7], facilitating low-carbon production transformations, and promoting renewable energy adoption [8]. CP is a market-oriented policy tool designed to achieve the decarbonization of corporate operations through GTI [9]. The adoption of carbon pricing has expanded globally as a strategy to address climate change. According to the International Carbon Action Partnership, as of early 2024, 36 carbon markets were operational worldwide, accounting for 18% of global greenhouse gas emissions.
To achieve carbon reduction targets, CP and GTI will play increasingly critical roles. Understanding the dynamic interplay between these two factors is essential for effectively leveraging market-based environmental policies. Such an understanding will enable industrial carbon reduction and sustainable development while balancing economic growth and environmental protection. However, the interaction between CP and GTI remains a matter of debate. Scholars posit that the influence of CP on GTI is primarily driven by two distinct mechanisms: the innovation offset effect and the compliance cost effect. The innovation offset effect suggests that higher CP incentivizes firms to GTI, offsetting regulatory costs through productivity gains and market competitiveness [10,11,12,13,14]. In contrast, the compliance cost effect highlights that higher CP increases operational costs, potentially crowding out R&D investments and stifling GTI in the short term [15,16,17,18]. Therefore, the impact of CP on GTI is dual, encompassing both positive incentives and negative cost pressures [19]. Delving into the dynamic interplay between these two variables and the resultant outcomes is a complex yet profoundly significant topic. Such research can inform policymakers in designing effective strategies and market mechanisms, encouraging firms to transform carbon costs into innovation catalysts, and thereby fostering a synergy between economic and environmental objectives.
Since the launch of economic reforms in 1978, China’s rapid economic growth, industrialization, and urbanization have led to a continuous rise in energy consumption and greenhouse gas emissions. At present, China is the world’s largest emitter, accounting for nearly one-third of global emissions, and plays a pivotal role in global climate mitigation efforts. In 2020, China committed to achieving carbon peaking by 2030 and carbon neutrality by 2060, known as the “dual carbon” goals. This is particularly challenging given that the United States and the European Union have already passed their carbon peak stages. The manufacturing and production sector accounts for the most significant share of China’s carbon emissions [20], and the adverse effects of these emissions have spurred a broad consensus on the need for reduction. In response, China introduced the concept of a national carbon emissions trading market in its 12th Five-Year Plan, recognizing CP as a significant driver of emission reductions. Since 2013, China has launched pilot emissions trading schemes in nine regions. In 2021, the national carbon market was officially established, with the potential to surpass the EU Emissions Trading System (EU-ETS) as the world’s largest if it expands to cover more sectors [21]. However, a critical challenge lies in determining the optimal CP. Most experts agree that a reasonable increase in CP can enhance the carbon reduction potential [22]. Additionally, high-emission companies are likely to invest in decarbonization only when the CP exceeds a critical threshold [23]. Studies have suggested that a CP of CNY 50–60 per ton can significantly stimulate GTI [24]. If China’s CP aligns with the EU-ETS level, it could boost the total factor productivity of Chinese enterprises by approximately 22.73% [25]. Undoubtedly, the EU’s experience in low-carbon transitions offers valuable insights for other regions. However, CP varies widely across countries and regions, ranging from as low as USD 1 per ton to USD 18 per ton due to variations in decarbonization goals and mitigation expenses. In China, CP has remained low and highly volatile since the launch of the pilot schemes [26].
Global climate governance is transitioning from voluntary soft constraints toward mandatory hard regulations. The Paris Agreement established a system combining nationally determined contributions with periodic global stocktakes, signifying an era of shared yet differentiated responsibilities in climate action. The UNEP Emissions Gap Report 2023 indicated that in the absence of strengthened global mitigation measures, projected temperature increases this century are estimated to reach 2.6–3.1 °C, significantly exceeding the scientifically established 1.5 °C planetary boundary and resulting in potentially irreversible catastrophic climate impacts. This critical situation has catalyzed three major developments: First, carbon pricing systems are expanding globally, with World Bank data indicating 75 carbon pricing instruments implemented worldwide as of 2024. Second, environmental standards are becoming new determinants of international trade rules, particularly as the EU Carbon Border Adjustment Mechanism threatens to impose additional costs on approximately USD 35 billion worth of Chinese exports. Third, developing countries face an enormous climate financing shortfall, requiring USD 2.4 trillion annually for climate action while receiving less than 20% of the needed funds. As the operator of the world’s largest carbon market and a leading provider of green technologies, China’s experience in aligning carbon pricing with technological innovation carries significant implications. Studying this relationship will not only support China’s climate commitments, but can also offer valuable lessons for emerging economies pursuing sustainable development alongside a reduction in emissions.
This study makes three significant contributions. First, most existing research on CP drivers has focused on the EU-ETS, and prior findings remain inconclusive. By developing an innovative analytical framework, this study bridges critical gaps through novel empirical evidence verifying a robust CP–GTI nexus in China. These findings advance theoretical and practical understanding of their dynamic interplay. Second, moving beyond conventional linear causal frameworks, this research applies rolling-window causality tests to segmented data, uncovering the dynamic and non-linear relationship between CP and GTI. This methodology enhances our understanding of CP’s evolving influence on GTI across distinct sub-sample periods. Third, unlike previous studies that focus on unidirectional effects, this research examines the bidirectional interaction between CP and GTI. By thoroughly analyzing the mutual influence process of these two variables, this study contributes to understanding the virtuous cycle mechanism between them.
The structure of this study is systematically arranged as follows: Section 2 provides a comprehensive review of the relevant literature. Section 3 describes the theoretical framework. Section 4 elaborates on the methodological approach employed. Section 5 describes the data collection and sources utilized. Section 6 discusses the empirical findings and their implications. Concluding remarks and insights are presented in Section 7.

2. Literature Review

Recent research has increasingly focused on investigating the link between CP and GTI [27]. While the effectiveness of CP in stimulating GTI remains debated [28], most scholars agree that CP generally promotes GTI. Bergh and Savin (2021) highlighted that carbon markets exert a modest yet positive impact on GTI [29]. Raza (2020) emphasized that well-designed environmental regulations motivate firms to pursue GTI [30]. Lim and Prakash (2023) observed that CP correlates with increased patent applications for climate mitigation technologies [31]. Similarly, Jung and Song (2023) found that a higher CP drives greater investment in GTI [32]. Gillingham et al. (2017) argued that CP drives businesses to adopt GTI, reducing their financial burden under emission regulations [33]. Cantone et al. (2023) further argued that the growing demand for such technologies rewards innovators, fostering greater research and development [14]. Gugler et al. (2024) noted that environmental taxes, CP, and R&D subsidies positively influence GTI [13]. Calel and Dechezleprêtre (2016) provided empirical evidence showing regulated firms under the EU-ETS generate up to 10% more low-carbon patents than their unregulated counterparts [34]. Baranzini et al. (2017) summarized the multifaceted benefits of CP, including cost efficiency and technological innovation [35]. Brauneis et al. (2013) suggested that a CP floor accelerates investments in GTI [36]. Mu and Zhao (2023) added that cap-and-trade systems encourage production improvement technologies for low-emission firms and emissions reduction technologies for high-emission firms [12].
However, some scholars hold opposing views. Teixidó et al. (2019) found that the Emissions Trading System, particularly during its initial phases, hampers low-carbon investments when focusing on a limited number of firms and sectors [16]. Similarly, Goulden et al. (2019) [15] argued that strict environmental policies place financial pressure on enterprises. These additional costs reduce investments in R&D and talent acquisition, ultimately stifling GTI [15]. Hoffmann (2007) further supported this view, noting that carbon trading may discourage GTI investments in the short term [37]. Lilliestam et al. (2022) reinforced this skepticism, finding no evidence that carbon pricing systems trigger zero-carbon investments [38].
China’s carbon pricing policies have garnered significant attention in recent years [39]. Research on China’s pilot carbon market and GTI generally highlights its positive impact on GTI. Weng et al. (2022) demonstrated that the pilot carbon market significantly promotes GTI, with notable interregional variations [40]. Zhou and Wang (2022) emphasized the carbon market’s effect on GTI [41]. Liu et al. (2022) [42] and Cong et al. (2023) [43] further confirmed that the pilot carbon market drives GTI at both the enterprise and city levels [42], with Cong et al. (2023) identifying a compensation effect on GTI [43]. Xie et al. (2022) showed that the carbon trading policy improves technology structures by promoting low-carbon technologies and restricting high-carbon ones [44]. Tan and Lin (2022) revealed that carbon trading significantly reduces carbon emissions, improves energy efficiency in large-scale industries, and increases market liquidity [45]. Zhou et al. (2019) found that carbon trading encourages enterprises to develop green technologies to minimize non-expected production outputs [46]. Kong et al. (2019) argued that reducing carbon emission quotas increases their price, incentivizing enterprises to cut emissions and reduce costs [47]. Chen et al. (2017) emphasized that increased CP levels drive the implementation of energy-efficient technologies within coal-fired power generation [48]. Similarly, Liu et al. (2016) calculated that CP speeds up the adoption of low-carbon innovations in China’s cement sector, where steeper prices correlate with faster diffusion [49]. Liu et al. (2021) and Guo and Li (2024) found that carbon trading policies enhance regional GTI efficiency and enterprise GTI, particularly in patents for inventions and utility models [50,51]. Zhu et al. (2019) provided evidence that emissions trading induces low-carbon innovation [52]. Li et al. (2024) stressed the importance of strict yet flexible policies in incentivizing GTI [53]. Guo and Feng (2021) showed that carbon trading increases long-term R&D investment, fostering GTI [54]. Cao and Su (2023) concluded that CP boosts GTI in pilot areas [55].
However, some studies have suggested that while carbon pricing policies aim to promote green innovation, certain design flaws and implementation challenges may lead to unintended inhibitory effects on GTI. Deng and Zhang (2019) highlighted that irrational pricing signals in certain carbon pricing mechanisms hinder businesses from making informed decisions regarding low-carbon technology investments [56]. Chen et al. (2021) [18] suggested China’s HP has yet to demonstrate significant innovation-inducing effects, failing to support even the weaker variant of the Porter hypothesis. Wang et al. (2018) [57] highlighted that strict environmental policies increase emissions reduction pressures on enterprises. These additional expenses raise business costs, reducing investments in R&D and talent acquisition, thereby hindering green technology innovation [58]. Chen et al. (2021) further noted that emissions trading systems inhibit the development of low-carbon technologies in the short term [18]. Zhang et al. (2024) emphasized that a poorly designed CP impedes the progress of GTI [17]. Zhang et al. (2022) demonstrated that rising CP may displace corporate R&D expenditures, thereby suppressing GTI [58]. This conclusion is supported by Zhang et al. (2021) [59], who used a provincial panel and a difference-in-difference model to demonstrate these effects [60]. Additionally, some findings collectively underscore the complexity and variability of CP’s influence on GTI [60]. Chang and Zhao (2024) found that CP exerts a relatively insignificant impact on the quality of GTI [60]. Lin et al. (2017) further elaborated that CP exhibits both redirection and crowding out effects on GTI [61].
Despite extensive research on the relationship between CP and GTI, significant knowledge gaps persist. First, while existing studies have examined the aggregate effects of CP on GTI, they have largely neglected to analyze the dynamic differential impacts and underlying mechanisms under varying spatiotemporal contexts, CP levels, and market volatility conditions. Second, the ongoing debate between the inhibitory versus incentive effects highlights the necessity for contextualized analysis that accounts for the unique market maturity and policy implementation characteristics of emerging economies like China. Third, there remains insufficient exploration at the national macro-level regarding how policy design and implementation can foster synergistic development and positive feedback between CP and GTI.

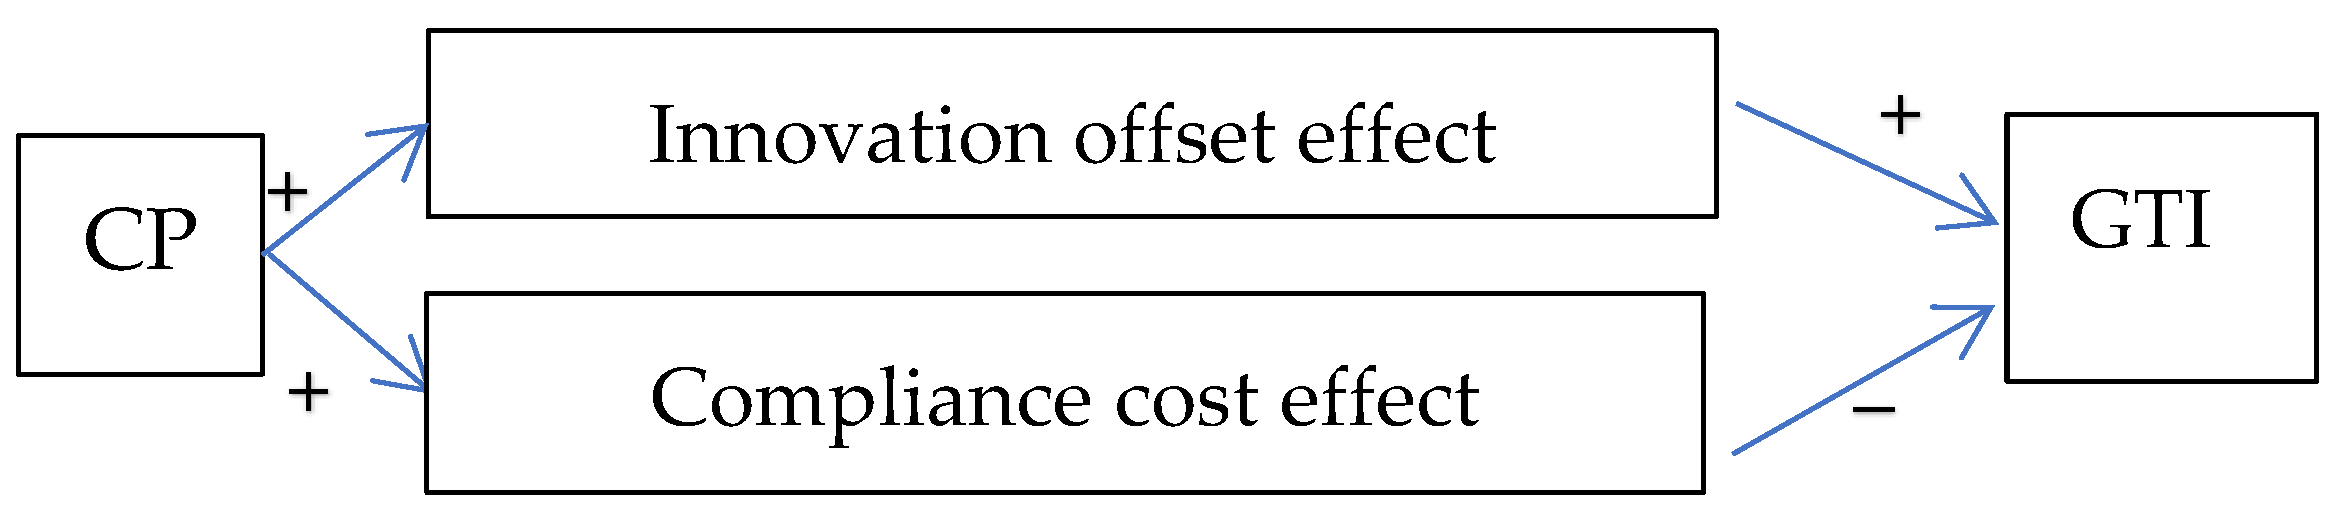
3. Theoretical Framework

CP exerts a dual-channel influence on GTI, as illustrated in Figure 1:
(1)
Innovation offset effect: Rising CP incentivizes firms to invest in GTI to alleviate regulatory pressure. Such investments may lead to technological advancements, efficiency improvements, or new product development, which can offset compliance costs and generate additional economic benefits, thereby positively stimulating GTI [10,11,12,13,14].
(2)
Compliance cost effect: Higher CP increases firms’ carbon allowance expenditures, raising compliance costs. This reduces profitability and may crowd out the resources available for GTI investments, thereby negatively suppressing GTI [15,16,17,18].
The innovation offset effect channel of CP to GTI can be specifically explained by the risk–return model. The risk–return model, originally proposed by Markowitz [62], serves as a foundational framework in finance and strategic management for analyzing decision-making under uncertainty. This model highlights how rational actors evaluate trade-offs between risk and expected returns when selecting among alternative investment strategies [63]. Firms facing environmental regulations must decide between two strategic options: (1) purchasing carbon allowances to comply with regulations while bearing ongoing compliance costs; (2) investing in GTI to reduce emissions, thereby eliminating the need for allowance purchases and potentially generating revenue through selling surplus allowances. This decision-making process requires careful consideration of two key factors: expected returns and risk. Suppose the expected return of purchasing carbon allowances is E ( r 1 ) , the expected return investing in GTI is E ( r 2 ) . The variance of purchasing carbon allowances and investing in GTI is σ 1 2 and σ 2 2 , respectively. The covariance of the two options is C o v ( r 1 , r 2 ) = ρ σ 1 σ 2 , where ρ is the correlation coefficient. Suppose the share of purchasing carbon allowances and investing in GTI is w 1 and w 2 , respectively, and w 1 + w 2 = 1 . Then, the decision-maker must maximize the portfolio’s expected return while constraining risk exposure below a specified threshold. The expected return of the two choices is E ( r p ) = w 1 E ( r 1 ) + w 2 E ( r 2 ) , and the risk of the two choices is V a r ( r p ) = w 1 2 σ 1 2 + w 2 2 σ 2 2 + 2 w 1 w 2 C o v ( r 1 , r 2 ) . The maximization problem of the decision-maker is expressed as
M a x E ( r p ) = w 1 E ( r 1 ) + ( 1 w 1 ) E ( r 2 )
such that w 1 2 σ 1 2 + ( 1 w 1 ) 2 σ 2 2 + 2 w 1 ( 1 w 1 ) ρ σ 1 σ 2 = σ 2 , where σ 2 is given.
The first-order optimality conditions from the Lagrangian formulation are given by
L w 1 = E ( r 1 ) E ( r 2 ) + 2 λ [ w 1 σ 1 2 ( 1 w 1 ) σ 2 2 + ( 1 2 w 1 ) ρ σ 1 σ 2 ] = 0
Equation (1) indicates the relationship between w 1 and σ 1 . Then, we have
w 1 σ 1 = ρ σ 2 + 2 w 1 ( σ 1 ρ σ 2 ) σ 1 2 + σ 2 2 2 ρ σ 1 σ 2
As ρ < 1 , σ 1 > σ 2 , then w 1 σ 1 < 0 . However, σ 1 < σ 2 ; then, w 1 σ 1 > 0 .
When w 1 σ 1 > 0 , the expected return of GTI exceeds the carbon compliance costs. Decision-makers then increase the GTI investment. This demonstrates CP’s innovation offset effect on GTI.

4. Methodology

4.1. Bootstrap Full-Sample Causality Test

The validity of Granger causality tests fundamentally requires stable time series data to produce reliable and meaningful results. In the existing literature [64,65], it has been extensively documented that conventional vector autoregressive (VAR) models often generate potentially misleading conclusions when analyzing non-stationary data. This occurs because such models exhibit a particular vulnerability to the structural discontinuities and stochastic trends that characterize unstable time series. To mitigate these shortcomings, Shukur and Mantalos (2000) introduced a residual-based bootstrap (RB) methodology, which recalibrates the statistical power of Granger causality testing by leveraging resampling techniques [66]. Their simulations demonstrated that this approach substantially refines the precision of causal inference, particularly in finite samples where asymptotic approximations may fail. Further extensions of this work (Shukur & Mantalos, 2004) refined the likelihood ratio (LR) test framework, demonstrating a superior performance in small-sample settings through improved size control and higher-order simulation accuracy [67]. In this study, to better understand the causal relationship between CP and GTI, we employed a modified likelihood ratio statistic for testing. The bivariate VAR (p) process is represented by Equation (2).
Y t = a 0 + a 1 Y t 1 + + a p Y t p + ε t , t = 1 , 2 , 3 T
The optimal lag length p is determined using the Schwarz Information Criterion (SIC), which systematically balances model complexity against estimation efficiency to select the most statistically appropriate specification. Furthermore, the variable Y can be decomposed into its constituent factors and reformulated as Y t = ( C P t , G T I t ) to enable alternative analytical interpretations. A critical consideration in modeling the relationship between CP and GTI involves accounting for financial constraints (FCs), which the existing research has identified as a pivotal moderating force in this transmission channel [68,69,70]. To ensure robust empirical results, we explicitly integrated FC as a control variable within the VAR framework. Accordingly, the baseline econometric specification was refined, and Equation (2) was expanded to include FC.
C P t G T I t = a 10 a 20 + a 11 ( L ) a 12 ( L ) a 13 ( L ) a 21 ( l ) a 22 ( L ) a 23 ( L ) C P t G T I t F C t + ε 1 t ε 2 t
The stochastic term ε t = ( ε 1 t , ε 2 t ) represents a white-noise process, ensuring that the model accounts for random, uncorrelated disturbances. The variables a i j ( L ) = k = 1 p a i j , k L k , i , j = 1 , 2 , and L are defined as lag operators, such that L k Y t = Y t k captures dynamic dependencies in the time series structure.
Given this specification, we analyzed Equation (3), focusing on a 12 , k = 0 , where the lag order k spans from 1 to p (i.e., k = 1, 2, …, p). If the statistical evidence leads to the rejection of the null hypothesis that CP does not Granger-cause GTI, this implies a statistically significant directional influence of CP on GTI. Conversely, using the identical specification from Equation (3), we examined the converse proposition that GTI shows no Granger-causal influence on CP.

4.2. Parameter Stability Test

Conventional bootstrap-based Granger causality tests rely on vector autoregressive (VAR) models that assume time-invariant structural parameters, a restrictive assumption rarely satisfied in empirical economic and financial datasets. In reality, policy reforms, technological innovations, or macroeconomic disturbances frequently introduce structural instability, causing conventional tests to produce misleading inferences. To overcome this limitation, this study implemented S u p - F , A v e - F , and E x p - F tests [71,72] to identify whether and when structural breaks distort the causality relationship. Complementing this approach, the Nyblom [73] and Hansen [74] stability tests examined gradual parameter evolution by assessing whether the coefficients exhibited persistent random-walk behavior suggestive of persistent instability or converged toward long-term equilibrium values. By systematically accounting for both abrupt structural breaks and gradual parameter drifts, this approach enhanced the robustness of causality inferences in environments where traditional assumptions fail. If parameter instability was detected, this suggested that the causal relationship between CP and GTI exhibited time-varying dynamics. In such cases, a sub-sample test was conducted to investigate the causal connection between CP and GTI, aligning with the preceding analysis. This approach ensured a more robust examination of the causal relationship, accounting for potential structural shifts in the data.

4.3. Bootstrap Sub-Sample Rolling-Window Causality Test

To account for potential parameter instability in our analysis, we implemented an advanced time-varying causality framework based on the rolling-window methodology [75]. This approach involved systematically analyzing the dataset through multiple consecutive observation periods, each spanning a predetermined and consistent time interval, denoted as window length (f). With a sequence length of E, the original sample was segmented into E f sub-samples. Subsequently, an improved LR test utilizing the RB method was conducted on each of these sub-samples. By examining the LR statistics and associated p-values of the E f sub-samples, we could determine the causal relationship between CP and GTI. N b 1 k = 1 p a 12 , k and N b 1 k = 1 p a 21 , k indicate the impact of CP on GTI and the effect of GTI on CP, respectively. N b represents the frequency of bootstrap repetitions. a 12 , k and a 21 , k are parameters derived from Equation (2). This analysis utilized a 90% confidence range for both variables, with parameter estimates bounded by their 5th (lower limit) and 95th (upper limit) percentiles, reflecting the empirical distributions of a 12 , k and a 21 , k , respectively [76].

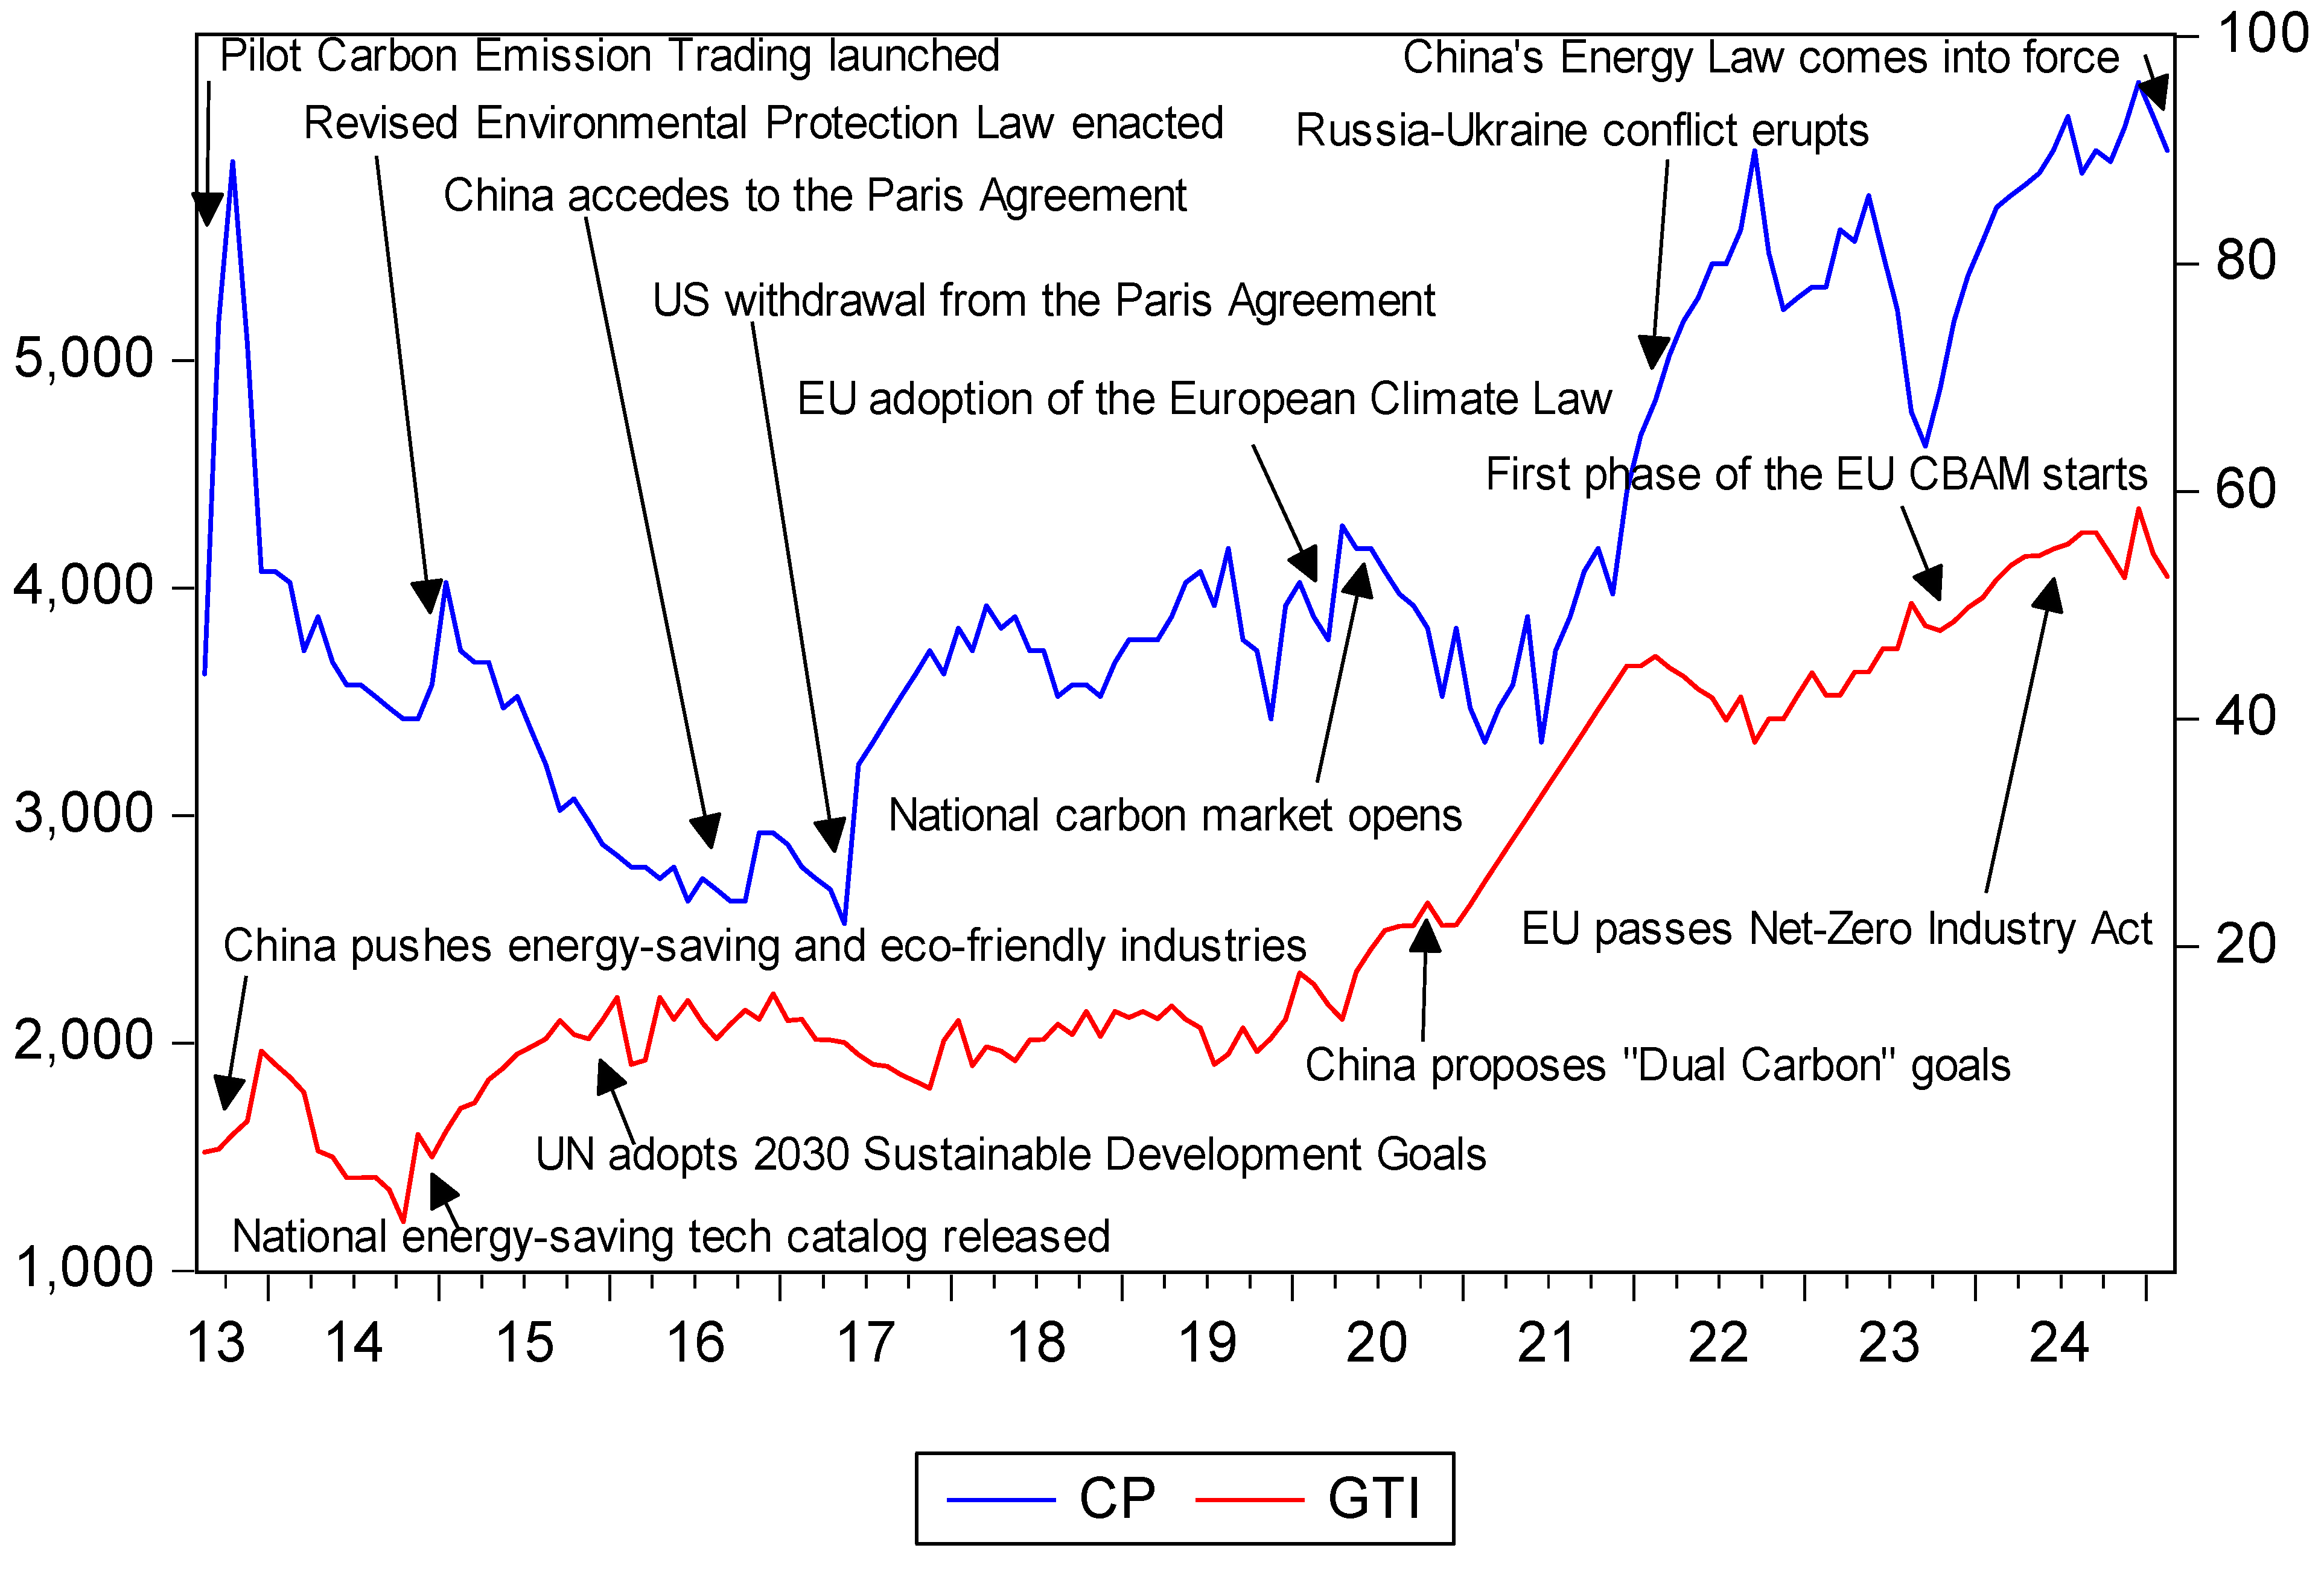
5. Data Source and Descriptive Analysis

This study utilized monthly data spanning from August 2013 to February 2025 to examine the causal relationship between CP and GTI. The first variable was CP. The CP data were collected from nine pilot carbon trading markets in China, including Beijing, Shanghai, Shenzhen, Guangdong, Tianjin, Hubei, Chongqing, Sichuan, and Fujian. These pilot regions covered over 20 industries, such as the power, steel, and chemical sectors, involving approximately 3000 key emission enterprises. The daily average CP was obtained from nine regional carbon markets in China. These data were sourced from the China Stock Market and Accounting Research Database (CSMAR), a leading provider of financial and economic data in China (website: https://data.csmar.com/; accessed on 1 March 2025). The daily CP figures were aggregated into monthly averages to construct a representative measure of China’s CP level. The study period extended from 5 August 2013 to 28 February 2025. The starting date was selected because it marks the commencement of China’s carbon market trading, with the first carbon quota transaction taking place on 5 August 2013.
The second key variable, GTI, was proxied using patent grant data. The study collected comprehensive patent records from the Chinese Patent Database, maintained by the State Intellectual Property Office (SIPO) (website: https://www.cnipa.gov.cn; accessed on 5 March 2025). To identify patents relevant to green and low-carbon technologies, this study applied the International Patent Classification (IPC) codes specified in the “Green and Low-Carbon Technology Patent Classification System.” This classification framework was formally issued by SIPO in 2022 to standardize the identification of environmentally friendly technologies.
SIPO’s “Green and Low-Carbon Technology Patent Classification System” (2022) and the “Green Technology Patent Classification System” (2023) focus on the application of green and low-carbon technology data under China’s green patent classification framework. Compared to the international WIPO classification, SIPO’s system better reflects the current status and trends of green technology development in China, emphasizing technological innovations in the clean and efficient utilization of traditional fossil energy, particularly coal, in line with China’s energy resource endowment (rich in coal, poor in oil, and scarce in gas). The distinction between the two classification systems lies in their scope: the “Green and Low-Carbon Technology Patent Classification System” specifically targets green and low-carbon technologies, including those related to the clean utilization of traditional energy, energy efficiency, renewable energy, and carbon capture, utilization, and storage (CCUS), which achieve carbon reduction, zero-carbon, and negative-carbon effects. It excludes green technologies that contribute to carbon reduction synergies, such as pollution reduction and resource recycling. In contrast, the “Green Technology Patent Classification System” encompasses all green technologies. Given the focus of this study on CP, GTI, and carbon emissions reduction, the “Green and Low-Carbon Technology Patent Classification System” was selected as the reference framework, aligning more closely with the research objectives.
Furthermore, GTI is characterized by long development cycles, uncertain project returns, and substantial financial investment requirements, which often lead to FC for enterprises [69,70]. Under such constraints, even if CP stimulates corporate demand for low-carbon investments, financing challenges may compel firms to maintain high-carbon production methods, thereby undermining the effectiveness of carbon pricing policies [68,77]. To account for this, FCs were included as a control variable in this study. FCs were measured using the RMB loan, with data sourced from the official website of the People’s Bank of China. The specific data are presented in Table 1.
Figure 2 and Figure 3 illustrate the trends in CP, GTI, and FCs. Over the sample period, CP fluctuated at relatively low levels before 2020, experienced a rapid increase from 2020 to 2022, and then stabilized at higher levels thereafter. In July 2021, China launched its national carbon emission trading market. By the end of 2024, the cumulative trading volume of carbon allowances reached 630 million tons, with a total turnover of CNY 43.033 billion. In 2024 alone, the carbon allowance trading volume amounted to 189 million tons, with a turnover of CNY 18.114 billion. Throughout the observation period, China’s GTI exhibited a general upward trend, with slight declines observed in specific years, such as 2014, 2017, and 2022. From 2013 to 2024, China’s GTI grew at an average annual rate of over 12%, significantly surpassing the global average growth rate of 2.5%. Currently, China’s GTI accounts for more than 30% of the global total. Additionally, RMB loans maintained a year-on-year growth rate of around 10% during the observation period, showing sustained growth.
Table 1 presents the descriptive statistics for the key variables under examination. The mean values for CP, GTI, and FCs were 53.755, 2582.712, and 1,530,099.000, respectively. Notably, these variables exhibited considerable variability, as evidenced by the substantial differences between their minimum and maximum values, suggesting high volatility in the dataset. Further analysis of the distributional properties revealed that CP, GTI, and FCs displayed positive skewness, indicating a rightward asymmetry in their distributions. Moreover, the kurtosis values for these variables fell below 3, confirming that their distributions were platykurtic. The departure from normality was further reinforced by the Jarque–Bera test results, which were statistically significant at the 1% level for all three variables. Given these non-normal distributional characteristics, applying conventional Granger causality tests may yield unreliable inferences, necessitating alternative methodologies to ensure robust causal analysis.

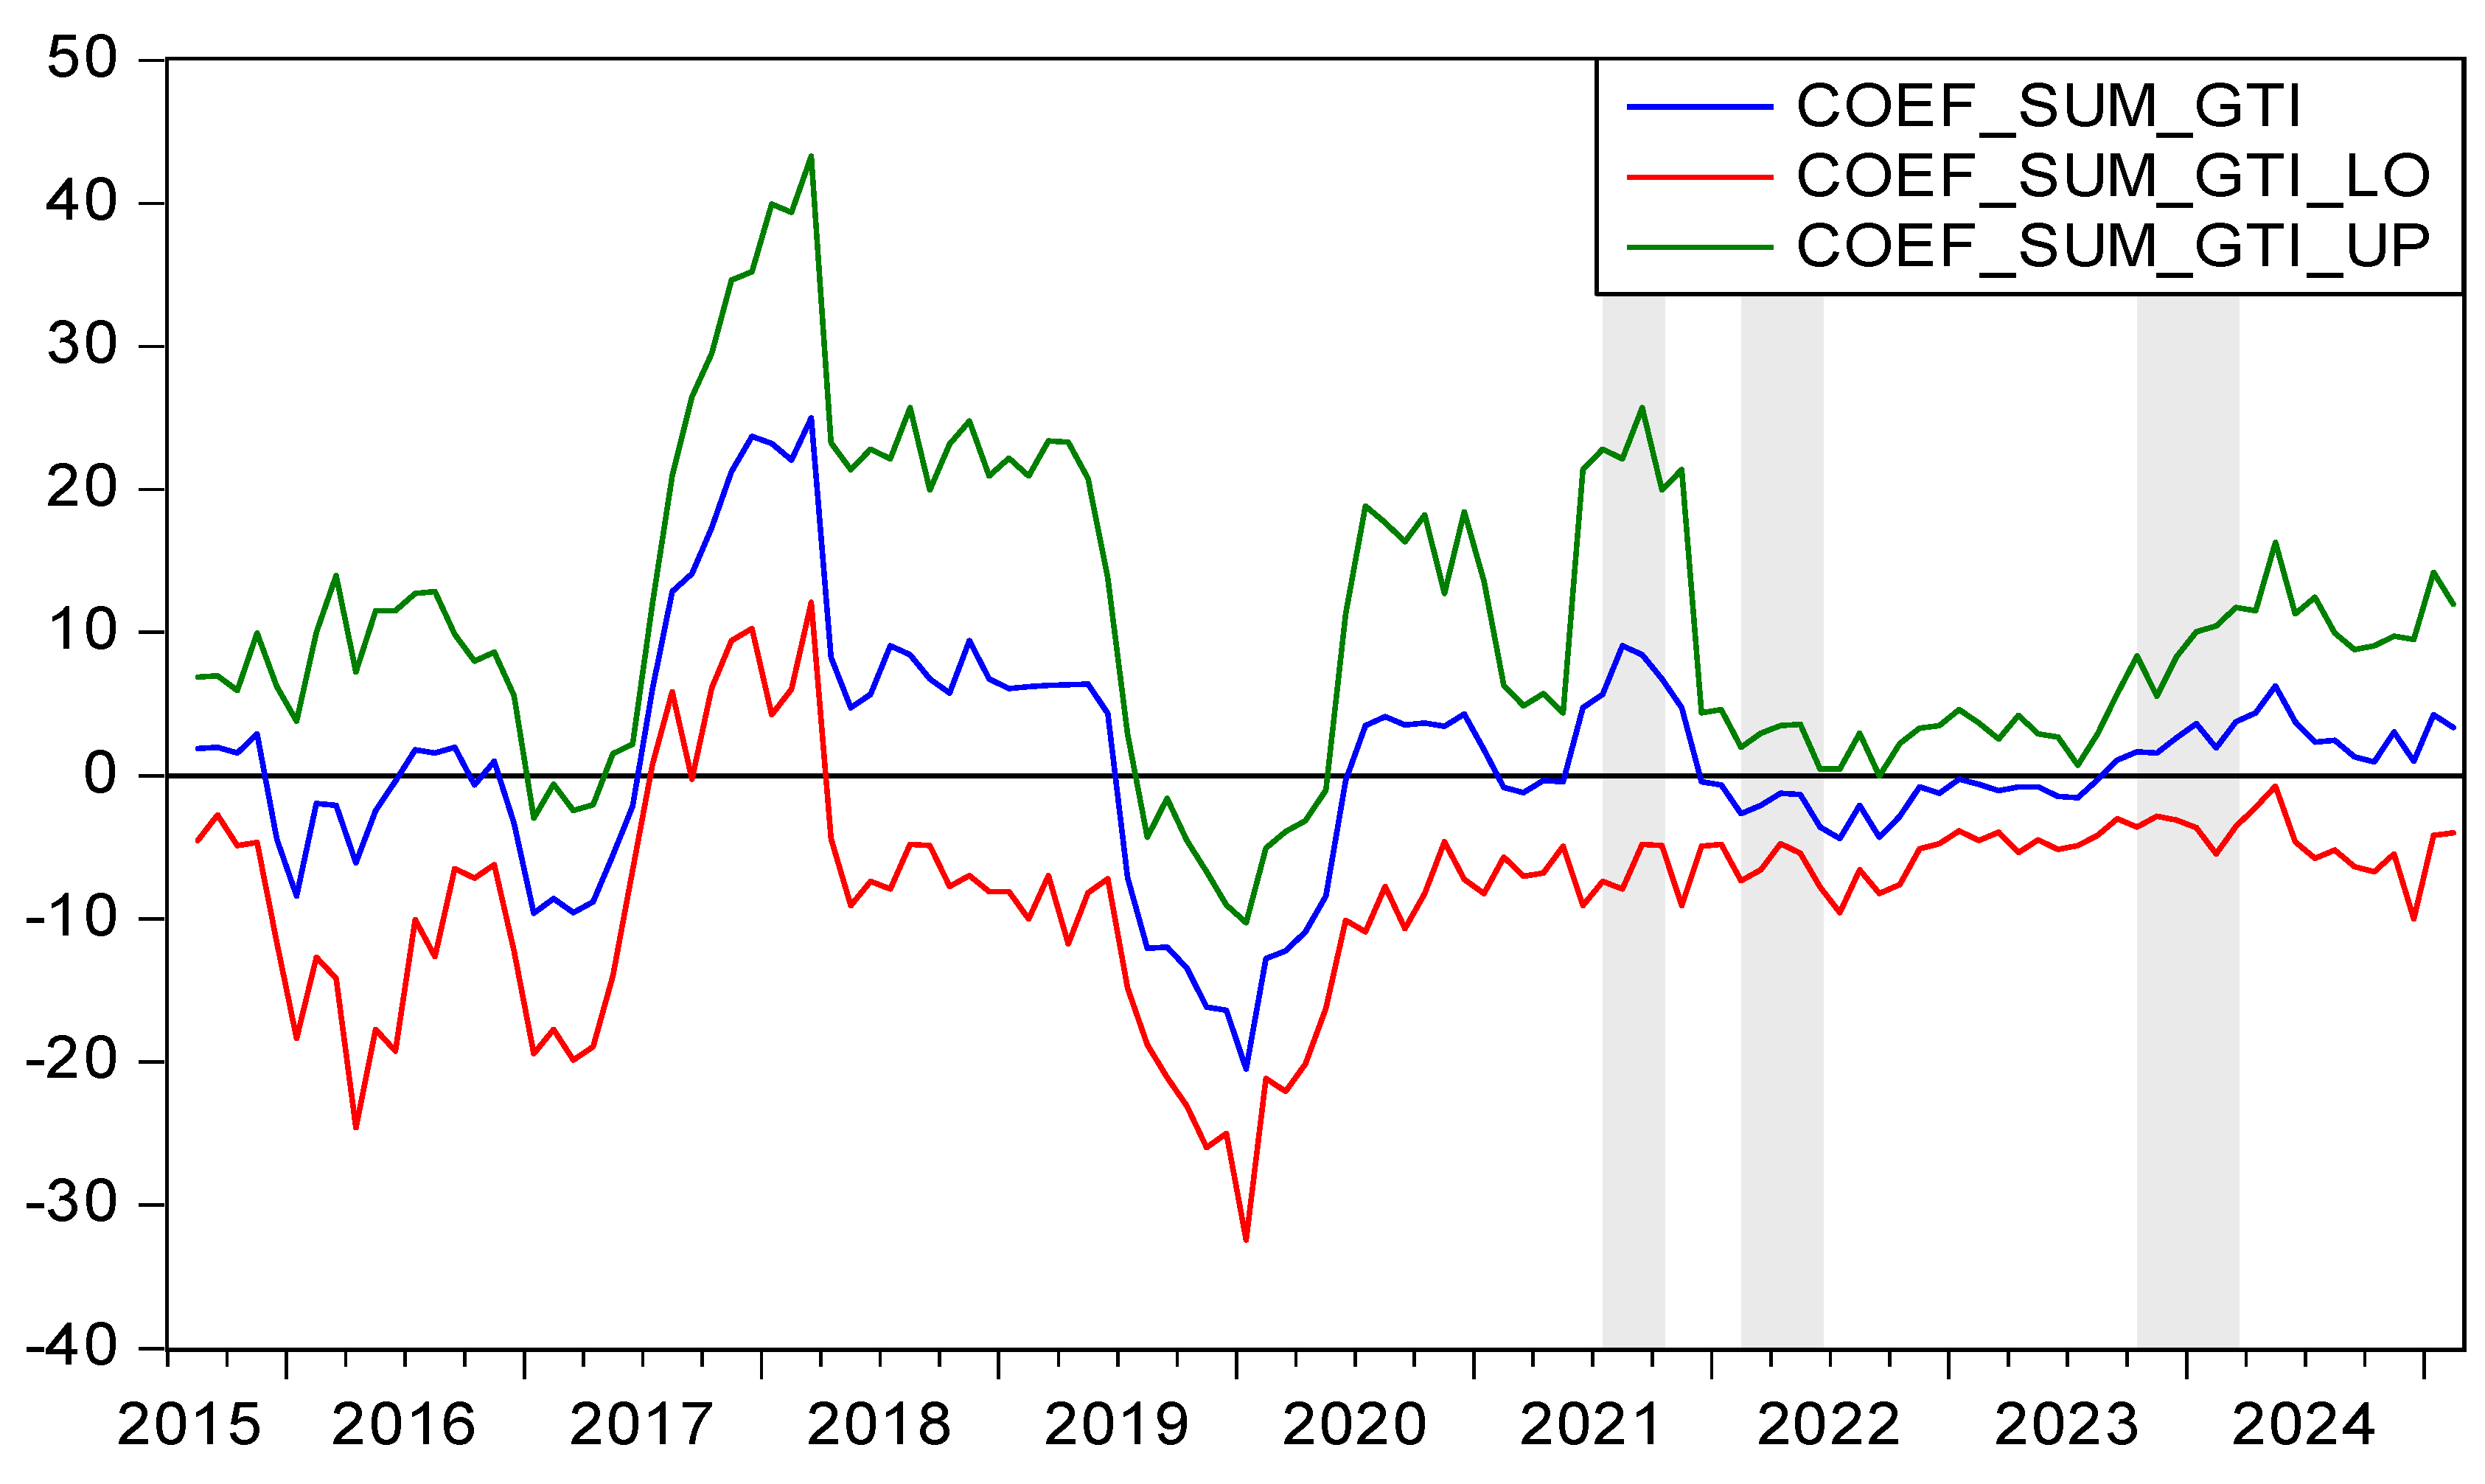
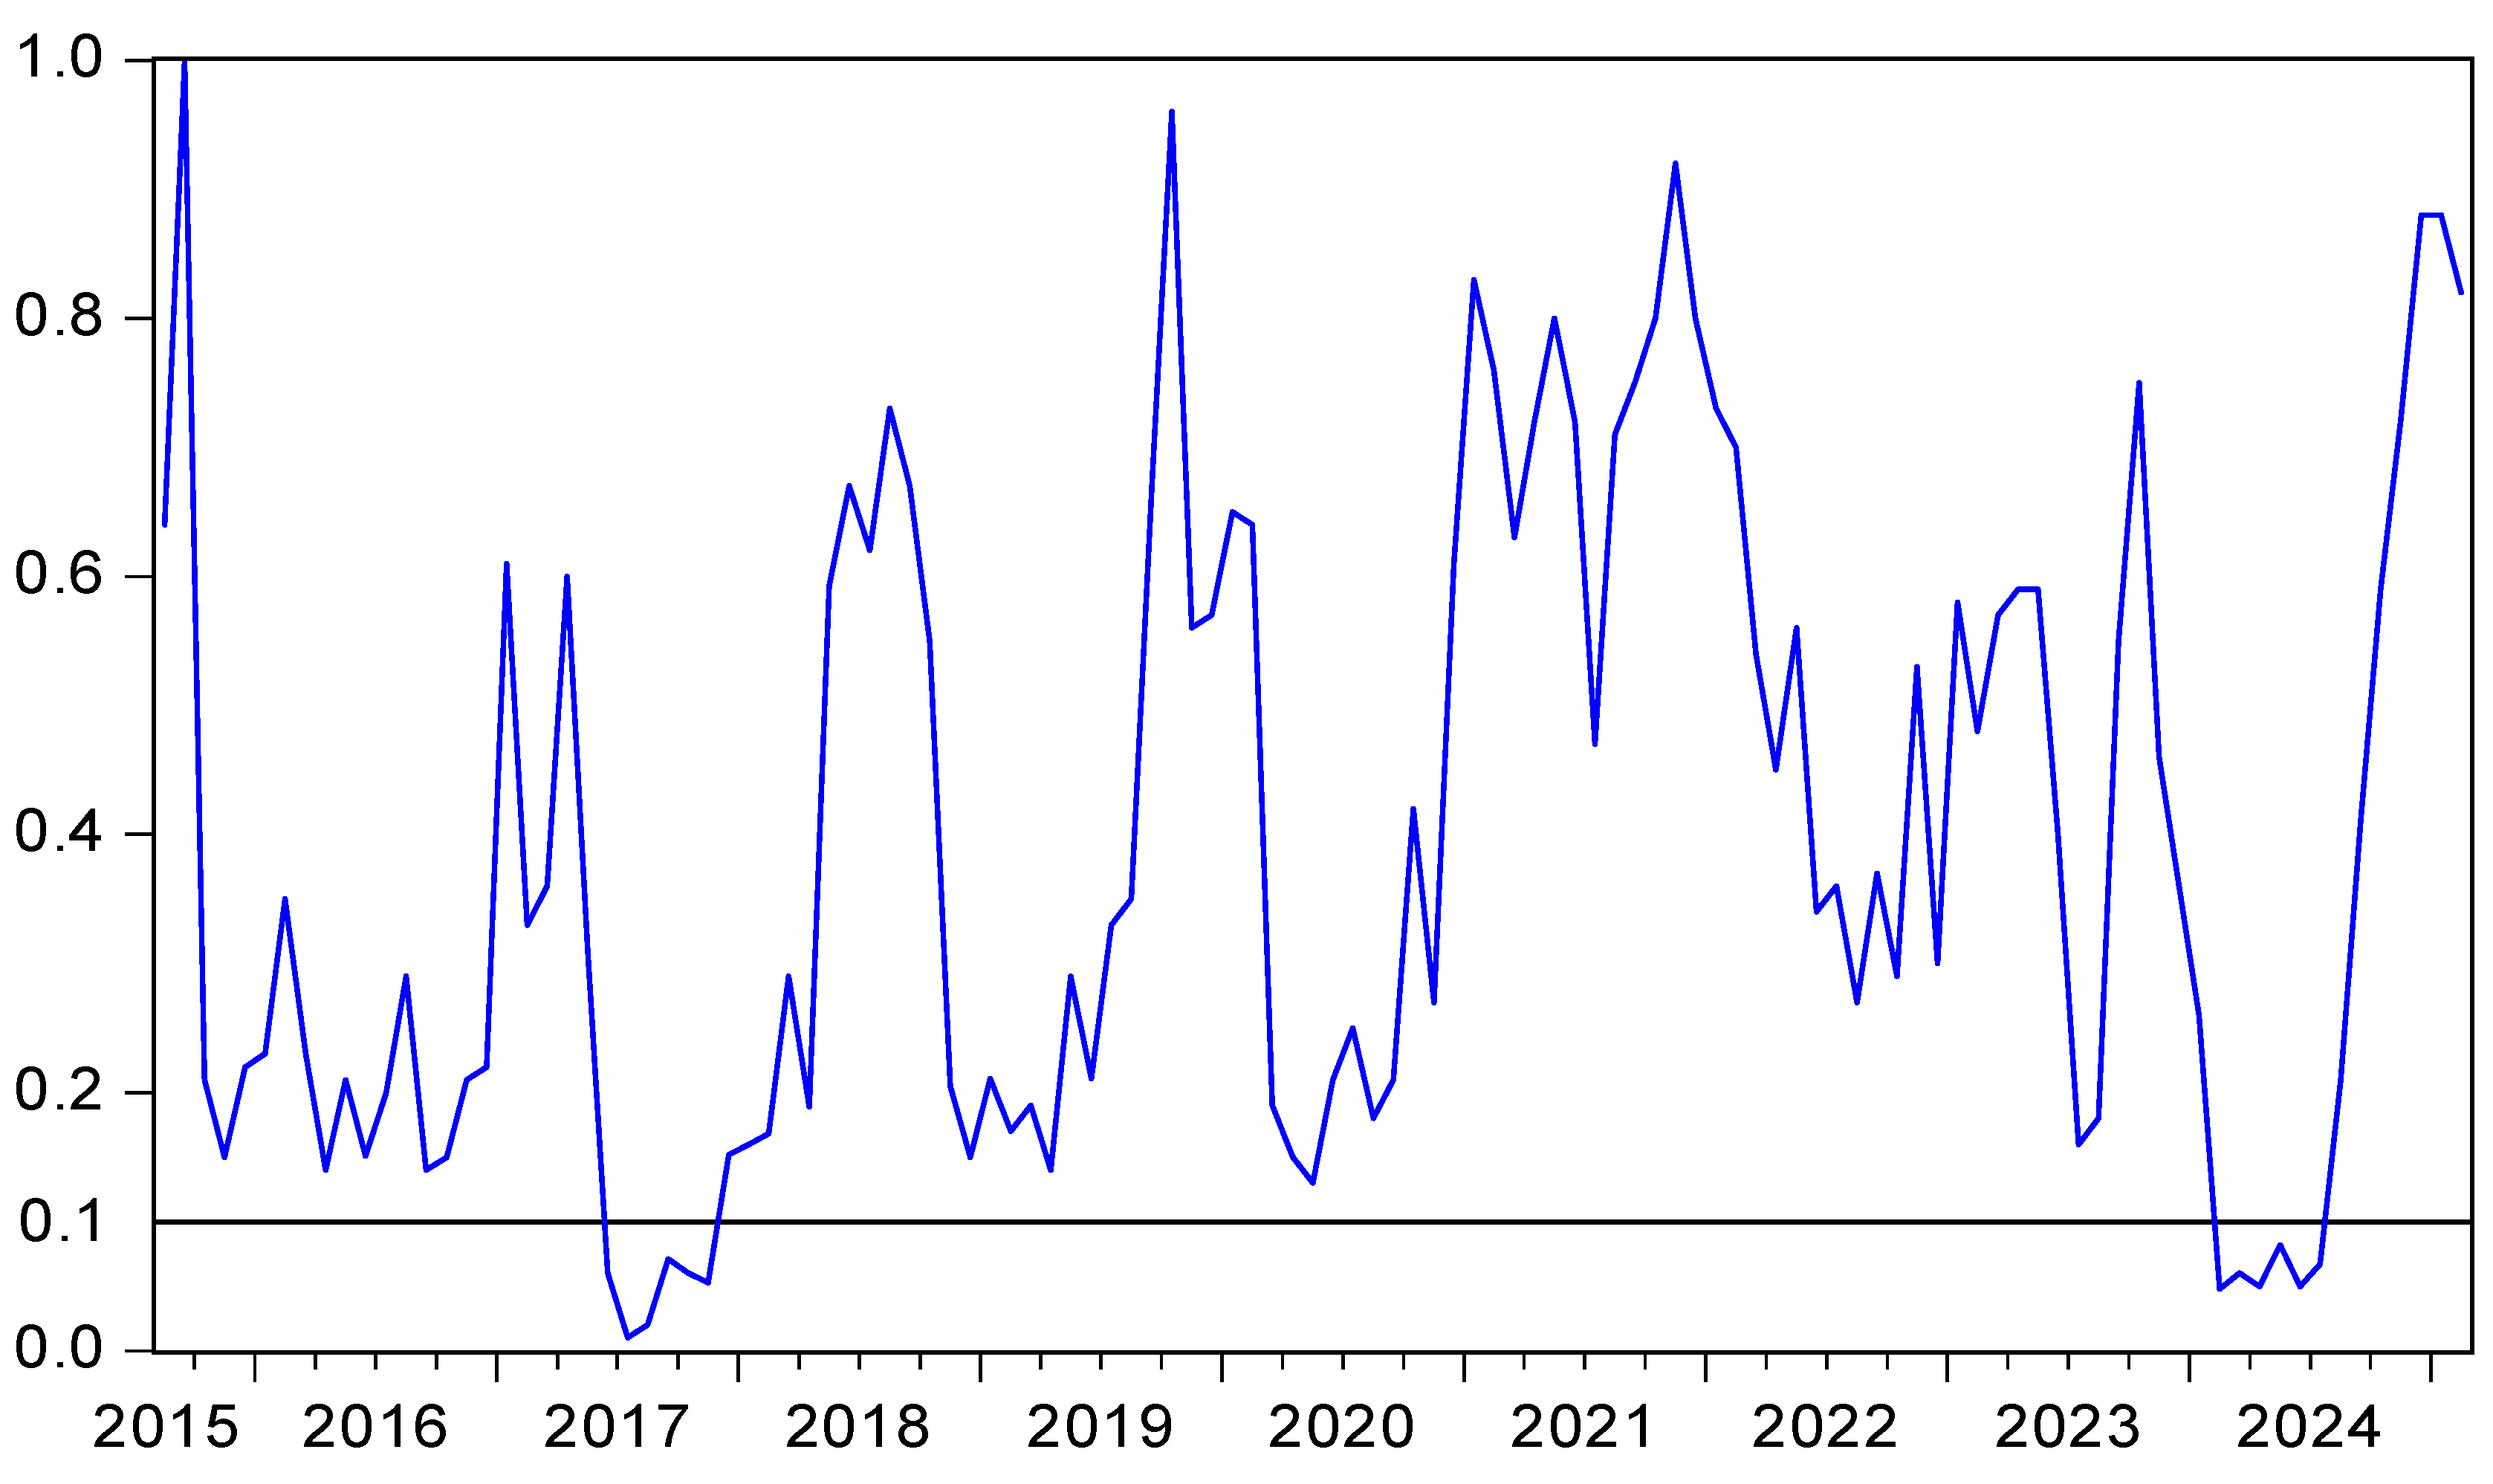
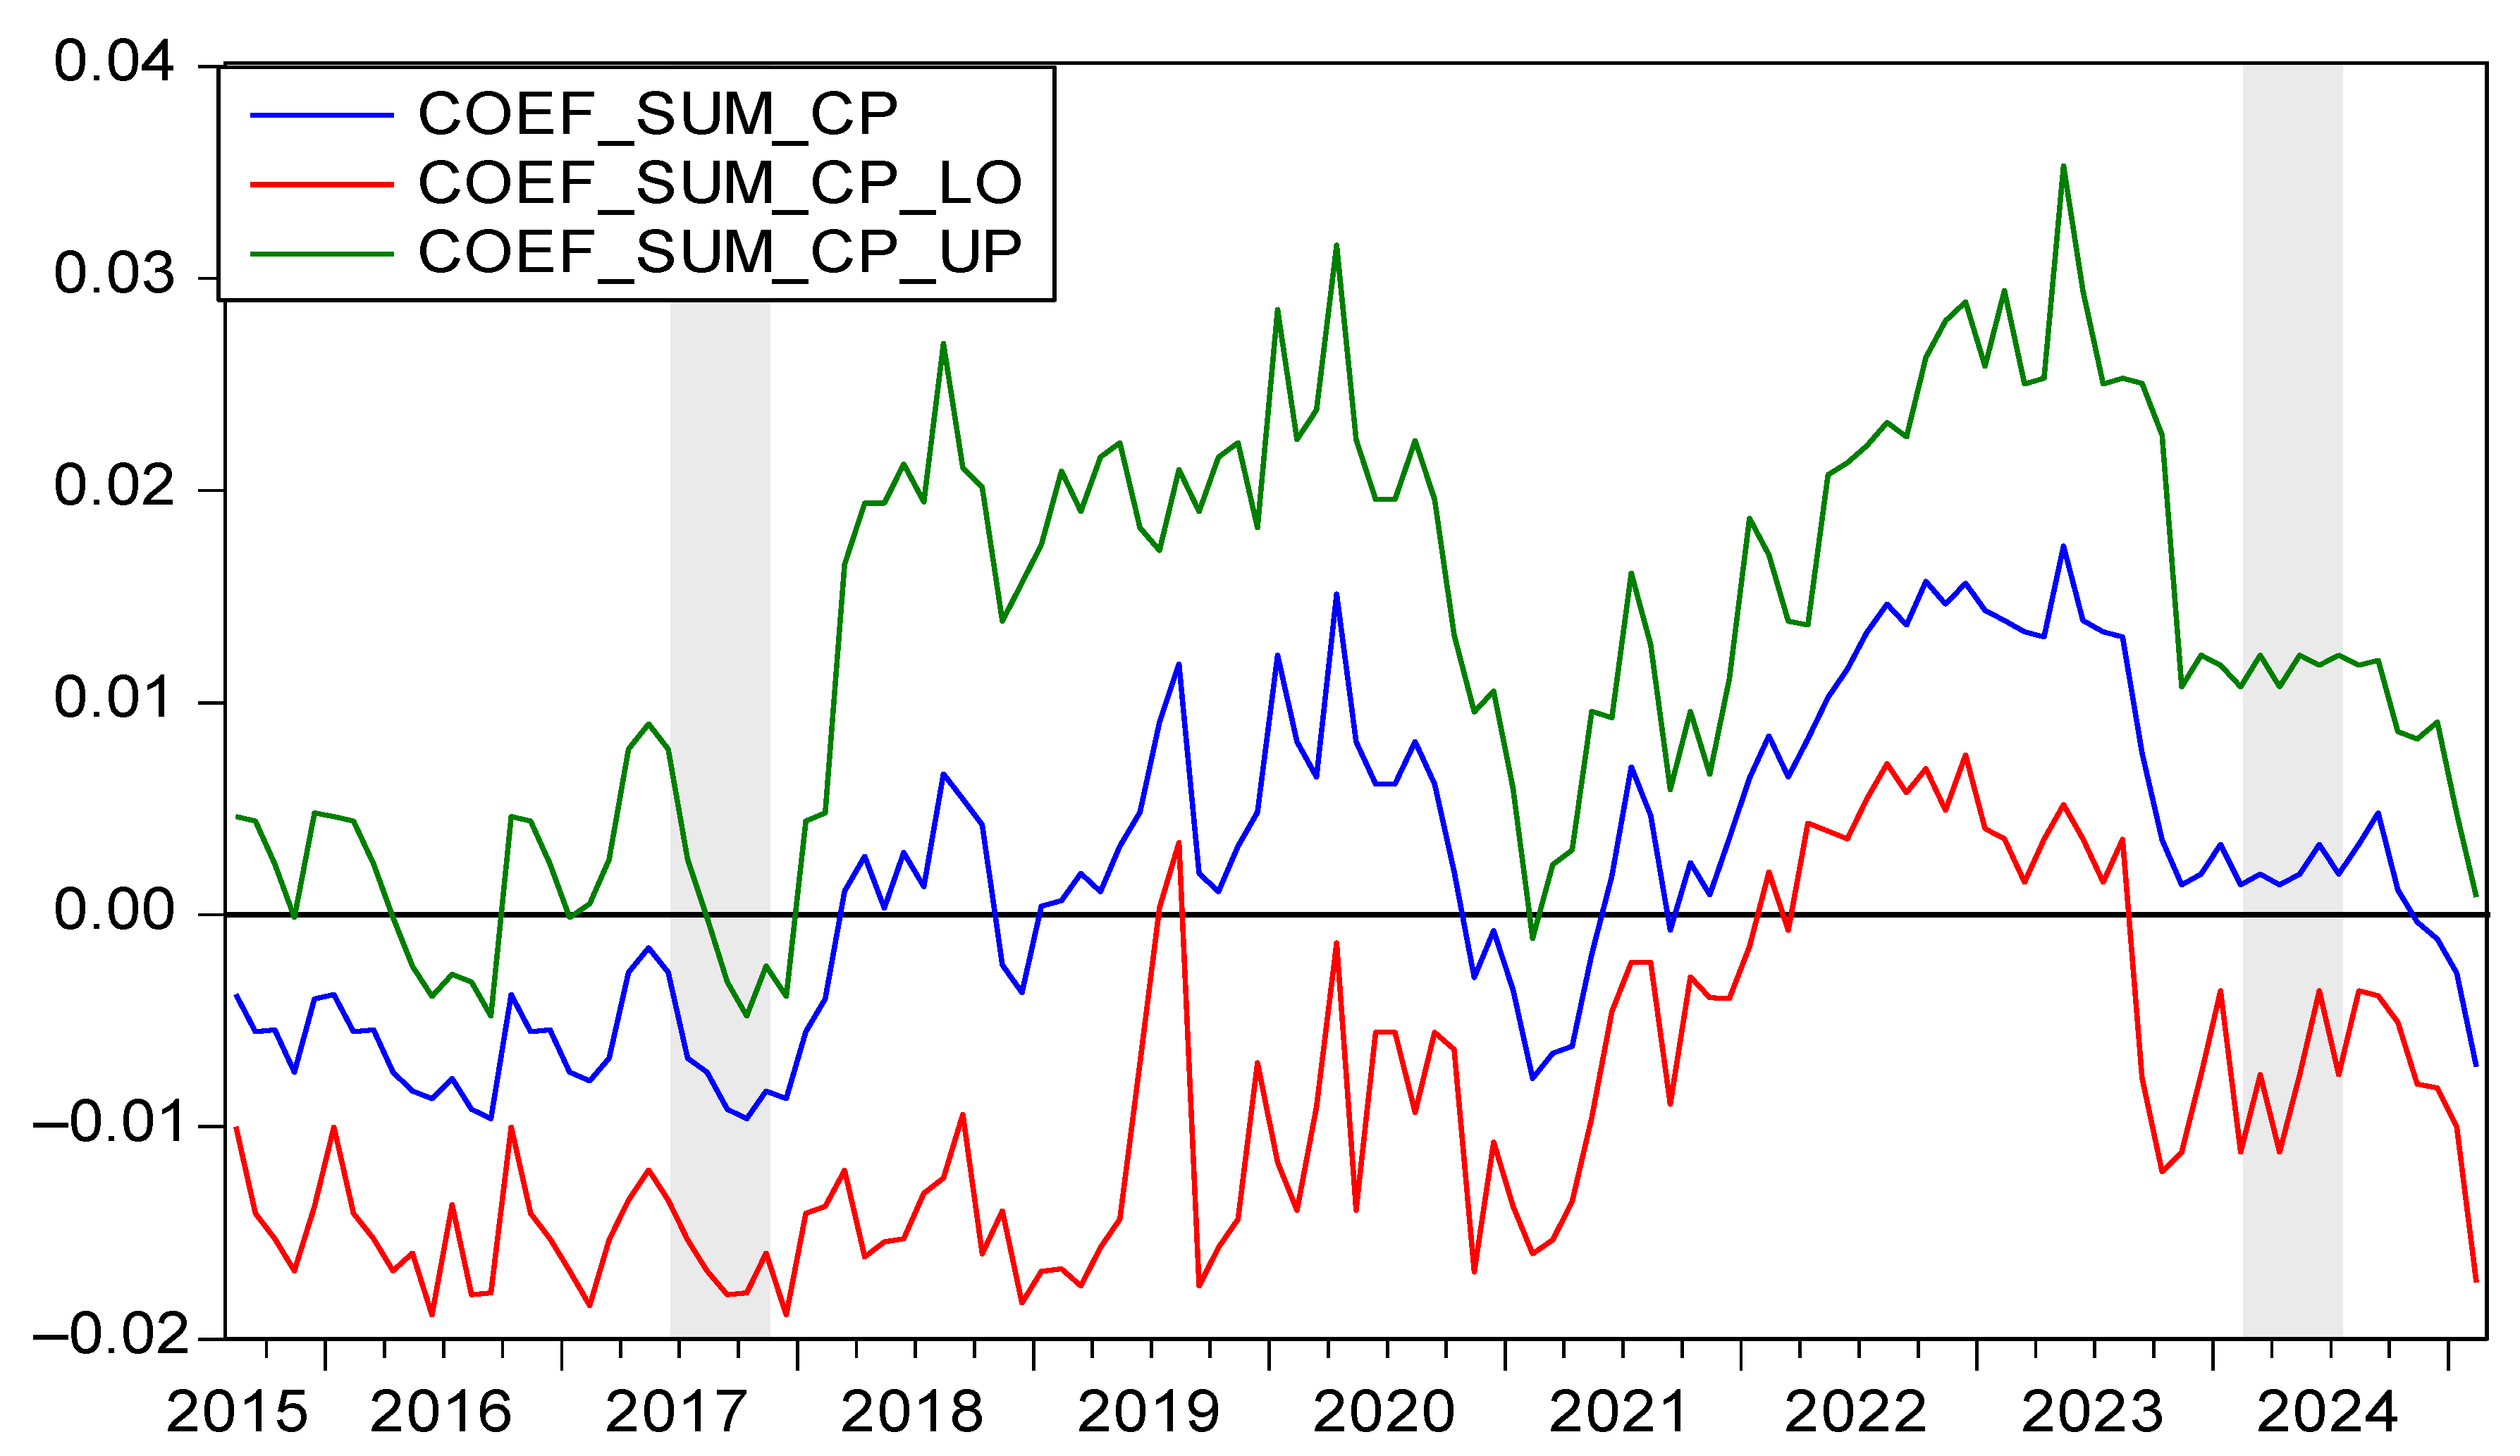
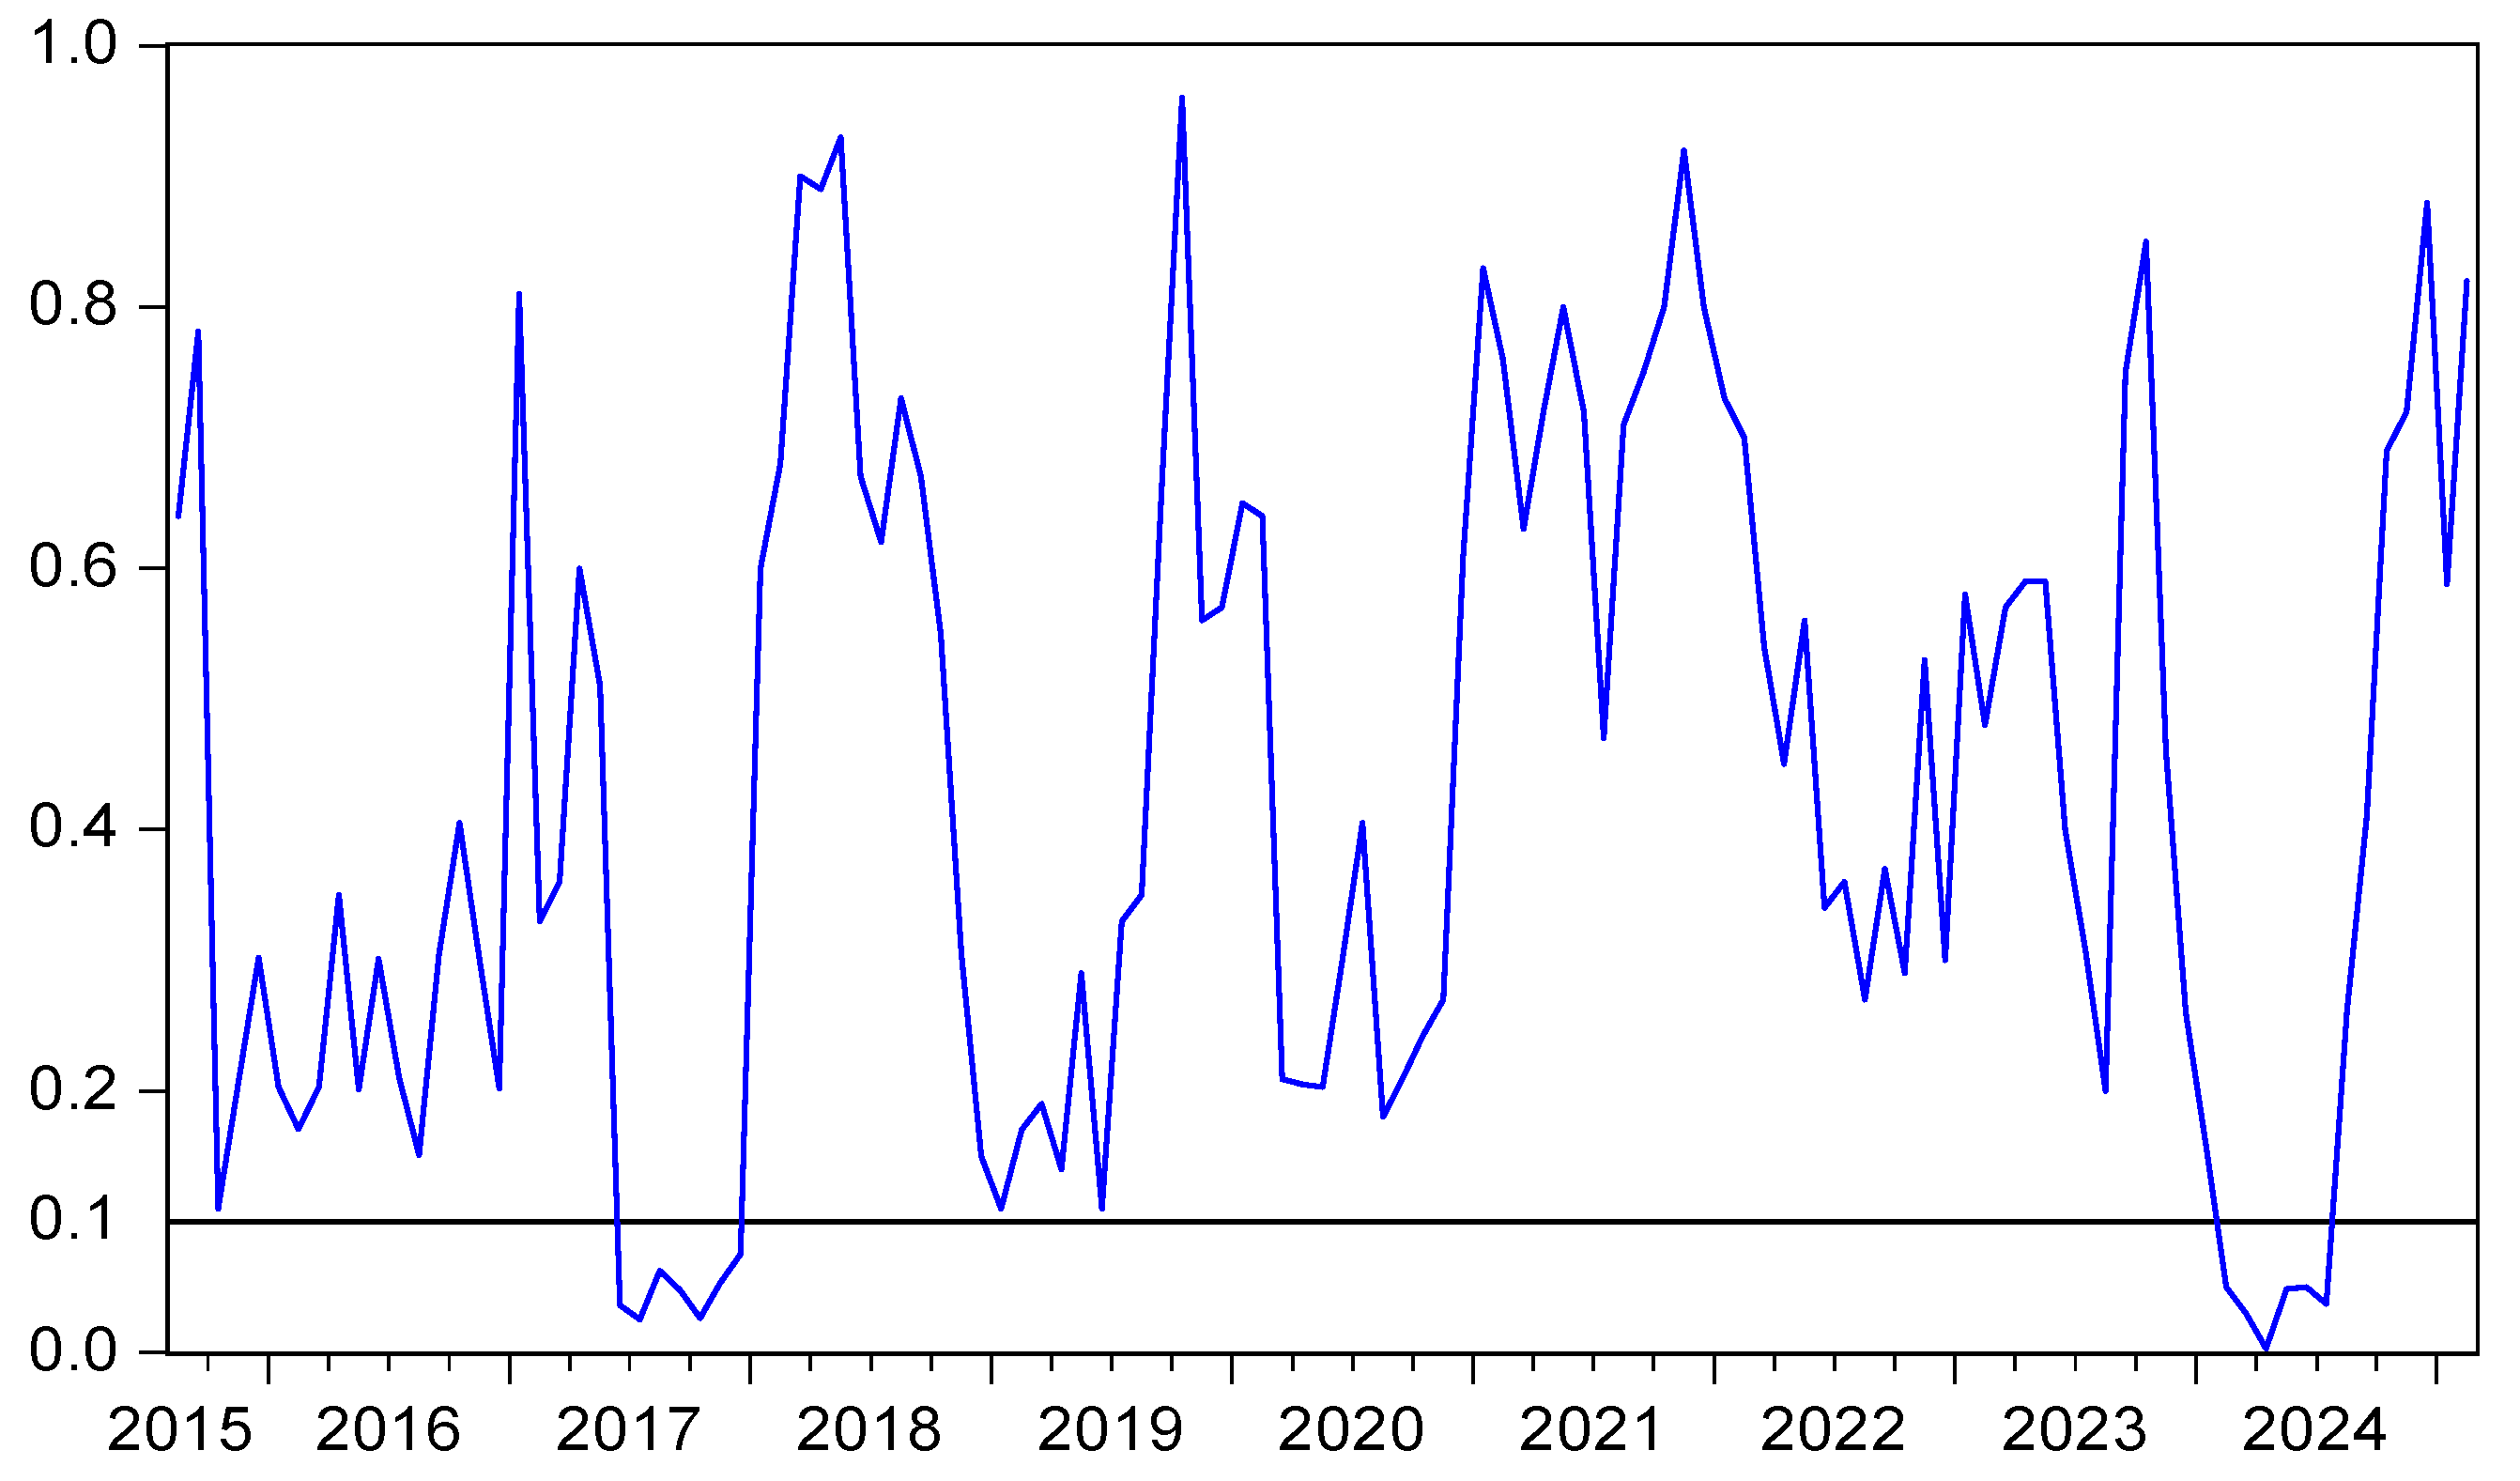
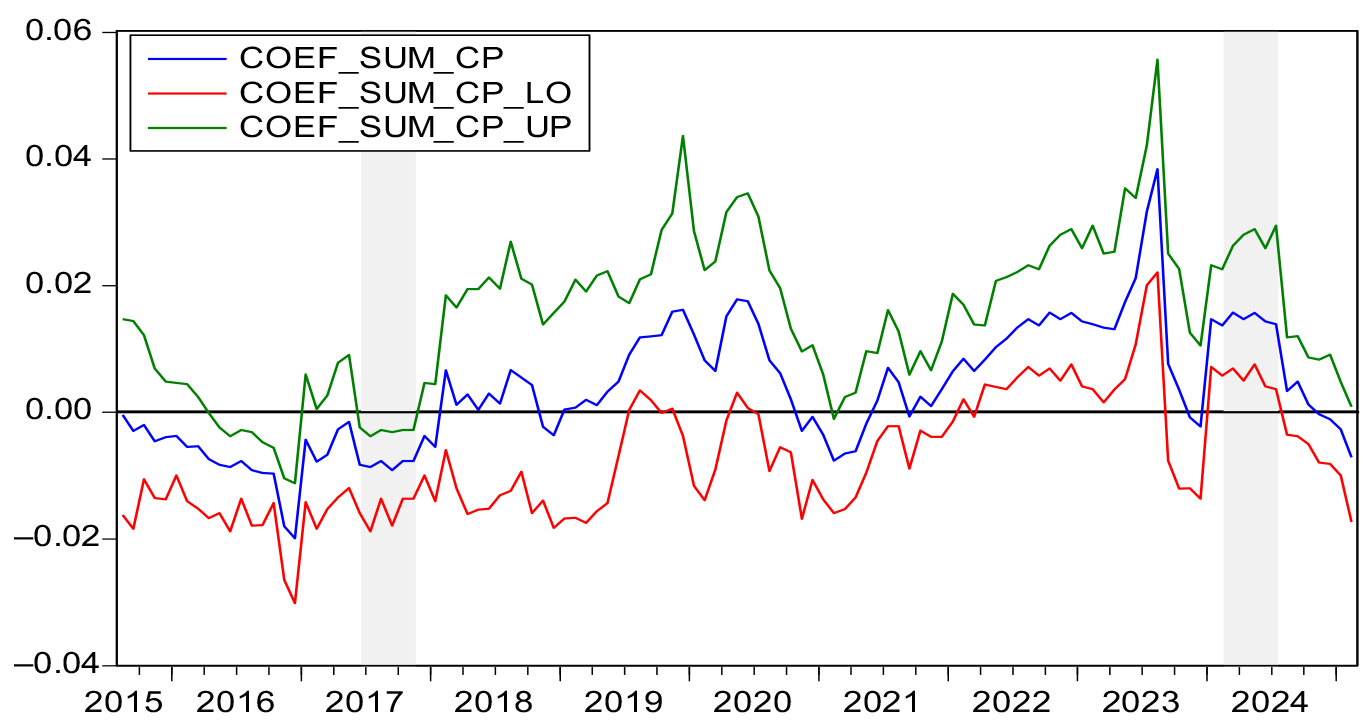
6. Empirical Results

We analyzed CP–GTI full-sample Granger causality using a 4-lag VAR model selected via SIC. As shown in Table 2, CP has a causal effect on GTI, but not vice versa. However, due to parameter instability caused by structural variations, these findings are considered unreliable. To address this, we conducted parameter stability tests such as Sup-F, Ave-F, Exp-F, and Lc tests [71,72], which revealed significant structural changes at the 1% level (Table 3). For instance, the launch of China’s national carbon market (July 2021) coincided with a structural breakpoint, explaining the heightened Granger causality from CP to GTI in the post-2021 period. Conversely, geopolitical shocks such as the Russia–Ukraine conflict (February 2022) may have temporarily weakened the CP–GTI relationship by shifting policy priorities toward energy security. These findings suggest that the Granger causality between CP and GTI is both time-sensitive and context-dependent, influenced by institutional developments and external disruptions.
The initial analyses identified significant parameter instability, prompting the adoption of a robust bootstrap sub-sample rolling-window causality test. After careful methodological consideration, we determined a 24-month observation window to be optimal, as this duration effectively balanced two critical requirements: (1) it maintained statistical reliability in accordance with Shukur and Pesaran’s criteria, and (2) it ensured meaningful economic interpretability within our specific research framework. To rigorously validate this window selection, we conducted comprehensive sensitivity analyses employing alternative window lengths of 20, 28, and 32 months. The results obtained across these different window specifications demonstrated remarkable consistency, thereby confirming the robustness of our findings.
Figure 4 shows the p-values associated with the null hypothesis that CP does not Granger cause GTI. Figure 5 elucidates the directional influence from CP to GTI. The analysis in Figure 4 and Figure 5 uncovers nuanced patterns of causality over time. Specifically, during the periods of July 2021 to October 2021 and October 2023 to March 2024, CP exerted a positive influence on GTI. Conversely, during the period from February 2022 to June 2022, CP had a negative influence on GTI.
In the period from July 2021 to October 2021, both CP and GTI rose. On 16 July 2021, China’s national carbon emission trading market opened at the Shanghai Environment and Energy Exchange. From 16 July to 31 December, the cumulative trading volume of carbon emission allowances reached 179 million tons, with a total transaction value of CNY 7.661 billion. Over half of the key emission units actively participated in the market. On 31 December, the closing price was CNY 54.22 per ton, marking a 12.96% increase from the opening price. Additionally, in 2021, China granted over 37,000 green and low-carbon patents, with a growth rate of 32%. During this period, the positive impact of CP on GTI can be explained in three ways. First, as China’s national carbon emission trading market stabilized, its scale and coverage expanded. CP served as a market mechanism, offering clear direction for green development. With stricter emission limits and rising CP, companies had to focus on green innovation to achieve sustainable growth, thereby boosting GTI [44,46]. Second, CP fueled the emergence of a green technology market. Companies that mastered green patent technology gained a competitive advantage. Developing green patents not only reduces carbon emission costs but also generates revenue through licensing and technology transfer. This innovation offset effect drove firms to increase R&D investment, promoting GTI [11,12]. Third, high CP highlighted the value of emissions reduction, making green innovation projects more appealing for investment and financing. This accelerated the pace of GTI [69,70].
In the period from February 2022 to June 2022, CP rose. In February 2022, the Russia–Ukraine conflict erupted. As a major global energy exporter, Russia’s restricted energy exports destabilized global energy supply chains. Global oil prices spiked, peaking at USD 139 per barrel, nearly double the previous year and reaching the highest level since 2008. Soaring oil prices forced some Chinese companies to cut energy costs and maintain operations by temporarily using higher-emission alternatives like coal, resulting in increased carbon emissions. Higher emissions raised the demand for carbon allowances, driving up CP. However, GTI declined. The Russia–Ukraine conflict impacted multiple global areas, including energy, food, supply chains, financial markets, and geopolitics, increasing global uncertainty. These uncertainties and risks suppressed China’s GTI. During this period, the negative impact of CP on GTI can be explained in two ways. First, a high CP significantly raised compliance costs for firms. To meet the carbon allowance requirements, companies had to pay more. These additional expenses reduced available funds, forcing firms to prioritize compliance over green technology R&D. This created a negative compliance cost effect on GTI [15,16]. Second, the geopolitical and military conflicts introduced uncertainty into the global carbon market. Facing unpredictable conditions, companies opted for low-risk, short-term solutions with limited emission reduction effects, rather than investing in high-risk but high-reward long-term GTI. This conservative strategy suppressed GTI [78,79,80]. Third, China’s domestic energy policies in 2022 likely suppressed corporate green innovation investment. The 14th Five-Year Plan for Modern Energy System, released in March 2022, prioritized short-term energy security, with particular emphasis on coal supply during the 2022 energy shortages. This policy focus may have led some firms to temporarily defer GTI investments as they prioritized securing conventional energy supplies. In addition, concurrent coal price controls and mandatory production quotas compelled firms to allocate substantial capital and operational resources toward compliance, reducing the available funding for GTI R&D.
In the period from October 2023 to March 2024, CP and GTI rose together. On 1 October 2023, the first phase of the EU Carbon Border Adjustment Mechanism (CBAM) started. CBAM, a derivative policy of the EU carbon market also known as the “carbon tariff”, required exporters in six carbon-intensive industries to report their carbon emissions to EU authorities to continue exporting to Europe. This generated widespread “carbon anxiety,” driving up CP. Meanwhile, GTI also rose. In 2023, the volume of green and low-carbon patent applications published in China reached 97,000, up 14.5%. Patent grants totaled 45,000, an 8.0% increase. By the end of 2023, the number of valid green and low-carbon patents in China reached 243,000, a 19.1% rise. The positive impact of CP on GTI during this period can be explained in two ways. First, the EU carbon tariff was eventually reflected in product prices, reducing the market competitiveness of high-carbon products while increasing that of low-carbon ones. Thus, through the innovation offset effect, the EU carbon tariff motivated some exporters to boost GTI [13]. Companies achieving low-carbon transition through innovation gained a global competitive edge, captured green markets early, and stayed ahead as policies tightened [36,37]. Second, the EU carbon tariff raised emission costs for exporters. The rising cost pressures drove firms toward GTI as a strategic response [81,82].
Figure 6 presents the p-values testing the null hypothesis that GTI does not Granger-cause CP. Figure 7 reveals the directional impact of GTI on CP. The analysis in Figure 6 and Figure 7 uncovered a nuanced causal relationship that unfolded over time. In the period from June 2017 to November 2017, GTI exhibited a negative influence on CP. In contrast, in the period from February 2024 to July 2024, GTI demonstrated a positive influence on CP.
In the period from June 2017 to November 2017, GTI declined, but CP rose. In June 2017, the Trump administration announced the US withdrawal from the Paris Agreement. The decision weakened global climate cooperation efforts. As the world’s largest economy and second-largest historical greenhouse gas emitter, the US exit reduced funding and technology transfer to developing nations. This hampered their ability to combat climate change. Global research collaboration and investment in climate solutions declined, and low-carbon innovation slowed. In China, the number of green and low-carbon patents granted dropped from 25,000 in 2016 to 23,000 in 2017. However, CP rose from CNY 23 per ton in June 2017 to CNY 34 per ton by November 2017, increasing rapidly. During this period, the negative impact of GTI on CP can be explained in two aspects. First, GTI slowed down, and companies lacked effective emissions reduction methods, leading to increased carbon emissions. This increased the demand for carbon emission quotas, pushing up CP [83,84,85,86,87]. Second, the slowed GTI reduced market confidence in long-term emissions reduction goals. Fears of future quota shortages prompted companies to compete for quotas in the short term, further raising CP [88].
In the period from February 2024 to July 2024, both GTI and CP rose. In 2024, the number of green and low-carbon patents granted was nearly 50,000 in China. Among them, the number of patents granted in solar PV, new energy vehicles, and battery technologies ranked first globally. China’s solar PV supply chain accounted for over 70% of global production. New energy vehicle production and sales remained the world’s highest for eight consecutive years. In 2024, China’s CP rose, with a peak of CNY 106.02 per ton and a low of CNY 69.67 per ton. The average price was CNY 91.8 per ton. The year-end closing price was CNY 97.49 per ton, up 22.75% from the end of 2023. During this period, the positive impact of GTI on CP can be explained in two ways. First, GTI reduced emission reduction costs. Companies were more willing to join the carbon trading market. Increased participation boosted carbon market confidence, liquidity, and vitality, driving CP higher [89,90]. Second, the improved GTI led to the widespread adoption of innovations like carbon capture and renewable energy. This enhanced resource efficiency and carbon productivity [91]. Notable reductions in carbon emissions incentivized governments to implement more rigorous regulatory standards while decreasing quota allowances, thereby driving up CP [92]. Third, GTI enhanced carbon market activity by reducing corporate emission costs. For instance, solar power generation costs declined by 12% in 2024, contributing to a 30% year-on-year surge in China’s carbon market trading volume in the first half of 2024. Improved liquidity lowered market entry barriers, attracting short-term traders to capitalize on upward trends while reinforcing the long-term expectations of carbon scarcity. This allowed the market to more efficiently reflect supply–demand shifts driven by green technology adoption, drawing increased investor participation and driving CP higher. Ultimately, this created a clear cycle: better GTI lifts liquidity, and higher liquidity drives CP up.
To strengthen the validity of the quantitative analysis, this research substituted the original control factor of FCs with climate policy uncertainty (CPU) and crude oil prices (COPs) as alternative control variables, while conducting subsequent empirical verification. CPU and COPs potentially impact both CP and GTI via worldwide market fluctuations and international policies. CPU suppresses CP by weakening market expectations, while simultaneously hindering GTI by increasing investment risks [93,94]. International COP volatility affects CP and corporate R&D investment in GTI through energy substitution and cost transmission effects [18,95,96]. Hence, CPU and COPs were included as control variables.
The empirical outcomes presented in Figure 8, Figure 9, Figure 10 and Figure 11, which incorporate CPU and COPs as alternative control variables, demonstrate that the modified variable selection maintained consistency with prior analytical results. This alignment provides evidence for the robustness of our quantitative analysis, reinforcing the methodological validity of our research.
In short, the bootstrap full-sample method indicated that CP Granger-causes GTI, but GTI does not Granger-cause CP. However, this conclusion does not hold when the coefficients in the VAR(p) model are non-constant. To demonstrate this variability, our study employed four parameter stability techniques, revealing abrupt structural changes in CP and GTI. Subsequently, we applied the more sophisticated sub-sample technique to identify the complex relationship between these two variables. The findings suggest that CP exerts a dual-channel effect on GTI, and vice versa.

7. Conclusions and Policy Implications

7.1. Conclusions

This study investigated the temporally heterogeneous causal relationship between carbon pricing (CP) and green technology innovation (GTI). Our findings revealed substantial uncertainty in this relationship: CP stimulates GTI via the innovation offset effect in some periods but inhibits it through the compliance cost effect in others. Conversely, GTI exerts both positive and negative influences on CP across different temporal phases, highlighting the complex and bidirectional interplay between the two variables.
The relationship between CP and GTI is governed by two opposing mechanisms: the innovation offset effect and the compliance cost effect. The dominance of either mechanism depends on contextual factors, including policy synergy, international competitive landscape, and financial market conditions.
(1)
Policy synergy: When CP is effectively coordinated with complementary environmental policy instruments, the innovation offset effect predominates. Such policy combinations simultaneously reduce innovation costs and enhance expected returns, internalizing carbon costs as innovation incentives. Conversely, isolated CP without supporting measures increases pure compliance costs, leading firms to reduce R&D expenditures under budget constraints and thereby activating the compliance cost effect.
(2)
International competitive landscape: The global competitive environment shapes firm strategy. With robust carbon leakage prevention mechanisms such as carbon border adjustments, firms cannot evade carbon costs through relocation and are compelled to innovate to maintain competitiveness. In such cases, CP pressures translate into innovation drivers. In the absence of such trade policy coordination, firms favor geographical arbitrage over technological innovation, triggering the compliance cost effect.
(3)
Financial market conditions: Financial market completeness determines firms’ capacity to transform carbon signals. The developed green financial markets mitigate GTI FCs through diversified instruments, enabling firms to smooth intertemporal investments and convert carbon pressures into innovation inputs. Under financial friction, however, binding liquidity constraints amplify R&D budget displacement by rising carbon costs, reinforcing the compliance cost effect.
In essence, these factors collectively influence firm decisions by altering the relative prices and budget constraints of GTI activities: policy synergy adjusts the marginal costs and benefits of innovation, international competition modifies strategic options, and financial conditions reshape intertemporal budgets. The innovation offset effect dominates when these factors lower GTI costs or raise expected returns, while their absence strengthens the compliance cost effect.

7.2. Policy Implications

To foster a positive and synergistic interaction between CP and GTI, promoting a reduction in catbon emissions, the Chinese government should focus on the following actions.
First, the industry coverage and market scale of China’s carbon market should be expanded. Initially, the coverage should be extended from power generation to high-emission industries like steel and cement, and then the chemical and building materials sectors should be gradually incorporated while piloting emerging fields such as data centers and aviation. Additionally, a synergistic policy framework should be established for carbon market expansion through integrating price- and market-based environmental policies. Regarding price-based mechanisms, a tiered water taxation system featuring penalty rates for water-intensive sectors should be implemented, forming a dual resource-energy constraint mechanism complementary to carbon pricing. Concurrently, the environmental protection tax requires optimization through the inclusion of co-pollutants such as VOCs, enabling integrated carbon pollution regulation. For market solutions, integrated trading platforms linking emission rights and carbon allowances should be established, bundled pollution–carbon reduction products developed, and renewable energy incorporated into energy quota systems.
Second, a dynamically optimized carbon pricing system should be established. CP floors and ceilings should be set. This would prevent excessive pressure on enterprises from high CP and eliminate weak incentives from low prices. Additionally, a CP stabilization fund can be created to absorb excess trading volume or inject fiscal funds during significant price fluctuations, ensuring market stability.
Third, a green innovation coefficient should be incorporated into carbon quota allocation to reward enterprises that achieve breakthroughs in emission-reduction technologies with additional quotas. This market-driven mechanism accelerates technological innovation by granting a scaling factor of 1.1 to 1.5 multiplier on allocated quotas for companies that develop and deploy nationall certified breakthrough technologies. In this way, firms can recover R&D costs by selling surplus quotas while entering a virtuous cycle where an advanced GTI reduces compliance costs.
Fourth, a trinity “monitoring–trading–governance” mechanism should be established to synergize China’s carbon market, SDGs, and GTI. First, SDG indicators (7.3 for energy efficiency, 9.4 for low-carbon industries, and 13.2 for climate policy) can be integrated through the national eco-environment big data platform, developing a carbon market digital twin system to monitor innovation elasticity coefficients in key sectors. Second, “SDG–CP” index futures can be piloted at the Shanghai Environment and Energy Exchange, linking corporate green patent counts with carbon allowance auction prices at a 1:0.5 SDG-to-CO2 exchange ratio. Lastly, international alliances should be fostered to build mutual SDG recognition systems between China’s carbon market and ASEAN/EU/Middle Eastern markets, deploying blockchain-based carbon–SDG certification while creating a green tech transfer fund that rewards cross-border projects achieving SDG 9.4 with 10–15% extra carbon allowances.
Fifth, more green financial instruments should be developed. First, a diversified green financial instrument system should be established, including improving green credit mechanisms, issuing specialized green bonds, and setting up green technology venture capital funds to provide multi-level financing support for green technology innovation. Second, innovative carbon financial derivatives need to be developed, such as carbon futures contracts and patent-backed financing products, while building blockchain-based carbon emissions reduction technology certification and trading platforms to enhance market efficiency. Then, market participants should be expanded by introducing specialized investment institutions like carbon funds and foreign investors to increase market vitality. On this basis, a linkage mechanism of “carbon price signal–financial leverage–technology diffusion” should be established to effectively connect carbon pricing with green technology innovation. Finally, mutual recognition mechanisms with major international carbon markets should be promoted, and a “Belt and Road” carbon trading hub should be built. Through unified carbon accounting standards and multilateral offset mechanisms, the international transfer and diffusion of green technologies will be facilitated, ultimately forming a global financial ecosystem that supports green technology innovation.
This study revealed the relationship between CP and GTI in China, but the international generalizability of the findings should be interpreted with caution due to cross-country variations in marginal abatement costs. These variations, stemming from differences in emission targets, development stages, and economic structures, fundamentally alter the CP–GTI mechanism. This study employed green and low-carbon technology patents as a proxy for GTI. While patent data provide measurable indicators of innovation output, they cannot capture two critical dimensions: the actual commercialization rate of green technologies and their quantified environmental benefits in field applications. The conclusions and countermeasures of this study, while based on China’s national-level analysis, lack detailed regional subdivisions. This may limit the targeting of policy recommendations or lead to an overestimation of their applicability. Future research should enhance generalizability by examining how distinct policy systems and varying marginal abatement costs differentially influence the CP–GTI relationship across different national contexts.

Author Contributions

Y.G.: designed the research framework and composed the initial manuscript; C.S.: conducted the computational analysis and software implementation; T.G.: oversaw the theoretical development and verified the analytical results. All authors have read and agreed to the published version of the manuscript.

Funding

This research received no external funding.

Institutional Review Board Statement

Not applicable.

Informed Consent Statement

Not applicable.

Data Availability Statement

The data generated during this study are available from the corresponding author upon formal request or after official publication.

Conflicts of Interest

No financial conflicts or personal relationships influenced this study.

References

  1. Rennert, K.; Errickson, F.; Prest, B.C.; Rennels, L.; Newell, R.G.; Pizer, W.; Kingdon, C.; Wingenroth, J.; Cooke, R.; Parthum, B.; et al. Comprehensive evidence implies a higher social cost of CO2. Nature 2022, 610, 687–692. [Google Scholar] [CrossRef] [PubMed]
  2. Revesz, R.; Greenstone, M.; Hanemann, M.; Sterner, T.; Grab, D.; Howard, P.; Schwartz, J. Best cost estimate of greenhouse gases. Science 2017, 357, 655–657. [Google Scholar] [CrossRef] [PubMed]
  3. Dietz, S.; Rising, J.; Stoerk, T.; Wagner, G. Economic impacts of tipping points in the climate system. Proc. Natl. Acad. Sci. USA 2021, 118, e2103081118. [Google Scholar] [CrossRef]
  4. Xiao, J.; Li, G.; Xie, L.; Wang, S.; Yu, L. Decarbonizing China’s power sector by 2030 with consideration of technological progress and cross-regional power transmission. Energy Policy 2021, 150, 112150. [Google Scholar] [CrossRef]
  5. Onifade, S.T.; Alola, A.A. Energy transition and environmental quality prospects in leading emerging economies: The role of environmental-related technological innovation. Sustain. Dev. 2022, 30, 1766–1778. [Google Scholar] [CrossRef]
  6. Ahmad, M.; Ahmed, Z.; Riaz, M.; Yang, X. Modeling the Linkage Between Climate-Tech, Energy Transition, and CO2 Emissions: Do Environmental Regulations Matter? Gondwana Res. 2024, 127, 131–143. [Google Scholar] [CrossRef]
  7. Sun, H.P.; Edziah, B.K.; Kporsu, A.K.; Sarkodie, S.A.; Taghizadeh-Hesary, F. Energy efficiency: The role of technological innovation and knowledge spillover. Technol. Forecast. Soc. Change 2021, 167, 120659. [Google Scholar] [CrossRef]
  8. Han, M.Y.; Sun, R.Y.; Feng, P.; Hua, E.R. Unveiling characteristics and determinants of China’s wind power geographies towards low-carbon transition. J. Environ. Manag. 2023, 331, 117215. [Google Scholar] [CrossRef]
  9. Nordhaus, W. Climate change: The ultimate challenge for economics. Am. Econ. Rev. 2019, 109, 1991–2014. [Google Scholar] [CrossRef]
  10. Porter, M.E.; Van der Linde, C. Toward a new conception of the environment-competitiveness relationship. J. Econ. Perspect. 1995, 9, 97–118. [Google Scholar] [CrossRef]
  11. Robertson, J.; Caruana, A.; Ferreira, C. Innovation performance: The effect of knowledge-based dynamic capabilities in cross-country innovation ecosystems. Int. Bus. Rev. 2021, 32, 101866. [Google Scholar] [CrossRef]
  12. Mu, Y.; Zhao, J. Production strategy and technology innovation under different carbon emission polices. Sustainability 2023, 15, 9820. [Google Scholar] [CrossRef]
  13. Gugler, K.; Szücs, F.; Wiedenhofer, T. Environmental Policies and directed technological change. J. Environ. Econ. Manag. 2024, 124, 102916. [Google Scholar] [CrossRef]
  14. Cantone, B.; Evans, D.; Reeson, A. The effect of carbon price on low carbon innovation. Sci. Rep. 2023, 13, 3673. [Google Scholar] [CrossRef] [PubMed]
  15. Goulden, S.; Negev, M.; Reicher, S.; Berman, T. Implications of standards in setting environmental policy. Environ. Sci. Policy 2019, 98, 39–46. [Google Scholar] [CrossRef]
  16. Teixidó, J.; Verde, S.F.; Nicolli, F. The impact of the EU emissions trading system on low-carbon technological change: The empirical evidence. Ecol. Econ. 2019, 164, 106347. [Google Scholar] [CrossRef]
  17. Zhang, W.; Wang, Y.; Zhang, W. How double-carbon policies affect green technology innovation capability of enterprise: Empirical analysis based on spatial Dubin model. IEEE Trans. Eng. Manag. 2024, 71, 9953–9965. [Google Scholar] [CrossRef]
  18. Chen, Z.F.; Zhang, X.; Chen, F.L. Do carbon emission trading schemes stimulate green innovation in enterprises? Evidence from China. Technol. Forecast. Soc. Change 2021, 168, 120744. [Google Scholar] [CrossRef]
  19. Chen, M.; Wang, K. The combining and cooperative effects of carbon price and technological innovation on carbon emission reduction: Evidence from China’s industrial enterprises. J. Environ. Manag. 2023, 343, 118188. [Google Scholar] [CrossRef]
  20. Duan, H.; Zhou, S.; Jiang, K.; Bertram, C.; Harmsen, M.; Kriegler, E.; van Vuuren, D.P.; Wang, S.; Fujimori, S.; Tavoni, M.; et al. Assessing China’s efforts to pursue the 1.5 °C warming limit. Science 2021, 372, 378–385. [Google Scholar] [CrossRef]
  21. Cui, J.; Wang, C.; Zhang, J.; Zheng, Y. The effectiveness of China’s regional carbon market pilots in reducing firm emissions. Proc. Natl. Acad. Sci. USA 2021, 118, e2109912118. [Google Scholar] [CrossRef] [PubMed]
  22. Chu, J.; Shao, C.; Emrouznejad, A.; Wu, J.; Yuan, Z. Performance evaluation of organizations considering economic incentives for emission reduction: A carbon emission permit trading approach. Energy Econ. 2021, 101, 105398. [Google Scholar] [CrossRef]
  23. Zhang, X.; Yang, H.; Yu, Q.; Qiu, J.; Zhang, Y. Analysis of carbon-abatement investment for thermal power market in carbon-dispatching mode and policy recommendations. Energy 2018, 149, 954–966. [Google Scholar] [CrossRef]
  24. Wei, Y.; Zhu, R.; Tan, L. Emission trading scheme, technological innovation, and competitiveness: Evidence from China’s thermal power enterprises. J. Environ. Manag. 2022, 320, 115874. [Google Scholar] [CrossRef]
  25. Wu, Q.; Wang, Y. How does carbon emission price stimulate enterprises’ total factor productivity? Insights from China’s emission trading scheme pilots. Energy Econ. 2022, 109, 105990. [Google Scholar] [CrossRef]
  26. Ji, C.; Hu, Y.; Tang, B. Research on carbon market price mechanism and influencing factors: A literature review. Nat. Hazards 2018, 92, 761–782. [Google Scholar] [CrossRef]
  27. Chen, M.; Yao, T.; Wang, K. The economic impact of climate change: A bibliometric analysis of research hotspots and trends. Environ. Sci. Pollut. Res. 2023, 30, 47935–47955. [Google Scholar] [CrossRef]
  28. Lilliestam, J.; Patt, A.; Bersalli, G. The effect of carbon pricing on technological change for full energy decarbonization: A review of empirical ex-post evidence. Wiley Interdiscip. Rev.-Clim. Change 2021, 12, e681. [Google Scholar] [CrossRef]
  29. van den Bergh, J.; Savin, I. Impact of carbon pricing on low-carbon innovation and deep decarbonisation: Controversies and path forward. Environ. Resour. Econ. 2021, 80, 705–715. [Google Scholar] [CrossRef]
  30. Raza, Z. Effects of regulation-driven green innovations on short sea shipping’s environmental and economic performance. Transp. Res. D Transp. Environ. 2020, 84, 102340. [Google Scholar] [CrossRef]
  31. Lim, S.; Prakash, A. Does carbon pricing spur climate innovation? A panel study, 1986–2019. J. Clean. Prod. 2023, 395, 136459. [Google Scholar] [CrossRef]
  32. Jung, H.; Song, C. Effects of emission trading scheme (ETS) on change rate of carbon emission. Sci. Rep. 2023, 13, 912. [Google Scholar] [CrossRef] [PubMed]
  33. Gillingham, K.; Carattini, S.; Esty, D. Lessons from first campus carbon-pricing scheme. Nature 2017, 551, 27–29. [Google Scholar] [CrossRef]
  34. Calel, R.; Dechezleprêtre, A. Environmental policy and directed technological change: Evidence from the european carbon market. Rev. Econ. Stat. 2016, 98, 173–191. [Google Scholar] [CrossRef]
  35. Baranzini, A.; van den Bergh, J.C.J.M.; Carattini, S.; Howarth, R.B.; Padilla, E.; Roca, J. Carbon pricing in climate policy: Seven reasons, complementary instruments, and political economy considerations. Wiley Interdiscip. Rev.-Clim. Change 2017, 8, e462. [Google Scholar] [CrossRef]
  36. Brauneis, A.; Mestel, R.; Palan, S. Inducing low-carbon investment in the electric power industry through a price floor for emissions trading. Energy Policy 2013, 53, 190–204. [Google Scholar] [CrossRef]
  37. Hoffmann, V.H. EU ETS and investment decisions: The case of the German electricity industry. Eur. Manag. J. 2007, 25, 464–474. [Google Scholar] [CrossRef]
  38. Lilliestam, J.; Patt, A.; Bersalli, G. On the quality of emission reductions: Observed effects of carbon pricing on investments, innovation, and operational shifts. A response to van den Bergh and Savin. Environ. Resour. Econ. 2022, 83, 733–758. [Google Scholar] [CrossRef]
  39. Zhang, J.; Li, H.; Chen, W.; Liu, Y. The transformation of global climate governance: Mechanisms, challenges and China’s role. Sustainability 2025, 17, 963. [Google Scholar]
  40. Weng, Z.; Ma, Z.; Xie, Y.; Cheng, C. Effect of China’s carbon market on the promotion of green technological innovation. J. Clean. Prod. 2022, 373, 133789. [Google Scholar] [CrossRef]
  41. Zhou, F.; Wang, X. The carbon emissions trading scheme and green technology innovation in China: A new structural economics perspective. Econ. Anal. Policy 2022, 74, 365–381. [Google Scholar] [CrossRef]
  42. Liu, M.; Shan, Y.; Li, Y. Study on the effect of carbon trading regulation on green innovation and heterogeneity analysis from China. Energy Policy 2022, 171, 113290. [Google Scholar] [CrossRef]
  43. Cong, J.; Zhang, W.; Guo, H.; Zhao, Y. Possible green-technology innovation motivated by China’s pilot carbon market: New evidence from city panel data. Clim. Policy 2023, 24, 558–571. [Google Scholar] [CrossRef]
  44. Xie, L.; Zhou, Z.; Hui, S. Does environmental regulation improve the structure of power generation technology? Evidence from China’s pilot policy on the carbon emissions trading market (CETM). Technol. Forecast. Soc. Change 2022, 176, 121428. [Google Scholar] [CrossRef]
  45. Tan, R.; Lin, B. The long term effects of carbon trading markets in China: Evidence from energy intensive industries. Sci. Total Environ. 2022, 806, 150311. [Google Scholar] [CrossRef] [PubMed]
  46. Zhou, B.; Zhang, C.; Song, H.; Wang, Q. How does emission trading reduce China’s carbon intensity? An exploration using a decomposition and difference-in-differences approach. Sci. Total Environ. 2019, 676, 514–523. [Google Scholar] [CrossRef]
  47. Kong, Y.; Zhao, T.; Yuan, R.; Chen, C. Allocation of carbon emission quotas in Chinese provinces based on equality and efficiency principles. J. Clean. Prod. 2019, 211, 222–232. [Google Scholar] [CrossRef]
  48. Chen, H.; Kang, J.-N.; Liao, H.; Tang, B.-J.; Wei, Y.-M. Costs and potentials of energy conservation in China’s coal-fired power industry: A bottom-up approach considering price uncertainties. Energy Policy 2017, 104, 23–32. [Google Scholar] [CrossRef]
  49. Liu, X.; Fan, Y.; Li, C. Carbon pricing for low carbon technology diffusion: A survey analysis of China’s cement industry. Energy 2016, 106, 73–86. [Google Scholar] [CrossRef]
  50. Liu, B.; Sun, Z.; Li, H. Can carbon trading policies promote regional green innovation efficiency? Empirical data from pilot regions in China. Sustainability 2021, 13, 2891. [Google Scholar] [CrossRef]
  51. Guo, J.; Li, C. Does China’s carbon emissions trading policy improve enterprise green innovation? Financ. Res. Lett. 2024, 69, 106214. [Google Scholar] [CrossRef]
  52. Zhu, J.; Fan, Y.; Deng, X.; Xue, L. Low-carbon innovation induced by emissions trading in China. Nat. Commun. 2019, 10, 4088. [Google Scholar] [CrossRef] [PubMed]
  53. Li, C.; Yang, X.; Xu, H.; Ju, H. The impacts of different environmental regulations on firm’s performance in China based on R&D investment, environmental innovation and non-environmental innovation. Technol. Anal. Strateg. Manag. 2024, 1–13. [Google Scholar] [CrossRef]
  54. Guo, L.; Feng, C. Are there spillovers among China’s pilots for carbon emission allowances trading? Energy Econ. 2021, 103, 105574. [Google Scholar] [CrossRef]
  55. Cao, X.; Su, X. Has the carbon emissions trading pilot policy promoted carbon neutrality technology innovation? China Popul. Resour. Environ. 2023, 33, 94–104. [Google Scholar]
  56. Deng, M.; Zhang, W. Recognition and analysis of potential risks in China’s carbon emission trading markets. Adv. Clim. Change Res. 2019, 10, 30–46. [Google Scholar] [CrossRef]
  57. Wang, F.; Jiang, T.; Guo, X. Government quality, environmental regulation and enterprise green technology innovation. Sci. Res. Manag. 2018, 39, 26–33. [Google Scholar]
  58. Zhang, W.; Li, G.; Guo, F. Does carbon emissions trading promote green technology innovation in China? Appl. Energy 2022, 315, 119012. [Google Scholar] [CrossRef]
  59. Zhang, X.; Zhang, D.; Yu, R. Theory and practice of national carbon market design with Chinese characteristics. Manag. World 2021, 37, 80–95. [Google Scholar]
  60. Chang, H.; Zhao, Y. The impact of carbon trading on the “quantity” and “quality” of green technology innovation: A dynamic QCA analysis based on carbon trading pilot areas. Environ. Innov. Soc. Transit. 2024, 43, 25668. [Google Scholar] [CrossRef]
  61. Lin, S.; Wang, B.; Wu, W.; Qi, S. The potential influence of the carbon market on clean technology innovation in China. Clim. Policy 2017, 18 (Suppl. 1), 71–89. [Google Scholar] [CrossRef]
  62. Markowitz, H. The utility of wealth. J. Polit. Econ. 1952, 60, 151–158. [Google Scholar] [CrossRef]
  63. Wüstenhagen, R.; Menichetti, E. Strategic choices for renewable energy investment: Conceptual framework and opportunities for further research. Energy Policy 2012, 40, 1–10. [Google Scholar] [CrossRef]
  64. Toda, H.Y.; Phillips, P.C. Vector autoregressions and causality. Econometrica 1993, 61, 1367–1393. [Google Scholar] [CrossRef]
  65. Sims, C.A.; Stock, J.H.; Watson, M.W. Inference in linear time series models with some unit roots. Econometrica 1990, 58, 113–144. [Google Scholar] [CrossRef]
  66. Shukur, G.; Mantalos, P. A simple investigation of the Granger-causality test in integrated cointegrated VAR systems. J. Appl. Stat. 2000, 27, 1021–1031. [Google Scholar] [CrossRef]
  67. Shukur, G.; Mantalos, P. Size and power of the RESET test as applied to systems of equations: A bootstrap approach. J. Mod. Appl. Stat. Methods 2004, 3, 370–385. [Google Scholar] [CrossRef]
  68. Wang, S.; Liu, J.; Qin, X. Financing constraints, carbon emissions and high-quality urban development: Empirical evidence from 290 cities in China. Int. J. Environ. Res. Public Health 2022, 19, 2386. [Google Scholar] [CrossRef]
  69. Zhang, P.; Qi, J. Carbon emission regulation and corporate financing constraints: A quasi-natural experiment based on China’s carbon emissions trading mechanism. J. Contemp. Account. Econ. 2025, 21, 100452. [Google Scholar] [CrossRef]
  70. Wu, Y.; Liu, X.; Tang, C. Carbon Market and corporate financing behavior: From the perspective of constraints and demand. Econ. Anal. Policy 2024, 81, 873–889. [Google Scholar] [CrossRef]
  71. Andrews, D.W. Tests for parameter instability and structural change with unknown change point. Econometrica 1993, 61, 821–856. [Google Scholar] [CrossRef]
  72. Andrews, D.W.; Ploberger, W. Optimal tests when a nuisance parameter is present only under the alternative. Econometrica 1994, 62, 1383–1414. [Google Scholar] [CrossRef]
  73. Nyblom, J. Testing for the constancy of parameters over time. J. Am. Stat. Assoc. 1989, 84, 223–230. [Google Scholar] [CrossRef]
  74. Hansen, B.E. Tests for parameter instability in regressions with I(1) processes. J. Bus. Econ. Stat. 1992, 10, 321–335. [Google Scholar]
  75. Balcilar, M.; Ozdemir, Z.A.; Arslanturk, Y. Economic growth and energy consumption causal nexus viewed through a bootstrap rolling window. Energy Econ. 2010, 32, 1398–1410. [Google Scholar] [CrossRef]
  76. Su, C.; Liu, X.; Qin, M.; Umar, M. Is the uncertainty economic policy an impediment or an impetus to technological innovation? Emerging Mark. Financ. Trade 2024, 60, 2579–2593. [Google Scholar]
  77. Wu, C.; Xu, C.; Zhao, Q.; Lin, S. Research on financing strategy of low-carbon supply chain based on cost-sharing contract. Environ. Sci. Pollut. Res. 2022, 29, 48358–48375. [Google Scholar] [CrossRef]
  78. Jaffe, A.B.; Peterson, S.R.; Portney, P.R.; Stavins, R.N. Environmental regulation and the competitiveness of US manufacturing: What does the evidence tell us? J. Econ. Lit. 1995, 33, 132–163. [Google Scholar]
  79. Niu, S.; Zhang, J.; Luo, R.; Feng, Y. How does climate policy uncertainty affect green technology innovation at the corporate level? New evidence from China. Environ. Res. 2023, 237, 117003. [Google Scholar] [CrossRef]
  80. Sun, G.; Fang, J.; Li, T.; Ai, Y. Effects of climate policy uncertainty on green innovation in Chinese enterprises. Int. Rev. Financ. Anal. 2024, 91, 102960. [Google Scholar] [CrossRef]
  81. Wang, L.; Wen, Y.; Zhang, Y. The impact of EU carbon border adjustment mechanism on China’s export and its countermeasures. Glob. Energy Interconnect. 2025, 8, 205–212. [Google Scholar] [CrossRef]
  82. Zhong, J.; Pei, J. Carbon border adjustment mechanism: A systematic literature review of the latest developments. Clim. Policy 2023, 24, 228–242. [Google Scholar] [CrossRef]
  83. Xu, L.; Yang, J.; Cheng, J.; Dong, H. How has China’s low-carbon city pilot policy influenced its CO2 abatement costs? Analysis from the perspective of the shadow price. Energy Econ. 2022, 115, 106353. [Google Scholar] [CrossRef]
  84. Agan, B. Sustainable development through green transition in EU countries: New evidence from panel quantile regression. J. Environ. Manag. 2024, 365, 121545. [Google Scholar] [CrossRef] [PubMed]
  85. Borghesi, S.; Cainelli, G.; Mazzanti, M. Linking emission trading to environmental innovation: Evidence from the Italian manufacturing industry. Res. Policy 2015, 44, 669–683. [Google Scholar] [CrossRef]
  86. Nie, Q.; Zhang, L.; Tong, Z.; Dai, G.; Chai, J. Cost compensation method for PEVs participating in dynamic economic dispatch based on carbon trading mechanism. Energy 2022, 239, 121704. [Google Scholar] [CrossRef]
  87. Valero-Gil, J.; Surroca, J.A.; Tribo, J.A.; Gutierrez, L.; Montiel, I. Innovation vs. standardization: The conjoint effects of eco-innovation and environmental management systems on environmental performance. Res. Policy 2023, 52, 104737. [Google Scholar] [CrossRef]
  88. Cainelli, G.; D’Amato, A.; Mazzanti, M. Resource efficient eco-innovations for a circular economy: Evidence from EU firms. Res. Policy 2020, 49, 103827. [Google Scholar] [CrossRef]
  89. Ibikunle, G.; Gregoriou, A.; Hoepner, A.G.F.; Rhodes, M. Liquidity and market efficiency in the world’s largest carbon market. Br. Account. Rev. 2016, 48, 431–447. [Google Scholar] [CrossRef]
  90. Habiba, U.; Xinbang, C.; Anwar, A. Do green technology innovations, financial development, and renewable energy use help to curb carbon emissions? Renew. Energy 2022, 193, 1082–1093. [Google Scholar] [CrossRef]
  91. Song, A.; Rasool, Z.; Nazar, R.; Anser, M.K. Towards a greener future: How green technology innovation and energy efficiency are transforming sustainability. Energy 2024, 290, 129891. [Google Scholar] [CrossRef]
  92. Van den Heuvel, S.; Gozgor, G.; Koengkan, M.; Lau, M.C.K.; Paramati, S.R.; Sheng, X. The dynamic effects of climate policy uncertainty: A machine learning approach. J. Clean. Prod. 2024, 434, 140123. [Google Scholar]
  93. Aghion, P.; Dechezleprêtre, A.; Hémous, D.; Martin, R.; Van Reenen, J. Climate policy and innovation: Evidence from the auto industry. Am. Econ. Rev. 2022, 112, 1917–1944. [Google Scholar]
  94. Dogan, E.; Madaleno, M. Oil prices, carbon emissions, and the Porter Hypothesis: A global perspective. Econ. Model. 2024, 131, 106614. [Google Scholar]
  95. Kocaarslan, B.; Soytaş, U. Do oil prices predict carbon prices? New evidence from G7 and BRICS. Energy Econ. 2023, 118, 106504. [Google Scholar]
  96. Sohag, K.; Chukavina, K.; Samargandi, N. Oil price shocks and green innovation: The role of political institutions. Renew. Sustain. Energy Rev. 2023, 184, 113555. [Google Scholar]
Figure 1. The dual-channel mechanism of CP’s influence on GTI.
Sustainability 17 05371 g001
Figure 2. The trends of CP and GTI.
Sustainability 17 05371 g002
Figure 3. The trend of FCs.
Sustainability 17 05371 g003
Figure 4. p-values testing the null hypothesis that CP does not Granger-cause GTI. Notes: Black line indicates significance threshold at p = 0.1; Reject H0 if p < 0.1 with significant causality.
Sustainability 17 05371 g004
Figure 5. The coefficients for the effect of CP on GTI. Notes: Black line denotes the reference line where coefficients equal zero; Blue line above zero: positive effect. Below zero: negative effect.
Sustainability 17 05371 g005
Figure 6. p-Values testing the null hypothesis that GTI does not Granger-cause CP. Notes: Black line indicates significance threshold at p = 0.1; Reject H0 if p < 0.1 with significant causality.
Sustainability 17 05371 g006
Figure 7. The coefficients for the effect of GTI on CP. Notes: Black line denotes the reference line where coefficients equal zero; Blue line above zero: positive effect. Below zero: negative effect.
Sustainability 17 05371 g007
Figure 8. p-values testing the null hypothesis that CP does not Granger-cause GTI in the robustness check. Notes: Black line indicates significance threshold at p = 0.1; Reject H0 if p < 0.1 with significant causality.
Sustainability 17 05371 g008
Figure 9. The coefficients for the effect of CP on GTI in the robustness check. Notes: Black line denotes the reference line where coefficients equal zero; Blue line above zero: positive effect. Below zero: negative effect.
Sustainability 17 05371 g009
Figure 10. p-values testing the null hypothesis that GTI does not Granger-cause CP in the robustness check. Notes: Black line indicates significance threshold at p = 0.1; Reject H0 if p < 0.1 with significant causality.
Sustainability 17 05371 g010
Figure 11. The coefficients for the effect of GTI on CP in the robustness check. Notes: Black line denotes the reference line where coefficients equal zero; Blue line above zero: positive effect. Below zero: negative effect.
Sustainability 17 05371 g011
Table 1. Descriptive statistics for CP and GTI.
MeanMedianMaximumMinimumStandard DeviationSkewnessKurtosisJarque–Bera
CP53.75548.00096.00022.00019.9070.5372.19210.467 ***
GTI2582.7122139.0004349.0001216.000872.7560.6001.90415.302 ***
FC1,530,099.0001,443,055.0002,583,669.000694,962.200575,680.8000.2861.79810.256 ***
Notes: *** Significance at the 1% level.
Table 2. Full-sample Granger causality tests.
TestsH0: CP Does Not Granger-Cause GTIH0: GTI Does Not Granger-Cause CP
Statisticsp-ValueStatisticsp-Value
Bootstrap LR test10.4950.0405.2750.270
Notes: p-values were calculated from 10,000 bootstrap repetitions.
Table 3. The parameter stability test.
TestsCPGTIVAR System
Statisticsp-ValueStatisticsp-ValueStatisticsp-Value
Sup-F24.332 ***0.003102.902 ***0.00049.192 ***0.000
Ave-F8.912 **0.02028.814 ***0.00021.282 ***0.000
Exp-F15.534 **0.01457.312 ***0.00036.346 ***0.000
Lc 5.391 ***0.000
Notes: p-values were computed from 10,000 bootstrap iterations. *** Significance at the 1% level. ** Significance at the 5% level.
Disclaimer/Publisher’s Note: The statements, opinions and data contained in all publications are solely those of the individual author(s) and contributor(s) and not of MDPI and/or the editor(s). MDPI and/or the editor(s) disclaim responsibility for any injury to people or property resulting from any ideas, methods, instructions or products referred to in the content.

