Article

Simulating Energy Balance Dynamics to Support Sustainability in a Seasonally Dry Tropical Forest in Semi-Arid Northeast Brazil

by
Rosaria R. Ferreira
1,
Keila R. Mendes
1,
Pablo E. S. Oliveira
1,2,
Pedro R. Mutti
1,2,
Demerval S. Moreira
3,
Antonio C. D. Antonino
4,
Rômulo S. C. Menezes
4,
José Romualdo S. Lima
5,
João M. Araújo
6,
Valéria L. Amorim
7,
Nikolai S. Espinoza
8,
Bergson G. Bezerra
1,2,
Cláudio M. Santos e Silva
1,2,9,* and
Gabriel B. Costa
1,7,10,11,12
1
Climate Sciences Post-Graduate Program, Federal University of Rio Grande do Norte, Av. Senador Salgado Filho, 3000, Lagoa Nova, Natal 59078-970, Brazil
2
Department of Atmospheric and Climate Sciences, Federal University of Rio Grande do Norte, Natal 59078-970, Brazil
3
Faculty of Sciences, São Paulo State University “Julio Mesquita Filho”, Av. Engenheiro Luis Edmundo Carrijo Coube, 2085, Bauru 17033-360, Brazil
4
Department of Nuclear Energy, Universidade Federal de Pernambuco, Recife 50740-545, Brazil
5
Graduate Program in Agricultural Production, Federal University of the Agreste of Pernambuco, Garanhuns 55302-000, Brazil
6
Physics Department, Federal University of Rio Grande do Norte, Av. Senador Salgado Filho, 3000, Lagoa Nova, Natal 59078-970, Brazil
7
Biosciences Post-Graduate Program (PPGBIO), Federal University of Western Pará (UFOPA), Santarém 68000-000, Brazil
8
Centro Gestor e Operacional do Sistema de Proteção da Amazônia (CENSIPAM), Manaus 69000-000, Brazil
9
Graduate Program in Environmental Sciences, Federal University of Pará, Belém 68000-000, Brazil
10
Postgraduate Program in Natural Resources of the Amazon—PPGRNA, Federal University of Western Pará (UFOPA), Santarém 68000-000, Brazil
11
Postgraduate Program in Forest Science, Technology and Innovation—PPGCTIF, Federal University of Western Pará (UFOPA), Santarém 68000-000, Brazil
12
Biotechnology and Biodiversity–Bionorte Network (REDE BIONORTE), Federal University of Western Pará (UFOPA), Santarém 68000-000, Brazil
*
Author to whom correspondence should be addressed.
Sustainability 2025, 17(12), 5350; https://doi.org/10.3390/su17125350
Submission received: 23 January 2025 / Revised: 21 March 2025 / Accepted: 3 April 2025 / Published: 10 June 2025

Abstract

:
In semi-arid regions, seasonally dry tropical forests are essential for regulating the surface energy balance, which can be analyzed by examining air heating processes and water availability control. The objective of this study was to evaluate the ability of the Brazilian Developments on the Regional Atmospheric Modelling System (BRAMS) model in simulating the seasonal variations of the energy balance components of the Caatinga biome. The surface measurements of meteorological variables, including air temperature and relative humidity, were also examined. To validate the model, we used data collected in situ using an eddy covariance system. In this work, we used the BRAMS model version 5.3 associated with the Joint UK Land Environment Simulator (JULES) version 3.0. The model satisfactorily represented the rainfall regime over the northeast region of Brazil (NEB) during the wet period. In the dry period, however, the coastal rainfall pattern over the NEB region was underestimated. In addition, the results showed that the surface fluxes linked to the energy balance in the Caatinga were impacted by the effects of rainfall seasonality in the region. The assessment of the BRAMS model’s performance demonstrated that it is a reliable tool for studying the dynamics of the dry forest in the region, providing valuable support for sustainable management and conservation efforts.

1. Introduction

In the context of climate change, future scenarios projected by dynamic models of the climate system indicate shifts in the rainfall regime of some regions of the planet, with an increasing trend of water scarcity mainly in semi-arid areas [1,2]. One important region of the earth that has been suffering from the impacts caused by climate change is Semi-arid Brazil (SEB), in which the Caatinga biome is the predominant vegetation cover [3,4,5]. The Caatinga is a tropical forest with seasonal dryness, found only in Brazil, covering about 12% of the country’s total land area [6]. The vegetation is characterized by the presence of xerophytes, deciduous and semideciduous species [7]. Caatinga plants have different morphophysiological adaptive mechanisms such as thorns, leathery leaves and highly efficient water use that helps reduce water loss through transpiration [8,9].
Changes in land use, linked to land degradation in the Caatinga, along with extreme drought events, could play a role in the desertification process in the SEB [10]. It is estimated that large Caatinga areas have already been degraded due to anthropogenic activities, including wood harvesting and agriculture [11,12,13]. This issue has been discussed by government agencies and the scientific community in search of strategies to mitigate damage caused to the Caatinga vegetation, providing the population with adaptation practices for the current and future climate [14,15,16].
The plant species of the Caatinga have their photosynthetic activity adapted to water-deficit conditions [17,18]. Thus, they can adjust their metabolism according to rainfall seasonality, reducing their activities during periods of water deficit and increasing the fixation of CO2 when rainfall occurs [19,20]. The resilience of the Caatinga biome concerning water availability is one of its structural and metabolic characteristics that differ from other biomes such as savannas. However, studies on the surface energy balance in the Caatinga are still scarce [21]. Thus, it is necessary to develop scientific research aimed at better understanding the functioning of the Caatinga as a way to preserve its biodiversity, assisting in political decision making to reduce the vulnerability of the SEB region.
The spatiotemporal variability and low accumulated rainfall in the SEB coupled with high evaporation rates can influence the sensible and latent heat fluxes, energy balance, albedo and carbon balance of the Caatinga [21,22]. To quantify surface radiation fluxes in this biome, studies were carried out using methods based on Bowen’s ratio [23], remote sensing [24,25] and the eddy covariance technique [26]. Despite existing studies, uncertainties remain regarding many processes at the Caatinga, primarily due to the numerous biophysical factors that can cause variations in atmospheric patterns across different locations within the biome. To minimize these uncertainties, micrometeorological measurements are essential to gain a deeper understanding of the environmental specifics, validate models of biosphere–atmosphere interactions and remote sensing products, and serve various other purposes [27], such as the use in dynamic modeling of the climate system and regional modeling, focusing on a parameterization of the soil-vegetation-atmosphere interface (SVAT) [16,28].
The SVAT models have evolved from simplified schemes to more reliable and robust representations of heat and mass exchange processes at the biosphere–atmosphere interface. This advancement has been driven by computational progress and the development of in situ experimental research, allowing the validation of simulated results [29]. In recent years, increasing concerns over climate change impacts and the need for more sustainable management of natural resources have driven the use of these models to gain a deeper understanding of energy balance dynamics and their influence on ecosystems [30,31,32].
However, the Caatinga, one of Brazil’s most threatened biomes, remains understudied regarding the dynamic modeling of its eco-physiological and climatic processes [18,33]. Environmental degradation and changes in the region’s energy balance may compromise its ecological resilience and the essential ecosystem services it provides to local populations, including hydrological cycle regulation and biodiversity maintenance [26,34,35]. To address this gap, this study seeks to analyze the patterns of behavior of energy balance components in the Caatinga by integrating in situ measurements with a regional dynamic model, contributing to environmental monitoring strategies and the sustainable use of natural resources.
Dynamic modeling was chosen for its ability to more accurately represent the temporal and spatial variability of energy fluxes, enabling a detailed analysis of the physical processes governing the energy balance and their relationship with the sustainability of semi-arid ecosystems [1,13,30]. Understanding energy exchange processes and the impacts of climatic variations can support the development of environmental policies aimed at mitigating the effects of desertification and promoting sustainable management practices for vegetation and water resources [10,33].
For this purpose, we employed the regional dynamic model Brazilian Developments on the Regional Atmospheric Modelling System (BRAMS) version 5.3 [36], an enhanced version of the Regional Atmospheric Modelling System (RAMS) [37], adapted to better represent the atmospheric conditions of Brazil and South America [38,39]. BRAMS was used in conjunction with the SVAT Joint UK Land Environment Simulator (JULES) version 3.0 [40], recognized for its advanced ability to simulate surface processes, including vegetation dynamics, carbon storage, soil moisture, photosynthesis and plant and soil respiration [41].
The use of regional dynamic models to simulate the energy balance in preserved areas of the Caatinga will provide accurate estimates of energy fluxes and balance components, adequately reflecting seasonal variations and the daily cycle of surface fluxes, contributing to the understanding of the energy behavior of this semi-arid biome in comparison to other Brazilian biomes, such as the Amazon [42,43] and the Cerrado [44]. Therefore, the main scientific questions are as follows: (1) Does the JULES-BRAMS model accurately represent the changes in energy fluxes observed in response to precipitation seasonality (higher H fluxes during the dry period and increase in LE fluxes during the wet period), particularly regarding the variability of energy fluxes across different seasons in the Caatinga? (2) How accurately does the JULES-BRAMS model represent essentia atmospheric variables, including air temperature, relative humidity and precipitation, in comparison to observational data and remote sensing products? (3) What are the main limitations of the current SVAT parameterization in the JULES-BRAMS model, and how can improvements in soil cover representation enhance the accuracy of energy balance simulations in seasonally dry tropical forests?

2. Material and Methods

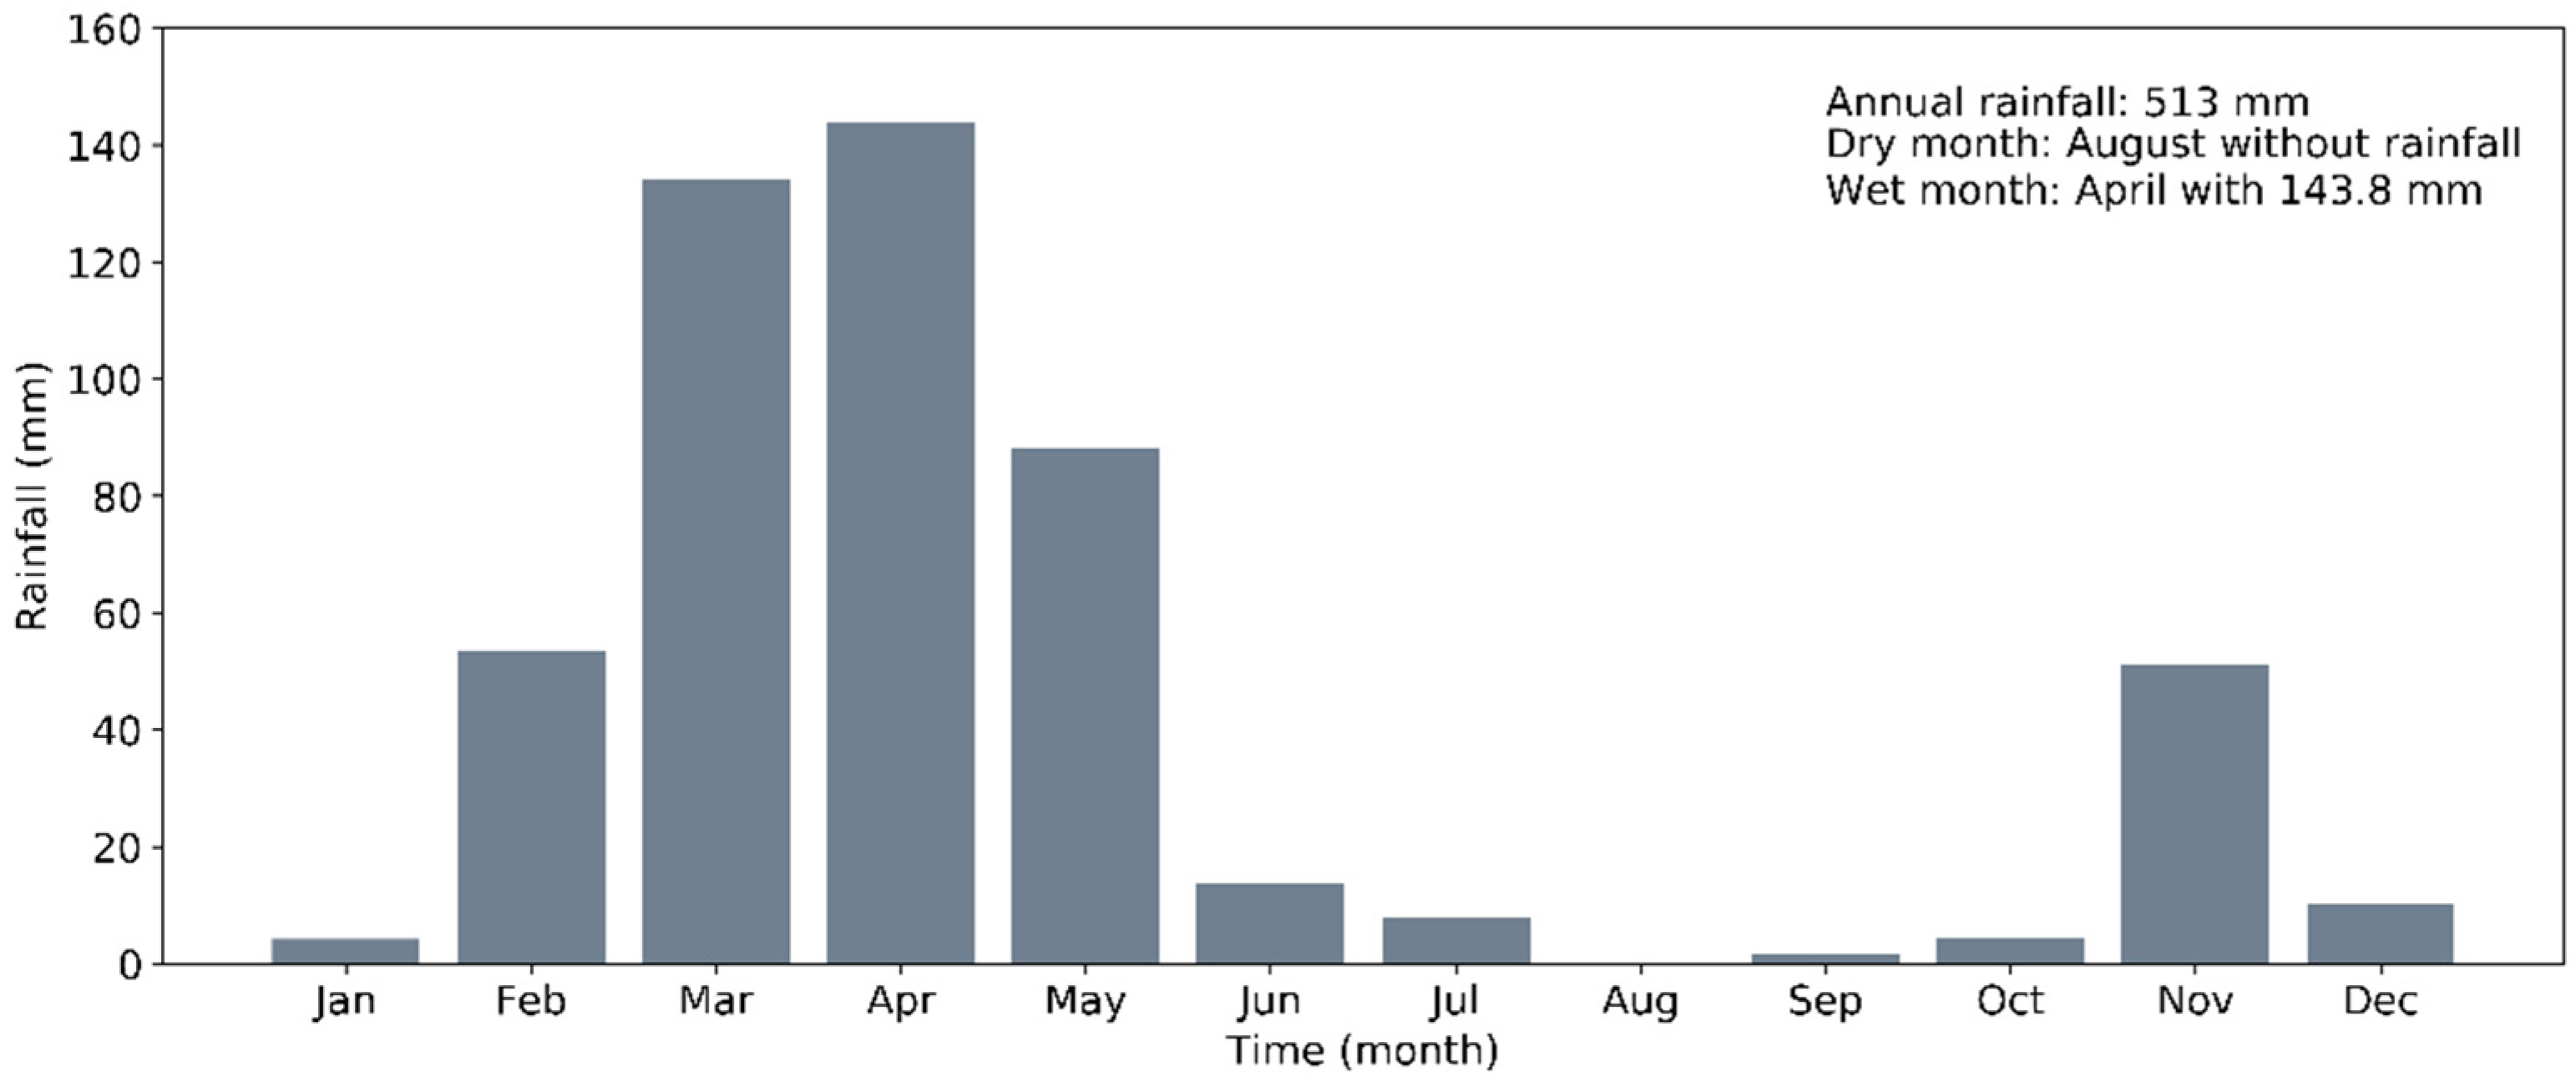
2.1. Description of the Experimental Area

The data used for the validation of the simulations are from a micrometeorological tower installed in an area of seasonally dry tropical forest (Caatinga) in the semi-arid region of Northeast Brazil (NEB) (6°34′4″ S 37°15′0″ W, 205 m above sea level), which consists of a fragment of preserved Caatinga in the Seridó Ecological Conservation Station (ESEC-Seridó) near the city of Serra Negra do Norte in the Rio Grande do Norte state (Figure 1). The data were collected using an eddy covariance system installed on an 11 m high micrometeorological tower used to measure heat and mass fluxes. The ESEC-Seridó is managed by the Chico Mendes Institute for Biodiversity Conservation (ICMBio) and the monitoring project of this biome is part of the National Observatory of Water and Carbon Dynamics in the Caatinga Biome network.
The climate of the tower’s installation site is tropical semi-arid (Bsh) according to the Köppen classification [45], with the wet season established from February to June and a mean annual rainfall of 700 mm [27]. The region has an annual average relative humidity of the air of 60% and an annual mean air temperature of 25 °C [10,46], ranging from 24.7 °C in the wet season to 32.2 °C in the dry–wet season in 2014 [47]. Most of the precipitation occurs during a 3–5 month wet season (from January to May), while the remaining 7–8 months experience an extended dry season (from June to December).
The vegetation in this area consists of deciduous and semi-deciduous species, forming a shrub–tree structure with an average height of approximately 8 m. The region primarily consists of sparsely distributed small trees, shrubs and herbaceous patches, which are predominantly present during the wet season (January to May) [48]. The dominant species in the area include xerophytic plants adapted to the harsh conditions of the semi-arid climate [48]. The study site’s soil is predominantly composed of Lithic Neosol, with sandy loam and sandy clay loam textures. The soils are shallow, rocky and characterized by low fertility and low water-holding capacity due to the limited organic matter content [49].

2.2. Observational Dataset

To evaluate the performance of the simulations in the Caatinga biome, we used a set of surface data composed of air temperature (Tair), relative humidity of the air (RH), sensible heat flux (H), latent heat flux (LE) and soil (G) heat fluxes, and net radiation (Rn). These data were collected at the ESEC-Seridó during the period from 1 January 2014 to 31 December 2015 [26]. However, we only used data from the same period of the simulation (April and August 2014, as defined in the following sections).
To determine rainfall patterns during the simulation period, we used three different datasets: (i) daily accumulated rainfall data from the Climate Prediction Center—National Oceanic and Atmospheric Administration (CPC-NOAA) [36]; (ii) daily accumulated rainfall estimated by the Tropical Rainfall Measuring Mission (TRMM) satellite [37]; (iii) gridded daily accumulated precipitation from the dataset elaborated by [38].
Each rainfall dataset was interpolated in a regular grid of 0.25° × 0.25° spacing. We decided to use these three distinct sets of rainfall data due to the differences in their characteristics. For example, the CPC and [36] datasets provide rainfall information over the continent only. The TRMM dataset on the other hand has rainfall information both over the continent and the ocean, thus allowing the verification of the positioning of rainfall areas associated with the Intertropical Convergence Zone (ITCZ) at the equatorial region. It is important to note that the ITCZ is the central atmospheric system responsible for rainfall in the experiment site region [22,39], and therefore, its adequate representation by the model is essential when interpreting the results.

2.3. Dynamic Regional Model

In this study, we used the Brazilian Developments on the Regional Atmospheric Modelling System (BRAMS) version 5.3 [40], an enhanced version of the Regional Atmospheric Modelling System (RAMS) [41], adapted to more accurately represent atmospheric conditions in Brazil and South America [44,45].
Our main focus was analyzing the surface variables simulated by the SVAT Joint UK Land Environment Simulator (JULES) version 3.0 [46], considered a state-of-the-art model for representing surface processes. JULES incorporates advanced formulations that enable the simulation of various processes, such as vegetation dynamics, carbon storage, soil moisture, photosynthesis and respiration in both plants and soil [47]. This model was implemented in BRAMS by [46], who evaluated the coupled JULES-BRAMS system in simulating carbon fluxes and various other surface variables across the Amazon Basin.
However, this is the first study to apply this modeling system in the Caatinga. The use of JULES-BRAMS in this semi-arid biome represents a significant advancement, enabling more robust estimates of energy balance components and a deeper comprehension of vegetation–atmosphere interactions in a region that has received limited attention from this type of modeling.

2.4. Numerical Experiments

The study area is situated in a semi-arid region, distinguished by a pronounced seasonal precipitation pattern. As shown in Figure 2, rainfall is highly concentrated in a short wet period, precipitation occurring from January to May, with a peak of 143.8 mm in April, followed by a prolonged dry season from June to December. The average annual precipitation varies between 300 mm and 1000 mm, with a significant reduction in rainfall during the dry months. No precipitation was observed in August, and a second peak of approximately 50 mm occurred in November, associated with the presence of a Cyclonic Vortex of High Levels (VCAN) [35], as previously reported by [47]. The combination of low precipitation and high evapotranspiration rates (1500–2000 mm per year) results in significant water stress, with the vegetation undergoing adaptive mechanisms such as leaf loss to manage the water deficit during the dry period. Based on this analysis, we selected April and August as the rainy and dry months, respectively, for the simulations.
Previous studies conducted in ESEC-Seridó [26,50] established a seasonal division for the year 2014, considering the rainfall behavior and the response of Caatinga vegetation, using the Enhanced Vegetation Index (EVI) and the Normalized Difference Vegetation Index (NDVI). In this context, we selected the months with the highest and lowest precipitation for the evaluation of the BRAMS model, since during the rainy season, Caatinga vegetation shows a rapid photosynthetic response and leaf expansion, maintaining these characteristics throughout the wet period. However, during the dry months, leaf loss occurs due to the water-deficit tolerance mechanism, causing the vegetation to enter a state of vegetative dormancy.
The first 10 days of the simulation were excluded from the analysis, as they correspond to the model’s spin-up time. Table 1 shows the initial and boundary conditions applied in the simulations, while Table 2 shows the main physical configurations and parameterizations adopted in the experiments, based on [51]. With these configurations, we aim to adequately represent the surface characteristics and atmospheric conditions of the Caatinga biome.

2.5. Analysis Tools

Data processing and statistical analysis were performed using the R software, version 4.2.3 (R Core Team, 2023). The BRAMS model’s performance in the Caatinga was evaluated using statistical metrics, comparing it with observational data from the ESEC-Seridó station. The following measures were used: root mean square error (RMSE), standard deviation (SD) and Pearson’s correlation coefficient (r). A graphical summary of the skill metrics was elaborated in the form of a Taylor diagram [63], showing the agreement between simulated and observed data.

3. Results

3.1. Assessing the Model’s Performance for Rainfall Patterns

The spatial distribution of rainfall in April simulated with the BRAMS model and obtained from other data sources is presented in Figure 3. The BRAMS model overestimated rainfall compared to the TRMM dataset, with differences exceeding 18 mm/day (Figure 3c), particularly in areas of Piauí and Ceará States (2° S 39° W; 8° S 45° W), coastal areas of NEB (between 12° and 16° S) and the southern Amazonian basin (8° S 50° W; 10° S 58° W) (Figure 3a). The spatial distribution of rainfall during the wet season indicates central, northern and coastal areas experienced the most rainfall due to convective clouds associated with the seasonal displacement of the ITCZ. Observed rainfall in August was scarce in central Brazil and NEB, with extensive areas devoid of rainfall. On the eastern NEB coast, observed rainfall exceeded 12 mm/day (Figure 4).
In ESEC-Seridó, the BRAMS model overestimated total accumulated rainfall and rainy days in April, showing 208.4 mm over 19 days, whereas rain gauge data indicated 93.2 mm over 12 days (Table 3). CPC-NOAA and TRMM datasets reported 14 and 16 rainy days, respectively, while the [37] dataset (107.5 mm), composed of in situ rainfall data, showded the closest value of accumulated precipitation in the ESEC-Seridó.

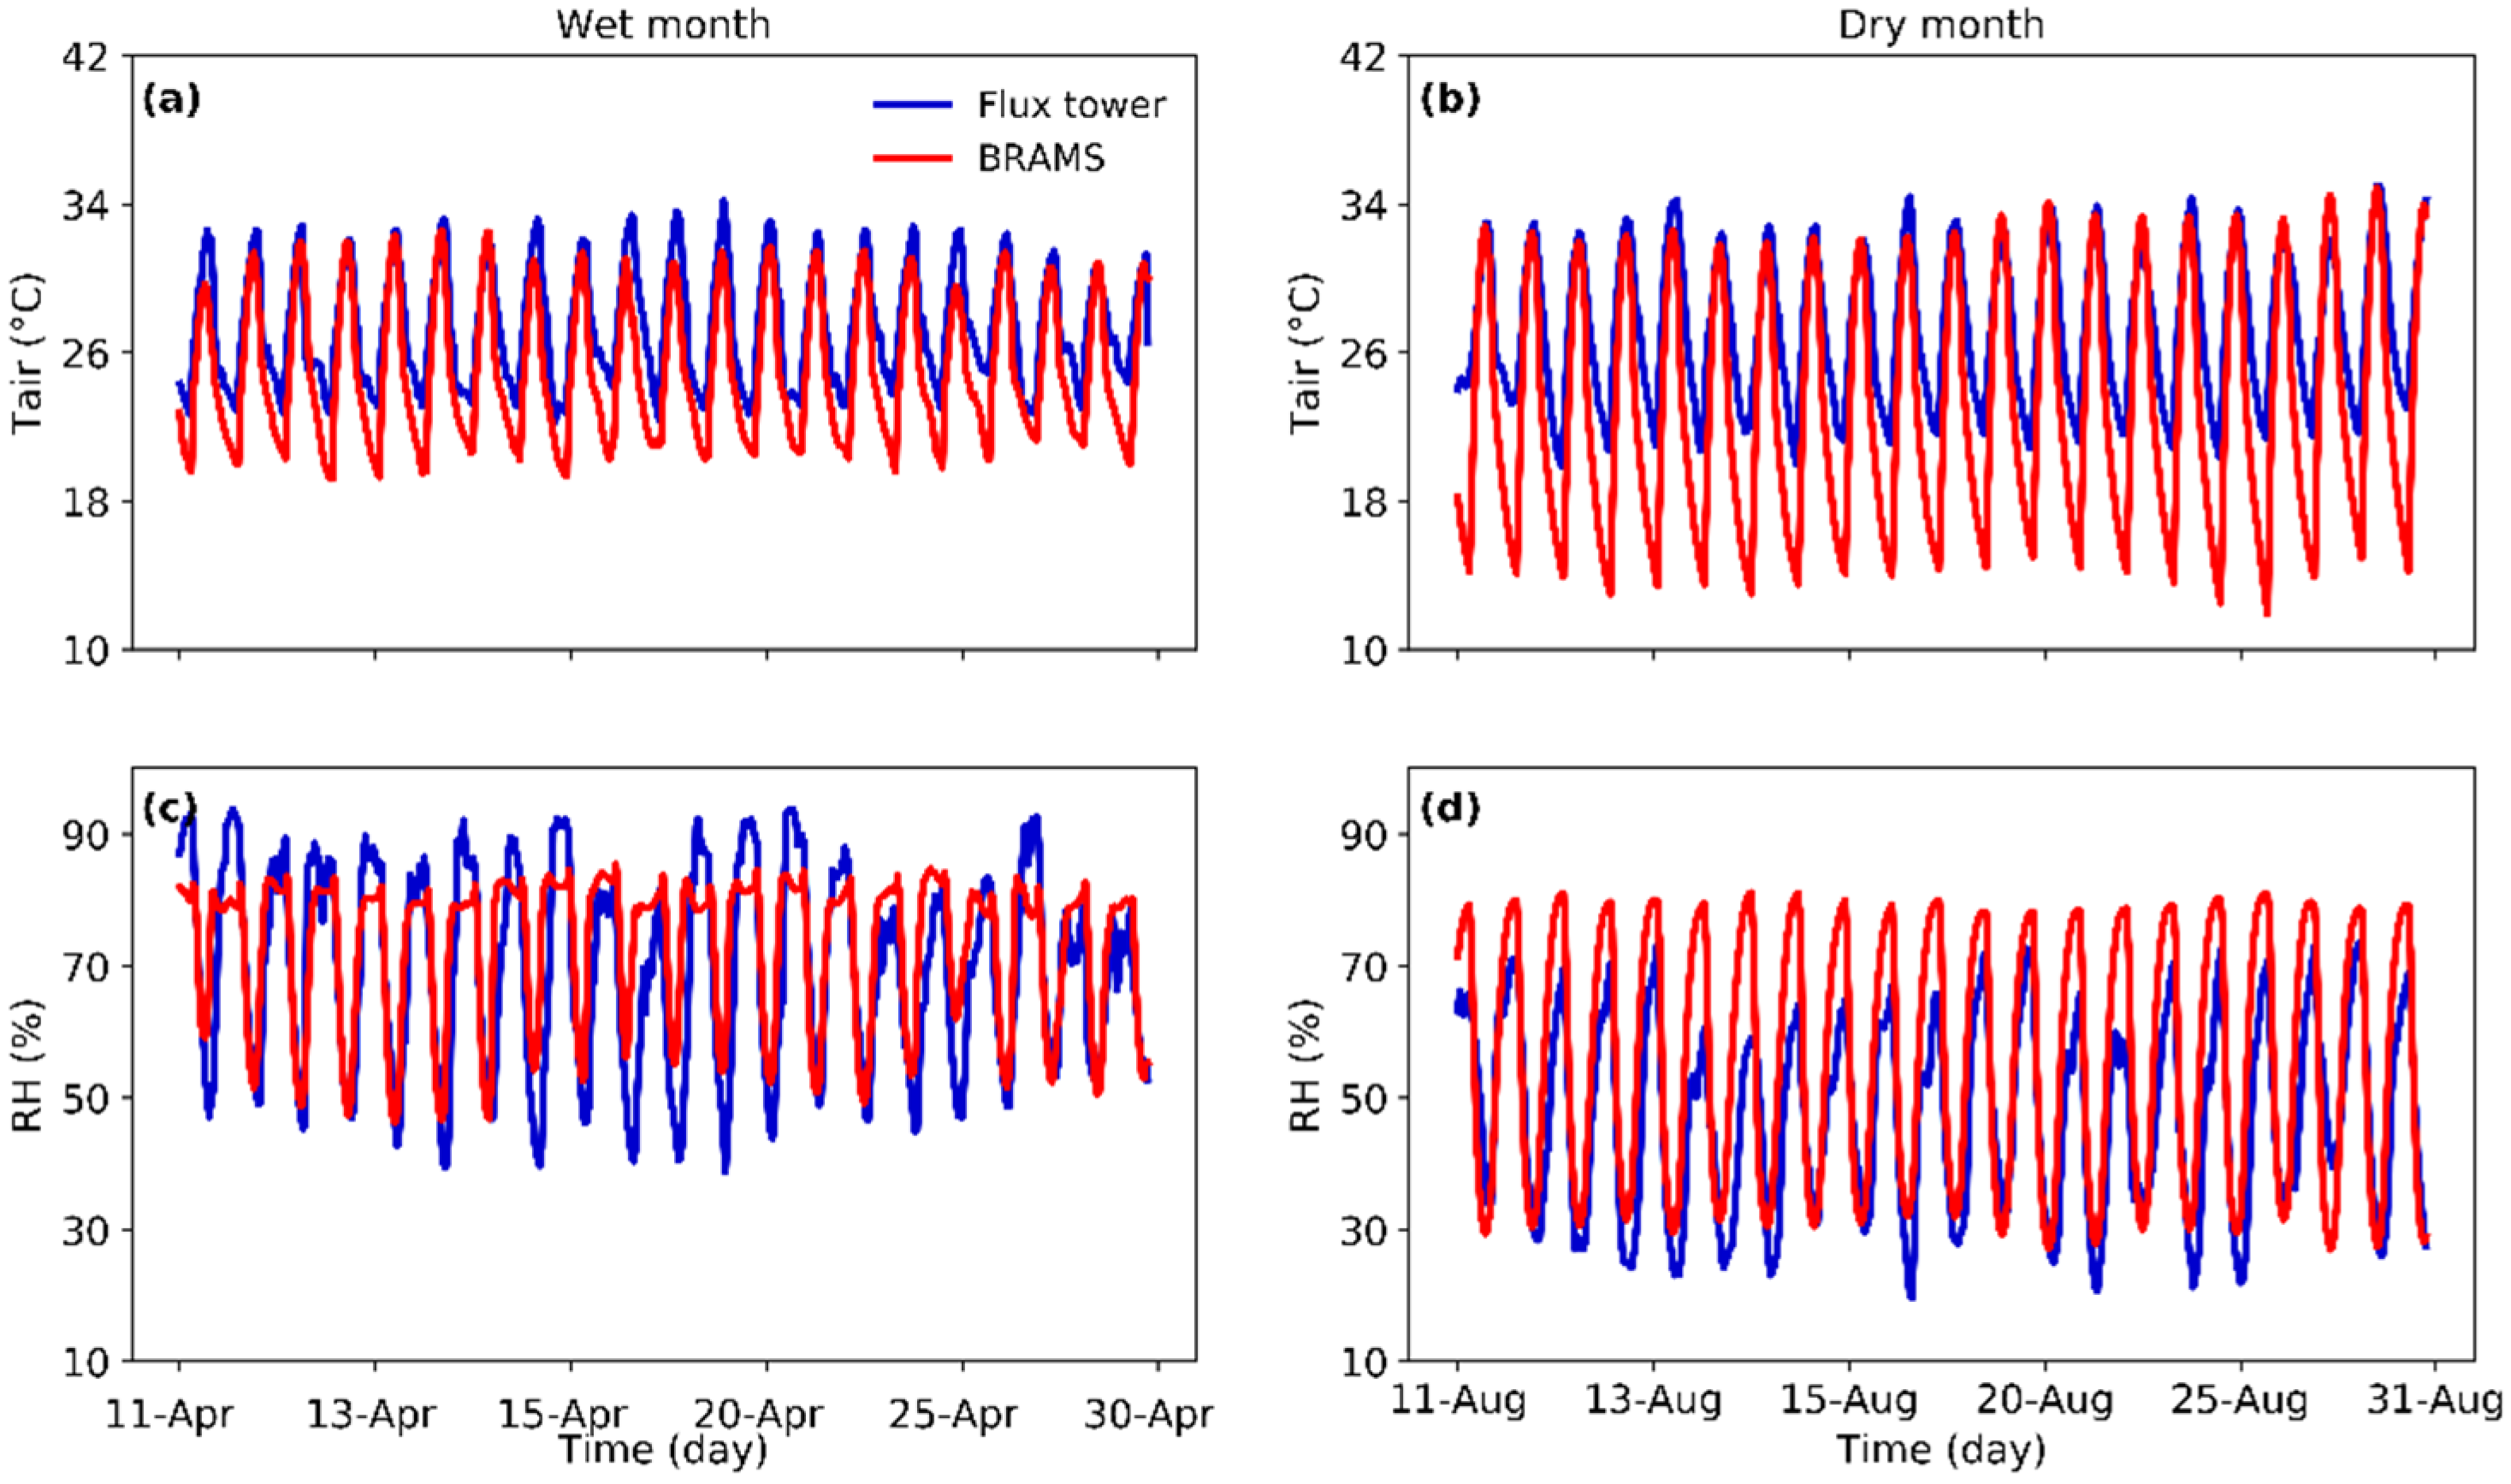
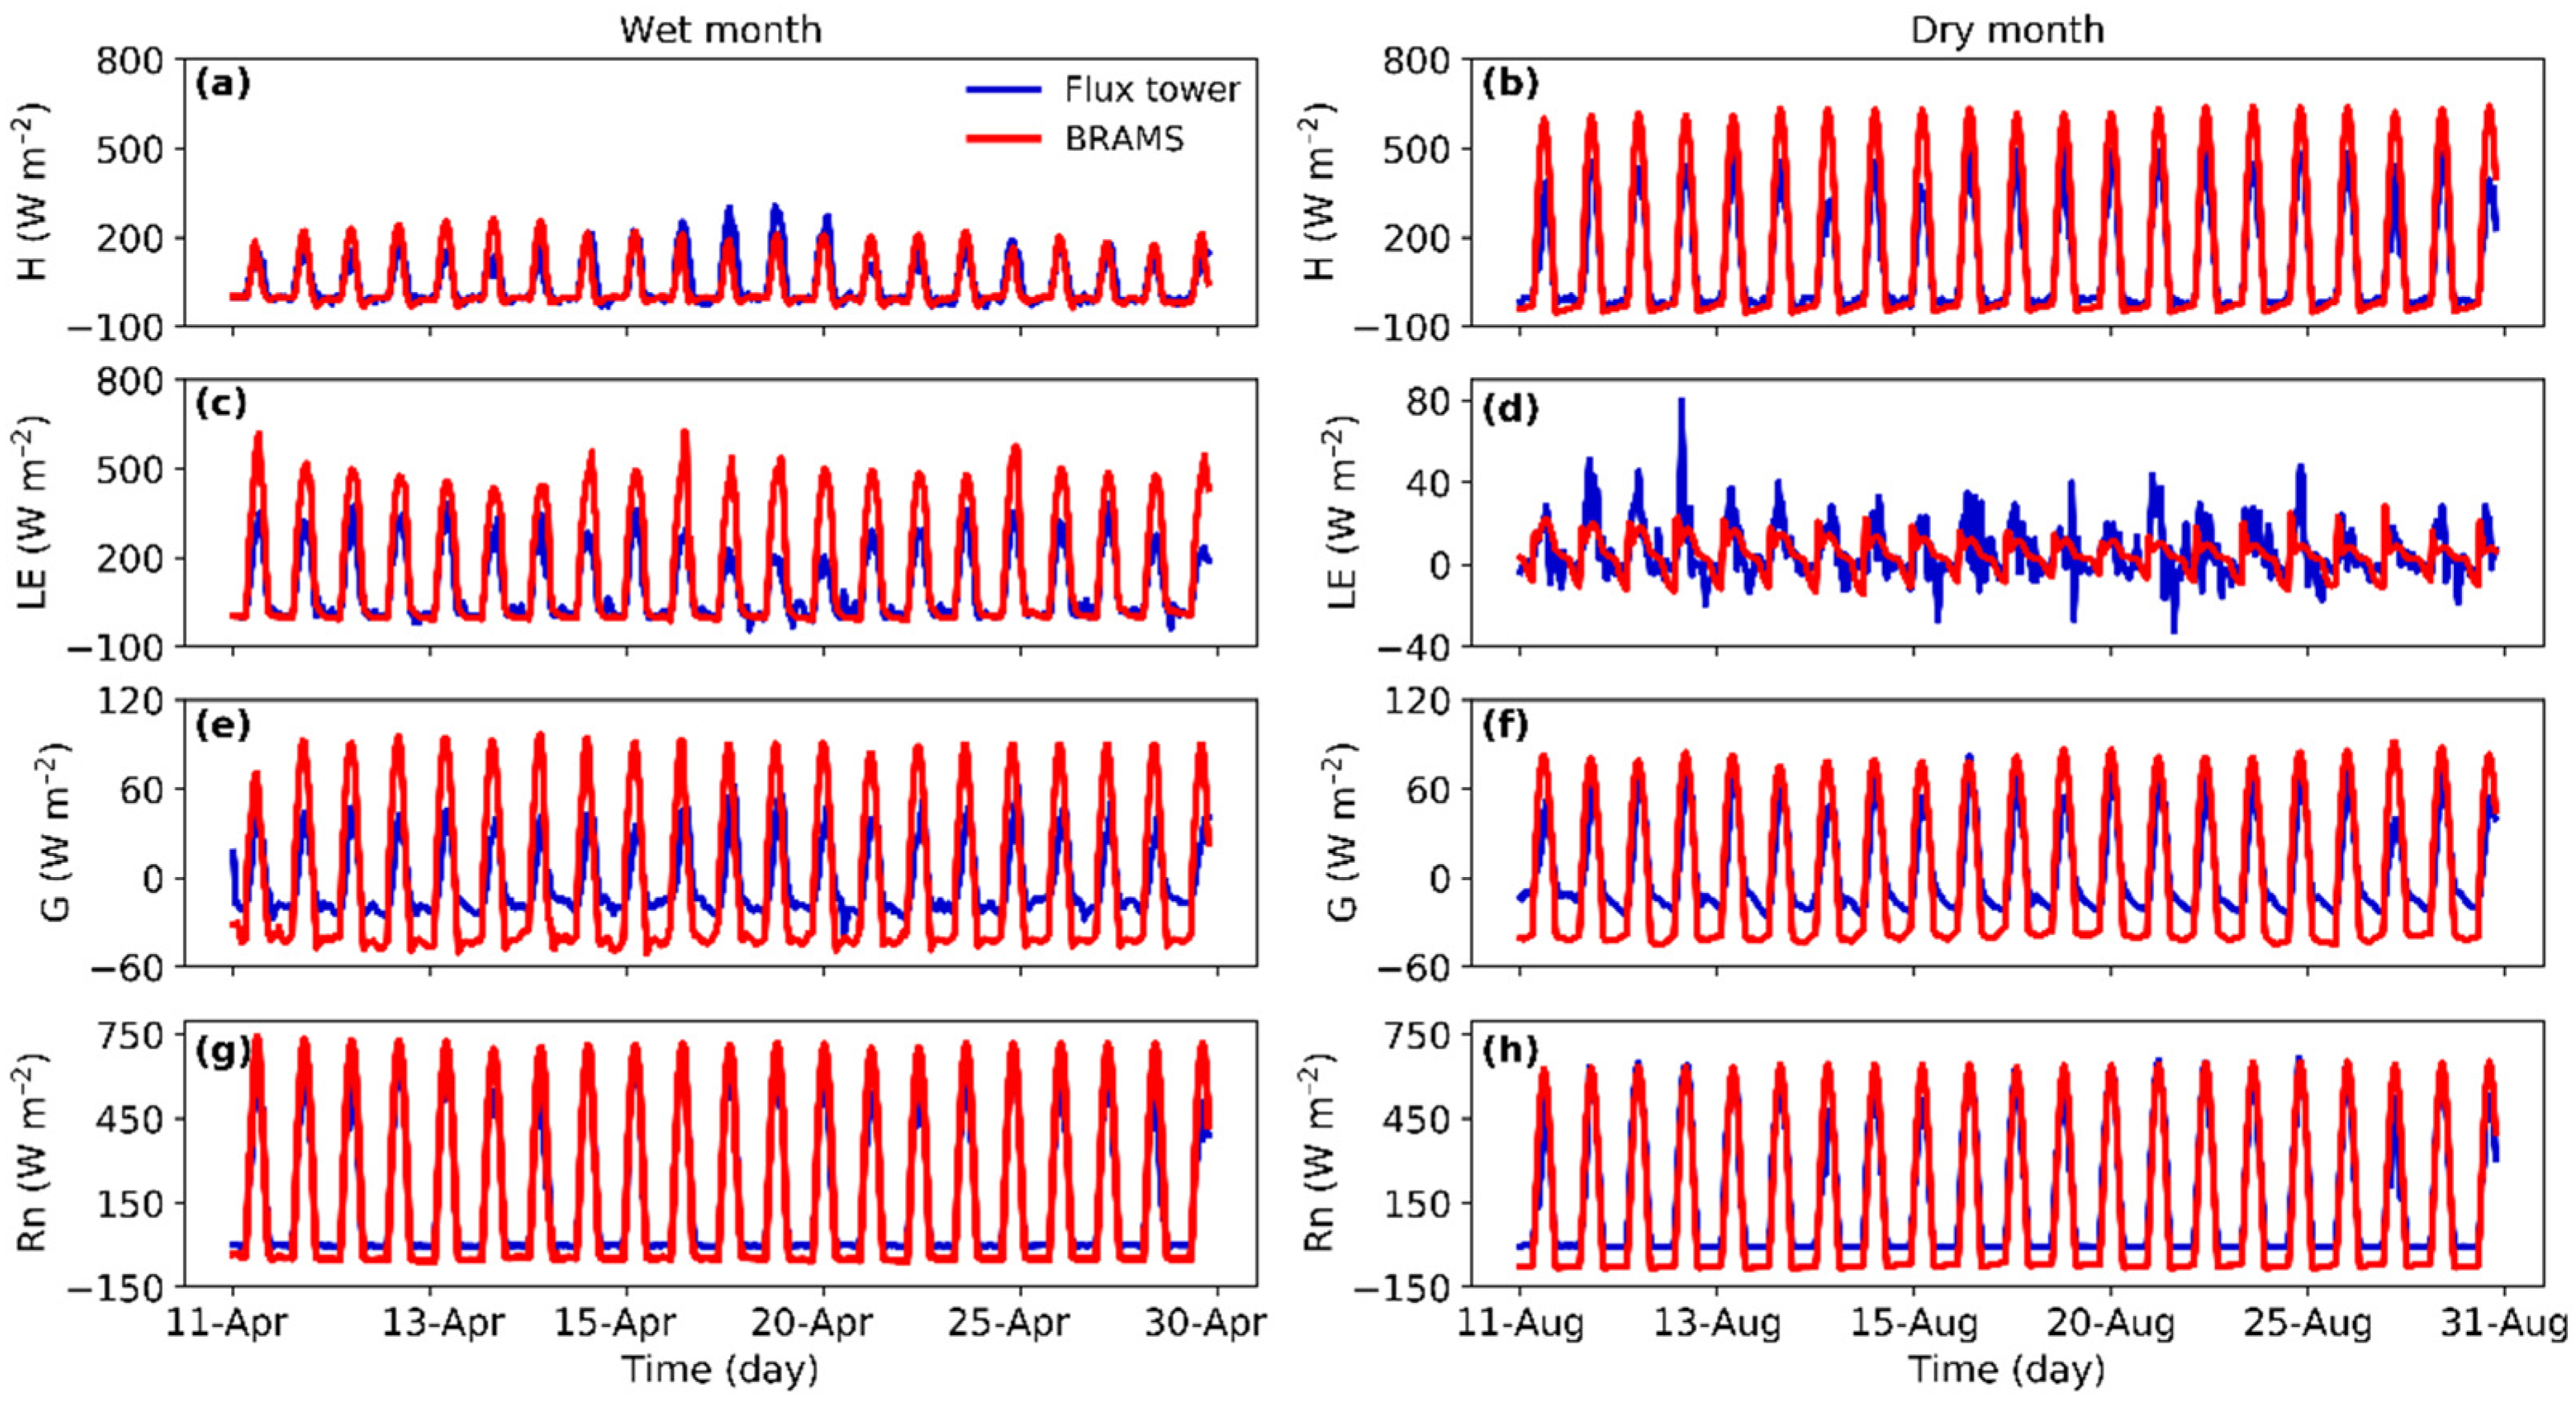
3.2. Surface Variables and Energy Fluxes

Figure 5 shows the simulated and observed daily time series of Tair and RH for the Caatinga biome during the wet and dry months. The model retrieved well-defined cycles both in the wet and dry periods for both variables (Figure 5). However, two systematic errors in the simulations were verified. During the dry period, the minimum temperatures below observed values and maximum RHs much higher than observed values. Additionally, during the wet period, the model underestimated the RH amplitude and the minimum values of temperature (Figure 5b,d).
The Tair maximums are well correlated with the minimum RH of the air in both seasons, with a greater temperature range in the dry season (~20 °C to 34 °C), while in the wet season, this range is reduced to between ~24 °C and 32 °C. The simulations show good correlations between the maximum Tair and the minimum RH with the data observed, both in the wet season and the dry season. The minimum Tair was underestimated in the dry and wet period, mainly in the dry season. Consequently, the minimum values of RH were overestimated.
The mean Tair value observed in April was 27.3 °C and in August it was 27.2 °C (Table 4); this shows that the temperature variability in the Caatinga biome throughout the year is extremely low. The BRAMS model, however, presented mean Tair values of 25.0 °C in April and 23.0 °C in August. Despite underestimating Tair, it can be seen that the model can adequately reproduce lower temperatures and higher standard deviations in the dry month. In the wet month, the mean observed RH was 69.3%, while the simulated mean was 72.4% (Table 4).
Simulated H fluxes closely matched observed values in April, with mean simulated fluxes of 43.1 W m−2 and observed values of 40.6 W m−2 (Table 5). Simulated LE fluxes were overestimated by 30% in April and underestimated by 40% in August (Figure 6). Observed LE peaks exceeded 400 W m−2 in April (Figure 6c), and during August, observed LE fluxes dropped significantly, with peak values below 100 W m−2 (Figure 6). BRAMS overestimated G fluxes, particularly during April, attributed to deficiencies in soil moisture representation.
The numerical simulation was able to capture the Rn variability, and this was the surface variable which could be best represented by the BRAMS model on the Caatinga biome in both stations (Figure 6g,h). Furthermore, the time series showed that at night when there is a radiative loss over the surface, the Rn measured in the Caatinga showed an average value of around −4.5 W m−2, while the value estimated by BRAMS was −52.3 W m−2. The analysis of G fluxes simulated by the model showed an overestimation in relation to observed values, especially during the wet month (Figure 6e,f).

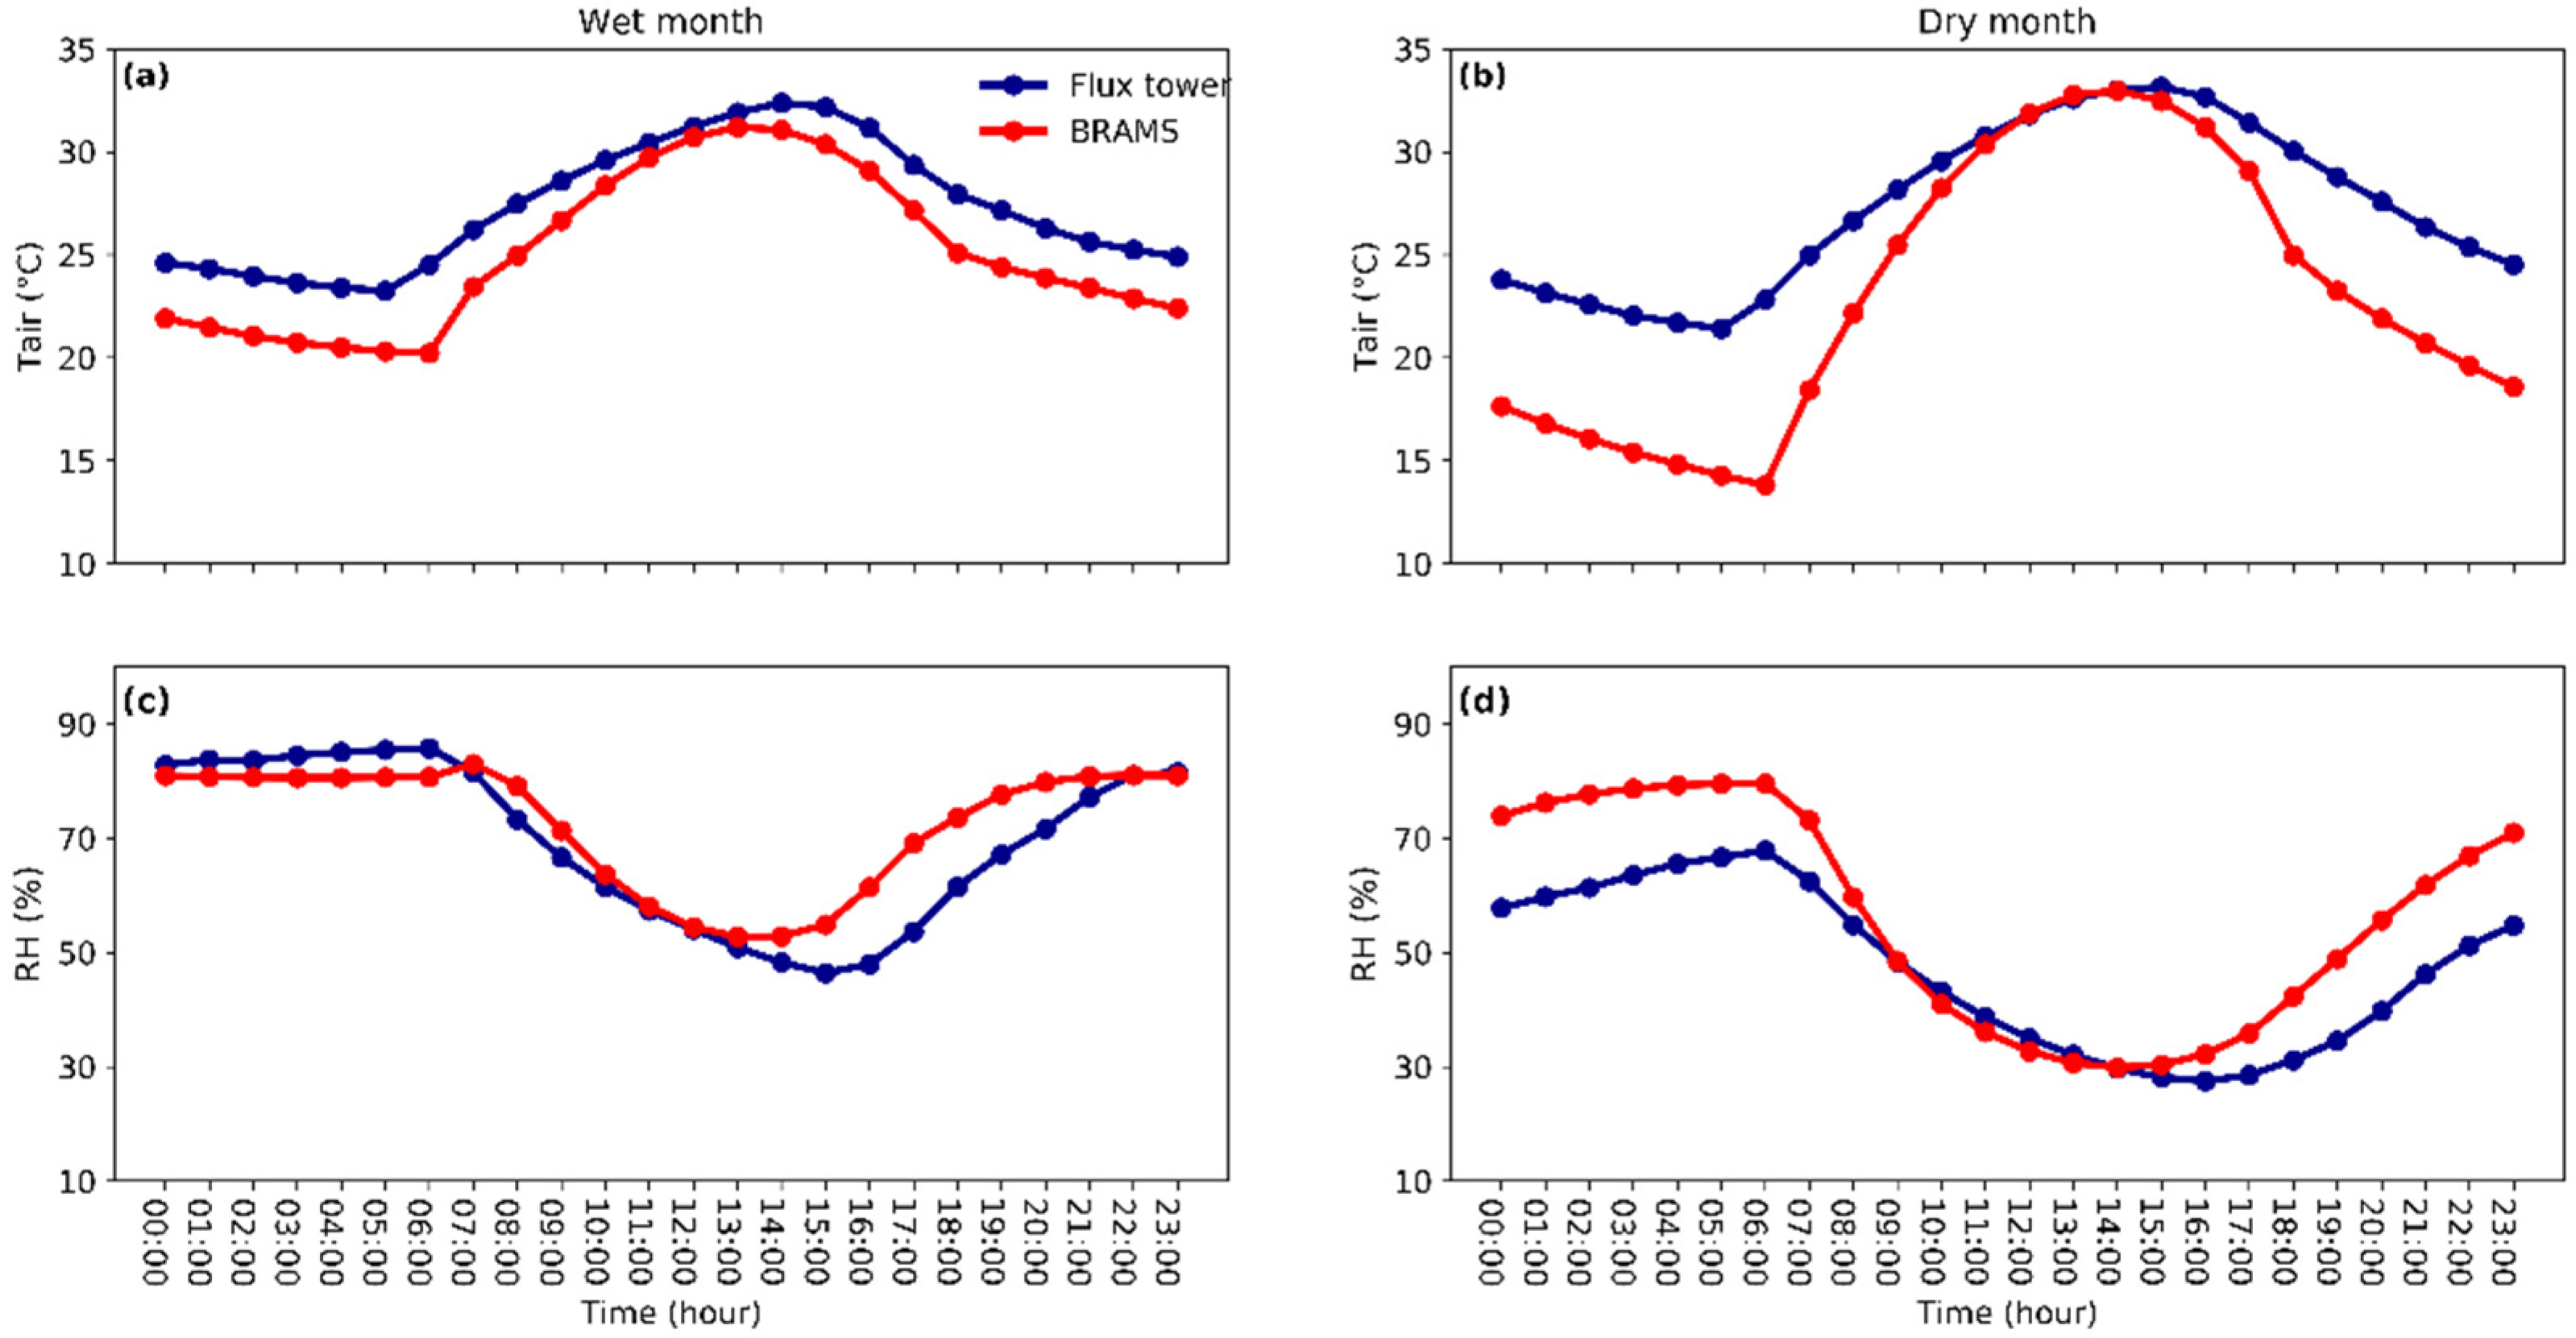
3.3. Daily Cycle in the Caatinga Biome

Figure 7 shows the daily cycle of simulated and observed Tair and RH values. Minimum Tair values in April and August occurred at 5:00 h, with simulated minimums lagging by an hour. RH maximum and minimum peaks showed discrepancies in timing between simulated and observed values, with BRAMS performing better during the dry season.
Simulated energy fluxes (H, LE, G, and Rn) aligned with the diurnal cycle of incident solar radiation (Figure 8). Simulated H fluxes closely followed observed values during the wet month but were slightly overestimated during the dry month. LE fluxes were under estimated during August mornings and overestimated in April. Simulated G fluxes were overestimated in both periods, indicating deficiencies in soil heat conduction representation.

3.4. Statistical Analysis

Figure 9 presents the Taylor diagram with statistical metrics between simulated and observed variables. The result shows that the BRAMS model presented a better skill in the dry month for the variables Tair, RH, G and Rn and worse to LE (Figure 9). Furthermore, for the dry month, except for the LE flux (r = 0.59), the remaining simulated variables showed a correlation above 0.75. In the wet month, the Tair, LE and Rn had a correlation above 0.90 (Figure 9).
It was found that Tair, RH, H and Rn had SD normalized with a range from 0.7 to 1.6, in which the slightest deviations were in the wet season for these variables (Figure 9). In addition, it was observed that soil heat flux presented the most significant deviation and overestimation in relation to observation, with a high correlation (r > 0.80) in the two seasons. The evaluation results of the BRAMS model for the Caatinga biome agree with other studies conducted through dynamic modeling, and thus are reasonable in other biomes (Table 6).

4. Discussion

4.1. Rainfall Patterns and Model Performance

The results highlight the BRAMS model’s capability to simulate the spatial distribution of precipitation under different climatic conditions, although it proved to be more effective during wet periods rather than dry ones. The significant overestimation of precipitation can be attributed to the model’s spatial resolution and its representation of meteorological systems affecting the area.
The overestimation of rainfall by the BRAMS model in April highlights its limitations in capturing the spatial variability of convective systems, particularly along the ITCZ. Previous studies emphasize the ITCZ’s role as the primary driver of rainfall in the region, reaching its southernmost position during the austral autumn [66,67,68]. The wet season in the NEB is also modulated by the incursion of transient systems, for example, frontal systems, propagating from the high latitudes of South America, which can cause rainfall in the southern part of the region [69,70].
In the dry month, rainfall was extremely low in the central part of the NEB, which is almost entirely covered by the Caatinga vegetation. One can also notice that the BRAMS model was able to satisfactorily simulate rainfall over the eastern NEB, which is characterized by stratiform clouds (warm rain) with shallow convection [56]. The CPC-NOAA also captured this pattern and [38] datasets, but not by the TRMM satellite. Xavier et al. [38] showed the closest value for accumulated precipitation (107.5 mm), attributed to its use of in situ rainfall data. As the south central area of the NEB region (6° S 50° W; 4° S 45 °W) has a high topography, the TRMM satellite may have presented difficulties in estimating the rain in this location.
Coastal rains on the East Coast are generally associated with convective systems in the form of squall lines [71,72]. The underestimation of rainfall rates can be attributed to the low resolution (~25 km) of the model, in agreement with previous studies conducted with other dynamic models [59,60]. The rainfall observed in the East part of NEB, near the ESEC-345 Seridó, showed a bimodal pattern. The first maximum in April is associated with the North–South displacement of ITCZ, and the second maximum, between June and July, caused by mesoscale convective systems moving from east to west influencing the rainfall regime in that region; additionally, the precipitation between November and February can be influenced by UTCV, associated or not with front systems, as reported by a wide scientific literature [46,69,73].

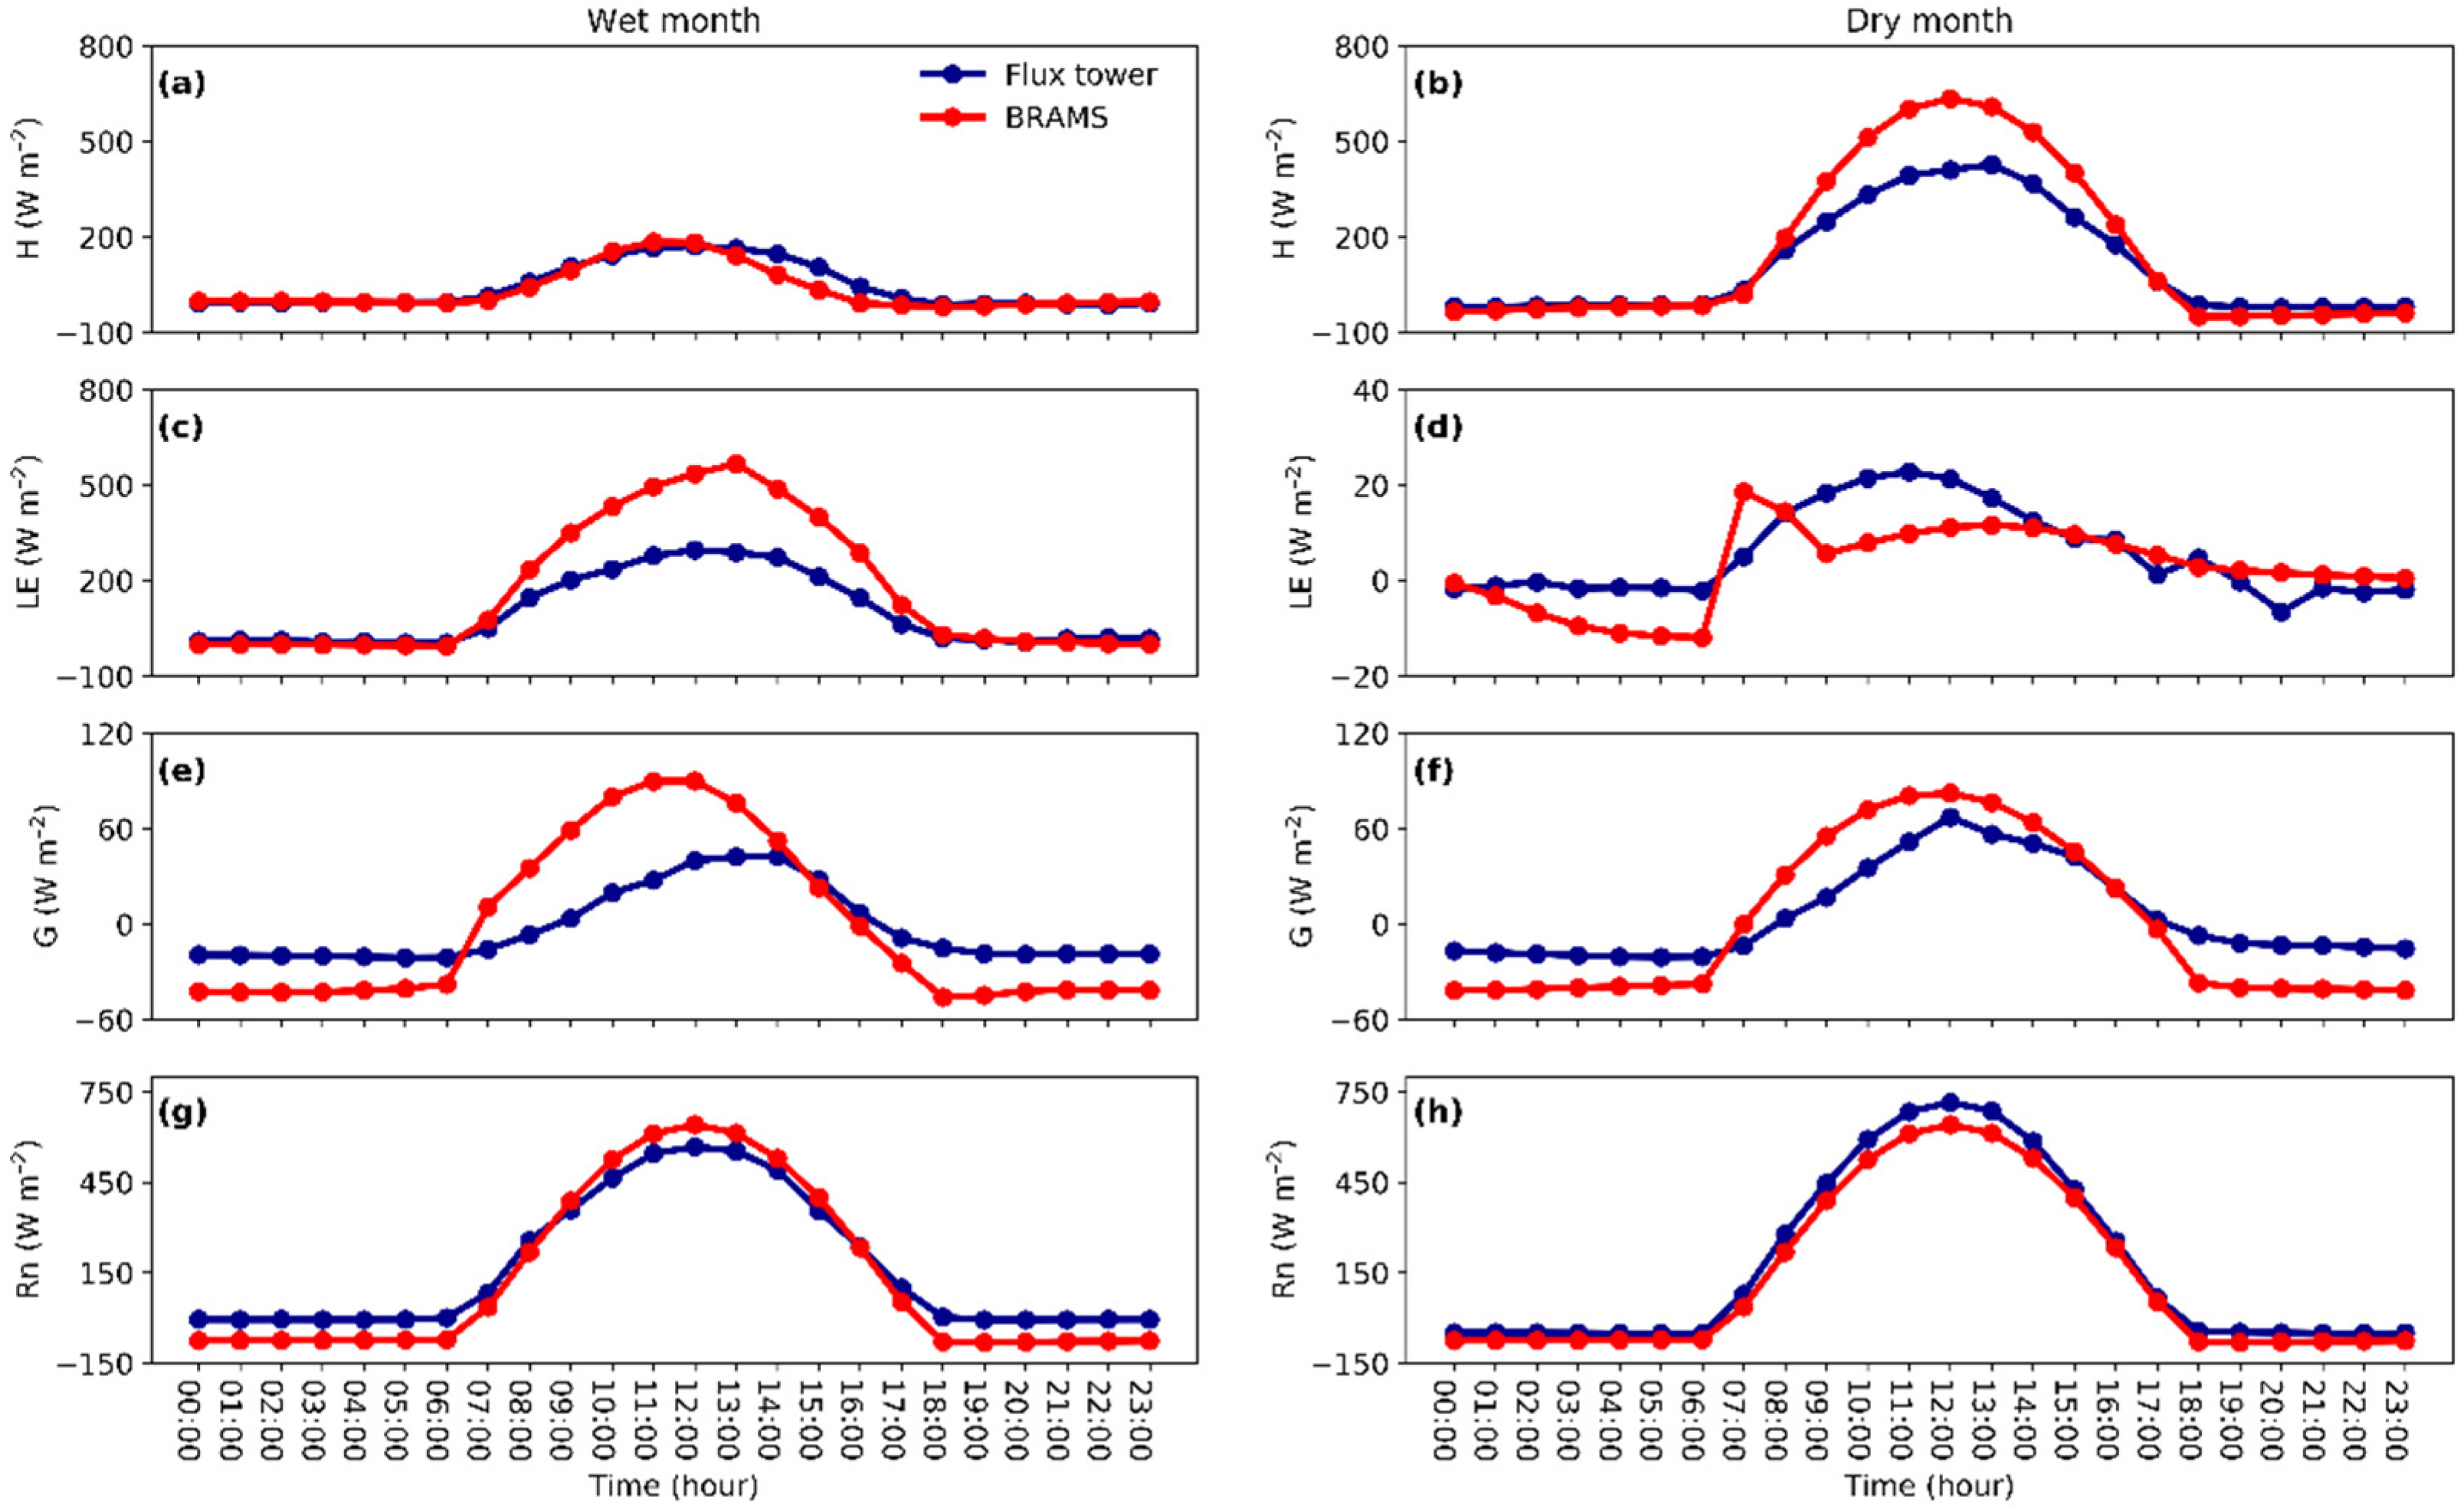
4.2. Surface Variables, Energy Fluxes and Daily Cycle in the Caatinga Biome

The systematic errors in BRAMS simulations of Tair and RH suggest deficiencies in the CARMA radiation parameterization [60] and its interactions with atmospheric chemical composition [60]. Nighttime overestimations of RH and underestimations of Tair may result from biases in longwave radiation representation [74,75].
Observed mean Tair stability in the Caatinga biome contrasts with BRAMS’ underestimation, potentially linked to limitations in the surface energy balance module (JULES). The model’s overestimation of LE fluxes during the wet season and underestimation during the dry season aligns with challenges in representing water availability and evapotranspiration dynamics, as noted in [33].
Simulated energy fluxes generally matched observed diurnal patterns but showed discrepancies in amplitude. Overestimated G fluxes during April highlight the need for improved soil heat flux parameterization in BRAMS, consistent with findings in other ecosystems [74].
The analysis of Figure 6 indicates that there is a higher conversion of Rn into H fluxes during the dry month (Figure 6b,h). This is associated with the dynamics of the air heating processes, which are more intense during this time of year in the Caatinga and also with the higher availability of solar radiation during August. The mean simulated H fluxes (43.1 W m−2) were similar to observed values (40.6 W m−2) in the month of April (Table 5).
The assessment of simulated LE shows that the model can adequately represent this variable (Figure 6c,d), but with an overestimation of about 30% in the wet month and an underestimation of 40% in the dry month. In April, LE fluxes measured at the surface presented peaks higher than 400 W m−2 (Figure 6c), associated with high evapotranspiration rates in the Caatinga biome, since at this time of year, the photosynthetic activity of the vegetation is more intense due to greater water availability and, consequently, greater leaf cover. During the dry month, there was a remarkable decrease in LE and the peak of simulated LE was lower than what has observed, different from the wet period (Figure 6d). Furthermore, one can observe peak LE values below 100 W m−2. The decrease in LE fluxes during the dry period is linked to reduced water availability in the soil caused by the lack of rainfall in the biome.
The assessment of simulated LE shows that the model can adequately represent this variable (Figure 6c,d), but with an overestimation of about 30%, the wet month and an underestimation of 40% in the dry month. In April, LE fluxes measured at the surface presented peaks higher than 400 W m−2 (Figure 6c), associated with high evapotranspiration rates in the Caatinga biome, since at this time of year, the photosynthetic activity of the vegetation is more intense due to greater water availability and, consequently, greater leaf cover. During the dry month, there was a remarkable decrease in LE and the peak of simulated LE was lower than what has observed, different from the wet period (Figure 6d). Furthermore, one can observe peak LE values below 100 W m−2. This reduction in LE fluxes during the dry period is attributed to lower water availability in the soil due to the absence of rainfall over the biome.
The analysis of G fluxes simulated by the BRAMS model revealed an overestimation compared to observed values, particularly during the wet month (Figure 6). This suggests a potential limitation in the model’s ability to accurately represent soil moisture dynamics in the Caatinga biome. The surface module (JULES) requires further refinement to improve soil moisture estimation and better align with the environmental characteristics of the region.
Despite this, the BRAMS model effectively captured the daily cycle of energy fluxes during the dry season, highlighting its capability to represent the influence of solar radiation on surface processes. However, the observed discrepancies in simulating LE during the morning hours point to challenges in accurately representing thermal and moisture dynamics during the early part of the day.
The observed discrepancies underscore the necessity of refining BRAMS’ parameterizations to improve the representation of micro-meteorological processes in the Caatinga biome. Future research should focus on integrating higher-resolution datasets and enhancing soil–vegetation–atmosphere interactions to reduce biases in simulated energy and moisture fluxes. Enhanced model accuracy will support better management strategies for semi-arid regions under changing climatic conditions.

4.3. Performance and Improvements in the Simulation of the Caatinga Biome by the JULES/BRAMS Model

The assessment of the BRAMS model’s capability for simulations in the Caatinga biome indicated its potential as a study tool for the region. However, certain limitations in the model’s physical parameterization must be addressed to enhance the representation of the ecosystem’s biophysical and atmospheric characteristics. Among the aspects requiring improvement, surface parameterization stands out, particularly in the SVAT-type scheme. The representation of soil moisture dynamics proved to be deficient, which may compromise the simulation of the ecosystem’s response to climatic variations, as the Caatinga is characterized by water-limited conditions.
Additionally, cloud microphysics exhibited difficulties in reproducing coastal precipitation patterns, especially during the dry season. These discrepancies suggest that the model’s cloud microphysics schemes need adjustments to better represent cloud formation and evolution in the region. The simulation of radiation processes also showed inconsistencies, particularly in the representation of air temperature. The observed differences indicate that the interaction of longwave radiation with atmospheric components may not be correctly captured by the model, which can directly impact the estimation of surface energy balance.
Another relevant factor concerns the parameterization of the atmospheric boundary layer. Errors identified in relative humidity peaks suggest the need for adjustments in vertical moisture transport processes, which are fundamental for characterizing the thermal and dynamic structure of the atmosphere in the Caatinga. These improvements can contribute to a better representation of the surface–atmosphere interaction, positively impacting the accuracy of the model’s simulations.
Finally, the quality of input data plays a crucial role in the model’s calibration and validation. The scarcity of high-resolution observational data in the Caatinga poses challenges for reducing biases in simulations. In this regard, expanding in situ experimental campaigns is essential to provide more precise information on the physical and biogeochemical processes occurring in the region. More reliable input data will allow for more accurate model initialization and the attainment of more realistic results.
Given these considerations, it is expected that improvements in the mentioned aspects will enhance BRAMS’s ability to simulate energy fluxes and atmospheric dynamics in the Caatinga. This enhancement would make the model a more robust tool for future climatic and ecological studies, contributing to the understanding of the impacts of climate change on this semi-arid ecosystem and providing support for management strategies and local biodiversity conservation.

5. Conclusions

The study analyzed energy balance components in the Caatinga biome using in situ measurements and BRAMS model simulations. Results indicated that meteorological systems like the ITCZ influenced rainfall in the wet period, while BRAMS moderately represented rainfall patterns compared to CPC-NOAA, TRMM and XAVIER. However, the model failed to capture coastal rainfall in the dry period due to inadequate representation of warm precipitating clouds. Air temperature simulations were more accurate in the wet period but underestimated values in the dry season, likely due to longwave radiation interactions. RH was best represented in the wet period, though peak values were overestimated in the dry season. Surface energy fluxes responded to rainfall seasonality, with increased H fluxes during the dry period and LE fluxes in the wet season, a pattern partially captured by BRAMS.
Despite its usefulness, improvements in SVAT parameterization are needed for better representation of soil cover and atmospheric processes. Future studies should enhance model physics and expand in situ observations to refine simulations, particularly in ground heat flux and humidity dynamics, given the strong influence of water availability on energy flux variability in the Caatinga.

Author Contributions

Conceptualization, C.M.S.e.S., R.R.F. and K.R.M.; investigation, C.M.S.e.S., R.R.F., D.S.M. and K.R.M.; methodology, C.M.S.e.S., R.R.F., K.R.M., P.E.S.O., D.S.M. and B.G.B.; validation, R.R.F., K.R.M., C.M.S.e.S., B.G.B., P.R.M., P.E.S.O., D.S.M., G.B.C., J.R.S.L., A.C.D.A., R.S.C.M., J.M.A., V.L.A. and N.S.E.; formal analysis, R.R.F., K.R.M., C.M.S.e.S., B.G.B., P.R.M., P.E.S.O., D.S.M., G.B.C., J.R.S.L., A.C.D.A., R.S.C.M., J.M.A., V.L.A. and N.S.E.; writing—original draft preparation, R.R.F., C.M.S.e.S. and K.R.M.; writing—review and editing, R.R.F., K.R.M., C.M.S.e.S., B.G.B., P.R.M., P.E.S.O., D.S.M., G.B.C., J.R.S.L., A.C.D.A., R.S.C.M., J.M.A., V.L.A. and N.S.E.; funding acquisition, G.B.C., C.M.S.e.S., B.G.B., A.C.D.A. and R.S.C.M. All authors have read and agreed to the published version of the manuscript.

Funding

This research was funded by the National Observatory of Water and Carbon Dynamics in the Caatinga Biome network research project (n° 465764/2014-2) and PROPPIT/UFOPA (Program to support qualified scientific production—PAPCIQ), Research Incentive Program—PIP (PPBIO-UFOPA, n° 2100) and Granting of financial air for Research (PPGRNA-UFOPA, n° 2100).

Institutional Review Board Statement

Not applicable.

Informed Consent Statement

Not applicable.

Data Availability Statement

The data presented in this study are available on request from the corresponding author. The data are not publicly available due to privacy.

Acknowledgments

The authors are thankful to the Coordination for the Improvement of Higher Education Personnel (CAPES) for the scholarship granted to the first author (Process n° 88887.137587/2017-00); to the ICMBio (Chico Mendes Institute for Biodiversity Conservation); and to the São Paulo State University “Julio Mesquita Filho” (UNESP). The authors are thankful to the National Coundil for Scientific and Technological Development (CNPq) to the grant of Productivity Scholarship of Bergson G. Bezerra (n° 310781/2020-5) and Cláudio M. Santos e Silva (n° 312222/2023-8). The authors are also thankful to the grant of Productivity and Technological Development Scholarship Program (PQDT-UFOPA) to Gabriel Brito Costa, the financial support of PROPPIT/UFOPA (Program to support qualified scientific production—PAPCIQ), Research Incentive Program—PIP (PPBIO-UFOPA) and Granting of financial air for Research (PPGRNA-UFOPA).

Conflicts of Interest

The authors declare no conflict of interest.

References

  1. Huang, J.; Ji, M.; Xie, Y.; Wang, S.; He, Y.; Ran, J. Global semi-arid climate change over last 60 years. Clim. Dyn. 2016, 46, 1131–1150. [Google Scholar] [CrossRef]
  2. Montenegro, S.; Ragab, R. Impact of possible climate and land use changes in the semi arid regions: A case study from North Eastern Brazil. J. Hydrol. 2012, 434, 55–68. [Google Scholar] [CrossRef]
  3. Souza, D.O.; Alvalá, R.C.; Nascimento, M.G. Urbanization effects on the microclimate of Manaus: A modeling study. Atmos. Res. 2016, 167, 237–248. [Google Scholar] [CrossRef]
  4. Araújo Filho, R.N.; Freire, B.G.S.; Wilcoxb, B.P.; Westb, J.B.; Ferreira, F.J.; Marques, F.A. Recovery of carbon stocks in deforested Caatinga Dry forest soils requires at least 60 years. For. Ecol. Manag. 2017, 407, 210–220. [Google Scholar] [CrossRef]
  5. Althoff, T.; Menezes, R.; Pinto, A.; Parey, C.; Carvalho, A.L.; Martins, J.C.R.; Carvalho, E.X.; Silva, A.S.A.; Dutra, E.D.; Sampaio, E. Adaptation of the century model to simulate C and N dynamics of Caatinga Dry forest before and after deforestation. Agric. Ecosyst. Environ. 2018, 254, 26–34. [Google Scholar] [CrossRef]
  6. Fernandes, M.F.; Cardoso, D.; de Queiroz, L.P. An updated plant checklist of the Brazilian Caatinga seasonally dry forests and woodlands reveals high species richness and endemism. J. Arid. Environ. 2020, 174, 104079. [Google Scholar] [CrossRef]
  7. Tavares-Damasceno, J.P.; de Souza Silveira, J.L.G.; Câmara, T.; Stedile, P.C.; Macario, P.; Toledo-Lima, G.S.; Pichorim, M. Effect of drought on demography of Pileated Finch (Coryphospingus pileatus: Thraupidae) in northeastern Brazil. J. Arid. Environ. 2017, 147, 63–79. [Google Scholar] [CrossRef]
  8. Falcão, H.M.; Medeiros, C.D.; Silva, B.L.R.; Sampaio, E.V.S.B.; Almeida-Cortez, J.S.; Santos, M.G. Phenotypic plasticity and ecophysiological strategies in a tropical dry forest chronosequence: A study case with Poincianella pyramidalis. For. Ecol. Manag. 2015, 340, 62–69. [Google Scholar] [CrossRef]
  9. Pires, W.N.; Moura, M.S.B.; Souza, L.S.B.; Silva, T.G.F.; Carvalho, H.F.S. Fluxos de radiacao, energia, CO2 e vapor de agua em uma area de Caatinga em regeneracao. Agrometoeros 2017, 25, 143–151. [Google Scholar] [CrossRef]
  10. Marengo, J.A.; Torres, R.R.; Alves, L.M. Drought in Northeast Brazil—Past, present, and future. Theor. Appl. Climatol. 2016, 129, 1189–1200. [Google Scholar] [CrossRef]
  11. Ribeiro, K.; Sousa-Neto, E.R.; Carvalho, J.A.; Lima, J.R.S.; Menezes, R.S.C.; Duarte-Neto, P.J.; Guerra, G.S.; Ometto, J. Land cover changes and greenhouse gas emissions in two different soil covers in the Brazilian Caatinga. Sci. Total Environ. 2016, 571, 1048–1057. [Google Scholar] [CrossRef]
  12. Mariano, D.A.; Santos, C.A.C.; Wardlow, B.D.; Allie, M.V.; Tadesse, T.; Svoboda, M.D. Use of remote sensing indicators to assess effects of drought and humaninduced land degradation on ecosystem health in Northeastern Brazil. Remote Sens. Environ. 2018, 213, 129–143. [Google Scholar] [CrossRef]
  13. Tomasella, J.; Vieira, R.M.S.; Barbosa, A.A.; Rodriguez, D.A.; Santana, M.O.; Sestini, M.F. Desertification trends in the northeast of Brazil over the period 2000–2016. Int. J. Appl. Earth Obs. Geoinf. 2018, 73, 197–206. [Google Scholar] [CrossRef]
  14. Alvalá, R.C.S.; Cunha, A.P.; Brito, S.S.B.; Seluchi, M.E.; Marengo, J.A.; Moraes, O.L.L.; Carvalho, M.A. Drought Monitoring in the Brazilian Semiarid Region. Ann. Braz. Acad. Sci. 2017, 91, 1678–2690. [Google Scholar] [CrossRef]
  15. Brito, S.S.B.; Cunha, A.P.M.A.; Cunningham, C.C.; Alvalá, J.A.; Marengo, M.A. Frequency, duration and severity of drought in the Semiarid Northeast Brazil region. Int. J. Climatol. 2017, 38, 517–529. [Google Scholar] [CrossRef]
  16. Cunha, A.P.M.A.; Alvalá, R.C.S.; Sampaio, G.; Shimizu, M.H.; Costa, M.H. Calibration and Validation of the Integrated Biosphere Simulator (IBIS) for a Brazilian Semiarid Region. J. Appl. Meteorol. Climatol. 2013, 52, 2753–2770. [Google Scholar] [CrossRef]
  17. Santos, M.G.; Oliveira, M.T.; Figueiredo, K.V.; Falcão, H.M.; Arruda, E.C.P.; Almeida–Cortez, J.; Antonino, A.C.D. Caatinga, the Brazilian dry tropical forest: Can it tolerate climate changes? Theor. Exp. Plant Physiol. 2014, 26, 83–99. [Google Scholar] [CrossRef]
  18. Falcão, H.M.; Medeiros, C.D.; Fonsêca, M.B.; do Espírito-Santo, M.M.; Santos, M.G.; Almeida, J.S. Variation in the water use and gas exchange of two Brazilian tropical dry forest phytophysiognomies in response to successional stage. J. Arid. Environ. 2022, 206, 104831. [Google Scholar] [CrossRef]
  19. Mendes, K.R.; Batista-Silva, W.; Dias-Pereira, J.; Pereira, M.P.; Souza, E.V.; Serrão, J.E.; Granja, J.A.A.; Pereira, E.C.; Gallacher, D.J.; Mutti, P.R.; et al. Leaf plasticity across wet and dry seasons in Croton blanchetianus (Euphorbiaceae) at a tropical dry forest. Sci. Rep. 2022, 12, 954. [Google Scholar] [CrossRef]
  20. Pinheiro, E.A.R.; Costa, C.A.G.; Araújo, J.C. Effective root depth of the Caatinga biome. J. Arid. Environ. 2013, 89, 1–4. [Google Scholar] [CrossRef]
  21. Silva, P.F.; Lima, J.R.S.; Antonino, A.C.D.; Souza, R.; Souza, E.S.; Silva, J.R.I.; Alves, E.M. Seasonal patterns of carbon dioxide, water and energy fluxes over the Caatinga and grassland in the semi-arid region of Brazil. J. Arid. Environ. 2017, 147, 71–82. [Google Scholar] [CrossRef]
  22. De Souza, C.A.A.; Jardim, A.M.D.R.F.; de Souza, L.S.B.; Júnior, G.D.N.A.; Alves, C.P.; de Morais, J.E.F.; de Carvalho Lopes, D.; Steidle Neto, A.J.; da Silva Salvador, K.R.; da Silva, T.G.F. Intercomparison of micrometeorological variables, surface energy fluxes, and evapotranspiration in different landscapes of the Brazilian semi-arid region. Agric. For. Meteorol. 2023, 341, 109679. [Google Scholar] [CrossRef]
  23. Silva, D.J.F.; Silva, T.R.B.F.; de Oliveira, M.L.; de Oliveira, G.; Mishra, M.; Santos, C.A.G.; da Silva, R.M.; Santos, C.A.C.D. Analysis of surface radiation fluxes and environmental variables over Caatinga vegetation with different densities. J. Arid. Environ. 2024, 222, 105163. [Google Scholar] [CrossRef]
  24. Silva, C.O.F.; Teixeira, A.H.C.; Manzione, R.L. Agriwater: An R Package for Spatial Modelling of Energy Balance and Actual Evapotranspiration Using Satellite Images and Agrometeorological Data. Environ. Model. Softw. 2019, 120, 104497. [Google Scholar] [CrossRef]
  25. Campos, S.; Mendes, K.; Silva, L.; Mutti, P.; Medeiros, S.; Amorim, L.B.; Santos, C.A.C.; Perez-Marin, A.; Ramos, T.; Marques, T.V.; et al. Closure and partitioning of the energy balance in a preserved area of a Brazilian seasonally Dry tropical forest. Agric. For. Meteorol. 2019, 271, 398–412. [Google Scholar] [CrossRef]
  26. Ferreira, R.R.; Mutti, P.; Mendes, K.; Campos, S.; Marques, T.; Oliveira, C.; Gonçalves, W.; Mota, J.; Difante, G.; Urbano, S.; et al. An assessment of the MOD17A2 gross primary production product in the Caatinga biome, Brazil. Int. J. Remote Sens. 2020, 42, 1275–1291. [Google Scholar] [CrossRef]
  27. Rezende, L.F.C.; Arenque-Musa, B.C.; Moura, M.S.B.; Aidar, S.T.; Von Randow, C.; Menezese, R.S.C.; Ometto, J. Calibration of the maximum carboxylation velocity (Vcmax) using data mining techniques and ecophysiological data from the Brazilian semiarid region, for use in Dynamic Global Vegetation Models. Braz. J. Biol. 2016, 76, 341–351. [Google Scholar] [CrossRef]
  28. Yu, M.; Wang, G.; Chen, H. Quantifying the impacts of land surface schemes and dynamic vegetation on the model dependency of projected changes in surface energy and water budgets. J. Adv. Model. Earth Syst. 2016, 8, 370–386. [Google Scholar] [CrossRef]
  29. Llopart, M.; Rocha, R.P.; Reboita, M.; Cuadas, S. Sensitivity of simulated South America climate to the land surface schemes in RegCM4. Clim. Dyn. 2017, 49, 3975–3987. [Google Scholar] [CrossRef]
  30. Gómez, I.; Caselles, V.; Estrelas, M.J.; Sánches, J.M.; Rubio, E.; Miró, J.J. Improved meteorology and surface fluxes in mesoscale modelling using adjusted initial vertical soil moisture profiles. Atmos. Res. 2018, 213, 523–536. [Google Scholar] [CrossRef]
  31. Hu, C.; Griffis, T.J.; Liu, S.; Xiao, W.; Hu, N.; Huang, W.; Yang, D.; Lee, X. Anthropogenic methane emission and its partitioning for the Yangtze River Delta region of China. J. Geophys. Res. 2019, 124, 1148–1170. [Google Scholar] [CrossRef]
  32. Da Rosa Ferraz Jardim, A.M.; de Morais, J.E.F.; de Souza, L.S.B.; da Silva, T.G.F. Understanding interactive processes: A review of CO2 flux, evapotranspiration, and energy partitioning under stressful conditions in dry forest and agricultural environments. Environ. Monit. Assess. 2022, 194, 677. [Google Scholar] [CrossRef] [PubMed]
  33. Clark, D.B.; Mercado, L.M.; Sitch, S.; Jones, C.D.; Gedney, N.; Best, M.J.; Pryor, M.; Rooney, G.G.; Essery, R.L.H.; Blyth, E.; et al. The Joint UK Land Environment Simulator (JULES), model description—Part 2: Carbon fluxes and vegetation dynamics. Geosci. Model Dev. 2011, 4, 701–722. [Google Scholar] [CrossRef]
  34. Repinaldo, H.F.B.; Fedorova, N.; Levit, V.; Repinaldo, C.R. Upper Tropospheric Cyclonic Vortex and Brazilian Northeast Jet Stream over Alagoas State: Circulation Patterns and Rainfall. Rev. Bras. Meteorol. 2020, 35, 745–754. [Google Scholar] [CrossRef]
  35. Chen, M.; Shi, W.; Xie, P.; Silva, V.B.S.; Kousky, V.E.; Wayne Higgins, R.; Janowiak, J.E. Assessing objective techniques for gauge-based analyses of global daily precipitation. J. Geophys. Res. 2008, 113, D04110. [Google Scholar] [CrossRef]
  36. Kummerow, C.; Simpson, J.; Thiele, O.; Barnes, W.; Chang, A.T.C.; Stocker, E.; Adler, R.F.; Hou, A.; Kakar, R.; Wentz, F.; et al. The Status of the Tropical Rainfall Measuring Mission (TRMM) after Two Years in Orbit. J. Appl. Meteorol. 2000, 39, 1965–1982. [Google Scholar] [CrossRef]
  37. Xavier, A.C.; King, C.W.; Scanlon, B.R. Daily gridded meteorological variables in Brazil (1980–2013). Int. J. Climatol. 2016, 36, 2644–2659. [Google Scholar] [CrossRef]
  38. Zhang, G.J.; Song, X.; Wang, Y. The double ITCZ syndrome in GCMs: A coupled feedback problem among convection, clouds, atmospheric and ocean circulations. Atmos. Res. 2019, 229, 255–268. [Google Scholar] [CrossRef]
  39. Freitas, S.R.; Panetta, J.; Longo, K.M.; Rodrigues, L.F.; Moreira, D.S.; Rosário, N.E.; Silva Dias, P.L.; Silva Dias, M.A.F.; Souza, E.P.; Freitas, E.D.; et al. The Brazilian developments on the Regional Atmospheric Modeling System (BRAMS 5.2): An integrated environmental model tuned for tropical areas. Geosci. Model Dev. 2017, 10, 189–222. [Google Scholar] [CrossRef]
  40. Walko, R.L.; Band, L.E.; Baron, J.; Kittel, T.G.F.; Lammers, R.; Lee, T.J.; Ojima, D.; Pielke, R.A.; Taylor, C.; Tague, C.; et al. Coupled atmosphericbiophysics-hydrology models for environmental modeling. J. Appl. Meteorol. 2000, 39, 931–944. [Google Scholar] [CrossRef]
  41. Von Randow, C.; Zeri, M.; Coupe, N.R.; Muza, N.M.; Alves, L.G.G.; Costa, M.H.; Araújo, A.C.; Manzi, O.; Rocha, H.R.; Saleska, S.R. Inter-annual variability of carbon and water fluxes in Amazonian forest, Cerrado and pasture sites, as simulated by terrestrial biosphere models. Agric. For. Meteorol. 2013, 182, 145–155. [Google Scholar] [CrossRef]
  42. Coupe, N.R.; Levine, N.; Christoffersen, B.O.; Albert, P.L.; Wu, J.; Costa, M.H.; Galbraith, D.; Imbuzeiro, H.; Martins, G.; Araújo, A.C.; et al. Do dynamic global vegetation models capture the seasonality of carbon fluxes in the Amazon basin? A data-model intercomparison. Glob. Change Biol. 2016, 23, 191–208. [Google Scholar] [CrossRef] [PubMed]
  43. Biudes, M.S.; Vourlitis, G.L.; Machado, N.G.; Arruda, P.H.Z.; Neves, G.A.R.; Lobo, F.A.; Neale, C.M.U.; Nogueira, J.S. Patterns of energy balance exchange for tropical ecosystems across a climate gradient in Mato Grosso, Brazil. Agric. For. Meteorol. 2015, 202, 112–124. [Google Scholar] [CrossRef]
  44. Alvares, C.A.; Stape, J.; Sentelhas, P.; Gonçalves, J.; Sparovek, G. Koppen’s climate classification map for Brazil. Meteorol. Z. 2013, 22, 711–728. [Google Scholar] [CrossRef]
  45. Oliveira, P.T.; Silva, C.M.S.; Lima, K.C. Climatology and trend analysis of extreme precipitation in subregions of Northeast Brazil. Theor. Appl. Climatol. 2016, 130, 77–90. [Google Scholar] [CrossRef]
  46. Marques, T.; Mendes, K.; Mutti, P.; Medeiros, S.; Silva, L.; Perez, A.; Campos, S.; Lucio, P.; Lima, K.; dos Reis, J.; et al. Environmental and biophysical controls of evapotranspiration from Seasonally Dry Tropical Forests (Caatinga) in the Brazilian Semiarid. Agric. For. Meteorol. 2020, 287, 107957. [Google Scholar] [CrossRef]
  47. Santana, J.A.S.; Santana Júnior, J.A.S.; Barreto, W.S.; Ferreira, A.T.S. Estrutura e distribuição espacial da vegetação da Caatinga na Estação Ecológica do Seridó, RN. Braz. J. For. Res. 2016, 36, 355–361, (In Portuguese with English Abstract). [Google Scholar] [CrossRef]
  48. Costa, C.A.G.; Lopes, J.W.B.; Pinheiro, E.A.R.; Araújo, J.C.; Gomes-Filho, R.R. Spatial behaviour of soil moisture in the root zone of the Caatinga biome. Rev. Ciênc. Agron. 2013, 44, 685–694. [Google Scholar] [CrossRef]
  49. Mendes, K.; Campos, S.; Silva, L.; Mutti, P.; Ferreira, R.; Medeiros, S.; Perez-Mari, A.; Marques, T.; Ramos, T.; Vieira, L.; et al. Seasonal variation in net ecosystem CO2 exchange of a Brazilian seasonally dry tropical forest. Sci. Rep. 2020, 10, 9454. [Google Scholar] [CrossRef]
  50. Moreira, D.S.; Freitas, S.R.; Bonatti, J.P.; Mercado, L.M.; Rosário, N.M.É.; Longo, K.M.; Miller, J.B.; Gloor, M.; Gatti, L.V. Coupling between the JULES land-surface scheme and the CCATT-BRAMS atmospheric chemistry model (JULES-CCATT-BRAMS1.0): Applications to numerical weather forecasting and the CO2 budget in South America. Geosci. Model Dev. 2013, 6, 453–494. [Google Scholar] [CrossRef]
  51. Dee, D.P.; Uppala, S.M.; Simmons, A.J.; Berrisford, P.; Poli, P.; Kobayashi, S.; Andrae, U.; Balmaseda, M.A.; Balsamo, G.; Bauer, P.; et al. The ERA-Interim reanalysis: Configuration and performance of the data assimilation system. Q. J. R. Meteorol. Soc. 2011, 137, 553–597. [Google Scholar] [CrossRef]
  52. Reynolds, R.W.; Rayner, N.A.; Smith, T.M.; Stokes, D.C.; Wang, W. An improved in situ and satellite SST analysis for climate. J. Clim. 2002, 15, 1609–1625. [Google Scholar] [CrossRef]
  53. Gevaerd, R.; Freitas, S.R. Estimativa operacional da umidade do solo para inicialização de modelos de previsão numérica da atmosfera. Parte I: Descrição da metodologia e validação. Rev. Bras. Meteorol. 2006, 21, 1–15. [Google Scholar]
  54. Kaufman, Y.J.; Tanré, D.; Remer, L.A.; Vermote, E.F.; Chu, A.; Holben, B.N. Operational remote sensing of tropospheric aerosol over land from EOS moderate resolution imaging spectroradiometer. J. Geophys. Res. Atmos. 1997, 102, 17051–17067. [Google Scholar] [CrossRef]
  55. Rossato, L.; Alvalá, R.d.S.; Tomasella, J. Variação espaço-temporal da umidade do solo no brasil: Análise das condições médias para o período de 1971–1990. Rev. Bras. Meteorol. 2004, 19, 113–122. [Google Scholar]
  56. Gesch, D.B.; Verdin, K.L.; Greenlee, S.K. New land surface digital elevation model covers the Earth. EOS Trans. Am. Geophys. Union 1999, 80, 69–70. [Google Scholar] [CrossRef]
  57. Peters, W.; Jacobson, A.R.; Sweeney, C.; Andrews, A.E.; Conway, T.J.; Masarie, K.; Miller, J.B.; Bruhwiler, L.M.P.; Petron, G.; Hirsch, A.I.; et al. An atmospheric perspective on North American carbon dioxide exchange: CarbonTracker. Proc. Natl. Acad. Sci. USA 2007, 104, 18925–18930. [Google Scholar] [CrossRef]
  58. Grell, G.A.; Dévényi, D. A generalized approach to parameterizing convection combining ensemble and data assimilation techniques. Geophys. Res. Lett. 2002, 29, 38-1–38-4. [Google Scholar] [CrossRef]
  59. Souza, E.P. Estudo Teórico e Numérico da Relação entre Convecção e Superfícies Heterogêneas na Região Amazônica. Ph.D. Thesis, DCA/IAG, São Paulo University (USP), São Paulo, SP, Brazil, 1999. (In Portuguese). [Google Scholar]
  60. Longo, K.M.; Freitas, S.R.; Andreae, M.O.; Setzer, A.; Prins, E.; Artaxo, P. The Coupled Aerosol and Tracer Transport model to the Brazilian developments on the Regional Atmospheric Modeling System (CATT-BRAMS)—Part 2: Model sensitivity to the biomass burning inventories. Atmos. Chem. Phyisics 2010, 10, 5785–5795. [Google Scholar] [CrossRef]
  61. Mellor, G.L.; Yamada, T. Development of a turbulence closure model for geophysical fluid problems. Rev. Geophys. Space Phys. 1982, 20, 851–875. [Google Scholar] [CrossRef]
  62. Taylor, K.E. Summarizing multiple aspects of model performance in a single diagram. J. Geophys. Res. 2001, 106, 7183–7192. [Google Scholar] [CrossRef]
  63. Lyra, A.A.; Chou, S.C.; Sampaio, G.O. Sensitivity of the Amazon biome to high resolution climate change projections. Acta Amaz. 2016, 46, 175–188. [Google Scholar] [CrossRef]
  64. Anwar, S.A.; Zakey, A.S.; Robaa, S.M.; Abdel Wahab, M.M. The influence of two land-surface hydrology schemes on the regional climate of Africa using the RegCM4 model. Theor. Appl. Climatol. 2019, 136, 1535–1548. [Google Scholar] [CrossRef]
  65. Hastenrath, S.; Heller, L. Dynamics of climatic hazards in northeast Brazil. Q. J. R. Meteorol. Soc. 1977, 103, 77–92. [Google Scholar] [CrossRef]
  66. Kayano, M.T.; Andreoli, R.V. Decadal variability of northern northeast Brazil rainfall and its relation to tropical sea surface temperature and global sea level pressure anomalies. J. Geophys. Res. 2004, 109, C11011. [Google Scholar] [CrossRef]
  67. Utida, G.; Cruz, F.W.; Etourneau, J.; Bouloubassi, I.; Schefuß, E.; Vuille, M.; Turcq, B. Tropical South Atlantic influence on Northeastern Brazil precipitation and ITCZ displacement during the past 2300 years. Sci. Rep. 2019, 9, 1698. [Google Scholar] [CrossRef]
  68. Fedorova, N.; Santos, D.M.B.; Segundo, M.M.L.; Levit, V. Middle Tropospheric Cyclonic Vortex in Northeastern Brazil and the Tropical Atlantic. Pure Appl. Geophys. 2016, 174, 397–411. [Google Scholar] [CrossRef]
  69. Marengo, J.A.; Alves, L.M.; Alvala, R.C.S.; Cunha, A.P.; Brito, S.; Moraes, O.L.L. Climatic characteristics of the 2010–2016 drought in the semiarid Northeast Brazil region. An. Acad. Bras. Ciênc. 2018, 90, 1973–1985. [Google Scholar] [CrossRef]
  70. Palharini, R.S.A.; Vila, D.A. Climatological Behavior Precipitating Clouds in the Northeast Regions of Brazil. Adv. Meteorol. 2017, 2017, 5916150. [Google Scholar] [CrossRef]
  71. Oliveira, F.P.; Oyama, M.D. Squall Line Initiation over the Northern Coast of Brazil in March: Observational Features. Meteorol. Appl. 2019, 27, e1799. [Google Scholar] [CrossRef]
  72. Gomes, H.B.; Ambrizzi, T.; Silva, B.P.; Hodges, K.; Dias, P.L.S.; Herdies, D.L.; Silva, M.C.L.; Gomes, H.B. Climatology of easterly wave disturbances over the tropical south atlantic. Clim. Dyn. 2019, 53, 1393–1411. [Google Scholar] [CrossRef]
  73. Toon, O.B.; Turco, R.P.; Westphal, D.; Malone, R.; Liu, M. A multidimensional model for aerosols: Description of computational analogs. J. Atmos. Sci. 1988, 45, 2123–2144. [Google Scholar] [CrossRef]
  74. Rosário, N.E.; Longo, K.M.; Freitas, S.R.; Yamasoe, M.A.; Fonseca, R.M. Modeling the South American regional smoke plume: Aerosol optical depth variability and surface shortwave flux perturbation. Atmos. Chem. Phys. 2013, 13, 2923–2938. [Google Scholar] [CrossRef]
  75. Souza, R.M.S.; Feng, X.; Antonino, A.C.D.; Montenegro, S.G.L.; Souza, E.S.; Porporato, A. Vegetation response to rainfall seasonality and interannual variability in tropical dry forests. Hydrol. Process. 2016, 30, 3583–3595. [Google Scholar] [CrossRef]
Figure 1. Spatial characteristics of the Caatinga biome, location of the flux tower (ESEC-Seridó) and the domain of the simulation used the dynamic regional model.
Sustainability 17 05350 g001
Figure 2. Monthly accumulated rainfall (mm) for the year 2014 in ESEC-Seridó.
Sustainability 17 05350 g002
Figure 3. Mean daily rainfall distribution (mm/day) in the wet month (April); (a) BRAMS; (b) CPC-NOAA; (c) TRMM; (d) XAVIER [37].
Sustainability 17 05350 g003
Figure 4. Mean daily rainfall distribution (mm/day) in the dry month (August); (a) BRAMS; (b) CPC-NOAA; (c) TRMM; (d) XAVIER [37].
Sustainability 17 05350 g004
Figure 5. Daily time series of Tair and RH conditions for the Caatinga biome. The blue line indicates data measured in situ and the red line indicates data simulated using the BRAMS model; (a) Tair in the wet month; (b) Tair in the dry month; (c) RH in the wet month; (d) RH in the dry month.
Sustainability 17 05350 g005
Figure 6. Daily time series of the energy balance components in the Caatinga biome. The blue line indicates data measured in situ and the red line indicates data simulated using the BRAMS model; (a) H fluxes in the wet month; (b) H fluxes in the dry month; (c) LE fluxes in the wet month; (d) LE fluxes in the dry month; (e) G fluxes in the wet month; (f) G fluxes in the dry month; (g) Rn fluxes in the wet month; (h) Rn fluxes in the dry month.
Sustainability 17 05350 g006
Figure 7. Daily cycle of Tair and RH variables in the Caatinga biome during the wet and dry season. The blue line refers to data measured in situ, and the red line refers to data simulated using the BRAMS model: (a) Tair in the wet month; (b) Tair in the dry month; (c) RH in the wet month; (d) RH in the dry month.
Sustainability 17 05350 g007
Figure 8. Daily cycle of the energy balance components in the Caatinga biome during the wet season and the dry season. The blue line refers to data measured in situ and the red line refers to data simulated using the BRAMS model; (a) H fluxes in the wet month; (b) H fluxes in the dry month; (c) LE fluxes in the wet month; (d) LE fluxes in the dry month; (e) G fluxes in the wet month; (f) G fluxes in the dry month; (g) Rn fluxes in the wet month; (h) Rn fluxes in the dry month.
Sustainability 17 05350 g008
Figure 9. Taylor diagram showing the normalized standard deviation (SD), correlation and root mean square error (RMSE) between simulated and observed data in the wet season (blue circle) and dry season (red circle). The open circle located at normalized SD = 1.0 and RMSE = 0 indicates the observations.
Sustainability 17 05350 g009
Table 1. Characteristics of the initial and boundary conditions used in the numerical experiments.
Input DataDescriptionReference
Large-scale atmospheric conditionsECMWF 0.25° spacing grid[52]
Sea Surface Temperature (SST)NCEP weekly[53]
Soil moistureDerived from TRMM[54]
Normalized Difference Vegetation Index (NDVI)MODIS sensor[55]
Soil textureFAO-INPE[56]
Topography and vegetationUSGS 10 km[57]
Carbon emissionsCarbonTracker—NOAA[58]
Table 2. Physical settings and parameterizations that were used in the experiments.
ParameterDescription
Time step30 s
Integration time step in April720 h
Integration time step in August720 h
Deep cumulus parameterization[59]
Shallow cumulus parameterization[60]
Radiation parameterizationCARMA [61]
Turbulence parameterization[62]
Microphysics parameterizationOriginal BRAMS
Vertical coordinateSigma-Z
Grid spacing (ΔX)25 km
Number of points in X200
Number of points in Y110
Number of points in Z45
Center point of the grid−7° S, −40° W
Table 3. Quantitative assessment of rainfall in the period from 10 to 30 April in the ESEC-Seridó.
SourceRain DaysAccumulated Rainfall (mm)
BRAMS19208.4
ESEC-Seridó1293.2
CPC-NOAA14144.5
TRMM16123.6
[37]16107.5
Table 4. Mean value and standard deviation of observed and simulated (values in parenthesis) air temperature (Tair) and relative air humidity (RH) data.
VariableWet MonthDry Month
Tair (°C)27.3 ± 3.2 (25.0 ± 3.8)27.2 ± 4.0 (23.0 ± 6.6)
RH (%)69.3 ± 15.3 (72.4 ± 11.4)47.3 ± 14.8 (56.0 ± 18.9)
Table 5. Mean value and standard deviation of observed and simulated (values in parenthesis) energy balance components data: sensible heat flux (H), latent heat flux (LE), soil heat flux (G) and net radiation (Rn).
Variable (W m−2)Wet MonthDry Month
H43.1 ± 75.4 (40.6 ± 79.8)111.1 ± 170.2 (154.2 ± 250.7)
LE97.5 ± 112.4 (160.1 ± 195.9)5.6 ± 12.5 (4.8 ± 8.2)
G−2.6 ± 23.2 (−1.9 ± 50.6)5.4 ± 29.5 (0.6 ± 48.6)
Rn174.8 ± 227.6 (176.5 ± 289.3)166.6 ± 222.6 (138.4 ± 272.5)
Table 6. Correlation coefficients between simulated and observed values retrieved in other studies using dynamic modeling of the atmosphere.
ModelBiomeTairRHHLEReference
BRAMS-JULESCaatinga0.950.790.860.94Present study
BRAMS-LEAF3Amazon forest0.700.55--[62]
ETA-INLANDAmazon forest--0.970.98[64]
BRAMS-LEAF3Temperate forest0.960.930.980.78[31]
REGCM4.5-CLM4.5Savanna0.860.800.750.84[65]
Disclaimer/Publisher’s Note: The statements, opinions and data contained in all publications are solely those of the individual author(s) and contributor(s) and not of MDPI and/or the editor(s). MDPI and/or the editor(s) disclaim responsibility for any injury to people or property resulting from any ideas, methods, instructions or products referred to in the content.

