Article

Developing Novel Sustainable-Based Model to Assess Cities’ Performance Using Enviro-Socio-Economic Impact Indicators: A Case Study in Egypt

1
Environmental Engineering Department, Egypt-Japan University of Science and Technology (E-JUST), New Borg El-Arab City, Alexandria 21934, Egypt
2
Sustainable Architecture Program, Egypt-Japan University of Science and Technology (E-JUST), New Borg El-Arab City, Alexandria 21934, Egypt
3
Department of Civil and Environmental Engineering, School of Environment and Society, Institute of Science Tokyo, Meguro-Ku, Tokyo 152-8552, Japan
4
Sanitary Engineering Department, Faculty of Engineering, Alexandria University, Alexandria 21544, Egypt
*
Author to whom correspondence should be addressed.
Sustainability 2025, 17(12), 5317; https://doi.org/10.3390/su17125317
Submission received: 3 May 2025 / Revised: 30 May 2025 / Accepted: 2 June 2025 / Published: 9 June 2025
(This article belongs to the Section Development Goals towards Sustainability)

Abstract

Essential research is required to assist several developing countries in transforming urban areas into sustainable cities by providing an assessment tool that covers the environmental, economic, and social pillars of sustainability. Hence, this study introduces a novel sustainable-based model by assigning scores to the sustainable development goals (SDGs) for maintaining inclusive, safe, and resilient cities in developing nations. Quantitative and qualitative data were collected to describe 50 sustainable indicators of 27 cities, representing Egypt’s diverse urban environments from 2012 to 2022. These indicators and SDG scores were used to classify the cities into “Low”, “Medium”, and “High” based on their progress toward achieving sustainability performance. Most coastal and inland cities depicted a “High” scoring performance regarding the advanced maritime infrastructure, farming market size, and cultural tourism context. Built-up area, population growth, green urban area, and economy were considered the main indicators influencing the SDG#11 “Sustainable cities” annual variation. The SDG-based model was employed to create different scenarios to improve SDG#11 fulfillment, showing the importance of investing in the agribusiness sector to raise the gross domestic product. The study outputs were beneficial in guiding most resource-constrained countries to establish the “Sustainable city” concept under the SDGs umbrella.

Graphical Abstract

1. Introduction

The concept of sustainable cities has recently gained global attention because modern urban projects strive to balance population growth with environmental protection and social equity [1]. These urban projects can be evaluated using some targets and indicators [2], offering a comprehensive framework that covers the sustainability pillars: social, economic, and environmental (see Supplementary Table S1). These sustainability dimensions assess the city’s progress in overcoming the challenges of urbanization accompanied by inadequate public transportation systems, insufficient affordable housing, and air quality deterioration [3]. Furthermore, the use of urban-based indicators provides opportunities for decision-makers to classify the cities into “Low”, “Medium”, and “High” according to their sustainability levels (see Supplementary Table S2) [4]. In this classification procedure, a sustainable development goals (SDGs) framework assigns scores to each city, and then the cities are ranked according to the achievement of effective measurements, such as green urban space expansion, educational facility establishment, and infrastructure installation [5]. The SDG’s performance scores serve as a roadmap for cities, guiding urban planners to identify areas that need water quality improvement, poverty rate reduction, and clean energy utilization [6]. Hence, more research should create SDG-related strategies that can identify and classify the sustainability status in cities using a set of indicators (e.g., water, air, energy, poverty, education workforce, and housing), further achieving the highest sustainability performance scores. This strategy can also enable governments, policymakers, and public sectors to define the essential actions required to strengthen the resident’s quality of life [7].
Creating an SDG scoring model can offer multiple advantages to the cities of different developing countries by assessing diverse socio-economic contexts, such as gender equality [8], financial stability, and population growth [9]. This model can also evaluate a wide range of sustainability challenges, including climate-related events (i.e., Target 1.5: improve flood defenses and emergency shelters), agriculture, children’s learning (i.e., Target 16.6: develop reliable institutions), and food security compared with the conventional and localized sustainable assessment tools [10]. This SDG-based model can be established by defining a set of indicators that describe the three pillars of sustainable development to maintain a better quality of life in cities. These pillars include poverty reduction, “Target 1.2”, biodiversity conservation, “Target 15.1”, greenhouse gas (GHG) emission minimization, “Target 7.a”, and green infrastructure (e.g., shipping, logistics, and port services) establishment, “Target 11.2”. Further, quantitative data on these indicators are gathered from the cities under investigation, getting access to the available governmental reports and online surveys of published research [11]. These steps estimate the scores of SDGs assigned to each city, further defining the cities that require specific actions to develop their national and sub-national planning processes within the SDGs framework.
While recent studies have evaluated the sustainability performance of various cities worldwide (see Supplementary Table S3), their work should be upgraded to establish a reliable SDG-based assessment model designed at the local city level in developing countries. The importance of this model arises from the need for the urban transformation of traditional cities toward the sustainability strategy, overcoming the limitation of rapid unplanned urbanization, limited data accessibility, and natural resource constraints. Egypt was selected as a case study because it represents one of the essential rapidly urbanizing countries implementing national initiatives to promote sustainable urban living [12], particularly under the umbrella of Egypt Vision 2030 and SDG-aligned development plans [13]. While recent studies have defined the “Eco, Green, and Livable cities” concept in Egypt (see Supplementary Table S4), their research outputs should be connected to the SDGs achieved that help decision-makers protect and preserve the country’s cultural and natural heritage and share and compare ideas worldwide. To address this research gap, the current study introduces a comprehensive framework that assigns SDG-based sustainability scores to different cities based on their ability to achieve a global urban development agenda. These scores highly support urban planners in identifying context-specific development scenarios that aim at making human settlements more inclusive, safe, resilient, and sustainable (see the core research questions covered by the study in Supplementary Table S5).
The detailed procedures of the proposed framework are fivefold: (1) define about 50 enviro-socio-economic indicators to illustrate how the cities can contribute to sustainable development, ensuring that the proposed model is generalizable to other countries worldwide, (2) define the essential indicators and targets of each SDG, and estimate the contribution of each goal toward creating sustainable societies, (3) assign SDG scores to each city followed by categorizing these cities according to the scores fulfilled, (4) determine the synergetic interaction between the scoring of SDG#11 and other UN goals, and (5) verify the proposed model using a case study of Alexandria, Egypt, and suggest different scenarios to enhance the sustainability performance. This framework is flexible because it can be continuously updated by modifying the qualitative and quantitative indicators or adding new indicators to ensure that the scoring results remain relevant and effective in various urban scales globally.

2. Literature Review

2.1. Sustainability Assessment Tools for Urban Development

Extensive efforts have recently been exerted by scientific societies to quantify urban growth changes using several sustainability assessment tools (see Supplementary Table S6). For instance, many regions have developed their assessment tools, such as leadership in energy and environmental design (LEED; [14]) in the USA, building research establishment environmental assessment method (BREEAM; [15]) in the U.K., Canada Green Building Council [16], and Green Star Australia environmental rating system [17]. The LEED tool is used to evaluate the building’s environmental impact and energy performance, further enhancing the green building rating systems. Although the LEED certification framework has been recently applied to assess healthy, cost-efficient, and energy-saving green buildings, it can combine with socio-economic assessment tools that consider workers’ salaries, the number of children going to school, and the percentage of females in total labor force [17]. While the BREEAM method describes the construction and operation of buildings from the earliest design stages, it can be upgraded to address the environmental challenges associated with water scarcity and quality, low-carbon energy sources, and domestic waste recycling [1]. These urban assessment tools should also be combined with multiple indicators that support quality of life in smart cities (see Supplementary Table S7 for a literature survey evaluating Egyptian cities’ performance toward sustainability). Other sustainability assessment tools should consider the cities in developing countries that suffer from water limitations and electricity supply crises [18], further improving their housing, sanitation and hygiene, transportation, migration, and health conditions (see Supplementary Figure S1).

2.2. Role of SDG#11 in Urban Sustainability Assessment

Among the 17 SDGs reported by the United Nations, SDG#11 is particularly important for urban contexts [11] because it offers direct pathways to recycle residential wastes, improve outdoor air quality, and generate synergies with various SDG targets. For instance, the progress of Target 11.7, “access green and public spaces”, has a positive correlation with Target 3.9, “air quality management”, because the availability of landscapes can capture suspended pollutants from the dust-laden air, reducing the risks of respiratory system diseases [19]. Moreover, implementing integrated public transportation facilities and services, “Target 11.2”, and developing national libraries in underserved and low-income neighborhoods, “Target 11.4”, are essential in ensuring access to basic literacy levels, “Target 4.5” [20]. Avoiding the dumping of municipal and other wastes (e.g., garbage and plastics) into the streets and residential places, “Target 11.6”, contributes to the fulfillment of “Target 12.4” for the management of resources and wastes throughout their life cycle [21]. Policymakers can control the in-migration streams to the metropolitan areas, “Target 10.7”, by providing housing units, “Target 11.3: sustainable urbanization and human settlement planning”, to accommodate mobility and boost population growth [22]. Promoting adequate multilateral trading systems (e.g., the maritime and logistics sector) is essential to advance Target 17.10, “equitable international trade”, contributing to a strong and sustainable economic framework (i.e., Target 11.a: support positive economic performance) [12]. Hence, the synergetic interaction between SDG#11 and other UN goals should be explored to evaluate the city’s performance and identify the societal and governmental strategies required to adopt a culture of sustainability among residents and businesses.

2.3. Global Benchmarking vs. Localized Assessment in Sustainable Cities

Compared to global benchmarking models, the city’s SDG index provides a framework that scores urban areas based on publicly available SDG-aligned data, focusing on poverty reduction, education access, and environmental quality [23]. Likewise, the Arcadis Sustainable Cities Index assesses cities through three dimensions, e.g., people, planet, and profit, maintaining equitable community, social-ecological resilience, and financial strength [24]. While both models offer a high-level overview for developmental evaluation, they should be integrated into the world’s shared plan to end extreme poverty and reduce inequality. Alternatively, broader frameworks, such as the Urban Monitoring Framework (UMF) by UN-Habitat [25] and the World Bank Urban Sustainability Framework (USF), integrate governance, infrastructure, and inclusivity but face limitations related to institutional capacity and data scarcity in informal urban areas [26]. The OECD Green Growth Indicators and Mercer Quality of Living Index emphasize economic and quality-of-life metrics but remain less adaptable to contexts with African informal economies and trends in income inequality [27]. This comparison highlights the need for context-specific and disaggregated approaches that address both environmental and socio-economic dimensions of sustainability at the local level, giving sustainable solutions suitable for other countries worldwide (see Supplementary Table S8).

3. Theoretical Background and Hypothesis Development

3.1. Theoretical Frameworks for Transition to Sustainable and Smart Urban Paradigms

The sustainable development of cities has evolved through several theoretical paradigms in urban and regional planning. Early models, such as Christaller’s Central Place Theory and Perroux’s Growth Poles theory, emphasized the spatial organization of economic activities and the role of the city’s unique socio-spatial structure in driving regional development [28]. As urbanization intensified, other models, e.g., the Concentric Zone Theory (Burgess), Sector Theory (Hoyt), and Multiple Nuclei Model (Harris and Ullman), offered frameworks to understand urban formation, functional zoning, and landscape and sprawl conceptualization relevant to the current sustainability assessment models [29]. In recent decades, the paradigm has shifted to viewing cities as complex socio-ecological systems that must balance community empowerment, financial viability, environmental preservation, and health equity [30]. This systems-oriented view is captured by SDG#11, which calls for inclusive, safe, resilient, and sustainable urbanization (see Supplementary Figure S1). It also signifies an essential shift away from growth-centric development to sustainable-related models, emphasizing livability, ecological integration, smart mobility, green infrastructure, and participatory governance. The current study obtains benefits from this theoretical transition toward SDG#11 that can renew and plan cities and ensure access to main services, utilities, energy, housing, transport, and green public areas.

3.2. Conceptual Framework for SDG-Based Urban Sustainability Assessment

Figure 1 shows a schematic diagram of the methodological framework used to estimate the SDG scores assigned to each city. Certain indicators (e.g., housing, urban pollution, and access to services and amenities) were included in this framework, addressing the challenges related to sustainable urban development within the city boundaries. These indicators were chosen because they represented the key to achieving sustainable cities and are directly related to citizens’ quality of life in most developing countries [2]. The framework involves five key steps: (1) integrated collection of quantitative and qualitative data across environmental, social, and economic pillars; (2) indicator definition and assignment of SDG-related scores, including normalization and statistical evaluation using the Pearson Correlation Matrix to identify interdependencies among indicators; (3) selection of essential SDG targets corresponding to the three sustainability pillars; (4) creation of a classification model using normalized SDG scores and city ranking (low, medium, and high); and (5) model validation through statistical and sensitivity analysis. A case study of Alexandria is used to demonstrate the model’s application and inform scenario planning for enhancing SDG#11 performance. These steps are illustrated in the Section 4.

4. Materials and Methods

4.1. Data Source and Collection Strategy

Different sets of data were generated to fulfill the study objectives regarding the assessment of the cities’ performances in achieving the three pillars of sustainable development (see Supplementary Figure S2). Big and/or open urban data covered the 2012–2022 time span. The environmental-based data, such as the air and water quality parameters, were collected from reports and documents provided by the Egyptian Environmental Affairs Authority (EEAA), which collaborates closely with various governmental and non-governmental facilities and international bodies [31]. This authority is responsible for enforcing environmental laws and regulations in Egypt, improving the country’s environmental management capabilities. The United Nations Environment Program (UNEP) [32,33], with its Global Environment Outlook (GEO) for cities [34], was also used to retrieve data related to environmental quality assessment. The data related to remote sensing was collected from different sources, including OpenStreetMap (OSM) [35] and the geographical portal for planning management [36]. This data collection method complies with previous environmental monitoring studies exploring water quality [37] and air pollution [13] in Egypt. Socio-financial data about the population and economic sectors in Egypt was obtained from the Central Agency for Public Mobilization and Statistics (CAPMAS) year reports [38] and cultural statistics for Egypt [39]. The community economic data, covering employment rates, transportation, logistics, tourism, and hospitality, were determined from the Statista portal [40]. Data related to education (e.g., curriculum quality, finance, teachers, and capacity building) and culture (employment and activities) were obtained from the United Nations Educational, Scientific, and Cultural Organization (UNESCO) Institute of Statistics [41]. Data related to gender equality and poverty were collected from the United Nations Development Programme (UNDP) reports [42]. Data used to describe job opportunities, financial resources, sanitation services, and access to electricity were retrieved from the World Bank Group Annual Report [43]. Observations used to demonstrate the health, education, nutrition, and connection to the water system for every child in Egypt were gathered from the United Nations International Children’s Emergency Fund (UNICEF) reports [44]. The information associated with the economic pillar of sustainable development, including gross domestic product (GDP), labor force, currency exchange rate, and tourism, was gathered from the International Monetary Fund (IMF) [45], Central Bank of Egypt (CBE) [46], and UN Trade and Development (UNCTAD) [47] databases.

4.2. Selection Criteria of Representative Egyptian Cities

Among the 294 Egyptian cities, this study focused on assessing the sustainable performance of 27 cities that mainly represented the Egyptian governorates (see Supplementary Figure S2) [48]. These cities were chosen due to their administrative management, availability of urban infrastructure, and role in regional supply chain hubs, ensuring a representative and manageable scope for most developing countries. For instance, these cities covered the coastal and industrial hubs (e.g., Alexandria and Suez), agricultural centers (e.g., Kafr El-Sheikh and Damanhur), architectural historic areas, and tourism-driven activities (e.g., Luxor and Hurghada), providing a broad geographical coverage [49]. A brief description of the selected cities, regarding the geographic locations, dominant economic activities, and type, is summarized in Supplementary Table S7. Alexandria was selected to validate the proposed SDG-based model because it integrates coastal, industrial, and tourism activities with agricultural functions, illustrating its role as a multifunctional urban hub [7]. Satellite imagery of the main Alexandria’s urban planning areas was analyzed in 1985, 2013, 2017, and 2024 to gain insights into the city’s evolutionary patterns of urbanization and natural landscapes (see Supplementary Figure S3).

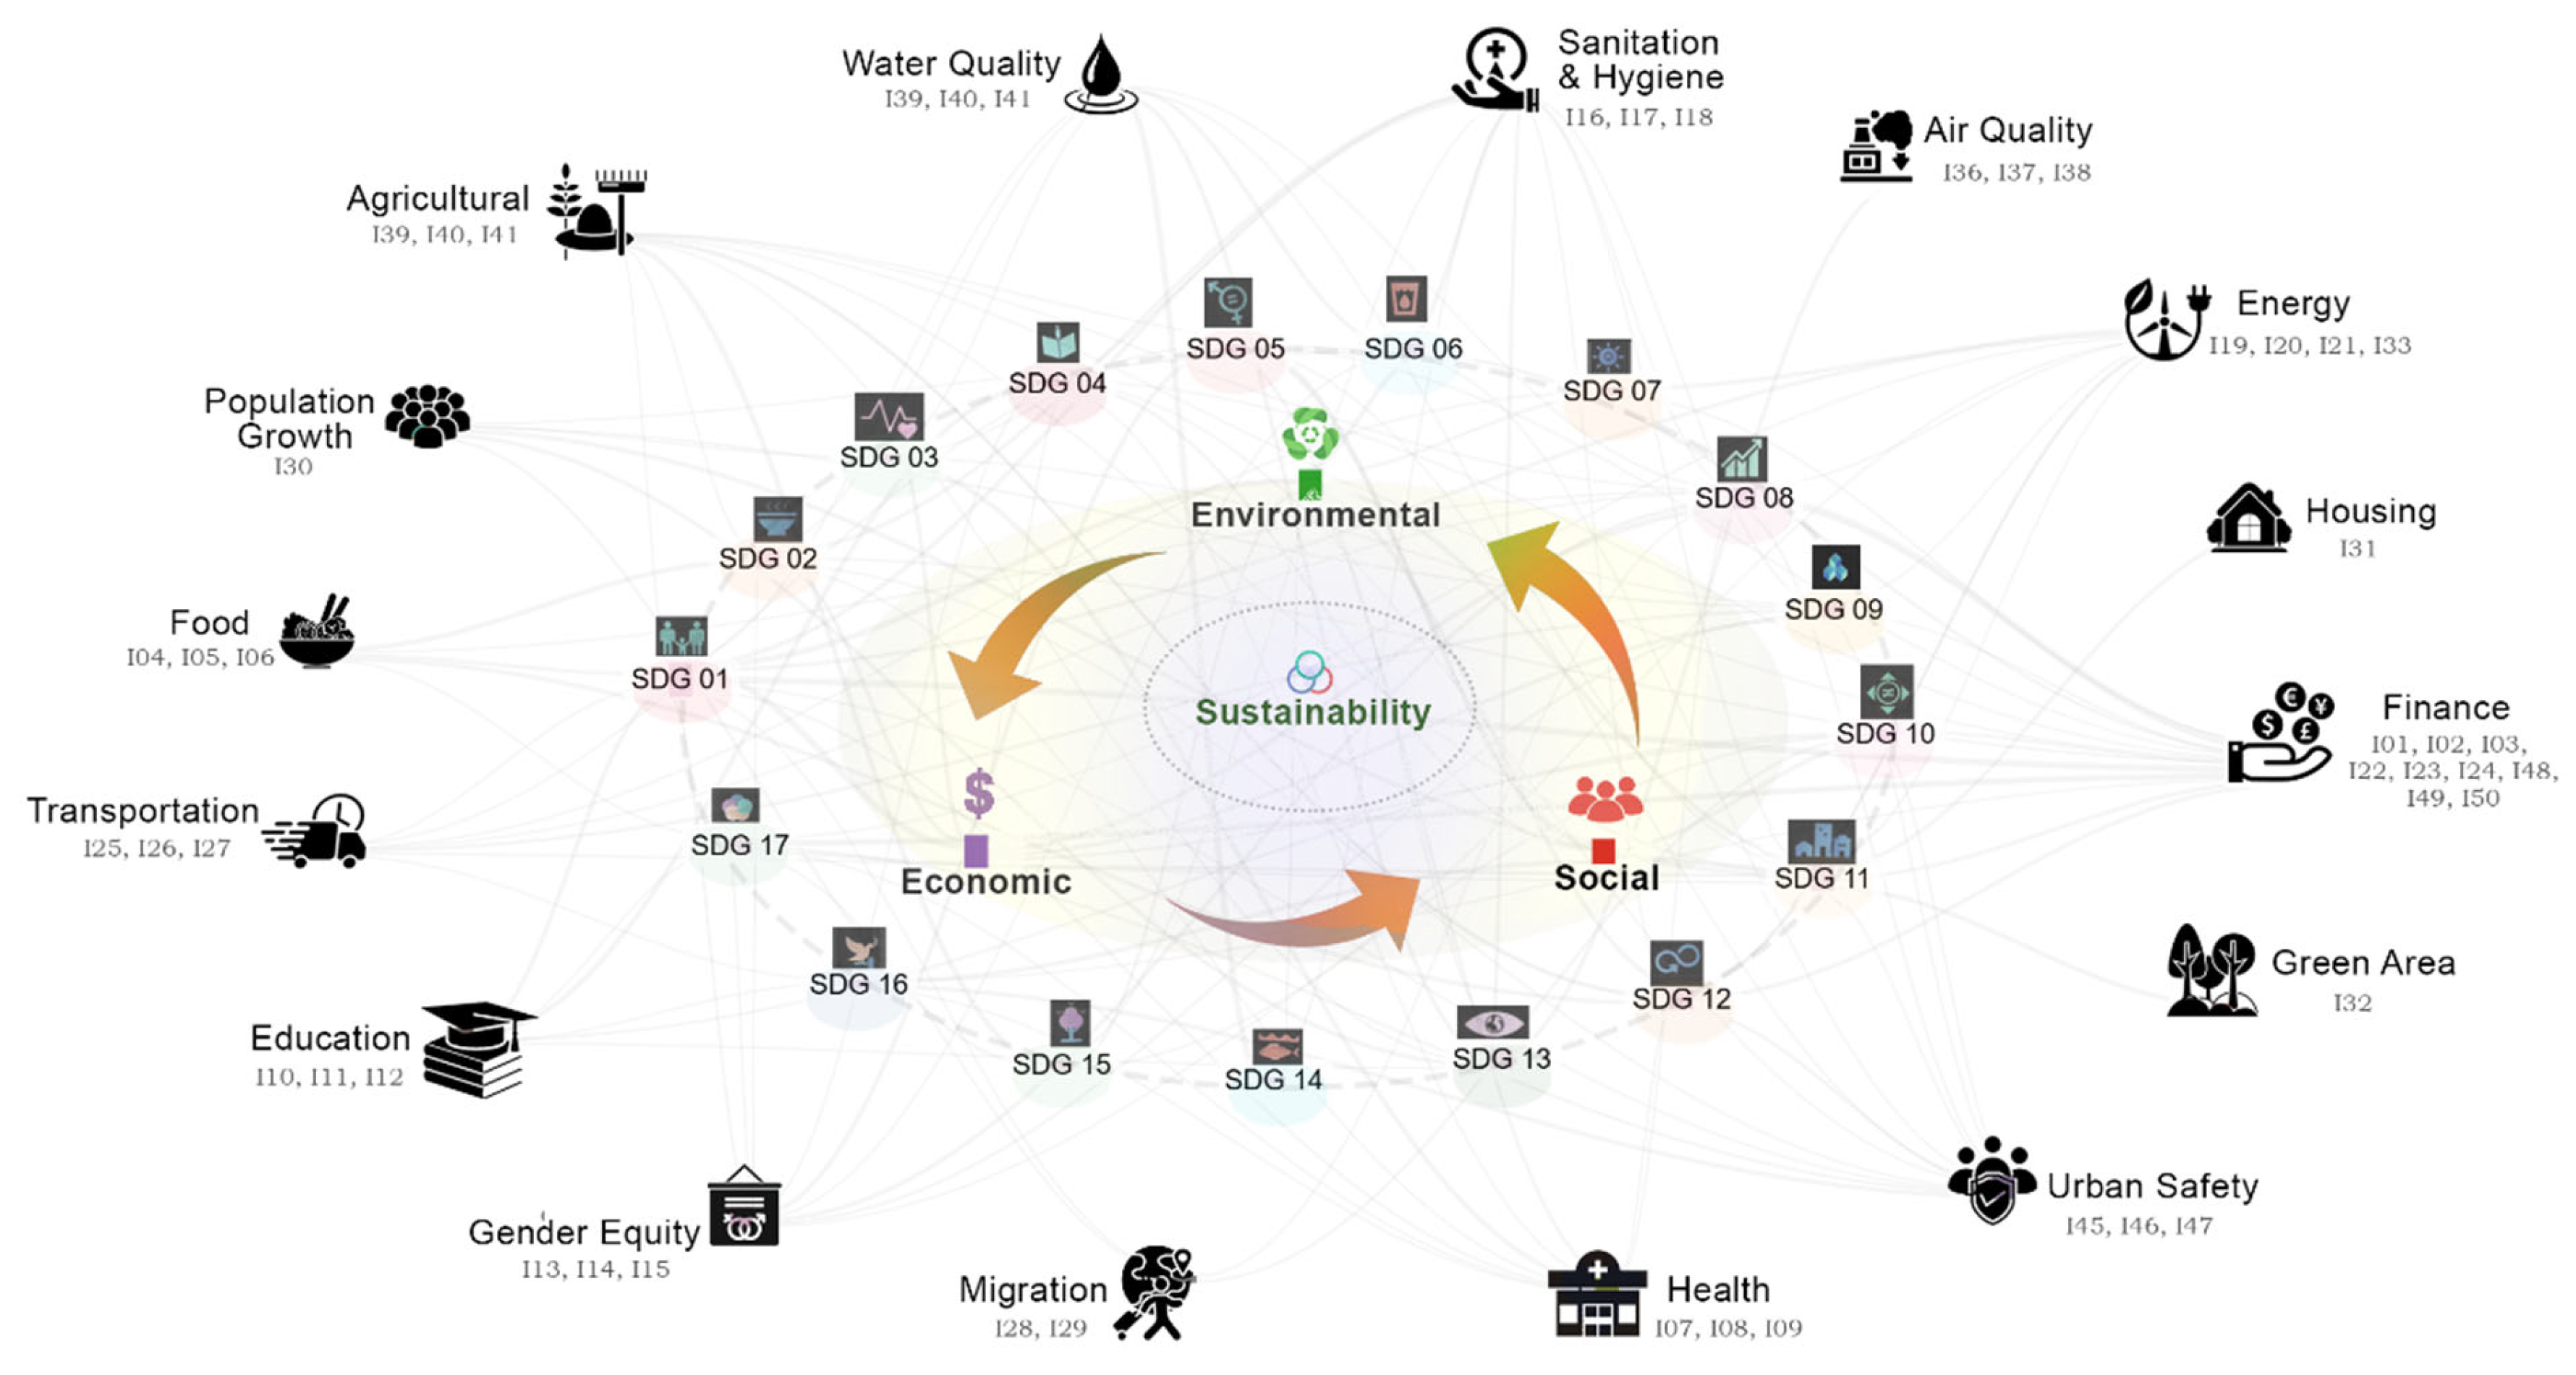
4.3. Indicator Selection, Categorization, and Linking to Sustainable Performance

Table 1 summarizes a comprehensive set of 50 indicators selected to address the diverse sectors and sustainability pillars [9], covering the 17 SDGs. These indicators were chosen and arranged to describe the main features that could meet the standards of urban development and design, as previously demonstrated [20]. For instance, enhancing the air quality in cities is obtained by the achievement of SDG#13 on climate change, and hence, the indicators of I#10: sulfur dioxide concentration, I#11: total suspended particles, and I#12: elevation above sea level were chosen in this goal. Moreover, the use of clean and affordable energy in cities is highly linked to the fulfillment of SDG#7 on modern energy, and thus, I#4: amount of petroleum extracted, I#5: amount of gas extracted, and I#6: percentage of households connected to the public network electricity were selected as the three indicators of this goal. The quantitative indicators represented measurable numerical values (e.g., GDP per capita, population density, and CO2; emissions), whereas the qualitative indicators captured subjective or policy-related aspects of urban sustainability (e.g., governance effectiveness, environmental policies, and social inclusion) [12].

4.4. Data Pre-Processing

Qualitative indicators were transformed into numerical values through a standardized scoring rubric, enabling their incorporation into the SDG modeling process. Binary (no or yes) indicator variables were assigned a value of 0 for the absence or failure of a policy or initiative, whereas a value of 1 reflected the presence or active enforcement of this indicator. An ordinal Likert scale (1–5) was considered for indicators that induced greater differentiation, such as those evaluating policy intensity or institutional engagement. These two scoring methods were applied to capture variation in implementation quality, ranging from minimal to fully comprehensive efforts, as previously reported [52]. The indicator values were then normalized by Equation (1), ensuring that all criteria were expressed on a comparable scale while preserving their relative proportions across cities:
N S c o r e = a a 2 + b 2 + c 2
where Nscore is the normalized score and a, b, and c are the raw data of the cities.
This data normalization procedure was arranged to create an indicator–city (I − C) matrix [4,53], giving a standardized form of [I − C]50×27 (see Supplementary Table S9). Pearson’s correlation coefficient (r) was used to refine the dataset by removing redundant or statistically insignificant indicators, ensuring that only the most informative variables were retained for further assessment. This “r” coefficient ranged from −1 for a strong negative correlation to +1 for a strong positive correlation, where values near 0 signify no correlation.

4.5. Selection of Essential Sustainable Development Goal (SDG) Targets for the Three Pillars of Sustainable Development

The 169 SDG targets were screened to give the main targets that showed either direct or indirect correlations with the sustainable indicators in cities. This screening procedure was performed by describing each goal by one to four targets (see Supplementary Table S10), and then a whole point “1” was assigned to each accomplished target. The score of each indicator was calculated by Equation (2), using the correlation between the number of targets achieved and the total number outlined by each goal [4]:
I S c o r e = 100 × ( t i T i )
where Iscore is the indicator score, ti is the number of achieved targets of the indicator, and Ti is the total number of targets for the specific SDG. For example, SDG#15 was selected to describe the fulfillment of I#16, “number of encroachments on agricultural lands”, because the expansion of urban areas into the agricultural zones tends to reduce available farmland, disrupt terrestrial ecosystems, “Target 15.3”, and deteriorate biodiversity and natural habitats, “Targets 15.5” [19]. These two targets were selected out of the twelve targets of SDG#15, assigning a score of 2/12 × 100 = 16% to I#16. Further, the estimated scores were multiplied by (−1) if the indicator reduces sustainability achievements [53] (e.g., increasing I#19 for a number of children who did not attend school negatively impacts the fulfillment of Target 4.5 related to equal access to different educational levels). This step was repeated for all 50 indicators using expert judgments and interviews (see questionnaire sheet in Supplementary Table S11) [54]. The results of this step are summarized in the [SDG − I]17×50 matrix (see Supplementary Table S10).

4.6. SDG-Based Model Scoring and Creation and City Ranking

There was a synergetic interaction between the 50 indicators, the 27 governorate capitals in Egypt, and SDGs targets, defining the three pillars of sustainable development (Figure 2). The previously estimated two matrices [SDG − I]17×50 and [I − C]50×27 were cross-multiplied to estimate the [SDG − C]17×27 matrix (Equation (3)), representing the score of SDG assigned to each city [55]:
[ S D G C ] ( 17 × 27 ) = [ S D G I ] ( 17 × 50 ) × [ I C ] ( 50 × 27 )
The scores of the estimated [SDG − C]17×27 matrix were analyzed by the Jenks Natural Breaks method [56], grouping the cities into three levels of sustainability performance. The cities were labeled as “Low”, “Medium”, and “High” according to the percentage of SDG achieved as <40%, 40–60%, and >60%, respectively (see Supplementary Table S2), following the ranking of cities from lowest to highest based on the smart city index [6].

5. Results

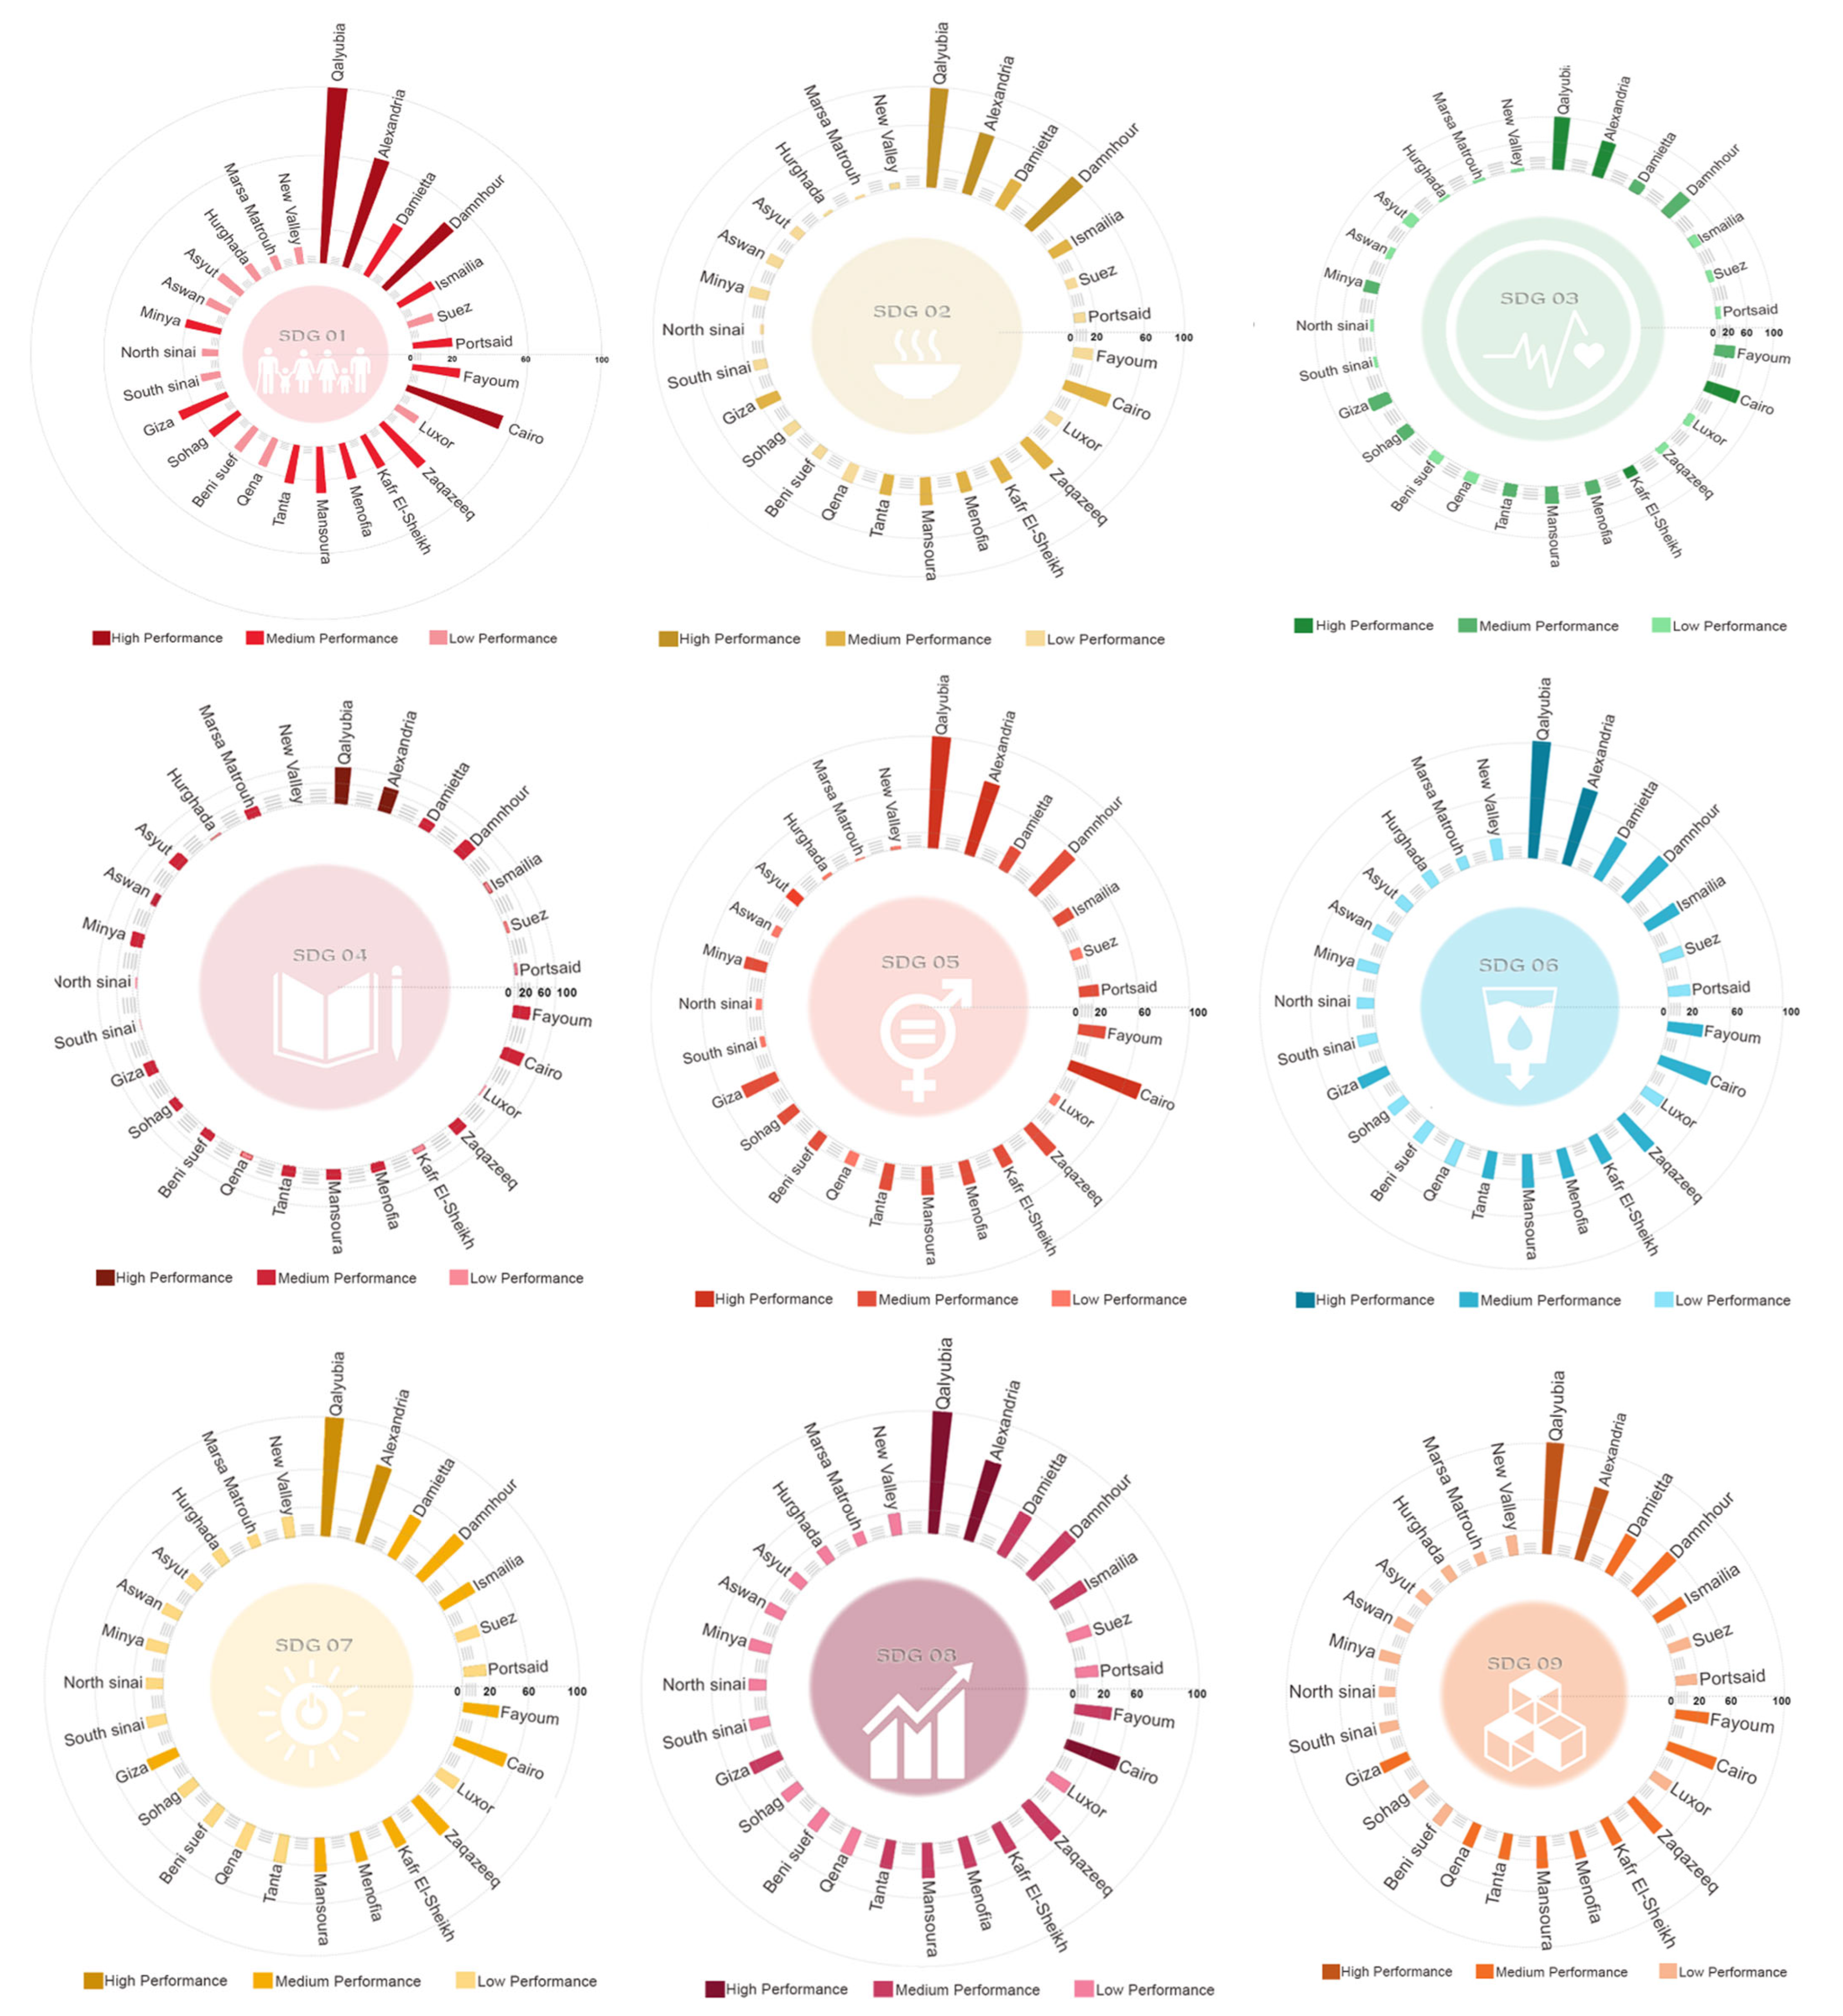
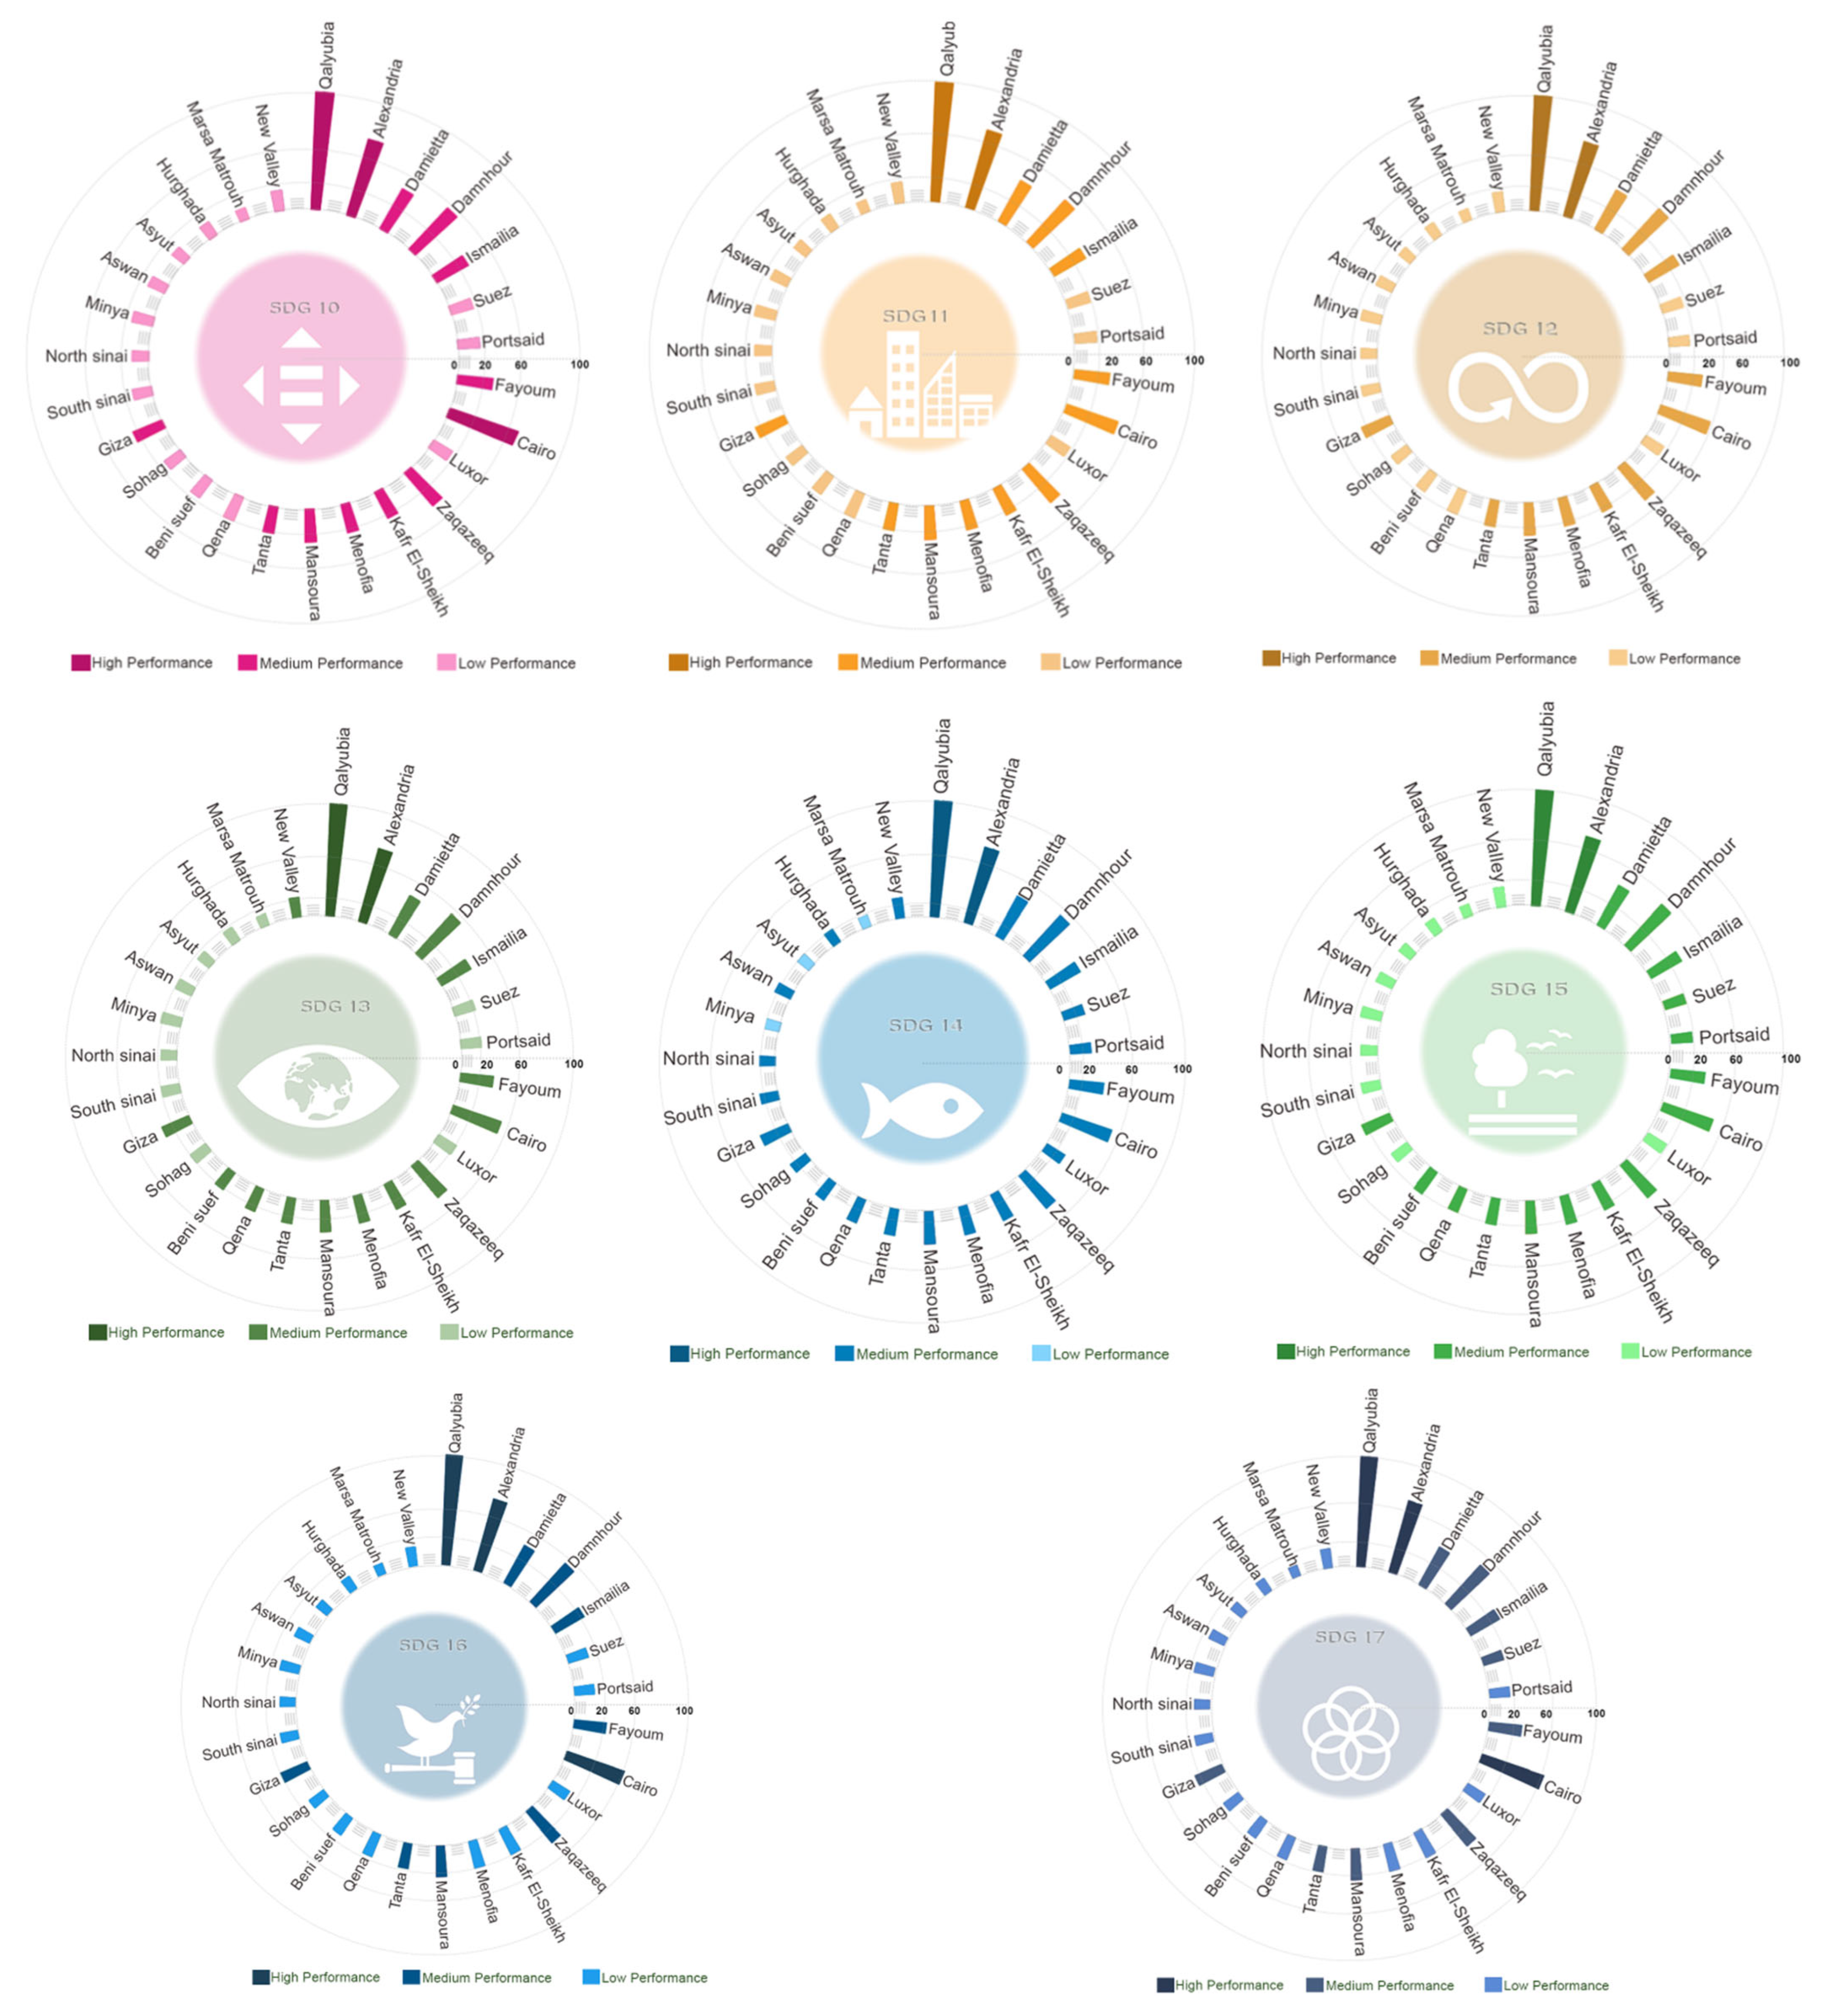
5.1. Assessment of City’s Progress Toward SDG Achievement

Initially, the selected number of indicators was screened to avoid redundancy of observations, improve the statistical validity of the SDG-based model, and enhance the interpretability of urban sustainability performance (see Supplementary Figure S4). This step also facilitated the classification of the 27 cities into the “Low”, “Medium”, and “High” categories based on the cities’ performance in fulfilling SDGs (Figure 3; see also the categorization of these cities in Supplementary Table S7).
The first category represented the “High” ranking cities, including Qalyubeya, Alexandria, Cairo, and Damanhur, owing to their ability to maintain several key indicators crucial for sustainable progress. Alexandria, as a coastal city, showed higher scores on I#15, “number of maritime associations” (74%), probably because it hosts around fifty such maritime companies and industries [57]. These organizations focus on coral reef restoration to reduce sea pollution (Target 14.2: protect marine and coastal ecosystems) and act as natural barriers against sea-level rise, “Target 13.2: climate change policies” [58]. These achievements are supported by developing active community engagement programs, where over 10,000 volunteers participate annually in beach litter clean-ups and marine conservation activities, “Target 14.a develop research capacity to contribute to marine biodiversity” [59].
Cairo showed higher scores on I#2, “households connected to public sanitation” (93%), and I#46, “infrastructure”, mainly related to Target 9.1, “sustainable and resilient infrastructure”. Cairo contains an integrated and highly connected transportation system, including extensive Metro lines, bus networks, and major highways, “Target 11.2 sustainable transport systems”. The Cairo Metro, for example, serves over 3 million passengers daily, making it one of the busiest and most active means of transportation in Africa and the Middle East [60]. Regarding human services, about 90% of households in Cairo are connected to the public sanitation system, which considerably reduces health risks “Target 3.8: health coverage” and promotes a cleaner urban environment, “Target 6.2: sanitation and hygiene services” [61]. This highly connected infrastructure enhances the ratio of green and public spaces to the number of people, facilitating more efficient and safer public areas (Target 11.7). Despite these advantages, some parts of Cairo face significant challenges related to air pollution. The city showed lower scores on I#10, “sulfur dioxide (SO2)” (20%), and I#11, “total suspended particles” (44%), delaying the achievement of Target 3.9, “number of deaths and illnesses from air pollution”. The anthropogenic sources of air pollution in Cairo include traffic emissions, representing >50% of the city’s total air pollutants [62], “Target 11.6: air quality in cities”. Additionally, the city could fulfill Target 16.6, “accountable and transparent institutions”, by launching new digital platforms (I#31), such as mobile-based tools, to report urban issues (e.g., traffic problems and infrastructure maintenance requirements).
The second category represents the Mansoura, Zaqazeeq, Damietta, Giza, Fayoum Kafr El-Sheikh, Menofia, and Ismailia cities, with “Medium” performance toward sustainability. Some of these cities entail insufficient values for essential key indicators that negatively impact their overall performance to fulfill more SDGs. For example, Mansoura represented a higher percentage of I#16 (59%) for urban encroachments on agricultural land, representing a significant environmental concern that undermines the city’s progress toward achieving Target 15.3: restore degraded land and soil. This agricultural land loss also impacts flora abundance (I#17: 73%), delaying the city’s capacity to restore ecosystems (Target 15.5: protect biodiversity and natural habitats). Safeguarding agricultural land from desertification and drought is essential in ensuring secure and equal access to crop productivity in Mansoura (Target 2.3). This step is also influenced by grain water productivity (measured as tons of harvested product per unit of irrigation water consumed or applied) and irrigation methods, showing a direct correlation with Target 6.4, “address water scarcity” [19].
Menofia has a low scoring value on (I#5: 15%) regarding the quantity of gas extracted, where the city should increase the share of the population consuming greener electricity mixed with low-carbon emissions. The city has a plan to expand national grid infrastructure to ensure access to electricity services (Target 1.4: access to basic services and facilities) and apply carbon prices to the energy sector (Target 7.a: clean energy technology). For instance, enhancing the technical performance of the main cooking practices (the fuel and the cook stove) in the households’ daily life of Menofia would support modern energy facilities (Target 7.1: access to affordable energy).
The third group is defined by the “Low” category, comprising 14 cities that heavily depend on a single development sector. The tourism sector in Hurghada contributes to more than 10% of the country’s GDP [21], representing 92% achievement of I#44, “capital investments of tourism”. The city’s financial progress is established by attracting both international and domestic tourists to its renowned Red Sea beaches and diving sites [63], highlighting tourism as a dominant contributor to shaping Hurghada’s development and prosperity (Target 8.9: promote sustainable tourism). The city announced a strategic plan to develop and implement financial tools for monitoring sustainable tourism, creating jobs, and promoting local culture (Target 12.b).
Suez has a high scoring value of 85% on I#48, “revenue from taxes charged on ships”, where the maritime and logistics sector in the city shares approximately 22% of Egypt’s GDP profile (Target 17.1: improve tax administration) [64]. The city’s economy depends particularly on the Suez Canal (a strategic passageway for navies), connecting the Mediterranean Sea to the Red Sea. This waterway is considered a vital artery for international trade, “Target 17.10: participate in the multilateral trading system”. To sustain this growth pattern, the city intends to enhance the infrastructure quality and operational capacity of the Suez Canal, supporting a range of associated firms related to shipping, logistics, and port services, “Target 9.4: upgrade infrastructure and retrofit industries”. Furthermore, the city is implementing measures to improve the health and safety of migrant workers by carefully monitoring I#25 and I#26, “distribution of planned and well-managed migration streams”, enforcing local labor laws, “Target 10.7: safe migration and mobility”.

5.2. Identifying Key Indicators Influencing the Establishment of Sustainable Cities

Based on the scoring performance of Egyptian cities (see Figure 3), SDG#11 was assigned as the main criterion in evaluating urban sustainability and planning among cities. As such, this goal shows strong synergetic interactions with other SDGs, aligning with the global urbanization trends [11]. Four indicators out of fifty exhibited the greatest impact on the cities’ ability to meet SDG#11 performance (see efficient indicator selection in Supplementary Figure S5). These four indicators (I#27; I#28; I#29; I#43) showed a direct relevance to the key urban targets (i.e., the findings are compared with the results of other scoring-based evaluation methods in Supplementary Table S12), which could be described as follows.

5.2.1. Effect of Cities’ Population Growth on Sustainable City Development

Figure 4 shows the scoring values of the four main indicators analyzed to examine their impacts on SDG#11 achievement. The findings revealed that the cities experiencing higher population growth rates could demonstrate a stronger impact on SDG#11 performance compared with other cities (Figure 4a). For instance, Cairo implemented smart accommodation services and comprehensive urban master plans to maintain mixed-use compact, and densely populated areas. Promoting compact urban growth intends to maximize land-use efficiency by integrating residential and commercial spaces into walkable neighborhoods, meeting Target 11.3, “enhance inclusive urbanization”. The city’s population growth also has a direct correlation with Target 11.2, “sustainable transport systems”, by providing convenient and affordable access to bicycles and encouraging residents to use cheap vehicles for short trips [3]. Additionally, cities have made advances in achieving Target 11.1, “affordable housing and upgrading slums”, by accessing reasonable accommodation to support this growing urban population without serious urban sprawl [11].

5.2.2. Effect of Cities’ Built-Up Area on Sustainable City Development

As illustrated in Figure 4b, mega-cities with expansive built-up areas, typically exceeding 1000 km2, often demonstrate a stronger impact on SDG#11 performance compared to cities with smaller built-up areas. This phenomenon could be explained by several interconnected factors, such as urban density, building orientation, and infrastructure development [22]. For instance, Cairo, with a built-up area of ≈2019 km2, could partially fulfill Target 11.6, “reduce adverse environmental impacts”, by adjusting the orientation of high-rise buildings to take advantage of the prevailing wind patterns. This approach is suitable to enhance natural ventilation airflow, “Target 3.9: reduce illness from air pollution”, minimizing the need for air conditioners in dense built-up areas in Cairo. Incorporating renewable energy sources, such as solar panels and wind turbines, into these high-rise buildings reduces the energy consumption patterns, “Target 12.1: sustainable consumption” and GHG by approximately 25%, “Target 11.b: adaptation to climate change” [65]. Increasing the built-up area also has a positive correlation with SDG#11 fulfillment by expanding urban public transport services toward sustainable mobility (Target 11.2). Limited housing availability in small-sized built-up areas could resist the growing demand for suitable accommodation and fundamental necessities, “Target 11.1: affordable housing and basic services”.

5.2.3. Effect of Cities’ Green Urban Areas (GUAs) on Sustainable City Development

As clarified in Figure 4c, cities with a high percentage of GUAs have a considerable influence on SDG#11 performance compared to those with limited green spaces. This phenomenon occurs due to enhancing the natural ventilation airflow facilities, including vertical gardens and green rooftops, provided by these GUAs, “Target 11.7: access to public spaces”. The cities with better GUAs could also accomplish Target 11.6, “reduce environmental impacts”, by mitigating the urban air pollution levels caused by the occurrence and movement of dust storms. The GUA’s health can also be promoted by incorporating vertical greenery systems into residential buildings, creating a living green façade that improves air quality and provides natural insulation [1].

5.2.4. Effect of Cities’ Gross Domestic Product (GDP) on Sustainable City Development

As demonstrated in Figure 4d, mega-scale projects have greater impacts on SDG#11 scoring compared to small-scale projects. Some ancient Egyptian cities (e.g., Cairo, Luxor, and Alexandria) with high economic strengths could meet Target 11.4, “protect cultural and natural heritage” by restoring and conserving several historic buildings. Deploying the multi-faceted approach, such as the implementation of urban drainage systems in the Catacombs of Kom El Shoqafa [66] to manage rainwater runoff and reduce flood risks from the weathering of stone monuments, complies with Target 11.5, “decrease economic losses”. The involvement of environmentally friendly materials in masonry repairs, such as lime mortar in Karnak Temple [67], complies with Target 11.c, “utilize local materials in buildings”. This pattern helps in maintaining the structural integrity and historical aesthetics of the buildings [17], further increasing the monetary value of tourism services in Luxor. The city’s GDP could also increase by incorporating advanced glazing techniques (e.g., double or triple-glazed windows) to reduce the heat loss of the historic structures (e.g., Citadel of Salah El-Din) while preserving their original features [68].

5.3. Employing the SDG-Based Score Model for Case Study Evaluation and Proposing Improvement Scenarios

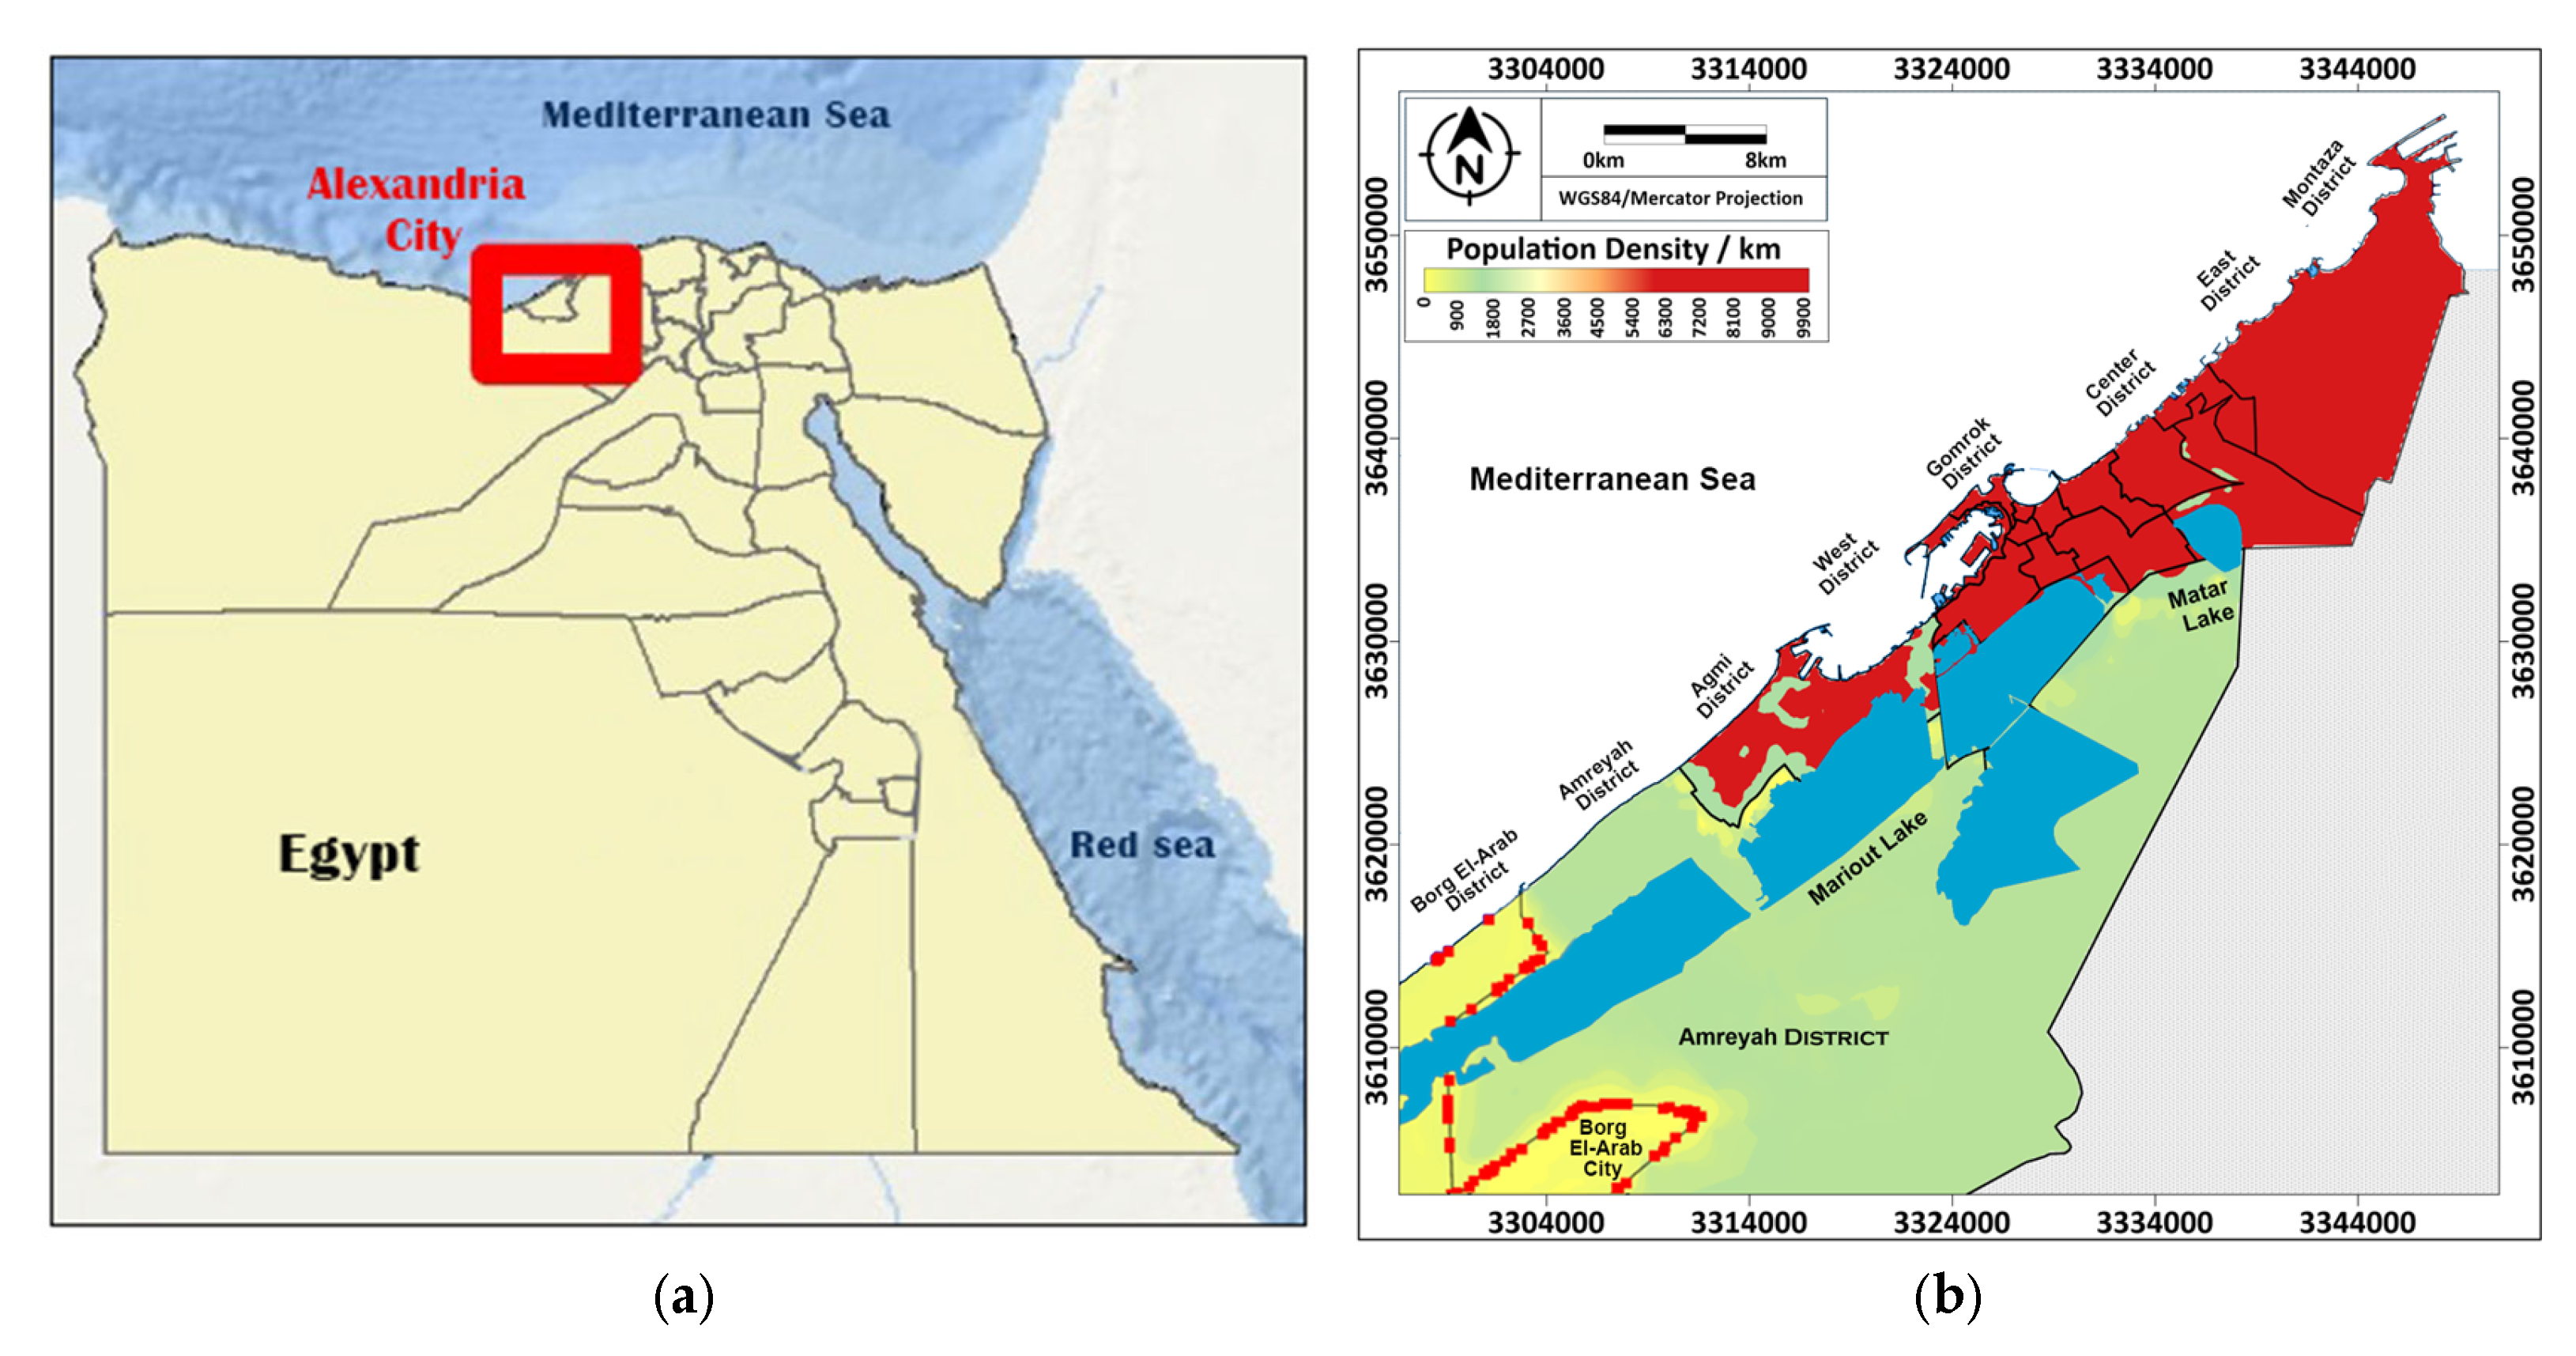
5.3.1. Evaluating Performance of Alexandria Using SDG#11 Scoring Approach

Three indicators, namely population growth, built-up area, and GDP of financial projects, exhibited an increasing trend over the 1985–2024 years (see Supplementary Table S13). However, there has been a decreasing pattern in the indicators related to GUAs, probably due to the lack of urban planning and design systems, negatively impacting Target 11.a, “ensure balanced territorial development”. The decline in the overall SDG#11 scoring performance by almost 10% encourages the policymakers to create strategic and conceptual frameworks to develop the selected indicators in Alexandria (see the city’s location in Figure 5a). For instance, a sharp decline in GUAs by about 86% from 1985 to 2024 severely impacted the city’s ability to meet Target 11.7, “accessible and environmental-friendly zones”. It was suggested that the urban planners would optimize the GUA configuration within the city by implementing additional parks and enlarging their tree canopy cover, as previously demonstrated in Vancouver, Canada [69].

5.3.2. Proposed Scenarios for Improving SDG#11 Achievement

The observations of the proposed SDG-based model could develop multiple strategies to address the challenges that delay SDG#11 fulfillment:
  • Re-allocation of population density:
Because population growth was an essential factor in determining the SDG#11 score (Figure 5b), this scenario attempts to guarantee a homogeneous distribution of population density. The expected future population would rise to approximately 10.3 million by the year 2054 with a growth rate of almost 2% per year (Equation (4)):
F u t u r e   p o p u l a t i o n = P r e s e n t   p o p u l a t i o n × 1 + g r o w t h   r a t e y e a r s
The SDG#11 score of Alexandria is delayed due to dense population and household concentration in the northeastern districts (e.g., Montaza, East, and Central), along with the persistent underutilization of southwestern zones (e.g., Amreya and Borg El-Arab). Hence, the proposed urban strategy emphasizes a spatially inclusive and balanced development approach by allocating medium-density dwellings in the western areas. This option could optimize and reduce the cost of key urban services, such as water supply and disposal facilities, having significant potential to Target 11.1, “affordable accommodation and essential services” improvement. Attracting more citizens to move to Alexandria’s urban centers (i.e., the planned western areas) is also suitable for enhancing Target 11.3, “sustainable urbanization”, by developing new residential and economic hubs. Moreover, Target 11.2 achievement can be promoted by improving road safety, connecting infrastructure facilities to the major highways, and expanding public transportation networks. Due to improving Targets 11.1, 11.2, and 11.3, the SDG#11 fulfillment would rise from 37% in 2024 to 44% in 2054. As such, this scenario supports SDG#11 achievement by relieving urban traffic congestion around the core districts while encouraging the expansion and intensification of the city’s urban footprint through well-integrated and strategically guided population distribution.
  • Increasing the built-up area:
The land area required for the extension and infill development of Alexandria was calculated according to the expected population number and the selected density of 12,000 person/km2. In these medium-density urban zones, the built-up area could share 50–70% of the entire city’s land [70]. The additional urban parts are designed to maintain sufficient agricultural lands, making Alexandria suitable for investment in agribusiness, food processing, and smart irrigation systems. This approach complies with Target 11.a, “support development planning”, by uniformly re-distributing the city’s residents and mitigating the issues associated with the sprawling urban patterns (e.g., loss of agricultural lands and population agglomeration). This proposed scenario also has a positive impact on Target 11.3 fulfillment by ensuring compatible land uses and functions (Figure 5c), such as residential (30%), commercial (40%), community services (20%), infrastructure (10%), and others (10%). Developing these areas would necessitate the presence of urban nodes, such as parks, promenades, and other leisure spaces, complying with Target 11.7, “access to safe and public spaces”. These facilities would not only provide pleasurable experiences to the residents and tourists but also promote investment expansion and enhance the city’s function as a popular tourist destination, “Target 11.5: reduce economic losses”. As such, the balance between built-up areas, urbanized places, and open spaces prevented urban sprawl expansion, further improving the city’s SDG#11 score by 45%.
  • Green urban areas (GUAs):
Figure 5d reveals that expanding GUAs by more than 50% due to the presence of Lake Mariout would serve as a “blue backbone” for the extension of green corridors and ecological buffers along the water body, “Target 11.7: green and public zones”. Establishing waterfront greenways and spaces near the Alexandria coastal zone could assist in adopting and implementing national disaster risk mitigation scenarios, effectively reducing the negative impacts of anthropogenic activities on human health, “Target 11.b: integrated plans for climate change adaptation”. Moreover, constructing this proposed green belt would conserve agricultural lands and maintain soil rhizosphere food webs, enhancing crop marketing to the farming community in response to population dynamics, “Target 11.a support positive economic”. It is suggested that the available groundwater and desalinated water in the study area could contribute to the cultivation of the proposed green buffer zone.
  • Economic potential
Alexandria’s GDP is expected to rise by >70% in the year 2054, with a growth rate of nearly 6% (Equation (5)):
G D P ( F u t u r ) = [ G D P ] ( C u r r e n t ) × 1 + G r o w t h   R a t e 100 y e a r s
The sensitivity analysis results demonstrated that developing profitable projects for the urban residents would exhibit the greatest impact on advancing the SDG#11 performance (see Supplementary Figure S6). This high correlation could be because the production of goods in Alexandria allows the city to establish transit-oriented development (TOD) to optimize transportation that guarantees flexible movement of people and heavy-duty trucks (Target 11.2). Moreover, increasing the amount of money that the Alexandria government spends on services or activities can attract small-scale chemical and plastic industries, workshops, and smart factories (see Figure 5e), promoting economic clustering and connectivity with the urban core (Target 11.a: positive economic planning). Also, increasing Alexandria’s exports minus its imports would create special economic zones between the urban core and peripheral regions, further expanding the number of schools, hospitals, roads, and bridges, “Target 11.4 cultural and natural heritage” [65].

6. Discussion

6.1. Classification of Cities According to Their Performances in Fulfilling Sustainable Development Goals (SDGs)

The urban transformation of traditional cities toward sustainability is an essential topic worldwide, requiring quantitative and qualitative investigations and collaboration between the public sector, individuals, and non-governmental organizations. For instance, several developing countries aim to maintain the socio-financial knowledge of inhabitants and reduce environmental impacts (e.g., low-carbon cities) in residential areas. This study provides much-needed and relevant information on the ranking of various cities in Egypt, which is one of the main developing countries recognized as the third largest economy in Africa, by assigning scores to the 17 SDGs achieved. This step was justified by defining 50 indicators highly correlated with the three pillars of sustainable development, giving the [SDG − I]17×50 matrix. Quantitative and qualitative observations of these 50 indicators were collected to describe the urban sustainability of 27 cities in Egypt, denoting the [I − C]50×27 matrix. The synergetic interaction of these two matrices was used to calculate [SDG − C]17×27, describing the SDG scores assigned to each city [53]. Further, the cities were arranged into three ranking categories of “High”, “Medium”, and “Low” according to the SDGs achieved (see Supplementary Table S2). This arrangement was used to define the unmanaged sustainability goals of each city, where decision-makers would utilize the proposed SDG model to overcome the urban sustainability challenges. For example, Qalyubeya maintained higher scores on I#33, “number of employed persons”, and I#34, “average employee salaries”, by establishing competitive value-added and labor-intensive manufactories. This city contains several industries and firms (e.g., textile and cement), increasing the achievement of Target 8.2, “maintain higher levels of productivity of economies”. For instance, the textile industrial sector in this city is particularly prominent, with around 150 factories that employ about 50,000 workers [71]. This industry not only enhances financial productivity but also raises societal awareness by promoting female participation in the labor force (I#22: number of women employed), further encouraging gender equality “Target 5.5” achievement [8]. In addition, increasing employment rates above 70% and average wages above USD 10,000 per capita, such as the condition of some cities in this “High” category, would substantially fulfill Target 8.1, “sustain per capita economic growth” [72].
Damanhur depicted higher scores on I#36, “growth rate of cereal yield”, because the city aims at implementing resilient agricultural activities and plant gene banks for doubling farmers’ income “Target 2.5: crop genetic diversity”. In a comparable developing country, the Kilimanjaro region in Tanzania has implemented sustainable agriculture practices to safeguard food security and promote the livelihoods of about 70% of Tanzanian farmers [73], aligning with Target 2.3, “ensure cereal yield progress”. The city attempts to enhance international cooperation by employing diversified cropping systems and vegetation banks, “Target 2.a: focus on agricultural research from the practitioners’ and scientists’ perspective”. However, some parts of the city face social challenges regarding the progress in the educational sector (I#19), probably due to the high percentage of children not attending schools. This indicator negatively impacts the fulfillment of Target 4.1, “ensuring equitable education”, and hence, the city has a plan to develop a better quality of early childhood education [43]. Moreover, the city’s lower parental literacy (I#21) affects the development of an educated workforce essential for technical expertise and innovation in infrastructure projects, “Target 4.6: achieve literacy”.

6.2. Defining the Main Indicators Influencing the Fulfillment of SDG#11

It was found that the SDG#11 scores on an integrated assessment of urban sustainability were highly influenced by four indicators describing population growth, built-up area, green spaces, and GDP per capita.
Port Said is responsible for trading a substantial volume of the country’s imports and exports, linking I#43, “GDP of financial projects”, with the fulfillment of Target 11.5, “decrease the direct economic losses”. For instance, the city seeks to invest in repairing and strengthening structural parts that can improve the drainage system’s performance against extreme weather events. This objective further reduces the risk of economic disruptions and disasters to achieve Target 1.5, “reduce exposure to climate-related disasters”, by upgrading housing in areas vulnerable to floods. This target showed a synergetic interaction with I#35, “number of households” due to reducing the number of flood-affected households by 25%, further improving urban connectivity and the resilience of about 50,000 low-income residents.
Mansoura could fulfill Target 11.2 by expanding public transport and services to effectively manage the growing number of drivers and passengers, where this target is interconnected to I#27, “population growth”. This sustainable urban mobility plan is essentially linked to Target 3.6 by implementing dedicated bus lanes that can significantly reduce road traffic injuries and accidents [11]. For example, the city’s policymakers have noticed a reduction in road traffic injuries by 15% and traffic accidents by 20% after decreasing the number of private vehicles on the roads by 10% [74].
Target 11.3 on “inclusive and sustainable urbanization” is influenced by I#28, “built-up area”, where some cities such as Alexandria can attract more employees and tourists by promoting better green environments (plantation coverage rate). This objective positively matches Target 11.6, attempting to reduce the adverse per capita environmental impact with a particular focus on improving air quality (e.g., particulate matter PM10 and PM2.5). The city could also achieve Target 11.6 by implementing effective waste recycling strategies to manage the additional garbage, rubbish, and package and construction materials generated from the urban sprawl.
A similar pattern was noticed in Damietta that had a significant potential to enhance Target 11.7 by expanding the public and green spaces as a proportion of the total city space “I#29: green urban area”. This aim is considerably linked to Target 13.1, which strengthens the resilience to climate change (e.g., the plant biomass assimilates large amounts of CO2 during photosynthesis), reducing the city’s overall carbon footprint. As such, Damietta intends to transform underutilized urban areas into parks, community gardens, and green corridors, acting as natural carbon sinks (Target 12.2: manage natural resources).

6.3. Validation of the Proposed Model Using Alexandria as a Coastal City That Faced Several Environmental Challenges over Recent Years

The proposed SDG-based model is beneficial for decision-makers in Alexandria to define the strategic plans, overcoming the limitations of urban sprawl characterized by dispersed and ribbon-like developments (i.e., the developed model was also applicable to other benchmark case studies in Supplementary Tables S14–S16). For instance, Alexandria’s rapid population growth negatively affects Target 11.3, “inclusive urbanization”, due to the presence of fragmented built environments, with sprawling low-density and disconnected high-density residential districts [7]. Furthermore, expanding the built-up area with improper planning adversely impacts Target 11.2, “sustainable transport systems”, because of creating isolated neighborhoods, further reducing accessibility to essential services (e.g., public transportation). Moreover, the lack of green spaces over the years has negatively impacted Target 11.7, “accessible green areas”, due to the absence of recreational zones responsible for managing the spatial separation and public activities of several city parts [75]. Investing in Alexandria’s infrastructure construction (e.g., smart waste management) attempts to improve the integrity and connectivity across various urban zones, contributing to Target 11.a, “financial interaction between urban areas”.

7. Conclusions, Implications, and Research Limitations

7.1. Theoretical and Practical Implications

The study broadens the understanding of sustainable cities, especially those that can attract both foreign and domestic investments, by investigating the connection between the SDG achieved and a set of enviro-socio-economic indicators. The estimate [SDG − C]17×27 matrix (see Equation (3)), representing the score of SDG assigned to each city, serves as a theoretical approach for classifying the cities into “Low”, “Medium”, and “High” according to their sustainability levels. The conceptual framework (see Figure 1) can be used by decision-makers in different sectors, such as public health, education, and governance, to prioritize the environmental challenges accompanied by water scarcity and quality, low-carbon energy sources, and domestic waste recycling. The study’s theoretical contributions have implications for both practitioners and academics involved in the transition to sustainable and smart urban paradigms.
The study also exhibits considerable practical implications for decision-makers, policymakers, and stakeholders, particularly in identifying and classifying the sustainability status in cities using a set of indicators (e.g., water, air, energy, poverty, education workforce, and housing). The selected indicators in Table 1 are practical because they can be continuously updated by modifying the collected qualitative and quantitative data or introducing additional criteria to ensure that the scoring findings remain relevant and effective to other urban scales globally. The SDGs scoring in Figure 3 can guide the decision-makers to create more effective strategies for sustainable urbanization in most developing countries that experience rapid industrialization, population growth, waste generation, and energy demand. Especially, meeting the SDG#11 performance can enable governments, policymakers, and public sectors to define the essential scenarios needed to strengthen the residents’ quality of life and human settlement planning.

7.2. Overcoming Study Limitations

Like any academic and professional study in the context of urban development, this work has certain limitations. Table 2 highlights key challenges encountered during the sustainability assessment process and suggests corresponding strategies to address them. These limitations include issues related to data availability, indicator selection, and geographical scope, further affecting the depth and accuracy of sustainability evaluations. To address these challenges, recommendations are made to enhance data collection processes, expand indicator sets, and apply advanced techniques (e.g., machine learning) to improve analysis outcomes.

7.3. Final Remarks

This study successfully developed an adequate modeling tool that could classify the cities based on the achievement of most SDGs (i.e., low, medium, and high scoring), especially SDG#11 for sustainable urban development. This tool was appropriately employed to assess Egyptian sustainability status, where this country aims to overcome the lack of food, electricity, and water services and supplies. The SDG-based model was created by collecting multisource big data from different activities/sectors (e.g., industrial, agricultural, tourism, and fishing), identifying 50 techno-enviro-economic indicators. The proposed SDG-based model was also useful in creating four different scenarios involved in enhancing the achievement of SDG#11/targets by 2054 in Alexandria as a coastal city. As such, the study outputs are beneficial to urban planners and policymakers for establishing alternative strategies that could strengthen national and regional development urban planning in most developing countries worldwide. Future studies should focus on refining the model and expanding its applicability across diverse urban contexts, thereby offering a roadmap to understand urban sustainability and SDG progress on a global scale.

Supplementary Materials

The following supporting information can be downloaded at https://www.mdpi.com/article/10.3390/su17125317/s1, Figure S1: Theoretical transition toward SDG#11 illustrated through the historical evolution of urban development models. The timeline traces key paradigms from early spatial models, such as the Concentric Zone Model (1925) and Central Place Theory (1933), through mid-20th-century theories like the Growth Pole Theory (1950), to contemporary frameworks emphasizing sustainability, smart growth, and resilience. This conceptual progression culminates in the adoption of SDG#11 by the United Nations in 2015, promoting inclusive, safe, resilient, and sustainable cities and human settlements; Figure S2: Distribution of city type clusters across Egypt’s governorates. This figure presents the classification of Egyptian cities into distinct functional clusters based on their predominant economic and geographic characteristics. The most common city type is the “Agricultural Hub,” followed by “Industrial City” and “Tourism City.” Less frequent clusters include “Eco-Tourism Cities” and “Oasis/Renewable Energy Hubs”; Figure S3: Case study, Alexandria, Egypt, which has a 32 km coastline that runs along the Mediterranean Sea. The city has experienced significant historical population growth and high-density urbanization, resulting in intense urban expansion and land-use changes [75]. The city serves as a vital hub for more than one-third of Egypt’s industrial activities, and it is widely recognized as a leading Mediterranean coastal destination [65]. Maps indicate a consistent increase in built-up areas and a corresponding decrease in green urban areas over the studied period (1985, 2013, 2017, and 2024); The maps were generated using remote sensing data from Landsat 5, Landsat 8, and Sentinel-2 satellites, with spatial resolutions adjusted to ensure consistency in the analysis across the different time periods; Figure S4: Pearson Correlation Matrix for 57 sustainability indicators across 27 Egyptian cities (normalized). This heat map visualizes the strength and direction of relationships among 57 enviro-socio-economic indicators used in the sustainability assessment model. Dark blue shades indicate strong positive correlations (e.g., between employment rate and GDP per capita), while white or light blue areas suggest weak or no correlation (e.g., public transportation usage and literacy rates). Transitioning hues toward light blue and white reflect negative correlations, such as the inverse relationship between urban expansion and air quality index (AQI), emphasizing environmental trade-offs in rapidly growing cities; Figure S5: PCA clustering for selection of four main indicators influencing [SDG − C] model (a) clustering PCA plot: Clustering of indicators influencing [SDG − C] model, (b) biplot of the PCA: Longer arrows signify stronger contributions to the principal component; Figure S6: Validation of the proposed SDG-based model. Sensitivity analysis of SDG 11 score with ±20% parameter variations. The plots illustrate the normalized percentage impact of variations: (a) population growth, (b) built-up area, (c) green urban area, and (d) GDP on the SDG 11 score; Table S1: Definition of the three pillars of sustainable development used to assess the cities performance toward SDGs achievement; Table S2: City-level classification by SDG performance category based on key indicator strengths; Table S3: Comparative summary of prior urban sustainability studies in Egypt and the added value of the current study; Table S4: Summary of recent articles (literature) on cities evaluation based on SDGs and their main findings; Table S5: Core research questions covered by the current study to create a model that can assign scores to different cities based on their ability to achieve multiple SDGs criteria and indicators; Table S6: Comparative overview of major sustainability assessment tools and global benchmarking models for evaluating urban SDG performance. The table highlights each framework’s geographic scope, scale of application, focus areas, key metrics, aligned SDG targets, and limitations when applied in developing countries. It underscores the complementarity between project-level tools (e.g., LEED, BREEAM) and city/national-level indices (e.g., SDG Index, Urban Monitoring Framework) in promoting sustainable urban development; Table S7: City-level classification by geographic zone, economic activity, and functional cluster across Egypt; Table S8: Matrix of normalized indicators with Egyptian cities ([I − C]50×27); Table S9: Main targets having either direct or indirect correlations with SDGs, where each goal is covered by one to three targets; Table S10: Matrix of correlation between indicators and SDGs ([SDG − I]50×17); Table S11: Expert evaluation form for sustainability indicators, showing expert profile, indicator evaluation, open feedback, and interpretation guideline. This table summarizes expert evaluations of key sustainability indicators, spanning environmental, social, and economic dimensions. It captures expert profile information, quantifiable indicator values, and standardized Likert scale ratings for both relevance and measurability. The form also incorporates open-ended feedback to refine indicator selection and classification. An integrated interpretation guide facilitates the analysis of mean scores and standard deviations, facilitating the validation and integration of indicators into SDG-based urban sustainability models; Table S12: Application of principal component analysis (PCA), analytic hierarchy process (AHP), and sensitivity analysis to determine the key indicators influencing SDG#11 variation; Table S13: Proposed values used to estimate Alexandria’s evolving patterns of urbanization and encroachment on natural landscapes within 1985–2054, describing the scores on SDG#11; Table S14: Matrix of correlation between four indicators and SDG#11 ([SDG − I]4×1); Table S15: Matrix of four normalized indicators with four different cities ([I − C]4×4); Table S16: Performance ranking of SDG#11 fulfillment for four different cities worldwide based on the proposed SDG-based model [6,11,29,30,56,65,75,76,77,78,79,80,81,82,83,84,85,86,87,88,89,90,91,92,93,94,95,96,97,98,99,100,101,102,103,104,105,106,107,108,109,110,111,112,113,114,115,116,117,118,119,120,121,122,123,124,125,126,127,128,129,130,131,132,133,134,135,136,137,138,139,140,141,142,143,144,145,146,147,148,149,150,151,152,153,154,155,156,157,158,159,160,161,162,163,164,165,166].

Author Contributions

Conceptualization, M.F. and M.N.; methodology, T.A.; validation, M.N.; formal analysis, T.A.; investigation, T.A.; writing—original draft preparation, T.A.; writing—review and editing, M.N.; visualization, E.E. and M.N.; supervision, E.E., M.F. and M.N. All authors have read and agreed to the published version of the manuscript.

Funding

This research received no external funding.

Institutional Review Board Statement

Not applicable.

Informed Consent Statement

Not applicable.

Data Availability Statement

The data supporting this study’s findings are included in the article and Supplementary Materials.

Acknowledgments

The first author acknowledges Egypt–Japan University of Science and Technology, E-JUST, and the Japan International Cooperation Agency (JICA).

Conflicts of Interest

The authors declare no conflicts of interest.

References

  1. Jorge-Ortiz, A.; Braulio-Gonzalo, M.; Bovea, M. Assessing urban sustainability: A proposal for indicators, metrics and scoring—A case study in Colombia. Environ. Dev. Sustain. 2023, 25, 11789–11822. [Google Scholar] [CrossRef]
  2. Michalina, D.; Mederly, P.; Diefenbacher, H.; Held, B. Sustainable Urban Development: A Review of Urban Sustainability Indicator Frameworks. Sustainability 2021, 13, 9348. [Google Scholar] [CrossRef]
  3. Zhou, X.; Dong, Q.; Huang, Z.; Yin, G.; Zhou, G.; Liu, Y. The spatially varying effects of built environment characteristics on the integrated usage of dockless bike-sharing and public transport. Sustain. Cities Soc. 2023, 89, 104348. [Google Scholar] [CrossRef]
  4. Heiba, Y.; Ibrahim, M.; Mohamed, A.; Fujii, M.; Nasr, M. Developing smart sustainable irrigation matrix (SIM)-based model for selection of best irrigation techniques: A framework to achieve SDGs. J. Clean. Prod. 2023, 420, 138404. [Google Scholar] [CrossRef]
  5. United Nations. Transforming Our World: The 2030 Agenda for Sustainable Development; Resolution Adopted by the General Assembly on 25 September 2015, A/RES/70/1; United Nations: Geneva, Switzerland, 2015. [Google Scholar]
  6. Abu-Rayash, A.; Dincer, I. Development of integrated sustainability performance indicators for better management of smart cities. Sustain. Cities Soc. 2021, 67, 102704. [Google Scholar] [CrossRef]
  7. Soliman, A.; Soliman, Y. Exposing urban sustainability transitions: Urban expansion in Alexandria, Egypt. Int. J. Urban Sustain. Dev. 2022, 14, 33–55. [Google Scholar] [CrossRef]
  8. Diab, O.; Hindy, S. Women and Economic Reform in Egypt: Impact of Production Changes on Female Waged Labor Force Participation. Middle East Crit. 2022, 31, 61–79. [Google Scholar] [CrossRef]
  9. Trantas, N. How Sustainable and Inclusive Is Economic Growth in Greece? Trends, Public Policies, and Their Effectiveness. In The Political Economy of Evaluation in Greece; Petrakis, P.E., Boufounou, P.V., Kostis, P.C., Eds.; The Political Economy of Greek Growth up to 2030; Palgrave Macmillan: Cham, Switzerland, 2024. [Google Scholar] [CrossRef]
  10. Hassan, O.; Mohamed, E.; Hassan, A.; Shaheen, M.; Bekheet, W. Sustainable urban development of mobility and streetscape in historic city quarters, an ancient street in Alexandria–Egypt, as a case study. Alex. Eng. J. 2023, 78, 378–389. [Google Scholar] [CrossRef]
  11. United Nations. Goal 11: Make Cities Inclusive, Safe, Resilient and Sustainable. 2016. Available online: http://www.un.org/sustainabledevelopment/cities/ (accessed on 5 November 2024).
  12. Aboulnaga, M.; Puma, P.; Eletrby, D.; Bayomi, M.; Farid, M. Sustainability Assessment of the National Museum of Egyptian Civilization (NMEC): Environmental, Social, Economic, and Cultural Analysis. Sustainability 2022, 14, 13080. [Google Scholar] [CrossRef]
  13. Abdel-Salam, M. Relationship between residential indoor air quality and socioeconomic factors in two urban areas in Alexandria, Egypt. Build. Environ. 2022, 207 Pt A, 108425. [Google Scholar] [CrossRef]
  14. Wu, P.; Song, Y.; Shou, W.; Chi, H.; Chong, H.-Y.; Sutrisna, M. A comprehensive analysis of the credits obtained by LEED 2009 certified green buildings. Renew. Sustain. Energy Rev. 2017, 68 Pt 1, 370–379. [Google Scholar] [CrossRef]
  15. Ferreira, A.; Pinheiro, M.; Brito, J.; Mateus, R. A critical analysis of LEED, BREEAM and DGNB as sustainability assessment methods for retail buildings. J. Build. Eng. 2023, 66, 105825. [Google Scholar] [CrossRef]
  16. CAGBC. Canada Green Building Council (CAGBC). 2021. Available online: https://www.cagbc.org/ (accessed on 3 March 2025).
  17. Illankoon, I.; Tam, V.; Le, K.; Weerakoon, S. Life-Cycle Cost Model for Green Star Office Buildings in Australia. In Sustainability in Energy and Buildings 2018; Kaparaju, P., Howlett, R., Littlewood, J., Ekanyake, C., Vlacic, L., Eds.; KES-SEB 2018 Smart Innovation, Systems and Technologies; Springer: Cham, Switzerland, 2019; Volume 131. [Google Scholar] [CrossRef]
  18. Allen, C.; Metternicht, G.; Wiedmann, T. Initial progress in implementing the Sustainable Development Goals (SDGs): A review of evidence from countries. Sustain. Sci. 2018, 13, 1453–1467. [Google Scholar] [CrossRef]
  19. Radwan, T.; Blackburn, G.; Whyatt, J.; Atkinson, P. Dramatic Loss of Agricultural Land Due to Urban Expansion Threatens Food Security in the Nile Delta, Egypt. Remote Sens. 2019, 11, 332. [Google Scholar] [CrossRef]
  20. Pukowiec-Kurda, K. The urban ecosystem services index as a new indicator for sustainable urban planning and human well-being in cities. Ecol. Indic. 2022, 144, 109532. [Google Scholar] [CrossRef]
  21. Abu Elyazid, A. Towards a Smart Tourism Destination: An Empirical Study on Hurghada, Egypt. Minia J. Tour. Hosp. Res. 2023, 16, 127–150. [Google Scholar] [CrossRef]
  22. Chavunduka, C.; De Vries, W.; Diaz, P.D. (Eds.) Sustainable and Smart Spatial Planning in Africa: Case Studies and Solutions, 1st ed.; CRC Press: Boca Raton, FL, USA, 2022. [Google Scholar] [CrossRef]
  23. Battisti, F. SDGs and ESG Criteria in Housing: Defining Local Evaluation Criteria and Indicators for Verifying Project Sustainability Using Florence Metropolitan Area as a Case Study. Sustainability 2023, 15, 9372. [Google Scholar] [CrossRef]
  24. Martín-Rojo, I. Strategic Planning for a Smart Sustainable City Model: The Importance of Public Administration and Enterprises Cooperation. In The Strategic Paradigm of CSR and Sustainability; Poveda-Pareja, E., Marco-Lajara, B., Úbeda-García, M., Manresa-Marhuenda, E., Eds.; Palgrave Studies in Governance, Leadership and Responsibility; Palgrave Macmillan: Cham, Switzerland, 2024. [Google Scholar] [CrossRef]
  25. Álvarez-Melcón, I.; Sisto, R.; Rodríguez, Á.; Pereira, D. Integrating the SDGs into Urban Regeneration: A Madrid Nuevo Norte Case Study Using an Adapted Voluntary Local Review Framework. Sustainability 2024, 16, 9727. [Google Scholar] [CrossRef]
  26. Pierce, J.; Costadone, L.; Mannetti, L.; Morpurgo, J.; Green, C.; Halder, M.; Guijosa, P.; Bogan, A.; Galt, R.; Hughes, J. Urban Nature Indexes tool offers comprehensive and flexible approach to monitoring urban ecological performance. npj Urban Sustain. 2024, 4, 22. [Google Scholar] [CrossRef]
  27. Alavijeh, N.K.; Shadmehri, M.A.; Esmaeili, P.; Dehdar, F. Asymmetric Impacts of Renewable Energy on Human Development: Exploring the Role of Carbon Emissions, Economic Growth, and Urbanization in European Union Countries. J. Knowl. Econ. 2024, 15, 17188–17212. [Google Scholar] [CrossRef]
  28. Ribeiro, V.; Fachinelli, A. Sustainable Mobility in the Century of Metropolises: Case Study of Greater London. Land 2024, 13, 1662. [Google Scholar] [CrossRef]
  29. Aliu, I. Residential Quality and Housing Preference Theories. In Urban Private Housing in Nigeria: Understanding Residential Quality and Housing Preference Dynamics in Metropolitan Lagos; Springer Nature: Cham, Switzerland, 2024; pp. 31–52. [Google Scholar] [CrossRef]
  30. Nguyen, T.; Vu, G. Eco-city Paradigm: Urban Planning Towards Sustainable Development Goals. E3S Web Conf. EDP Sci. 2023, 403, 01002. [Google Scholar] [CrossRef]
  31. EEAA. Egyptian Environmental Affairs Agency. 2024. Available online: https://www.eeaa.gov.eg/ (accessed on 5 November 2024).
  32. UNEP. United Nations Environment Programme. 2024. Available online: https://www.unep.org/ (accessed on 5 November 2024).
  33. Mingst, K.; Karns, M.; Lyon, A. The United Nations in the 21st Century, 6th ed.; Routledge: Milton Park, UK, 2022. [Google Scholar] [CrossRef]
  34. GEO. Global Environment Outlook. 2024. Available online: https://www.unep.org/geo/ (accessed on 5 November 2024).
  35. Mocnik, F.; Mobasheri, A.; Zipf, A. Open source data mining infrastructure for exploring and analysing OpenStreetMap. Open Geospat. Data Softw. Stand. 2018, 3, 7. [Google Scholar] [CrossRef]
  36. Abdelhaleem, F.; Basiouny, M.; Ashour, E.; Mahmoud, A. Application of remote sensing and geographic information systems in irrigation water management under water scarcity conditions in Fayoum, Egypt. J. Environ. Manag. 2021, 299, 113683. [Google Scholar] [CrossRef]
  37. Sallam, G.; Elsayed, E. Estimating relations between temperature, relative humidity as independed variables and selected water quality parameters in Lake Manzala, Egypt. Ain Shams Eng. J. 2018, 9, 1–14. [Google Scholar] [CrossRef]
  38. CAPMAS. Central Agency for Public Mobilization and Statistics. Household Income, Expenditure and Consumption Survey 2017–2018. 2018. Available online: https://www.capmas.gov.eg/Admin/Pages%20Files/2019123101612income1.pdf (accessed on 28 March 2024).
  39. Cultural Atlas: Egyptian Culture. Available online: https://culturalatlas.sbs.com.au/egyptian-culture (accessed on 5 November 2024).
  40. Statista. 2024. Available online: https://www.statista.com/topics/2510/egypt/ (accessed on 5 November 2024).
  41. UNESCO. United Nations Educational, Scientific and Cultural Organization. 2024. Available online: https://www.unesco.org/en/countries/eg (accessed on 5 November 2024).
  42. UNDP. United Nations Development Programme. 2024. Available online: https://hdr.undp.org/ (accessed on 5 November 2024).
  43. WB. The World Bank in Egypt. 2024. Available online: https://www.worldbank.org/en/country/egypt (accessed on 5 November 2024).
  44. UNICEF. United Nations International Children’s Emergency Fund. 2024. Available online: https://www.unicef.org/egypt/ (accessed on 5 November 2024).
  45. IMF. International Monetary Fund. 2024. Available online: https://www.imf.org/en/Countries/EGY (accessed on 5 November 2024).
  46. CBE. Central Bank of Egypt. 2024. Available online: https://www.cbe.org.eg/en (accessed on 5 November 2024).
  47. UNCTAD. UN Trade and Development. 2024. Available online: https://unctad.org/ (accessed on 5 November 2024).
  48. SIS. Egypt’s State Information Service (SIS). 2024. Available online: https://sis.gov.eg/?lang=en-us (accessed on 5 November 2024).
  49. Ragheb, A.; Aly, R.; Ahmed, G. Toward sustainable urban development of historical cities: Case study of Fouh City, Egypt. Ain Shams Eng. J. 2022, 13, 101520. [Google Scholar] [CrossRef]
  50. ESCWA. United Nations Economic and Social Commission. 2024. Available online: https://opengov.unescwa.org/node/1211 (accessed on 5 November 2024).
  51. UNFPA. United Nations Population Fund. 2024. Available online: https://egypt.unfpa.org/en (accessed on 5 November 2024).
  52. Alamoudi, A.; Abidoye, R.; Lam, T. The Impact of Citizens’ Participation Level on Smart Sustainable Cities Outcomes: Evidence from Saudi Arabia. Buildings 2023, 13, 343. [Google Scholar] [CrossRef]
  53. Heiba, Y.; Nasr, M.; Fujii, M.; Ibrahim, M. Improving irrigation schemes using sustainable development goals (SDGs)-related indicators: A case study of tomato production in pot-scale experimentation. Environ. Dev. Sustain. 2024, 26, 17721–17747. [Google Scholar] [CrossRef]
  54. Borghys, K.; Vandercruysse, L.; Veeckman, C.; Temmerman, L.; Heyman, R. Localizing the sustainable development goals in smart and sustainable cities: How can citizen-generated data support the local monitoring of SDGs? A case study of the Brussels Capital Region. Front. Environ. Sci. 2024, 12, 1369001. [Google Scholar] [CrossRef]
  55. Carlsen, L.; Bruggemann, R. The 17 United Nations’ sustainable development goals: A status by 2020. Int. J. Sustain. Dev. World Ecol. 2022, 29, 219–229. [Google Scholar] [CrossRef]
  56. Jenks, G. The data model concept in statistical mapping. Intern Yearb. Cart. 1967, 7, 186–190. [Google Scholar]
  57. Sislian, L.; Jaegler, A. A sustainable maritime balanced scorecard applied to the Egyptian Port of Alexandria. Supply Chain Forum Int. J. 2018, 19, 101–110. [Google Scholar] [CrossRef]
  58. Hafez, R.M.; Madney, I. Suez Canal Region as an economic hub in Egypt location analysis for the mass real estate appraisal process. Hous. Build. Natl. Res. Cent. J. 2020, 16, 59–75. [Google Scholar] [CrossRef]
  59. Lind, L.; Lundberg, E. Why are you cleaning beaches? A study on motivations of volunteer beach cleaners. J. Environ. Plan. Manag. 2024, 1–23. [Google Scholar] [CrossRef]
  60. Mohamed, W. Supporting a decision for metro station restoration based on facility assessment: Application to Cairo metro stations. J. Eng. Appl. Sci. 2022, 69, 9. [Google Scholar] [CrossRef]
  61. Bishoge, O. Challenges facing sustainable water supply, sanitation and hygiene achievement in urban areas in sub-Saharan Africa. Local Environ. 2021, 26, 893–907. [Google Scholar] [CrossRef]
  62. Sannigrahi, S.; Kumar, P.; Molter, A.; Zhang, Q.; Basu, B.; Basu, A.; Pilla, F. Examining the status of improved air quality in world cities due to COVID-19 led temporary reduction in anthropogenic emissions. Environ. Res. 2021, 196, 110927. [Google Scholar] [CrossRef]
  63. Khalaf, M.; Elias, W.; Wafek, G. Assessing tourism services quality and its effect on Egyptians tourists satisfaction in hurghada. Int. J. Herit. Tour. Hosp. 2020, 14, 73–87. [Google Scholar] [CrossRef]
  64. Chorev, S. The Suez Canal: Forthcoming Strategic and Geopolitical Challenges. In The Suez Canal: Past Lessons and Future Challenges; Lutmar, C., Rubinovitz, Z., Eds.; Palgrave Studies in Maritime Politics and Security; Palgrave Macmillan: Cham, Switzerland, 2023. [Google Scholar] [CrossRef]
  65. Hemeda, S. Geotechnical modelling of the climate change impact on world heritage properties in Alexandria, Egypt. Herit. Sci. 2021, 9, 73. [Google Scholar] [CrossRef]
  66. Ali, M.; Kotb, A.; Elsherif, A.; Hisham, R.; Osama, M. Environmental’s Design Role in the Reviving and Preserving of Architectural Heritage Case Study (Catacombs of Kom El Shoqafa). Procedia-Soc. Behav. Sci. 2016, 225, 132–144. [Google Scholar] [CrossRef]
  67. Fahmy, A.; Molina-Piernas, E.; Domínguez-Bella, S. Conservation Assessment of the Stone Blocks in the Northeast Corner of the Karnak Temples in Luxor, Egypt. Minerals 2024, 14, 890. [Google Scholar] [CrossRef]
  68. Luo, W.; Sandanayake, M.; Hou, L.; Tan, Y.; Zhang, G. A systematic review of green construction research using scientometrics methods. J. Clean. Prod. 2022, 366, 132710. [Google Scholar] [CrossRef]
  69. Jarvis, I.; Gergel, S.; Koehoorn, M.; van den Bosch, M. Greenspace access does not correspond to nature exposure: Measures of urban natural space with implications for health research. Landsc. Urban Plan. 2020, 194, 103686. [Google Scholar] [CrossRef]
  70. Bruvoll, H. Quantifying spatial complexity of settlement plans through fractal analysis. J. Archaeol. Method Theory 2023, 30, 1142–1167. [Google Scholar] [CrossRef]
  71. Springborg, R.; Adly, A.; Gorman, A.; Moustafa, T.; Saad, A.; Sakr, N.; Smierciak, S. Routledge Handbook on Contemporary Egypt, 1st ed.; Routledge: Milton Park, UK, 2021. [Google Scholar] [CrossRef]
  72. Lee, R.; Kim, J. Developing a Social Index for Measuring the Public Opinion Regarding the Attainment of Sustainable Development Goals. Soc. Indic. Res. 2021, 156, 201–221. [Google Scholar] [CrossRef]
  73. Mkonda, M. Agricultural sustainability and food security in agroecological zones of Tanzania. Sustain. Agric. Rev. 2021, 52, 309–334. [Google Scholar] [CrossRef]
  74. Timmermans, C.; Shawky, M.; Alhajyaseen, W.; Nakamura, H. Investigating the attitudes of Egyptian drivers toward traffic safety. Int. Assoc. Trafic Saf. Sci. Res. 2022, 46, 73–81. [Google Scholar] [CrossRef]
  75. Fouad, S.; Heggy, E.; Weilacher, U. Waterways transformation in the vulnerable port city of Alexandria. Cities 2023, 141, 104426. [Google Scholar] [CrossRef]
  76. Adnan, M.; Prasetyo, T.; Pakpahan, E.; Nasution, M. Environment-Based Spatial Management Combines Dignified Justice in Harmonization of Regulations. In Proceedings of the 5th International Conference on Humanities and Social Science (ICHSS 2024); Atlantis Press: Paris, France, 2025. [Google Scholar]
  77. Baxrom o‘g‘li, T.S. Economic Growth and Competitiveness: Global Trends and National Strategies. Educ. Sci. Innov. Ideas World 2025, 63, 193–204. [Google Scholar]
  78. Hrivastava, V.; Sinha, K. A Conceptual Framework for Promoting Neighborhood Social Sustainability: A Review of Literature. Future Cities Environ. 2025, 11, 1–17. [Google Scholar]
  79. Salem, M.; Tsurusaki, N.; Divigalpitiya, P.; Osman, T.; Hamdy, O.; Kenawy, E. Assessing Progress Towards Sustainable Development in the Urban Periphery: A Case of Greater Cairo, Egypt. Int. J. Sustain. Dev. Plan. 2020, 15, 971–982. [Google Scholar] [CrossRef]
  80. Amin-Salem, H.; El-Maghrabi, M.; Osorio-Rodarte, I.; Verbeek, J. Sustainable Development Goal Diagnostics: The Case of the Arab Republic of Egypt; Policy Research Working Paper|no. WPS 8463; World Bank Group: Washington, DC, USA, 2018; Available online: http://documents.worldbank.org/curated/en/532831528165791465 (accessed on 5 November 2024). (In English)
  81. Faroun, N.; El-Badrawy, A.; El-Gizawi, L. Transforming Old Cities into Smart Cities Using Environmental Key Performance Indicators to Solve Environmental Problems. Civ. Eng. Archit. 2022, 10, 2075–2088. [Google Scholar] [CrossRef]
  82. Beah, T.; Kotp, H.; Al-Menshawy, A. Transforming Existing Egyptian Cities into Sustainable Cities. IOP Conf. Ser. Earth Environ. Sci. 2022, 1113, 012014. [Google Scholar] [CrossRef]
  83. Hussein, A.; Pollock, E. Sustainable Development approaches in Egypt. IOP Conf. Ser. Earth Environ. Sci. 2019, 297, 012027. [Google Scholar] [CrossRef]
  84. Ibrahim, N.; ElBaz, M. Optimizing the Performance of Universities’ Buildings in Egypt as a Means of Accomplishing the 2030 Sustainable Development Goals. J. Al-Azhar Univ. Eng. Sect. 2024, 19, 605–623. [Google Scholar]
  85. Ragheb, G.; El-Wahab, M.; Ragheb, R. Sustainable Indicators Framework for Strategic Urban Development: A Case Study of Abu Teeg City in Assiut, Egypt. Int. J. Sustain. Dev. Plan. 2022, 17, 91–107. [Google Scholar] [CrossRef]
  86. Boulnaga, M.; Amer, A.; Elsobki, R. Sustainable Transportation: Challenges and Applicability in Megacities to Attain SDGs—Case Study of Cairo, Egypt. J. Sustain. Urban Plan. Dev. 2021, 14, 69–74. [Google Scholar]
  87. Salem, M.; Tsurusaki, N.; Divigalpitiya, P.; Kenawy, E. An Effective Framework for Monitoring and Measuring the Progress Towards Sustainable Development in the Peri-Urban Areas of the Greater Cairo Region, Egypt. World 2020, 1, 1–19. [Google Scholar] [CrossRef]
  88. El Barmelgy, I.; Rasheed, S.A. Sustainable Coastal Cities Between Theory and Practice: Case Study of Egyptian Coastal Cities. J. Sustain. Dev. 2016, 9, 216–233. [Google Scholar] [CrossRef]
  89. Liu, Q.; Li, F.; Peng, L.; Dong, S.; Yang, Y.; Cheng, H. Multiple evaluation framework of sustainability development in resource-based cities: A case study of China. Ecol. Indic. 2024, 158, 1111338. [Google Scholar] [CrossRef]
  90. Wang, C.; Wang, L.; Zhai, J.; Feng, T.; Lei, Y.; Li, S.; Liu, Y.; Liu, Y.; Hu, Z.; Zhu, K.; et al. Assessing progress toward China’s subnational sustainable development by region Sustainable Development Index. Sustain. Horiz. 2024, 11, 100099. [Google Scholar] [CrossRef]
  91. Nagati, O.; Gad, H.; El-Didi, A.; Kihila, J.; Mbuya, E.; Njavike, E. Towards a Bottom-up Approach for Localising SDGs in African Cities. Afr. Dev./Afr. Dév. 2023, 48, 79–112. [Google Scholar]
  92. Liu, Y.; Huang, B.; Guo, H.; Liu, J. A big data approach to assess progress towards Sustainable Development Goals for cities of varying sizes. Commun. Earth Environ. 2023, 4, 66. [Google Scholar] [CrossRef]
  93. Han, L.; Lu, L.; Lu, J.; Liu, X.; Zhang, S.; Luo, K.; He, D.; Wang, P.; Guo, H.; Li, Q. Assessing spatiotemporal changes of SDG indicators at the neighborhood level in Guilin, China: A geospatial big data approach. Remote Sens. 2022, 14, 4985. [Google Scholar] [CrossRef]
  94. Mangweta, R.; Mokoele, N.; Monama, S. Building sustainable cities to address urban sprawl: A reflective analysis towards achieving SDGs. EUREKA Soc. Humanit. 2022, 6, 72–78. [Google Scholar] [CrossRef]
  95. Osman, T.; Kenawy, E.; Abdrabo, K.I.; Shaw, D.; Alshamndy, A.; Elsharif, M.; Salem, M.; Alwetaishi, M.; Aly, R.M.; Elboshy, B. Voluntary local review framework to monitor and evaluate the progress towards achieving Sustainable Development Goals at a city level: Buraidah city, KSA and SDG11 as a case study. Sustainability 2021, 13, 9555. [Google Scholar] [CrossRef]
  96. Giles-Corti, B.; Lowe, M.; Ardel, J. Achieving the SDGs: Evaluating indicators to be used to benchmark and monitor progress towards creating healthy and sustainable cities. Health Policy 2020, 124, 58–590. [Google Scholar] [CrossRef]
  97. Mahama, A.M. Determinants of Factors Influencing Householders’ Access to Improved Water and Sanitation Facilities in Selected Low-Income Urban Areas of Accra. Master’s Thesis, University of Ghana, Accra, Ghana, 2013. [Google Scholar]
  98. Abba, S.; Said, Y.; Bashir, A. Assessment of Water Quality Changes at Two Locations of Yamuna River Using the National Sanitation Foundation of Water Quality (NSFWQI). J. Civ. Eng. Environ. Technol. 2015, 2, 730–733. [Google Scholar]
  99. Barragán-Escandón, A.; Terrados-Cepeda, J.; Zalamea-León, E.; Arias-Reyes, P. Electricity Production Using Renewable Resources in Urban Centres. Proc. Inst. Civ. Eng.-Energy 2018, 171, 12–25. [Google Scholar] [CrossRef]
  100. Mwaniki, D. Infrastructure Development in Nairobi: Widening the Path Towards a Smart City and Smart Economic Development. In Smart Economy in Smart Cities; International Collaborative Research: Hong Kong, China, 2017. [Google Scholar]
  101. Kalair, A.; Abas, N.; Saleem, M.; Kalair, A.; Khan, N. Role of energy storage systems in energy transition from fossil fuels to renewables. Energy Storage 2021, 3, e135. [Google Scholar] [CrossRef]
  102. Li, Z.; Ding, Y.; Han, D. Energy consumption transformation, cleaner production, and regional carbon productivity in China: Evidence based on a panel threshold model. IEEE Access 2021, 9, 16254–16265. [Google Scholar] [CrossRef]
  103. Ayambire, R.; Amponsah, O.; Peprah, C.; Takyi, S. A review of practices for sustaining urban and peri-urban agriculture: Implications for land use planning in rapidly urbanising Ghanaian cities. Land Use Policy 2019, 84, 260–277. [Google Scholar] [CrossRef]
  104. Bren d’Amour, C.; Reitsma, F.; Baiocchi, G.; Barthel, S.; Güneralp, B.; Erb, K.; Seto, K. Future urban land expansion and implications for global croplands. Proc. Natl. Acad. Sci. USA 2017, 114, 8939–8944. [Google Scholar] [CrossRef] [PubMed]
  105. Gore, S.; Borde, N.; Desai, P.H. Mapping tourism strategy patterns on tourism area life cycle. J. Hosp. Tour. Insights 2024, 7, 329–351. [Google Scholar] [CrossRef]
  106. Hao, X.; Dong, L.; Qian, X.; Benjamin, S.; Wang, H.; Chen, P.; Zhang, X. Characterizing the polycentricity in waste governance: A comparative study on Shanghai, Tokyo, and Hong Kong. npj Urban Sustain 2024, 4, 42. [Google Scholar] [CrossRef]
  107. Yang, D.; Qin, Y.; Xu, Y.; Xing, K.; Chen, Y.; Jia, X.; Wang, B. Sequestration of carbon dioxide from the atmosphere in coastal ecosystems: Quantification, analysis, and planning. Sustain. Prod. Consum. 2024, 47, 413–424. [Google Scholar] [CrossRef]
  108. Manes, S.; Vale, M.; Malecha, A.; Pires, A. Nature-based solutions promote climate change adaptation safeguarding ecosystem services. Ecosyst. Serv. 2022, 55, 101439. [Google Scholar] [CrossRef]
  109. Satta, A.; Puddu, M.; Venturini, S.; Giupponi, C. Assessment of coastal risks to climate change related impacts at the regional scale: The case of the Mediterranean region. Int. J. Disaster Risk Reduct. 2017, 24, 284–296. [Google Scholar] [CrossRef]
  110. Li, J.; Luo, G.; He, L.; Xu, J.; Lyu, J. Analytical approaches for determining chemical oxygen demand in water bodies: A review. Crit. Rev. Anal. Chem. 2018, 48, 47–65. [Google Scholar] [CrossRef]
  111. Prambudy, H.; Supriyatin, T.; Setiawan, F. The testing of chemical oxygen demand (COD) and biological oxygen demand (BOD) of river water in Cipager Cirebon. J. Phys. Conf. Ser. 2019, 1360, 012010. [Google Scholar] [CrossRef]
  112. Samaei, S. Advancing Marine Infrastructure: Integration of Advanced Composite Materials with Concrete. In Proceedings of the First International Conference on the Exchange of Scientific Information in the Fields of Concrete Structures and Materials (ICConcrete), Tehran, Iran, 6–7 May 2024. [Google Scholar]
  113. Dafforn, K.; Glasby, T.; Airoldi, L.; Rivero, N.; Mayer-Pinto, M.; Johnston, E. Marine urbanization: An ecological framework for designing multifunctional artificial structures. Front. Ecol. Environ. 2015, 13, 82–90. [Google Scholar] [CrossRef]
  114. Lako, A.; Çomo, E. Sustainable Water Management: An Integrated Approach to Solving the Problems of Wastewater Treatment. Qubahan Acad. J. 2024, 4, 91–100. [Google Scholar] [CrossRef]
  115. Bidak, L.; Kamal, S.; Halmy, M.; Heneidy, S. Goods and services provided by native plants in desert ecosystems: Examples from the northwestern coastal desert of Egypt. Glob. Ecol. Conserv. 2015, 3, 433–447. [Google Scholar] [CrossRef]
  116. Stephenson, P.; Londoño-Murcia, M.; Borges, P.; Claassens, L.; Frisch-Nwakanma, H.; Ling, N.; Fumagalli, L. Measuring the impact of conservation: The growing importance of monitoring fauna, flora and funga. Diversity 2022, 14, 824. [Google Scholar] [CrossRef]
  117. Butt, N.; Shanahan, D.; Shumway, N.; Bekessy, S.; Fuller, R.; Watson, J.; Hole, D. Opportunities for biodiversity conservation as cities adapt to climate change. Geo Geogr. Environ. 2018, 5, e00052. [Google Scholar] [CrossRef]
  118. Davies, J.; Lee, J. To attend or not to attend? Why some students chose school and others reject it. Support Learn. 2006, 21, 204–209. [Google Scholar] [CrossRef]
  119. Araque, F.; Roldán, C.; Salguero, A. Factors influencing university drop out rates. Comput. Educ. 2009, 53, 563–574. [Google Scholar] [CrossRef]
  120. Bhargava, A. Globalization, Literacy Levels and Economic Development. WIDER Research Paper. 2008. Available online: https://www.econstor.eu/bitstream/10419/63295/1/559007000.pdf (accessed on 5 November 2024).
  121. Lee, M.; Gopinathan, S. Social change and education reforms in high performing education systems: Policy lessons from Singapore and Hong Kong. In Globalisation, Ideology and Education Reforms; Emerging Paradigms: Singapore, 2020; pp. 83–106. [Google Scholar]
  122. Foley, M.; Cooper, R.; Mosseri, S. Gender Equitable Recruitment and Promotion: Leading Practice Guide. 2019. Available online: https://www.wgea.gov.au/sites/default/files/documents/Recruitment_and_Promotion_0.pdf (accessed on 5 November 2024).
  123. Assaad, R.; Krafft, C. The Egypt labor market panel survey: Introducing the 2012 round. J. Labor Dev. 2013, 2, 8. [Google Scholar] [CrossRef]
  124. Barnett, J.; Webber, M. Accommodating Migration to Promote Adaptation to Climate Change; The World Bank: Washington, DC, USA, 2010. [Google Scholar]
  125. Mendola, M. Rural Out-Migration and Economic Development at Origin: A Review of the Evidence. J. Int. Dev. 2012, 24, 102–122. [Google Scholar] [CrossRef]
  126. Arimah, B. The Face of Urban Poverty: Explaining the Prevalence of Slums in Developing Countries. 2010. Available online: https://www.researchgate.net/publication/46474265_The_Face_of_Urban_Poverty_Explaining_the_Prevalence_of_Slums_in_Developing_Countries (accessed on 5 November 2024).
  127. Biancone, P.; Graziano, M. Disruptive Mobility for Smart Cities: It’s Time to Change! J. Clean. Prod. 2024, 472, 143575. [Google Scholar] [CrossRef]
  128. Abidin, M.; Arfan, A. Detection of development and density urban build-up area with satellite image overlay. Int. J. Environ. Eng. Educ. 2019, 2, 40–45. [Google Scholar] [CrossRef]
  129. DiFrancesco, M. The Right to Barcelona: Spectrality, Unbuiltness, and El fantasma de Gaudí. In Spanish Graphic Narratives; Recent Developments in Sequential Art: Berlin/Heidelberg, Germany, 2020; pp. 257–284. [Google Scholar]
  130. Firdaus, A.; Pribadi, K.; Abduh, M. The state of sustainable and disaster-resilient infrastructure in Indonesia. IOP Conf. Ser. Earth Environ. Sci. 2024, 1314, 1502. [Google Scholar] [CrossRef]
  131. Siklos, P. Resilience in the Face of Large Shocks: Challenges that Await Central Banks in Emerging Market Economies. 2024. Available online: https://www.resbank.co.za/en/home/publications/publication-detail-pages/special-occasional-bulletins/2024/special-occasional-bulletin-of-economic-notes-24-01-resilience-i (accessed on 5 November 2024).
  132. Chiquetto, J.; Machado, P.; Mouette, D.; Ribeiro, F. Air quality improvements from a transport modal change in the São Paulo megacity. Sci. Total Environ. 2024, 945, 173968. [Google Scholar] [CrossRef]
  133. Esmail, B.; Cortinovis, C.; Suleiman, L.; Albert, C.; Geneletti, D.; Mörtberg, U. Greening cities through urban planning: A literature review on the uptake of concepts and methods in Stockholm. Urban For. Urban Green. 2022, 72, 127584. [Google Scholar] [CrossRef]
  134. Hu, Q.; Zhang, Y.; Wang, J.; Huo, R.; Feng, Z. The Evaluation of Territorial Spatial Planning from the Perspective of Sustainable Development Goals. Sustainability 2024, 16, 2965. [Google Scholar] [CrossRef]
  135. Wang, B. Development of the legal definition of the floating city: Judicial interpretation of structural characteristics of floating homes and developments. In Proceedings of the Third World Conference on Floating Solutions: WCFS2023, Tokyo, Japan, 28–29 August 2024. [Google Scholar]
  136. Bredenoord, J. Bamboo as a Sustainable Building Material for Innovative, Low-Cost Housing Construction. Sustainability 2024, 16, 2347. [Google Scholar] [CrossRef]
  137. Moghaieb, H. Estimating local administrators’ participation in planning: Case of “Egypt vision 2030”. Rev. Econ. Political Sci. 2019, 4, 197–223. [Google Scholar] [CrossRef]
  138. Gradstein, M.; Klemp, M. Natural resource access and local economic growth. Eur. Econ. Rev. 2020, 127, 103441. [Google Scholar] [CrossRef]
  139. Ojo, B. esilience and sustainability of supply chains in the face of natural disasters and climate change. Int. J. Sci. Res. Arch. 2024, 12, 2996–3007. [Google Scholar]
  140. Sumner, A.; Yusuf, A. New Estimates of the Cost of Ending Poverty and Its Global Distribution; UNU-WIDER: Helsinki, Finland, 2024. [Google Scholar]
  141. Alwang, J.; Sabry, S.; Shideed, K.; Swelam, A.; Halila, H. Economic and food security benefits associated with raised-bed wheat production in Egypt. Food Secur. 2018, 10, 589–601. [Google Scholar] [CrossRef]
  142. Kumarankutty, A. Equitable productive urban green spaces as a goal towards sustainable development. In The Elgar Companion to the Built Environment and the Sustainable Development Goal; Edward Elgar Publishing: Cheltenham, UK, 2024; pp. 121–136. [Google Scholar]
  143. Turk, J. Meeting projected food demands by 2050: Understanding and enhancing the role of grazing ruminants. J. Anim. Sci. 2016, 94, 53–62. [Google Scholar] [CrossRef]
  144. Eigenbrod, C.; Gruda, N. Urban vegetable for food security in cities: A review. Agron. Sustain. Dev. 2015, 35, 483–498. [Google Scholar] [CrossRef]
  145. Fawzy, M.E. Quality of life and human rights conditions in a public psychiatric hospital in Cairo. Int. J. Hum. Rights Healthc. 2015, 8, 199–217. [Google Scholar] [CrossRef]
  146. Bårdén, S.; Ernfors, M. Roadmap: Digitalisation of the Road Transport System Version 2024. 2024. Available online: https://www.connectedautomateddriving.eu/wp-content/uploads/2024/10/Trafikverket-Report-Roadmap-Digitalisation-of-the-Road-Transport-System-Version-2024.pdf (accessed on 5 November 2024).
  147. Arimah, B. Infrastructure as a Catalyst for the Prosperity of African Cities. Procedia Eng. 2017, 198, 245–266. [Google Scholar] [CrossRef]
  148. Cakaj, A.; Lisiak-Zielińska, M.; Khaniabadi, Y.; Sicard, P. Premature deaths related to urban air pollution in Poland. Atmos. Environ. 2023, 301, 119723. [Google Scholar] [CrossRef]
  149. Mohammed, A.; Saleh, I.; Zahran, H.; Abdel-Latif, N. Ecological and Risk Assessment of Heavy Metals in a Diverse Industrial Area of Al-Akrasha, Egypt. Atmosphere 2023, 14, 1745. [Google Scholar] [CrossRef]
  150. Elistia, E.; Syahzuni, B. The Correlation of the Human Development Index (HDI) Towards Economic Growth (GDP Per Capita) in 10 ASEAN Member Countries. J. Humanit. Soc. Stud. 2018, 2, 40–46. [Google Scholar] [CrossRef]
  151. Aris, M.; Nuraini, C. Optimizing City Spatial Plans: Development Strategy Urban Sustainability in Medan. Int. J. Soc. Law 2024, 2, 255–269. [Google Scholar]
  152. Li, J.; Fu, G.; Zhao, X. Urban Economic Resilience and Supply Chain Dynamics: Evaluating Monetary Recovery Policies in Global Cities During the Early COVID-19 Pandemic. Mathematics 2024, 12, 673. [Google Scholar] [CrossRef]
  153. Zhang, L.; Zhang, Y.; Li, H.; Lei, Z. Estimating Long-Term Impacts of Tunnel Infrastructure Development on Urban Sustainability Using Granular Computing. Appl. Soft Comput. 2021, 113, 107932. [Google Scholar] [CrossRef]
  154. Alessandretti, L.; Orozco, L.N.; Saberi, M.; Szell, M.; Battiston, F. Multimodal Urban Mobility and Multilayer Transport Networks. Environ. Plan. B Urban Anal. City Sci. 2023, 50, 2038–2070. [Google Scholar] [CrossRef]
  155. Xiao, Z.; Lam, J. A systems framework for the sustainable development of a Port City: A case study of Singapore’s policies. Res. Transp. Bus. Manag. 2017, 22, 255–262. [Google Scholar] [CrossRef]
  156. Mawoli, M. A Sustainable Funding for the Maintenance of Critical Urban Infrastructure in Nigeria. KIU J. Soc. Sci. 2021, 7, 91–102. [Google Scholar]
  157. Vidigal, G.; Claussen, K. The Sustainability Revolution in International Trade Agreements; Oxford University Press: Oxford, UK, 2024. [Google Scholar]
  158. Konstantinus, A.; Zuidgeest, M.; Christodoulou, A.; Raza, Z.; Woxenius, J. Barriers and enablers for short sea shipping in the Southern African Development Community. Sustainability 2019, 11, 1532. [Google Scholar] [CrossRef]
  159. Abdelwahid, H.A.; Dahlan, H.M.; Mojemamy, G.M.; Al-Harbi, T.J.; Indarkiri, N.Y.; Tourkmani, A.M. Developing and standardizing a tool to assess the health education needs of diabetic patients at Jazan Armed Forces Hospital. J. Egypt. Public Health Assoc. 2025, 100, 3. [Google Scholar] [CrossRef]
  160. Zou, X.; Zhao, R. Shifting Paradigm of Urban Sustainability: Major Sustainable City Development Trends in the East Asian Context. J. Int. Dev. 2023, 35, 296–311. [Google Scholar] [CrossRef]
  161. Du Toit, A. Spatial Planning in Large Urban Systems: The Gauteng City-Region. Ph.D. Thesis, North-West University, Potchefstroom, South Africa, 2023. [Google Scholar]
  162. Reyes, D. Sustainable Development Planning in the Built Environment: Towards a Circular Economy: A Case Study in Lahti, Finland. 2023. Available online: https://www.theseus.fi/handle/10024/808418 (accessed on 5 November 2024).
  163. Jolliffe, I.; Cadima, J. Principal component analysis: A review and recent developments. Philos. Trans. R. Soc. A Math. Phys. Eng. Sci. 2016, 374, 20150202. [Google Scholar] [CrossRef] [PubMed] [PubMed Central]
  164. Xing, L.; Xue, M.; Hu, M. Dynamic simulation and assessment of the coupling coordination degree of the economy–resource–environment system: Case of Wuhan City in China. J. Environ. Manag. 2019, 230, 474–487. [Google Scholar] [CrossRef]
  165. Saltelli, A.; Aleksankina, K.; Becker, W.; Fennell, P.; Ferretti, F.; Holst, N.; Li, S.; Wu, Q. Why so many published sensitivity analyses are false: A systematic review of sensitivity analysis practices. Environ. Model. Softw. 2019, 114, 29–39. [Google Scholar] [CrossRef]
  166. Bayoumi, W.; Effat, H.; Ramadan, R.; Mansour, K.; AbdAlmoity, E. Towards a Socio-economic Resilience Assessment for Social Deterioration and Economic Decline: An Application in Greater Alexandria Coastal City Using Geospatial Models. In Modelling and Advanced Earth Observation Technologies for Coastal Zone Management; Ali, E.M., El-Magd, I.A., Eds.; Springer Remote Sensing/Photogrammetry; Springer: Cham, Switzerland, 2025; pp. 389–436. [Google Scholar] [CrossRef]
Figure 1. Conceptual framework for creating a sustainability-based model to classify and evaluate cities based on their progress toward sustainability.
Sustainability 17 05317 g001
Figure 2. Synergetic interaction between fifty enviro-socio-economic indicators, sustainable development goals (SDGs), and the three pillars of sustainable development. The diagram visualizes how thematic clusters of indicators, such as finance, agriculture, population growth, education, gender equity, water quality, and urban safety, are interconnected with relevant SDGs and the three core sustainability pillars: social, economic, and environmental.
Sustainability 17 05317 g002
Figure 3. Comparative performance of Egyptian governorates in achieving the sustainable development goals (SDGs). This figure illustrates the performance of various cities in Egypt across seventeen SDGs. Each radial plot represents a specific goal, showing the relative performance of city color-coded into high (dark shades), medium (intermediate shades), and low (light shades) performance categories. For example, I#18, “abundance classes of the flora”, could represent SDG#14 because dense flora and fauna reduce water flow velocities and create turbulent flows and shear stress over the seabed, causing sediment deposition, and accretion, “Targets 14.2”. Moreover, this indicator (I#18) describes the spreading of flora that contributes to aquatic pollution in urban areas, “Target 14.1”, and influences the management of fisheries, aquaculture, and tourism, “Targets 14.7”. These three targets out of ten targets in SDG#14 provide a score of 3/10 × 100 = 30.0% to I#18.
Sustainability 17 05317 g003aSustainability 17 05317 g003b
Figure 4. Correlation between key urban indicators and SDG 11 performance across city typologies. This figure illustrates the variation in SDG#11 performance (%) based on four primary indicators: (a) population growth, (b) built-up area, (c) green urban area, and (d) economy.
Sustainability 17 05317 g004
Figure 5. Proposed urban renovation and sustainability scenarios for Alexandria, Egypt, targeting the year 2054. (a) location map of Alexandria along Egypt’s Mediterranean coast; (b) population density projection, emphasizing growth in New Borg El-Arab (30°49′–30°58′ N, 29°27′–29°43′ E) and highlighting high-density zones in Montaza and central districts; (c) urban expansion and land cover transformation, showing an increase in built-up area from 322 km2 in 2024 to 570 km2 in 2054, with the integration of agro-industrial clusters (171 km2) in underutilized southern peripheral areas; (d) green urban area (GUA) enhancement, illustrating the rise in green coverage from 27 km2 in 2024 to 114 km2 in 2054 through green belts, corridors, and ecological buffers; (e) infrastructure and GDP improvement, identifying the proposed transit-oriented development (TOD) zones along primary corridors to support compact, and mixed-use urbanism. GDP investment in transportation infrastructure is projected to increase by nearly 15%, while industry value-added activities and agriculture’s share in GDP are expected to rise by 22% and 25%, respectively—particularly within TOD-aligned agro-industrial areas in the south.
Sustainability 17 05317 g005aSustainability 17 05317 g005b
Table 1. Categorization of the fifty sustainability indicators by the environmental, social, and economic pillars of sustainability, including indicator types and corresponding sustainable development goal (SDG) targets.
No.IndicatorsIndicator TypeSuggested SDGs’
Targets Interlinkages
Data Source
DirectIndirect
Environmental pillar indicators
01Water consumptionQuantitative6.1, 6.411.5, 12.2, 13.1[38]
02Percent of households connected to the public network sanitationQuantitative6.2, 6.33.9, 11.1, 12.4
03Number of sanitation stationsQuantitative6.2, 6.33.9, 9.1, 11.1
04Amount of petroleum extractedQuantitative7.3, 12.29.4, 12.6, 13.2[46]
05Amount of gas extractedQuantitative7.1, 12.27.3, 9.4, 13.2
06Percentage of households connected to the public network electricityQuantitative7.1, 11.11.4, 10.2
07Gas generation by productive regionQuantitative9.4, 12.47.2, 12.6, 13.2[50]
08Planted areas with strategic cropsQuantitative2.4, 15.312.2, 13.2, 15.2
09Productive areas with strategic cropsQuantitative2.3, 2.48.2, 12.2, 15.2
10Average concentration of sulfur dioxide (SO2)Quantitative3.9, 11.612.4, 13.2, 13.3[42]
11Average concentration of total suspended particles (TSP)Quantitative3.9, 11.612.4, 13.2, 13.3
12Elevation above sea levelQuantitative11.5, 13.114.2, 15.1
13Measure of water quality (chemical oxygen demand; COD)Quantitative6.3, 14.112.4, 15.1, 15.2[51]
14Measure of water quality (biochemical oxygen demand; BOD)Quantitative6.3, 6.612.4, 14.1, 15.1
15Number of maritime associationsQuantitative14.7, 14.a8.9, 17.17
16Number of encroachments on agricultural landsQuantitative11.3, 15.12.4, 13.1[50]
17Protected areas in Egypt (wetlands, deserts, special geological formation)Quantitative15.1, 15.46.6, 14.5
18Ecological richness and vegetation abundanceQualitativeScale (1–5)15.2, 15.511.4, 13.1, 13.3
Social pillar indicators
19Percentage of children who have never been to schoolQuantitative4.1, 4.21.4, 5.1, 10.2[41]
20Distribution of Egyptian population according to students enrolled and dropoutQuantitative4.1, 4.38.6, 10.2
21Illiteracy rate among Egyptian populationQuantitative4.6, 4.71.4, 5.5, 10.2
22Number of women recruited and employedQuantitative5.5, 8.54.5, 10.3[32]
23Number of marriage contractsQuantitative5.6, 16.93.7, 10.2
24Number of divorcesQuantitative5.6, 16.13.4, 10.3
25Number of distributions of in-migration streamsQuantitative10.7, 11.18.8, 1.4[31]
26Number of distributions of out-migration streamsQuantitative10.7, 17.188.5, 11.3
27Population growthQuantitative11.3, 3.713.1, 4.5[38]
28Build-up areaQuantitative11.3, 9.16.6, 15.3, 13.1
29Green areasQuantitative11.7, 15.13.9, 13.3, 6.6
30Public safety and crime incidenceQualitative16.1, 16.311.7, 5.2, 10.3[43]
31Degree of digital governance and service accessibilityQualitativeScale (1–5)16.6, 9.c17.6, 10.2
32Number of employees in cultural associationsQuantitative11.4, 4.75.c, 8.3
Economic pillar indicators
33Estimates of employed personsQuantitative8.5, 8.310.2, 5.5[38]
34Average employees’ salaryQuantitative8.5, 10.11.2, 5.1, 10.4
35Number of householdsQuantitative11.1, 1.45.6, 6.2
36Growth rate of the cereal yieldQuantitative2.3, 2.412.2, 13.2[42]
37Number of imported and local slaughtered livestockQuantitative2.1, 12.22.2, 3.4
38Quantities of red meat production Quantitative2.1, 2.312.2, 3.9
39Number of patients in public and central hospitalsQuantitative3.8, 3.21.4, 10.2[44]
40Number of birthsQuantitative3.7, 5.64.2, 16.9
41Number of deathsQuantitative3.1, 3.210.2, 16.1
42Estimates of labor forceQuantitative8.5, 8.64.4, 10.3[32]
43Gross domestic productQuantitative8.1, 8.29.2, 10.1
44Capital investments in tourism sectorQuantitative8.9, 12.b11.4, 14.7
45Total number of tunnelsQuantitative9.1, 11.213.1, 11.3[47]
46Coverage and integration of public transport systemsQualitativeScale (1–5)11.2, 9.113.2, 3.6
47 Accessibility and distribution of postal servicesQualitativeScale (1–5)9.c, 16.610.2, 17.8
48Revenue generated from taxes charged on shipsQuantitative17.1, 8.114.7, 9.3[45]
49Fund from developed countriesQuantitative17.2, 17.310.b, 13.a
50Foreign direct investments Quantitative17.5, 10.b8.2, 9.3
Table 2. Limitations and suggested improvements to create resilient cities under the umbrella of the three pillars of SDGs (e.g., environmental, financial, and social).
LimitationsSuggestions
Limited data availability obstructs comprehensive city sustainability assessments, leading to missing observations and challenges in record justificationCollaborating with national and local authorities to enhance data collection and reporting mechanisms
Data used for the scoring analysis of cities covers a period from April 2012 to February 2022Incorporating data from earlier stages, including historical records, would provide a more comprehensive and influential output
Expert judgment is needed to score qualitative indicatorsEngage local stakeholders in assigning weights and validating qualitative indicators to reduce subjectivity
Equal weights were assigned to all SDG targets achieved, assuming uniform importance across indicatorsApply differentiated weights to SDG targets using methods such as the analytic hierarchy process (AHP) or expert-based scoring
Qualitative indicators are scored with fixed binary values or Likert scale regardless of contextCalibrate qualitative scoring using contextual expert input or adaptive scoring frameworks based on city-specific data
Uniform classification thresholds (low, medium, high) using the Jenks Natural Breaks methodExplore alternative classification schemes (e.g., clustering or fuzzy logic) to account for nonlinear patterns in city performance
Among the 50 indicators collected for analysis, SDG#11 exhibits a strong relationship with only four specific indicatorsExpand the number of indicators considered to gain a more comprehensive understanding of urban planning and its impact on achieving SDG#11
The number of targets to which indicators have been assigned is limited to approximately three targets per goalEnhancing the synergetic interaction between the targets and each indicator by expanding the number of sustainability dimensions (e.g., political, technical, and satisfaction)
Limited geographical scopeThe proposed SDG-based model could be validated in diverse urban contexts, including cities from different regions, income levels, and development stages
Spatial resolution of satellite imagery may cause an underestimation of small-sized open spaces in urban areasUse machine learning and deep learning techniques to improve the detection and classification of small open spaces within urban areas
Disclaimer/Publisher’s Note: The statements, opinions and data contained in all publications are solely those of the individual author(s) and contributor(s) and not of MDPI and/or the editor(s). MDPI and/or the editor(s) disclaim responsibility for any injury to people or property resulting from any ideas, methods, instructions or products referred to in the content.

