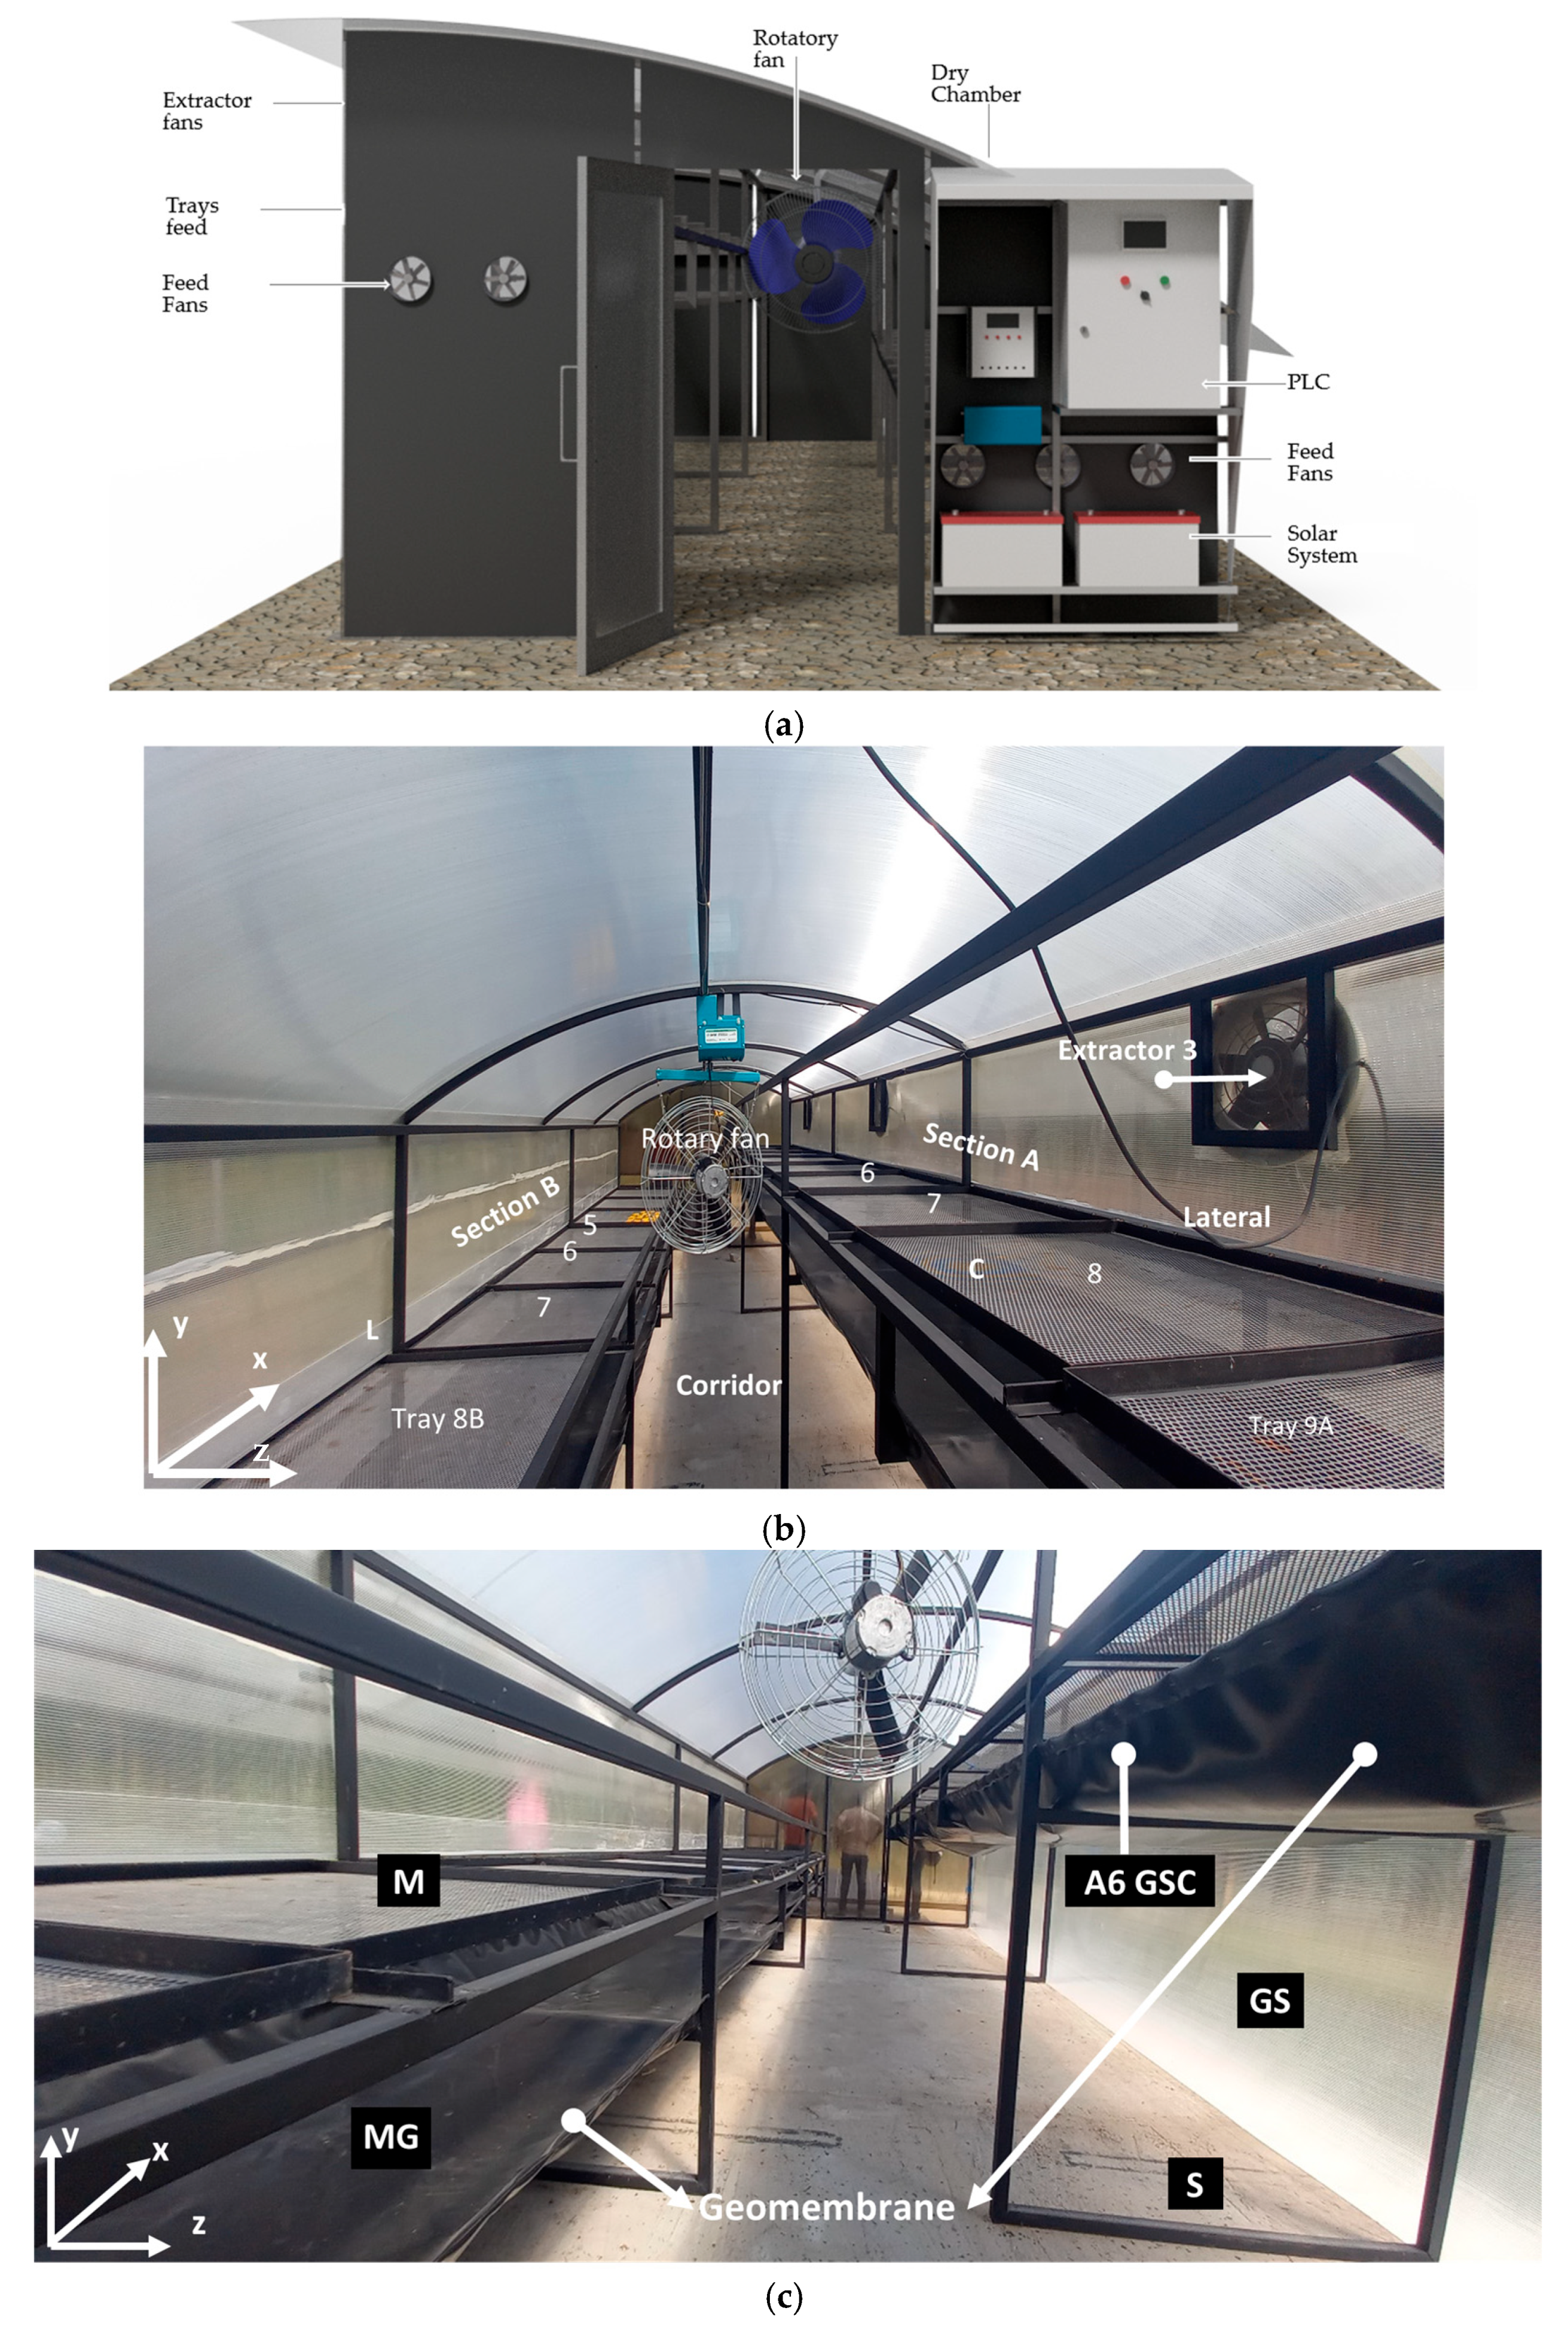
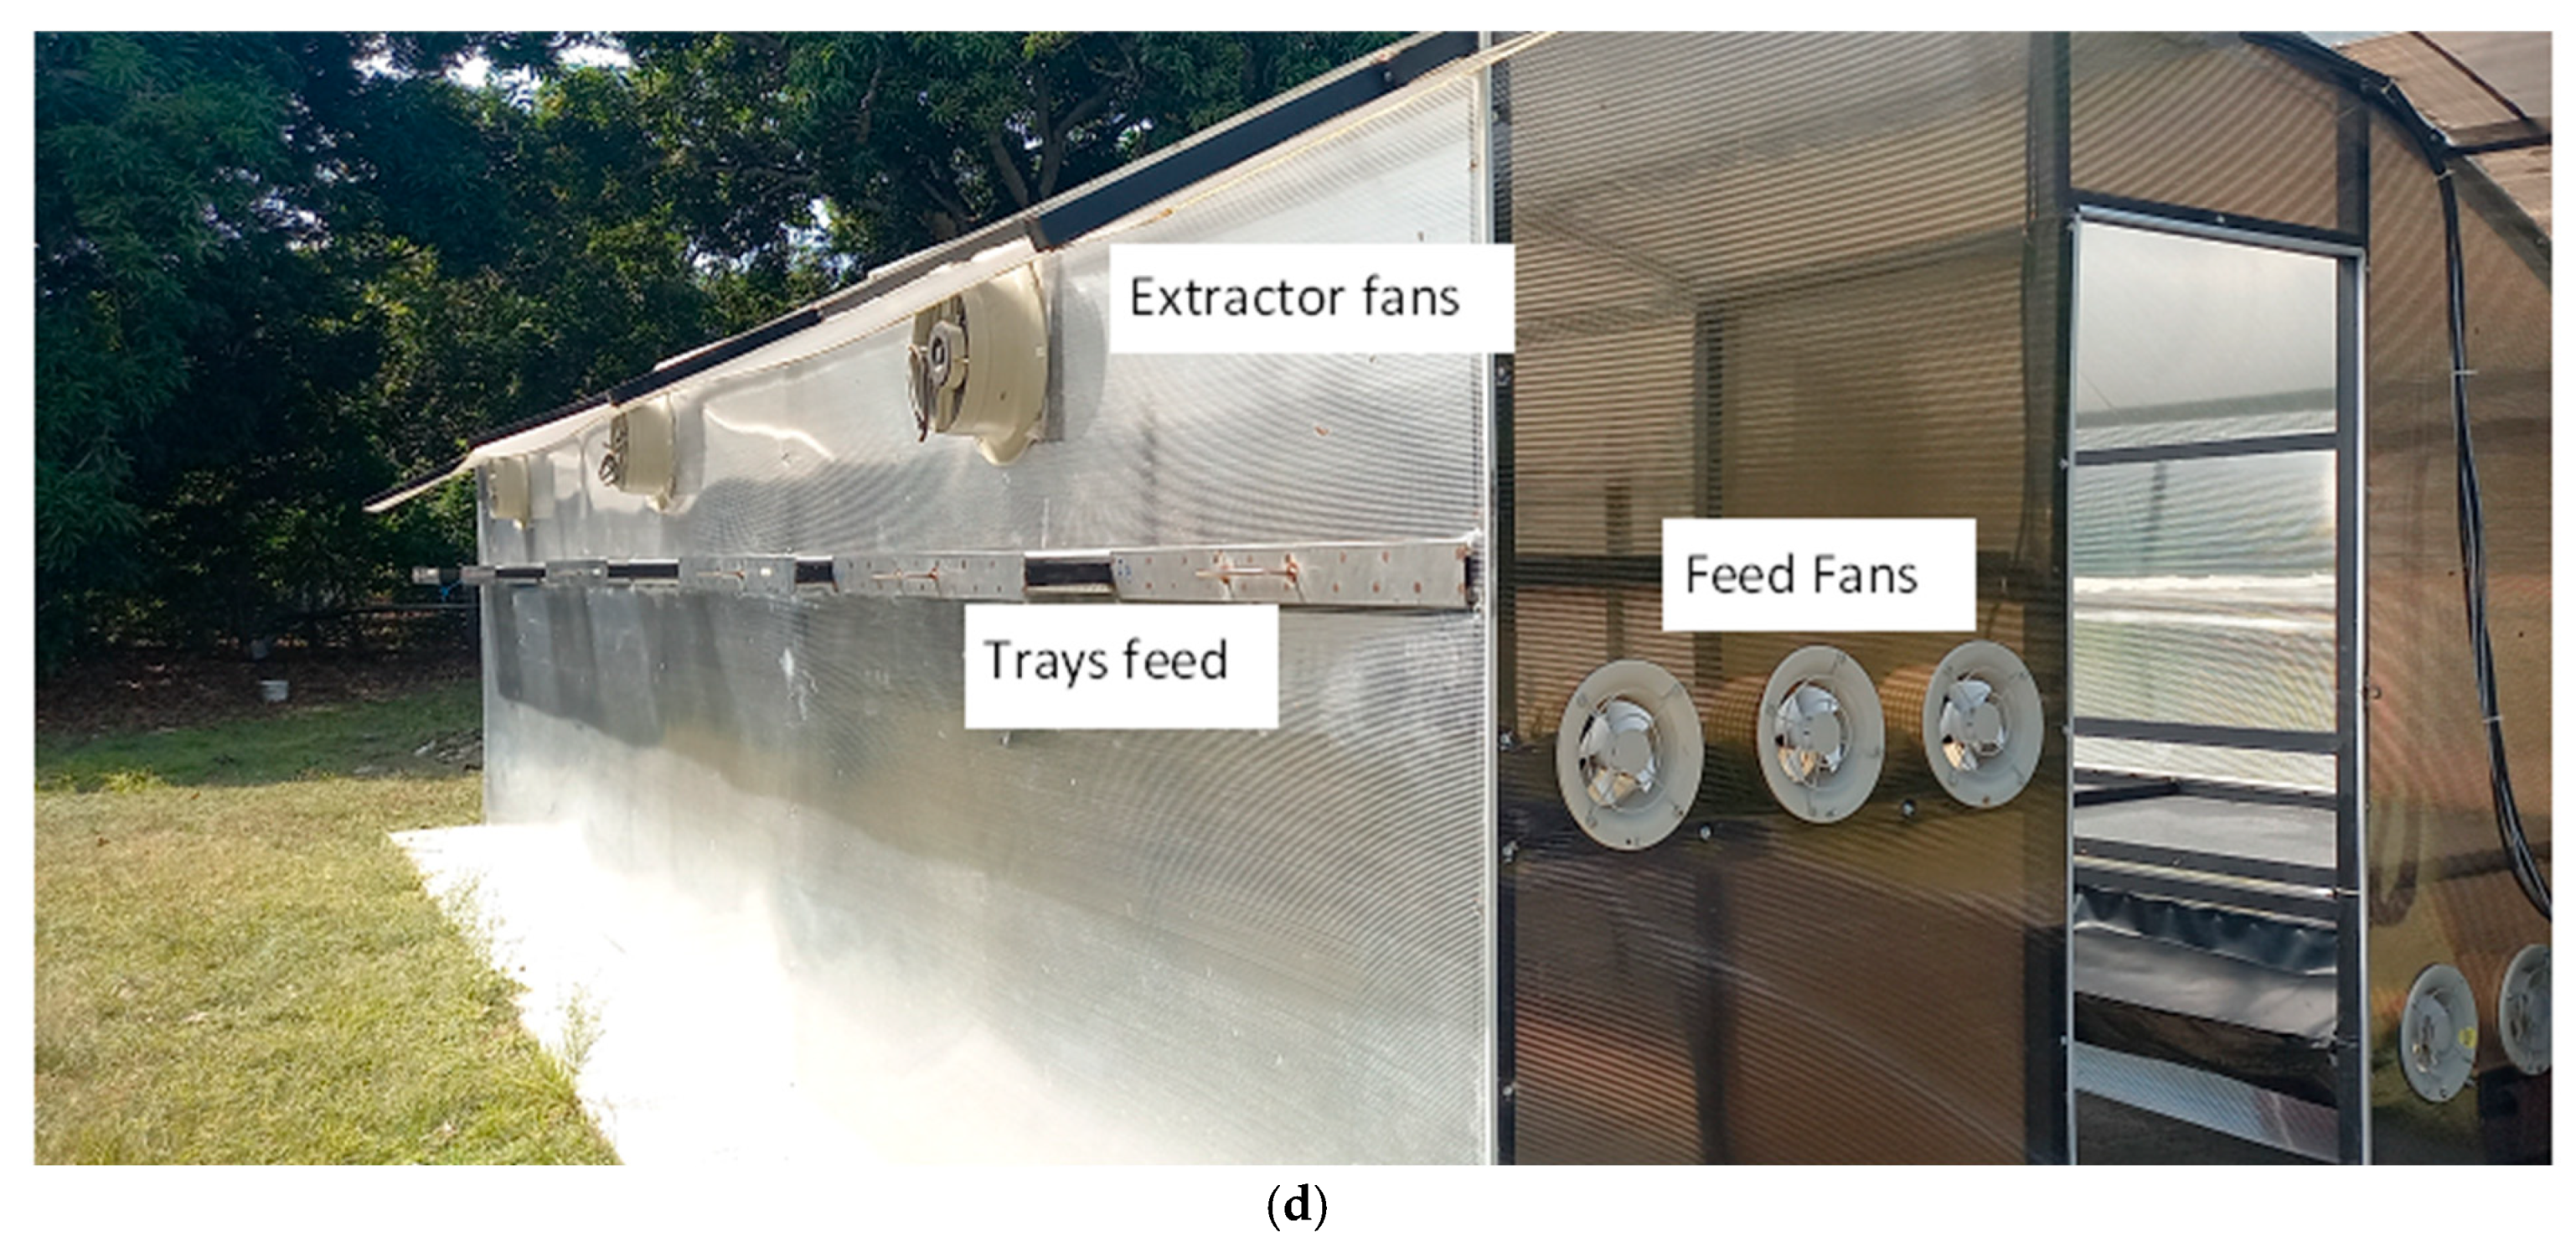
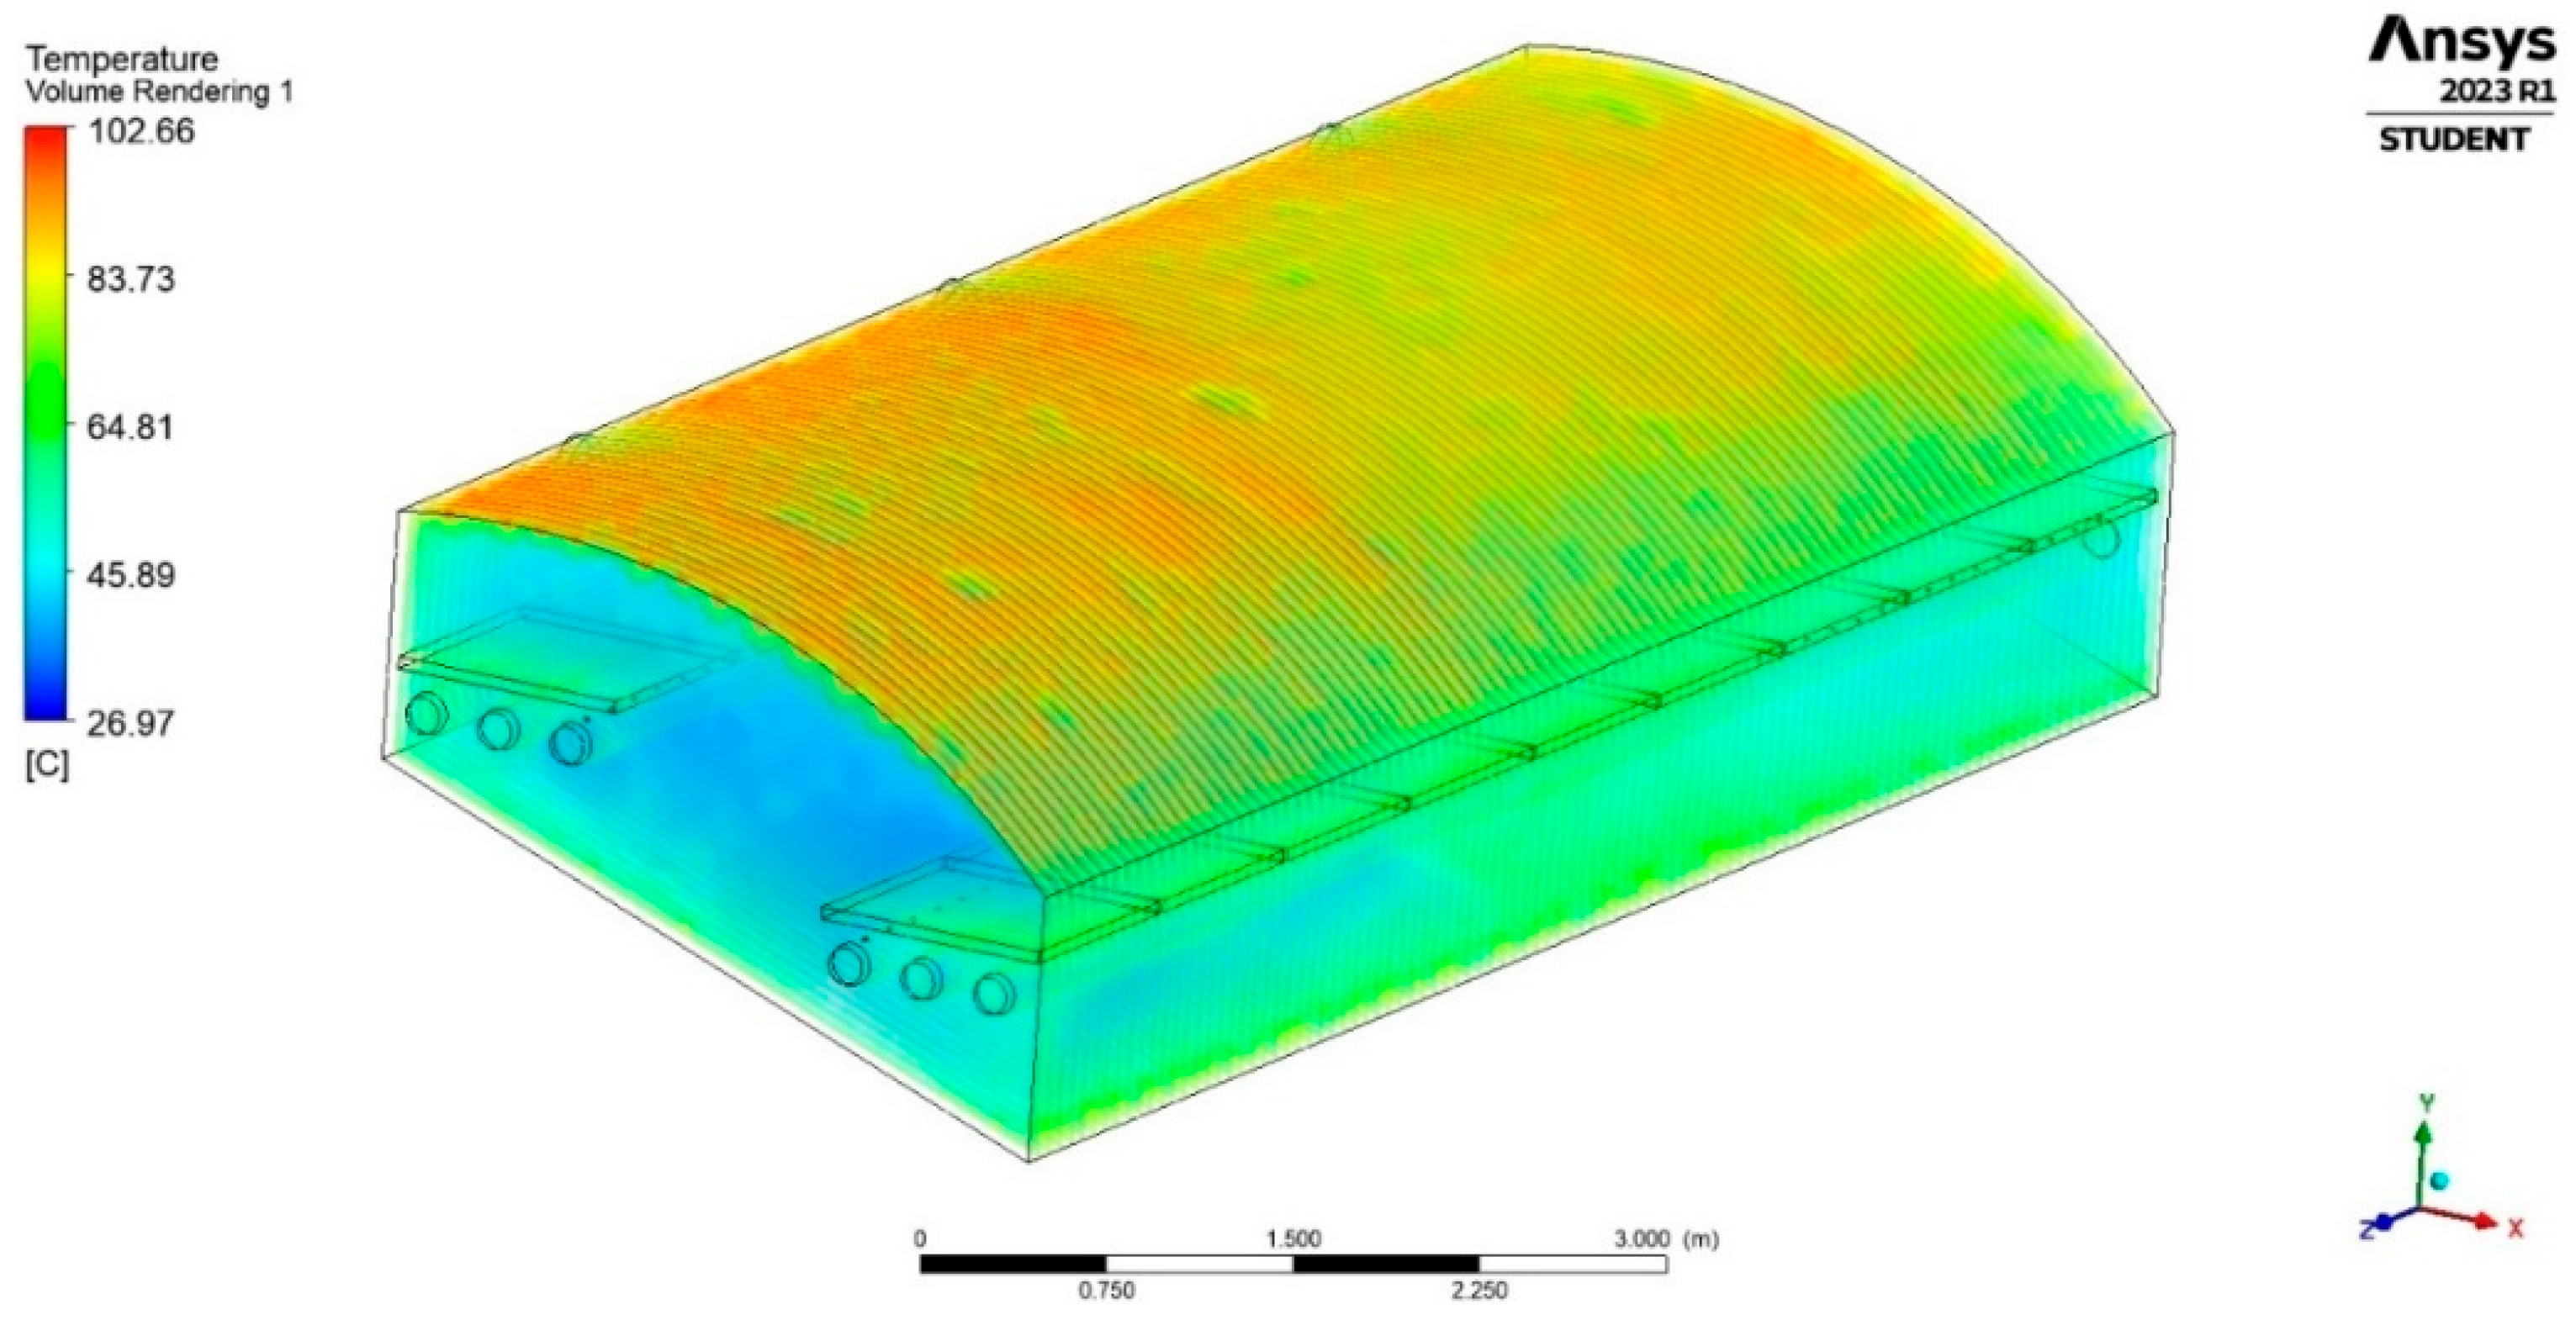
3.1. Solar Photovoltaic Dryer Design
Local environmental conditions show an average temperature of 27 °C throughout the year, with more cloudy days between November and February and the brightest between June and September. This means that the highest availability of radiation occurs from June to September. The longest daylight period occurs in June, with 12 h and 22 min, while in December, daylight extends for 11 h and 53 min. The wind velocity reaches its highest value in August (8 km/h) and its lowest in December (4 km/h). These climatic conditions are summarized in
Table 1. Mango production takes place from September to December. These conditions and key variables, such as the airflow velocity, temperature distribution, and moisture extraction efficiency, were also considered as input conditions in the CFD analysis (ANSYS Fluent 2024 (ANSYS Inc., Canonsburg, PA, USA) to evaluate and simulate the aerodynamic and thermal behavior of the solar dehydrator. Thermal gradients were predicted under different design configurations using turbulence and heat transfer models. This facilitated the selection of operating conditions to optimize the heat and mass transfer, reduce drying times, and improve the thermal homogeneity within the system.
Figure 2 shows the temperature profile, while
Figure 3 shows the airflow profile.
To determine the requirements for the photovoltaic module, the energy requirements for the exhaust fans, intake fans, and PLC were calculated and are summarized in
Table 2. An operation time of 10 min/hour was considered for both exhaust fans and intake fans, as preliminary tests showed that this time was enough to reach appropriate and homogeneous air conditions inside the chamber regarding T and RH, maintaining a reasonable driving force and low energy consumption, as the air temperature remained high while RH showed low values. The experiment lasted 10 h per day, as preliminary tests showed that 8 h of drying without the photovoltaic system were enough to reduce the moisture content of the mango slices to less than 12%. An additional 2 h were included as a security factor.
The average irradiation reported for Espinal, shown in
Table 1, is 4 kWh/m
2 and 4 sun hours per day. Based on the average energy availability and requirements, a photovoltaic module of 1100 W was installed on the solar dryer. The module consists of a pair of JA Solar
® 550W JAM72S30-550/MR monocrystalline PERC panels (manufactured by JA Solar Technology Co., Ltd., Beijing, China), which have 144 cells (6 × 24), with a maximum nominal power of 550 W. This module has a conversion efficiency of 20.56% and an irradiance of 1000 W/m
2. The panel has a length of 2 278 mm by 113 mm, a height of 30 mm, and weighs 27.3 kg. A GEL battery of 12 VDC-250 Ah Tensite
® (Tensite
®, manufactured by Shenzhen Tensite New Energy Co., Ltd., Shenzhen, China) was installed to ensure one day of self-sufficiency, along with an SPF 3000TL LVM-ES inverter with a nominal power of 3000 W and maximum efficiency of 97%. Compatible with 48 V batteries, it has an 80 A MPPT controller and 40 A charger, allowing it to operate without batteries.
3.2. Dryer Performance
For an evaluation of the dryer, the conditions inside and outside the chamber were monitored to determine the dryer’s efficiency, considering the differences in the temperature (DifT) and the differences in the relative humidity (DifH) inside and outside the chamber.
The results for T° and RH under different evaluation factors showed highly significant differences (
p < 0.0001) in the temperature profiles for the four evaluation factors: the position (inside and outside the chamber), hour of the day (HH), operation mode (OM), and load of the drying chamber (L). The interactions position*HH (
p < 0.0001), OM*load (
p = 0.0084), and position*OM (
p < 0.0212) were also significant.
Table A1,
Table A2 and
Table A3 in
Appendix A show the statistical groupings from Tukey’s multiple comparison tests for these factors and the interactions that were significant. While the effect of the position*HH interaction led to a discriminating temperature in 23 groups throughout the day (
Table A1), three marked temperature stages can be distinguished in
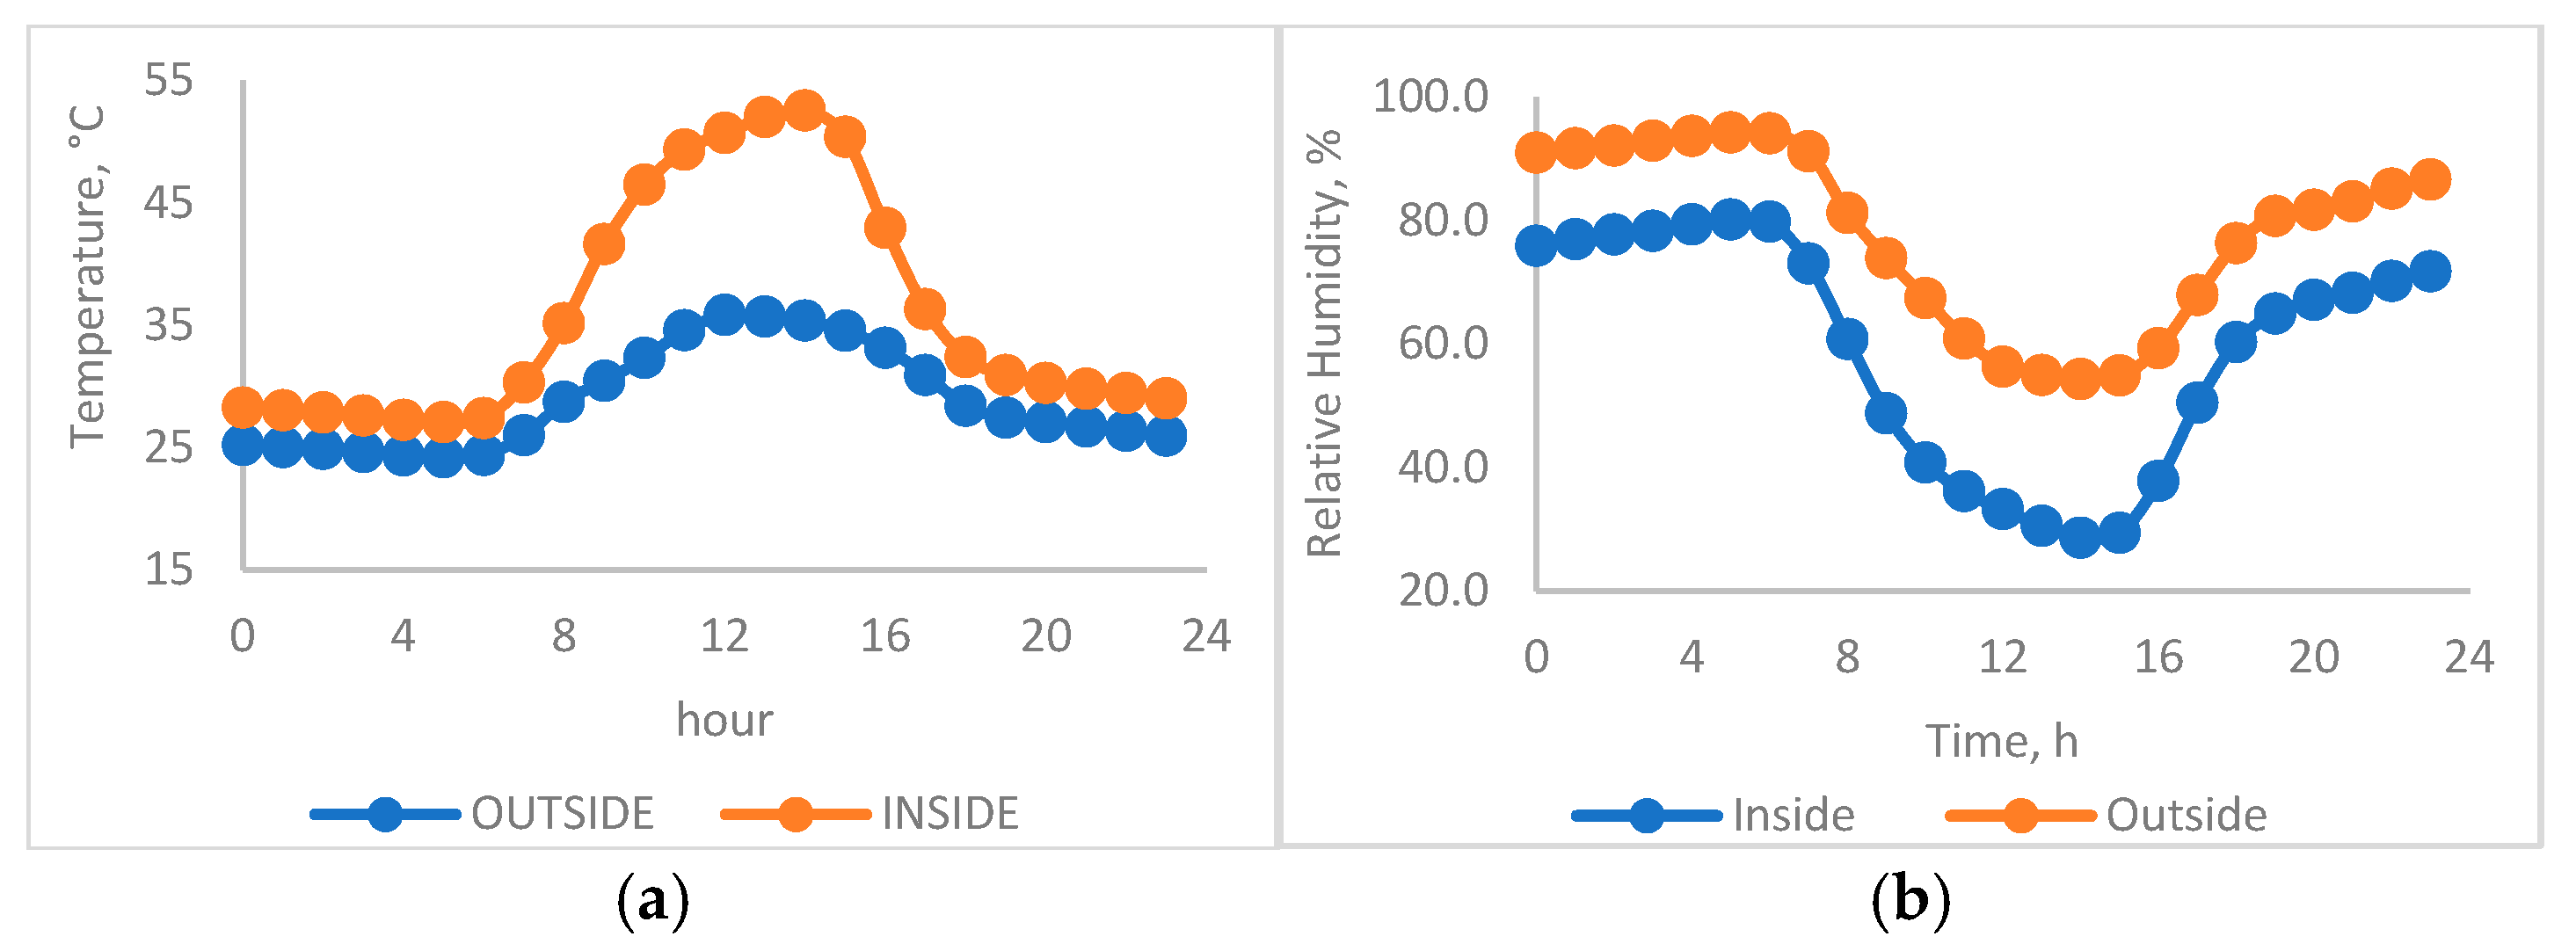
Figure 4a. The first stage occurs between 7 and 14 h, where both external and internal temperatures increase rapidly, reaching their peak around 14 h. Next, a second stage occurs between 14 and 18 h, during which temperatures decrease rapidly and, finally, a third stage occurs between 18 and 7 h, during which both temperatures decrease slowly. In the first two stages, a large delta between the two temperatures (external and internal) is maintained, while the difference is minimal in the third stage.
A similar case was found with the relative humidity behavior, in which all evaluation factors (the position, time, operational mode, and load) were significant (
p < 0.0001), as were the interactions of the position*Operation mode, Operation mode*load (
p < 0.0001), and position*HH (
p = 0.004). Details of the different groups discriminated by these factors and their interactions are listed in
Table A4,
Table A5 and
Table A6 in
Appendix A, which show statistical groupings from Tukey’s multiple comparison tests. In this case, 40 different groups were identified, as shown in
Table A4.
Figure 4b shows the relative humidity profiles of the internal and external dryer chambers throughout the day. From
Figure 4b, three stages can be distinguished, similar to those identified in the T° profile. The first stage, between 7 h and 15 h, shows a rapid decrease in the relative humidity. The second stage, between 15 and 19 h, shows that RH increases rapidly, and finally, the third stage, between 19 and 7 h, shows that RH increases slowly.
These results confirm the inverse relationship between T° and RH, whose correlation coefficient was 0.98. The increase in temperature under the same water content and total pressure conditions leads to a reduction in the partial pressure of water vapor, as evidenced by the decrease in the RH.
To reduce the effect and noise that changing climate conditions introduce to the analysis, a new variable was created based on the difference between the external and internal temperature (DifT) and relative humidity (DifH) conditions in the drying chamber. The statistical analysis considering these two variables showed significant differences for DifH due to the time of day (HH), operation mode OM (
p < 0.0001), and their interaction OM*HH (
p = 0.042).
Table A7 shows the OM*HH interactions that show significant differences. Similar behavior was found for T°, for which the operation mode (OM), time (HH), and their interaction OM*HH were highly significant (
p < 0.0001). The load (
p = 0.0276) and the interaction OM*load (
p = 0.0364) were also significant.
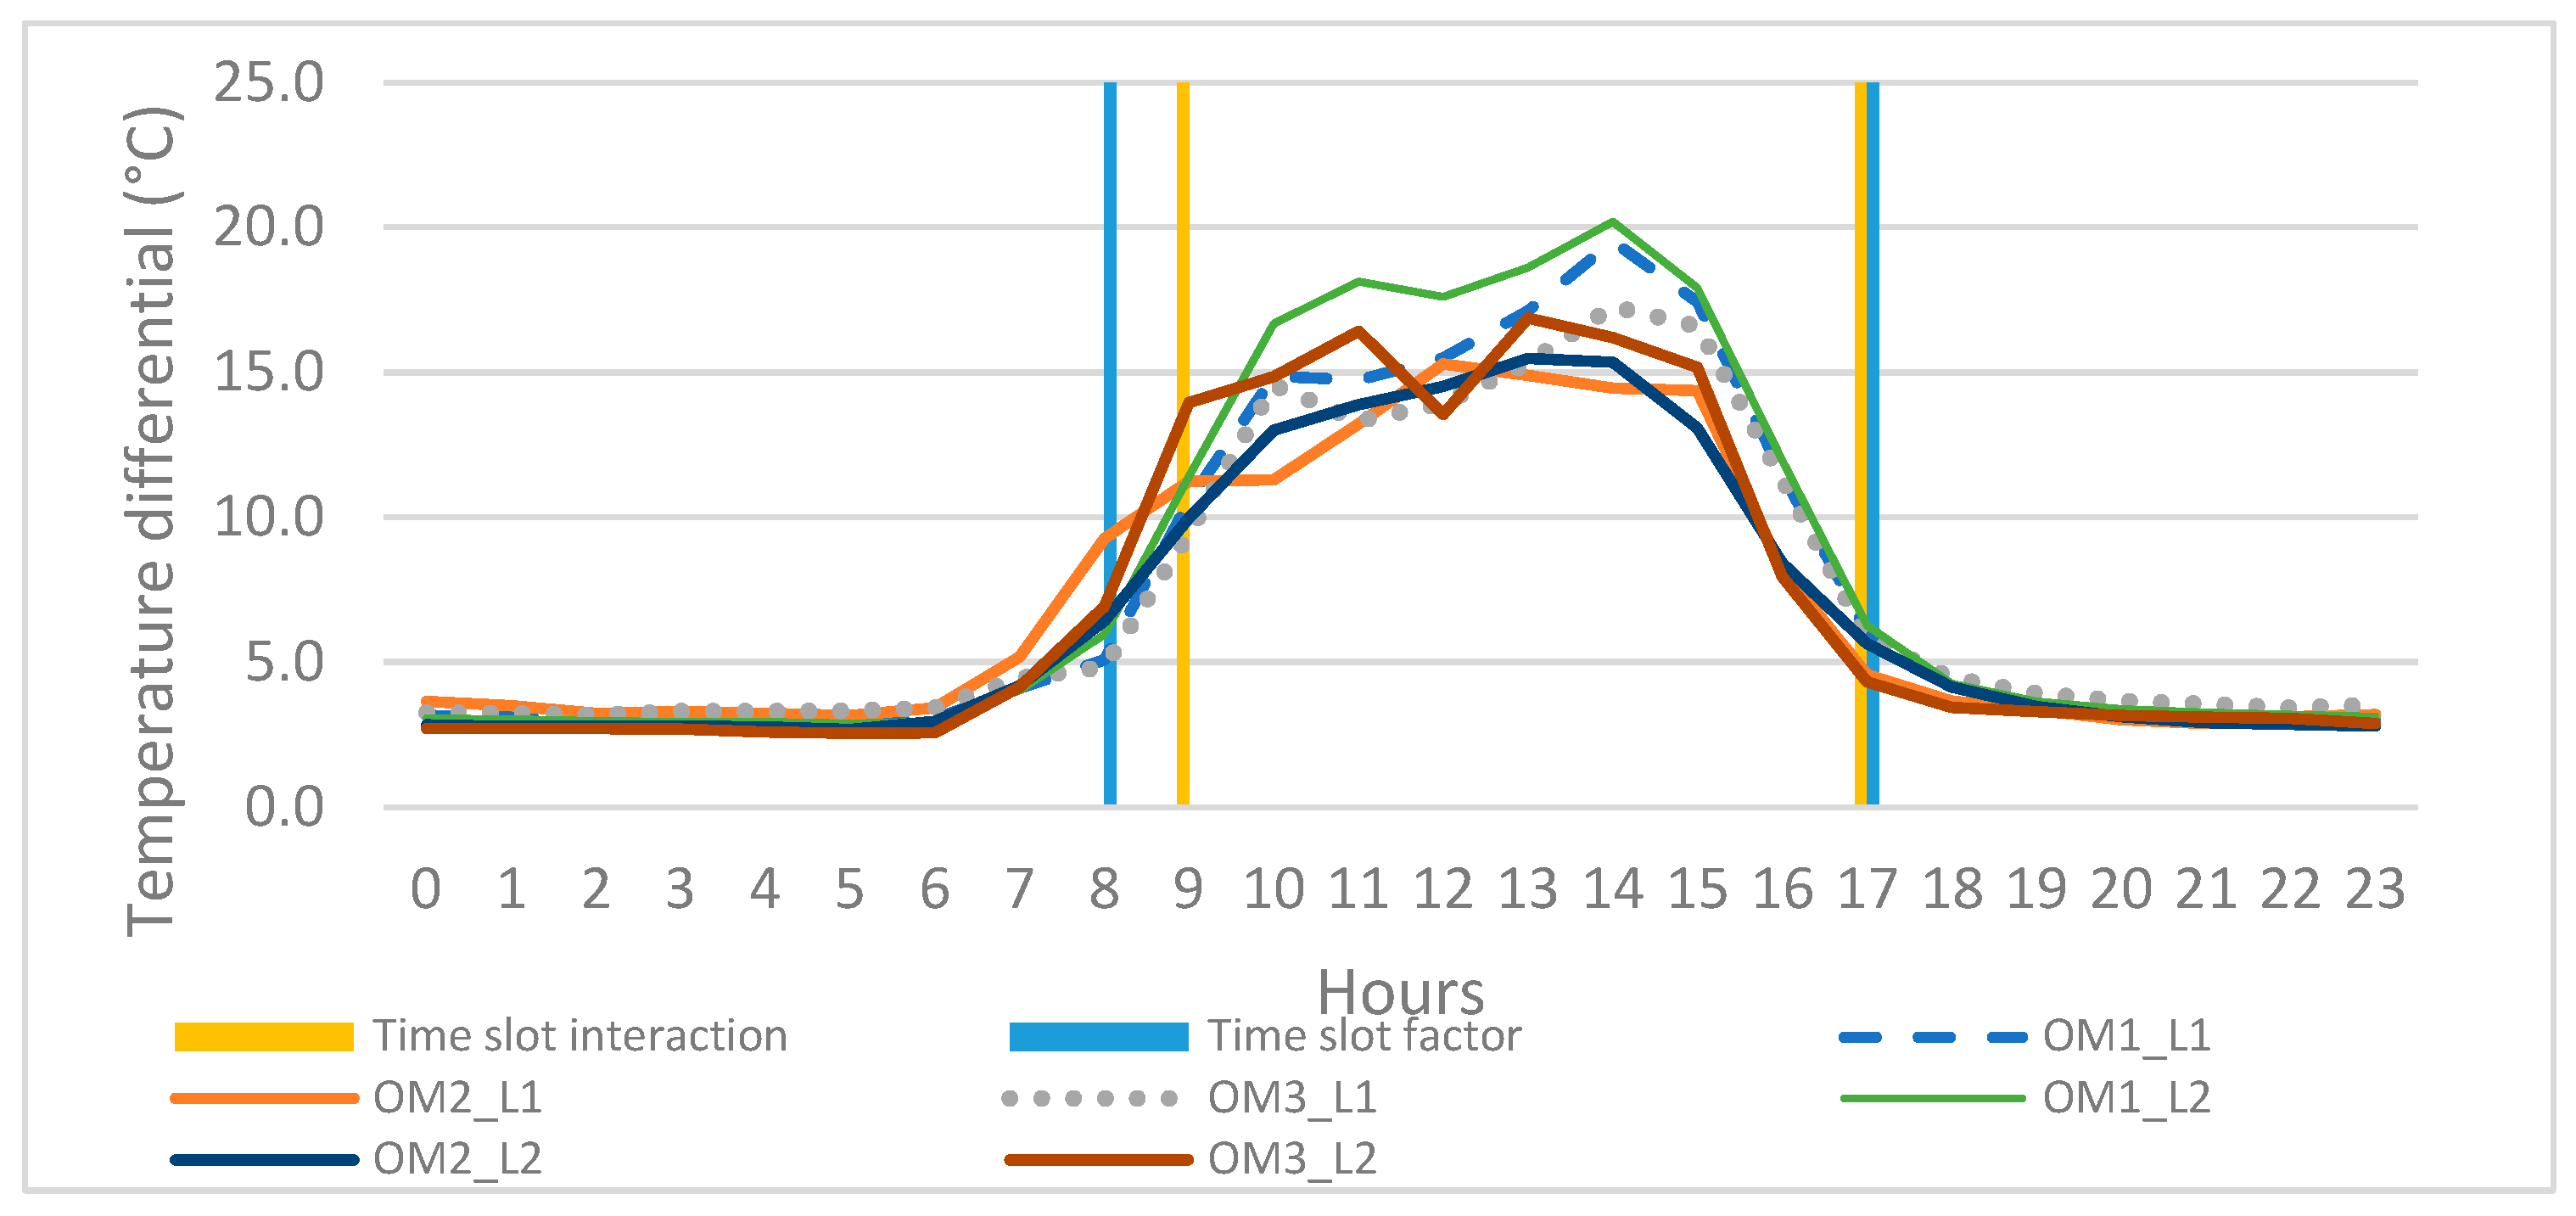
Figure 5 illustrates the temperature dynamics throughout the day under different OMs, while
Table A8 in
Appendix A shows the statistical groupings from Tukey’s multiple comparison tests for the significant interactions. Similarly,
Table A9 shows the effect of the OM*load interaction on DifT.
Figure 5 shows the T° dynamic throughout the day under different operational conditions and highlights two time slots. The first, indicated by purple lines between 8 and 17 h, represents the time slot during which DifT is affected significantly by the hour of the day (HH), while the time slot between the two vertical blue lines (9 to 17 h) indicates the time slot during which the DifT presents significant differences due to the interaction HH*OM. According to this analysis, the performance evaluation of the dehydrator was conducted between 9 h and 17 h, the time slot when significant differences occur in both T° and RH.
Homogeneity of the air inside the drying chamber. T° and RH inside the dryer chamber were recorded under different evaluation factors, such as the operation modes, OM (OM1, OM2, and OM3), fruit load (L2: without mango and L1: with mango), and the spatial location inside the drying chamber, P(s), P(x), P(l), and P(h).
Analysis of the effect of P(s): This factor showed significant differences in the relative humidity (
p = 0.0039), as did the time of day (HH) (
p < 0.0001), while the interaction P(s)*HH was not significant (
p = 0.8000). The OM (
p < 0.0001) and load L (
p = 0.0080) also affected the RH profile, as well as the interactions P(s)*OM (
p = 0.0201), P(s)*L (
p = 0.0006), and OM*L (
p = 0.0005).
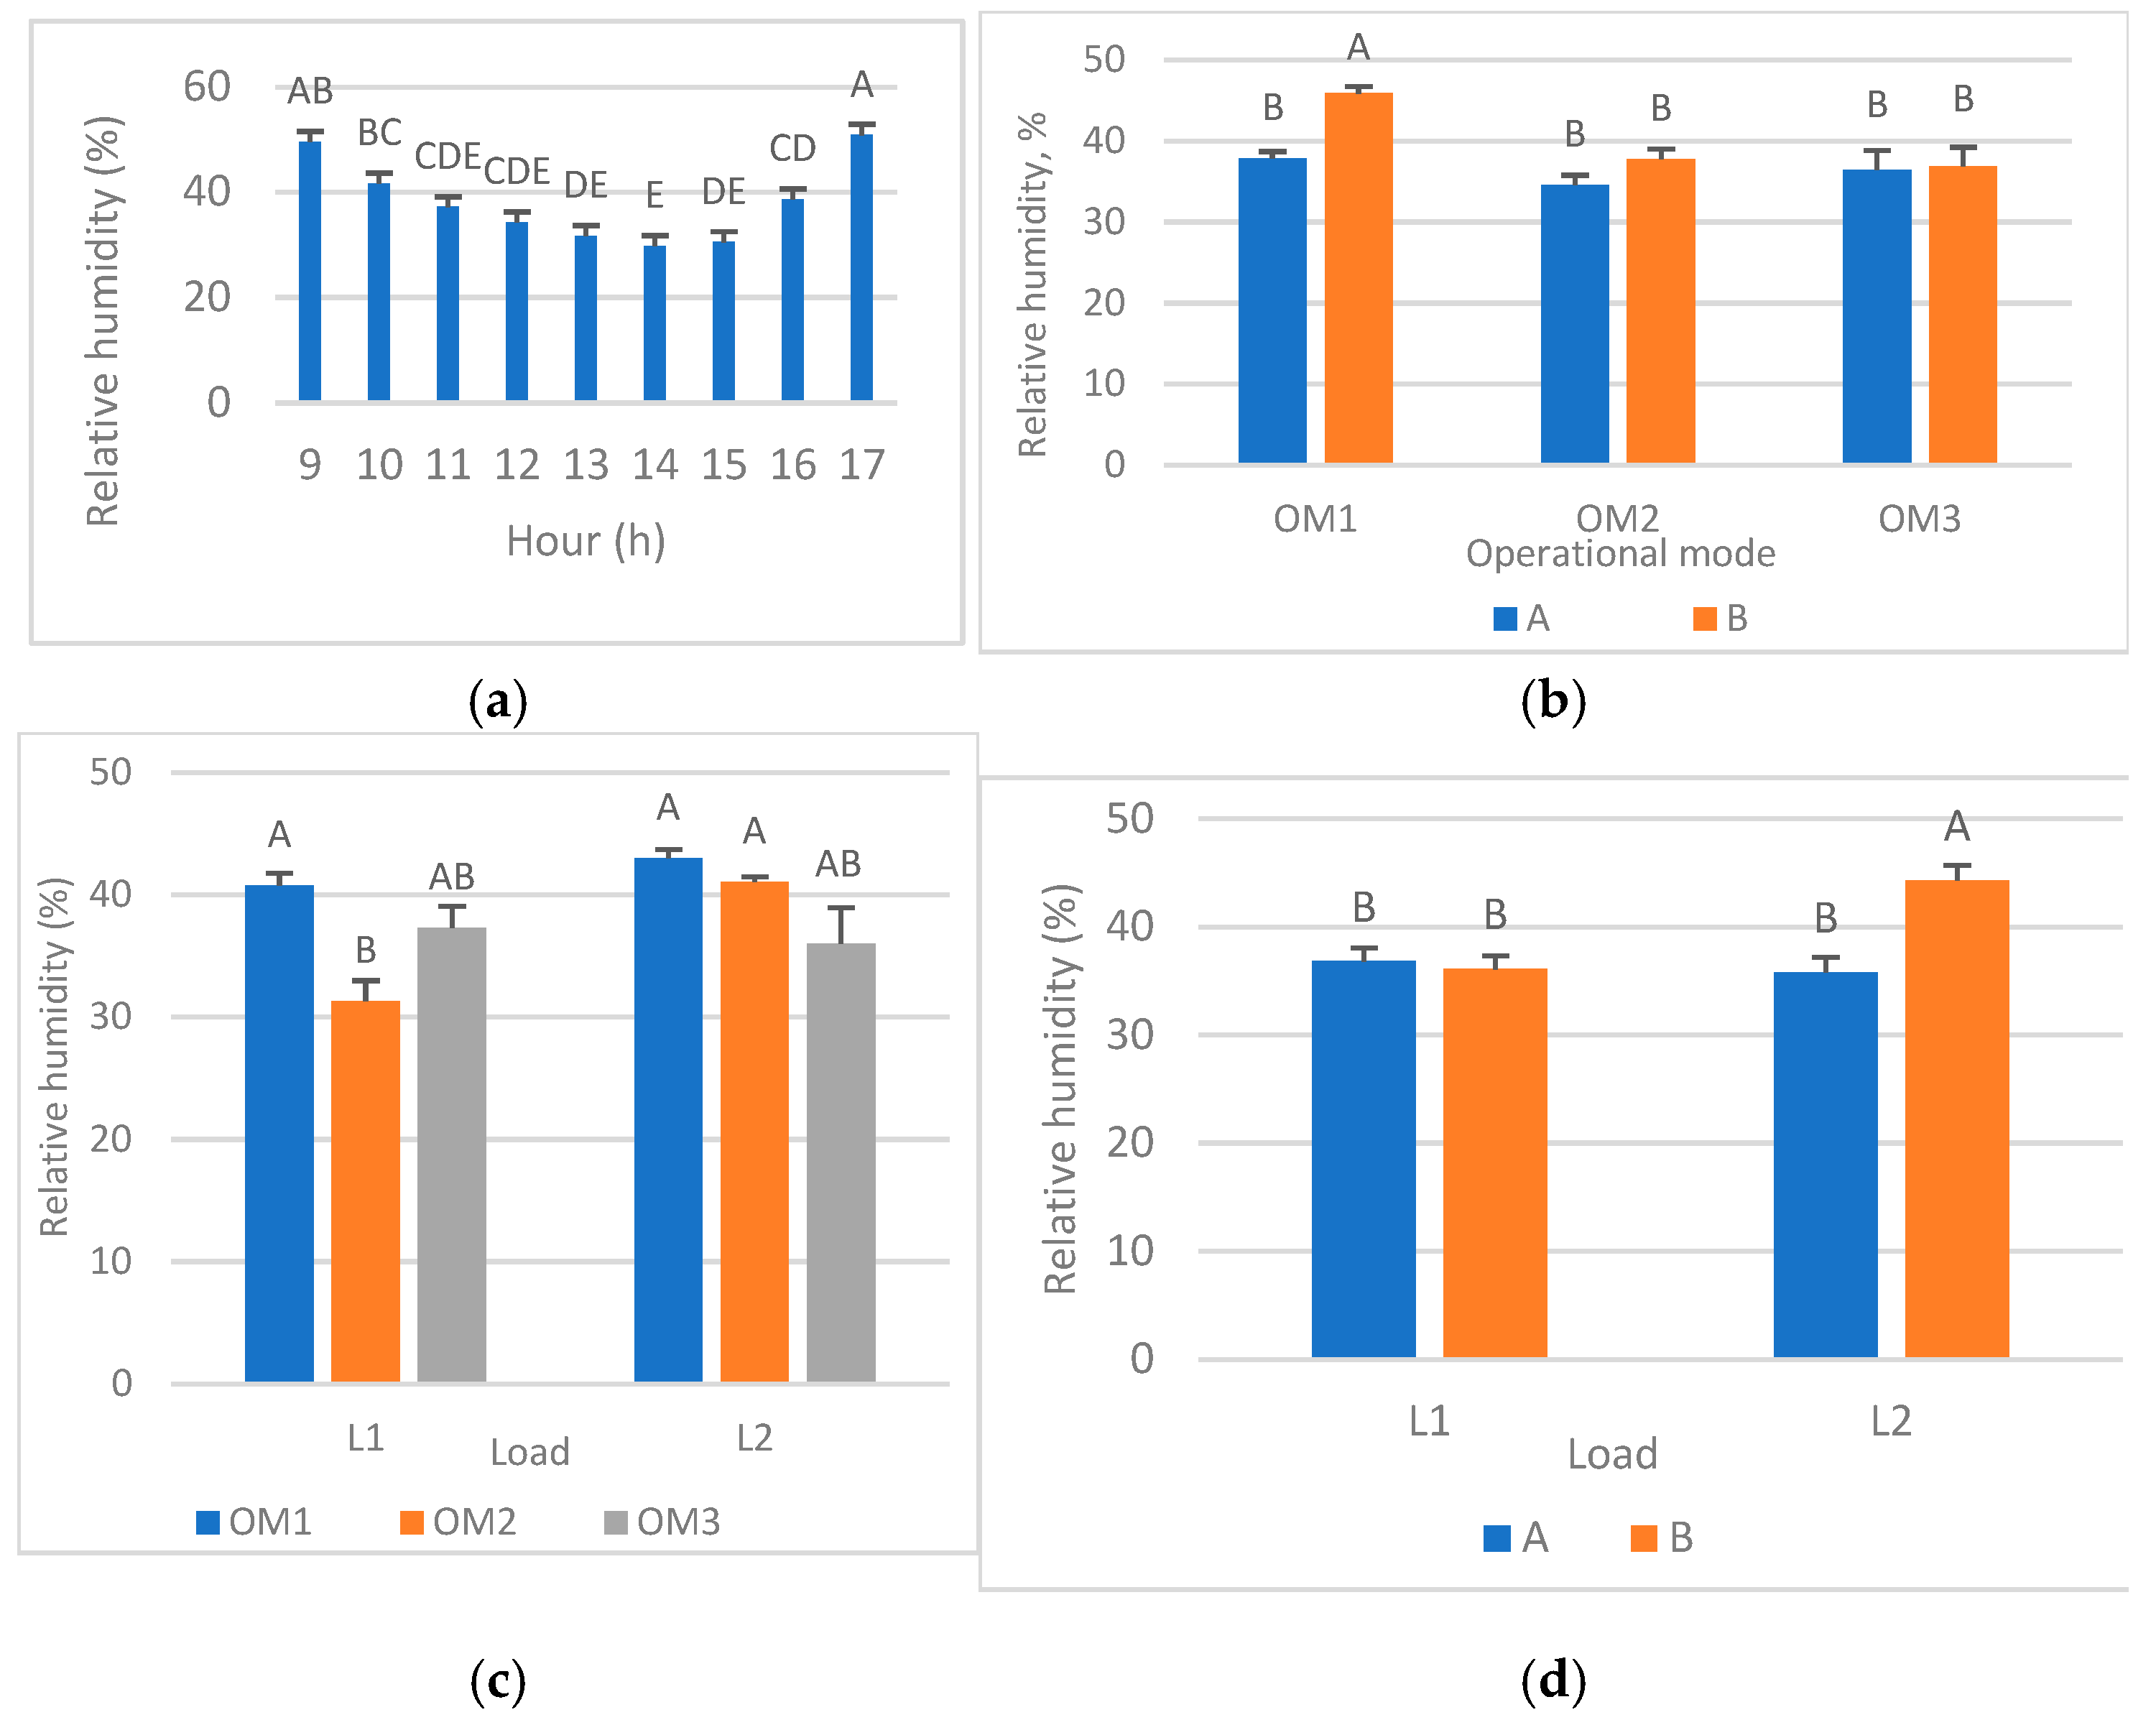
Figure 6 shows the effect of the time of day (HH) and the interactions that had significant effects on the RH profiles.
Figure 6a shows that the highest RH is found at the boundaries of the evaluation time frame (9 and 17 h), while the lowest values are found between 13 and 15 h. Regarding the P(s)*OM interaction, the highest RH was reported for OM1 and the trays located in section B (
Figure 6b). Regarding the OM*L interaction, it was found that a mango-loaded chamber combined with operation mode OM2 gives the lowest RH, while the highest relative humidity is obtained under OM1. This result suggests that OM1 is the least efficient OM since OM1 reports the highest RH inside the chamber even when the chamber is empty. In contrast, OM2 gives the lowest RH when the drying chamber is loaded with mangoes, as shown in
Figure 6c.
Regarding the most favorable conditions for system operation, the P(s)*Load interaction showed that section B trays present higher RH than those located in section A when the dehydrator is empty, and this difference disappears when the chamber is loaded with fruits (
Figure 6d).
Similar to the RH analysis, the temperature was also affected by factors such as the time of the day, HH (
p < 0.0001), load, L (
p = 0.0044), and interactions P(s)*OM (
p = 0.0403), P(s)*L (
p = 0.0059), OM*L (
p = 0.0117), and P(s)*OM*L (
p = 0.0334).
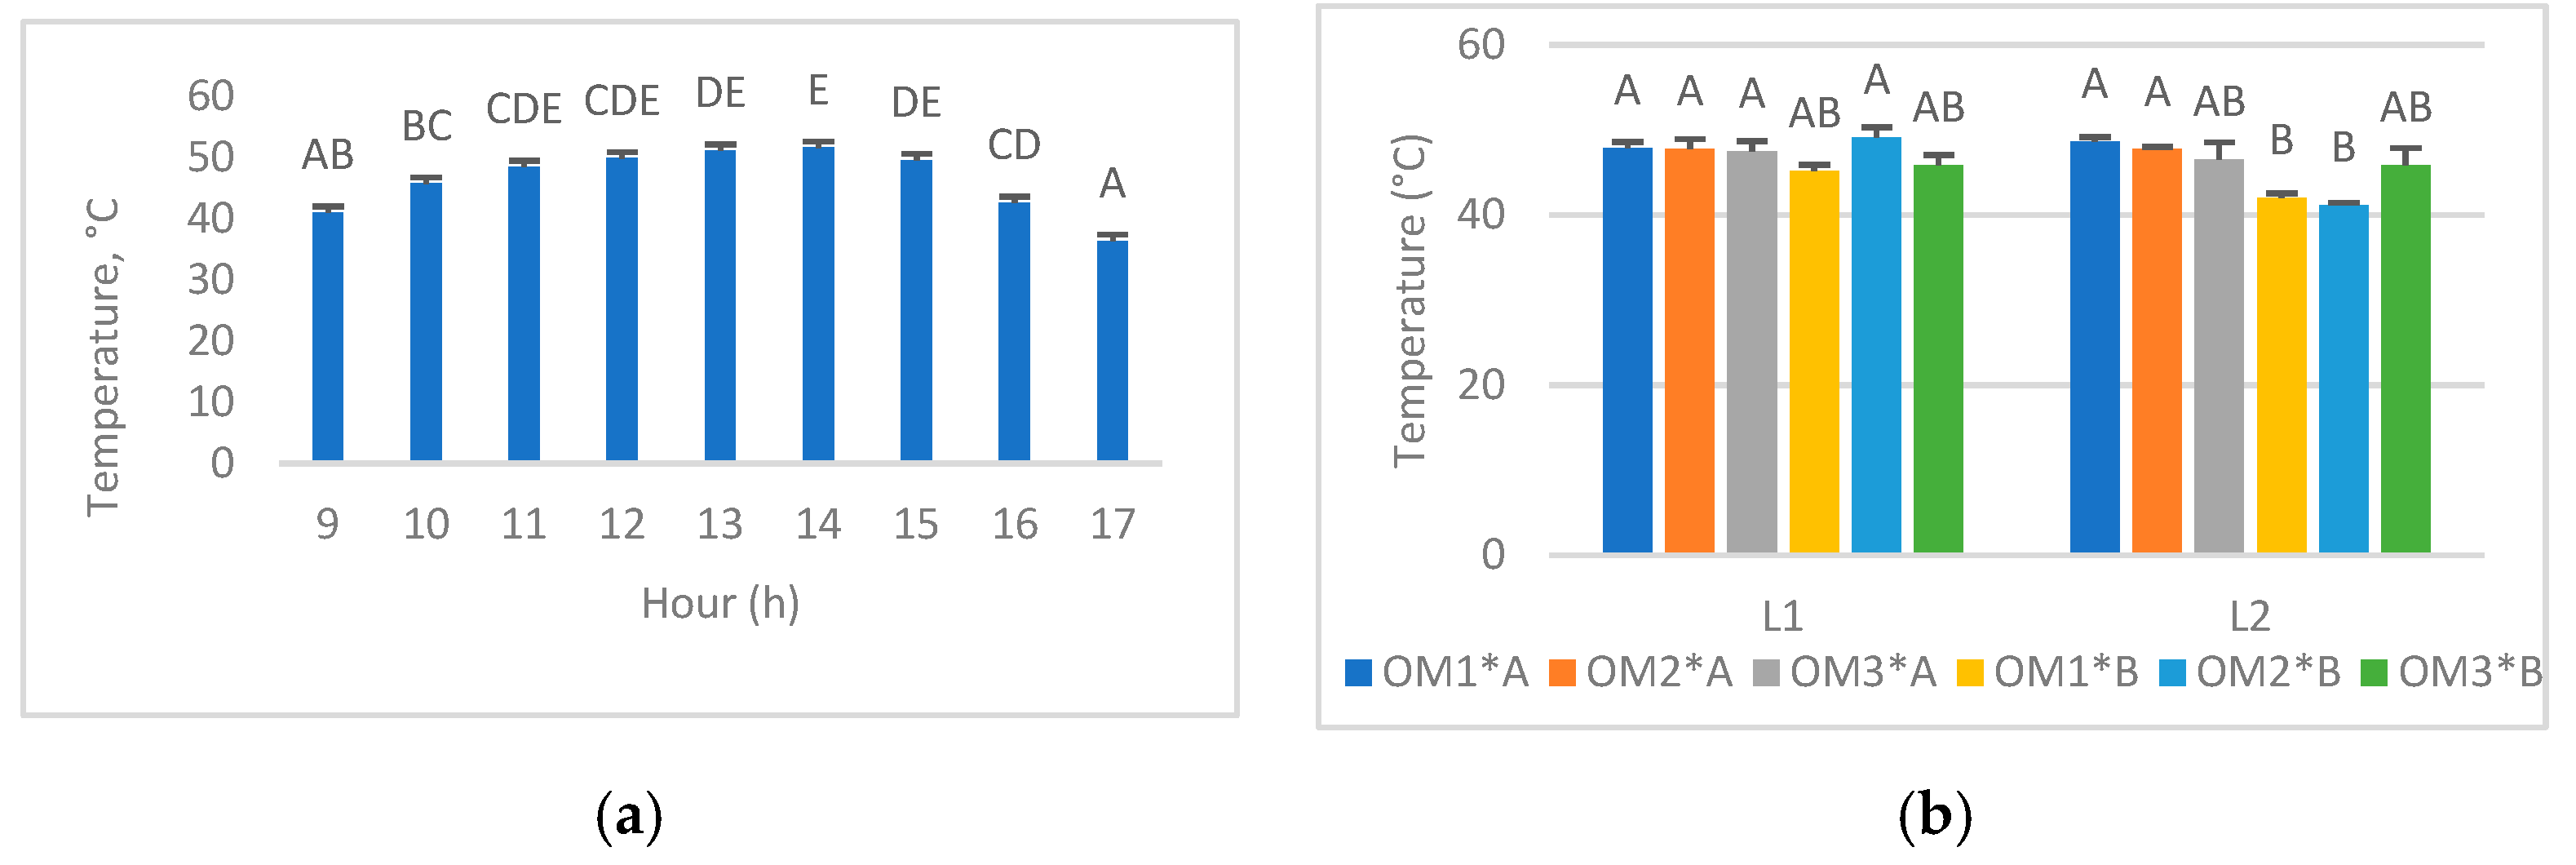
Figure 7 shows the behavior of the temperature under the influence of these factors.
Figure 7a shows that the lowest temperature is also found at the boundaries of the evaluation time frame (9 and 17 h), and the highest temperature is found at 13 h, which is in line with the behavior observed for RH. This confirms the inverse correlation between these two variables; thus, the subsequent analysis focused on the behavior of the temperature.
Figure 7b indicates that trays located in section A report the highest temperature values compared with those reported for trays located in section B. This can be explained by the greater exposure to solar irradiation presented by section A trays, which are located in the highest part of the chamber. Additionally, section B trays are close to the ground, which is not insulated, causing high energy losses in this area, resulting in temperature decreases. These findings confirm the effects of factors such as the solar radiation availability, airflow, and the position within the dryer on the efficiency of the dehydration process [
10]. According to
Figure 7b, when the dryer is loaded with mangoes, there is no difference in the temperature in section A due to the OM, while for the temperature profile in section B, the OM2 reports a higher temperature than those reached under OM1 and OM3 operations. When the drying chamber is empty, the highest temperature is found in section B under OM3, while in section A and the lowest temperature is found under OM3. These results are explained by the fact that under OM3, the air inside the system is homogenized regularly, which reduces the overall temperature as the temperature is lower near the ground than in the rest of the air mass.
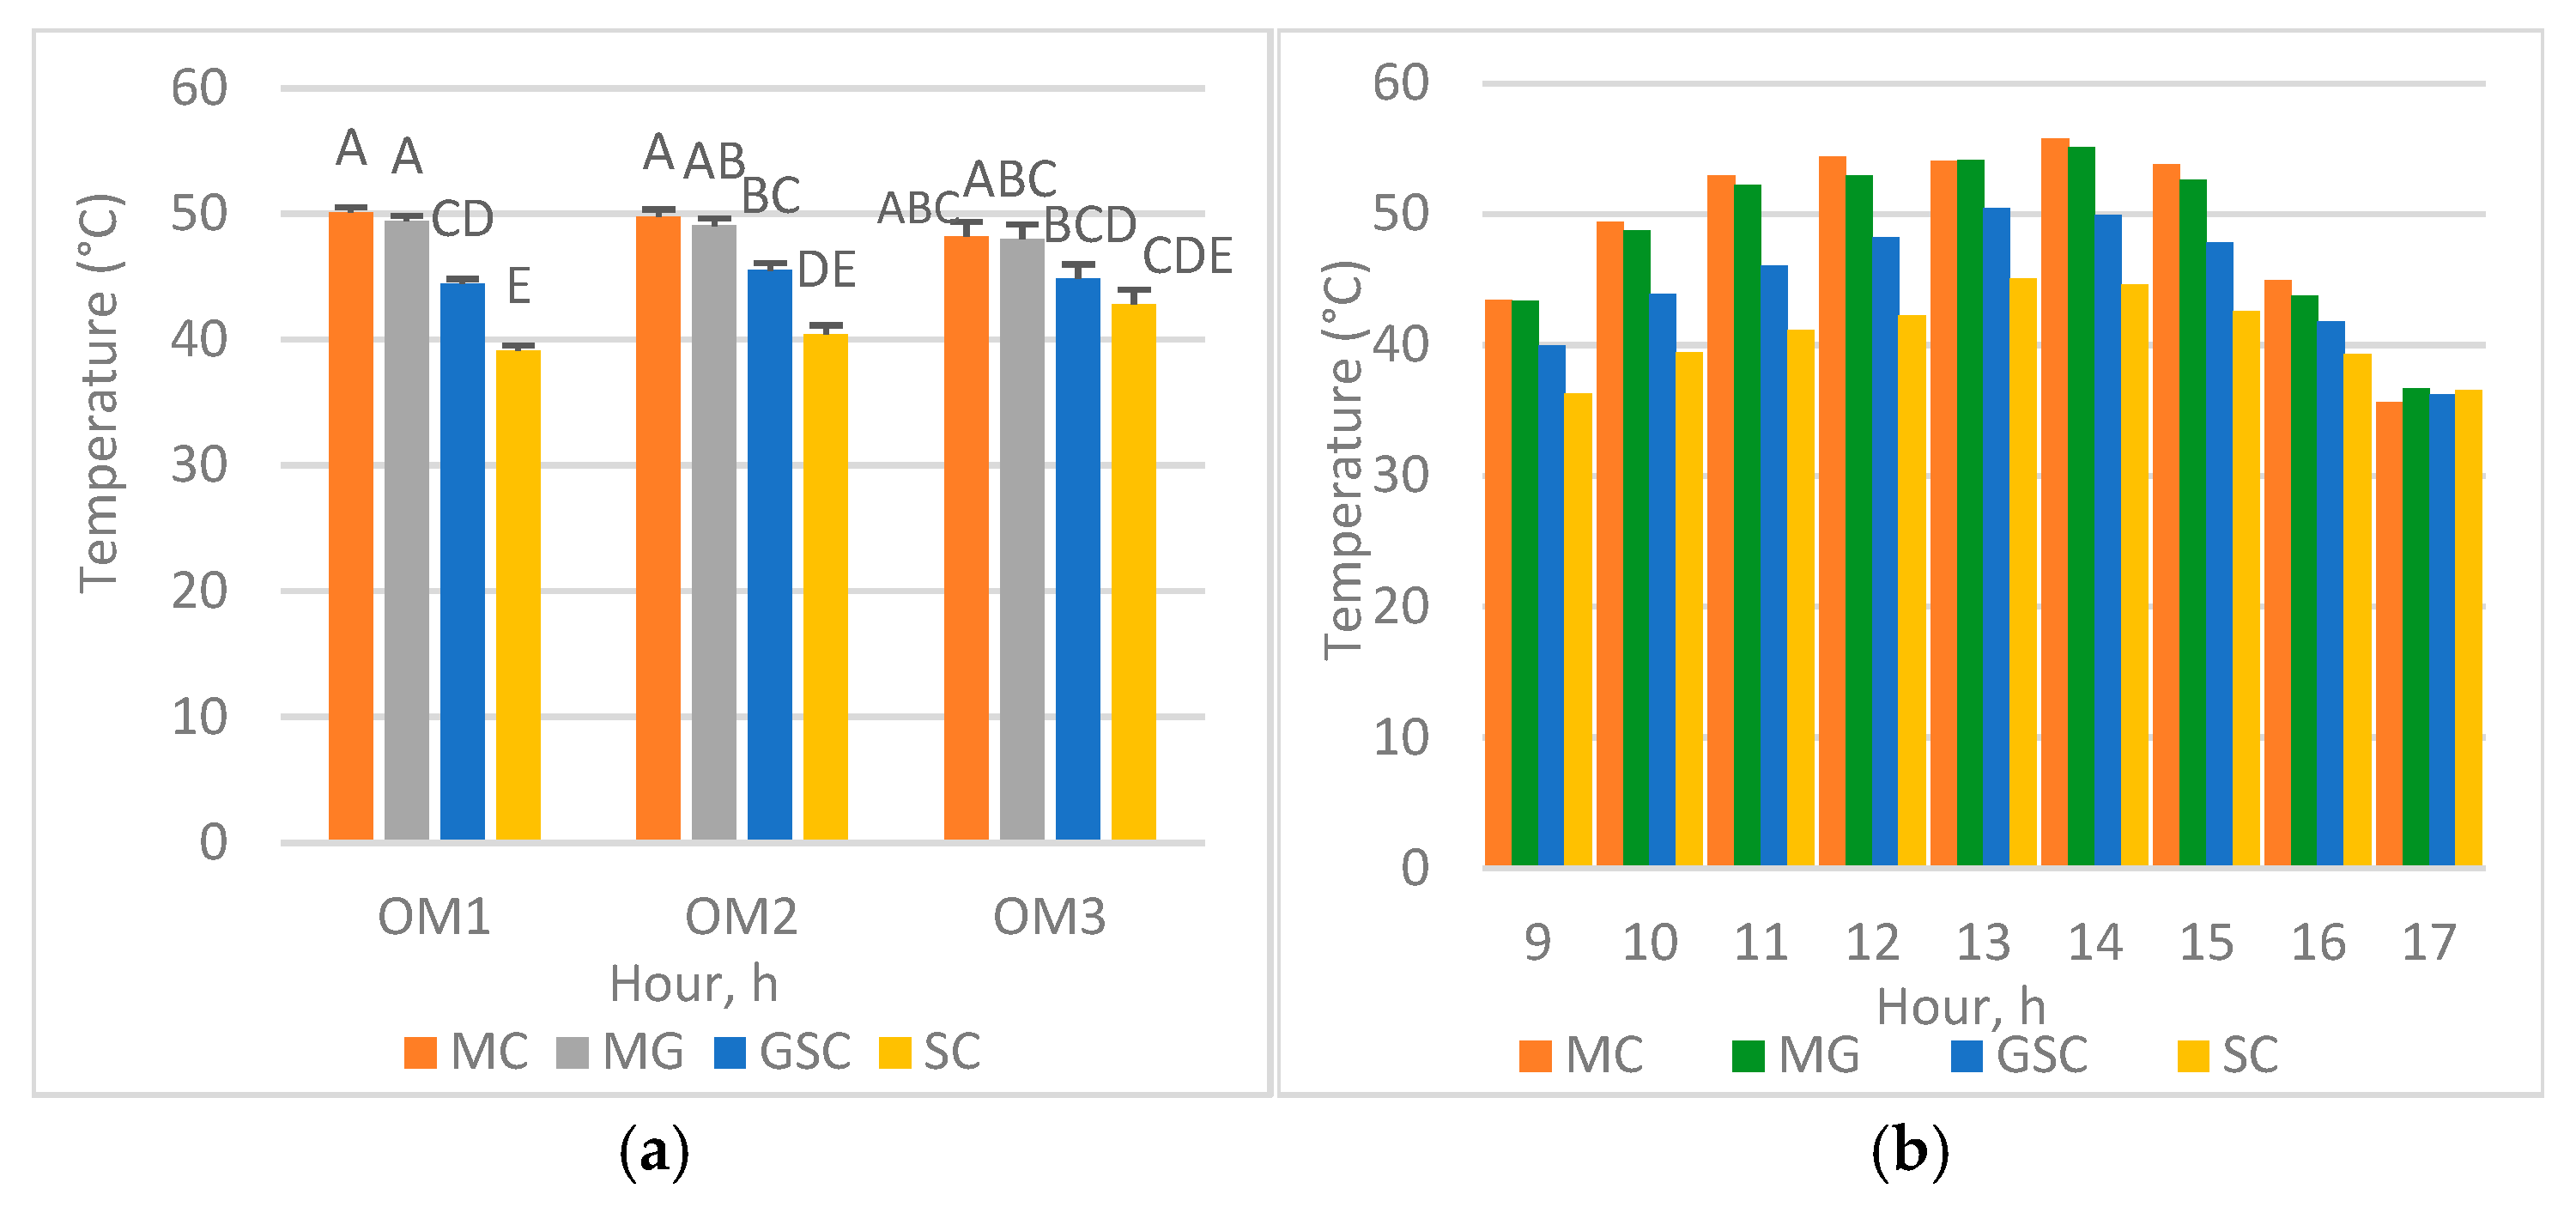
Vertical Profile P(h). Significant differences were found for P(h) (
p < 0.0001), time (HH), and OM (
p < 0.0001) on RH, and for the interactions P(h)*OM (
p = 0.0019) and the interaction HH*OM*Load (
p = 0.0037). Similarly, a temperature analysis showed significant differences due to time (HH), P(h) (
p < 0.0001), and the interactions P(h)*HH (
p = 0.0125) and P(h)*OM (
p = 0.0231), which are illustrated in
Figure 8.
Figure 8a shows a temperature gradient from the top of the drying chamber (MC) to the floor (SC). The same figure shows how the OM affects the T° profile: OM3 reduces the gradient, while OM1 increases it. This confirms the homogenizing effect of OM3. Another point to highlight is the small difference found between the MG and GS in the dryer chamber, which highlights the insulating function that the geomembrane offers to avoid energy loss toward the ground. However, the highest temperature differences were found between the MG and GS, which also indicates that the geomembrane acts as a barrier to the homogenization of air properties within the drying chamber. Therefore, the geomembrane position should be evaluated.
Figure 8b shows that the highest temperatures are found between 11 and 14 h, for positions MC and MG, without showing significant differences between them, as shown in
Table A10. Based on these results, we recommend carrying out the dehydration process between 11 and 15 h to increase its performance. In other studies, variations of up to 20 °C and 20% RH have been found between trays located in the highest and lowest parts of the dehydrator [
21]. Based on these results, it can be postulated that the dryer in the present study offers homogeneous conditions, particularly when the dryer is operated under OM2 and OM3.
Analysis of the P(l) factor shows a significant effect on the RH P(l) (p = 0.0149) and the T° (p = 0.0329). The RH in the corridor was significantly higher than at the lateral sides, and consistent with this, T° was higher at the side walls than in the corridor. Concerning OM, OM1 had the highest RH, followed by OM3; OM2 had the lowest RH.
A similar analysis for temperature confirmed the influence of HH (p < 0.0001) and identified the effect of the P(l) (p = 0.0329) on the temperature profile. The effect of the P(l) indicates that there is a temperature gradient across the width of the dehydrator, where the highest temperatures are achieved near the walls and the lowest in the central corridor. This can be explained by the fact that walls contribute to the energy transfer by conduction in addition to heat transfer by convection, which increases the temperature more quickly in areas near the dehydrator walls, while in the center or corridor, the heat transfer occurs only by convection, which is a slower energy transfer method that increases the temperature more gradually. Additionally, the corridor has a large space that is not insulated, leading to high temperatures. The high temperatures achieved between 11 and 15 h of the day are correlated with the high irradiation that occurs at this time of day and with the direct incidence of solar rays on the drying chamber during this period.
Analysis of Factor P(x). This parameter represents the tray position along the “x” axis, from position 1 to 9. The results showed that position P(x), time HH, and OM (p < 0.0001), as well as interactions HH*Load (p = 0.0154) and OM*Load (p < 0.0001), had significant differences in the relative humidity. The trays close to the ends of the dryer chamber had a lower RH compared with those located towards the center of the chamber. The interaction P(s)*OM*L showed that OM2 with the chamber loaded resulted in the lowest RH, while the highest RH was found for OM1.
Performing a similar analysis with the temperature, time HH, and position P(x) showed significant effects (p < 0.0001). Consistent with the results found for the RH, the highest temperatures were found in the trays close to the front and to the back of the drying chamber; this was in trays three and nine, while tray six had the lowest temperature. This behavior could be due to the chamber’s position, as the front wall receives sunlight in the morning and the back wall in the afternoon, more than those located at the center of the drying chamber. Additionally, the central rotary fan can reduce the temperature profile of the central trays as it is located between positions six and seven.
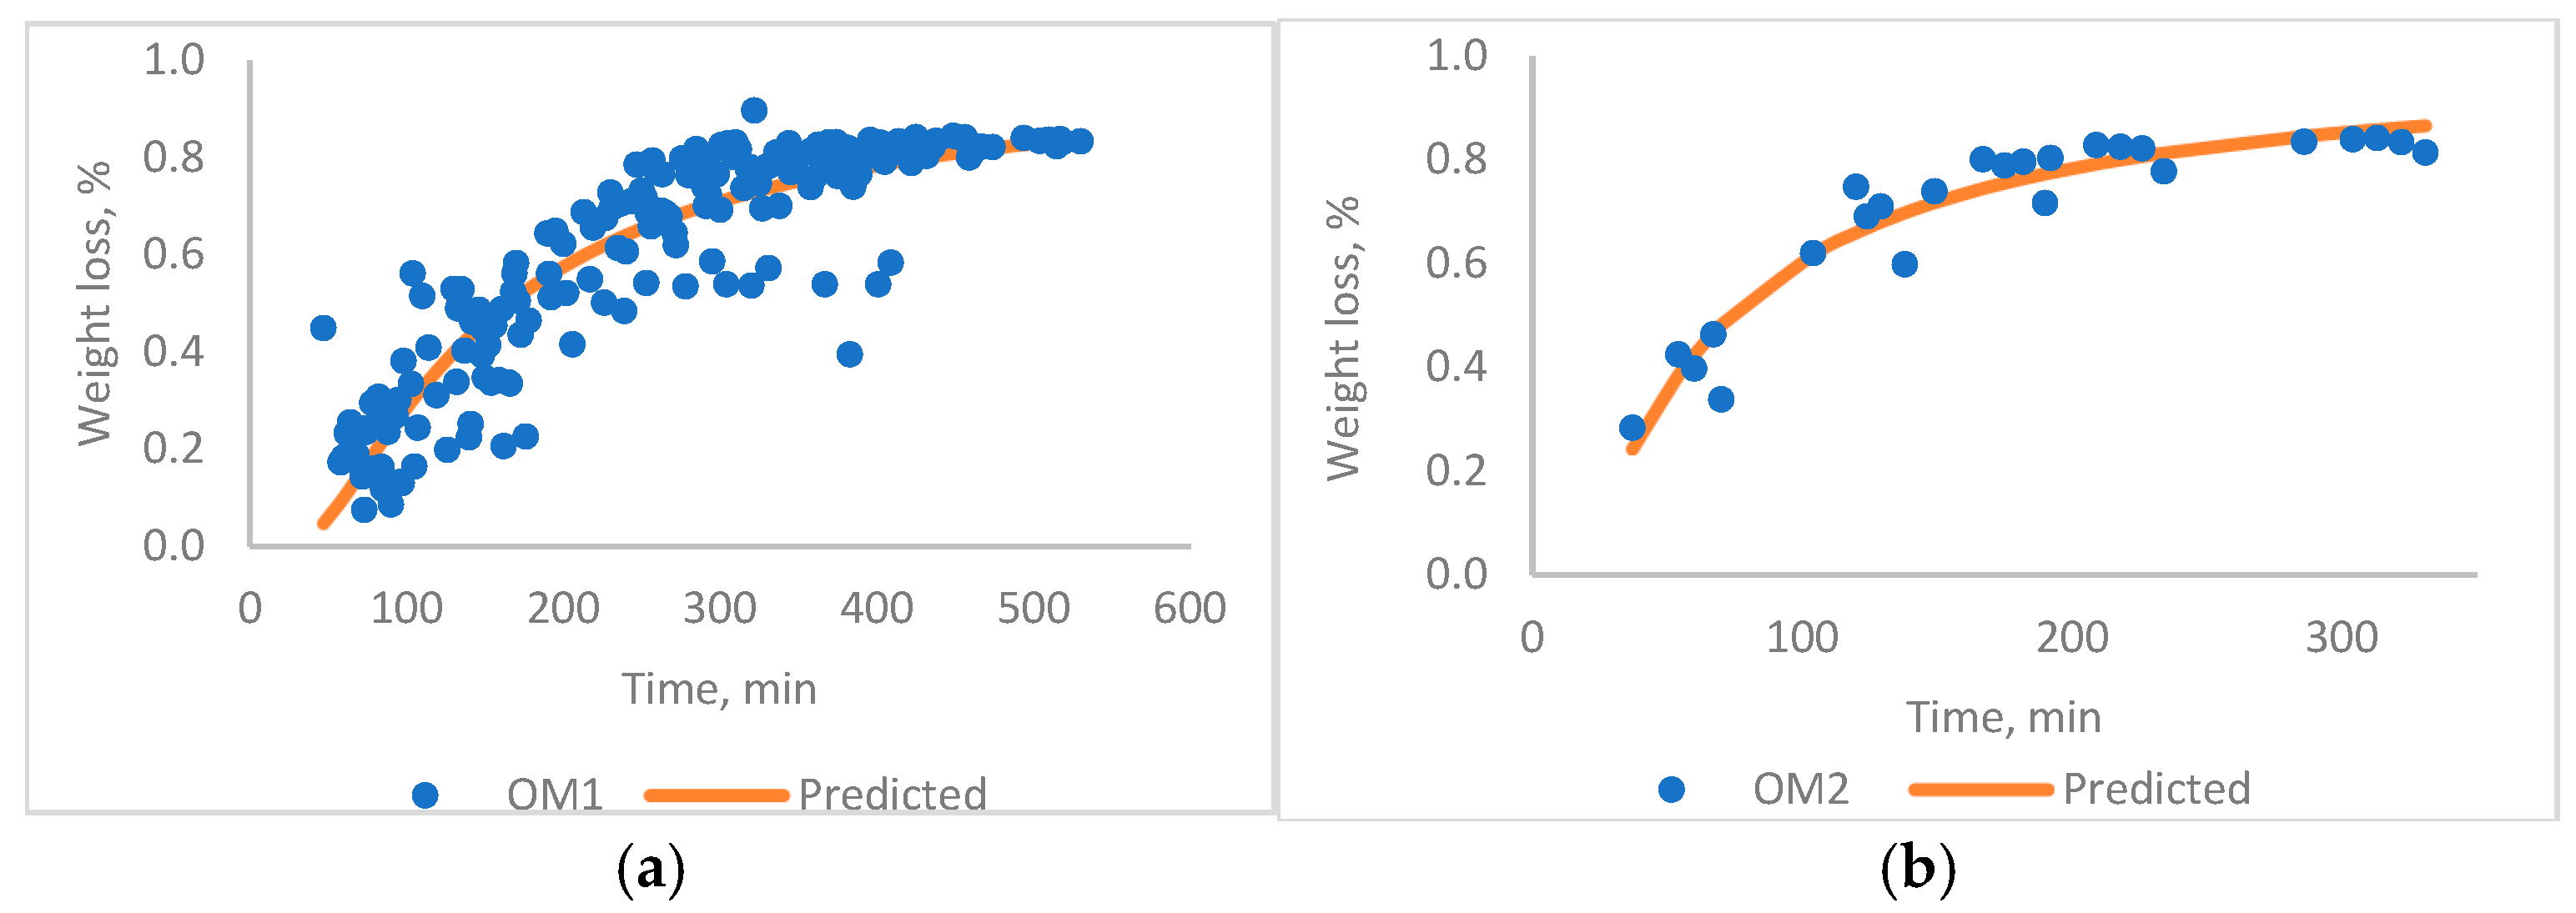
3.3. Mango Drying Rate
The analyses showed that the OM1 mode resulted in a final moisture content of approximately 17%, while operation modes OM2 and OM3 achieved a 7% moisture content. The dehydration process under mode OM1 lasted for eight hours. Under OM2 and OM3, the dehydration process was stopped after six hours of dehydration. The water activity of the dehydrated mangoes ranged between 0.65 and 0.72.
Three mathematical models were evaluated to model the weight loss of the mango slices during solar drying under the three operation modes: Henderson and Pabis, Page, and Lewis or Newton. For each model, the residual values, sum of squared errors (SSEs), mean squared error, and root mean squared error (RMSE) were calculated using the Marquardt method for the parameter estimation by least squares in nonlinear models. Of these three models, the Page model gave the lowest values for the SSE, MSE, and RMSE parameters in all systems (OM1, OM2, and OM3) (
Table A11), meaning it provides the most accurate predictions with minimal error. The Page model was used to estimate the drying curve, as illustrated in
Figure 9, for both OM1 and OM3, with its parameters shown in
Table 3. The Page model is commonly used to model the drying of agricultural products, including pulps and seeds, among others. It generally has a better fit to curves generated from experimental drying data of agricultural products, such as mango pulp, rice, passion fruits, and mangoes, among others, with R
2 values greater than 0.9, which are similar to the results obtained in [
22].
Figure 9 illustrates the dynamics of mango dehydration under the two operation modes, OM1 and OM2, which represent contrasting conditions. The first one, OM1, operates without any forced airflow and uses only passive energy to heat the air; the second one, OM2, uses passive energy but also incorporates forced airflow, making use of photovoltaic energy to operate the fans responsible for renewing and homogenizing the air.
The curves in
Figure 9 show better performance of the solar dryer operated under OM2, as it reduces dehydration time by 50%. In the first hour, the weight loss exceeded 60% when operated under OM2 and 25% when operated under OM1. After 200 min, the differences between these two modes of operation were reduced; the weight loss reached 80% with OM2 and 60% with OM1. At the beginning of the process, the drying rate increased gradually with the increasing temperature and decreasing RH. However, once the temperature stabilized, the drying of the mango slices increased the RH, and the drying rate gradually decreased [
22,
23,
29]. From
Figure 9, it is also possible to identify the positive effect of a high airflow on the mass and energy transfer processes. In OM2, the central rotary fan increases the airflow and air velocity, probably enough to remove the air layer on the mango slice surface, which is the controlling step in the drying process. This can be observed in
Figure 9, where, in the first two hours, OM2 shows a higher dehydration rate than OM1, which has no rotary fan. Additionally, the rotary fan prevents dead spots and the formation of T° and RH gradients in the drying chamber, which enhances the mass and energy transfer. The periodic replacement of moist air with fresh air by the intake fans and exhaust fan system also maintains the driving force at a high level. Finally, the exhaust fan at the top of the side wall of the drying chamber promotes the movement through the trays.
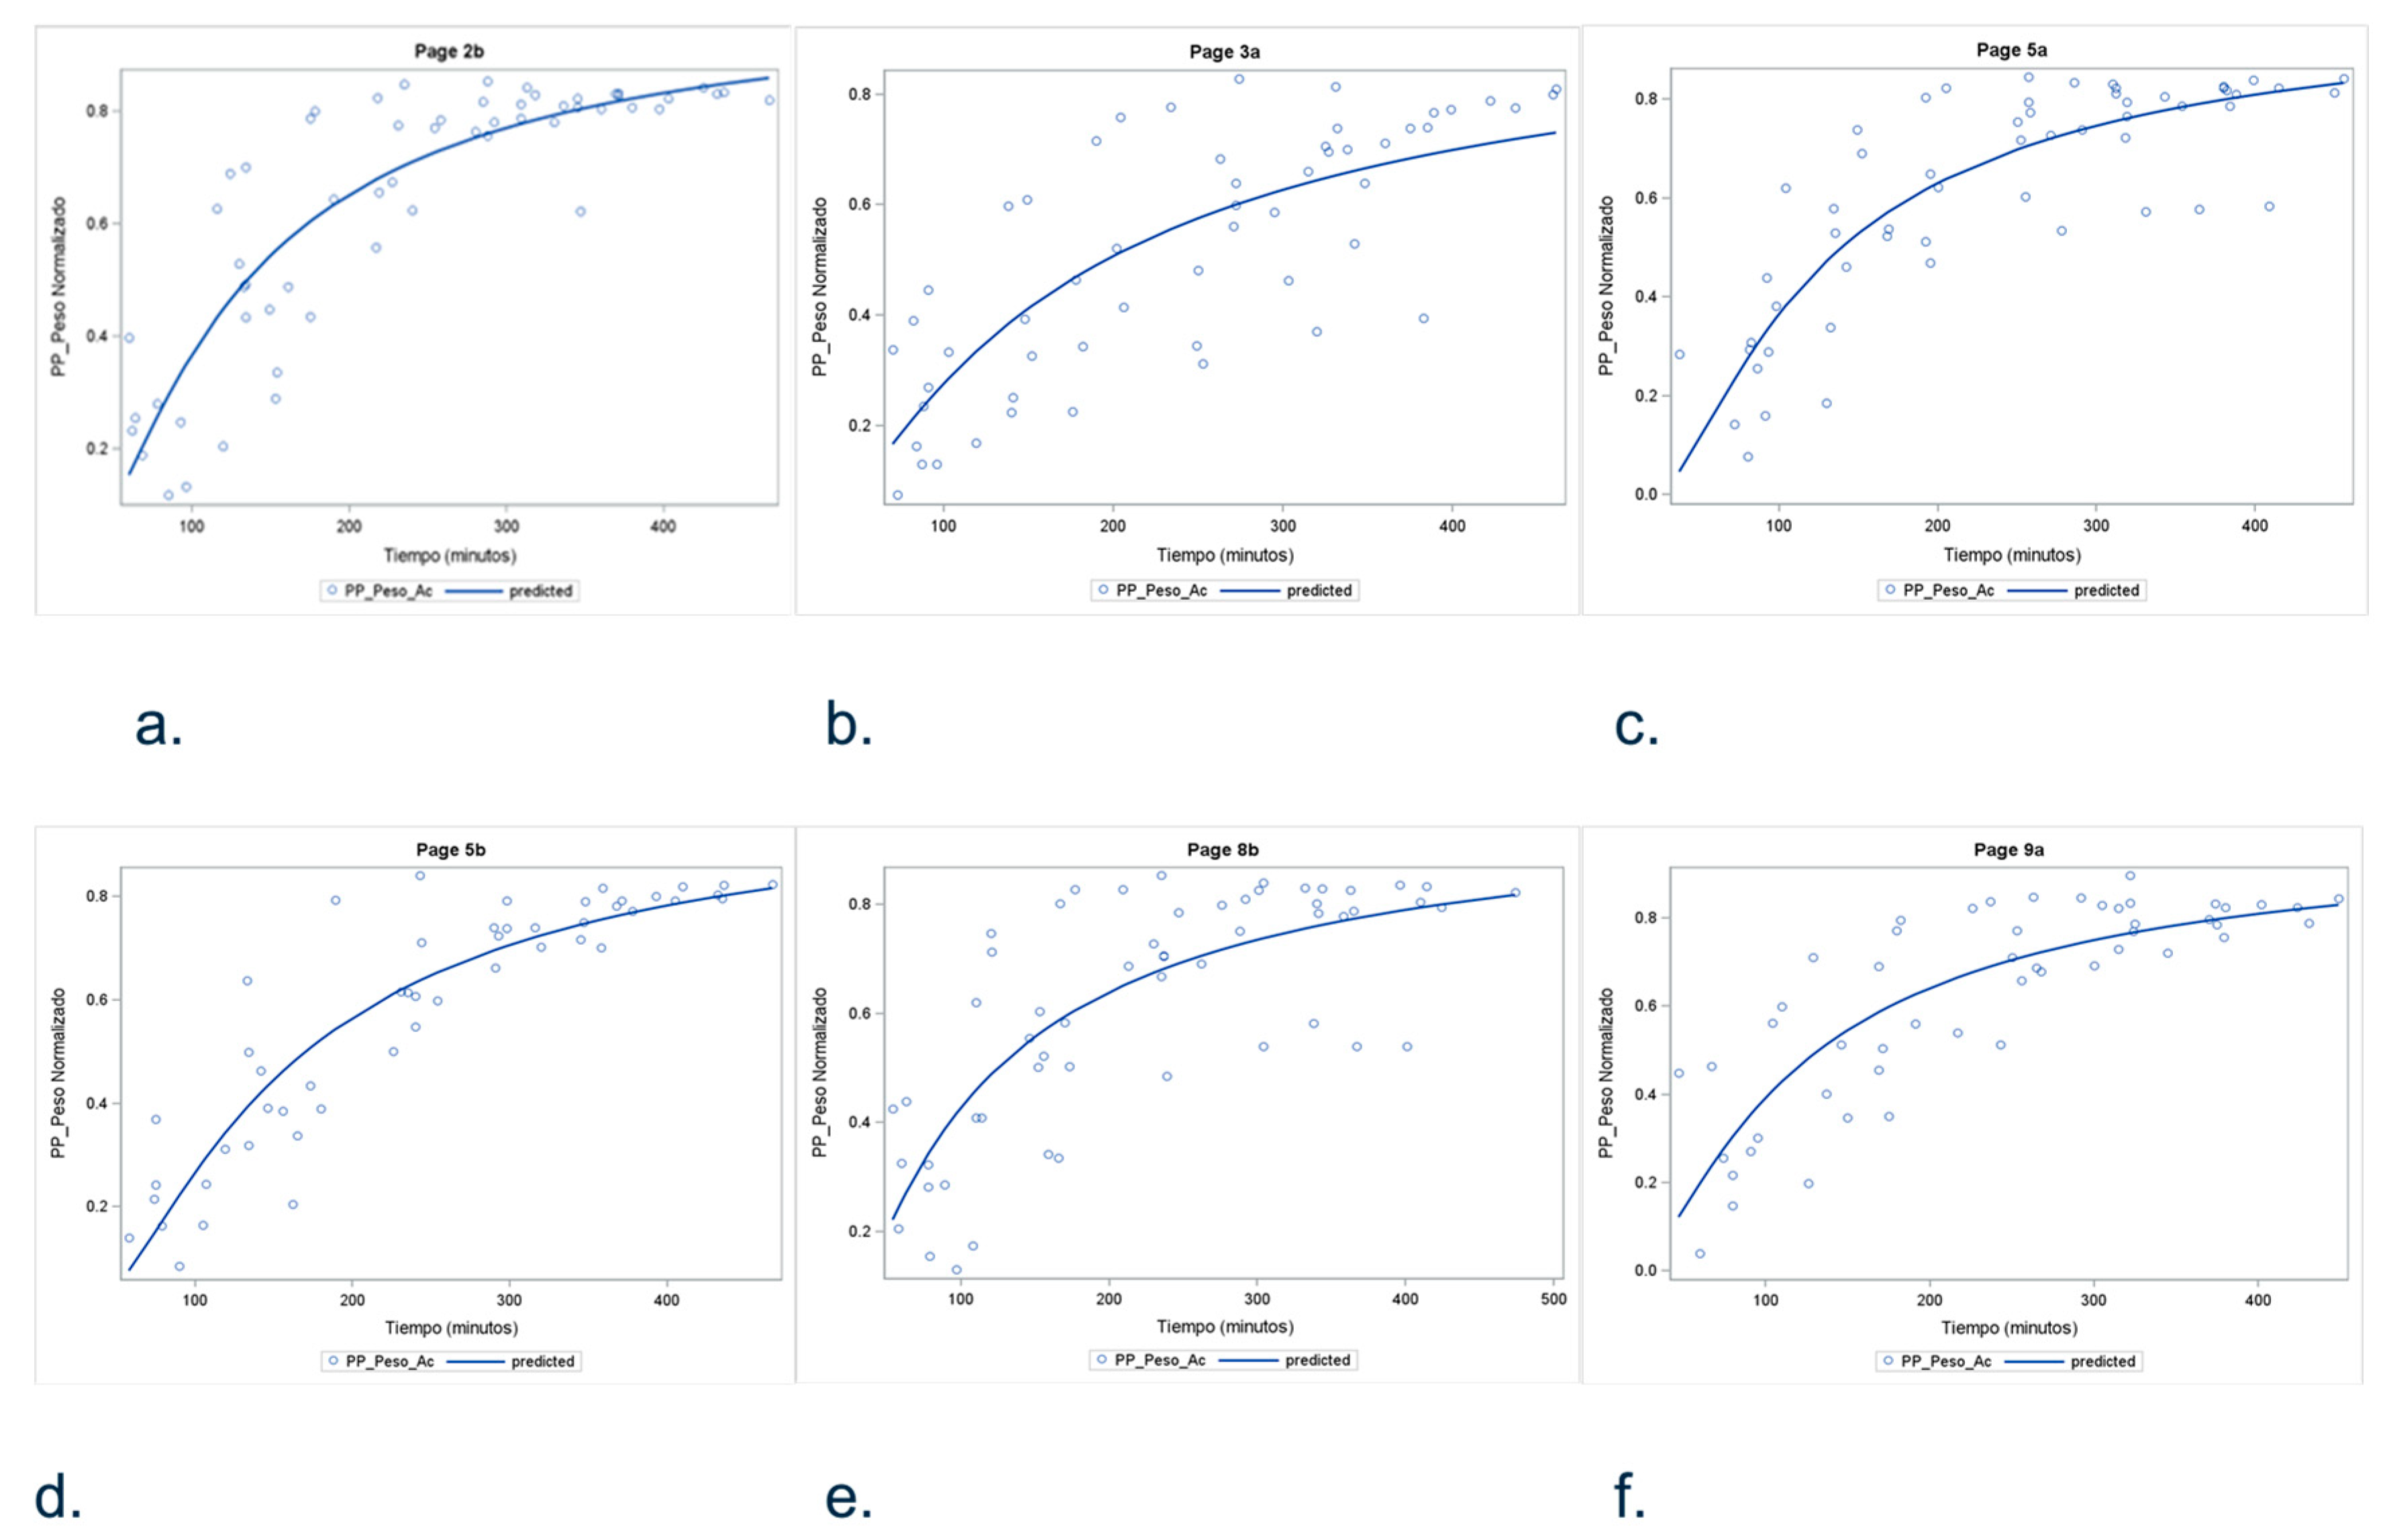
The homogeneity of the drying chamber is summarized in
Figure 10, where the drying curves from six trays located at different positions in the chamber (2b, 3a, 5a, 5b, 8b, and 9a) were evaluated. The Page model was used to analyze the data obtained. Based on the lower variability and greater stability during the process, the tray in position 5 seemed to have more stable drying rates, although the drying in all trays showed a similar performance. The use of the central rotary fan is probably sufficiently efficient to homogenize the air conditioning within the drying chamber, eliminating the differences in temperature profiles identified in the chamber when it was operated under OM1.
3.4. Sustainability Analysis
Based on all the results found, the dehydration of mango slices under operation mode OM1 resulted in moisture contents of 17% and 12% after six and seven hours of dehydration, respectively. Under operation modes OM3 and OM2, the final moisture contents ranged between 6.5 and 7% after the same time of dehydration. In most cases, the water activity recorded values lower than 0.7, which are conditions that prevent food spoilage and deterioration. From these results, it can be proposed that the combined use of passive and photovoltaic energy (OM2 and OM3) represents more efficient drying processes. Photovoltaic energy supplies the energy needed to operate the exhaust, intake, and rotary fans, which remove and replenish the exhausted and moist air with fresh air, homogenizes the air mass conditions inside the drying chamber, and generates a strong airflow that improves the mass and energy transfer coefficients and, thus, the mass and energy transfer processes [
23,
30].
OM1 had a lower drying efficiency compared with OM2 and OM3, as depicted in
Figure 6,
Figure 7,
Figure 8 and
Figure 9; however, its efficiency is still high, with a drying rate of 0.12 kg/Kg h b.w for 12% of the final moisture, 18 m
2, and eight hours of drying. Comparing these results with other similar studies is not easy, as the drying performance depends on different factors, such as the type of product, initial moisture content, type of dryer, climate conditions, and airflow [
7]. Based on these considerations, the results were compared with those reported for apples, eggplants, and potatoes dried in open dryers after eight hours of drying in open dryers, where drying rates of 0.088 kg/kg h and 0.03 kg/kg h were reported for open and convective dryers, respectively, for the same period of eight hours and final moisture of 12%. However, it is important to mention that these processes have been conducted on a small scale. Similar studies on peppermint and potatoes [
11] conducted in open dryers also achieved a 12% final moisture in eight hours of drying, and another study reported 12 h [
31] for drying mango slices. There are several studies on solar dehydration [
7], but most of them are at laboratory or smaller scales. Few studies have been conducted on medium or large scales to compare or validate these results. A 50 m
2 solar greenhouse-type tunnel drying unit without a forced ventilation system [
25] was evaluated for drying mangoes, reporting drying times of between 23 and 27 h and a final moisture content lower than 12%, which highlights the efficiency of the solar dryer evaluated in the present study.
The results show that the best conditions for dehydration are achieved between 11 and 15 h—a time frame during which the outside temperature is high and the inside temperature is even higher due to the close relationship between these two temperatures and drying chamber conditions. A more accurate estimation of this drying rate reduces the variation in the final moisture content, thus improving the product quality [
21]. To achieve a more efficient dehydration process, it is recommended that the fruit be dehydrated in this time slot, or between 10 and 16 h, the period of the day when the dehydration rate is high. The results also showed that stopping the process before 10 h or continuing the process beyond 16 h is not a prudent or effective decision. This is in accordance with other studies in which the process was conducted from 8 to 16 h and from 9 to 17 h. The shorter time found here for the OM2 and OM3 operation modes significantly reduces labor costs and produces higher-quality products, among other advantages.
The temperature and relative humidity profiles show that the dehydrator’s capacity can be increased by increasing the number of trays, as the air mass never reached saturation conditions, and throughout the evaluation period (9 to 16 h), the DifT remained sufficiently high, meaning that it is possible to increase the mango load by including additional trays. However, it is not recommended that the mango load per tray be increased, as this would reduce the free space in each tray and, thus, the dehydration rate.
Air homogenization plays an important role in the dryer’s efficiency, as it was evident that the rotary central fan (OM2 and OM3) eliminates the temperature and relative humidity gradients that are generated when the system is operated under OM1.
Other important findings relate to the absence of thermal insulation on the dehydrator floor, which generates energy losses through this area. This was reflected in lower temperatures in this zone and in the lower-temperature profile when the rotary central fan operates (OM2 and OM3), as this homogenizes the air conditioning throughout the dryer chamber. However, the geomembrane was also found to be a good insulator, as the temperatures at MC and MG are quite similar and significantly higher than those of GS and SC; thus, this geomembrane can be used as an insulating layer on the ground.
Although the system operated under OM2 had the best results in terms of the drying speed and time, it is necessary to optimize its performance based on the air replenishment frequency, considering different factors, such as the hour of the day, DifT, and DifRH, to maintain the highest driving force.
Finally, it is important to emphasize the importance of continuing to work on these solar processes, which are aligned with clean energy and sustainable food production. The foods produced using this type of process are recognized as natural and green products with longer shelf lives, which confers important added value on mangoes and other food products. However, the analysis should consider other aspects, such as the quality of the fruit and the performance of the dryer, the complexity of its construction, and its sustainability. Under this premise, it is crucial to recognize that every solar dryer possesses unique attributes that require careful consideration when choosing the optimal model to align with the desired goals to reduce food losses and add value.
Although open dryers and direct solar dryers are characterized by lower costs, the product quality is low due to the direct exposure of the product to sun rays and their effect on color and other quality traits. Indirect solar dryers offer better-quality products; however, the complexity of constructing them and their costs depend on their specific characteristics. While mixed dryers, such as those that combine passive energy with photovoltaic energy, offer higher efficiencies in terms of drying rates and good-quality products, these dryers also show some traits that could be disadvantageous, such as high initial investment costs, the need for technical personnel to construct them, and the need for training to operate and maintain them.
Attention should be paid to the sustainability of these photovoltaic dryers because although they use clean energy, a comprehensive life-cycle analysis may indicate that their environmental impacts are not as sustainable as initially perceived due to the photovoltaic module production and disposal of their residues after they reach the end of their useful life [
32,
33]. From this point of view, greenhouse dryers offer important advantages such as low prices, ease of operation and maintenance, acceptable drying rates, good-quality products, and a lower environmental impact.
Based on this premise, it can be postulated that the solar dryer analyzed in the present study, operated in OM1 mode, is the best alternative for mango farmers, with the lowest environmental impact. Solar dryers operated under OM2 and OM3 led to more efficient processes and good-quality products (color, texture, and nutritional content), and an economic and financial analysis showed positive results for farmers. Although the color, texture, and nutritional content analyses were not conducted with the technical rigor required, the results were positive.
This allows us to recommend delving deeper into this topic, which is crucial to proposing solar drying as a feasible alternative to reduce food losses, add value, and contribute to food security. If this drying process can ensure the sensory and nutritional quality of food products, then, combined with its sustainability of the process, solar drying can be proposed as a feasible alternative to increase the shelf life of nutritious products for most of the population, increase the incomes of small-scale farmers, and facilitate transport, storage, and distribution, meaning that they can reach remote communities, thus contributing to reducing food insecurity and reducing chronic illnesses associated with the low consumption of fruits and vegetables.
Finally, dried mangoes expand the dried mango market with a higher value and lower risk. The selling price per kg of dried mango can range between USD 25 and 30, while 1 kg of fresh mangoes costs between USD 2 and 3.


 ,
, 
