

Hierarchical DEMATEL-DTP Method for Identifying Key Factors Affecting Plateau-Characteristic Agroecological Security


Abstract
1. Introduction
2. Analysis of Factors Affecting PCAES
3. Hierarchical DEMATEL-DTP Method
3.1. Hierarchical DEMATEL
3.2. DPSIRM Model
3.3. TERE Model
3.4. POS Model
3.5. Steps in the Hierarchical DEMATEL-DTP Method
4. Analysis Process and Results
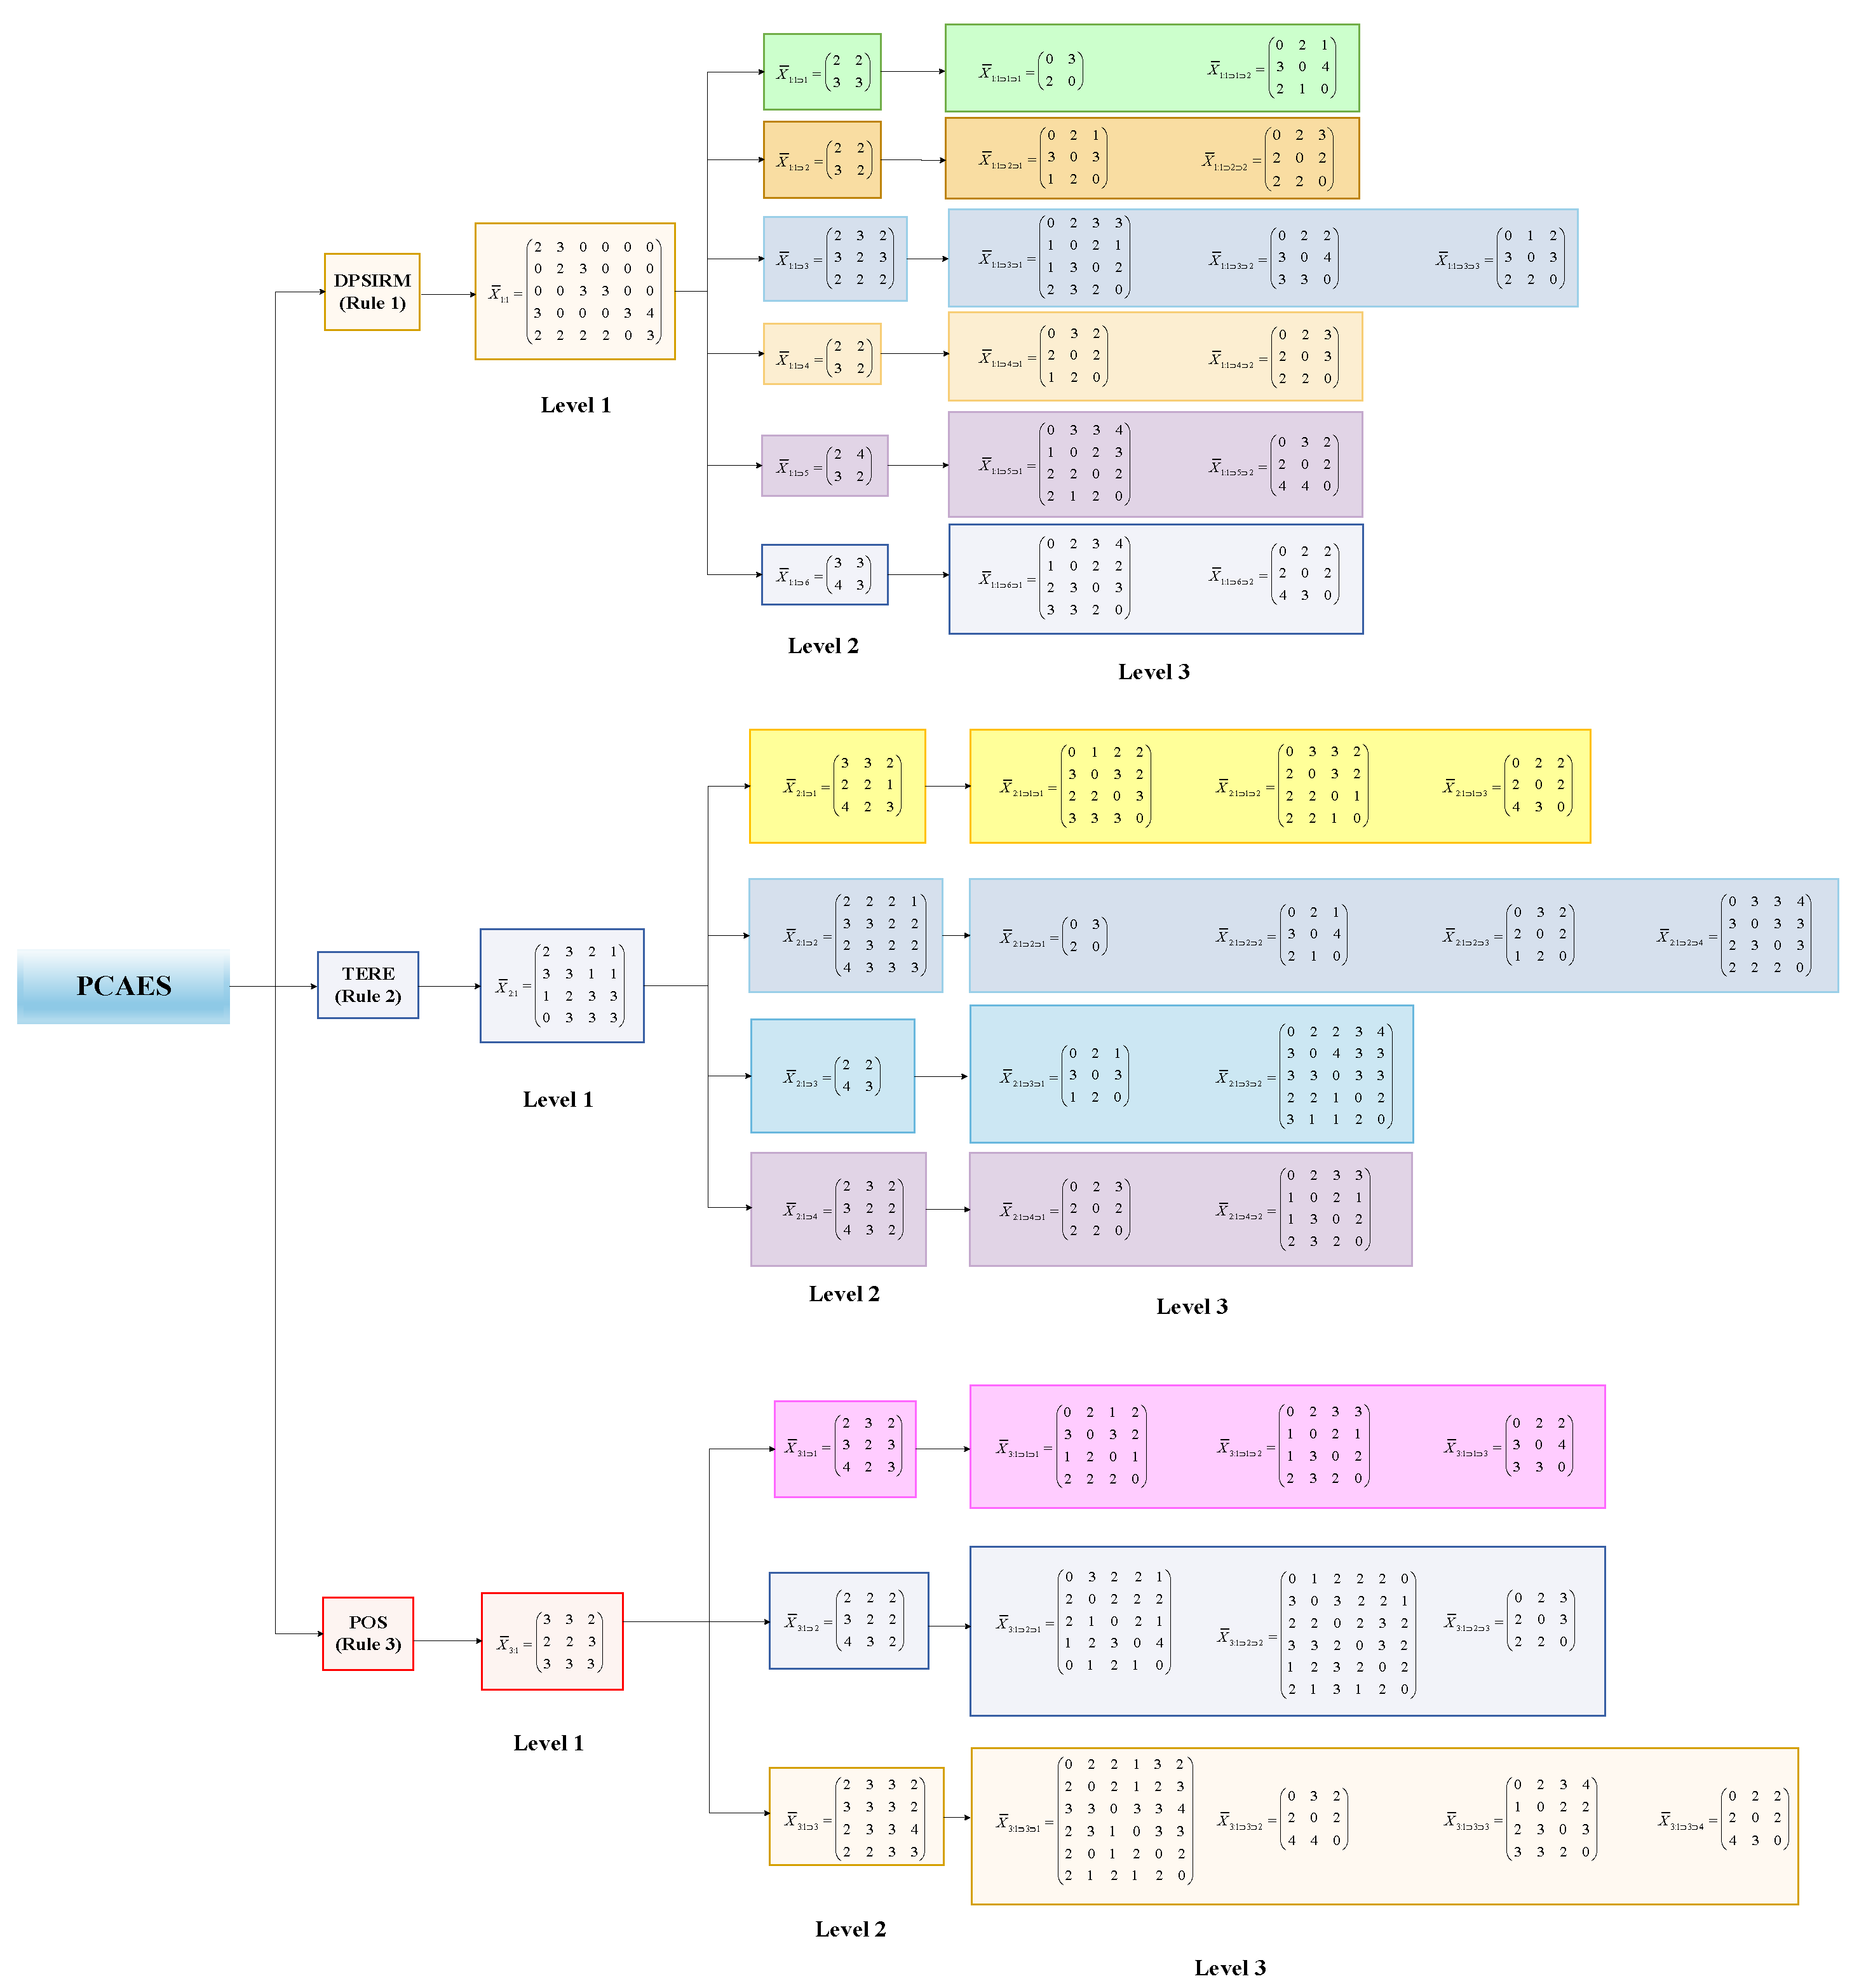
4.1. Hierarchical Decomposition
4.2. Direct Influence Analysis
4.3. Construction of the Super-IDR Matrix
4.4. Identification of Key Factors
5. Discussion and Recommendations
5.1. Interactions Between Key Factors
5.2. Management Suggestions
6. Conclusions
Author Contributions
Funding
Institutional Review Board Statement
Informed Consent Statement
Data Availability Statement
Acknowledgments
Conflicts of Interest
Appendix A
Appendix A.1. The Image Mentioned in Section 4.2
Appendix A.2. The Tables Referred to in Section 4.3

| Factor | f1 | f2 | f3 | f4 | f5 | f6 | f7 | f8 | f9 | f10 | f11 | f12 | f13 | f14 | f15 | f16 | f17 | f18 | f19 | f20 | f21 | f22 | f23 | f24 | f25 | f26 | f27 | f28 | f29 | f30 | f31 | f32 | f33 | f34 | f35 | f36 | f37 | f38 | f39 | f40 | f41 |
|---|---|---|---|---|---|---|---|---|---|---|---|---|---|---|---|---|---|---|---|---|---|---|---|---|---|---|---|---|---|---|---|---|---|---|---|---|---|---|---|---|---|
| f1 | 0.0000 | 0.2400 | 0.0649 | 0.0742 | 0.0609 | 0.1039 | 0.1294 | 0.1039 | 0.1160 | 0.1065 | 0.1151 | 0.0000 | 0.0000 | 0.0000 | 0.0000 | 0.0000 | 0.0000 | 0.0000 | 0.0000 | 0.0000 | 0.0000 | 0.0000 | 0.0000 | 0.0000 | 0.0000 | 0.0000 | 0.0000 | 0.0000 | 0.0000 | 0.0000 | 0.0000 | 0.0000 | 0.0000 | 0.0000 | 0.0000 | 0.0000 | 0.0000 | 0.0000 | 0.0000 | 0.0000 | 0.0000 |
| f2 | 0.1600 | 0.0000 | 0.0649 | 0.0742 | 0.0609 | 0.1051 | 0.1309 | 0.1051 | 0.1173 | 0.1077 | 0.1165 | 0.0000 | 0.0000 | 0.0000 | 0.0000 | 0.0000 | 0.0000 | 0.0000 | 0.0000 | 0.0000 | 0.0000 | 0.0000 | 0.0000 | 0.0000 | 0.0000 | 0.0000 | 0.0000 | 0.0000 | 0.0000 | 0.0000 | 0.0000 | 0.0000 | 0.0000 | 0.0000 | 0.0000 | 0.0000 | 0.0000 | 0.0000 | 0.0000 | 0.0000 | 0.0000 |
| f3 | 0.0973 | 0.0973 | 0.0000 | 0.0923 | 0.0462 | 0.0813 | 0.1012 | 0.0813 | 0.0907 | 0.0833 | 0.0901 | 0.0000 | 0.0000 | 0.0000 | 0.0000 | 0.0000 | 0.0000 | 0.0000 | 0.0000 | 0.0000 | 0.0000 | 0.0000 | 0.0000 | 0.0000 | 0.0000 | 0.0000 | 0.0000 | 0.0000 | 0.0000 | 0.0000 | 0.0000 | 0.0000 | 0.0000 | 0.0000 | 0.0000 | 0.0000 | 0.0000 | 0.0000 | 0.0000 | 0.0000 | 0.0000 |
| f4 | 0.1113 | 0.1113 | 0.1385 | 0.0000 | 0.1846 | 0.0945 | 0.1177 | 0.0945 | 0.1055 | 0.0969 | 0.1047 | 0.0000 | 0.0000 | 0.0000 | 0.0000 | 0.0000 | 0.0000 | 0.0000 | 0.0000 | 0.0000 | 0.0000 | 0.0000 | 0.0000 | 0.0000 | 0.0000 | 0.0000 | 0.0000 | 0.0000 | 0.0000 | 0.0000 | 0.0000 | 0.0000 | 0.0000 | 0.0000 | 0.0000 | 0.0000 | 0.0000 | 0.0000 | 0.0000 | 0.0000 | 0.0000 |
| f5 | 0.0913 | 0.0913 | 0.0923 | 0.0462 | 0.0000 | 0.0771 | 0.0961 | 0.0771 | 0.0861 | 0.0791 | 0.0855 | 0.0000 | 0.0000 | 0.0000 | 0.0000 | 0.0000 | 0.0000 | 0.0000 | 0.0000 | 0.0000 | 0.0000 | 0.0000 | 0.0000 | 0.0000 | 0.0000 | 0.0000 | 0.0000 | 0.0000 | 0.0000 | 0.0000 | 0.0000 | 0.0000 | 0.0000 | 0.0000 | 0.0000 | 0.0000 | 0.0000 | 0.0000 | 0.0000 | 0.0000 | 0.0000 |
| f6 | 0.0000 | 0.0000 | 0.0000 | 0.0000 | 0.0000 | 0.0000 | 0.0741 | 0.0370 | 0.0465 | 0.0429 | 0.0465 | 0.0334 | 0.0328 | 0.0346 | 0.0553 | 0.0491 | 0.0568 | 0.0564 | 0.0448 | 0.0489 | 0.0497 | 0.0000 | 0.0000 | 0.0000 | 0.0000 | 0.0000 | 0.0000 | 0.0000 | 0.0000 | 0.0000 | 0.0000 | 0.0000 | 0.0000 | 0.0000 | 0.0000 | 0.0000 | 0.0000 | 0.0000 | 0.0000 | 0.0000 | 0.0000 |
| f7 | 0.0000 | 0.0000 | 0.0000 | 0.0000 | 0.0000 | 0.1111 | 0.0000 | 0.1111 | 0.0591 | 0.0546 | 0.0591 | 0.0416 | 0.0409 | 0.0431 | 0.0689 | 0.0612 | 0.0707 | 0.0702 | 0.0558 | 0.0610 | 0.0619 | 0.0000 | 0.0000 | 0.0000 | 0.0000 | 0.0000 | 0.0000 | 0.0000 | 0.0000 | 0.0000 | 0.0000 | 0.0000 | 0.0000 | 0.0000 | 0.0000 | 0.0000 | 0.0000 | 0.0000 | 0.0000 | 0.0000 | 0.0000 |
| f8 | 0.0000 | 0.0000 | 0.0000 | 0.0000 | 0.0000 | 0.0370 | 0.0741 | 0.0000 | 0.0465 | 0.0429 | 0.0465 | 0.0334 | 0.0328 | 0.0346 | 0.0553 | 0.0491 | 0.0568 | 0.0564 | 0.0448 | 0.0489 | 0.0497 | 0.0000 | 0.0000 | 0.0000 | 0.0000 | 0.0000 | 0.0000 | 0.0000 | 0.0000 | 0.0000 | 0.0000 | 0.0000 | 0.0000 | 0.0000 | 0.0000 | 0.0000 | 0.0000 | 0.0000 | 0.0000 | 0.0000 | 0.0000 |
| f9 | 0.0000 | 0.0000 | 0.0000 | 0.0000 | 0.0000 | 0.0697 | 0.0887 | 0.0697 | 0.0000 | 0.0684 | 0.1026 | 0.0373 | 0.0367 | 0.0387 | 0.0618 | 0.0548 | 0.0634 | 0.0629 | 0.0501 | 0.0547 | 0.0555 | 0.0000 | 0.0000 | 0.0000 | 0.0000 | 0.0000 | 0.0000 | 0.0000 | 0.0000 | 0.0000 | 0.0000 | 0.0000 | 0.0000 | 0.0000 | 0.0000 | 0.0000 | 0.0000 | 0.0000 | 0.0000 | 0.0000 | 0.0000 |
| f10 | 0.0000 | 0.0000 | 0.0000 | 0.0000 | 0.0000 | 0.0643 | 0.0819 | 0.0643 | 0.0684 | 0.0000 | 0.0684 | 0.0342 | 0.0337 | 0.0355 | 0.0567 | 0.0503 | 0.0582 | 0.0578 | 0.0460 | 0.0502 | 0.0509 | 0.0000 | 0.0000 | 0.0000 | 0.0000 | 0.0000 | 0.0000 | 0.0000 | 0.0000 | 0.0000 | 0.0000 | 0.0000 | 0.0000 | 0.0000 | 0.0000 | 0.0000 | 0.0000 | 0.0000 | 0.0000 | 0.0000 | 0.0000 |
| f11 | 0.0000 | 0.0000 | 0.0000 | 0.0000 | 0.0000 | 0.0697 | 0.0887 | 0.0697 | 0.0684 | 0.0684 | 0.0000 | 0.0370 | 0.0364 | 0.0384 | 0.0613 | 0.0544 | 0.0629 | 0.0625 | 0.0497 | 0.0542 | 0.0550 | 0.0000 | 0.0000 | 0.0000 | 0.0000 | 0.0000 | 0.0000 | 0.0000 | 0.0000 | 0.0000 | 0.0000 | 0.0000 | 0.0000 | 0.0000 | 0.0000 | 0.0000 | 0.0000 | 0.0000 | 0.0000 | 0.0000 | 0.0000 |
| f12 | 0.0000 | 0.0000 | 0.0000 | 0.0000 | 0.0000 | 0.0000 | 0.0000 | 0.0000 | 0.0000 | 0.0000 | 0.0000 | 0.0000 | 0.0229 | 0.0343 | 0.0343 | 0.0137 | 0.0158 | 0.0157 | 0.0218 | 0.0240 | 0.0243 | 0.0361 | 0.0393 | 0.0329 | 0.0354 | 0.0354 | 0.0376 | 0.0000 | 0.0000 | 0.0000 | 0.0000 | 0.0000 | 0.0000 | 0.0000 | 0.0000 | 0.0000 | 0.0000 | 0.0000 | 0.0000 | 0.0000 | 0.0000 |
| f13 | 0.0000 | 0.0000 | 0.0000 | 0.0000 | 0.0000 | 0.0000 | 0.0000 | 0.0000 | 0.0000 | 0.0000 | 0.0000 | 0.0114 | 0.0000 | 0.0229 | 0.0114 | 0.0137 | 0.0158 | 0.0157 | 0.0218 | 0.0240 | 0.0243 | 0.0356 | 0.0387 | 0.0324 | 0.0349 | 0.0349 | 0.0370 | 0.0000 | 0.0000 | 0.0000 | 0.0000 | 0.0000 | 0.0000 | 0.0000 | 0.0000 | 0.0000 | 0.0000 | 0.0000 | 0.0000 | 0.0000 | 0.0000 |
| f14 | 0.0000 | 0.0000 | 0.0000 | 0.0000 | 0.0000 | 0.0000 | 0.0000 | 0.0000 | 0.0000 | 0.0000 | 0.0000 | 0.0114 | 0.0343 | 0.0000 | 0.0229 | 0.0143 | 0.0164 | 0.0163 | 0.0226 | 0.0250 | 0.0252 | 0.0375 | 0.0408 | 0.0341 | 0.0368 | 0.0368 | 0.0390 | 0.0000 | 0.0000 | 0.0000 | 0.0000 | 0.0000 | 0.0000 | 0.0000 | 0.0000 | 0.0000 | 0.0000 | 0.0000 | 0.0000 | 0.0000 | 0.0000 |
| f15 | 0.0000 | 0.0000 | 0.0000 | 0.0000 | 0.0000 | 0.0000 | 0.0000 | 0.0000 | 0.0000 | 0.0000 | 0.0000 | 0.0229 | 0.0343 | 0.0229 | 0.0000 | 0.0886 | 0.1018 | 0.1011 | 0.0226 | 0.0250 | 0.0252 | 0.0599 | 0.0652 | 0.0545 | 0.0587 | 0.0587 | 0.0623 | 0.0000 | 0.0000 | 0.0000 | 0.0000 | 0.0000 | 0.0000 | 0.0000 | 0.0000 | 0.0000 | 0.0000 | 0.0000 | 0.0000 | 0.0000 | 0.0000 |
| f16 | 0.0000 | 0.0000 | 0.0000 | 0.0000 | 0.0000 | 0.0000 | 0.0000 | 0.0000 | 0.0000 | 0.0000 | 0.0000 | 0.0319 | 0.0319 | 0.0332 | 0.0332 | 0.0000 | 0.0336 | 0.0336 | 0.0405 | 0.0447 | 0.0451 | 0.0532 | 0.0579 | 0.0484 | 0.0521 | 0.0521 | 0.0554 | 0.0000 | 0.0000 | 0.0000 | 0.0000 | 0.0000 | 0.0000 | 0.0000 | 0.0000 | 0.0000 | 0.0000 | 0.0000 | 0.0000 | 0.0000 | 0.0000 |
| f17 | 0.0000 | 0.0000 | 0.0000 | 0.0000 | 0.0000 | 0.0000 | 0.0000 | 0.0000 | 0.0000 | 0.0000 | 0.0000 | 0.0367 | 0.0367 | 0.0381 | 0.0381 | 0.0504 | 0.0000 | 0.0672 | 0.0465 | 0.0513 | 0.0518 | 0.0614 | 0.0669 | 0.0559 | 0.0602 | 0.0602 | 0.0640 | 0.0000 | 0.0000 | 0.0000 | 0.0000 | 0.0000 | 0.0000 | 0.0000 | 0.0000 | 0.0000 | 0.0000 | 0.0000 | 0.0000 | 0.0000 | 0.0000 |
| f18 | 0.0000 | 0.0000 | 0.0000 | 0.0000 | 0.0000 | 0.0000 | 0.0000 | 0.0000 | 0.0000 | 0.0000 | 0.0000 | 0.0365 | 0.0365 | 0.0379 | 0.0379 | 0.0504 | 0.0504 | 0.0000 | 0.0462 | 0.0510 | 0.0515 | 0.0610 | 0.0664 | 0.0556 | 0.0598 | 0.0598 | 0.0635 | 0.0000 | 0.0000 | 0.0000 | 0.0000 | 0.0000 | 0.0000 | 0.0000 | 0.0000 | 0.0000 | 0.0000 | 0.0000 | 0.0000 | 0.0000 | 0.0000 |
| f19 | 0.0000 | 0.0000 | 0.0000 | 0.0000 | 0.0000 | 0.0000 | 0.0000 | 0.0000 | 0.0000 | 0.0000 | 0.0000 | 0.0218 | 0.0218 | 0.0226 | 0.0226 | 0.0270 | 0.0310 | 0.0308 | 0.0000 | 0.0220 | 0.0440 | 0.0485 | 0.0528 | 0.0442 | 0.0476 | 0.0476 | 0.0505 | 0.0000 | 0.0000 | 0.0000 | 0.0000 | 0.0000 | 0.0000 | 0.0000 | 0.0000 | 0.0000 | 0.0000 | 0.0000 | 0.0000 | 0.0000 | 0.0000 |
| f20 | 0.0000 | 0.0000 | 0.0000 | 0.0000 | 0.0000 | 0.0000 | 0.0000 | 0.0000 | 0.0000 | 0.0000 | 0.0000 | 0.0240 | 0.0240 | 0.0250 | 0.0250 | 0.0298 | 0.0342 | 0.0340 | 0.0659 | 0.0000 | 0.0659 | 0.0530 | 0.0577 | 0.0482 | 0.0519 | 0.0519 | 0.0552 | 0.0000 | 0.0000 | 0.0000 | 0.0000 | 0.0000 | 0.0000 | 0.0000 | 0.0000 | 0.0000 | 0.0000 | 0.0000 | 0.0000 | 0.0000 | 0.0000 |
| f21 | 0.0000 | 0.0000 | 0.0000 | 0.0000 | 0.0000 | 0.0000 | 0.0000 | 0.0000 | 0.0000 | 0.0000 | 0.0000 | 0.0243 | 0.0243 | 0.0252 | 0.0252 | 0.0301 | 0.0346 | 0.0343 | 0.0440 | 0.0440 | 0.0000 | 0.0538 | 0.0585 | 0.0489 | 0.0527 | 0.0527 | 0.0560 | 0.0000 | 0.0000 | 0.0000 | 0.0000 | 0.0000 | 0.0000 | 0.0000 | 0.0000 | 0.0000 | 0.0000 | 0.0000 | 0.0000 | 0.0000 | 0.0000 |
| f22 | 0.0000 | 0.0000 | 0.0000 | 0.0000 | 0.0000 | 0.0000 | 0.0000 | 0.0000 | 0.0000 | 0.0000 | 0.0000 | 0.0000 | 0.0000 | 0.0000 | 0.0000 | 0.0000 | 0.0000 | 0.0000 | 0.0000 | 0.0000 | 0.0000 | 0.0000 | 0.1667 | 0.1111 | 0.0730 | 0.0730 | 0.0782 | 0.0706 | 0.0570 | 0.0627 | 0.0662 | 0.0791 | 0.0802 | 0.0841 | 0.0000 | 0.0000 | 0.0000 | 0.0000 | 0.0000 | 0.0000 | 0.0000 |
| f23 | 0.0000 | 0.0000 | 0.0000 | 0.0000 | 0.0000 | 0.0000 | 0.0000 | 0.0000 | 0.0000 | 0.0000 | 0.0000 | 0.0000 | 0.0000 | 0.0000 | 0.0000 | 0.0000 | 0.0000 | 0.0000 | 0.0000 | 0.0000 | 0.0000 | 0.1111 | 0.0000 | 0.1111 | 0.0786 | 0.0786 | 0.0843 | 0.0768 | 0.0620 | 0.0683 | 0.0720 | 0.0861 | 0.0873 | 0.0915 | 0.0000 | 0.0000 | 0.0000 | 0.0000 | 0.0000 | 0.0000 | 0.0000 |
| f24 | 0.0000 | 0.0000 | 0.0000 | 0.0000 | 0.0000 | 0.0000 | 0.0000 | 0.0000 | 0.0000 | 0.0000 | 0.0000 | 0.0000 | 0.0000 | 0.0000 | 0.0000 | 0.0000 | 0.0000 | 0.0000 | 0.0000 | 0.0000 | 0.0000 | 0.0556 | 0.1111 | 0.0000 | 0.0654 | 0.0654 | 0.0702 | 0.0643 | 0.0519 | 0.0571 | 0.0603 | 0.0721 | 0.0731 | 0.0766 | 0.0000 | 0.0000 | 0.0000 | 0.0000 | 0.0000 | 0.0000 | 0.0000 |
| f25 | 0.0000 | 0.0000 | 0.0000 | 0.0000 | 0.0000 | 0.0000 | 0.0000 | 0.0000 | 0.0000 | 0.0000 | 0.0000 | 0.0000 | 0.0000 | 0.0000 | 0.0000 | 0.0000 | 0.0000 | 0.0000 | 0.0000 | 0.0000 | 0.0000 | 0.1094 | 0.1179 | 0.0981 | 0.0000 | 0.0952 | 0.1429 | 0.0692 | 0.0559 | 0.0615 | 0.0649 | 0.0776 | 0.0787 | 0.0824 | 0.0000 | 0.0000 | 0.0000 | 0.0000 | 0.0000 | 0.0000 | 0.0000 |
| f26 | 0.0000 | 0.0000 | 0.0000 | 0.0000 | 0.0000 | 0.0000 | 0.0000 | 0.0000 | 0.0000 | 0.0000 | 0.0000 | 0.0000 | 0.0000 | 0.0000 | 0.0000 | 0.0000 | 0.0000 | 0.0000 | 0.0000 | 0.0000 | 0.0000 | 0.1094 | 0.1179 | 0.0981 | 0.0952 | 0.0000 | 0.1429 | 0.0692 | 0.0559 | 0.0615 | 0.0649 | 0.0776 | 0.0787 | 0.0824 | 0.0000 | 0.0000 | 0.0000 | 0.0000 | 0.0000 | 0.0000 | 0.0000 |
| f27 | 0.0000 | 0.0000 | 0.0000 | 0.0000 | 0.0000 | 0.0000 | 0.0000 | 0.0000 | 0.0000 | 0.0000 | 0.0000 | 0.0000 | 0.0000 | 0.0000 | 0.0000 | 0.0000 | 0.0000 | 0.0000 | 0.0000 | 0.0000 | 0.0000 | 0.1174 | 0.1264 | 0.1053 | 0.0952 | 0.0952 | 0.0000 | 0.0735 | 0.0593 | 0.0653 | 0.0689 | 0.0824 | 0.0835 | 0.0875 | 0.0000 | 0.0000 | 0.0000 | 0.0000 | 0.0000 | 0.0000 | 0.0000 |
| f28 | 0.0953 | 0.0964 | 0.0745 | 0.0867 | 0.0707 | 0.0000 | 0.0000 | 0.0000 | 0.0000 | 0.0000 | 0.0000 | 0.0000 | 0.0000 | 0.0000 | 0.0000 | 0.0000 | 0.0000 | 0.0000 | 0.0000 | 0.0000 | 0.0000 | 0.0000 | 0.0000 | 0.0000 | 0.0000 | 0.0000 | 0.0000 | 0.0000 | 0.0606 | 0.0606 | 0.0808 | 0.0968 | 0.0981 | 0.1043 | 0.0721 | 0.0637 | 0.0706 | 0.0785 | 0.0930 | 0.0863 | 0.1006 |
| f29 | 0.0769 | 0.0778 | 0.0602 | 0.0700 | 0.0571 | 0.0000 | 0.0000 | 0.0000 | 0.0000 | 0.0000 | 0.0000 | 0.0000 | 0.0000 | 0.0000 | 0.0000 | 0.0000 | 0.0000 | 0.0000 | 0.0000 | 0.0000 | 0.0000 | 0.0000 | 0.0000 | 0.0000 | 0.0000 | 0.0000 | 0.0000 | 0.0202 | 0.0000 | 0.0404 | 0.0606 | 0.0780 | 0.0790 | 0.0840 | 0.0582 | 0.0514 | 0.0570 | 0.0634 | 0.0751 | 0.0697 | 0.0812 |
| f30 | 0.0847 | 0.0857 | 0.0662 | 0.0770 | 0.0629 | 0.0000 | 0.0000 | 0.0000 | 0.0000 | 0.0000 | 0.0000 | 0.0000 | 0.0000 | 0.0000 | 0.0000 | 0.0000 | 0.0000 | 0.0000 | 0.0000 | 0.0000 | 0.0000 | 0.0000 | 0.0000 | 0.0000 | 0.0000 | 0.0000 | 0.0000 | 0.0404 | 0.0404 | 0.0000 | 0.0404 | 0.0867 | 0.0878 | 0.0933 | 0.0641 | 0.0566 | 0.0627 | 0.0698 | 0.0827 | 0.0767 | 0.0894 |
| f31 | 0.0893 | 0.0904 | 0.0699 | 0.0813 | 0.0663 | 0.0000 | 0.0000 | 0.0000 | 0.0000 | 0.0000 | 0.0000 | 0.0000 | 0.0000 | 0.0000 | 0.0000 | 0.0000 | 0.0000 | 0.0000 | 0.0000 | 0.0000 | 0.0000 | 0.0000 | 0.0000 | 0.0000 | 0.0000 | 0.0000 | 0.0000 | 0.0404 | 0.0202 | 0.0404 | 0.0000 | 0.0916 | 0.0928 | 0.0986 | 0.0676 | 0.0597 | 0.0662 | 0.0736 | 0.0872 | 0.0810 | 0.0943 |
| f32 | 0.1068 | 0.1080 | 0.0835 | 0.0971 | 0.0793 | 0.0000 | 0.0000 | 0.0000 | 0.0000 | 0.0000 | 0.0000 | 0.0000 | 0.0000 | 0.0000 | 0.0000 | 0.0000 | 0.0000 | 0.0000 | 0.0000 | 0.0000 | 0.0000 | 0.0000 | 0.0000 | 0.0000 | 0.0000 | 0.0000 | 0.0000 | 0.0726 | 0.0585 | 0.0650 | 0.0687 | 0.0000 | 0.0963 | 0.0642 | 0.0808 | 0.0714 | 0.0791 | 0.0880 | 0.1043 | 0.0968 | 0.1128 |
| f33 | 0.1083 | 0.1095 | 0.0847 | 0.0985 | 0.0804 | 0.0000 | 0.0000 | 0.0000 | 0.0000 | 0.0000 | 0.0000 | 0.0000 | 0.0000 | 0.0000 | 0.0000 | 0.0000 | 0.0000 | 0.0000 | 0.0000 | 0.0000 | 0.0000 | 0.0000 | 0.0000 | 0.0000 | 0.0000 | 0.0000 | 0.0000 | 0.0736 | 0.0592 | 0.0658 | 0.0696 | 0.0642 | 0.0000 | 0.0642 | 0.0819 | 0.0723 | 0.0802 | 0.0892 | 0.1057 | 0.0981 | 0.1143 |
| f34 | 0.1135 | 0.1148 | 0.0888 | 0.1032 | 0.0843 | 0.0000 | 0.0000 | 0.0000 | 0.0000 | 0.0000 | 0.0000 | 0.0000 | 0.0000 | 0.0000 | 0.0000 | 0.0000 | 0.0000 | 0.0000 | 0.0000 | 0.0000 | 0.0000 | 0.0000 | 0.0000 | 0.0000 | 0.0000 | 0.0000 | 0.0000 | 0.0782 | 0.0630 | 0.0700 | 0.0740 | 0.1283 | 0.1283 | 0.0000 | 0.0858 | 0.0758 | 0.0841 | 0.0935 | 0.1108 | 0.1028 | 0.1198 |
| f35 | 0.0574 | 0.0581 | 0.0449 | 0.0522 | 0.0426 | 0.0393 | 0.0489 | 0.0393 | 0.0439 | 0.0403 | 0.0435 | 0.0184 | 0.0182 | 0.0191 | 0.0306 | 0.0271 | 0.0314 | 0.0312 | 0.0248 | 0.0270 | 0.0274 | 0.0425 | 0.0463 | 0.0387 | 0.0417 | 0.0417 | 0.0443 | 0.0000 | 0.0000 | 0.0000 | 0.0000 | 0.0000 | 0.0000 | 0.0000 | 0.0000 | 0.0462 | 0.0692 | 0.0923 | 0.0587 | 0.0546 | 0.0629 |
| f36 | 0.0507 | 0.0513 | 0.0397 | 0.0461 | 0.0376 | 0.0347 | 0.0432 | 0.0347 | 0.0387 | 0.0356 | 0.0385 | 0.0163 | 0.0160 | 0.0169 | 0.0270 | 0.0240 | 0.0277 | 0.0275 | 0.0219 | 0.0239 | 0.0242 | 0.0376 | 0.0409 | 0.0342 | 0.0368 | 0.0368 | 0.0391 | 0.0000 | 0.0000 | 0.0000 | 0.0000 | 0.0000 | 0.0000 | 0.0000 | 0.0231 | 0.0000 | 0.0462 | 0.0462 | 0.0515 | 0.0478 | 0.0552 |
| f37 | 0.0562 | 0.0569 | 0.0440 | 0.0511 | 0.0417 | 0.0385 | 0.0479 | 0.0385 | 0.0430 | 0.0395 | 0.0427 | 0.0181 | 0.0178 | 0.0187 | 0.0299 | 0.0266 | 0.0307 | 0.0305 | 0.0243 | 0.0265 | 0.0269 | 0.0417 | 0.0453 | 0.0379 | 0.0408 | 0.0408 | 0.0434 | 0.0000 | 0.0000 | 0.0000 | 0.0000 | 0.0000 | 0.0000 | 0.0000 | 0.0462 | 0.0692 | 0.0000 | 0.0692 | 0.0572 | 0.0531 | 0.0613 |
| f38 | 0.0625 | 0.0633 | 0.0489 | 0.0569 | 0.0464 | 0.0428 | 0.0533 | 0.0428 | 0.0478 | 0.0439 | 0.0474 | 0.0201 | 0.0198 | 0.0208 | 0.0333 | 0.0296 | 0.0342 | 0.0339 | 0.0270 | 0.0295 | 0.0299 | 0.0463 | 0.0504 | 0.0422 | 0.0454 | 0.0454 | 0.0482 | 0.0000 | 0.0000 | 0.0000 | 0.0000 | 0.0000 | 0.0000 | 0.0000 | 0.0692 | 0.0692 | 0.0462 | 0.0000 | 0.0633 | 0.0588 | 0.0678 |
| f39 | 0.0741 | 0.0750 | 0.0580 | 0.0674 | 0.0550 | 0.0507 | 0.0632 | 0.0507 | 0.0566 | 0.0520 | 0.0562 | 0.0238 | 0.0234 | 0.0247 | 0.0395 | 0.0350 | 0.0405 | 0.0402 | 0.0320 | 0.0349 | 0.0354 | 0.0549 | 0.0597 | 0.0500 | 0.0538 | 0.0538 | 0.0572 | 0.0000 | 0.0000 | 0.0000 | 0.0000 | 0.0000 | 0.0000 | 0.0000 | 0.0783 | 0.0687 | 0.0762 | 0.0844 | 0.0000 | 0.0923 | 0.0923 |
| f40 | 0.0688 | 0.0696 | 0.0538 | 0.0625 | 0.0511 | 0.0471 | 0.0586 | 0.0471 | 0.0526 | 0.0482 | 0.0522 | 0.0221 | 0.0217 | 0.0229 | 0.0366 | 0.0325 | 0.0376 | 0.0373 | 0.0297 | 0.0324 | 0.0329 | 0.0509 | 0.0554 | 0.0464 | 0.0500 | 0.0500 | 0.0530 | 0.0000 | 0.0000 | 0.0000 | 0.0000 | 0.0000 | 0.0000 | 0.0000 | 0.0727 | 0.0638 | 0.0708 | 0.0784 | 0.0923 | 0.0000 | 0.0923 |
| f41 | 0.0801 | 0.0811 | 0.0627 | 0.0729 | 0.0595 | 0.0548 | 0.0683 | 0.0548 | 0.0612 | 0.0562 | 0.0608 | 0.0257 | 0.0253 | 0.0267 | 0.0427 | 0.0379 | 0.0438 | 0.0435 | 0.0346 | 0.0378 | 0.0383 | 0.0594 | 0.0646 | 0.0541 | 0.0582 | 0.0582 | 0.0618 | 0.0000 | 0.0000 | 0.0000 | 0.0000 | 0.0000 | 0.0000 | 0.0000 | 0.0839 | 0.0736 | 0.0817 | 0.0905 | 0.1846 | 0.1385 | 0.0000 |
| Factor | f19 | f20 | f21 | f35 | f29 | f32 | f33 | f30 | f39 | f40 | f41 | f1 | f2 | f3 | f4 | f5 | f22 | f23 | f24 | f28 | f34 | f37 | f38 | f6 | f7 | f8 | f16 | f17 | f18 | f31 | f36 | f9 | f10 | f11 | f12 | f13 | f14 | f15 | f25 | f26 | f41 |
|---|---|---|---|---|---|---|---|---|---|---|---|---|---|---|---|---|---|---|---|---|---|---|---|---|---|---|---|---|---|---|---|---|---|---|---|---|---|---|---|---|---|
| f19 | 0.0000 | 0.0094 | 0.0188 | 0.0188 | 0.0169 | 0.0169 | 0.0153 | 0.0131 | 0.0138 | 0.0128 | 0.0148 | 0.0299 | 0.0304 | 0.0231 | 0.0262 | 0.0220 | 0.0206 | 0.0222 | 0.0185 | 0.0179 | 0.0179 | 0.0170 | 0.0168 | 0.0249 | 0.0308 | 0.0249 | 0.0203 | 0.0200 | 0.0190 | 0.0171 | 0.0178 | 0.0102 | 0.0094 | 0.0103 | 0.0071 | 0.0071 | 0.0074 | 0.0074 | 0.0093 | 0.0093 | 0.0099 |
| f20 | 0.0282 | 0.0000 | 0.0282 | 0.0188 | 0.0179 | 0.0178 | 0.0162 | 0.0138 | 0.0146 | 0.0135 | 0.0156 | 0.0315 | 0.0321 | 0.0243 | 0.0276 | 0.0232 | 0.0217 | 0.0234 | 0.0195 | 0.0189 | 0.0189 | 0.0179 | 0.0177 | 0.0263 | 0.0325 | 0.0263 | 0.0214 | 0.0211 | 0.0200 | 0.0180 | 0.0188 | 0.0108 | 0.0099 | 0.0108 | 0.0075 | 0.0075 | 0.0078 | 0.0078 | 0.0098 | 0.0098 | 0.0104 |
| f21 | 0.0188 | 0.0188 | 0.0000 | 0.0282 | 0.0193 | 0.0192 | 0.0174 | 0.0149 | 0.0157 | 0.0146 | 0.0168 | 0.0339 | 0.0345 | 0.0262 | 0.0297 | 0.0249 | 0.0233 | 0.0251 | 0.0209 | 0.0203 | 0.0203 | 0.0193 | 0.0190 | 0.0283 | 0.0349 | 0.0283 | 0.0231 | 0.0227 | 0.0215 | 0.0194 | 0.0202 | 0.0116 | 0.0107 | 0.0116 | 0.0080 | 0.0081 | 0.0084 | 0.0084 | 0.0106 | 0.0106 | 0.0112 |
| f35 | 0.0282 | 0.0282 | 0.0282 | 0.0000 | 0.0202 | 0.0201 | 0.0183 | 0.0156 | 0.0165 | 0.0153 | 0.0177 | 0.0355 | 0.0361 | 0.0274 | 0.0311 | 0.0261 | 0.0244 | 0.0263 | 0.0219 | 0.0213 | 0.0213 | 0.0202 | 0.0199 | 0.0296 | 0.0366 | 0.0296 | 0.0242 | 0.0238 | 0.0226 | 0.0203 | 0.0212 | 0.0121 | 0.0112 | 0.0122 | 0.0084 | 0.0085 | 0.0088 | 0.0088 | 0.0111 | 0.0111 | 0.0117 |
| f29 | 0.0113 | 0.0119 | 0.0129 | 0.0135 | 0.0000 | 0.0218 | 0.0218 | 0.0145 | 0.0083 | 0.0077 | 0.0089 | 0.0250 | 0.0254 | 0.0193 | 0.0219 | 0.0184 | 0.0172 | 0.0185 | 0.0154 | 0.0150 | 0.0150 | 0.0142 | 0.0140 | 0.0208 | 0.0258 | 0.0208 | 0.0170 | 0.0167 | 0.0159 | 0.0143 | 0.0149 | 0.0085 | 0.0079 | 0.0086 | 0.0059 | 0.0060 | 0.0062 | 0.0062 | 0.0078 | 0.0078 | 0.0083 |
| f32 | 0.0112 | 0.0119 | 0.0128 | 0.0134 | 0.0145 | 0.0000 | 0.0218 | 0.0145 | 0.0082 | 0.0076 | 0.0088 | 0.0250 | 0.0254 | 0.0193 | 0.0219 | 0.0184 | 0.0172 | 0.0185 | 0.0154 | 0.0150 | 0.0150 | 0.0142 | 0.0140 | 0.0208 | 0.0258 | 0.0208 | 0.0170 | 0.0167 | 0.0159 | 0.0143 | 0.0149 | 0.0085 | 0.0079 | 0.0086 | 0.0059 | 0.0060 | 0.0062 | 0.0062 | 0.0078 | 0.0078 | 0.0083 |
| f33 | 0.0102 | 0.0108 | 0.0116 | 0.0122 | 0.0145 | 0.0145 | 0.0000 | 0.0073 | 0.0075 | 0.0069 | 0.0080 | 0.0227 | 0.0231 | 0.0175 | 0.0199 | 0.0167 | 0.0156 | 0.0168 | 0.0140 | 0.0136 | 0.0136 | 0.0129 | 0.0127 | 0.0189 | 0.0234 | 0.0189 | 0.0154 | 0.0152 | 0.0144 | 0.0130 | 0.0135 | 0.0077 | 0.0071 | 0.0078 | 0.0054 | 0.0054 | 0.0056 | 0.0056 | 0.0071 | 0.0071 | 0.0075 |
| f30 | 0.0087 | 0.0092 | 0.0099 | 0.0104 | 0.0145 | 0.0145 | 0.0073 | 0.0000 | 0.0064 | 0.0059 | 0.0068 | 0.0192 | 0.0195 | 0.0148 | 0.0168 | 0.0141 | 0.0132 | 0.0142 | 0.0118 | 0.0115 | 0.0115 | 0.0109 | 0.0108 | 0.0160 | 0.0198 | 0.0160 | 0.0130 | 0.0128 | 0.0122 | 0.0110 | 0.0114 | 0.0065 | 0.0060 | 0.0066 | 0.0045 | 0.0046 | 0.0048 | 0.0048 | 0.0060 | 0.0060 | 0.0063 |
| f39 | 0.0276 | 0.0292 | 0.0314 | 0.0330 | 0.0165 | 0.0164 | 0.0149 | 0.0127 | 0.0000 | 0.0364 | 0.0364 | 0.0393 | 0.0400 | 0.0304 | 0.0345 | 0.0289 | 0.0271 | 0.0292 | 0.0243 | 0.0236 | 0.0236 | 0.0223 | 0.0221 | 0.0328 | 0.0405 | 0.0328 | 0.0267 | 0.0263 | 0.0250 | 0.0225 | 0.0235 | 0.0134 | 0.0124 | 0.0135 | 0.0093 | 0.0094 | 0.0098 | 0.0097 | 0.0123 | 0.0123 | 0.0130 |
| f40 | 0.0257 | 0.0271 | 0.0292 | 0.0306 | 0.0153 | 0.0153 | 0.0139 | 0.0118 | 0.0364 | 0.0000 | 0.0364 | 0.0366 | 0.0372 | 0.0283 | 0.0321 | 0.0269 | 0.0252 | 0.0271 | 0.0226 | 0.0219 | 0.0219 | 0.0208 | 0.0205 | 0.0305 | 0.0377 | 0.0305 | 0.0249 | 0.0245 | 0.0232 | 0.0209 | 0.0218 | 0.0125 | 0.0115 | 0.0126 | 0.0087 | 0.0087 | 0.0091 | 0.0091 | 0.0114 | 0.0114 | 0.0121 |
| f41 | 0.0296 | 0.0313 | 0.0337 | 0.0353 | 0.0177 | 0.0176 | 0.0160 | 0.0136 | 0.0727 | 0.0545 | 0.0000 | 0.0432 | 0.0440 | 0.0334 | 0.0379 | 0.0318 | 0.0297 | 0.0320 | 0.0267 | 0.0259 | 0.0259 | 0.0245 | 0.0243 | 0.0360 | 0.0445 | 0.0360 | 0.0294 | 0.0289 | 0.0275 | 0.0247 | 0.0258 | 0.0148 | 0.0136 | 0.0148 | 0.0102 | 0.0103 | 0.0107 | 0.0107 | 0.0135 | 0.0135 | 0.0143 |
| f1 | 0.0299 | 0.0315 | 0.0339 | 0.0355 | 0.0250 | 0.0250 | 0.0227 | 0.0192 | 0.0393 | 0.0366 | 0.0432 | 0.0000 | 0.0923 | 0.0250 | 0.0285 | 0.0234 | 0.0259 | 0.0279 | 0.0232 | 0.0098 | 0.0099 | 0.0094 | 0.0094 | 0.0162 | 0.0201 | 0.0162 | 0.0132 | 0.0130 | 0.0124 | 0.0111 | 0.0116 | 0.0133 | 0.0123 | 0.0134 | 0.0092 | 0.0093 | 0.0097 | 0.0097 | 0.0121 | 0.0121 | 0.0129 |
| f2 | 0.0304 | 0.0321 | 0.0345 | 0.0361 | 0.0254 | 0.0254 | 0.0231 | 0.0195 | 0.0400 | 0.0372 | 0.0440 | 0.0615 | 0.0000 | 0.0250 | 0.0285 | 0.0234 | 0.0259 | 0.0279 | 0.0232 | 0.0098 | 0.0099 | 0.0094 | 0.0094 | 0.0165 | 0.0204 | 0.0165 | 0.0135 | 0.0133 | 0.0126 | 0.0113 | 0.0118 | 0.0135 | 0.0125 | 0.0136 | 0.0094 | 0.0094 | 0.0098 | 0.0098 | 0.0123 | 0.0123 | 0.0131 |
| f3 | 0.0231 | 0.0243 | 0.0262 | 0.0274 | 0.0193 | 0.0193 | 0.0175 | 0.0148 | 0.0304 | 0.0283 | 0.0334 | 0.0374 | 0.0374 | 0.0000 | 0.0355 | 0.0178 | 0.0168 | 0.0181 | 0.0151 | 0.0127 | 0.0128 | 0.0122 | 0.0122 | 0.0125 | 0.0155 | 0.0125 | 0.0102 | 0.0101 | 0.0096 | 0.0086 | 0.0090 | 0.0103 | 0.0095 | 0.0103 | 0.0071 | 0.0072 | 0.0075 | 0.0075 | 0.0094 | 0.0094 | 0.0100 |
| f4 | 0.0262 | 0.0276 | 0.0297 | 0.0311 | 0.0219 | 0.0219 | 0.0199 | 0.0168 | 0.0345 | 0.0321 | 0.0379 | 0.0428 | 0.0428 | 0.0533 | 0.0000 | 0.0710 | 0.0192 | 0.0207 | 0.0172 | 0.0146 | 0.0147 | 0.0139 | 0.0139 | 0.0142 | 0.0176 | 0.0142 | 0.0116 | 0.0114 | 0.0108 | 0.0098 | 0.0102 | 0.0117 | 0.0108 | 0.0117 | 0.0081 | 0.0081 | 0.0085 | 0.0085 | 0.0106 | 0.0106 | 0.0113 |
| f5 | 0.0220 | 0.0232 | 0.0249 | 0.0261 | 0.0184 | 0.0184 | 0.0167 | 0.0141 | 0.0289 | 0.0269 | 0.0318 | 0.0351 | 0.0351 | 0.0355 | 0.0178 | 0.0000 | 0.0157 | 0.0170 | 0.0141 | 0.0120 | 0.0120 | 0.0114 | 0.0114 | 0.0119 | 0.0147 | 0.0119 | 0.0097 | 0.0096 | 0.0091 | 0.0082 | 0.0085 | 0.0098 | 0.0090 | 0.0098 | 0.0068 | 0.0068 | 0.0071 | 0.0071 | 0.0089 | 0.0089 | 0.0095 |
| f22 | 0.0206 | 0.0217 | 0.0233 | 0.0244 | 0.0172 | 0.0172 | 0.0156 | 0.0132 | 0.0271 | 0.0252 | 0.0297 | 0.0259 | 0.0259 | 0.0252 | 0.0288 | 0.0236 | 0.0000 | 0.0385 | 0.0256 | 0.0132 | 0.0133 | 0.0126 | 0.0126 | 0.0112 | 0.0138 | 0.0112 | 0.0091 | 0.0090 | 0.0085 | 0.0077 | 0.0080 | 0.0091 | 0.0085 | 0.0092 | 0.0063 | 0.0064 | 0.0067 | 0.0066 | 0.0083 | 0.0083 | 0.0089 |
| f23 | 0.0222 | 0.0234 | 0.0251 | 0.0263 | 0.0185 | 0.0185 | 0.0168 | 0.0142 | 0.0292 | 0.0271 | 0.0320 | 0.0279 | 0.0279 | 0.0271 | 0.0310 | 0.0255 | 0.0256 | 0.0000 | 0.0256 | 0.0142 | 0.0143 | 0.0136 | 0.0136 | 0.0120 | 0.0149 | 0.0120 | 0.0098 | 0.0097 | 0.0092 | 0.0083 | 0.0086 | 0.0099 | 0.0091 | 0.0099 | 0.0068 | 0.0069 | 0.0072 | 0.0072 | 0.0090 | 0.0090 | 0.0095 |
| f24 | 0.0185 | 0.0195 | 0.0209 | 0.0219 | 0.0154 | 0.0154 | 0.0140 | 0.0118 | 0.0243 | 0.0226 | 0.0267 | 0.0232 | 0.0232 | 0.0226 | 0.0258 | 0.0212 | 0.0128 | 0.0256 | 0.0000 | 0.0118 | 0.0119 | 0.0113 | 0.0113 | 0.0100 | 0.0124 | 0.0100 | 0.0082 | 0.0080 | 0.0076 | 0.0069 | 0.0072 | 0.0082 | 0.0076 | 0.0083 | 0.0057 | 0.0057 | 0.0060 | 0.0060 | 0.0075 | 0.0075 | 0.0080 |
| f28 | 0.0179 | 0.0189 | 0.0203 | 0.0213 | 0.0150 | 0.0150 | 0.0136 | 0.0115 | 0.0236 | 0.0219 | 0.0259 | 0.0393 | 0.0393 | 0.0191 | 0.0219 | 0.0179 | 0.0198 | 0.0213 | 0.0178 | 0.0000 | 0.0210 | 0.0210 | 0.0280 | 0.0097 | 0.0120 | 0.0097 | 0.0079 | 0.0078 | 0.0074 | 0.0067 | 0.0070 | 0.0080 | 0.0074 | 0.0080 | 0.0055 | 0.0056 | 0.0058 | 0.0058 | 0.0073 | 0.0073 | 0.0077 |
| f34 | 0.0179 | 0.0189 | 0.0203 | 0.0213 | 0.0150 | 0.0150 | 0.0136 | 0.0115 | 0.0236 | 0.0219 | 0.0259 | 0.0396 | 0.0396 | 0.0193 | 0.0220 | 0.0181 | 0.0200 | 0.0215 | 0.0179 | 0.0210 | 0.0000 | 0.0210 | 0.0210 | 0.0097 | 0.0120 | 0.0097 | 0.0079 | 0.0078 | 0.0074 | 0.0067 | 0.0070 | 0.0080 | 0.0074 | 0.0080 | 0.0055 | 0.0056 | 0.0058 | 0.0058 | 0.0073 | 0.0073 | 0.0077 |
| f37 | 0.0170 | 0.0179 | 0.0193 | 0.0202 | 0.0142 | 0.0142 | 0.0129 | 0.0109 | 0.0223 | 0.0208 | 0.0245 | 0.0375 | 0.0375 | 0.0183 | 0.0209 | 0.0171 | 0.0189 | 0.0204 | 0.0170 | 0.0140 | 0.0210 | 0.0000 | 0.0210 | 0.0092 | 0.0114 | 0.0092 | 0.0075 | 0.0074 | 0.0070 | 0.0063 | 0.0066 | 0.0076 | 0.0070 | 0.0076 | 0.0052 | 0.0053 | 0.0055 | 0.0055 | 0.0069 | 0.0069 | 0.0073 |
| f38 | 0.0168 | 0.0177 | 0.0190 | 0.0199 | 0.0140 | 0.0140 | 0.0127 | 0.0108 | 0.0221 | 0.0205 | 0.0243 | 0.0375 | 0.0375 | 0.0182 | 0.0209 | 0.0171 | 0.0189 | 0.0204 | 0.0170 | 0.0140 | 0.0140 | 0.0140 | 0.0000 | 0.0091 | 0.0113 | 0.0091 | 0.0074 | 0.0073 | 0.0069 | 0.0063 | 0.0065 | 0.0075 | 0.0069 | 0.0075 | 0.0052 | 0.0052 | 0.0054 | 0.0054 | 0.0068 | 0.0068 | 0.0072 |
| f6 | 0.0125 | 0.0131 | 0.0141 | 0.0148 | 0.0104 | 0.0104 | 0.0094 | 0.0080 | 0.0164 | 0.0152 | 0.0180 | 0.0325 | 0.0330 | 0.0251 | 0.0285 | 0.0238 | 0.0223 | 0.0241 | 0.0200 | 0.0195 | 0.0195 | 0.0184 | 0.0182 | 0.0000 | 0.0976 | 0.0488 | 0.0354 | 0.0345 | 0.0326 | 0.0301 | 0.0314 | 0.0499 | 0.0461 | 0.0501 | 0.0346 | 0.0348 | 0.0363 | 0.0362 | 0.0455 | 0.0455 | 0.0483 |
| f7 | 0.0154 | 0.0162 | 0.0175 | 0.0183 | 0.0129 | 0.0129 | 0.0117 | 0.0099 | 0.0203 | 0.0188 | 0.0223 | 0.0401 | 0.0408 | 0.0310 | 0.0352 | 0.0295 | 0.0276 | 0.0298 | 0.0248 | 0.0241 | 0.0241 | 0.0228 | 0.0225 | 0.1463 | 0.0000 | 0.1463 | 0.0450 | 0.0439 | 0.0415 | 0.0383 | 0.0400 | 0.0617 | 0.0570 | 0.0620 | 0.0427 | 0.0431 | 0.0448 | 0.0448 | 0.0563 | 0.0563 | 0.0597 |
| f8 | 0.0125 | 0.0131 | 0.0141 | 0.0148 | 0.0104 | 0.0104 | 0.0094 | 0.0080 | 0.0164 | 0.0152 | 0.0180 | 0.0325 | 0.0330 | 0.0251 | 0.0285 | 0.0238 | 0.0223 | 0.0241 | 0.0200 | 0.0195 | 0.0195 | 0.0184 | 0.0182 | 0.0488 | 0.0976 | 0.0000 | 0.0354 | 0.0345 | 0.0326 | 0.0301 | 0.0314 | 0.0499 | 0.0461 | 0.0501 | 0.0346 | 0.0348 | 0.0363 | 0.0362 | 0.0455 | 0.0455 | 0.0483 |
| f16 | 0.0102 | 0.0107 | 0.0115 | 0.0121 | 0.0085 | 0.0085 | 0.0077 | 0.0065 | 0.0134 | 0.0124 | 0.0147 | 0.0265 | 0.0269 | 0.0205 | 0.0232 | 0.0195 | 0.0182 | 0.0196 | 0.0164 | 0.0159 | 0.0159 | 0.0150 | 0.0149 | 0.0707 | 0.0900 | 0.0707 | 0.0000 | 0.0322 | 0.0322 | 0.0483 | 0.0644 | 0.0407 | 0.0376 | 0.0409 | 0.0282 | 0.0284 | 0.0296 | 0.0295 | 0.0372 | 0.0372 | 0.0394 |
| f17 | 0.0100 | 0.0105 | 0.0113 | 0.0119 | 0.0084 | 0.0084 | 0.0076 | 0.0064 | 0.0132 | 0.0122 | 0.0145 | 0.0261 | 0.0265 | 0.0201 | 0.0228 | 0.0191 | 0.0179 | 0.0193 | 0.0161 | 0.0156 | 0.0156 | 0.0148 | 0.0146 | 0.0689 | 0.0877 | 0.0689 | 0.0483 | 0.0000 | 0.0644 | 0.0483 | 0.0483 | 0.0400 | 0.0370 | 0.0403 | 0.0278 | 0.0280 | 0.0291 | 0.0291 | 0.0366 | 0.0366 | 0.0388 |
| f18 | 0.0095 | 0.0100 | 0.0108 | 0.0113 | 0.0079 | 0.0079 | 0.0072 | 0.0061 | 0.0125 | 0.0116 | 0.0137 | 0.0248 | 0.0252 | 0.0191 | 0.0217 | 0.0182 | 0.0170 | 0.0183 | 0.0153 | 0.0148 | 0.0148 | 0.0140 | 0.0139 | 0.0652 | 0.0830 | 0.0652 | 0.0483 | 0.0483 | 0.0000 | 0.0483 | 0.0483 | 0.0380 | 0.0351 | 0.0382 | 0.0264 | 0.0265 | 0.0277 | 0.0276 | 0.0347 | 0.0347 | 0.0368 |
| f31 | 0.0086 | 0.0090 | 0.0097 | 0.0102 | 0.0072 | 0.0072 | 0.0065 | 0.0055 | 0.0113 | 0.0105 | 0.0124 | 0.0223 | 0.0227 | 0.0172 | 0.0195 | 0.0164 | 0.0153 | 0.0165 | 0.0138 | 0.0134 | 0.0134 | 0.0127 | 0.0125 | 0.0602 | 0.0766 | 0.0602 | 0.0322 | 0.0322 | 0.0161 | 0.0000 | 0.0322 | 0.0342 | 0.0316 | 0.0344 | 0.0237 | 0.0239 | 0.0249 | 0.0249 | 0.0313 | 0.0313 | 0.0332 |
| f36 | 0.0089 | 0.0094 | 0.0101 | 0.0106 | 0.0075 | 0.0075 | 0.0068 | 0.0057 | 0.0117 | 0.0109 | 0.0129 | 0.0233 | 0.0237 | 0.0180 | 0.0204 | 0.0171 | 0.0160 | 0.0172 | 0.0144 | 0.0139 | 0.0139 | 0.0132 | 0.0131 | 0.0628 | 0.0800 | 0.0628 | 0.0483 | 0.0161 | 0.0161 | 0.0322 | 0.0000 | 0.0357 | 0.0330 | 0.0359 | 0.0248 | 0.0249 | 0.0260 | 0.0259 | 0.0326 | 0.0326 | 0.0346 |
| f9 | 0.0000 | 0.0000 | 0.0000 | 0.0000 | 0.0000 | 0.0000 | 0.0000 | 0.0000 | 0.0000 | 0.0000 | 0.0000 | 0.0399 | 0.0406 | 0.0308 | 0.0350 | 0.0293 | 0.0274 | 0.0296 | 0.0246 | 0.0239 | 0.0239 | 0.0227 | 0.0224 | 0.0499 | 0.0617 | 0.0499 | 0.0407 | 0.0400 | 0.0380 | 0.0342 | 0.0357 | 0.0000 | 0.0401 | 0.0602 | 0.0328 | 0.0328 | 0.0341 | 0.0341 | 0.0290 | 0.0290 | 0.0312 |
| f10 | 0.0000 | 0.0000 | 0.0000 | 0.0000 | 0.0000 | 0.0000 | 0.0000 | 0.0000 | 0.0000 | 0.0000 | 0.0000 | 0.0369 | 0.0375 | 0.0285 | 0.0323 | 0.0271 | 0.0254 | 0.0273 | 0.0228 | 0.0221 | 0.0221 | 0.0209 | 0.0207 | 0.0461 | 0.0570 | 0.0461 | 0.0376 | 0.0370 | 0.0351 | 0.0316 | 0.0330 | 0.0401 | 0.0000 | 0.0401 | 0.0303 | 0.0303 | 0.0315 | 0.0315 | 0.0268 | 0.0268 | 0.0288 |
| f11 | 0.0000 | 0.0000 | 0.0000 | 0.0000 | 0.0000 | 0.0000 | 0.0000 | 0.0000 | 0.0000 | 0.0000 | 0.0000 | 0.0401 | 0.0408 | 0.0310 | 0.0352 | 0.0295 | 0.0276 | 0.0297 | 0.0248 | 0.0240 | 0.0241 | 0.0228 | 0.0225 | 0.0501 | 0.0620 | 0.0501 | 0.0409 | 0.0403 | 0.0382 | 0.0344 | 0.0359 | 0.0401 | 0.0401 | 0.0000 | 0.0328 | 0.0328 | 0.0341 | 0.0341 | 0.0290 | 0.0290 | 0.0312 |
| f12 | 0.0000 | 0.0000 | 0.0000 | 0.0000 | 0.0000 | 0.0000 | 0.0000 | 0.0000 | 0.0000 | 0.0000 | 0.0000 | 0.0277 | 0.0281 | 0.0214 | 0.0242 | 0.0203 | 0.0190 | 0.0205 | 0.0171 | 0.0166 | 0.0166 | 0.0157 | 0.0155 | 0.0346 | 0.0427 | 0.0346 | 0.0282 | 0.0278 | 0.0264 | 0.0237 | 0.0248 | 0.0328 | 0.0303 | 0.0328 | 0.0000 | 0.0209 | 0.0313 | 0.0313 | 0.0208 | 0.0208 | 0.0223 |
| f13 | 0.0000 | 0.0000 | 0.0000 | 0.0000 | 0.0000 | 0.0000 | 0.0000 | 0.0000 | 0.0000 | 0.0000 | 0.0000 | 0.0279 | 0.0283 | 0.0215 | 0.0244 | 0.0205 | 0.0192 | 0.0207 | 0.0172 | 0.0167 | 0.0167 | 0.0158 | 0.0156 | 0.0348 | 0.0431 | 0.0348 | 0.0284 | 0.0280 | 0.0265 | 0.0239 | 0.0249 | 0.0328 | 0.0303 | 0.0328 | 0.0104 | 0.0000 | 0.0209 | 0.0104 | 0.0208 | 0.0208 | 0.0223 |
| f14 | 0.0000 | 0.0000 | 0.0000 | 0.0000 | 0.0000 | 0.0000 | 0.0000 | 0.0000 | 0.0000 | 0.0000 | 0.0000 | 0.0290 | 0.0295 | 0.0224 | 0.0254 | 0.0213 | 0.0200 | 0.0215 | 0.0179 | 0.0174 | 0.0174 | 0.0165 | 0.0163 | 0.0363 | 0.0448 | 0.0363 | 0.0296 | 0.0291 | 0.0277 | 0.0249 | 0.0260 | 0.0341 | 0.0315 | 0.0341 | 0.0104 | 0.0313 | 0.0000 | 0.0209 | 0.0216 | 0.0216 | 0.0232 |
| f15 | 0.0000 | 0.0000 | 0.0000 | 0.0000 | 0.0000 | 0.0000 | 0.0000 | 0.0000 | 0.0000 | 0.0000 | 0.0000 | 0.0290 | 0.0295 | 0.0224 | 0.0254 | 0.0213 | 0.0199 | 0.0215 | 0.0179 | 0.0174 | 0.0174 | 0.0164 | 0.0163 | 0.0362 | 0.0448 | 0.0362 | 0.0295 | 0.0291 | 0.0276 | 0.0249 | 0.0259 | 0.0341 | 0.0315 | 0.0341 | 0.0209 | 0.0313 | 0.0209 | 0.0000 | 0.0216 | 0.0216 | 0.0232 |
| f25 | 0.0000 | 0.0000 | 0.0000 | 0.0000 | 0.0000 | 0.0000 | 0.0000 | 0.0000 | 0.0000 | 0.0000 | 0.0000 | 0.0364 | 0.0370 | 0.0281 | 0.0319 | 0.0268 | 0.0250 | 0.0270 | 0.0225 | 0.0218 | 0.0218 | 0.0207 | 0.0204 | 0.0455 | 0.0563 | 0.0455 | 0.0372 | 0.0366 | 0.0347 | 0.0313 | 0.0326 | 0.0581 | 0.0536 | 0.0581 | 0.0312 | 0.0312 | 0.0325 | 0.0325 | 0.0000 | 0.0373 | 0.0559 |
| f26 | 0.0000 | 0.0000 | 0.0000 | 0.0000 | 0.0000 | 0.0000 | 0.0000 | 0.0000 | 0.0000 | 0.0000 | 0.0000 | 0.0364 | 0.0370 | 0.0281 | 0.0319 | 0.0268 | 0.0250 | 0.0270 | 0.0225 | 0.0218 | 0.0218 | 0.0207 | 0.0204 | 0.0455 | 0.0563 | 0.0455 | 0.0372 | 0.0366 | 0.0347 | 0.0313 | 0.0326 | 0.0581 | 0.0536 | 0.0581 | 0.0312 | 0.0312 | 0.0325 | 0.0325 | 0.0373 | 0.0000 | 0.0559 |
| f41 | 0.0000 | 0.0000 | 0.0000 | 0.0000 | 0.0000 | 0.0000 | 0.0000 | 0.0000 | 0.0000 | 0.0000 | 0.0000 | 0.0386 | 0.0393 | 0.0299 | 0.0339 | 0.0284 | 0.0266 | 0.0286 | 0.0239 | 0.0232 | 0.0232 | 0.0219 | 0.0217 | 0.0483 | 0.0597 | 0.0483 | 0.0394 | 0.0388 | 0.0368 | 0.0332 | 0.0346 | 0.0623 | 0.0575 | 0.0623 | 0.0335 | 0.0335 | 0.0348 | 0.0348 | 0.0373 | 0.0373 | 0.0000 |
| Factor | f6 | f7 | f8 | f9 | f12 | f13 | f14 | f15 | f16 | f17 | f18 | f1 | f2 | f3 | f4 | f5 | f19 | f20 | f21 | f22 | f23 | f24 | f25 | f26 | f27 | f10 | f11 | f28 | f29 | f30 | f31 | f32 | f33 | f34 | f35 | f36 | f37 | f38 | f39 | f40 | f41 |
|---|---|---|---|---|---|---|---|---|---|---|---|---|---|---|---|---|---|---|---|---|---|---|---|---|---|---|---|---|---|---|---|---|---|---|---|---|---|---|---|---|---|
| f6 | 0.0000 | 0.0217 | 0.0109 | 0.0217 | 0.0225 | 0.0225 | 0.0234 | 0.0234 | 0.0186 | 0.0213 | 0.0212 | 0.0158 | 0.0174 | 0.0180 | 0.0190 | 0.0145 | 0.0117 | 0.0130 | 0.0151 | 0.0141 | 0.0142 | 0.0106 | 0.0267 | 0.0267 | 0.0284 | 0.0061 | 0.0055 | 0.0069 | 0.0058 | 0.0058 | 0.0064 | 0.0132 | 0.0134 | 0.0142 | 0.0117 | 0.0103 | 0.0114 | 0.0127 | 0.0134 | 0.0124 | 0.0143 |
| f7 | 0.0326 | 0.0000 | 0.0326 | 0.0217 | 0.0266 | 0.0266 | 0.0277 | 0.0277 | 0.0220 | 0.0253 | 0.0251 | 0.0187 | 0.0205 | 0.0213 | 0.0225 | 0.0171 | 0.0139 | 0.0153 | 0.0179 | 0.0166 | 0.0168 | 0.0125 | 0.0316 | 0.0316 | 0.0336 | 0.0072 | 0.0065 | 0.0082 | 0.0068 | 0.0069 | 0.0075 | 0.0157 | 0.0158 | 0.0168 | 0.0138 | 0.0121 | 0.0135 | 0.0150 | 0.0159 | 0.0147 | 0.0169 |
| f8 | 0.0109 | 0.0217 | 0.0000 | 0.0109 | 0.0207 | 0.0207 | 0.0215 | 0.0215 | 0.0171 | 0.0196 | 0.0195 | 0.0146 | 0.0160 | 0.0166 | 0.0175 | 0.0133 | 0.0108 | 0.0119 | 0.0139 | 0.0130 | 0.0131 | 0.0097 | 0.0246 | 0.0246 | 0.0262 | 0.0056 | 0.0051 | 0.0064 | 0.0053 | 0.0054 | 0.0059 | 0.0122 | 0.0123 | 0.0131 | 0.0108 | 0.0094 | 0.0105 | 0.0117 | 0.0124 | 0.0115 | 0.0132 |
| f9 | 0.0217 | 0.0217 | 0.0217 | 0.0000 | 0.0222 | 0.0222 | 0.0230 | 0.0230 | 0.0183 | 0.0210 | 0.0209 | 0.0156 | 0.0171 | 0.0177 | 0.0187 | 0.0142 | 0.0115 | 0.0127 | 0.0149 | 0.0138 | 0.0140 | 0.0104 | 0.0263 | 0.0263 | 0.0280 | 0.0060 | 0.0054 | 0.0068 | 0.0057 | 0.0057 | 0.0063 | 0.0130 | 0.0131 | 0.0140 | 0.0115 | 0.0101 | 0.0112 | 0.0124 | 0.0132 | 0.0122 | 0.0141 |
| f12 | 0.0225 | 0.0266 | 0.0207 | 0.0222 | 0.0000 | 0.0200 | 0.0300 | 0.0300 | 0.0279 | 0.0321 | 0.0319 | 0.0149 | 0.0164 | 0.0170 | 0.0179 | 0.0136 | 0.0111 | 0.0122 | 0.0142 | 0.0133 | 0.0134 | 0.0100 | 0.0252 | 0.0252 | 0.0268 | 0.0058 | 0.0052 | 0.0065 | 0.0054 | 0.0055 | 0.0060 | 0.0125 | 0.0126 | 0.0134 | 0.0110 | 0.0097 | 0.0108 | 0.0119 | 0.0127 | 0.0117 | 0.0135 |
| f13 | 0.0225 | 0.0266 | 0.0207 | 0.0222 | 0.0100 | 0.0000 | 0.0200 | 0.0100 | 0.0279 | 0.0321 | 0.0319 | 0.0148 | 0.0163 | 0.0168 | 0.0178 | 0.0135 | 0.0110 | 0.0121 | 0.0141 | 0.0132 | 0.0133 | 0.0099 | 0.0250 | 0.0250 | 0.0266 | 0.0057 | 0.0051 | 0.0065 | 0.0054 | 0.0055 | 0.0059 | 0.0124 | 0.0125 | 0.0133 | 0.0110 | 0.0096 | 0.0107 | 0.0118 | 0.0126 | 0.0116 | 0.0134 |
| f14 | 0.0234 | 0.0277 | 0.0215 | 0.0230 | 0.0100 | 0.0300 | 0.0000 | 0.0200 | 0.0290 | 0.0334 | 0.0332 | 0.0155 | 0.0170 | 0.0176 | 0.0186 | 0.0142 | 0.0115 | 0.0127 | 0.0148 | 0.0138 | 0.0140 | 0.0104 | 0.0262 | 0.0262 | 0.0279 | 0.0060 | 0.0054 | 0.0068 | 0.0056 | 0.0057 | 0.0062 | 0.0130 | 0.0131 | 0.0139 | 0.0115 | 0.0101 | 0.0112 | 0.0124 | 0.0132 | 0.0122 | 0.0140 |
| f15 | 0.0234 | 0.0277 | 0.0215 | 0.0230 | 0.0200 | 0.0300 | 0.0200 | 0.0000 | 0.0290 | 0.0334 | 0.0332 | 0.0156 | 0.0171 | 0.0177 | 0.0187 | 0.0142 | 0.0115 | 0.0127 | 0.0148 | 0.0138 | 0.0140 | 0.0104 | 0.0263 | 0.0263 | 0.0279 | 0.0060 | 0.0054 | 0.0068 | 0.0057 | 0.0057 | 0.0062 | 0.0130 | 0.0131 | 0.0140 | 0.0115 | 0.0101 | 0.0112 | 0.0124 | 0.0132 | 0.0122 | 0.0141 |
| f16 | 0.0371 | 0.0440 | 0.0341 | 0.0366 | 0.0186 | 0.0186 | 0.0194 | 0.0194 | 0.0000 | 0.0441 | 0.0441 | 0.0206 | 0.0226 | 0.0234 | 0.0247 | 0.0188 | 0.0153 | 0.0169 | 0.0197 | 0.0183 | 0.0185 | 0.0138 | 0.0348 | 0.0348 | 0.0370 | 0.0080 | 0.0071 | 0.0090 | 0.0075 | 0.0076 | 0.0083 | 0.0172 | 0.0174 | 0.0185 | 0.0152 | 0.0133 | 0.0149 | 0.0165 | 0.0175 | 0.0162 | 0.0186 |
| f17 | 0.0427 | 0.0506 | 0.0392 | 0.0421 | 0.0214 | 0.0214 | 0.0222 | 0.0222 | 0.0662 | 0.0000 | 0.0882 | 0.0239 | 0.0261 | 0.0271 | 0.0286 | 0.0218 | 0.0177 | 0.0195 | 0.0227 | 0.0212 | 0.0214 | 0.0159 | 0.0403 | 0.0403 | 0.0428 | 0.0092 | 0.0083 | 0.0104 | 0.0087 | 0.0088 | 0.0096 | 0.0199 | 0.0201 | 0.0214 | 0.0176 | 0.0154 | 0.0172 | 0.0190 | 0.0202 | 0.0187 | 0.0215 |
| f18 | 0.0424 | 0.0503 | 0.0390 | 0.0418 | 0.0213 | 0.0213 | 0.0221 | 0.0221 | 0.0662 | 0.0662 | 0.0000 | 0.0237 | 0.0260 | 0.0269 | 0.0284 | 0.0216 | 0.0175 | 0.0194 | 0.0226 | 0.0210 | 0.0213 | 0.0158 | 0.0400 | 0.0400 | 0.0425 | 0.0092 | 0.0082 | 0.0103 | 0.0086 | 0.0087 | 0.0095 | 0.0198 | 0.0200 | 0.0212 | 0.0175 | 0.0153 | 0.0171 | 0.0189 | 0.0201 | 0.0186 | 0.0214 |
| f1 | 0.0106 | 0.0125 | 0.0097 | 0.0104 | 0.0100 | 0.0099 | 0.0104 | 0.0104 | 0.0137 | 0.0159 | 0.0158 | 0.0000 | 0.0152 | 0.0101 | 0.0101 | 0.0051 | 0.0051 | 0.0057 | 0.0066 | 0.0062 | 0.0062 | 0.0046 | 0.0112 | 0.0112 | 0.0120 | 0.0073 | 0.0065 | 0.0082 | 0.0068 | 0.0069 | 0.0075 | 0.0157 | 0.0158 | 0.0168 | 0.0139 | 0.0122 | 0.0135 | 0.0150 | 0.0159 | 0.0147 | 0.0169 |
| f2 | 0.0116 | 0.0137 | 0.0107 | 0.0114 | 0.0109 | 0.0108 | 0.0114 | 0.0114 | 0.0151 | 0.0174 | 0.0173 | 0.0101 | 0.0000 | 0.0101 | 0.0101 | 0.0101 | 0.0056 | 0.0061 | 0.0071 | 0.0067 | 0.0068 | 0.0050 | 0.0121 | 0.0121 | 0.0130 | 0.0080 | 0.0071 | 0.0090 | 0.0075 | 0.0076 | 0.0083 | 0.0172 | 0.0174 | 0.0185 | 0.0152 | 0.0133 | 0.0148 | 0.0164 | 0.0175 | 0.0162 | 0.0186 |
| f3 | 0.0120 | 0.0142 | 0.0110 | 0.0118 | 0.0113 | 0.0112 | 0.0118 | 0.0118 | 0.0156 | 0.0181 | 0.0179 | 0.0101 | 0.0051 | 0.0000 | 0.0101 | 0.0051 | 0.0058 | 0.0064 | 0.0074 | 0.0069 | 0.0070 | 0.0052 | 0.0126 | 0.0126 | 0.0135 | 0.0083 | 0.0074 | 0.0093 | 0.0077 | 0.0079 | 0.0086 | 0.0178 | 0.0180 | 0.0191 | 0.0157 | 0.0138 | 0.0154 | 0.0170 | 0.0181 | 0.0167 | 0.0192 |
| f4 | 0.0127 | 0.0150 | 0.0117 | 0.0125 | 0.0119 | 0.0118 | 0.0124 | 0.0124 | 0.0165 | 0.0191 | 0.0189 | 0.0051 | 0.0101 | 0.0152 | 0.0000 | 0.0202 | 0.0061 | 0.0067 | 0.0078 | 0.0073 | 0.0074 | 0.0055 | 0.0132 | 0.0132 | 0.0142 | 0.0087 | 0.0078 | 0.0098 | 0.0082 | 0.0083 | 0.0090 | 0.0188 | 0.0190 | 0.0202 | 0.0166 | 0.0146 | 0.0162 | 0.0180 | 0.0191 | 0.0177 | 0.0203 |
| f5 | 0.0097 | 0.0114 | 0.0089 | 0.0095 | 0.0091 | 0.0090 | 0.0095 | 0.0095 | 0.0126 | 0.0145 | 0.0144 | 0.0000 | 0.0051 | 0.0101 | 0.0051 | 0.0000 | 0.0046 | 0.0051 | 0.0059 | 0.0055 | 0.0056 | 0.0041 | 0.0100 | 0.0100 | 0.0107 | 0.0066 | 0.0059 | 0.0075 | 0.0062 | 0.0063 | 0.0069 | 0.0143 | 0.0145 | 0.0154 | 0.0127 | 0.0111 | 0.0124 | 0.0137 | 0.0146 | 0.0135 | 0.0155 |
| f19 | 0.0078 | 0.0092 | 0.0072 | 0.0077 | 0.0074 | 0.0073 | 0.0077 | 0.0077 | 0.0102 | 0.0118 | 0.0117 | 0.0077 | 0.0083 | 0.0086 | 0.0091 | 0.0069 | 0.0000 | 0.0030 | 0.0060 | 0.0060 | 0.0060 | 0.0000 | 0.0088 | 0.0088 | 0.0095 | 0.0054 | 0.0048 | 0.0061 | 0.0051 | 0.0051 | 0.0056 | 0.0116 | 0.0117 | 0.0125 | 0.0103 | 0.0090 | 0.0100 | 0.0111 | 0.0118 | 0.0109 | 0.0126 |
| f20 | 0.0086 | 0.0102 | 0.0080 | 0.0085 | 0.0081 | 0.0081 | 0.0085 | 0.0085 | 0.0112 | 0.0130 | 0.0129 | 0.0085 | 0.0092 | 0.0095 | 0.0100 | 0.0076 | 0.0089 | 0.0000 | 0.0089 | 0.0060 | 0.0060 | 0.0030 | 0.0097 | 0.0097 | 0.0104 | 0.0059 | 0.0053 | 0.0067 | 0.0056 | 0.0057 | 0.0062 | 0.0128 | 0.0130 | 0.0138 | 0.0113 | 0.0099 | 0.0111 | 0.0123 | 0.0130 | 0.0121 | 0.0139 |
| f21 | 0.0101 | 0.0119 | 0.0093 | 0.0099 | 0.0095 | 0.0094 | 0.0099 | 0.0099 | 0.0131 | 0.0152 | 0.0151 | 0.0099 | 0.0107 | 0.0111 | 0.0117 | 0.0088 | 0.0060 | 0.0060 | 0.0000 | 0.0060 | 0.0089 | 0.0060 | 0.0113 | 0.0113 | 0.0122 | 0.0069 | 0.0062 | 0.0078 | 0.0065 | 0.0066 | 0.0072 | 0.0150 | 0.0151 | 0.0161 | 0.0132 | 0.0116 | 0.0129 | 0.0143 | 0.0152 | 0.0141 | 0.0162 |
| f22 | 0.0094 | 0.0111 | 0.0086 | 0.0092 | 0.0088 | 0.0088 | 0.0092 | 0.0092 | 0.0122 | 0.0141 | 0.0140 | 0.0092 | 0.0100 | 0.0104 | 0.0109 | 0.0083 | 0.0089 | 0.0089 | 0.0060 | 0.0000 | 0.0089 | 0.0060 | 0.0106 | 0.0106 | 0.0114 | 0.0065 | 0.0058 | 0.0073 | 0.0061 | 0.0061 | 0.0067 | 0.0139 | 0.0141 | 0.0150 | 0.0123 | 0.0108 | 0.0120 | 0.0133 | 0.0142 | 0.0131 | 0.0151 |
| f23 | 0.0095 | 0.0112 | 0.0087 | 0.0093 | 0.0089 | 0.0089 | 0.0093 | 0.0093 | 0.0123 | 0.0143 | 0.0142 | 0.0094 | 0.0101 | 0.0105 | 0.0111 | 0.0084 | 0.0030 | 0.0060 | 0.0089 | 0.0060 | 0.0000 | 0.0060 | 0.0107 | 0.0107 | 0.0115 | 0.0065 | 0.0058 | 0.0074 | 0.0061 | 0.0062 | 0.0068 | 0.0141 | 0.0142 | 0.0151 | 0.0125 | 0.0109 | 0.0122 | 0.0135 | 0.0143 | 0.0132 | 0.0152 |
| f24 | 0.0071 | 0.0083 | 0.0065 | 0.0069 | 0.0066 | 0.0066 | 0.0069 | 0.0069 | 0.0092 | 0.0106 | 0.0105 | 0.0069 | 0.0075 | 0.0078 | 0.0082 | 0.0062 | 0.0060 | 0.0030 | 0.0089 | 0.0030 | 0.0060 | 0.0000 | 0.0080 | 0.0080 | 0.0085 | 0.0049 | 0.0043 | 0.0055 | 0.0046 | 0.0046 | 0.0050 | 0.0105 | 0.0106 | 0.0112 | 0.0093 | 0.0081 | 0.0090 | 0.0100 | 0.0106 | 0.0098 | 0.0113 |
| f25 | 0.0178 | 0.0211 | 0.0164 | 0.0175 | 0.0168 | 0.0167 | 0.0175 | 0.0175 | 0.0232 | 0.0268 | 0.0267 | 0.0224 | 0.0243 | 0.0252 | 0.0265 | 0.0200 | 0.0132 | 0.0146 | 0.0170 | 0.0159 | 0.0161 | 0.0119 | 0.0000 | 0.0260 | 0.0390 | 0.0123 | 0.0110 | 0.0138 | 0.0115 | 0.0117 | 0.0127 | 0.0265 | 0.0267 | 0.0284 | 0.0234 | 0.0205 | 0.0228 | 0.0253 | 0.0269 | 0.0249 | 0.0286 |
| f26 | 0.0178 | 0.0211 | 0.0164 | 0.0175 | 0.0168 | 0.0167 | 0.0175 | 0.0175 | 0.0232 | 0.0268 | 0.0267 | 0.0224 | 0.0243 | 0.0252 | 0.0265 | 0.0200 | 0.0132 | 0.0146 | 0.0170 | 0.0159 | 0.0161 | 0.0119 | 0.0260 | 0.0000 | 0.0390 | 0.0123 | 0.0110 | 0.0138 | 0.0115 | 0.0117 | 0.0127 | 0.0265 | 0.0267 | 0.0284 | 0.0234 | 0.0205 | 0.0228 | 0.0253 | 0.0269 | 0.0249 | 0.0286 |
| f27 | 0.0190 | 0.0224 | 0.0175 | 0.0186 | 0.0179 | 0.0177 | 0.0186 | 0.0186 | 0.0247 | 0.0285 | 0.0283 | 0.0240 | 0.0260 | 0.0270 | 0.0284 | 0.0215 | 0.0142 | 0.0157 | 0.0182 | 0.0170 | 0.0172 | 0.0128 | 0.0260 | 0.0260 | 0.0000 | 0.0130 | 0.0117 | 0.0147 | 0.0122 | 0.0124 | 0.0135 | 0.0282 | 0.0284 | 0.0302 | 0.0249 | 0.0218 | 0.0243 | 0.0269 | 0.0286 | 0.0265 | 0.0304 |
| f10 | 0.0092 | 0.0109 | 0.0085 | 0.0090 | 0.0087 | 0.0086 | 0.0090 | 0.0090 | 0.0120 | 0.0138 | 0.0138 | 0.0073 | 0.0080 | 0.0083 | 0.0087 | 0.0066 | 0.0054 | 0.0059 | 0.0069 | 0.0065 | 0.0065 | 0.0049 | 0.0123 | 0.0123 | 0.0130 | 0.0000 | 0.0044 | 0.0044 | 0.0022 | 0.0066 | 0.0044 | 0.0114 | 0.0115 | 0.0123 | 0.0090 | 0.0079 | 0.0087 | 0.0097 | 0.0078 | 0.0073 | 0.0084 |
| f11 | 0.0082 | 0.0097 | 0.0076 | 0.0081 | 0.0078 | 0.0077 | 0.0081 | 0.0081 | 0.0107 | 0.0124 | 0.0123 | 0.0065 | 0.0071 | 0.0074 | 0.0078 | 0.0059 | 0.0048 | 0.0053 | 0.0062 | 0.0058 | 0.0058 | 0.0043 | 0.0110 | 0.0110 | 0.0117 | 0.0044 | 0.0000 | 0.0044 | 0.0022 | 0.0044 | 0.0066 | 0.0102 | 0.0103 | 0.0109 | 0.0080 | 0.0070 | 0.0078 | 0.0086 | 0.0070 | 0.0065 | 0.0075 |
| f28 | 0.0104 | 0.0123 | 0.0096 | 0.0102 | 0.0098 | 0.0097 | 0.0102 | 0.0102 | 0.0135 | 0.0156 | 0.0155 | 0.0082 | 0.0090 | 0.0093 | 0.0098 | 0.0075 | 0.0061 | 0.0067 | 0.0078 | 0.0073 | 0.0074 | 0.0055 | 0.0138 | 0.0138 | 0.0147 | 0.0066 | 0.0066 | 0.0000 | 0.0066 | 0.0066 | 0.0089 | 0.0128 | 0.0130 | 0.0138 | 0.0101 | 0.0089 | 0.0098 | 0.0109 | 0.0088 | 0.0082 | 0.0095 |
| f29 | 0.0086 | 0.0102 | 0.0080 | 0.0085 | 0.0081 | 0.0081 | 0.0085 | 0.0085 | 0.0112 | 0.0130 | 0.0129 | 0.0068 | 0.0075 | 0.0077 | 0.0082 | 0.0062 | 0.0051 | 0.0056 | 0.0065 | 0.0061 | 0.0061 | 0.0046 | 0.0115 | 0.0115 | 0.0122 | 0.0044 | 0.0066 | 0.0022 | 0.0000 | 0.0066 | 0.0066 | 0.0107 | 0.0108 | 0.0115 | 0.0084 | 0.0074 | 0.0082 | 0.0090 | 0.0073 | 0.0068 | 0.0078 |
| f30 | 0.0088 | 0.0104 | 0.0081 | 0.0086 | 0.0083 | 0.0082 | 0.0086 | 0.0086 | 0.0114 | 0.0132 | 0.0131 | 0.0069 | 0.0076 | 0.0079 | 0.0083 | 0.0063 | 0.0051 | 0.0057 | 0.0066 | 0.0061 | 0.0062 | 0.0046 | 0.0117 | 0.0117 | 0.0124 | 0.0044 | 0.0000 | 0.0022 | 0.0044 | 0.0000 | 0.0044 | 0.0109 | 0.0110 | 0.0117 | 0.0085 | 0.0075 | 0.0083 | 0.0092 | 0.0075 | 0.0069 | 0.0080 |
| f31 | 0.0095 | 0.0113 | 0.0088 | 0.0094 | 0.0090 | 0.0089 | 0.0094 | 0.0094 | 0.0124 | 0.0144 | 0.0143 | 0.0075 | 0.0083 | 0.0086 | 0.0090 | 0.0069 | 0.0056 | 0.0062 | 0.0072 | 0.0067 | 0.0068 | 0.0050 | 0.0127 | 0.0127 | 0.0135 | 0.0044 | 0.0022 | 0.0044 | 0.0022 | 0.0044 | 0.0000 | 0.0118 | 0.0120 | 0.0127 | 0.0093 | 0.0082 | 0.0090 | 0.0100 | 0.0081 | 0.0075 | 0.0087 |
| f32 | 0.0199 | 0.0235 | 0.0183 | 0.0195 | 0.0187 | 0.0186 | 0.0195 | 0.0195 | 0.0258 | 0.0299 | 0.0297 | 0.0157 | 0.0172 | 0.0178 | 0.0188 | 0.0143 | 0.0116 | 0.0128 | 0.0150 | 0.0139 | 0.0141 | 0.0105 | 0.0265 | 0.0265 | 0.0282 | 0.0114 | 0.0102 | 0.0128 | 0.0107 | 0.0109 | 0.0118 | 0.0000 | 0.0369 | 0.0246 | 0.0172 | 0.0151 | 0.0168 | 0.0186 | 0.0151 | 0.0140 | 0.0161 |
| f33 | 0.0201 | 0.0237 | 0.0185 | 0.0197 | 0.0189 | 0.0188 | 0.0197 | 0.0197 | 0.0261 | 0.0302 | 0.0300 | 0.0158 | 0.0174 | 0.0180 | 0.0190 | 0.0145 | 0.0117 | 0.0130 | 0.0151 | 0.0141 | 0.0142 | 0.0106 | 0.0267 | 0.0267 | 0.0284 | 0.0115 | 0.0103 | 0.0130 | 0.0108 | 0.0110 | 0.0120 | 0.0246 | 0.0000 | 0.0246 | 0.0175 | 0.0153 | 0.0170 | 0.0188 | 0.0152 | 0.0142 | 0.0163 |
| f34 | 0.0213 | 0.0252 | 0.0196 | 0.0210 | 0.0201 | 0.0199 | 0.0209 | 0.0209 | 0.0277 | 0.0321 | 0.0319 | 0.0168 | 0.0185 | 0.0191 | 0.0202 | 0.0154 | 0.0125 | 0.0138 | 0.0161 | 0.0150 | 0.0151 | 0.0112 | 0.0284 | 0.0284 | 0.0302 | 0.0123 | 0.0109 | 0.0138 | 0.0115 | 0.0117 | 0.0127 | 0.0492 | 0.0492 | 0.0000 | 0.0186 | 0.0163 | 0.0181 | 0.0200 | 0.0162 | 0.0151 | 0.0174 |
| f35 | 0.0176 | 0.0208 | 0.0162 | 0.0173 | 0.0165 | 0.0164 | 0.0172 | 0.0172 | 0.0228 | 0.0264 | 0.0262 | 0.0139 | 0.0152 | 0.0157 | 0.0166 | 0.0127 | 0.0103 | 0.0113 | 0.0132 | 0.0123 | 0.0125 | 0.0093 | 0.0234 | 0.0234 | 0.0249 | 0.0060 | 0.0053 | 0.0067 | 0.0056 | 0.0057 | 0.0062 | 0.0172 | 0.0175 | 0.0186 | 0.0000 | 0.0140 | 0.0209 | 0.0279 | 0.0237 | 0.0220 | 0.0254 |
| f36 | 0.0154 | 0.0182 | 0.0142 | 0.0151 | 0.0145 | 0.0144 | 0.0151 | 0.0151 | 0.0200 | 0.0232 | 0.0230 | 0.0122 | 0.0133 | 0.0138 | 0.0146 | 0.0111 | 0.0090 | 0.0099 | 0.0116 | 0.0108 | 0.0109 | 0.0081 | 0.0205 | 0.0205 | 0.0218 | 0.0052 | 0.0047 | 0.0059 | 0.0049 | 0.0050 | 0.0054 | 0.0151 | 0.0153 | 0.0163 | 0.0070 | 0.0000 | 0.0140 | 0.0140 | 0.0208 | 0.0193 | 0.0223 |
| f37 | 0.0171 | 0.0202 | 0.0158 | 0.0168 | 0.0161 | 0.0160 | 0.0168 | 0.0168 | 0.0223 | 0.0258 | 0.0256 | 0.0135 | 0.0148 | 0.0154 | 0.0162 | 0.0124 | 0.0100 | 0.0111 | 0.0129 | 0.0120 | 0.0122 | 0.0090 | 0.0228 | 0.0228 | 0.0243 | 0.0058 | 0.0052 | 0.0066 | 0.0054 | 0.0055 | 0.0060 | 0.0168 | 0.0170 | 0.0181 | 0.0140 | 0.0209 | 0.0000 | 0.0209 | 0.0230 | 0.0214 | 0.0247 |
| f38 | 0.0190 | 0.0224 | 0.0175 | 0.0187 | 0.0179 | 0.0178 | 0.0186 | 0.0186 | 0.0247 | 0.0286 | 0.0284 | 0.0150 | 0.0164 | 0.0170 | 0.0180 | 0.0137 | 0.0111 | 0.0123 | 0.0143 | 0.0133 | 0.0135 | 0.0100 | 0.0253 | 0.0253 | 0.0269 | 0.0064 | 0.0057 | 0.0073 | 0.0060 | 0.0061 | 0.0067 | 0.0186 | 0.0188 | 0.0200 | 0.0209 | 0.0209 | 0.0140 | 0.0000 | 0.0255 | 0.0237 | 0.0273 |
| f39 | 0.0202 | 0.0238 | 0.0186 | 0.0198 | 0.0190 | 0.0189 | 0.0198 | 0.0198 | 0.0262 | 0.0304 | 0.0302 | 0.0159 | 0.0175 | 0.0181 | 0.0191 | 0.0146 | 0.0118 | 0.0130 | 0.0152 | 0.0142 | 0.0143 | 0.0106 | 0.0269 | 0.0269 | 0.0286 | 0.0078 | 0.0070 | 0.0088 | 0.0073 | 0.0075 | 0.0081 | 0.0151 | 0.0152 | 0.0162 | 0.0178 | 0.0156 | 0.0173 | 0.0191 | 0.0000 | 0.0279 | 0.0279 |
| f40 | 0.0187 | 0.0221 | 0.0172 | 0.0184 | 0.0176 | 0.0175 | 0.0183 | 0.0183 | 0.0243 | 0.0281 | 0.0279 | 0.0147 | 0.0162 | 0.0167 | 0.0177 | 0.0135 | 0.0109 | 0.0121 | 0.0141 | 0.0131 | 0.0132 | 0.0098 | 0.0249 | 0.0249 | 0.0265 | 0.0073 | 0.0065 | 0.0082 | 0.0068 | 0.0069 | 0.0075 | 0.0140 | 0.0142 | 0.0151 | 0.0165 | 0.0145 | 0.0160 | 0.0178 | 0.0279 | 0.0000 | 0.0279 |
| f41 | 0.0215 | 0.0254 | 0.0198 | 0.0211 | 0.0202 | 0.0201 | 0.0210 | 0.0211 | 0.0279 | 0.0323 | 0.0321 | 0.0169 | 0.0186 | 0.0192 | 0.0203 | 0.0155 | 0.0126 | 0.0139 | 0.0162 | 0.0151 | 0.0152 | 0.0113 | 0.0286 | 0.0286 | 0.0304 | 0.0084 | 0.0075 | 0.0095 | 0.0078 | 0.0080 | 0.0087 | 0.0161 | 0.0163 | 0.0174 | 0.0190 | 0.0167 | 0.0185 | 0.0205 | 0.0558 | 0.0419 | 0.0000 |
| Factor | f1 | f2 | f3 | f4 | f5 | f6 | f7 | f8 | f9 | f10 | f11 | f12 | f13 | f14 | f15 | f16 | f17 | f18 | f19 | f20 | f21 | f22 | f23 | f24 | f25 | f26 | f27 | f28 | f29 | f30 | f31 | f32 | f33 | f34 | f35 | f36 | f37 | f38 | f39 | f40 | f41 |
|---|---|---|---|---|---|---|---|---|---|---|---|---|---|---|---|---|---|---|---|---|---|---|---|---|---|---|---|---|---|---|---|---|---|---|---|---|---|---|---|---|---|
| f1 | 0.0191 | 0.0936 | 0.0366 | 0.0394 | 0.0333 | 0.0552 | 0.0665 | 0.0547 | 0.0542 | 0.0477 | 0.0515 | 0.0157 | 0.0161 | 0.0167 | 0.0191 | 0.0232 | 0.0246 | 0.0244 | 0.0195 | 0.0206 | 0.0223 | 0.0161 | 0.0174 | 0.0141 | 0.0159 | 0.0159 | 0.0173 | 0.0099 | 0.0112 | 0.0095 | 0.0107 | 0.0153 | 0.0147 | 0.0136 | 0.0171 | 0.0127 | 0.0115 | 0.0122 | 0.0193 | 0.0178 | 0.0203 |
| f2 | 0.0667 | 0.0199 | 0.0360 | 0.0388 | 0.0338 | 0.0547 | 0.0659 | 0.0542 | 0.0536 | 0.0470 | 0.0506 | 0.0160 | 0.0164 | 0.0170 | 0.0194 | 0.0236 | 0.0251 | 0.0249 | 0.0196 | 0.0207 | 0.0224 | 0.0163 | 0.0175 | 0.0142 | 0.0164 | 0.0164 | 0.0179 | 0.0101 | 0.0114 | 0.0097 | 0.0110 | 0.0158 | 0.0153 | 0.0142 | 0.0175 | 0.0132 | 0.0120 | 0.0127 | 0.0198 | 0.0183 | 0.0208 |
| f3 | 0.0467 | 0.0474 | 0.0130 | 0.0428 | 0.0274 | 0.0452 | 0.0544 | 0.0447 | 0.0444 | 0.0384 | 0.0412 | 0.0140 | 0.0144 | 0.0149 | 0.0168 | 0.0207 | 0.0221 | 0.0219 | 0.0163 | 0.0173 | 0.0188 | 0.0132 | 0.0142 | 0.0114 | 0.0147 | 0.0147 | 0.0160 | 0.0098 | 0.0097 | 0.0084 | 0.0094 | 0.0142 | 0.0138 | 0.0140 | 0.0152 | 0.0117 | 0.0119 | 0.0127 | 0.0173 | 0.0160 | 0.0182 |
| f4 | 0.0542 | 0.0571 | 0.0611 | 0.0160 | 0.0740 | 0.0538 | 0.0648 | 0.0533 | 0.0529 | 0.0461 | 0.0496 | 0.0160 | 0.0165 | 0.0170 | 0.0194 | 0.0236 | 0.0252 | 0.0251 | 0.0190 | 0.0201 | 0.0218 | 0.0152 | 0.0163 | 0.0132 | 0.0166 | 0.0166 | 0.0180 | 0.0112 | 0.0110 | 0.0095 | 0.0107 | 0.0159 | 0.0154 | 0.0156 | 0.0172 | 0.0131 | 0.0133 | 0.0141 | 0.0195 | 0.0180 | 0.0205 |
| f5 | 0.0416 | 0.0441 | 0.0414 | 0.0268 | 0.0103 | 0.0418 | 0.0504 | 0.0414 | 0.0411 | 0.0359 | 0.0386 | 0.0124 | 0.0128 | 0.0132 | 0.0150 | 0.0183 | 0.0195 | 0.0194 | 0.0149 | 0.0158 | 0.0171 | 0.0119 | 0.0128 | 0.0103 | 0.0128 | 0.0128 | 0.0139 | 0.0087 | 0.0087 | 0.0075 | 0.0084 | 0.0123 | 0.0120 | 0.0121 | 0.0135 | 0.0102 | 0.0103 | 0.0109 | 0.0153 | 0.0141 | 0.0161 |
| f6 | 0.0258 | 0.0271 | 0.0226 | 0.0244 | 0.0203 | 0.0228 | 0.0650 | 0.0423 | 0.0425 | 0.0340 | 0.0365 | 0.0335 | 0.0344 | 0.0356 | 0.0410 | 0.0431 | 0.0457 | 0.0452 | 0.0273 | 0.0290 | 0.0311 | 0.0233 | 0.0251 | 0.0203 | 0.0334 | 0.0334 | 0.0363 | 0.0150 | 0.0099 | 0.0088 | 0.0189 | 0.0149 | 0.0146 | 0.0195 | 0.0150 | 0.0211 | 0.0164 | 0.0172 | 0.0171 | 0.0158 | 0.0179 |
| f7 | 0.0326 | 0.0342 | 0.0284 | 0.0307 | 0.0256 | 0.0875 | 0.0348 | 0.0870 | 0.0533 | 0.0437 | 0.0469 | 0.0422 | 0.0434 | 0.0448 | 0.0518 | 0.0546 | 0.0578 | 0.0571 | 0.0344 | 0.0366 | 0.0393 | 0.0294 | 0.0317 | 0.0257 | 0.0420 | 0.0420 | 0.0455 | 0.0190 | 0.0124 | 0.0111 | 0.0243 | 0.0184 | 0.0180 | 0.0244 | 0.0187 | 0.0269 | 0.0205 | 0.0215 | 0.0213 | 0.0197 | 0.0223 |
| f8 | 0.0252 | 0.0264 | 0.0219 | 0.0237 | 0.0198 | 0.0422 | 0.0644 | 0.0219 | 0.0400 | 0.0337 | 0.0362 | 0.0327 | 0.0336 | 0.0347 | 0.0402 | 0.0422 | 0.0447 | 0.0441 | 0.0268 | 0.0285 | 0.0306 | 0.0227 | 0.0245 | 0.0199 | 0.0324 | 0.0324 | 0.0352 | 0.0147 | 0.0096 | 0.0085 | 0.0186 | 0.0142 | 0.0139 | 0.0188 | 0.0144 | 0.0206 | 0.0158 | 0.0166 | 0.0164 | 0.0151 | 0.0172 |
| f9 | 0.0258 | 0.0271 | 0.0226 | 0.0244 | 0.0203 | 0.0517 | 0.0615 | 0.0513 | 0.0180 | 0.0387 | 0.0509 | 0.0342 | 0.0351 | 0.0363 | 0.0428 | 0.0457 | 0.0487 | 0.0482 | 0.0270 | 0.0289 | 0.0308 | 0.0241 | 0.0260 | 0.0211 | 0.0302 | 0.0302 | 0.0328 | 0.0152 | 0.0077 | 0.0072 | 0.0188 | 0.0127 | 0.0126 | 0.0197 | 0.0116 | 0.0208 | 0.0164 | 0.0172 | 0.0135 | 0.0124 | 0.0141 |
| f10 | 0.0207 | 0.0217 | 0.0174 | 0.0189 | 0.0159 | 0.0433 | 0.0523 | 0.0430 | 0.0395 | 0.0118 | 0.0372 | 0.0274 | 0.0281 | 0.0290 | 0.0350 | 0.0384 | 0.0408 | 0.0403 | 0.0226 | 0.0240 | 0.0254 | 0.0196 | 0.0213 | 0.0174 | 0.0230 | 0.0230 | 0.0250 | 0.0126 | 0.0057 | 0.0060 | 0.0161 | 0.0097 | 0.0096 | 0.0160 | 0.0088 | 0.0174 | 0.0131 | 0.0137 | 0.0096 | 0.0089 | 0.0101 |
| f11 | 0.0217 | 0.0226 | 0.0179 | 0.0195 | 0.0165 | 0.0458 | 0.0553 | 0.0455 | 0.0398 | 0.0367 | 0.0135 | 0.0287 | 0.0294 | 0.0304 | 0.0368 | 0.0402 | 0.0426 | 0.0421 | 0.0237 | 0.0253 | 0.0267 | 0.0205 | 0.0223 | 0.0183 | 0.0237 | 0.0237 | 0.0258 | 0.0133 | 0.0059 | 0.0057 | 0.0175 | 0.0095 | 0.0094 | 0.0163 | 0.0087 | 0.0181 | 0.0134 | 0.0139 | 0.0095 | 0.0088 | 0.0100 |
| f12 | 0.0219 | 0.0232 | 0.0198 | 0.0212 | 0.0176 | 0.0265 | 0.0313 | 0.0257 | 0.0237 | 0.0160 | 0.0168 | 0.0102 | 0.0243 | 0.0309 | 0.0308 | 0.0289 | 0.0303 | 0.0300 | 0.0147 | 0.0158 | 0.0173 | 0.0286 | 0.0312 | 0.0254 | 0.0342 | 0.0342 | 0.0373 | 0.0144 | 0.0084 | 0.0083 | 0.0168 | 0.0143 | 0.0144 | 0.0194 | 0.0112 | 0.0174 | 0.0145 | 0.0154 | 0.0132 | 0.0121 | 0.0137 |
| f13 | 0.0212 | 0.0224 | 0.0191 | 0.0205 | 0.0170 | 0.0257 | 0.0303 | 0.0249 | 0.0229 | 0.0156 | 0.0163 | 0.0163 | 0.0102 | 0.0236 | 0.0170 | 0.0278 | 0.0291 | 0.0289 | 0.0142 | 0.0153 | 0.0167 | 0.0275 | 0.0300 | 0.0245 | 0.0329 | 0.0329 | 0.0358 | 0.0139 | 0.0081 | 0.0080 | 0.0163 | 0.0137 | 0.0138 | 0.0187 | 0.0108 | 0.0169 | 0.0140 | 0.0149 | 0.0127 | 0.0117 | 0.0132 |
| f14 | 0.0225 | 0.0237 | 0.0202 | 0.0217 | 0.0180 | 0.0271 | 0.0320 | 0.0263 | 0.0242 | 0.0164 | 0.0172 | 0.0169 | 0.0307 | 0.0112 | 0.0243 | 0.0294 | 0.0309 | 0.0306 | 0.0150 | 0.0162 | 0.0177 | 0.0292 | 0.0319 | 0.0260 | 0.0349 | 0.0349 | 0.0380 | 0.0147 | 0.0086 | 0.0085 | 0.0172 | 0.0146 | 0.0147 | 0.0199 | 0.0114 | 0.0178 | 0.0148 | 0.0158 | 0.0135 | 0.0124 | 0.0140 |
| f15 | 0.0239 | 0.0253 | 0.0214 | 0.0230 | 0.0191 | 0.0278 | 0.0328 | 0.0270 | 0.0249 | 0.0170 | 0.0178 | 0.0249 | 0.0322 | 0.0259 | 0.0127 | 0.0487 | 0.0526 | 0.0524 | 0.0168 | 0.0181 | 0.0196 | 0.0393 | 0.0432 | 0.0355 | 0.0444 | 0.0444 | 0.0485 | 0.0172 | 0.0107 | 0.0108 | 0.0197 | 0.0176 | 0.0178 | 0.0230 | 0.0124 | 0.0187 | 0.0158 | 0.0168 | 0.0146 | 0.0135 | 0.0152 |
| f16 | 0.0289 | 0.0306 | 0.0261 | 0.0280 | 0.0232 | 0.0434 | 0.0517 | 0.0422 | 0.0337 | 0.0224 | 0.0236 | 0.0313 | 0.0323 | 0.0333 | 0.0332 | 0.0214 | 0.0438 | 0.0438 | 0.0251 | 0.0269 | 0.0291 | 0.0398 | 0.0434 | 0.0355 | 0.0505 | 0.0505 | 0.0550 | 0.0193 | 0.0137 | 0.0131 | 0.0272 | 0.0217 | 0.0216 | 0.0262 | 0.0179 | 0.0304 | 0.0192 | 0.0204 | 0.0209 | 0.0192 | 0.0218 |
| f17 | 0.0315 | 0.0334 | 0.0289 | 0.0310 | 0.0255 | 0.0466 | 0.0554 | 0.0452 | 0.0369 | 0.0237 | 0.0247 | 0.0349 | 0.0360 | 0.0371 | 0.0370 | 0.0577 | 0.0251 | 0.0687 | 0.0285 | 0.0306 | 0.0333 | 0.0451 | 0.0493 | 0.0402 | 0.0571 | 0.0571 | 0.0622 | 0.0213 | 0.0154 | 0.0149 | 0.0293 | 0.0249 | 0.0249 | 0.0295 | 0.0201 | 0.0296 | 0.0213 | 0.0228 | 0.0235 | 0.0217 | 0.0245 |
| f18 | 0.0303 | 0.0321 | 0.0278 | 0.0298 | 0.0246 | 0.0446 | 0.0531 | 0.0433 | 0.0355 | 0.0226 | 0.0236 | 0.0338 | 0.0349 | 0.0359 | 0.0358 | 0.0565 | 0.0568 | 0.0240 | 0.0278 | 0.0299 | 0.0324 | 0.0440 | 0.0480 | 0.0392 | 0.0555 | 0.0555 | 0.0605 | 0.0206 | 0.0149 | 0.0144 | 0.0286 | 0.0242 | 0.0242 | 0.0286 | 0.0194 | 0.0289 | 0.0206 | 0.0220 | 0.0227 | 0.0209 | 0.0237 |
| f19 | 0.0182 | 0.0190 | 0.0154 | 0.0167 | 0.0141 | 0.0170 | 0.0202 | 0.0167 | 0.0121 | 0.0094 | 0.0098 | 0.0148 | 0.0152 | 0.0157 | 0.0157 | 0.0222 | 0.0235 | 0.0233 | 0.0061 | 0.0139 | 0.0222 | 0.0292 | 0.0322 | 0.0259 | 0.0282 | 0.0282 | 0.0308 | 0.0137 | 0.0114 | 0.0106 | 0.0141 | 0.0160 | 0.0158 | 0.0174 | 0.0127 | 0.0130 | 0.0121 | 0.0128 | 0.0133 | 0.0123 | 0.0138 |
| f20 | 0.0198 | 0.0207 | 0.0168 | 0.0182 | 0.0153 | 0.0185 | 0.0219 | 0.0181 | 0.0133 | 0.0102 | 0.0107 | 0.0164 | 0.0169 | 0.0174 | 0.0174 | 0.0246 | 0.0260 | 0.0257 | 0.0296 | 0.0072 | 0.0307 | 0.0322 | 0.0356 | 0.0292 | 0.0312 | 0.0312 | 0.0341 | 0.0150 | 0.0125 | 0.0117 | 0.0155 | 0.0176 | 0.0174 | 0.0192 | 0.0137 | 0.0142 | 0.0132 | 0.0140 | 0.0146 | 0.0134 | 0.0151 |
| f21 | 0.0213 | 0.0223 | 0.0182 | 0.0197 | 0.0165 | 0.0201 | 0.0238 | 0.0197 | 0.0145 | 0.0111 | 0.0115 | 0.0174 | 0.0179 | 0.0184 | 0.0185 | 0.0261 | 0.0276 | 0.0273 | 0.0225 | 0.0226 | 0.0085 | 0.0330 | 0.0370 | 0.0304 | 0.0325 | 0.0325 | 0.0355 | 0.0159 | 0.0133 | 0.0124 | 0.0164 | 0.0189 | 0.0186 | 0.0205 | 0.0164 | 0.0154 | 0.0144 | 0.0153 | 0.0159 | 0.0147 | 0.0165 |
| f22 | 0.0303 | 0.0316 | 0.0262 | 0.0285 | 0.0242 | 0.0190 | 0.0226 | 0.0186 | 0.0170 | 0.0135 | 0.0142 | 0.0102 | 0.0106 | 0.0109 | 0.0117 | 0.0151 | 0.0159 | 0.0158 | 0.0127 | 0.0133 | 0.0138 | 0.0163 | 0.0655 | 0.0471 | 0.0369 | 0.0369 | 0.0406 | 0.0365 | 0.0313 | 0.0325 | 0.0352 | 0.0451 | 0.0456 | 0.0461 | 0.0225 | 0.0185 | 0.0197 | 0.0214 | 0.0270 | 0.0249 | 0.0280 |
| f23 | 0.0317 | 0.0331 | 0.0274 | 0.0298 | 0.0253 | 0.0197 | 0.0235 | 0.0193 | 0.0176 | 0.0141 | 0.0148 | 0.0106 | 0.0109 | 0.0113 | 0.0121 | 0.0156 | 0.0164 | 0.0163 | 0.0121 | 0.0133 | 0.0149 | 0.0475 | 0.0189 | 0.0469 | 0.0382 | 0.0382 | 0.0420 | 0.0381 | 0.0327 | 0.0339 | 0.0367 | 0.0470 | 0.0475 | 0.0481 | 0.0234 | 0.0192 | 0.0205 | 0.0223 | 0.0281 | 0.0259 | 0.0292 |
| f24 | 0.0260 | 0.0271 | 0.0224 | 0.0244 | 0.0207 | 0.0160 | 0.0190 | 0.0157 | 0.0142 | 0.0115 | 0.0122 | 0.0084 | 0.0087 | 0.0090 | 0.0096 | 0.0124 | 0.0130 | 0.0129 | 0.0106 | 0.0105 | 0.0125 | 0.0292 | 0.0465 | 0.0125 | 0.0313 | 0.0313 | 0.0344 | 0.0315 | 0.0270 | 0.0281 | 0.0304 | 0.0387 | 0.0391 | 0.0396 | 0.0191 | 0.0156 | 0.0166 | 0.0181 | 0.0229 | 0.0211 | 0.0238 |
| f25 | 0.0423 | 0.0445 | 0.0364 | 0.0394 | 0.0331 | 0.0375 | 0.0445 | 0.0367 | 0.0368 | 0.0297 | 0.0314 | 0.0231 | 0.0238 | 0.0246 | 0.0252 | 0.0315 | 0.0326 | 0.0322 | 0.0126 | 0.0135 | 0.0152 | 0.0556 | 0.0610 | 0.0503 | 0.0258 | 0.0597 | 0.0793 | 0.0439 | 0.0316 | 0.0335 | 0.0467 | 0.0490 | 0.0499 | 0.0568 | 0.0242 | 0.0319 | 0.0286 | 0.0309 | 0.0294 | 0.0271 | 0.0304 |
| f26 | 0.0423 | 0.0445 | 0.0364 | 0.0394 | 0.0331 | 0.0375 | 0.0445 | 0.0367 | 0.0368 | 0.0297 | 0.0314 | 0.0231 | 0.0238 | 0.0246 | 0.0252 | 0.0315 | 0.0326 | 0.0322 | 0.0126 | 0.0135 | 0.0152 | 0.0556 | 0.0610 | 0.0503 | 0.0597 | 0.0258 | 0.0793 | 0.0439 | 0.0316 | 0.0335 | 0.0467 | 0.0490 | 0.0499 | 0.0568 | 0.0242 | 0.0319 | 0.0286 | 0.0309 | 0.0294 | 0.0271 | 0.0304 |
| f27 | 0.0440 | 0.0463 | 0.0380 | 0.0410 | 0.0345 | 0.0391 | 0.0464 | 0.0383 | 0.0385 | 0.0311 | 0.0328 | 0.0242 | 0.0249 | 0.0257 | 0.0264 | 0.0329 | 0.0340 | 0.0336 | 0.0132 | 0.0141 | 0.0159 | 0.0579 | 0.0635 | 0.0523 | 0.0600 | 0.0600 | 0.0296 | 0.0455 | 0.0327 | 0.0347 | 0.0484 | 0.0507 | 0.0516 | 0.0589 | 0.0252 | 0.0332 | 0.0298 | 0.0322 | 0.0306 | 0.0281 | 0.0316 |
| f28 | 0.0651 | 0.0679 | 0.0502 | 0.0547 | 0.0473 | 0.0307 | 0.0368 | 0.0303 | 0.0296 | 0.0251 | 0.0269 | 0.0136 | 0.0139 | 0.0144 | 0.0170 | 0.0200 | 0.0215 | 0.0214 | 0.0163 | 0.0173 | 0.0187 | 0.0206 | 0.0225 | 0.0185 | 0.0204 | 0.0204 | 0.0222 | 0.0109 | 0.0275 | 0.0271 | 0.0336 | 0.0425 | 0.0430 | 0.0455 | 0.0418 | 0.0363 | 0.0409 | 0.0464 | 0.0517 | 0.0475 | 0.0533 |
| f29 | 0.0515 | 0.0538 | 0.0415 | 0.0452 | 0.0391 | 0.0286 | 0.0342 | 0.0282 | 0.0252 | 0.0212 | 0.0232 | 0.0120 | 0.0123 | 0.0127 | 0.0147 | 0.0191 | 0.0202 | 0.0200 | 0.0127 | 0.0135 | 0.0146 | 0.0173 | 0.0189 | 0.0155 | 0.0177 | 0.0177 | 0.0193 | 0.0172 | 0.0074 | 0.0211 | 0.0281 | 0.0359 | 0.0365 | 0.0365 | 0.0329 | 0.0316 | 0.0326 | 0.0359 | 0.0394 | 0.0363 | 0.0405 |
| f30 | 0.0527 | 0.0552 | 0.0425 | 0.0463 | 0.0401 | 0.0277 | 0.0332 | 0.0273 | 0.0253 | 0.0213 | 0.0221 | 0.0115 | 0.0118 | 0.0122 | 0.0144 | 0.0180 | 0.0193 | 0.0191 | 0.0122 | 0.0130 | 0.0140 | 0.0165 | 0.0181 | 0.0148 | 0.0173 | 0.0173 | 0.0188 | 0.0210 | 0.0205 | 0.0076 | 0.0221 | 0.0367 | 0.0360 | 0.0378 | 0.0339 | 0.0322 | 0.0336 | 0.0371 | 0.0413 | 0.0380 | 0.0424 |
| f31 | 0.0604 | 0.0632 | 0.0486 | 0.0529 | 0.0458 | 0.0440 | 0.0530 | 0.0436 | 0.0369 | 0.0318 | 0.0339 | 0.0192 | 0.0197 | 0.0204 | 0.0226 | 0.0270 | 0.0281 | 0.0250 | 0.0143 | 0.0152 | 0.0164 | 0.0209 | 0.0228 | 0.0188 | 0.0271 | 0.0271 | 0.0295 | 0.0249 | 0.0155 | 0.0202 | 0.0139 | 0.0382 | 0.0387 | 0.0427 | 0.0372 | 0.0416 | 0.0380 | 0.0417 | 0.0461 | 0.0424 | 0.0475 |
| f32 | 0.0683 | 0.0717 | 0.0564 | 0.0612 | 0.0526 | 0.0390 | 0.0467 | 0.0383 | 0.0358 | 0.0286 | 0.0302 | 0.0184 | 0.0189 | 0.0195 | 0.0222 | 0.0284 | 0.0306 | 0.0305 | 0.0179 | 0.0191 | 0.0209 | 0.0237 | 0.0257 | 0.0208 | 0.0273 | 0.0273 | 0.0297 | 0.0339 | 0.0282 | 0.0300 | 0.0337 | 0.0165 | 0.0503 | 0.0396 | 0.0452 | 0.0427 | 0.0447 | 0.0494 | 0.0544 | 0.0500 | 0.0559 |
| f33 | 0.0672 | 0.0705 | 0.0555 | 0.0602 | 0.0517 | 0.0380 | 0.0455 | 0.0373 | 0.0352 | 0.0280 | 0.0296 | 0.0180 | 0.0185 | 0.0191 | 0.0218 | 0.0277 | 0.0299 | 0.0298 | 0.0174 | 0.0186 | 0.0203 | 0.0231 | 0.0250 | 0.0202 | 0.0268 | 0.0268 | 0.0291 | 0.0333 | 0.0279 | 0.0284 | 0.0331 | 0.0384 | 0.0165 | 0.0387 | 0.0446 | 0.0420 | 0.0441 | 0.0488 | 0.0539 | 0.0495 | 0.0553 |
| f34 | 0.0773 | 0.0810 | 0.0615 | 0.0668 | 0.0573 | 0.0395 | 0.0473 | 0.0387 | 0.0384 | 0.0305 | 0.0322 | 0.0196 | 0.0201 | 0.0208 | 0.0237 | 0.0287 | 0.0312 | 0.0313 | 0.0208 | 0.0222 | 0.0243 | 0.0262 | 0.0284 | 0.0230 | 0.0292 | 0.0292 | 0.0318 | 0.0382 | 0.0311 | 0.0325 | 0.0352 | 0.0606 | 0.0611 | 0.0195 | 0.0511 | 0.0448 | 0.0501 | 0.0554 | 0.0629 | 0.0578 | 0.0648 |
| f35 | 0.0465 | 0.0488 | 0.0389 | 0.0422 | 0.0360 | 0.0446 | 0.0534 | 0.0439 | 0.0398 | 0.0319 | 0.0341 | 0.0234 | 0.0240 | 0.0249 | 0.0296 | 0.0365 | 0.0392 | 0.0390 | 0.0274 | 0.0288 | 0.0306 | 0.0379 | 0.0416 | 0.0342 | 0.0393 | 0.0393 | 0.0429 | 0.0175 | 0.0147 | 0.0137 | 0.0180 | 0.0222 | 0.0220 | 0.0240 | 0.0142 | 0.0325 | 0.0378 | 0.0458 | 0.0386 | 0.0355 | 0.0397 |
| f36 | 0.0412 | 0.0432 | 0.0344 | 0.0373 | 0.0318 | 0.0498 | 0.0598 | 0.0492 | 0.0424 | 0.0351 | 0.0376 | 0.0258 | 0.0265 | 0.0274 | 0.0314 | 0.0393 | 0.0355 | 0.0354 | 0.0210 | 0.0224 | 0.0241 | 0.0333 | 0.0366 | 0.0301 | 0.0408 | 0.0408 | 0.0445 | 0.0158 | 0.0111 | 0.0106 | 0.0208 | 0.0176 | 0.0175 | 0.0214 | 0.0212 | 0.0150 | 0.0290 | 0.0300 | 0.0332 | 0.0306 | 0.0342 |
| f37 | 0.0434 | 0.0454 | 0.0344 | 0.0373 | 0.0316 | 0.0365 | 0.0437 | 0.0358 | 0.0355 | 0.0281 | 0.0299 | 0.0206 | 0.0211 | 0.0219 | 0.0266 | 0.0303 | 0.0332 | 0.0332 | 0.0237 | 0.0252 | 0.0272 | 0.0343 | 0.0377 | 0.0310 | 0.0355 | 0.0355 | 0.0388 | 0.0145 | 0.0125 | 0.0119 | 0.0131 | 0.0198 | 0.0197 | 0.0221 | 0.0299 | 0.0338 | 0.0121 | 0.0376 | 0.0375 | 0.0345 | 0.0386 |
| f38 | 0.0463 | 0.0486 | 0.0370 | 0.0400 | 0.0340 | 0.0393 | 0.0471 | 0.0385 | 0.0385 | 0.0303 | 0.0323 | 0.0223 | 0.0228 | 0.0237 | 0.0288 | 0.0328 | 0.0359 | 0.0360 | 0.0254 | 0.0270 | 0.0291 | 0.0370 | 0.0406 | 0.0334 | 0.0386 | 0.0386 | 0.0421 | 0.0154 | 0.0131 | 0.0127 | 0.0139 | 0.0212 | 0.0211 | 0.0223 | 0.0371 | 0.0344 | 0.0291 | 0.0144 | 0.0403 | 0.0371 | 0.0415 |
| f39 | 0.0561 | 0.0589 | 0.0467 | 0.0507 | 0.0433 | 0.0534 | 0.0640 | 0.0526 | 0.0481 | 0.0393 | 0.0420 | 0.0277 | 0.0284 | 0.0294 | 0.0356 | 0.0431 | 0.0464 | 0.0462 | 0.0321 | 0.0341 | 0.0367 | 0.0460 | 0.0506 | 0.0417 | 0.0473 | 0.0473 | 0.0516 | 0.0207 | 0.0162 | 0.0154 | 0.0212 | 0.0238 | 0.0237 | 0.0270 | 0.0445 | 0.0409 | 0.0417 | 0.0456 | 0.0206 | 0.0520 | 0.0533 |
| f40 | 0.0525 | 0.0551 | 0.0437 | 0.0474 | 0.0405 | 0.0500 | 0.0599 | 0.0492 | 0.0450 | 0.0368 | 0.0393 | 0.0259 | 0.0266 | 0.0275 | 0.0333 | 0.0403 | 0.0434 | 0.0432 | 0.0300 | 0.0319 | 0.0343 | 0.0430 | 0.0473 | 0.0390 | 0.0442 | 0.0442 | 0.0483 | 0.0194 | 0.0152 | 0.0144 | 0.0199 | 0.0222 | 0.0221 | 0.0252 | 0.0417 | 0.0383 | 0.0390 | 0.0427 | 0.0529 | 0.0177 | 0.0522 |
| f41 | 0.0631 | 0.0662 | 0.0524 | 0.0569 | 0.0486 | 0.0600 | 0.0719 | 0.0591 | 0.0541 | 0.0442 | 0.0473 | 0.0310 | 0.0318 | 0.0329 | 0.0399 | 0.0482 | 0.0519 | 0.0516 | 0.0359 | 0.0382 | 0.0410 | 0.0517 | 0.0569 | 0.0469 | 0.0530 | 0.0530 | 0.0579 | 0.0232 | 0.0181 | 0.0172 | 0.0238 | 0.0265 | 0.0264 | 0.0302 | 0.0497 | 0.0458 | 0.0467 | 0.0510 | 0.0901 | 0.0719 | 0.0239 |
References
- Abbasi, R.; Martinez, P.; Ahmad, R. The digitization of agricultural industry—A systematic literature review on agriculture 4.0. Smart Agric. Technol. 2022, 2, 100042. [Google Scholar] [CrossRef]
- Noble, V. Mobilities of the One-Product policy from Japan to Thailand: A critical policy study of OVOP and OTOP. Territ. Politics Gov. 2019, 7, 455–473. [Google Scholar] [CrossRef]
- Sonn, J.W.; Gimm, D. South Korea’s Saemaul (New Village) movement: An organisational technology for the production of developmentalist subjects. Can. J. Dev. Stud. Rev. Can. D’études Développement 2013, 34, 22–36. [Google Scholar] [CrossRef]
- Kaufmann, L.; Mayer, A.; Matej, S.; Kalt, G.; Lauk, C.; Theurl, M.C.; Erb, K. Regional self-sufficiency: A multi-dimensional analysis relating agricultural production and consumption in the European Union. Sustain. Prod. Consump. 2022, 34, 12–25. [Google Scholar] [CrossRef]
- Jha, K.; Doshi, A.; Patel, P.; Shah, M. A comprehensive review on automation in agriculture using artificial intelligence. Artif. Intell. Agric. 2019, 2, 1–12. [Google Scholar] [CrossRef]
- Mohr, S.; Kühl, R. Acceptance of artificial intelligence in German agriculture: An application of the technology acceptance model and the theory of planned behavior. Precis. Agric. 2021, 22, 1816–1844. [Google Scholar] [CrossRef]
- Liu, Y.; Zou, L.; Wang, Y. Spatial-temporal characteristics and influencing factors of agricultural eco-efficiency in China in recent 40 years. Land Use Policy 2020, 97, 104794. [Google Scholar] [CrossRef]
- Acosta, L.A.; Maharjan, P.; Peyriere, H.M.; Mamiit, R.J. Natural capital protection indicators: Measuring performance in achieving the Sustainable Development Goals for green growth transition. Environ. Sustain. Ind. 2020, 8, 100069. [Google Scholar] [CrossRef]
- Fan, J.; Wang, Q.; Ji, M.; Sun, Y.; Feng, Y.; Yang, F.; Zhang, Z. Ecological network construction and gradient zoning optimization strategy in urban-rural fringe: A case study of Licheng District, Jinan City, China. Ecol. Indic. 2023, 150, 110251. [Google Scholar] [CrossRef]
- Pichler, M.; Bhan, M.; Gingrich, S. The social and ecological costs of reforestation. Territorialization and industrialization of land use accompany forest transitions in Southeast Asia. Land Use Policy 2021, 101, 105180. [Google Scholar] [CrossRef]
- Yang, T.; Song, W.; Huang, Z.; Wu, J. The values of biological diversity: A perspective from China. Biol. Conserv. 2023, 287, 110341. [Google Scholar] [CrossRef]
- Azam, A.; Shafique, M.; Rafiq, M.; Ateeq, M. Moving toward sustainable agriculture: The nexus between clean energy, ICT, human capital and environmental degradation under SDG policies in European countries. Energy Strategy Rev. 2023, 50, 101252. [Google Scholar] [CrossRef]
- de Wit, M.; Londo, M.; Faaij, A. Productivity developments in European agriculture: Relations to and opportunities for biomass production. Renew. Sustain. Energy Rev. 2011, 15, 2397–2412. [Google Scholar] [CrossRef]
- Self, S.; Grabowski, R. Economic development and the role of agricultural technology. Agric. Econ. Blackwell 2007, 36, 395–404. [Google Scholar] [CrossRef]
- Ibarrola-Rivas, M.; Unar-Munguia, M.; Kastner, T.; Nonhebel, S. Does Mexico have the agricultural land resources to feed its population with a healthy and sustainable diet? Sustain. Prod. Consump. 2022, 34, 371–384. [Google Scholar] [CrossRef]
- Liu, L.; Wang, X.; Meng, X.; Cai, Y. The coupling and coordination between food production security and agricultural ecological protection in main food-producing areas of China. Ecol. Indic. 2023, 154, 110785. [Google Scholar] [CrossRef]
- Tao, T.; Ma, L.; Wang, X.; Wu, S.; Shi, Z.; Cui, X. Resilience or efficiency? Strategic options for sustainable development of agricultural systems in ecologically fragile areas of China. Sci. Total Environ. 2023, 881, 163411. [Google Scholar] [CrossRef]
- Dou, X. Agro-ecological sustainability evaluation in China. J. Bioeconomics 2022, 24, 223–239. [Google Scholar] [CrossRef]
- Guzmán, G.I.; Fernández, D.S.; Aguilera, E.; Infante-Amate, J.; de Molina, M.G. The close relationship between biophysical degradation, ecosystem services and family farms decline in Spanish agriculture (1992–2017). Ecosyst. Serv. 2022, 56, 101456. [Google Scholar] [CrossRef]
- Grinberga-Zalite, G.; Zvirbule, A. Analysis of Waste Minimization Challenges to European Food Production Enterprises. Emerg. Sci. J. 2022, 6, 530–543. [Google Scholar] [CrossRef]
- Wen, J.; Hou, K. Research on the progress of regional ecological security evaluation and optimization of its common limitations. Ecol. Indic. 2021, 127, 107797. [Google Scholar] [CrossRef]
- Antle, J.M.; Basso, B.; Conant, R.T.; Godfray, H.C.J.; Jones, J.W.; Herrero, M.; Howitt, R.E.; Keating, B.A.; Munoz-Carpena, R.; Rosenzweig, C.; et al. Towards a new generation of agricultural system data, models and knowledge products: Design and improvement. Agric. Syst. 2017, 155, 255–268. [Google Scholar] [CrossRef] [PubMed]
- Du, Y.; Fan, Y. Spatiotemporal Dynamics of Agricultural Sustainability Assessment: A Study across 30 Chinese Provinces. Sustainability 2023, 15, 9066. [Google Scholar] [CrossRef]
- Chen, Y.; Miao, J.; Zhu, Z. Measuring green total factor productivity of China’s agricultural sector: A three-stage SBM-DEA model with non-point source pollution and CO2 emissions. J. Clean. Prod. 2021, 318, 128543. [Google Scholar] [CrossRef]
- Sun, C.; Xu, S.; Xu, M. What causes green efficiency losses in Chinese agriculture? A perspective based on input redundancy. Technol. Forecast. Soc. 2023, 197, 122907. [Google Scholar] [CrossRef]
- Buitenhuis, Y.; Candel, J.J.L.; Termeer, K.J.A.M.; Feindt, P.H. Does the Common Agricultural Policy enhance farming systems’ resilience? Applying the Resilience Assessment Tool (ResAT) to a farming system case study in the Netherlands. J. Rural Stud. 2020, 80, 314–327. [Google Scholar] [CrossRef]
- Adenle, A.A.; Wedig, K.; Azadi, H. Sustainable agriculture and food security in Africa: The role of innovative technologies and international organizations. Technol. Soc. 2019, 58, 101143. [Google Scholar] [CrossRef]
- Pawlak, K.; Kołodziejczak, M. The Role of Agriculture in Ensuring Food Security in Developing Countries: Considerations in the Context of the Problem of Sustainable Food Production. Sustainability 2020, 12, 5488. [Google Scholar] [CrossRef]
- Long, Y. Export competitiveness of agricultural products and agricultural sustainability in China. Reg. Sustain. 2021, 2, 203–210. [Google Scholar] [CrossRef]
- Yang, Z.; Solangi, Y.A. Analyzing the relationship between natural resource management, environmental protection, and agricultural economics for sustainable development in China. J. Clean. Prod. 2024, 450, 141862. [Google Scholar] [CrossRef]
- Xiong, H.; Zhan, J.; Xu, Y.; Zuo, A.; Lv, X. Challenges or drivers? Threshold effects of environmental regulation on China’s agricultural green productivity. J. Clean. Prod. 2023, 429, 139503. [Google Scholar] [CrossRef]
- Thompson, B.; Barnes, A.P.; Toma, L. Increasing the adoption intensity of sustainable agricultural practices in Europe: Farm and practice level insights. J. Environ. Manag. 2022, 320, 115663. [Google Scholar] [CrossRef] [PubMed]
- Du, Y.; Li, X. Critical factor identification of marine ranching ecological security with hierarchical DEMATEL. Mar. Policy 2022, 138, 104982. [Google Scholar] [CrossRef]
- Feng, T.; Liu, B.; Ren, H.; Yang, J.; Zhou, Z. Optimized model for coordinated development of regional sustainable agriculture based on water–energy–land–carbon nexus system: A case study of Sichuan Province. Energy Convers. Manag. 2023, 291, 117261. [Google Scholar] [CrossRef]
- Harvey, H.B.; Sotardi, S.T. The Pareto Principle. J. Am. Coll. Radiol. 2018, 15, 931. [Google Scholar] [CrossRef]
- Ministry of Agniculture and Rural Affairs of the People’s Republic of China. National Agricultural Green Development Plan for the Fourteenth Five-Year Plan. Available online: http://www.moa.gov.cn/nybgb/2021/202109/202112/t20211207_6384020.htm (accessed on 6 January 2024). (In Chinese)
- Yunnan Provincial Department of Agriculture and Rural Development. Notice on the Issuance of the “14th Five-Year” Development Plan for Modern Agriculture with Highland Characteristics in Yunnan Province. Available online: https://www.yn.gov.cn/ztgg/ynghgkzl/sjqtgh/zxgh/202112/t20211210_231445.html (accessed on 5 January 2024). (In Chinese)
- He, N.; Zhou, Y.; Wang, L.; Li, Q.; Zuo, Q.; Liu, J.; Li, M. Spatiotemporal evaluation and analysis of cultivated land ecological security based on the DPSIR model in Enshi autonomous prefecture, China. Ecol. Indic. 2022, 145, 109619. [Google Scholar] [CrossRef]
- Liu, L.; Li, J.; Wang, J.; Liu, F.; Cole, J.; Sha, J.; Jiao, Y.; Zhou, J. The establishment of an eco-environmental evaluation model for southwest China and eastern South Africa based on the DPSIR framework. Ecol. Indic. 2022, 145, 109687. [Google Scholar] [CrossRef]
- Shi, Z.; Ma, L.; Wang, X.; Wu, S.; Bai, J.; Li, Z.; Zhang, Y. Efficiency of agricultural modernization in China: Systematic analysis in the new framework of multidimensional security. J. Clean. Prod. 2023, 432, 139611. [Google Scholar] [CrossRef]
- Zhou, S.; Mueller, F.; Burkhard, B.; Cao, X.; Hou, Y. Assessing Agricultural Sustainable Development Based on the DPSIR Approach: Case Study in Jiangsu, China. J. Integr. Agric. 2013, 12, 1292–1299. [Google Scholar] [CrossRef]
- Gao, W.; Sun, Q.; Chen, Y.; Wang, X.; Li, X.; Lei, X. Construction of Evaluation Indicators for World Agricultural Powers and China’s Benchmarking Analysis. J. Chin. Agric. Univ. 2023, 28, 1–13. (In Chinese) [Google Scholar]
- Sobhani, P.; Esmaeilzadeh, H.; Wolf, I.D.; Deljouei, A.; Marcu, M.V.; Sadeghi, S.M.M. Evaluating the ecological security of ecotourism in protected area based on the DPSIR model. Ecol. Indic. 2023, 155, 110957. [Google Scholar] [CrossRef]
- Rasool, R.; Fayaz, A.; Shafiq, M.U.; Singh, H.; Ahmed, P. Land use land cover change in Kashmir Himalaya: Linking remote sensing with an indicator based DPSIR approach. Ecol. Indic. 2021, 125, 107447. [Google Scholar] [CrossRef]
- Song, W.; Zhang, H.; Zhao, R.; Wu, K.; Li, X.; Niu, B.; Li, J. Study on cultivated land quality evaluation from the perspective of farmland ecosystems. Ecol. Indic. 2022, 139, 108959. [Google Scholar] [CrossRef]
- Tang, H.; Hou, K.; Wu, S.; Liu, J.; Ma, L.; Li, X. Interpretation of the coupling mechanism of ecological security and urbanization based on a Computation-Verification-Coupling framework: Quantitative analysis of sustainable development. Ecotoxicol. Environ. Saf. 2023, 263, 115294. [Google Scholar] [CrossRef] [PubMed]
- Badrzadeh, N.; Samani, J.M.V.; Mazaheri, M.; Kuriqi, A. Evaluation of management practices on agricultural nonpoint source pollution discharges into the rivers under climate change effects. Sci. Total Environ. 2022, 838, 156643. [Google Scholar] [CrossRef]
- Deng, H.; Zheng, W.; Shen, Z.; Štreimikienė, D. Does fiscal expenditure promote green agricultural productivity gains: An investigation on corn production. Appl. Energy 2023, 334, 120666. [Google Scholar] [CrossRef]
- Xie, Y. Land expropriation, shock to employment, and employment differentiation: Findings from land-lost farmers in Nanjing, China. Land Use Policy 2019, 87, 104040. [Google Scholar] [CrossRef]
- Yin, Q.; Wang, Q.; Du, M.; Wang, F.; Sun, W.; Chen, L.; Tang, H. Promoting the resource utilization of agricultural wastes in China with public-private-partnership mode: An evolutionary game perspective. J. Clean. Prod. 2024, 434, 140206. [Google Scholar] [CrossRef]
- Wang, P.; Shi, J.; Xiong, P.; Chen, M.; Jin, W. Optimization of rural domestic sewage treatment mode based on life cycle assessment method: A case study of Wuzhong District, Suzhou City, China. J. Water Process Eng. 2023, 56, 104480. [Google Scholar] [CrossRef]
- Tseng, M. A causal and effect decision making model of service quality expectation using grey-fuzzy DEMATEL approach. Expert Syst. Appl. 2009, 36, 7738–7748. [Google Scholar] [CrossRef]
- Du, Y.; Li, X. Hierarchical DEMATEL method for complex systems. Expert Syst. Appl. 2021, 167, 113871. [Google Scholar] [CrossRef]
- Du, Y.; Gao, K. Ecological security evaluation of marine ranching with AHP-entropy-based TOPSIS: A case study of Yantai, China. Mar. Policy 2020, 122, 104223. [Google Scholar] [CrossRef]
- Xu, L.Y.; Du, J.G.; Liu, G.F. Analysis of dynamic change characteristics of rural water environment carrying capacity in taihu basin based on cloud model--a case study of Zhenjiang region in taihu basin. Resour. Environ. Yangtze Basin 2017, 26, 124–132. [Google Scholar]
- Du, W.; Liao, X.; Tong, Z.; Rina, S.; Rong, G.; Zhang, J.; Liu, X.; Guo, E. Early warning and scenario simulation of ecological security based on DPSIRM model and Bayesian network: A case study of east Liaohe river in Jilin Province, China. J. Clean. Prod. 2023, 398, 136649. [Google Scholar] [CrossRef]
- Chai, N.; Zhou, W. The DPSIRM—Grey cloud clustering method for evaluating the water environment carrying capacity of Yangtze River economic Belt. Ecol. Indic. 2022, 136, 108722. [Google Scholar] [CrossRef]
- Wang, S.; Wang, Y.; Song, M. Construction and analogue simulation of TERE model for measuring marine bearing capacity in Qingdao. J. Clean. Prod. 2017, 167, 1303–1313. [Google Scholar] [CrossRef]
- Zhang, D.; Yang, W.; Kang, D.; Zhang, H. Spatial-temporal characteristics and policy implication for non-grain production of cultivated land in Guanzhong Region. Land Use Policy 2023, 125, 106466. [Google Scholar] [CrossRef]
- Fontela, E.; Gabus, A. DEMATEL: Progress achieved. Futures 1974, 6, 361–363. [Google Scholar] [CrossRef]
- Lin, Q.; Zhang, K.; Huang, D.; Grifoll, M.; Feng, H. Evaluating the impact of Trans-Asian railway on logistics mode selection between Thailand and China: An AHP-TOPSIS approach. Alex. Eng. J. 2024, 98, 147–158. [Google Scholar] [CrossRef]
- Sun, Y.; Huang, Z.; Chi, F. Analysis of systemic factors affecting carbon reduction in Chinese energy-intensive industries: A dual-driven DEMATEL model. Energy 2023, 285, 129319. [Google Scholar] [CrossRef]
- Du, Y.; Shen, X. Group hierarchical DEMATEL method for reaching consensus. Comput. Ind. Eng. 2023, 175, 108842. [Google Scholar] [CrossRef]
- Du, Y.; Shen, X. Large-scale group hierarchical DEMATEL method with automatic consensus reaching. Inf. Fusion 2024, 108, 102411. [Google Scholar] [CrossRef]
- Tzeng, G.; Huang, C. Combined DEMATEL technique with hybrid MCDM methods for creating the aspired intelligent global manufacturing & logistics systems. Ann. Oper. Res. 2012, 197, 159–190. [Google Scholar]
- Apaydın, O.; Aladağ, Z. Ranking the evaluation criteria of Hi-Fi audio systems and constricted information space: A novel method for determining the DEMATEL threshold value. Appl. Acoust. 2022, 190, 108584. [Google Scholar] [CrossRef]
- Du, Y.; Fu, Z.; Wang, Z. Teaching Quality Improvement Strategies for College Teachers in the Context of Educational Strength—A Study Based on Hierarchical DEMATEL. J. Kunming Univ. Sci. Technol. (Nat. Sci. Ed.) 2024, 49, 345–356. (In Chinese) [Google Scholar]
- Lu, C.; Ouyang, Q. Environmental regulation and urban position in the inter-urban pollution transfer network: A perspective on network analysis of pollution-intensive enterprises’ relocation. J. Clean. Prod. 2024, 435, 140418. [Google Scholar] [CrossRef]
- Liu, Y.; Liu, S.; Sun, Y.; Wang, F.; Li, M. Driving forces of cultivated land evolution in agro-pastoral areas on the Qinghai-Tibet Plateau based on ecological niche theory. J. Clean. Prod. 2021, 313, 127899. [Google Scholar] [CrossRef]
- Chen, T.; Dai, J.; Chen, X.; Liang, C.; Shi, T.; Lyu, Y.; Zhao, F.; Wu, X.; Gao, M.; Huang, J.; et al. Agricultural land management extends the duration of the impacts of extreme climate events on vegetation in double–cropping systems in the Yangtze–Huai plain China. Ecol. Indic. 2024, 158, 111488. [Google Scholar] [CrossRef]
- Yunnan Provincial Statistics Office. Yunnan Provincial Statistical Bulletin on National Economic and Social Development 2023. Available online: https://www.yn.gov.cn/sjfb/tjgb/202403/t20240329_297393.html (accessed on 3 July 2024). (In Chinese)
- Yunnan Provincial Department of Agriculture and Rural Affairs. Yunnan Province High-Standard Farmland Construction Plan (2021–2030). Available online: https://nync.yn.gov.cn/html/2022/guihuaxinxi_0530/387367.html?cid=3962 (accessed on 15 May 2024). (In Chinese)
- China Environmental News. Yunnan’s Biodiversity Conservation at the Forefront of the Country. Available online: https://www.mee.gov.cn/ywdt/dfnews/202110/t20211012_956140.shtml (accessed on 3 August 2024). (In Chinese)
- Yunnan Provincial Water Resources Bureau. Yunnan Province Soil and Water Conservation Bulletin 2023. Available online: https://wcb.yn.gov.cn/html/2024/shuitubaochigongbao_1031/3059970.html (accessed on 9 August 2024). (In Chinese)
- Yunnan Forestry and Grassland Bureau. Yunnan ‘14th Five-Year Plan’ Forestry and Grassland Industry Development Plan. Available online: https://lcj.yn.gov.cn/html/2022/fazhanguihua_0126/65202.html (accessed on 8 September 2024). (In Chinese)
- Department of Emergency Management of Yunnan Province. Natural Disasters in Yunnan Province in 2024. Available online: https://yjglt.yn.gov.cn/html/2025/tjfx_0110/4029810.html (accessed on 10 February 2025). (In Chinese)
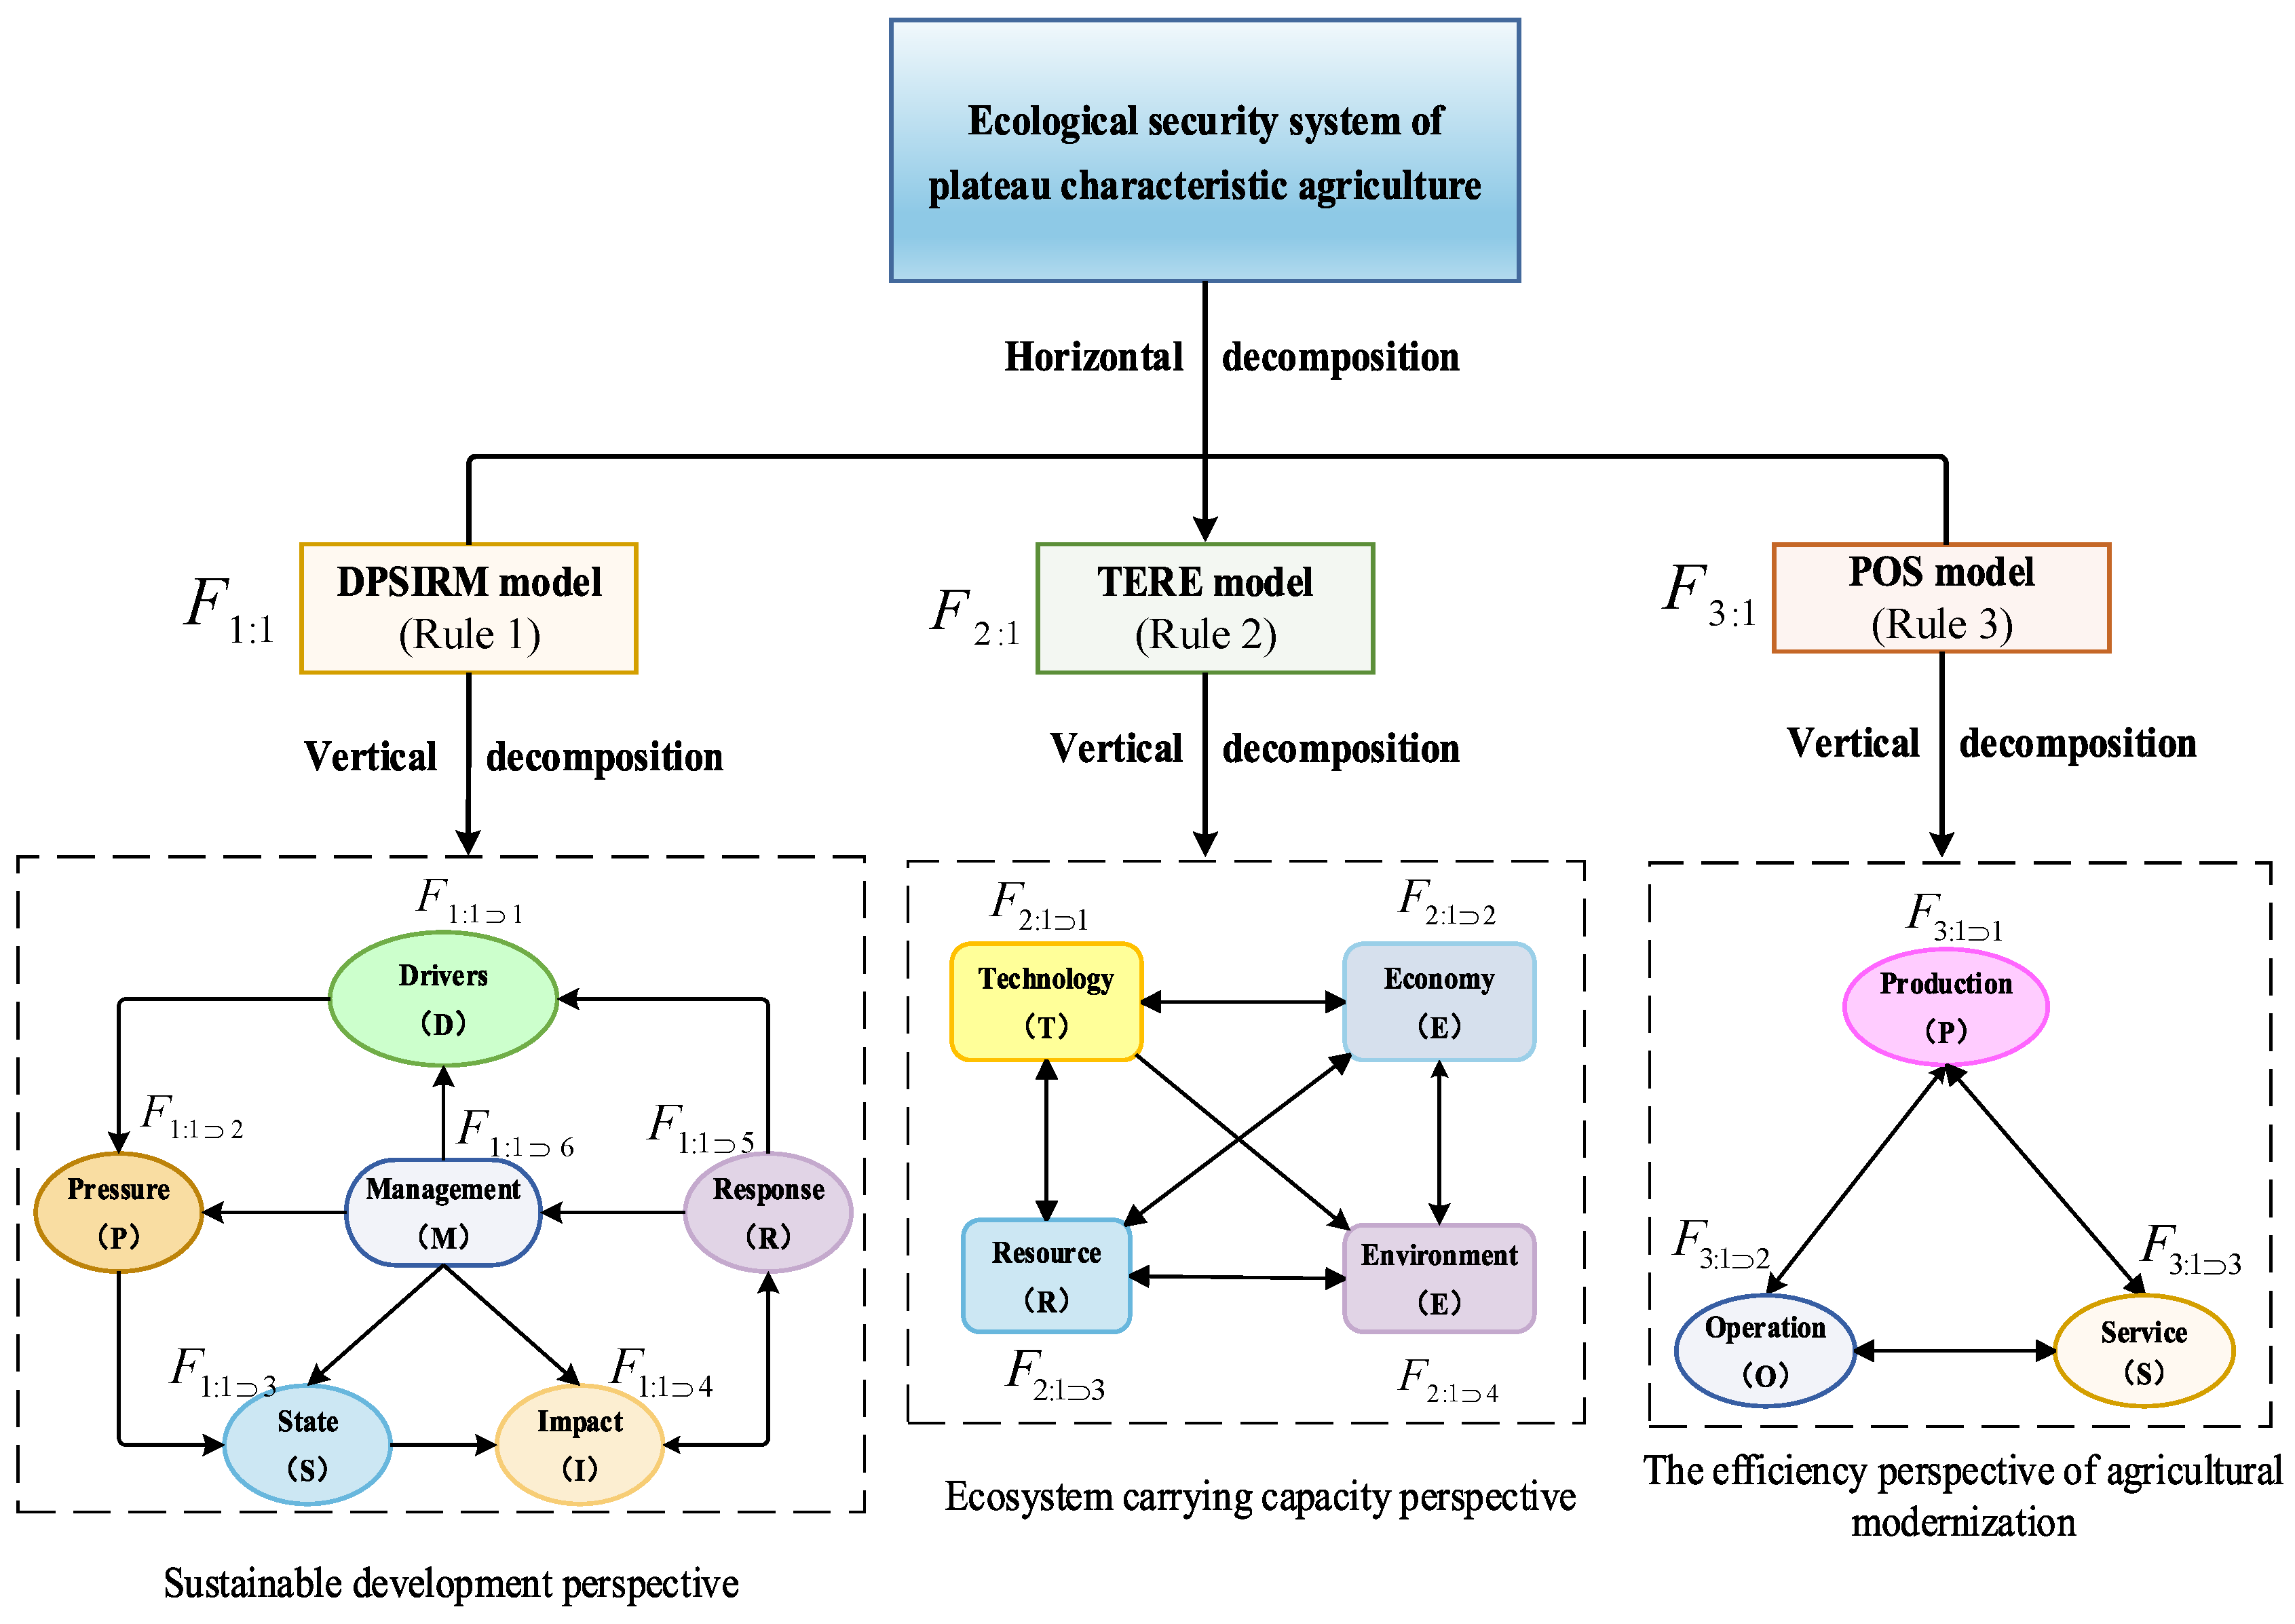
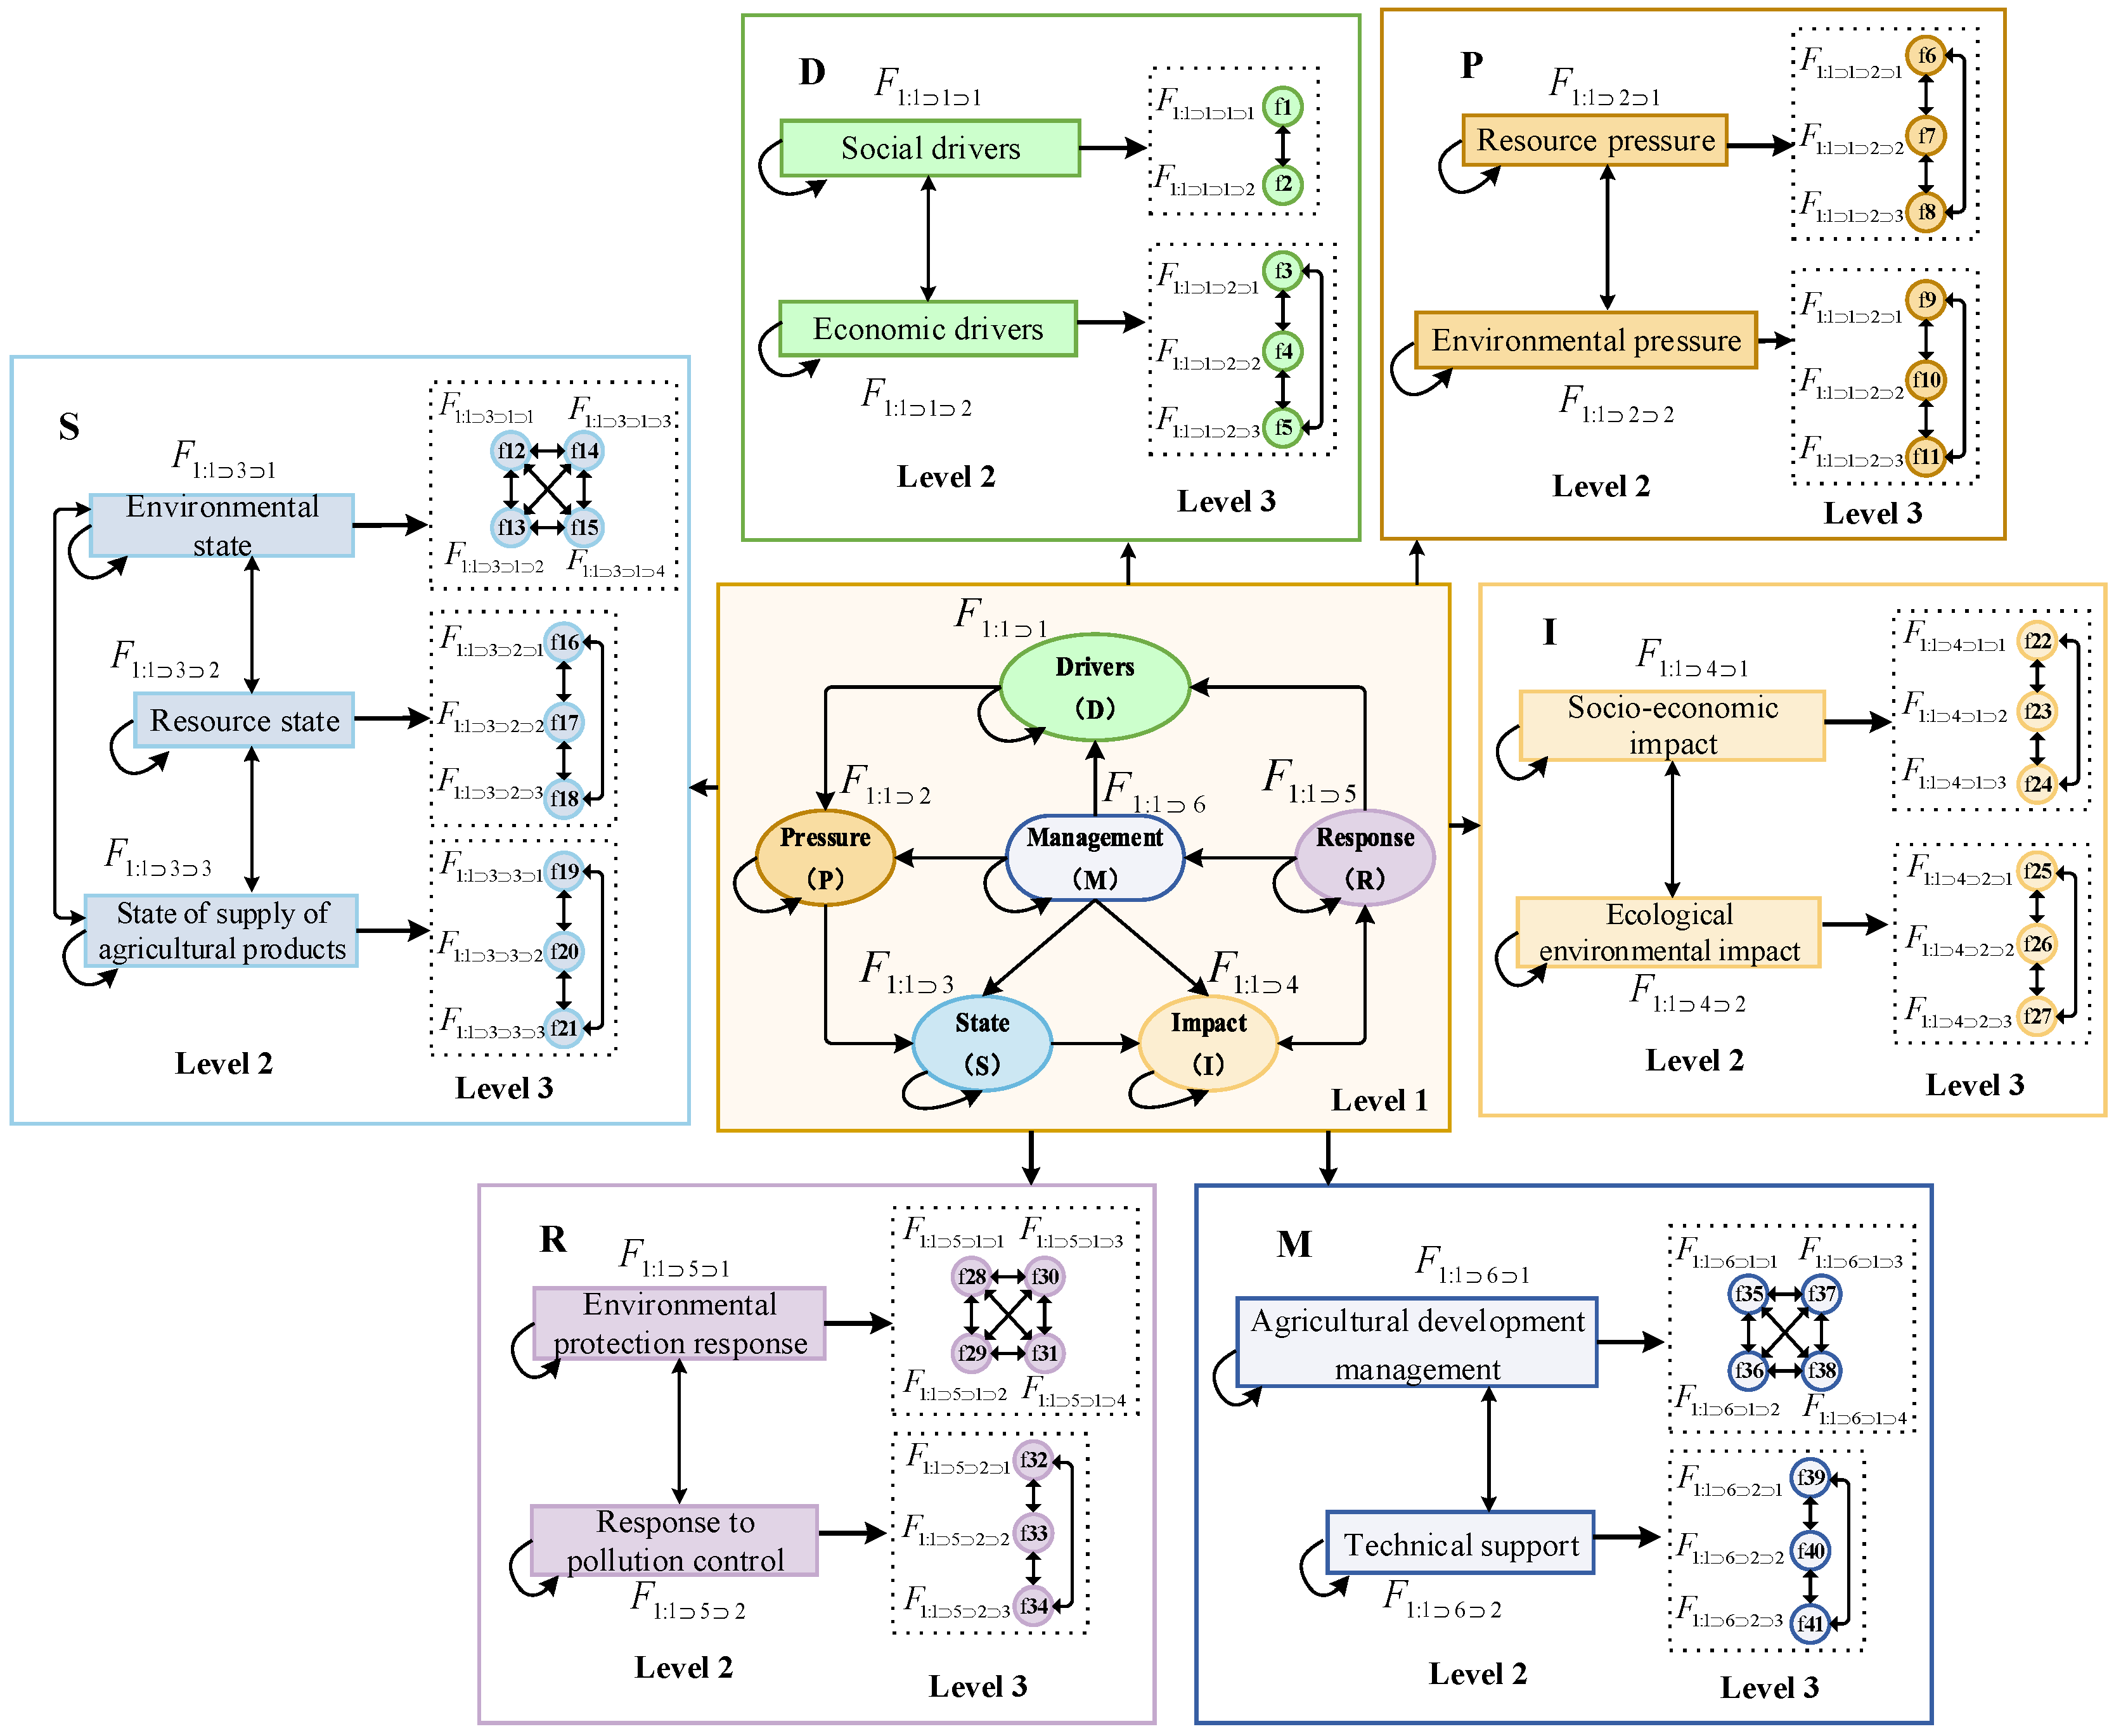

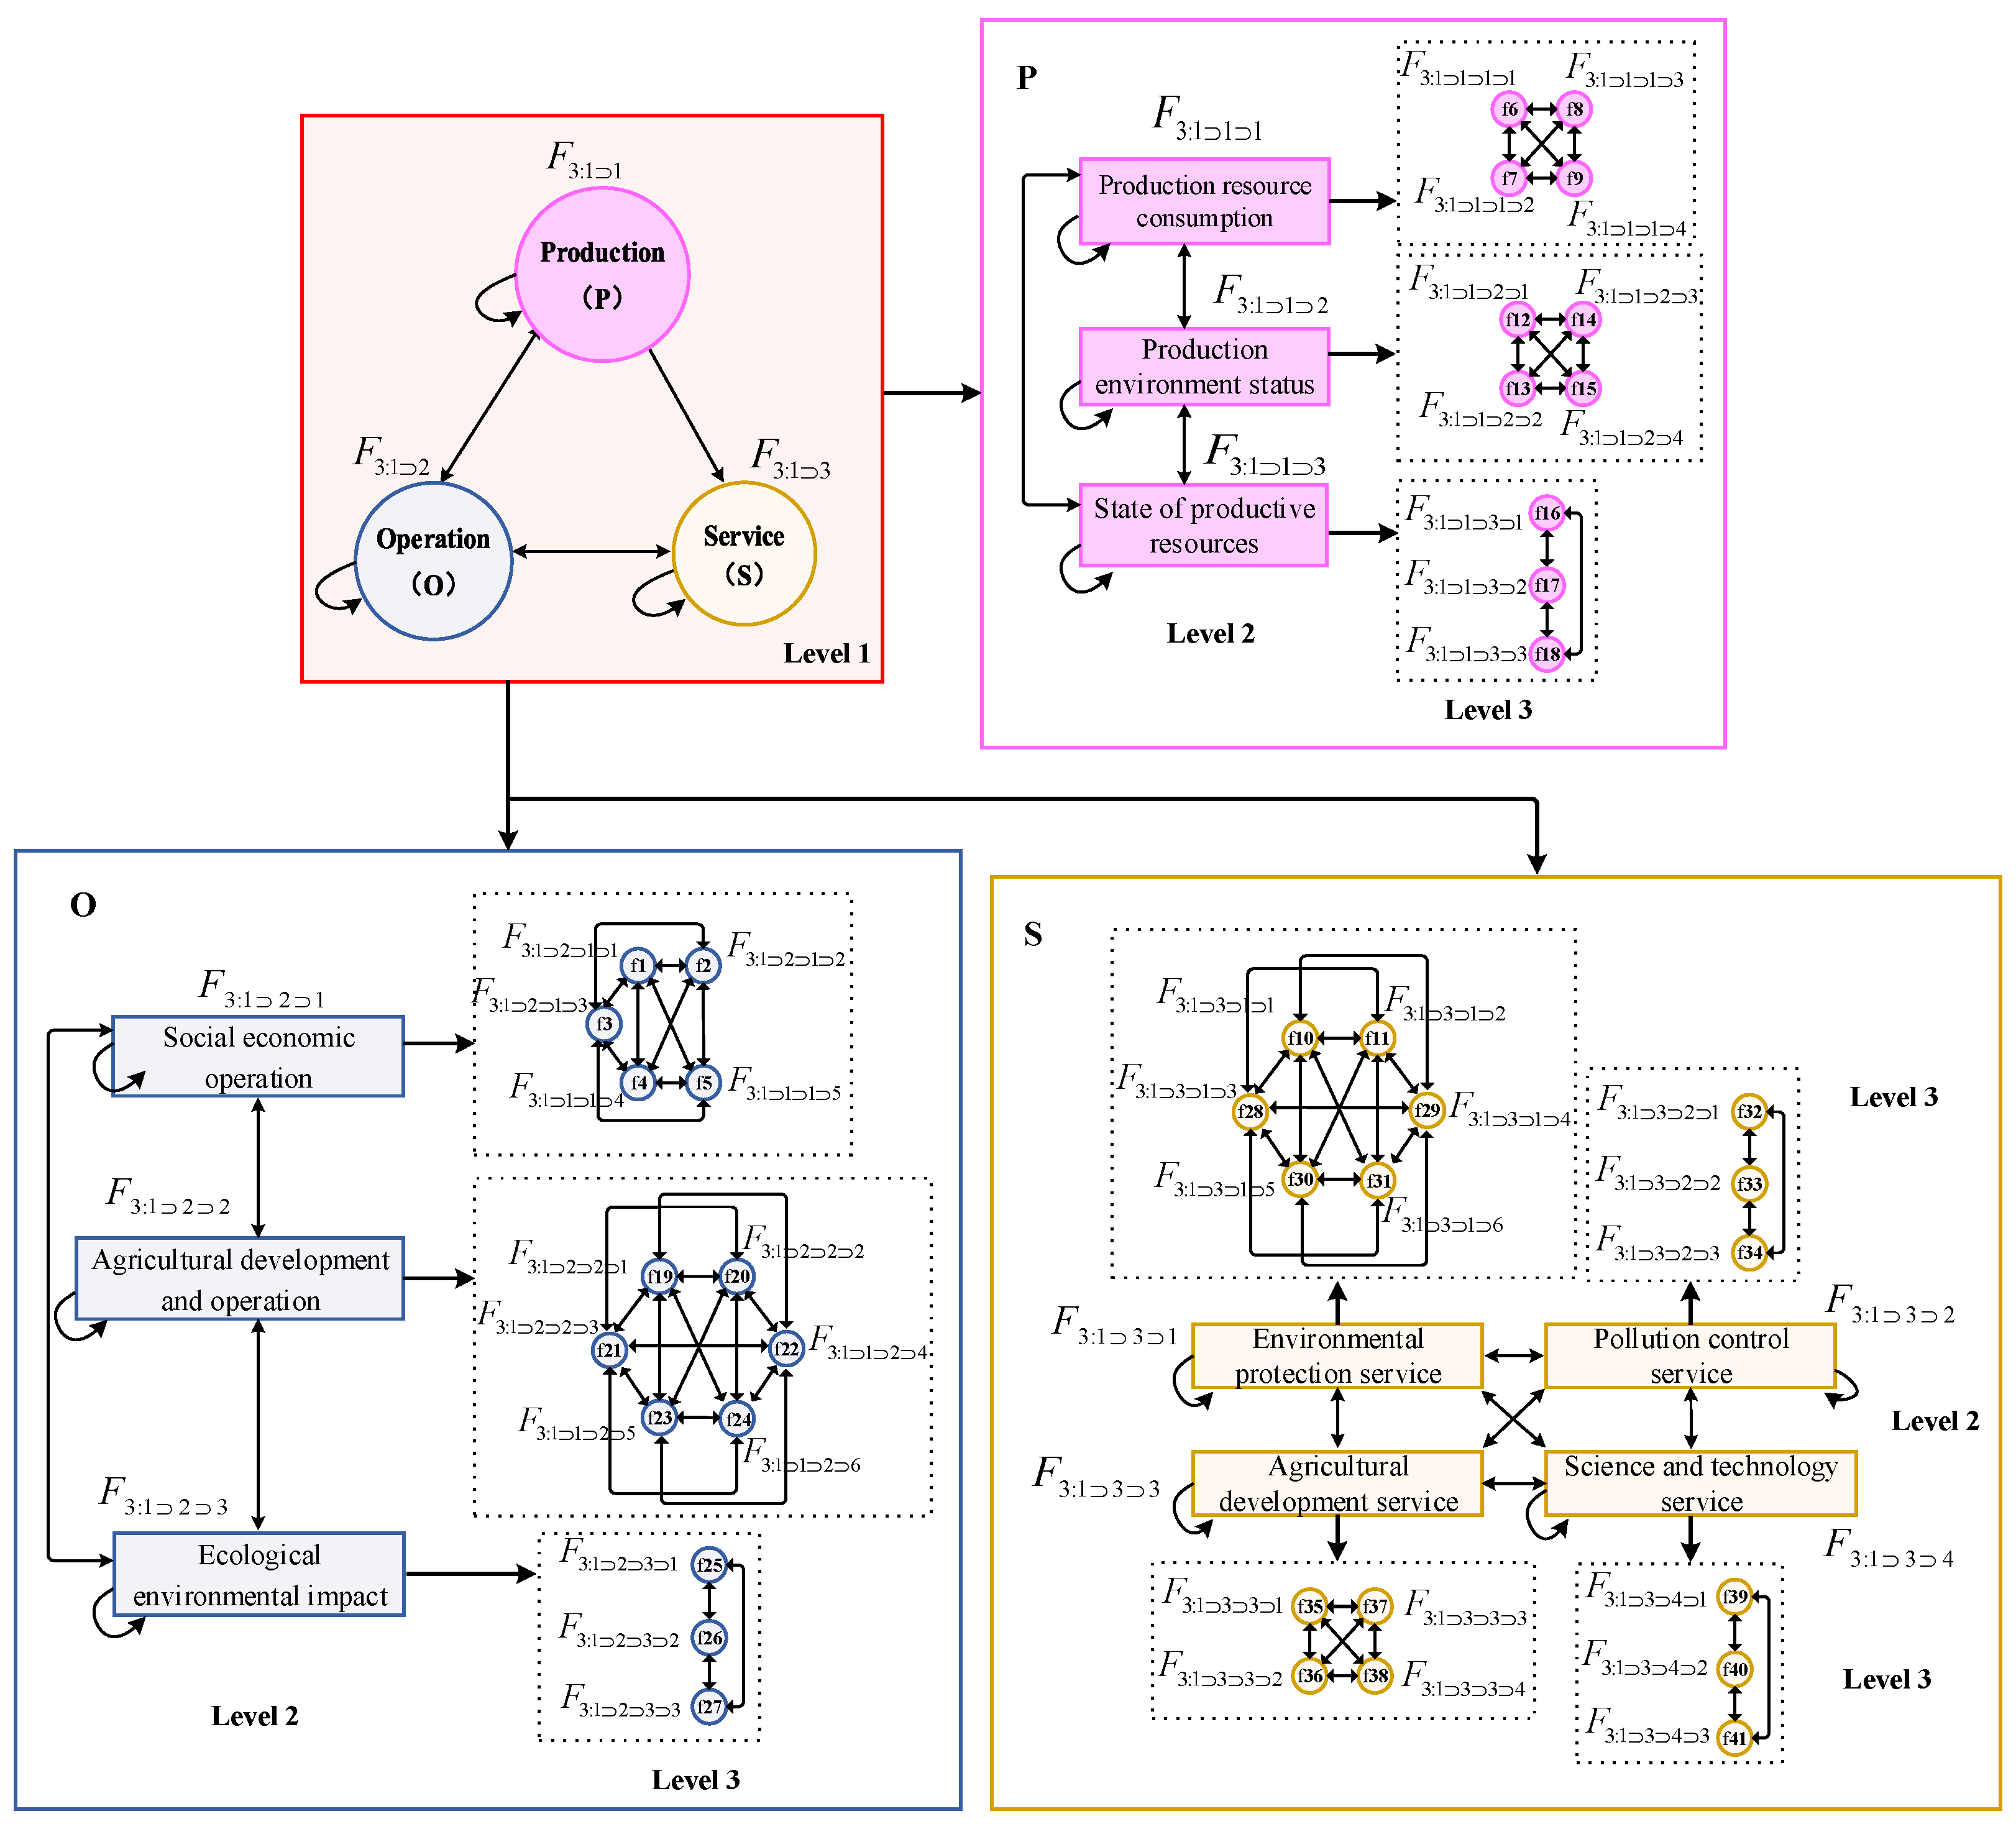

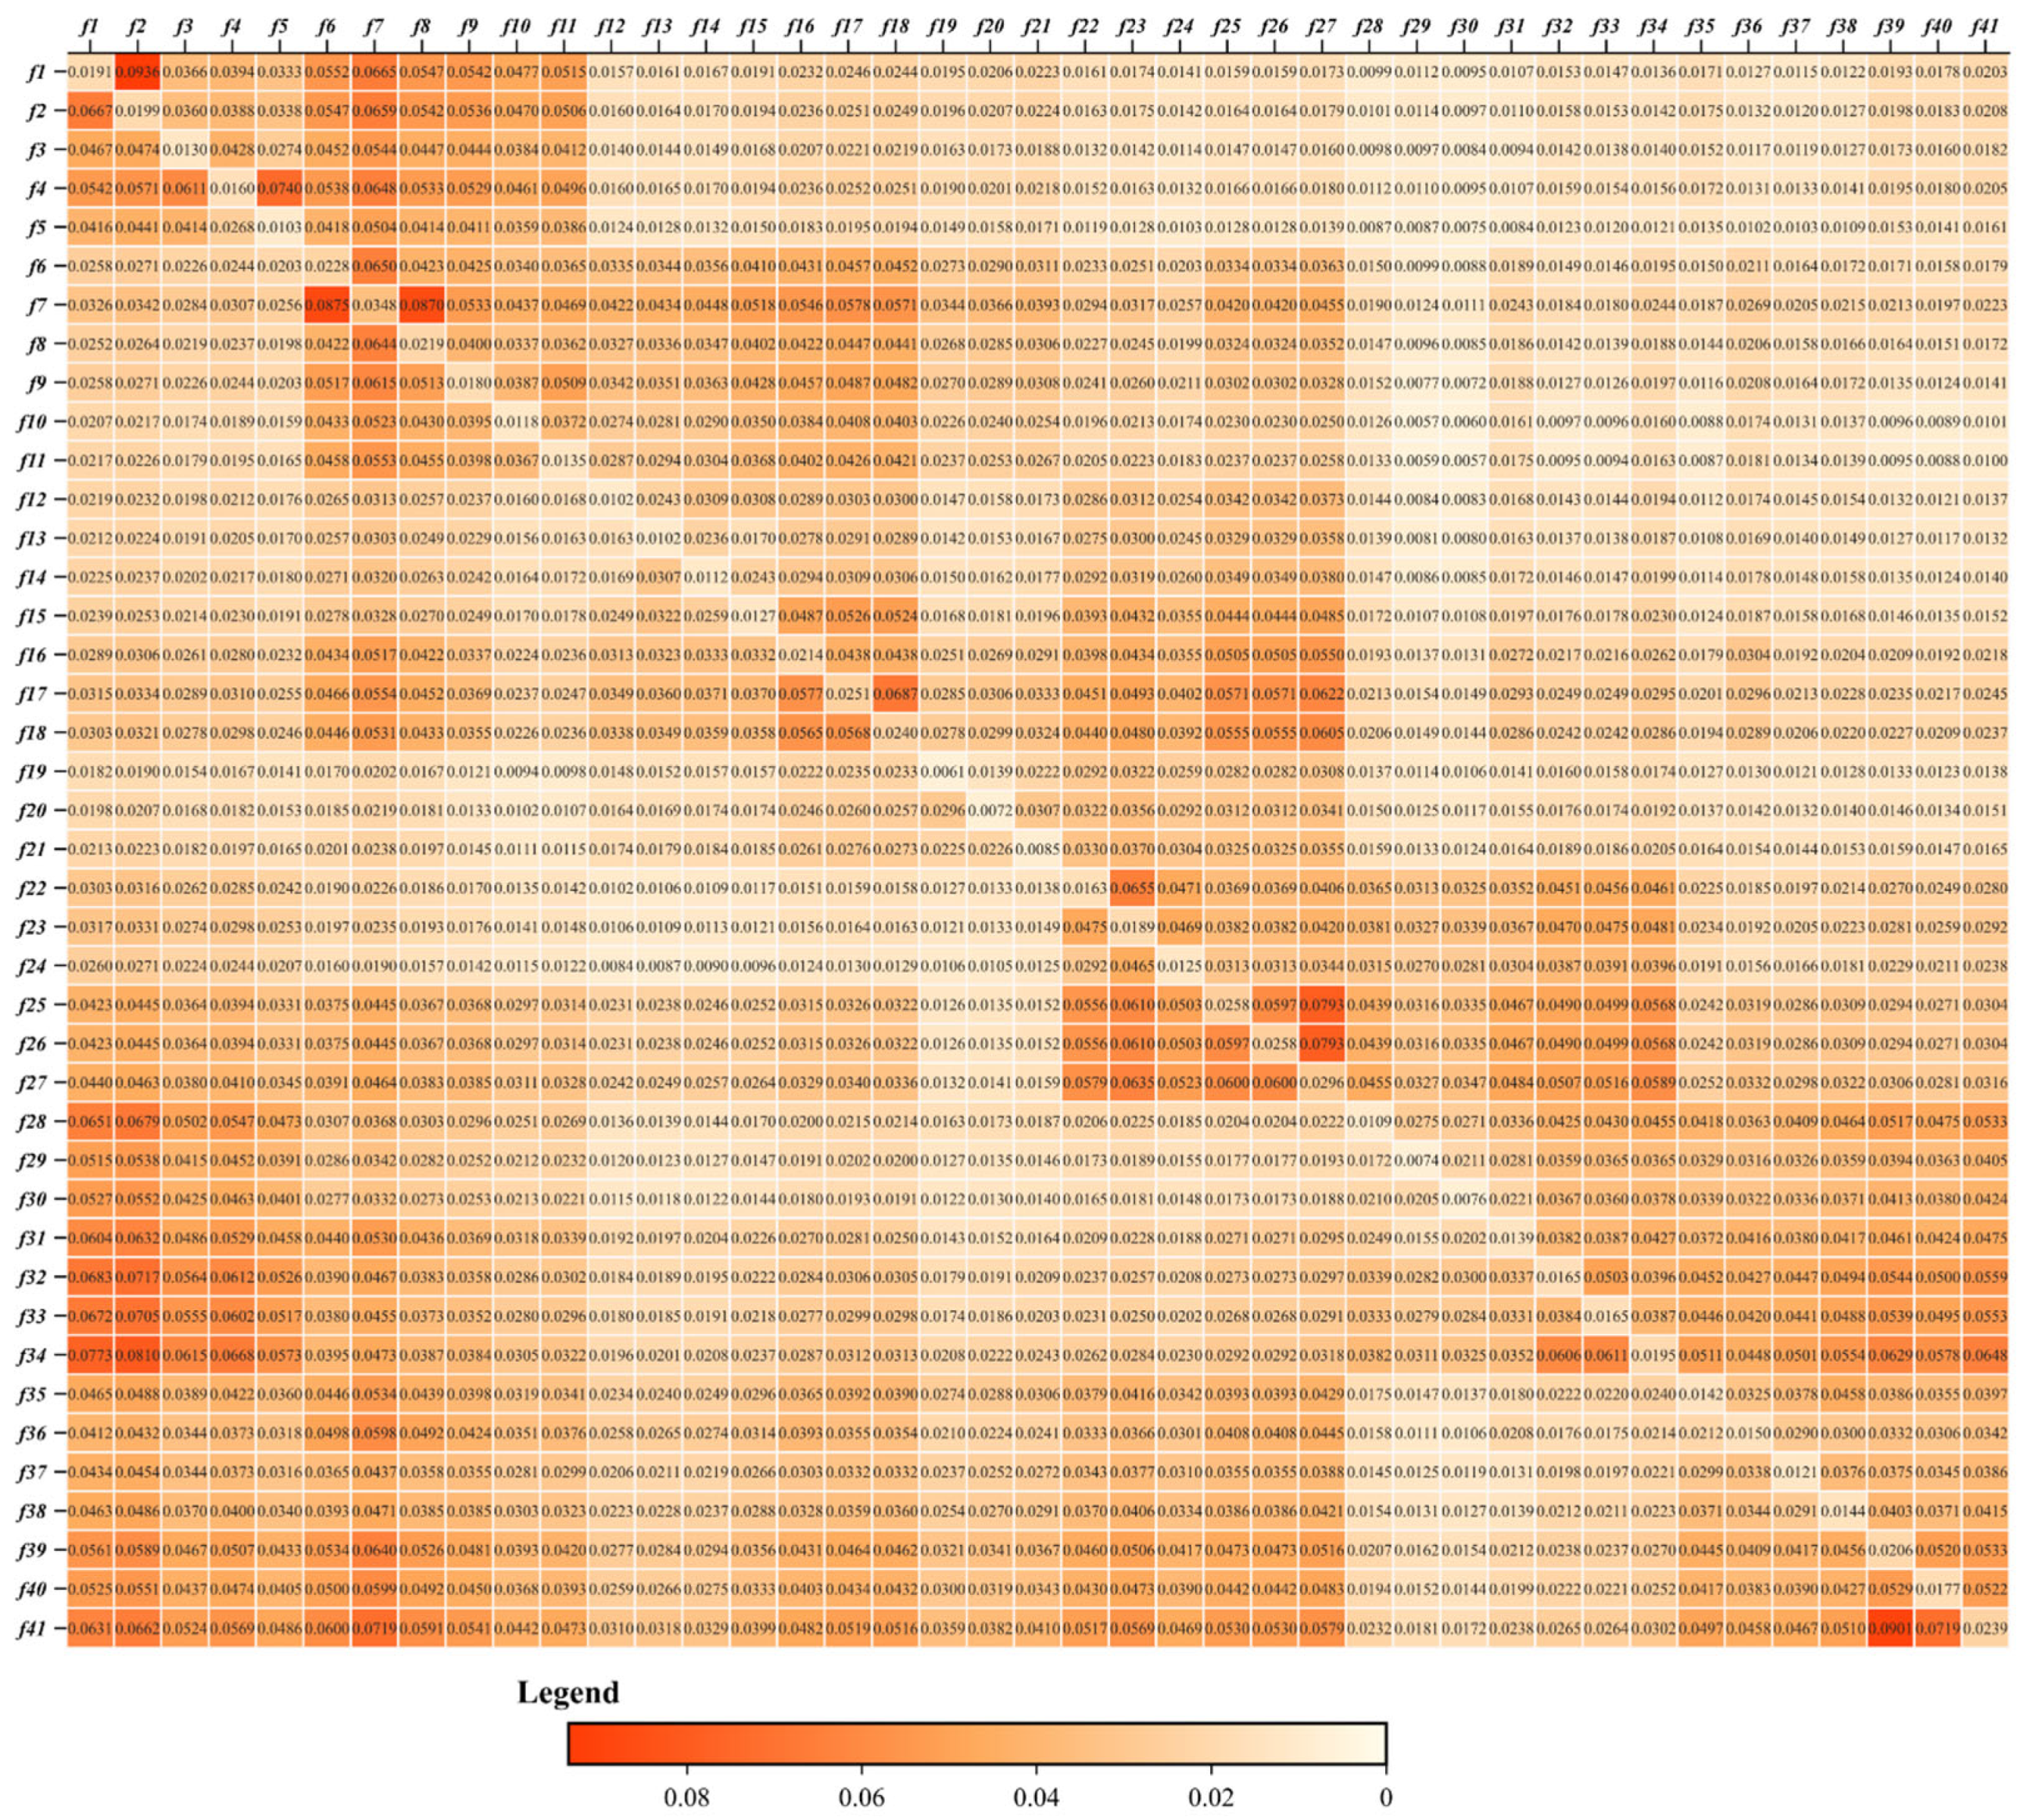
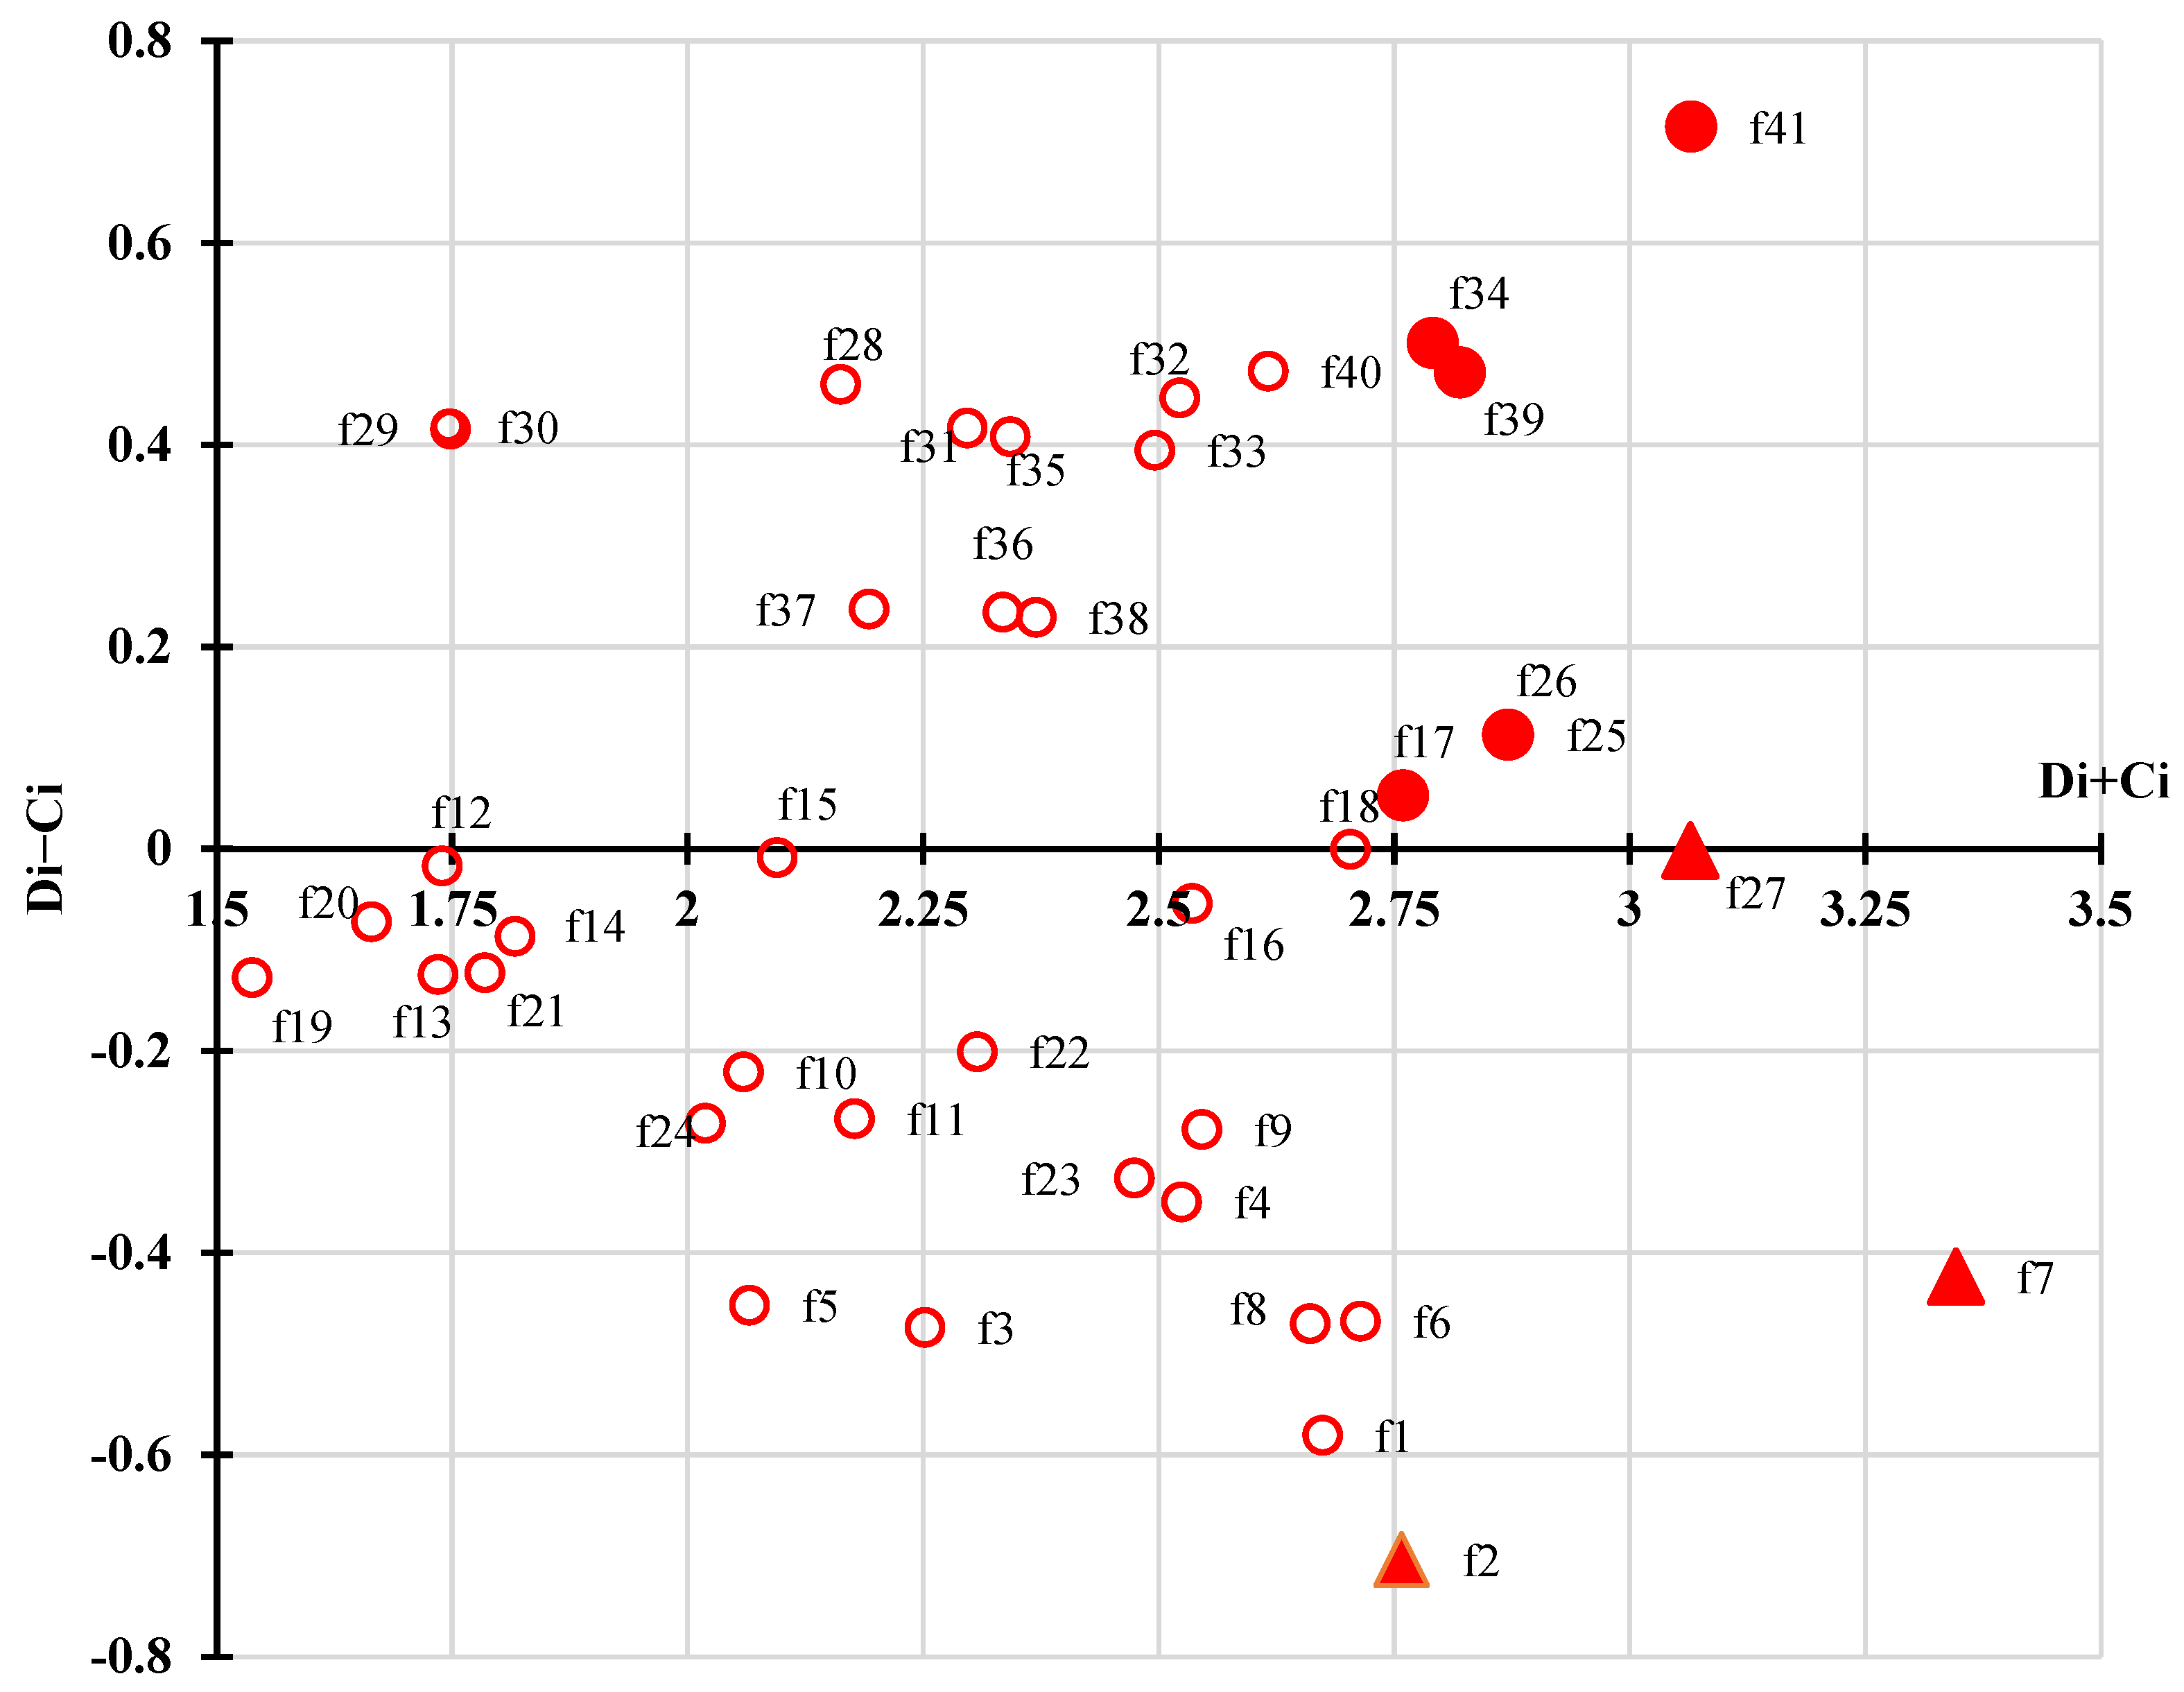
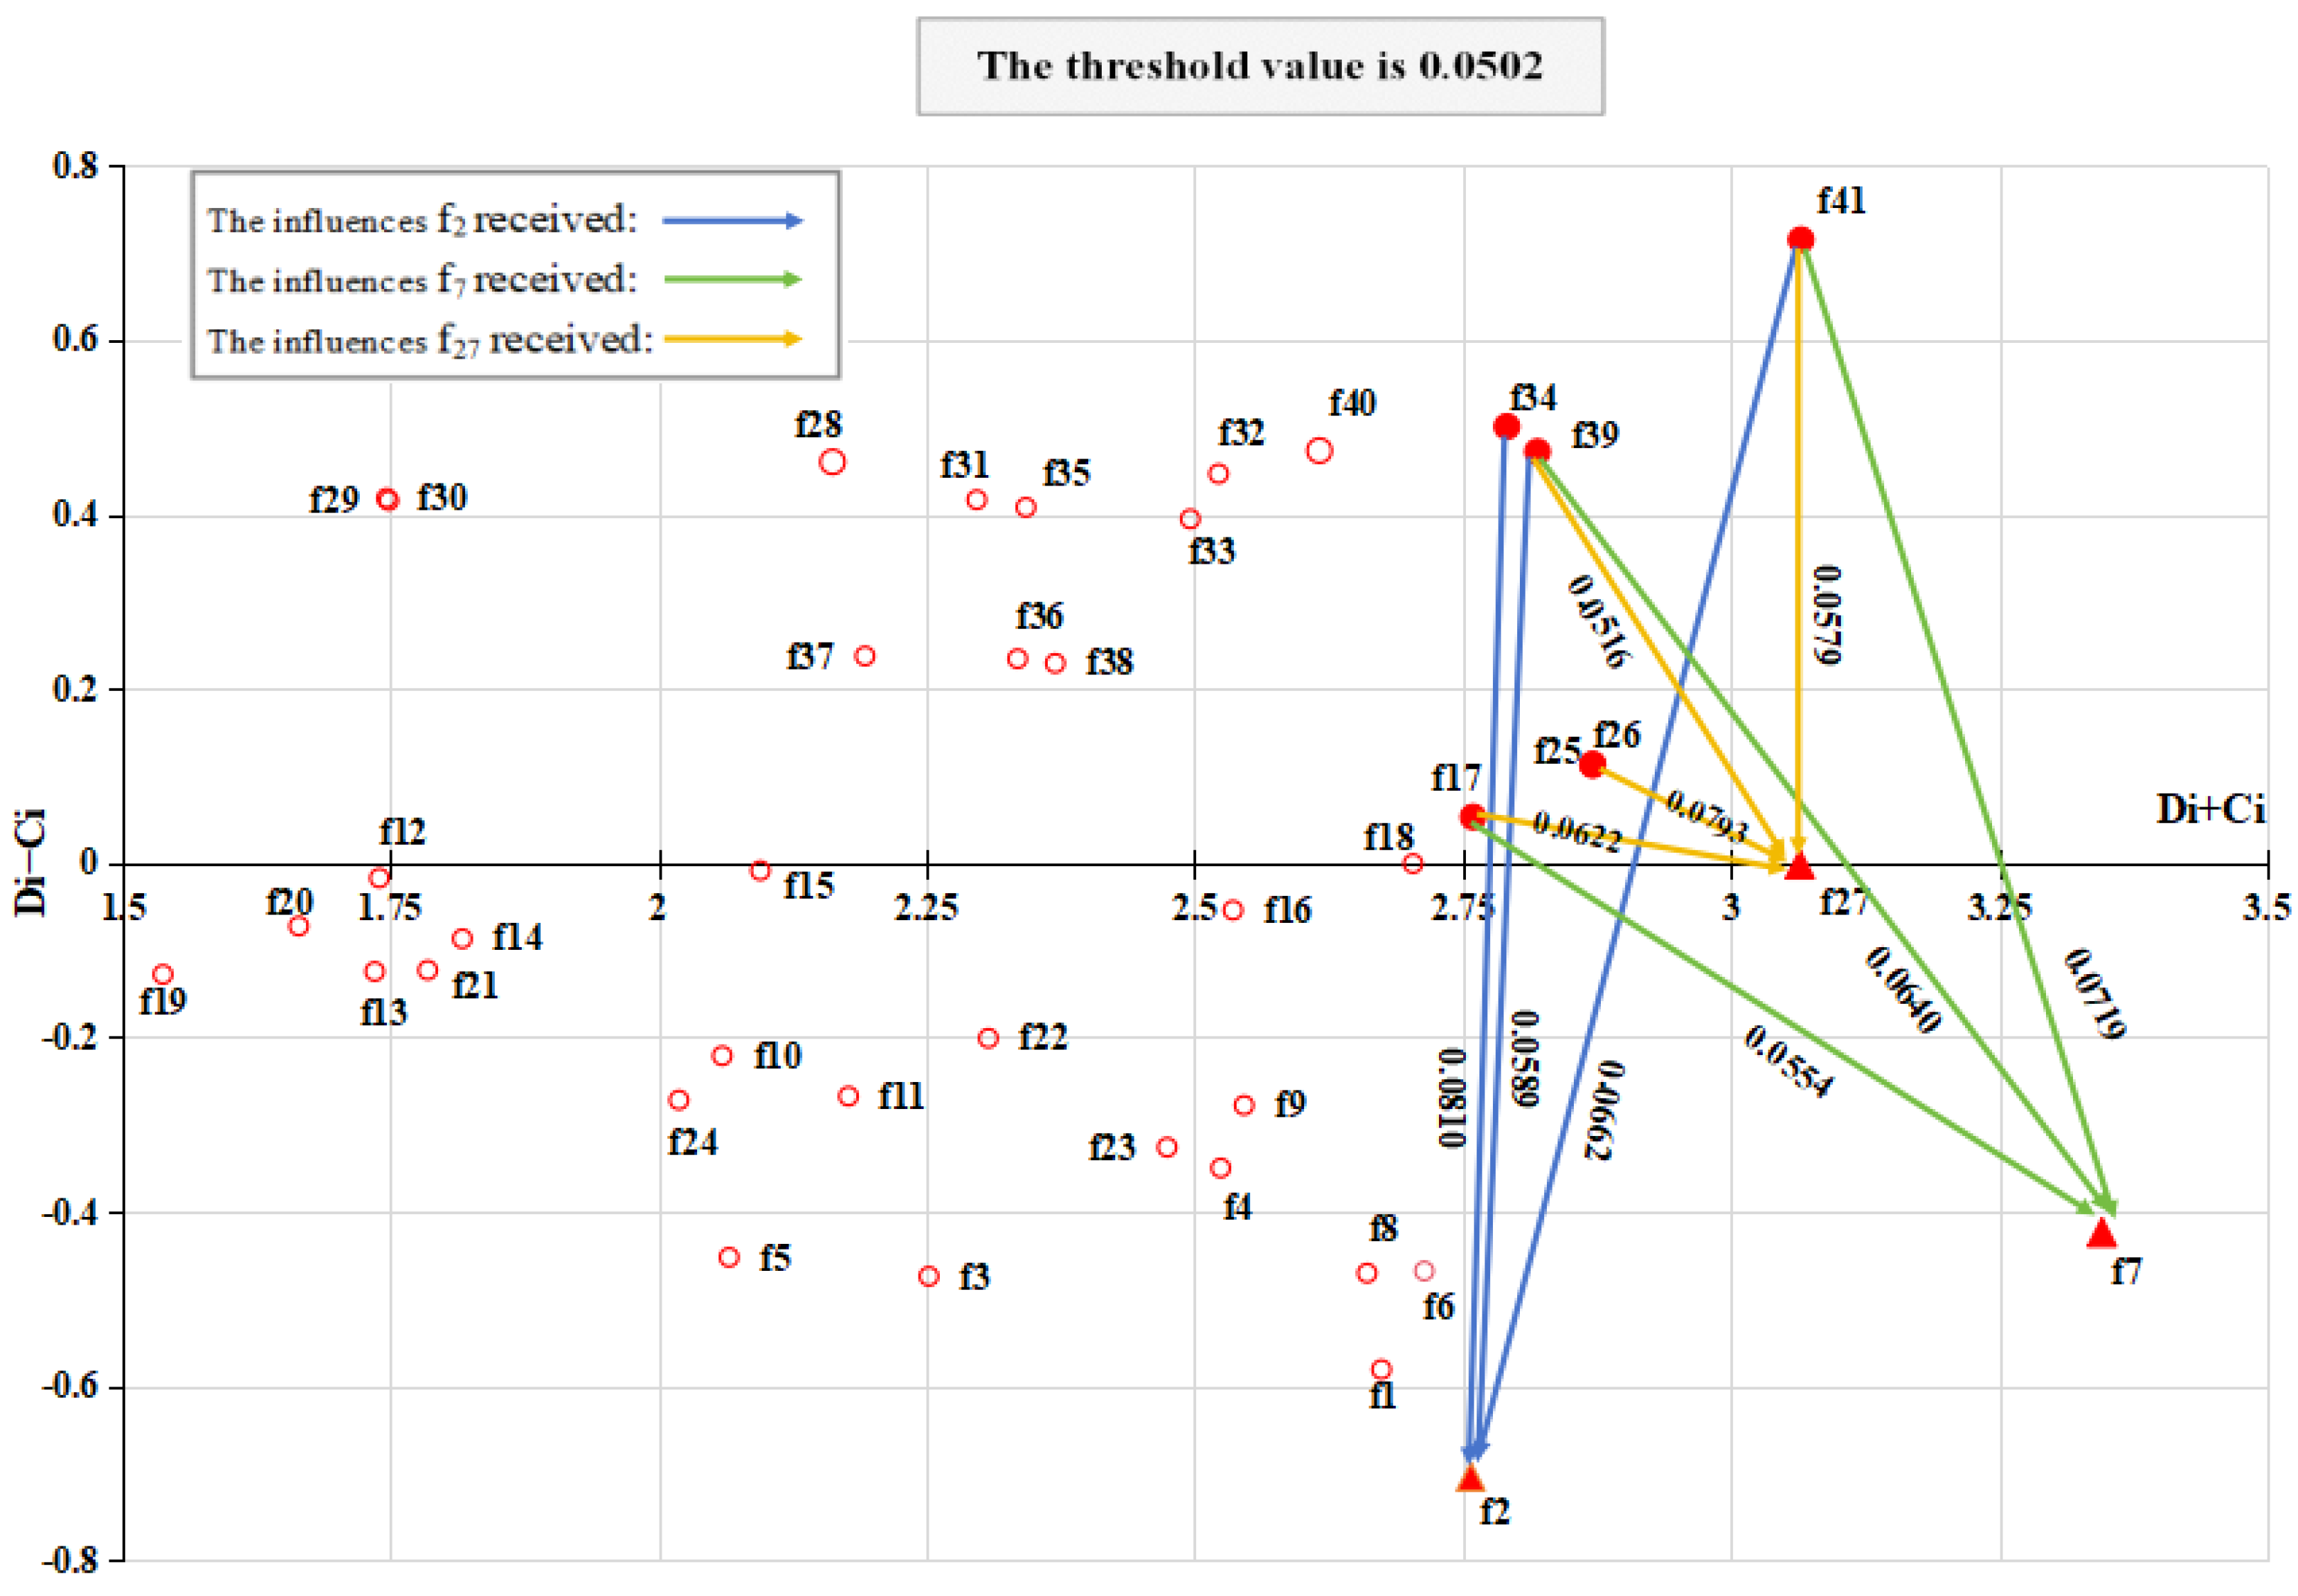
| Factors | Interpretation | Selection Basis | Reference |
|---|---|---|---|
| Natural population growth rate | Birth rate minus death rate. | Continued population growth has indeed boosted agricultural production. | [38] |
| Urbanization rate | Urban population divided by total population. | The process of urbanization can result in population loss, a decrease in arable land, and the wastage of land resources. | [46] |
| Per capita agricultural GDP | Agricultural GDP divided by the total population at year-end. | Per capita agricultural GDP represents the overall state of agricultural development. | [39] |
| Per capita arable land area | The ratio of total arable land area to population. | This indicator reflects the pressure on arable land resources, and a decrease in per capita arable land area will jeopardize agricultural security. | [38] |
| Per capita water resources | The ratio of total water resources to population. | This indicator reflects the pressure on water resources, and water scarcity has become one of the important factors constraining the sustainable development of the economy and society. | [40] |
| Ecological quality index | This index typically includes multiple ecological parameters and sub-indicators to comprehensively assess the quality of the ecosystem. | Quantify ecological quality with a numerical range typically from 0 to 100. Higher indices indicate better ecosystem quality, which is more conducive to agricultural production. | [41] |
| Biodiversity indices | The specific situation of the biodiversity index in agricultural production areas. | Protecting and enhancing biodiversity are crucial for achieving sustainable agricultural development. | [33] |
| Water pollution concentration | The concentration of pollutants in a unit volume of water. | This indicator reflects the current level of pollution in water resources. The concentration of water pollution directly affects water quality, which has a significant impact on agricultural production. | [47] |
| Overall compliance rate of routine monitoring | The compliance rate of agricultural products during routine national monitoring for agricultural product quality and safety. | Regular inspections of agricultural product quality and safety enable comprehensive, timely, and accurate understanding and monitoring of the status of agricultural product quality and safety. | [37] |
| The growth amount of agricultural product exports | The increase in the value of agricultural products exported from the domestic market to foreign countries compared to the previous year. | It reflects the development trends of domestic agriculture and the growth of international market demand, making it a positive economic indicator. | |
| Value added of agriculture and related industries | The proportion of value added created by agricultural and related industrial production activities to GDP in the current year. | It reflects the influence of plateau-characteristic agricultural development on social and economic development. | [42] |
| Soil erosion situation | The soil erosion rate in agricultural production areas for the current year. | Soil erosion is a form of land degradation that has serious impacts on agricultural production, ecological environment, and human well-being. | [43] |
| Vegetation degradation situation | The change in vegetation coverage rate in agricultural production areas compared to the previous year. | Plants serve as a crucial safeguard for agricultural ecological security, and a reduction in vegetation is unfavorable for agricultural development. | |
| Losses from anthropogenic or natural disasters | Losses incurred by natural disasters or man-made disasters at a certain stage. | Natural disasters or man-made disasters can cause significant losses to agricultural production and the agricultural ecological environment. | [33] |
| Policies related to environment and ecology | The proportion of policies related to agricultural environment and ecological safety to the total policies in the current year. | Environmental protection policies play a protective role in ensuring the ecological security of plateau-characteristic agriculture. | [44] |
| Degraded farmland management area | The area of degraded farmland effectively remediated. | Fertile soil is the most crucial resource in ecosystems; yet these resources are being lost at an alarming rate. | [36] |
| The intensity of investment in pollution control | The level of financial expenditure and resource allocation by governments and businesses in controlling and reducing environmental pollution. | This reflects the level of importance the government places on local pollution control, which is beneficial for the development of local agricultural ecological security. | [41] |
| The degree of high-quality farmland construction | The level at which local farmland construction meets high-standard requirements. | High-standard farmland represents the essence of agricultural arable land, serving as a core element in ensuring national food security and a crucial guarantee for promoting high-quality agricultural development. | [37] |
| Financial investment in agricultural special funds | Special funds invested by national and local governments in projects for the ecological protection of plateau-characteristic agriculture. | By increasing financial support for agriculture, we can ensure the sustainable and stable development of agricultural ecosystems. | [48] |
| Government subsidy | The amount of fiscal subsidies, tax incentives, and financial support provided by the government in the current year for agricultural ecological security and agricultural development. |
| Factors | Interpretation | Selection Basis | Reference |
|---|---|---|---|
| Demand for characteristic agricultural products | The demand situation for characteristic agricultural products in the current year. | The demand for characteristic agricultural products can be transformed into the drivers behind the production of these unique agricultural goods. | [41] |
| Profit margin | The ratio of profit to investment cost in industries related to plateau-characteristic agriculture. | To measure the profitability of enterprises related to plateau-characteristic agriculture. When these enterprises have higher economic benefits, they are motivated to continue developing. | [33] |
| Effective irrigation area index | The arable land area with adequate water sources, relatively flat terrain, and supporting irrigation infrastructure or equipment, capable of normal irrigation activities in the current year. | This indicator reflects the level of construction of local farmland water conservancy projects and other infrastructure. | [38] |
| Coverage rate of high-quality seeds for major crops | The proportion of cultivated crops using selectively bred high-quality varieties. | High-quality seeds typically possess characteristics such as high yield, good quality, and strong resistance, which are significant for increasing crop productivity and quality and ensuring food security. | [37] |
| Land reclamation rate | The proportion of arable land area at the end of the year to the total land area. | Arable land is a crucial foundation for agricultural production, and changes in arable land area directly affect national agricultural security. | [38] |
| Cultivated land quality class | The suitability of agricultural crops for arable land is categorized into 15 grades by the Ministry of Natural Resources based on their suitability and adaptability. | The grading of arable land quality is crucial for guiding agricultural production layout, alleviating resource and environmental pressures, and improving the quality and safety level of agricultural products. | [45] |
| Output of major agricultural products | The annual production volume of major agricultural products such as grains, meat, eggs, milk, vegetables, and fruits. | One of the key points of ecological security is to ensure that target crops achieve sufficient output. While emphasizing ecological environment, agricultural development should not be overlooked, and a balance between the two must be maintained. | [37] |
| Employment and resettlement situation of farmers | The employment and training of local farmers by enterprises related to plateau-characteristic agriculture. | The development of enterprises and industries related to plateau-characteristic agriculture can create numerous job opportunities, thereby increasing farmers’ income and enhancing their enthusiasm for production. | [49] |
| Comprehensive utilization rate of agricultural solid waste | The proportion of effective treatment and utilization of agricultural solid waste (such as livestock and poultry manure). | Improving the comprehensive utilization rate of agricultural solid waste is of great significance for promoting sustainable agricultural development, improving rural ecological environment, and increasing farmers’ income. | [50] |
| Wastewater treatment rate | The proportion of treated wastewater to the total volume of wastewater discharged. | Increasing the wastewater treatment rate not only helps to protect and improve agricultural ecological environments but also promotes sustainable agricultural development and enhances the well-being of farmers. | [51] |
| Leading agricultural industrialization enterprises | The proportion of leading enterprises identified as agricultural industrialization in the total number of agricultural enterprises. | Leading enterprises in agricultural industrialization are at the leading level in the same industry, and the more the number of leading enterprises in agricultural industrialization is identified, the better the agricultural development in the region. | [37] |
| Comprehensive mechanization rate of major crops | The proportion of mechanized operations in each stage of crop production, from cultivation to harvesting. | This indicator is typically used to measure the level of agricultural mechanization in a region or country, serving as one of the important indicators of agricultural modernization. | [40] |
| Factors | Interpretation | Selection Basis | Reference |
|---|---|---|---|
| Per capita labor input | Average annual labor hours per square kilometer of cultivated land. | It is an important indicator of the level of intensification in agricultural production, with higher inputs indicating lower levels of agricultural mechanization. | [38] |
| Consumption of agricultural plastic film per unit of arable land | The ratio of agricultural plastic film usage to arable land area. | Plastic mulch, being non-biodegradable and erosion-resistant polymer compounds, leaves significant residues that not only affect soil quality but also have adverse effects on agricultural ecological environments. | [40] |
| Utilization rate of fertilizers for major crops | The extent to which fertilizers are absorbed and utilized by crops during the production process. | This reflects the utilization rate of fertilizers. Increasing fertilizer utilization can reduce excessive use, lower agricultural production costs, and minimize environmental pollution. | [37] |
| Pesticide utilization rate of main crops | The degree to which pesticides applied during crop production are absorbed and utilized by the crops. | Long-term extensive use of pesticides can lead to pesticide residues in the soil, groundwater contamination, reduced crop quality, and adverse effects on arable land and agricultural ecological security. | |
| “Three products and one standard” agricultural products | Refers to the number of agricultural products certified as pollution-free, green, organic, or geographical indication during the year. | It reflects the ecological level of agricultural production and brand value and is an important indicator of the effectiveness of green development. | |
| Utilization of clean technology | Proportion of agricultural enterprises using clean technology in agricultural production. | The widespread use of clean technology can significantly reduce pollution during the production process. | [34] |
| Comprehensive utilization rate of crop straw | The proportion of crop straw that is reasonably utilized through various means after harvest. | This indicator reflects the level of resource utilization of agricultural waste and is an important measure for promoting sustainable agricultural development and a circular economy. | [37] |
| Agricultural science and technology personnel | Ratio of the number of agricultural science and technology personnel to the total number of agricultural workers. | The new technologies and varieties developed by scientific and technological personnel are crucial for agricultural development. | [42] |
| Intensity of agricultural R&D investment | Proportion of agricultural research and development investment funds to GDP. | This indicator is crucial for measuring the importance that a country or region places on agricultural science and technology innovation. It reflects the strategic position of agricultural science and technology in economic development. |
| ID | Factor | ID | Factor |
|---|---|---|---|
| f1 | Natural population growth rate | f22 | The growth amount of agricultural product exports |
| f2 | Urbanization rate | f23 | Value added of agriculture and related industries |
| f3 | Per capita agricultural GDP | f24 | Employment and resettlement situation of farmers |
| f4 | Demand for characteristic agricultural products | f25 | Soil erosion situation |
| f5 | Profit margin | f26 | Vegetation degradation situation |
| f6 | Per capita labor input | f27 | losses from anthropogenic or natural disasters |
| f7 | Per capita arable land area | f28 | Policies related to environment and ecology |
| f8 | Per capita water resources | f29 | Utilization of clean technology |
| f9 | Consumption of agricultural plastic film per unit of arable land | f30 | Comprehensive utilization rate of crop straw |
| f10 | Utilization rate of fertilizers for major crops | f31 | Degraded farmland management area |
| f11 | Pesticide utilization rate of main crops | f32 | Comprehensive utilization rate of agricultural solid waste |
| f12 | Ecological quality index | f33 | Wastewater treatment rate |
| f13 | Effective irrigation area index | f34 | The intensity of investment in pollution control |
| f14 | Coverage rate of high-quality seeds for major crops | f35 | Leading agricultural industrialization enterprises |
| f15 | land reclamation rate | f36 | The degree of high-quality farmland construction |
| f16 | Cultivated land quality class | f37 | Financial investment in agricultural special funds |
| f17 | Biodiversity indices | f38 | Government subsidy |
| f18 | Water pollution concentration | f39 | Comprehensive mechanization rate of major crops |
| f19 | Overall compliance rate of routine monitoring | f40 | Agricultural science and technology personnel |
| f20 | “Three products and one standard” agricultural products | f41 | Intensity of agricultural R&D investment |
| f21 | Output of major agricultural products | - | - |
| Subsystem | Factor | di | ci | ||||
|---|---|---|---|---|---|---|---|
| 2.0000 | 3.0000 | - | 5.0000 | 4.0000 | 9.0000 | ||
| 2.0000 | 2.0000 | - | 4.0000 | 5.0000 | 9.0000 | ||
| 0.3125 | 0.4375 | 0.4375 | 1.1875 | 1.6542 | 2.8417 | ||
| 0.8458 | 0.3708 | 0.9042 | 2.1208 | 1.1292 | 3.2500 | ||
| 0.4958 | 0.3208 | 0.2542 | 1.0708 | 1.5958 | 2.6667 |
| Factor | di + ci | Ranking | di- − ci | Factor Type | Factor | di + ci | Ranking | di- − ci | Factor Type |
|---|---|---|---|---|---|---|---|---|---|
| f1 | 2.6742 | 12 | −0.5807 | result factor | f22 | 2.3075 | 24 | −0.2008 | result factor |
| f2 | 2.7576 | 9 | −0.7036 | result factor | f23 | 2.4743 | 20 | −0.3258 | result factor |
| f3 | 2.2520 | 26 | −0.4738 | result factor | f24 | 2.0189 | 33 | −0.2717 | result factor |
| f4 | 2.5243 | 17 | −0.3496 | result factor | f25 | 2.8712 | 4 | 0.1130 | cause factor |
| f5 | 2.0657 | 31 | −0.4520 | result factor | f26 | 2.8712 | 4 | 0.1130 | cause factor |
| f6 | 2.7141 | 10 | −0.4677 | result factor | f27 | 3.0644 | 3 | −0.0015 | result factor |
| f7 | 3.3462 | 1 | −0.4235 | result factor | f28 | 2.1622 | 29 | 0.4601 | cause factor |
| f8 | 2.6608 | 13 | −0.4701 | result factor | f29 | 1.7482 | 36 | 0.4158 | cause factor |
| f9 | 2.5460 | 15 | −0.2777 | result factor | f30 | 1.7461 | 37 | 0.4184 | cause factor |
| f10 | 2.0593 | 32 | −0.2210 | result factor | f31 | 2.2967 | 25 | 0.4167 | cause factor |
| f11 | 2.1770 | 28 | −0.2673 | result factor | f32 | 2.5223 | 18 | 0.4465 | cause factor |
| f12 | 1.7395 | 38 | −0.0171 | result factor | f33 | 2.4958 | 19 | 0.3946 | cause factor |
| f13 | 1.7351 | 39 | −0.1243 | result factor | f34 | 2.7912 | 7 | 0.5007 | cause factor |
| f14 | 1.8169 | 34 | −0.0867 | result factor | f35 | 2.3425 | 22 | 0.4080 | cause factor |
| f15 | 2.0948 | 30 | −0.0086 | result factor | f36 | 2.3348 | 23 | 0.2344 | cause factor |
| f16 | 2.5357 | 16 | −0.0540 | result factor | f37 | 2.1925 | 27 | 0.2375 | cause factor |
| f17 | 2.7596 | 8 | 0.0529 | cause factor | f38 | 2.3699 | 21 | 0.2291 | cause factor |
| f18 | 2.7036 | 11 | −0.0005 | result factor | f39 | 2.8197 | 6 | 0.4718 | cause factor |
| f19 | 1.5376 | 41 | −0.1276 | result factor | f40 | 2.6163 | 14 | 0.4730 | cause factor |
| f20 | 1.6643 | 40 | −0.0722 | result factor | f41 | 3.0655 | 2 | 0.7149 | cause factor |
| f21 | 1.7846 | 35 | −0.1227 | result factor | - | - | - | - | - |
| Subsystems | A (Seven) | B (Eight) | C (Nine) | D (Ten) |
|---|---|---|---|---|
| D | 0 | 0 | 1 (f2) | 1 |
| P | 1 (f7) | 1 | 1 | 2 (f6, f7) |
| S | 1 (f17) | 1 | 1 | 1 |
| I | 3 (f25, f26, f27) | 3 | 3 | 3 |
| R | 0 | 1 (f34) | 1 | 1 |
| M | 2 (f39, f41) | 2 | 2 | 2 |
Disclaimer/Publisher’s Note: The statements, opinions and data contained in all publications are solely those of the individual author(s) and contributor(s) and not of MDPI and/or the editor(s). MDPI and/or the editor(s) disclaim responsibility for any injury to people or property resulting from any ideas, methods, instructions or products referred to in the content. |
© 2025 by the authors. Licensee MDPI, Basel, Switzerland. This article is an open access article distributed under the terms and conditions of the Creative Commons Attribution (CC BY) license (https://creativecommons.org/licenses/by/4.0/).
Share and Cite
Du, Y.-W.; Shang, Y.-X.; Li, C.-H. Hierarchical DEMATEL-DTP Method for Identifying Key Factors Affecting Plateau-Characteristic Agroecological Security. Sustainability 2025, 17, 5286. https://doi.org/10.3390/su17125286
Du Y-W, Shang Y-X, Li C-H. Hierarchical DEMATEL-DTP Method for Identifying Key Factors Affecting Plateau-Characteristic Agroecological Security. Sustainability. 2025; 17(12):5286. https://doi.org/10.3390/su17125286
Chicago/Turabian StyleDu, Yuan-Wei, Yu-Xiang Shang, and Chun-Hao Li. 2025. "Hierarchical DEMATEL-DTP Method for Identifying Key Factors Affecting Plateau-Characteristic Agroecological Security" Sustainability 17, no. 12: 5286. https://doi.org/10.3390/su17125286
APA StyleDu, Y.-W., Shang, Y.-X., & Li, C.-H. (2025). Hierarchical DEMATEL-DTP Method for Identifying Key Factors Affecting Plateau-Characteristic Agroecological Security. Sustainability, 17(12), 5286. https://doi.org/10.3390/su17125286