1. Introduction
Modern transmission and distribution systems depend on complex control architectures to ensure the efficient, reliable, and secure delivery of electrical energy. Moreover, the transition from centralized architectures to decentralized models, driven by the rise of energy communities, amplifies the need for real-time, time-synchronized, and distributed measurement systems [
1]. Within this framework, the accurate measurement of the voltage and current is essential for maintaining grid stability [
2]. In this context, Phasor Measurement Units (PMUs) have become indispensable tools, enabling real-time acquisition of synchronized phasor data that support a range of advanced applications, from grid monitoring to dynamic protection and control [
3].
By enabling the precise analysis of power flows, particularly in the presence of variable and distributed renewable energy sources, PMUs are particularly valuable for the integration of green generation, reduce energy losses, and enhance the reliability of smart grids [
4,
5]. These features are fully aligned with the Sustainable Development Goal (SDG) 7 (Affordable and Clean Energy) of Agenda 2030 [
6,
7,
8].
Extending PMU deployment to the distribution level enhances observability where it is typically limited, encouraging innovation in infrastructure and digitalization [
9]. This direction supports SDG 9 (Industry, Innovation, and Infrastructure), by fostering resilient and smart energy networks [
10,
11,
12].
Furthermore, the integration of synchronized measurement systems plays a fundamental role in enabling real-time control and efficient coordination of distributed resources, including energy storage systems and electric vehicle charging infrastructures [
13,
14].
Recent developments emphasize the strategic role of distribution-level PMUs in enhancing situational awareness for islanding detection and microgrid reliability [
15].
Despite these benefits, the diffusion of PMUs in distribution grids has been significantly slowed by a number of technical and economic barriers [
16,
17]. Chief among these is the high cost of instrumentation [
18], which is often difficult to justify given the greater number of nodes and the lower power levels typically involved in distribution systems compared with transmission networks [
19,
20]. Additionally, the more dynamic nature of distribution systems, which is characterized by frequent disturbances and topological changes, complicates the effective use of PMU-based solutions in such environments.
Disturbances in distribution grids can manifest in various forms [
21,
22], including short circuits, faults, and changes in generation or load. Often occurring simultaneously, the ability to capture and interpret these phenomena accurately is essential to prevent misdiagnosis and to support data-driven decision making [
23]. For instance [
24,
25], a line trip may coincide with a load reduction or automatic grid reconfiguration following a loss of generation. Instead, Ref. [
26] investigated the use of PMUs to assess the health conditions of grids through laboratory experiments on transformer aging and insulation contamination. Reference [
27] presents an improved method for fault detection and localization based on synchronized measurements. Reference [
28] demonstrates an event detection method in distribution systems using micro-PMU measurements, while [
29] introduces a method for detecting line parameters in distribution grids using PMUs.
Continuous changes in the generator, loads, and other key operating parameters can induce a wide array of disturbances, including harmonics, interharmonics, transients, and power oscillations (see
Figure 1).
It is crucial to discern which of the aforementioned phenomena impact the measurement of synchrophasors, frequency, and ROCOF [
30].
While high-frequency noise (e.g., from lightning strikes) can typically be filtered, other disturbances fall within a PMU’s operating bandwidth, introducing distortions or phase discontinuities [
31]. Harmonics and interharmonics, for example, manifest as disturbances within the PMU input band. Moreover, transient conditions generated by faults and switching operations induce abrupt changes in magnitude and/or phase angle, necessitating rapid tracking by PMUs [
32]. However, due to the inherent high-frequency content of such dynamics, PMUs experience transients during which measurements may contain outliers devoid of physical significance. These effects challenge both the estimation algorithms and the interpretation of real-time data [
33].
This paper proposes a structured framework to assess PMU performance in such conditions.
Section 2 outlines the methodology adopted in this study, beginning with a description of the simulated distribution grid and the simplification criteria applied to model its behavior. The section then details the testing procedure carried out and the approach used to extract voltage waveforms for evaluation using PMUs. Furthermore, the section presents the data processing methods used to assess PMU measurement performance, including the calculation of measurement errors and quality indices.
Section 3 presents experimental findings derived from measurements conducted in accordance with the established framework. The results offer insights into measurement reliability and the applicability of standard performance indices under dynamic conditions that reflect real-world grid behavior.
2. Methodology
This section describes the methodology adopted to evaluate the performance of a real PMU under realistic distribution grid conditions. The analysis is structured into three parts. First, the simulated distribution grid used for testing is introduced, along with the simplification criteria applied to model its electrical behavior. Then, the testing procedure is presented, including the configuration of the experimental setup and the techniques adopted for waveform acquisition. Finally, the methods used for data processing and the evaluation of measurement accuracy are detailed, with a focus on the standardized performance indices.
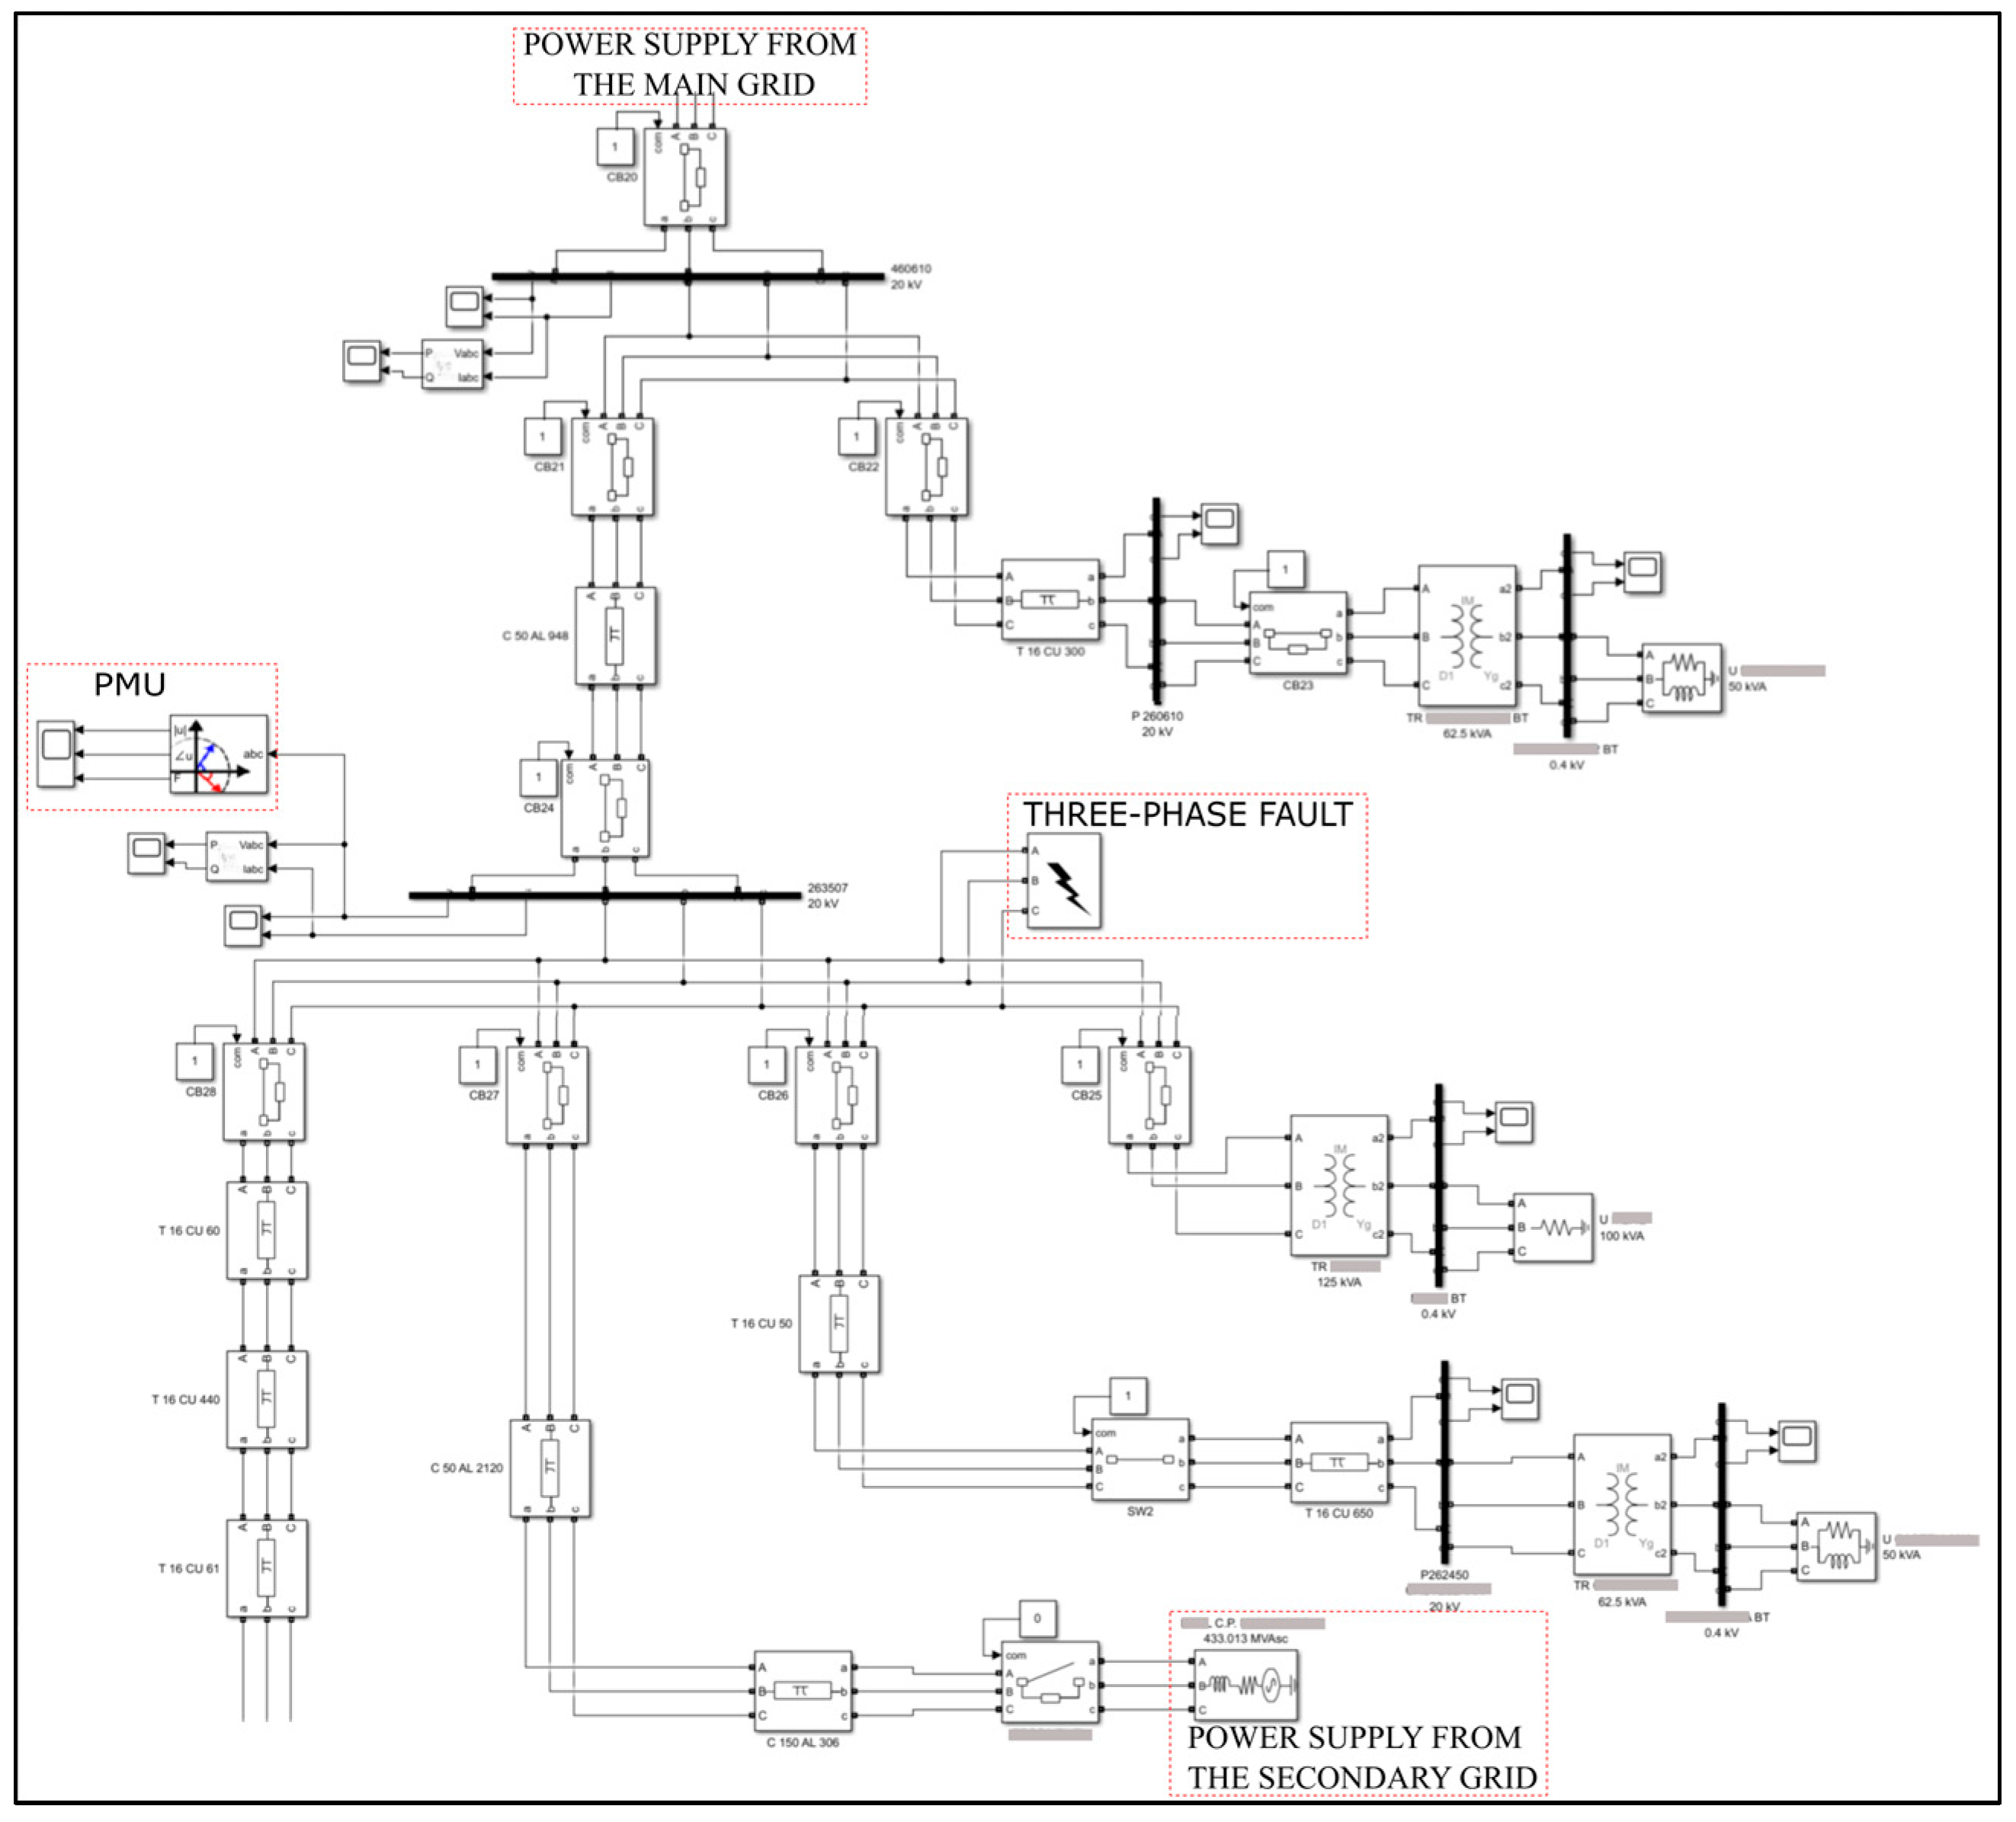
2.1. Simulated Distribution Grid
To conduct realistic testing of the PMU, a segment of the distribution grid belonging to a small municipal utility was selected, leveraging data from previous research conducted by the Electrical Engineering laboratory of the University of L’Aquila. This grid holds particular significance for testing purposes due to its distinct features: integration of a photovoltaic field into the MV grid, presence of two distinct branches stemming from an MV busbar, various LV loads supplied by commonly used distribution transformers, and a connection point to a primary substation (with lower short-circuit power compared to the main substation), enabling a counter-supply in the event of breakdowns or operational requirements.
Using ETAP software 20.5, a real grid project was reproduced to assess steady-state operating conditions, calculate line parameters, and identify grid components. In this way, it was assessed that the lumped parameter model accurately reflected the operation of the reproduced grid. Subsequently, a Simulink model was developed utilizing the Simscape: Specialized Power Systems library, encompassing all distribution grid components.
Upon completion of the model (a partial view depicted in
Figure 2), various simulations were conducted to evaluate operational scenarios. Components sourced from the Simulink library were calibrated using data derived from ETAP calculations.
The voltage levels across different sections of the grid are defined as follows:
HV voltage (phase-to-phase): 150 kV;
MV voltage (phase-to-phase): 20 kV;
LV voltage (phase-to-phase): 400 V.
Power lines were modeled using pi-double bipoles, with the parameters specified in units per kilometer. Direct and zero-sequence triad impedances were calculated by ETAP based on geometric parameters and line-laying conditions.
The MV/LV transformers were configured in Dyn1, with the LV neutral earthed following typical machine parameters for oil-insulated transformers. Likewise, the HV/MV transformers were configured in Yny1, with the HV neutral earthed, mirroring the setup of most transformers in the Primary Substations (CPs), also adhering to typical machine parameters for oil-insulated transformers.
All loads were assumed to be predominantly ohmic-inductive, with a power factor of 0.8. The only exception is a specific load, identifiable within the model by a distinct symbol (a resistor), where the power factor is unity.
Table 1 reports the parameters used for the simulation of the model, specifically those related to the lines, power supply networks, transformers, and loads. The length of each line segment can be derived from the line labels shown in
Figure 2, where the fourth element in the label indicates the conductor length in meters. For example, the label “T 16 Cu 500” refers to a bare overhead line with copper conductors with a 16 mm
2 cross-section and length of 500 m.
2.2. Experimental Test System
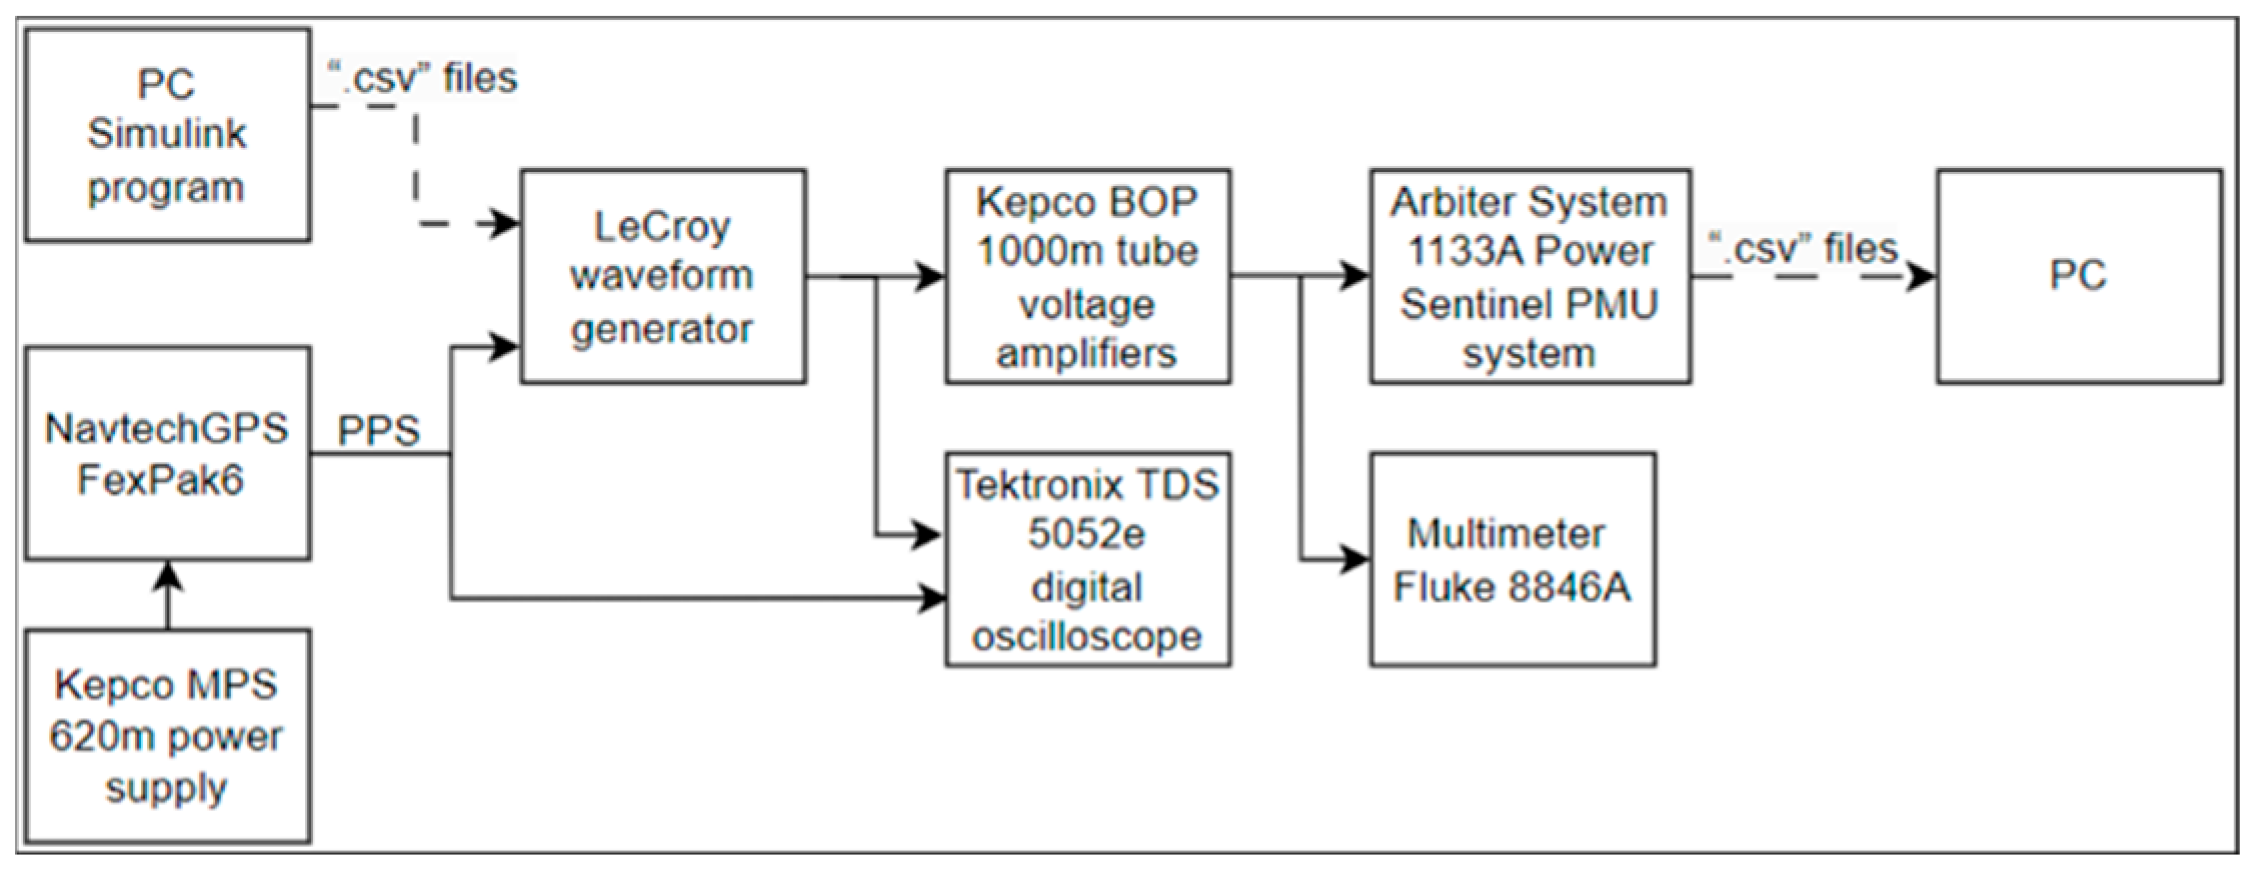
The PMU unit being tested for synchrophasor measurement is the M-class Arbiter System Model 1133A Power Sentinel PMU system(Arbiter Systems®, Inc., Paso Robles, CA, USA), equipped with a relative antenna. To generate the reference waveforms for testing, the LeCroy ArbStudio 1104 (Teledyne LeCroy, Chestnut Ridge, NY, USA) waveform generator was employed. Instrumentation control software, including PMU and waveform generator control, was operated on a Windows PC workstation.
These instruments were interconnected as outlined in the block diagram depicted in
Figure 3.
The waveforms slated for testing were exported from the Simulink program in “.csv” format files and subsequently loaded into the LeCroy waveform generator. This generator was utilized to replicate the voltages obtained from simulations across various scenarios studied. The signal transfer from Simulink to the LeCroy occurred at a sampling rate of 165 ksamples/s.
Given that the wave generator signals must adhere to a fixed time reference, the PPS synchronized with the UTC from the GPS was employed. However, as the GPS module within the PMU was inaccessible, an external add-on module, the GPS FlexPak6 (NovAtel Inc., Calgary, AL, Canada), was utilized. The NavtechGPS FlexPak6 add-on GPS module was powered by a 12 V supply via the Kepco MPS 620 m (Kepco, Inc., Flushing, NY, USA) power supply.
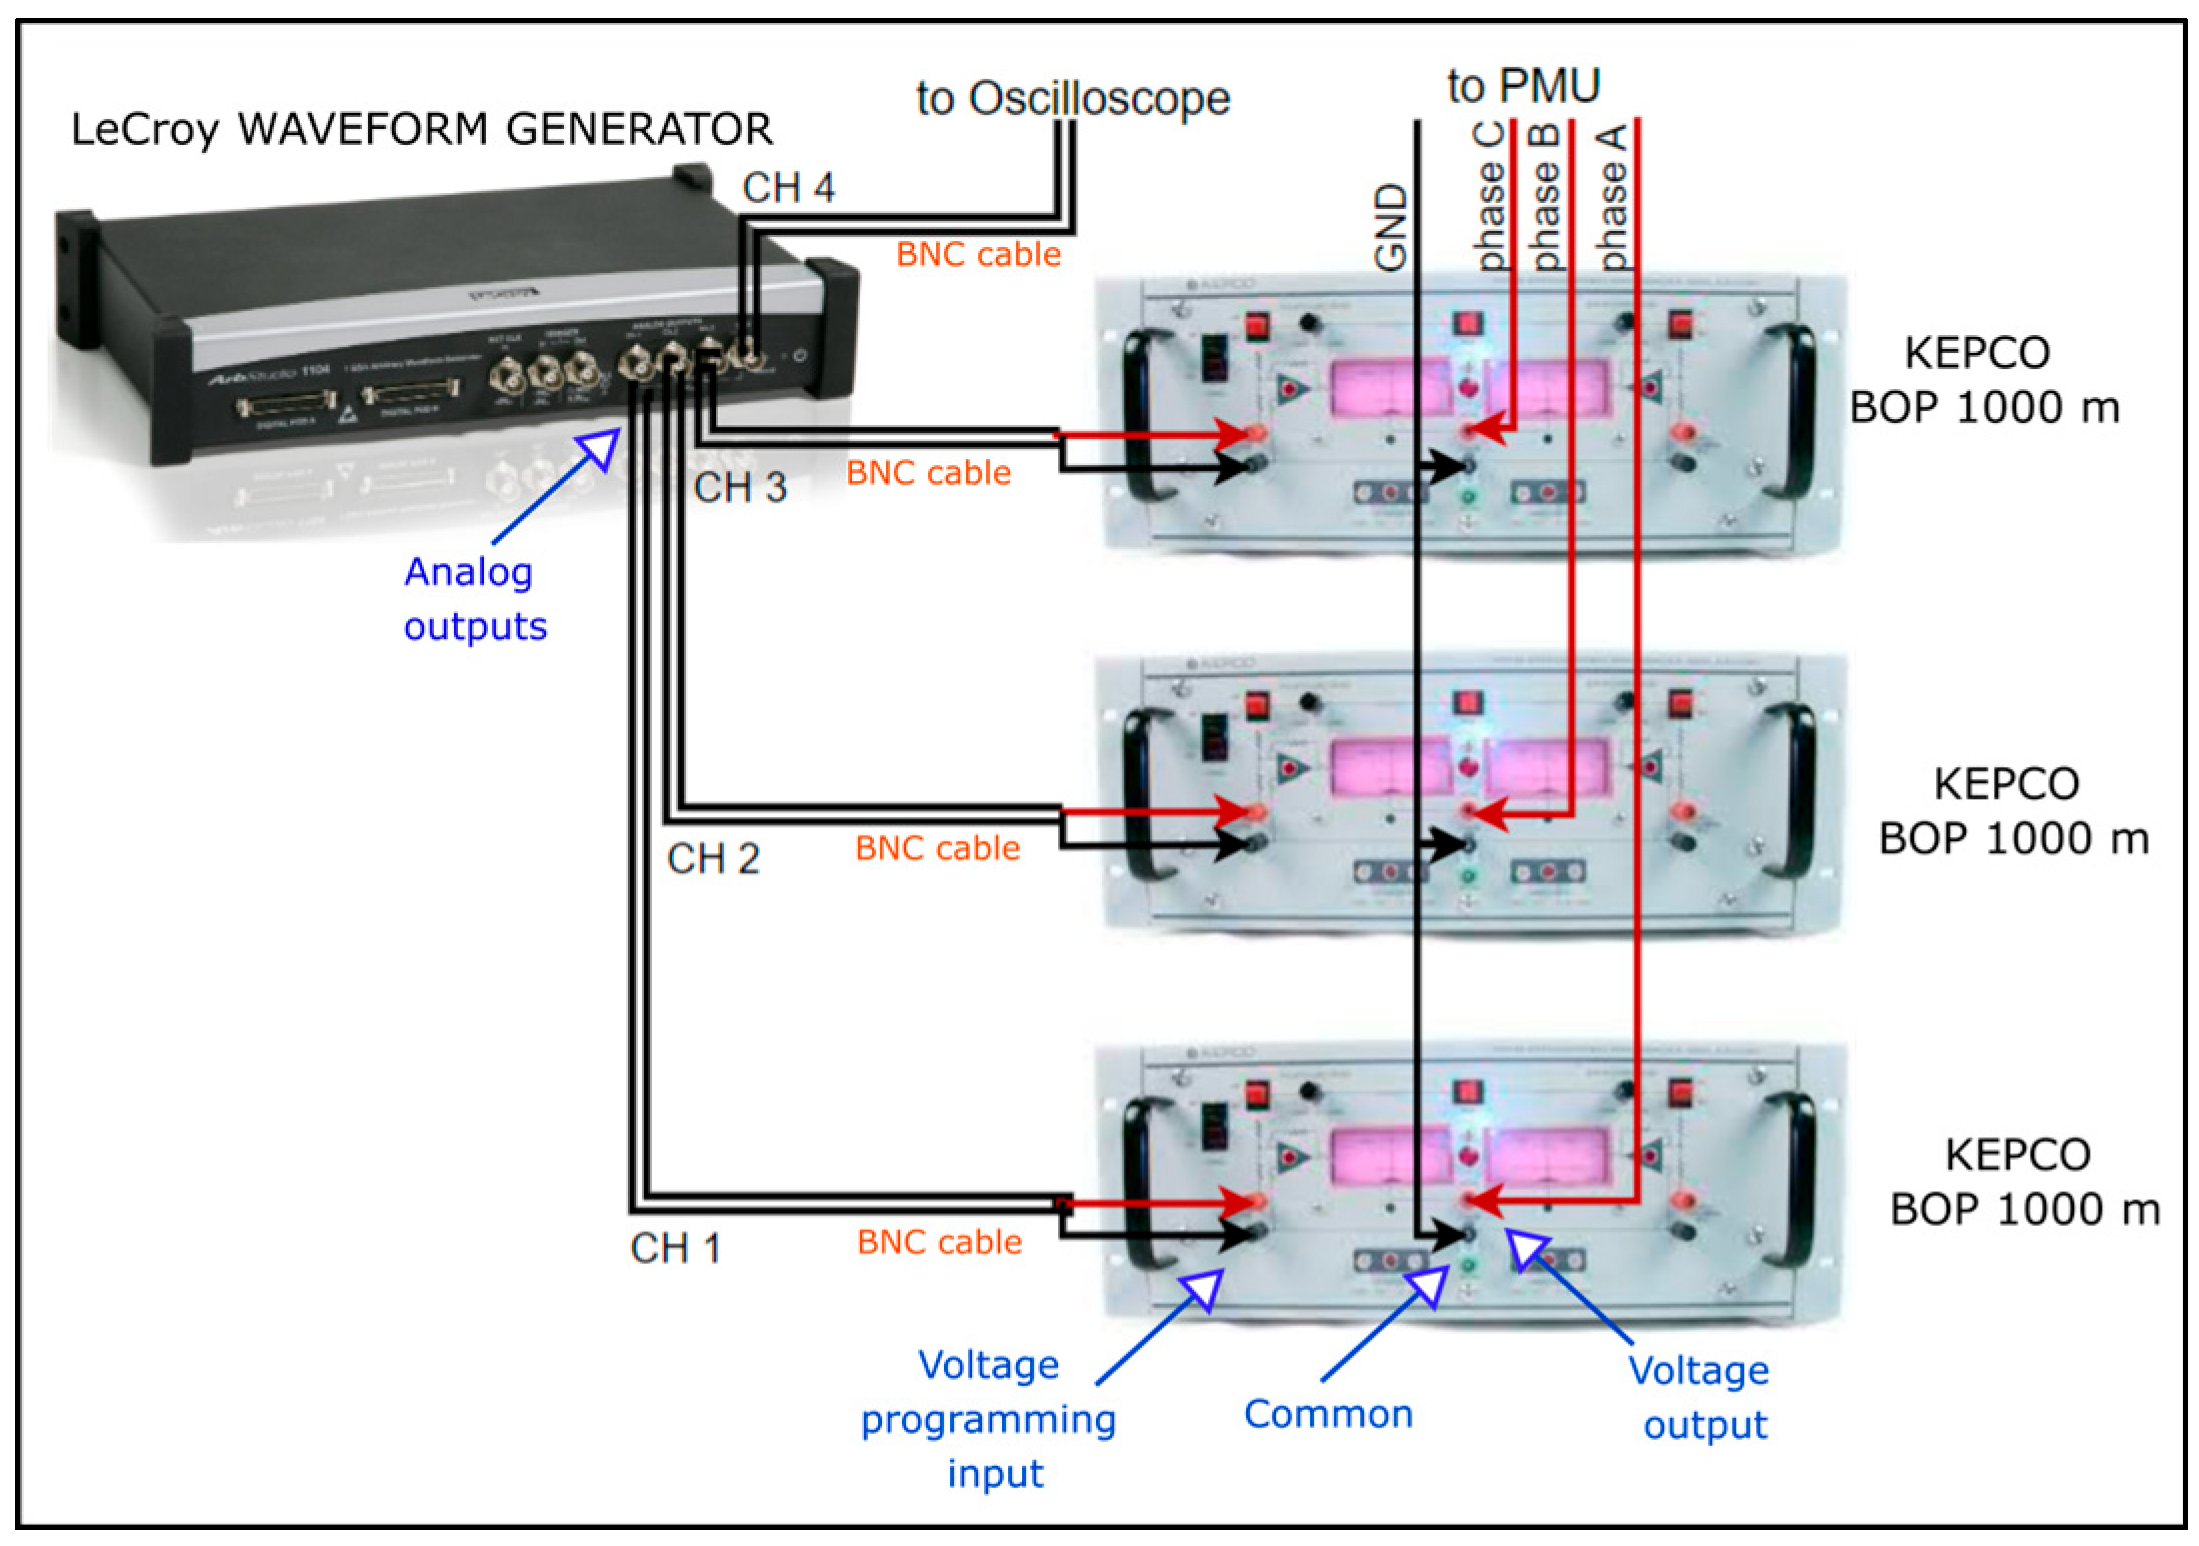
To elevate the voltage values of the three phases generated by the LeCroy waveform generator, three Kepco BOP 1000 m (Kepco, Inc., Flushing, NY, USA) tube voltage amplifiers were employed. These broadband amplifiers, operating up to 1.9 kHz, facilitated amplification of the harmonic content present in voltage transients occurring during simulations. Each amplifier was connected to the output of a single phase, replicating the star center and grounding it, as depicted in
Figure 4.
The Kepco BOP 1000 m amplifiers possess a fixed gain of 100. Consequently, the waveforms injected by the LeCroy were readjusted to achieve an output voltage of approximately 60 Vrms at the input of the PMU. This adjustment aimed to align with the instrument’s full-scale requirement (69 Vrms) while allowing a margin for potential overvoltages. Consequently, the peak value of the output signals from the LeCroy waveform generator was considered to be 0.4 V.
During testing, a discrepancy in the amplitude of the three reproduced waveforms was observed. Channels 1 and 2 exhibited slightly higher voltage output values compared to channels 3 and 4. As the channels are managed in pairs within the generator, internal circuitry asymmetry likely contributed to this disparity. Given this substantial signal amplification, this asymmetry could significantly impact results. To address this, asymmetry was compensated for during the initial test phase, which also accounted for temperature-induced changes.
The generated signals were then directed to the PMU, where synchrophasors were calculated. These data could either be viewed in real-time via PC station software or saved and exported in the CSV format with the relevant time reference.
Prior to commencing the test phase, it was imperative to ensure that the PMU was connected to an adequate number of satellites to ensure the correct synchronization of measurements with the UTC (a minimum of 7 identified satellites).
For real-time verification, channel 4 of the waveform generator, reproducing a second phase A, was connected to the Tektronix oscilloscope to verify the phase synchronization with the PPS, while the Fluke 8846A (Fluke Corporation, Everett, WA, USA) with 6.5 digit resolution was utilized to verify the RMS voltage.
ArbStudio software facilitated management of the LeCroy waveform generator and configuration of the waveforms sent to the PMU. Channel settings were configured to match the sampling frequency of the simulations, set at 165 kHz. Additionally, all four channels were configured to reproduce waveforms on the falling edge of the PPS in the continuous mode, ensuring a cyclical signal reproduction every 2 s.
The PSCSV program was utilized for the PMU measurements’ acquisition and configuration. This involved setting various parameters, such as the system’s nominal frequency (50 Hz in this case), maximum full-scale voltage, and PC connection type (ethernet, in this scenario), along with its address.
Finally, NovAtel Connect was used to manage the FlexPak6 GPS module and verify its correct connection to satellites, ensuring a sufficiently high PPS synchronization quality (a minimum of 8 “locked” satellites).
2.3. Performance Evaluation Metrics for PMU Assessment
To quantitatively assess the accuracy of the PMUs, a set of standardized performance metrics was employed. One of the most widely adopted indices is the Total Vector Error (TVE), which provides a comprehensive measure of the deviation between the measured and reference phasors, accounting for both magnitude and phase angle discrepancies [
34]. The IEEE Standard C37.118.1 [
35] defines specific TVE requirements under both steady-state and transient conditions, establishing compliance thresholds for all newly manufactured PMUs. The TVE at time
t is defined as follows:
where
Vmr(
t) +
jVmi(
t) represents the phasor as measured by the real PMU, and
Vsr(
t) +
jVsi(
t) corresponds to the reference phasor generated via Simulink simulation.
Another fundamental parameter in the characterization of the AC signals is the frequency,
f, and, consequently, the PMUs must measure it along with the Rate of Change of Frequency (ROCOF), defined as the first derivative of the frequency with respect to time, as follows:
ROCOF is typically expressed in hertz per second (Hz/s) and, like frequency and synchrophasor measurements, must be referenced to a time instance,
tr, synchronized with the UTC [
36].
To quantify the accuracy of the ROCOF estimation, the Rate of Frequency Error (RFE) index was used. This metric computes the absolute difference between the
ROCOFm estimated by the PMU and the reference
ROCOFs obtained from the simulated signals:
3. Results
In the analysis of the obtained results, particular attention was given to the RFE, ROCOF, and TVE indices. The objective was to assess which events pose the most significant challenges in PMU measurements and the time required for the system to report measurements within the standard-defined ranges following specific events.
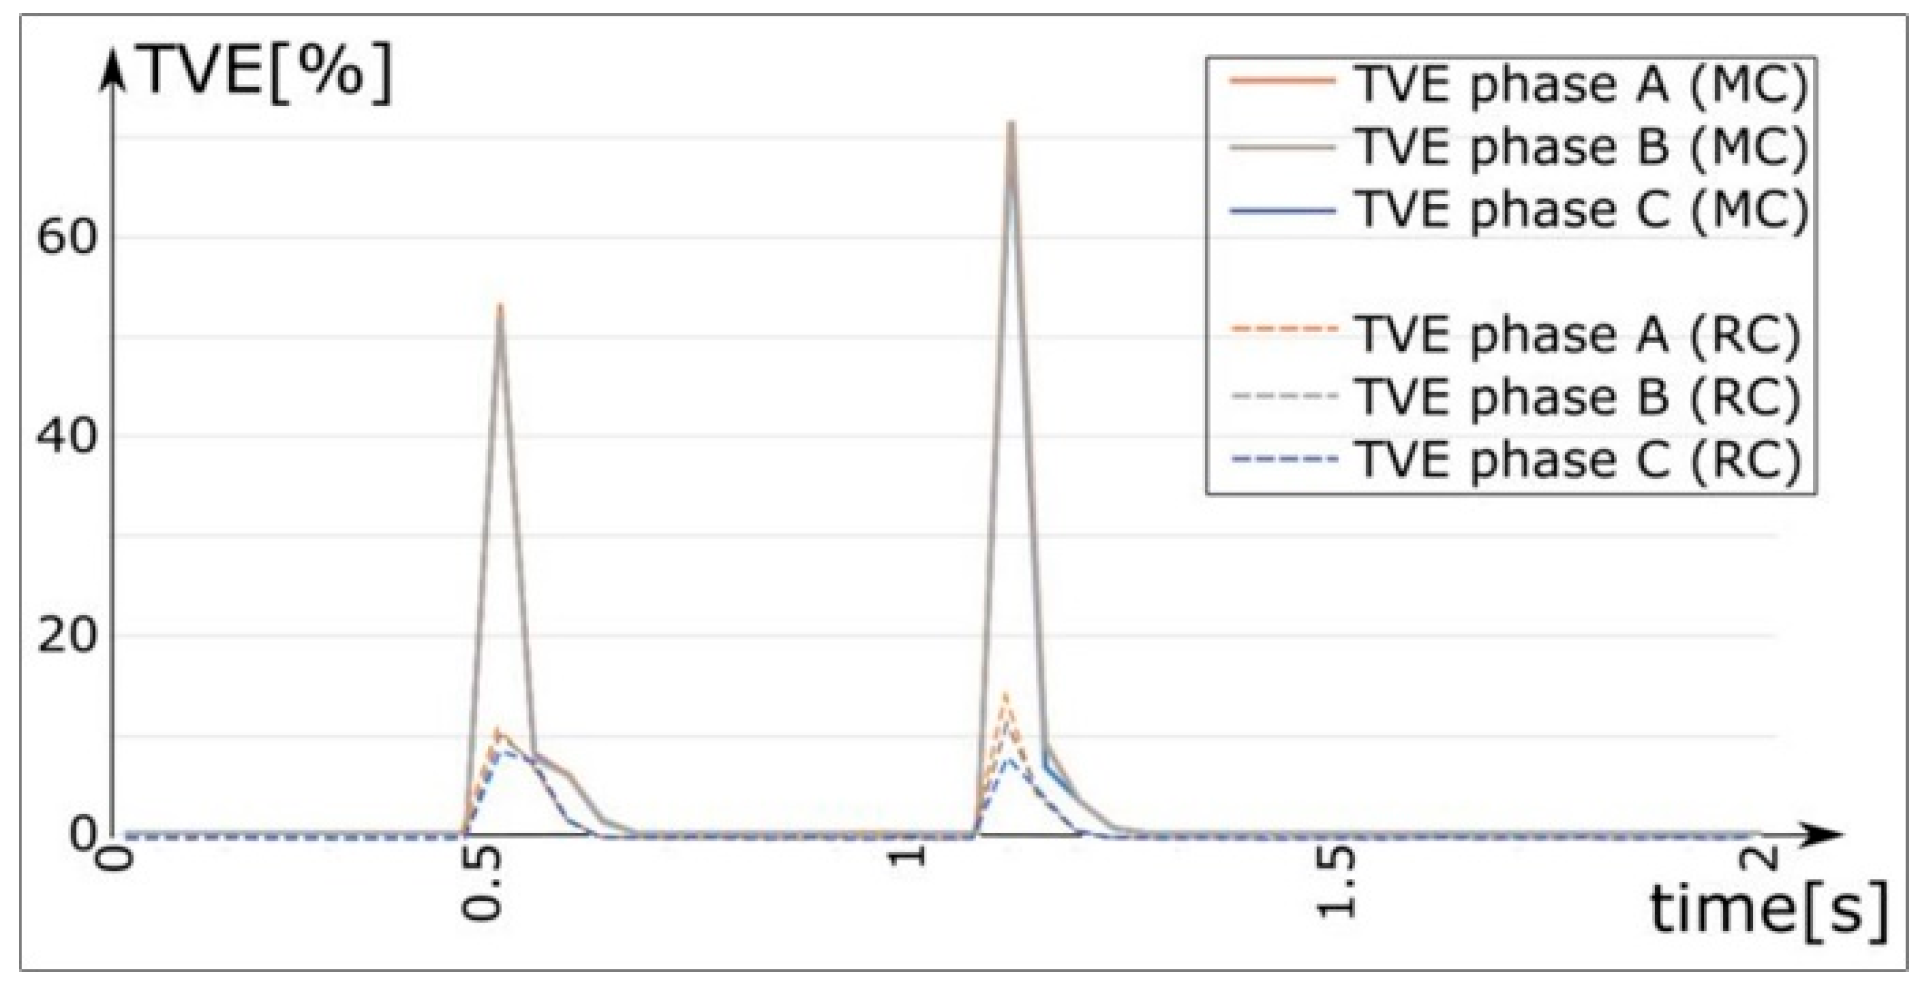
3.1. Comparison of the Mean and Reject Criteria for Analyzing Synchrophasor Data
As outlined in the preceding section, the data derived from simulations, encompassing the actual modulus and phase angle of the injected phasors into the PMU system, contain an excess of samples. These surplus samples can either be averaged over a period equivalent to the data return period from the PMU or discarded as redundant.
Figure 5 demonstrates that a superior performance was achieved by discarding the surplus samples compared with averaging them over time, which was particularly evident under transient conditions. This superiority stems from the PMU system’s operation, which provides a measurement sample every 40 ms. However, thanks to its internal calculation algorithm, it computes the synchrophasor value at much smaller intervals. If the PMU were to average measurements every 40 ms, the samples immediately following a transient would be influenced by transient-induced voltage values. However, this was not the case.
In examining the values, such as in the event of a three-phase fault, it was observed that the synchrophasor returned by the PMU immediately after the transient closely approximates the actual injected synchrophasor value.
In the scenario of a three-phase short circuit on a bus powered by the mains (refer to
Figure 5), with reference to the PMU measurement on the MV bus of Primary Substation 1 (PS1), it is evident that the TVE calculated using the reject criterion was significantly smaller, particularly at the peak value during the fault transient. This difference was notable only under transient conditions, as the average value corresponded to the instantaneous value in the simulations. Henceforth, only graphs related to the calculations performed with the rejection criterion are presented, bearing in mind that similar trends are observed with both criteria.
3.2. Realistic Case
For PMU testing, four measurement points (MV nodes) across the grid were strategically selected to assess the PMU’s response under varying conditions. These nodes were positioned to represent both distant and close measurement points relative to the primary substation, covering the branches of the grid for a comprehensive analysis.
For brevity, only graphs pertaining to measurements conducted on the “PS1, MV bus” are presented, as similar trends were observed across other nodes.
Regarding the faults, similar results were obtained, thus graphs for the medium-voltage and low-voltage faults at SS3 (secondary substation 3) supplied by the main grid are included.
The tests encompass operations typical in distribution grids, including both normal and fault conditions. Simulations were standardized to a 2 s duration utilizing a discrete step solver with a calculation frequency of 165 kHz. The simulations included the following:
Power supply from the main grid in a steady state without connection to renewable sources (
Figure 6).
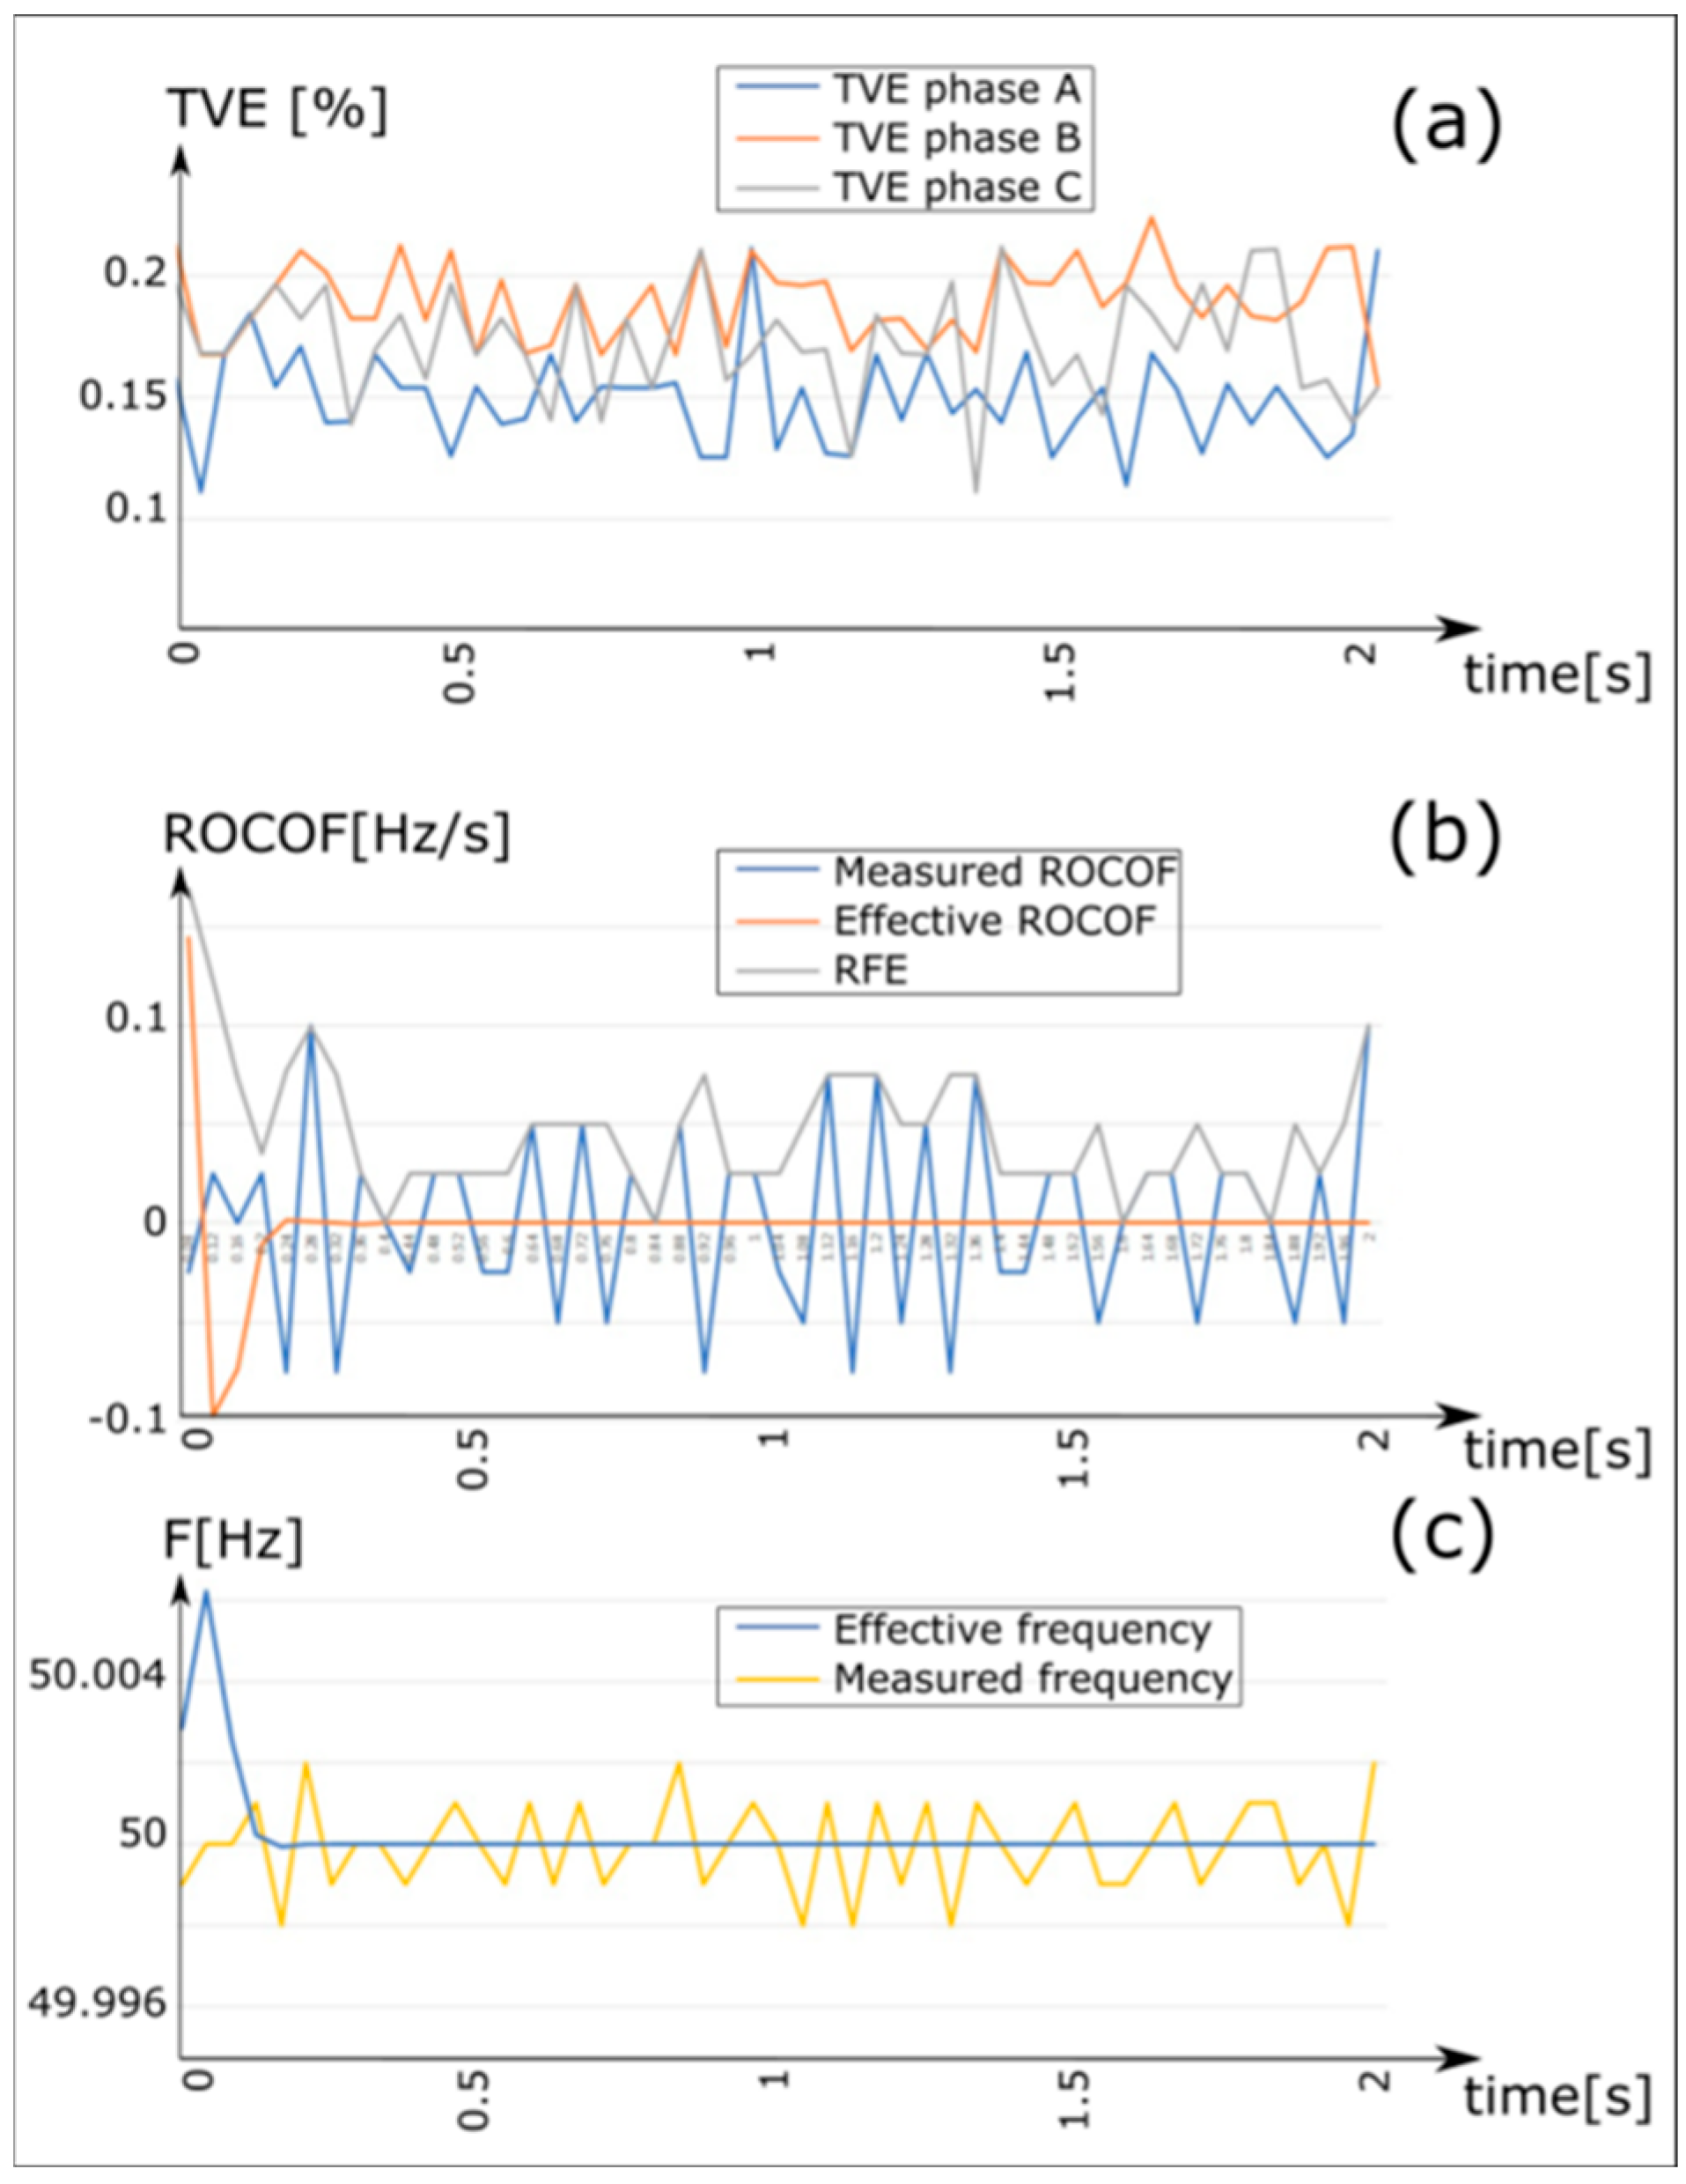
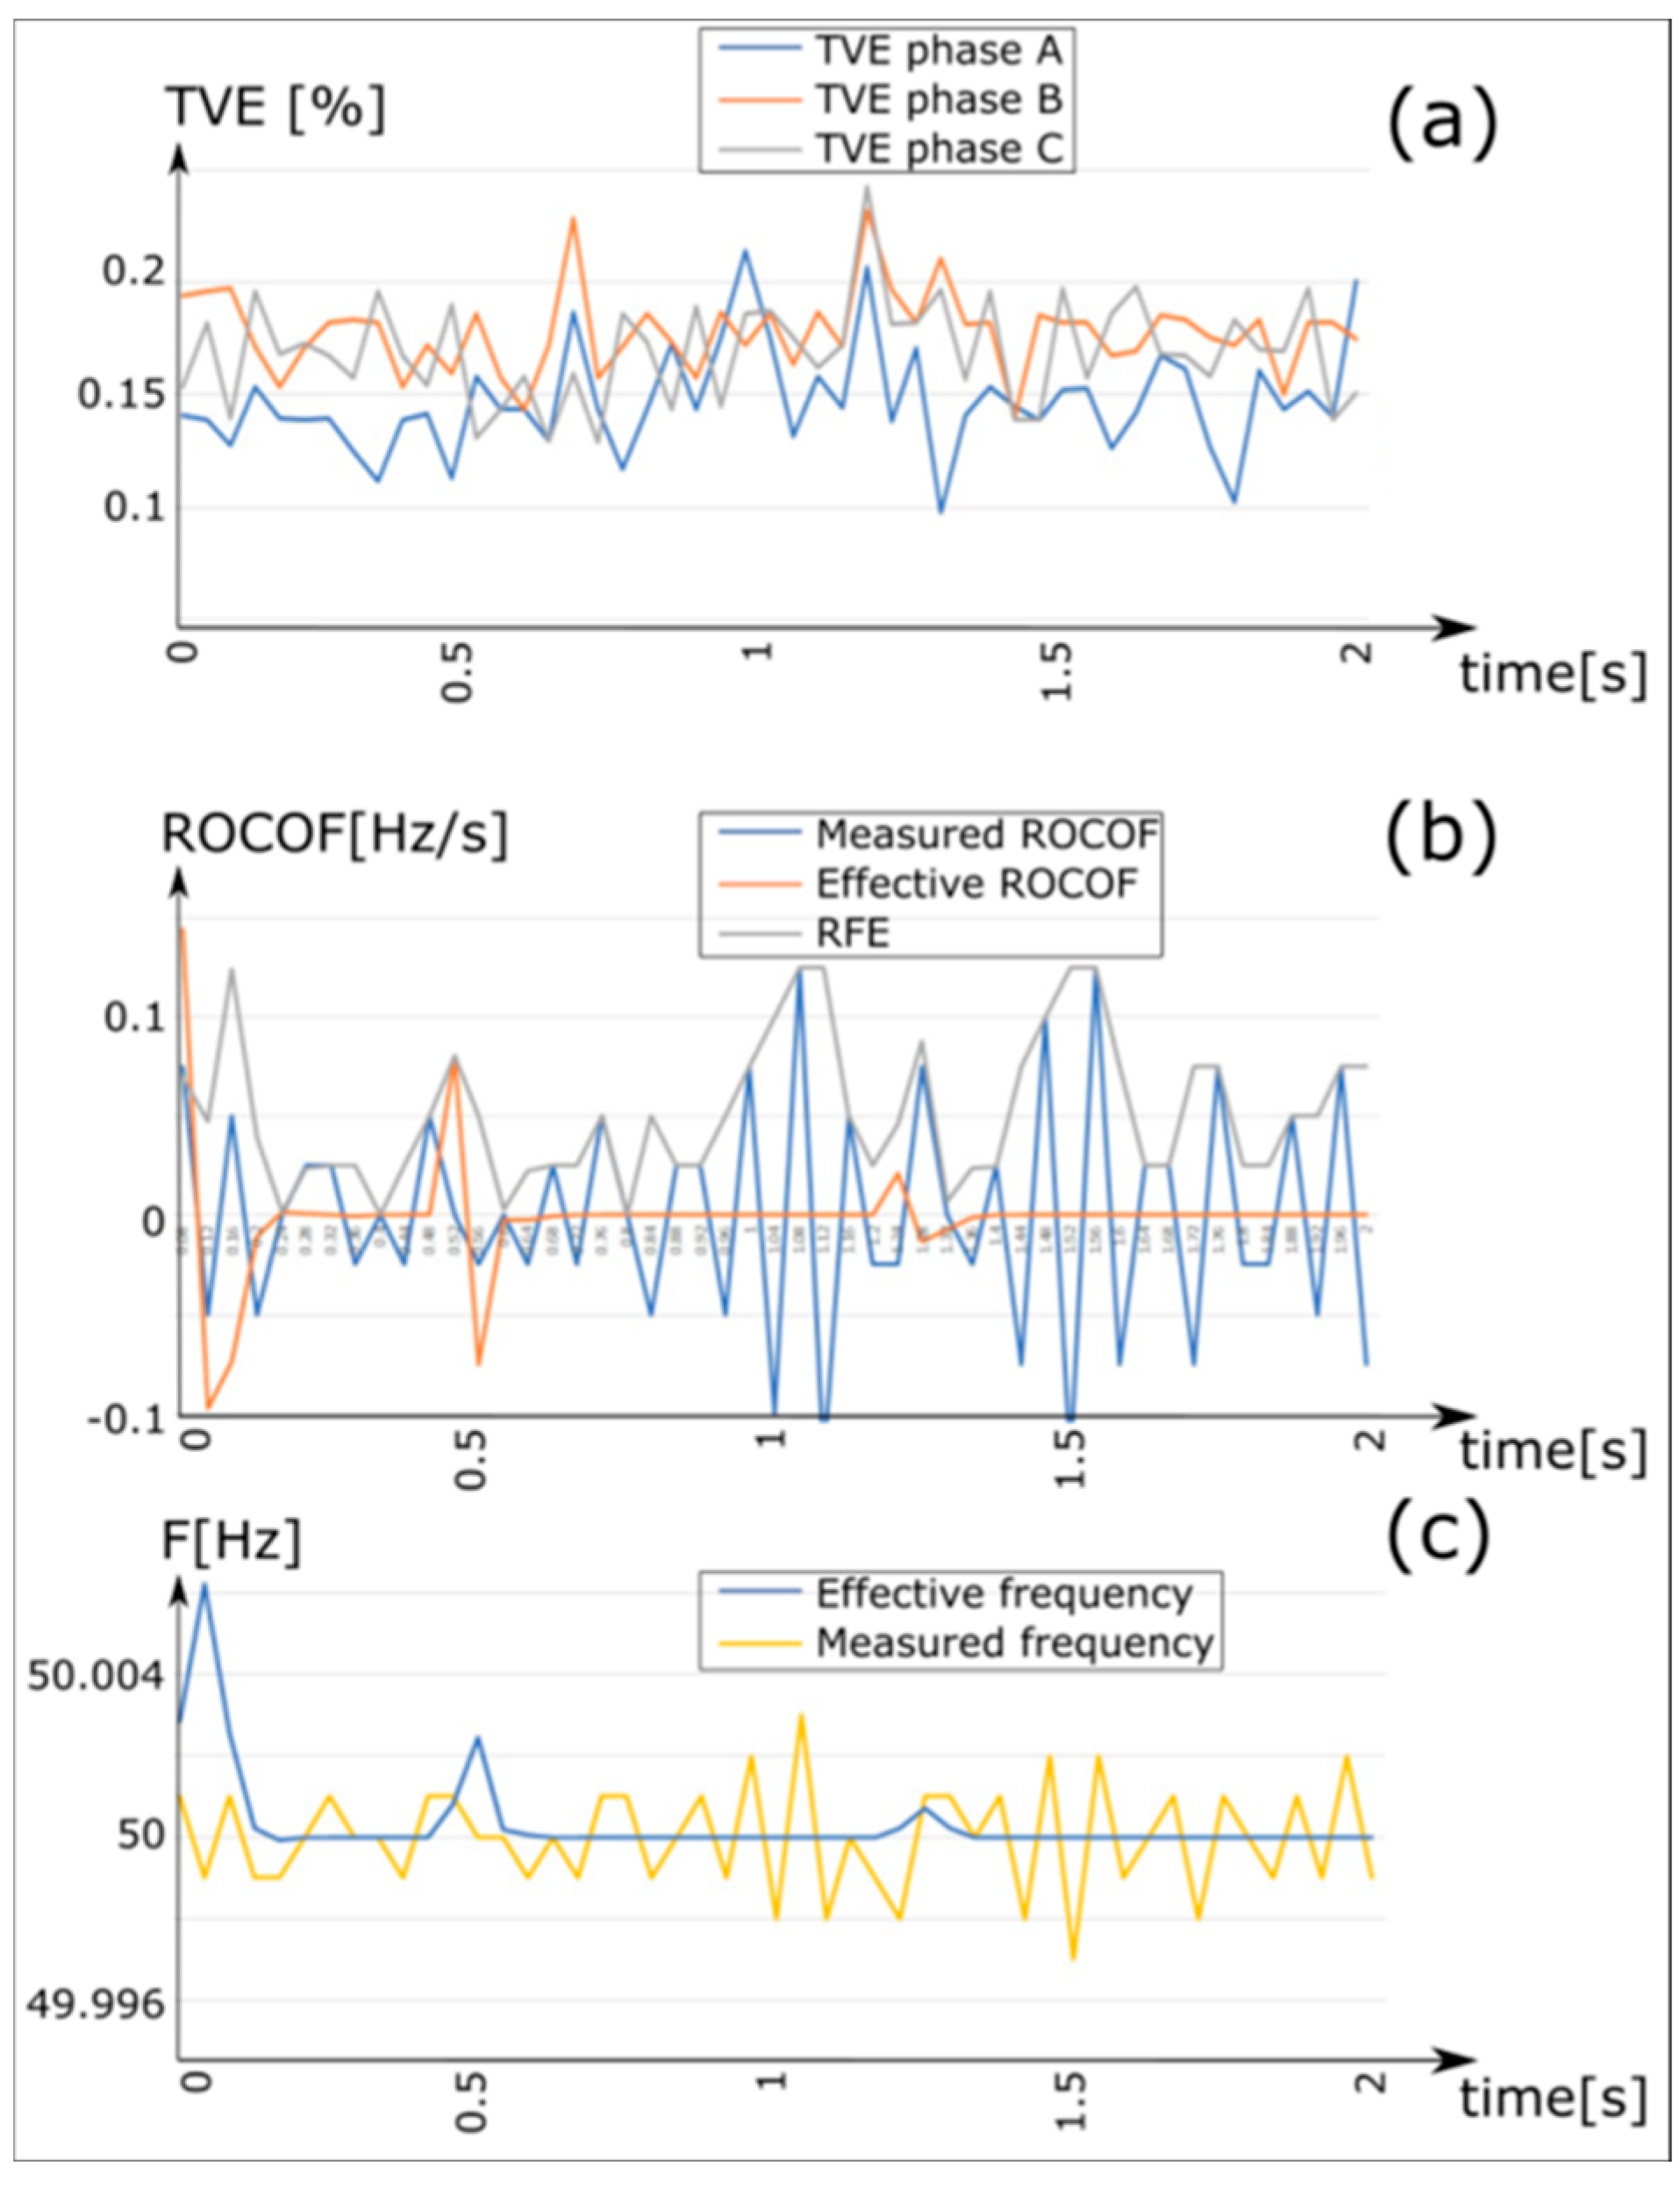
Disconnection at 0.5 s and subsequent reconnection at 1.2 s of a 100 kVA load from the LV busbar of SS10 (secondary substation 10), with power supplied from the main grid, excluding renewable sources (
Figure 7 and
Figure 8).
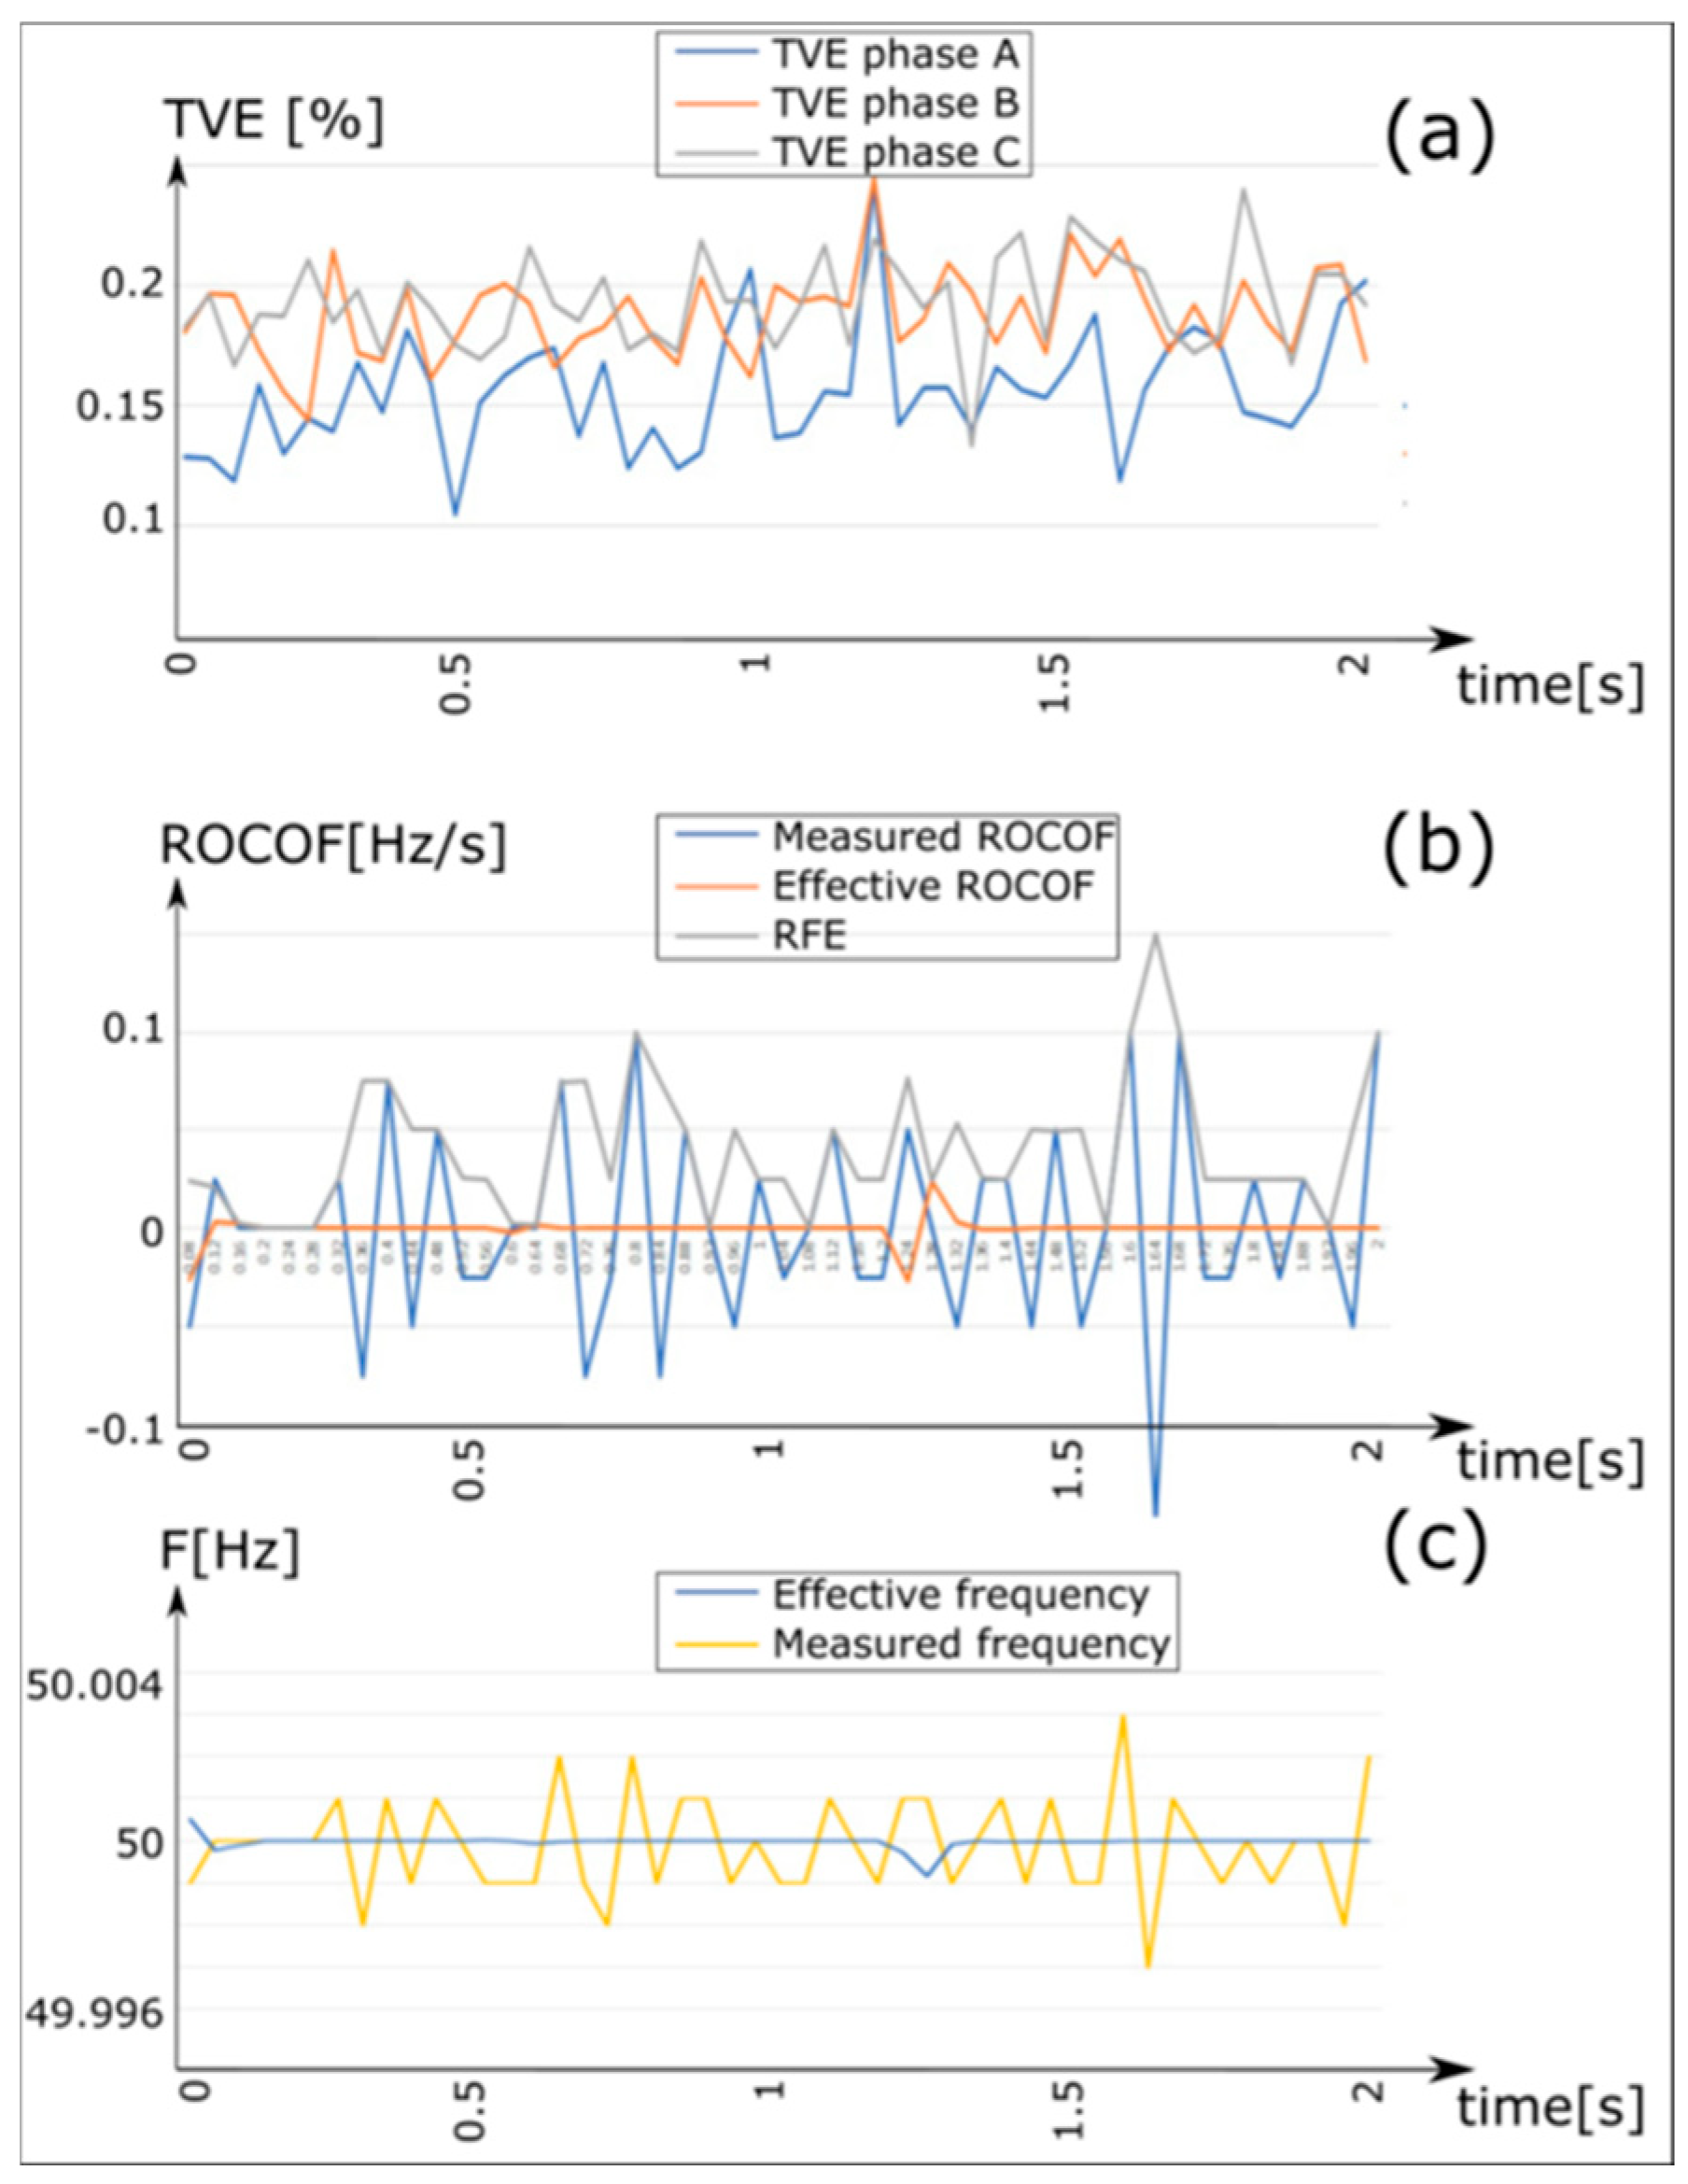
Disconnection at 0.5 s and subsequent reconnection at 1.2 s of a 100 kVA load from the LV busbar SS10 with the power supply from the secondary grid (CP 2) and the main grid disconnected (
Figure 9).
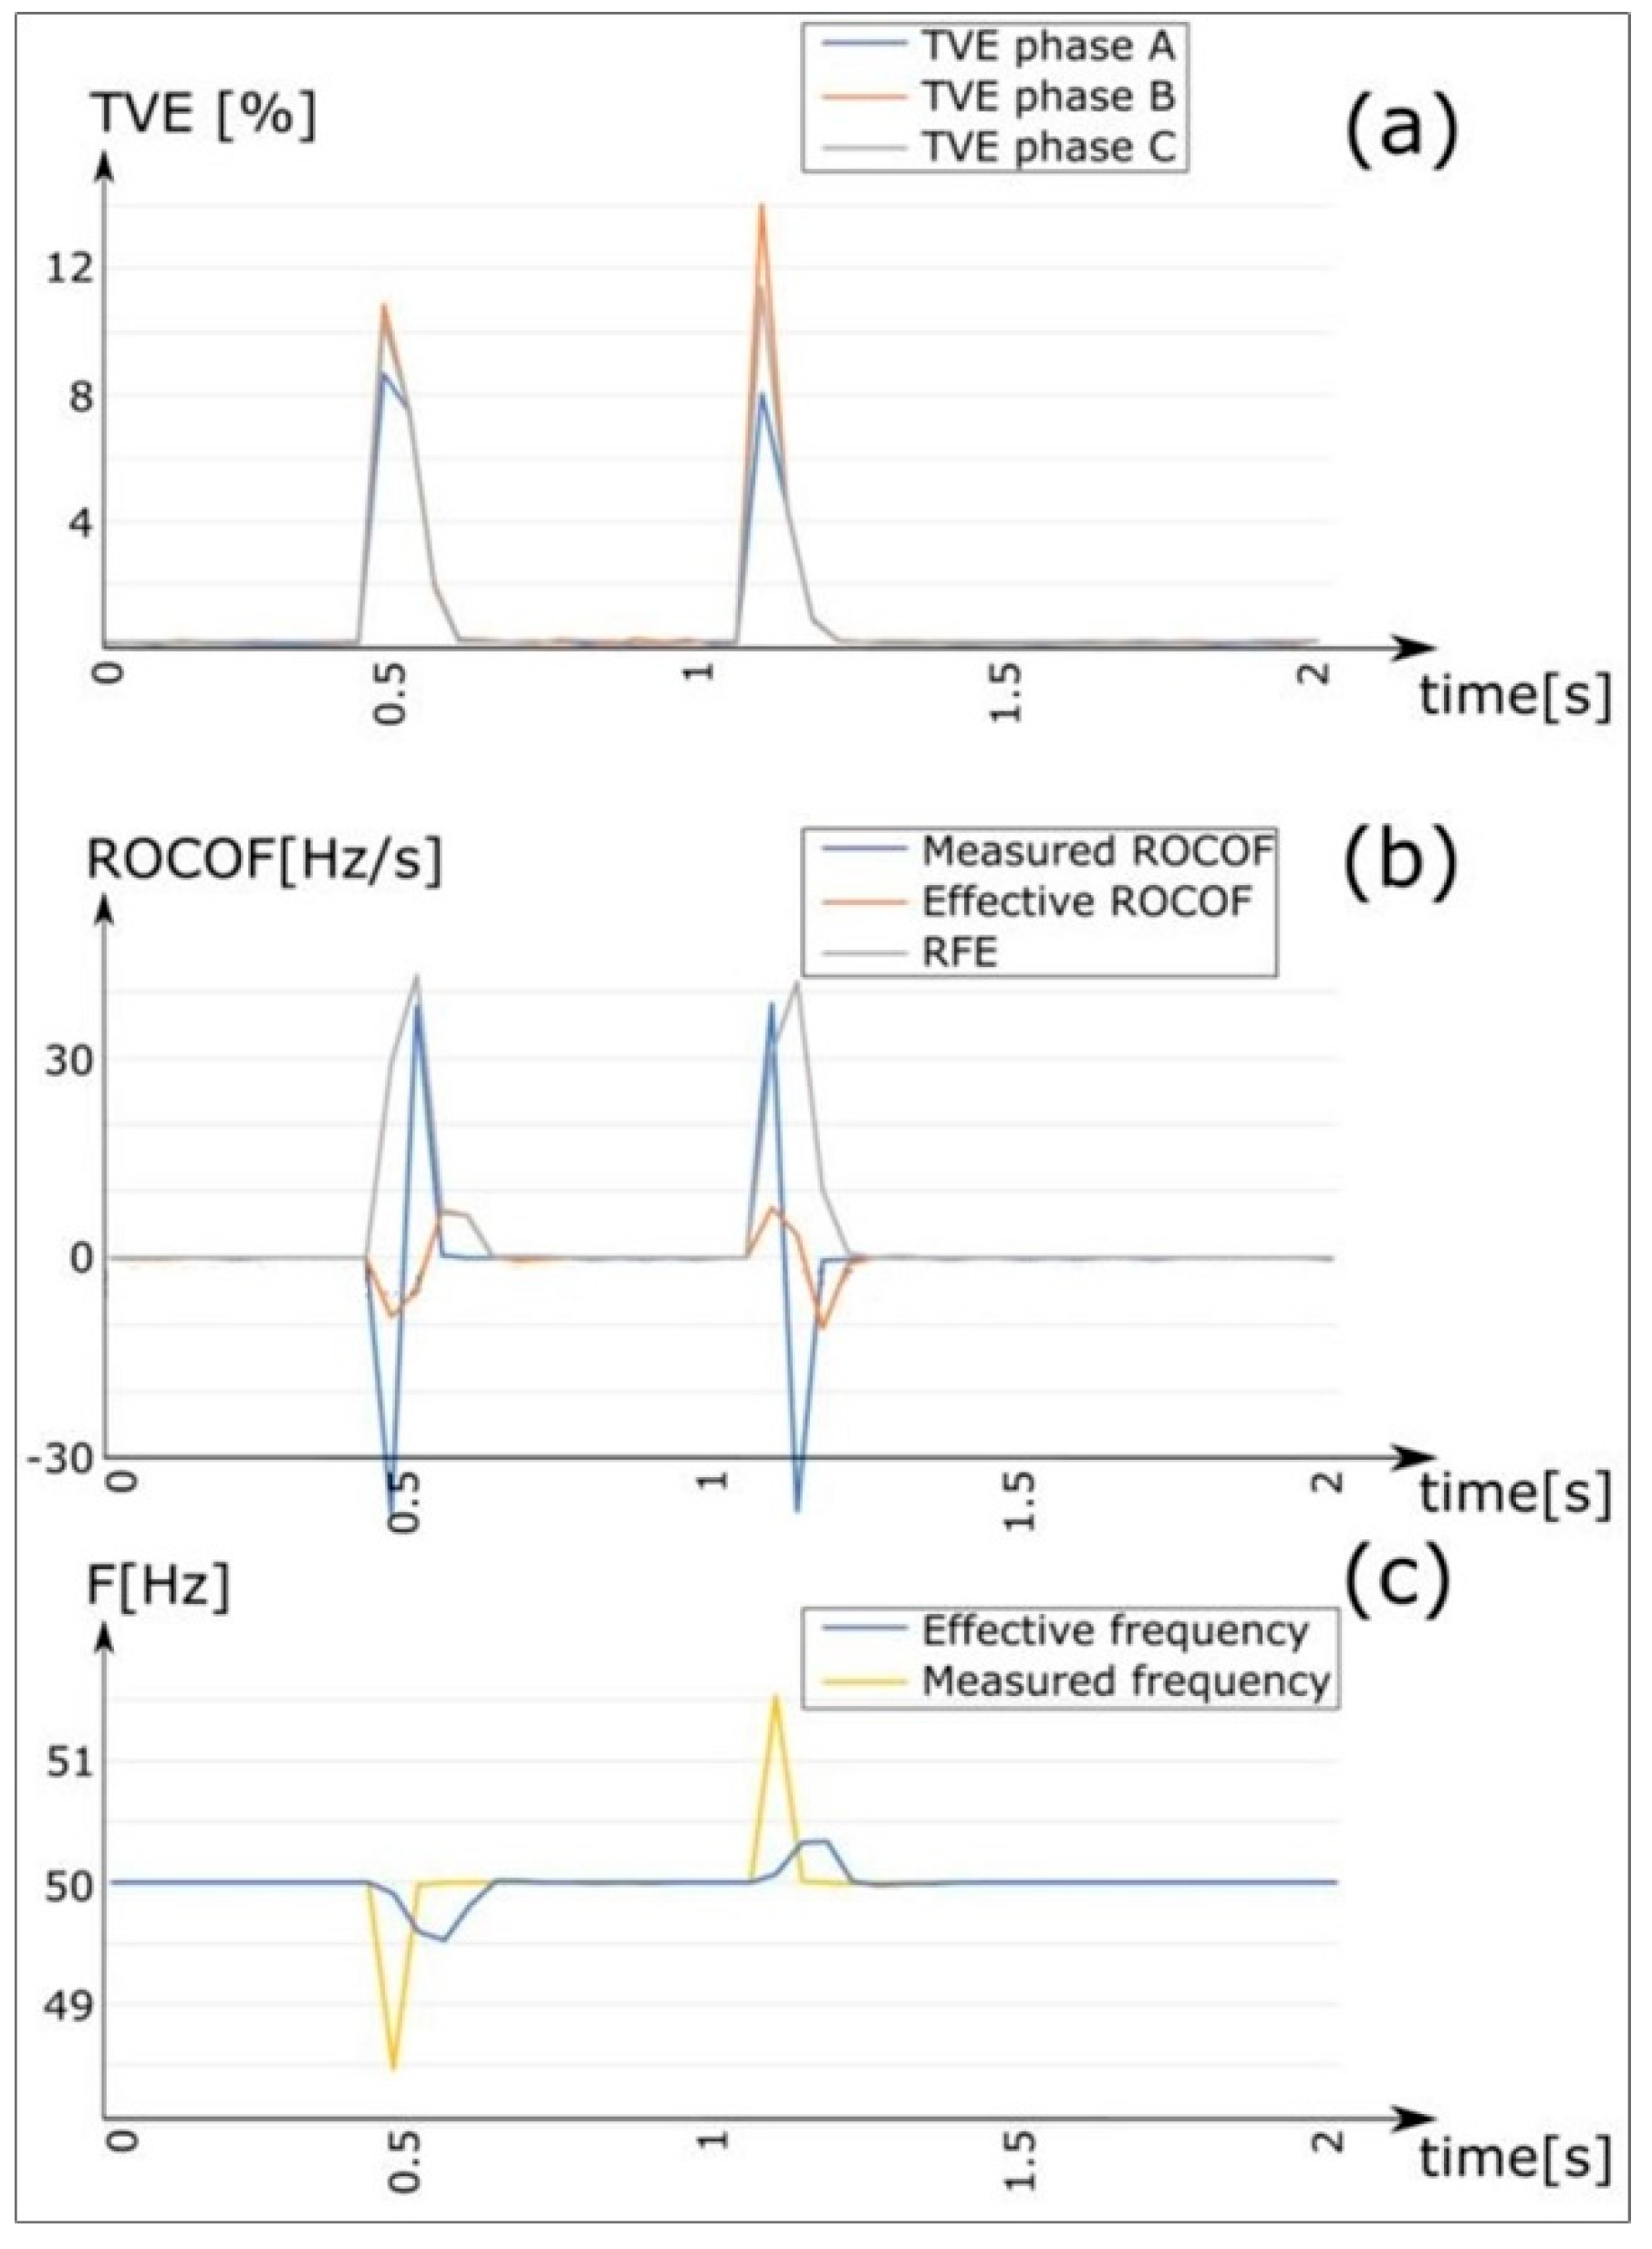
Three-phase short-circuits without a power supply from renewable sources, as follows: main grid power supply and fault point on the MV side of SS3 (
Figure 10).
Three-phase short-circuits without a power supply from renewable sources: main grid power supply and point of failure on the LV side of SS3 (
Figure 11).
In the three-phase fault simulations, the fault initiation was set at 0.5 s, with the fault clearance occurring at 1.2 s, corresponding to a tripping time of 0.6 s for upstream protection, to simulate the real network’s fault-clearing behavior.
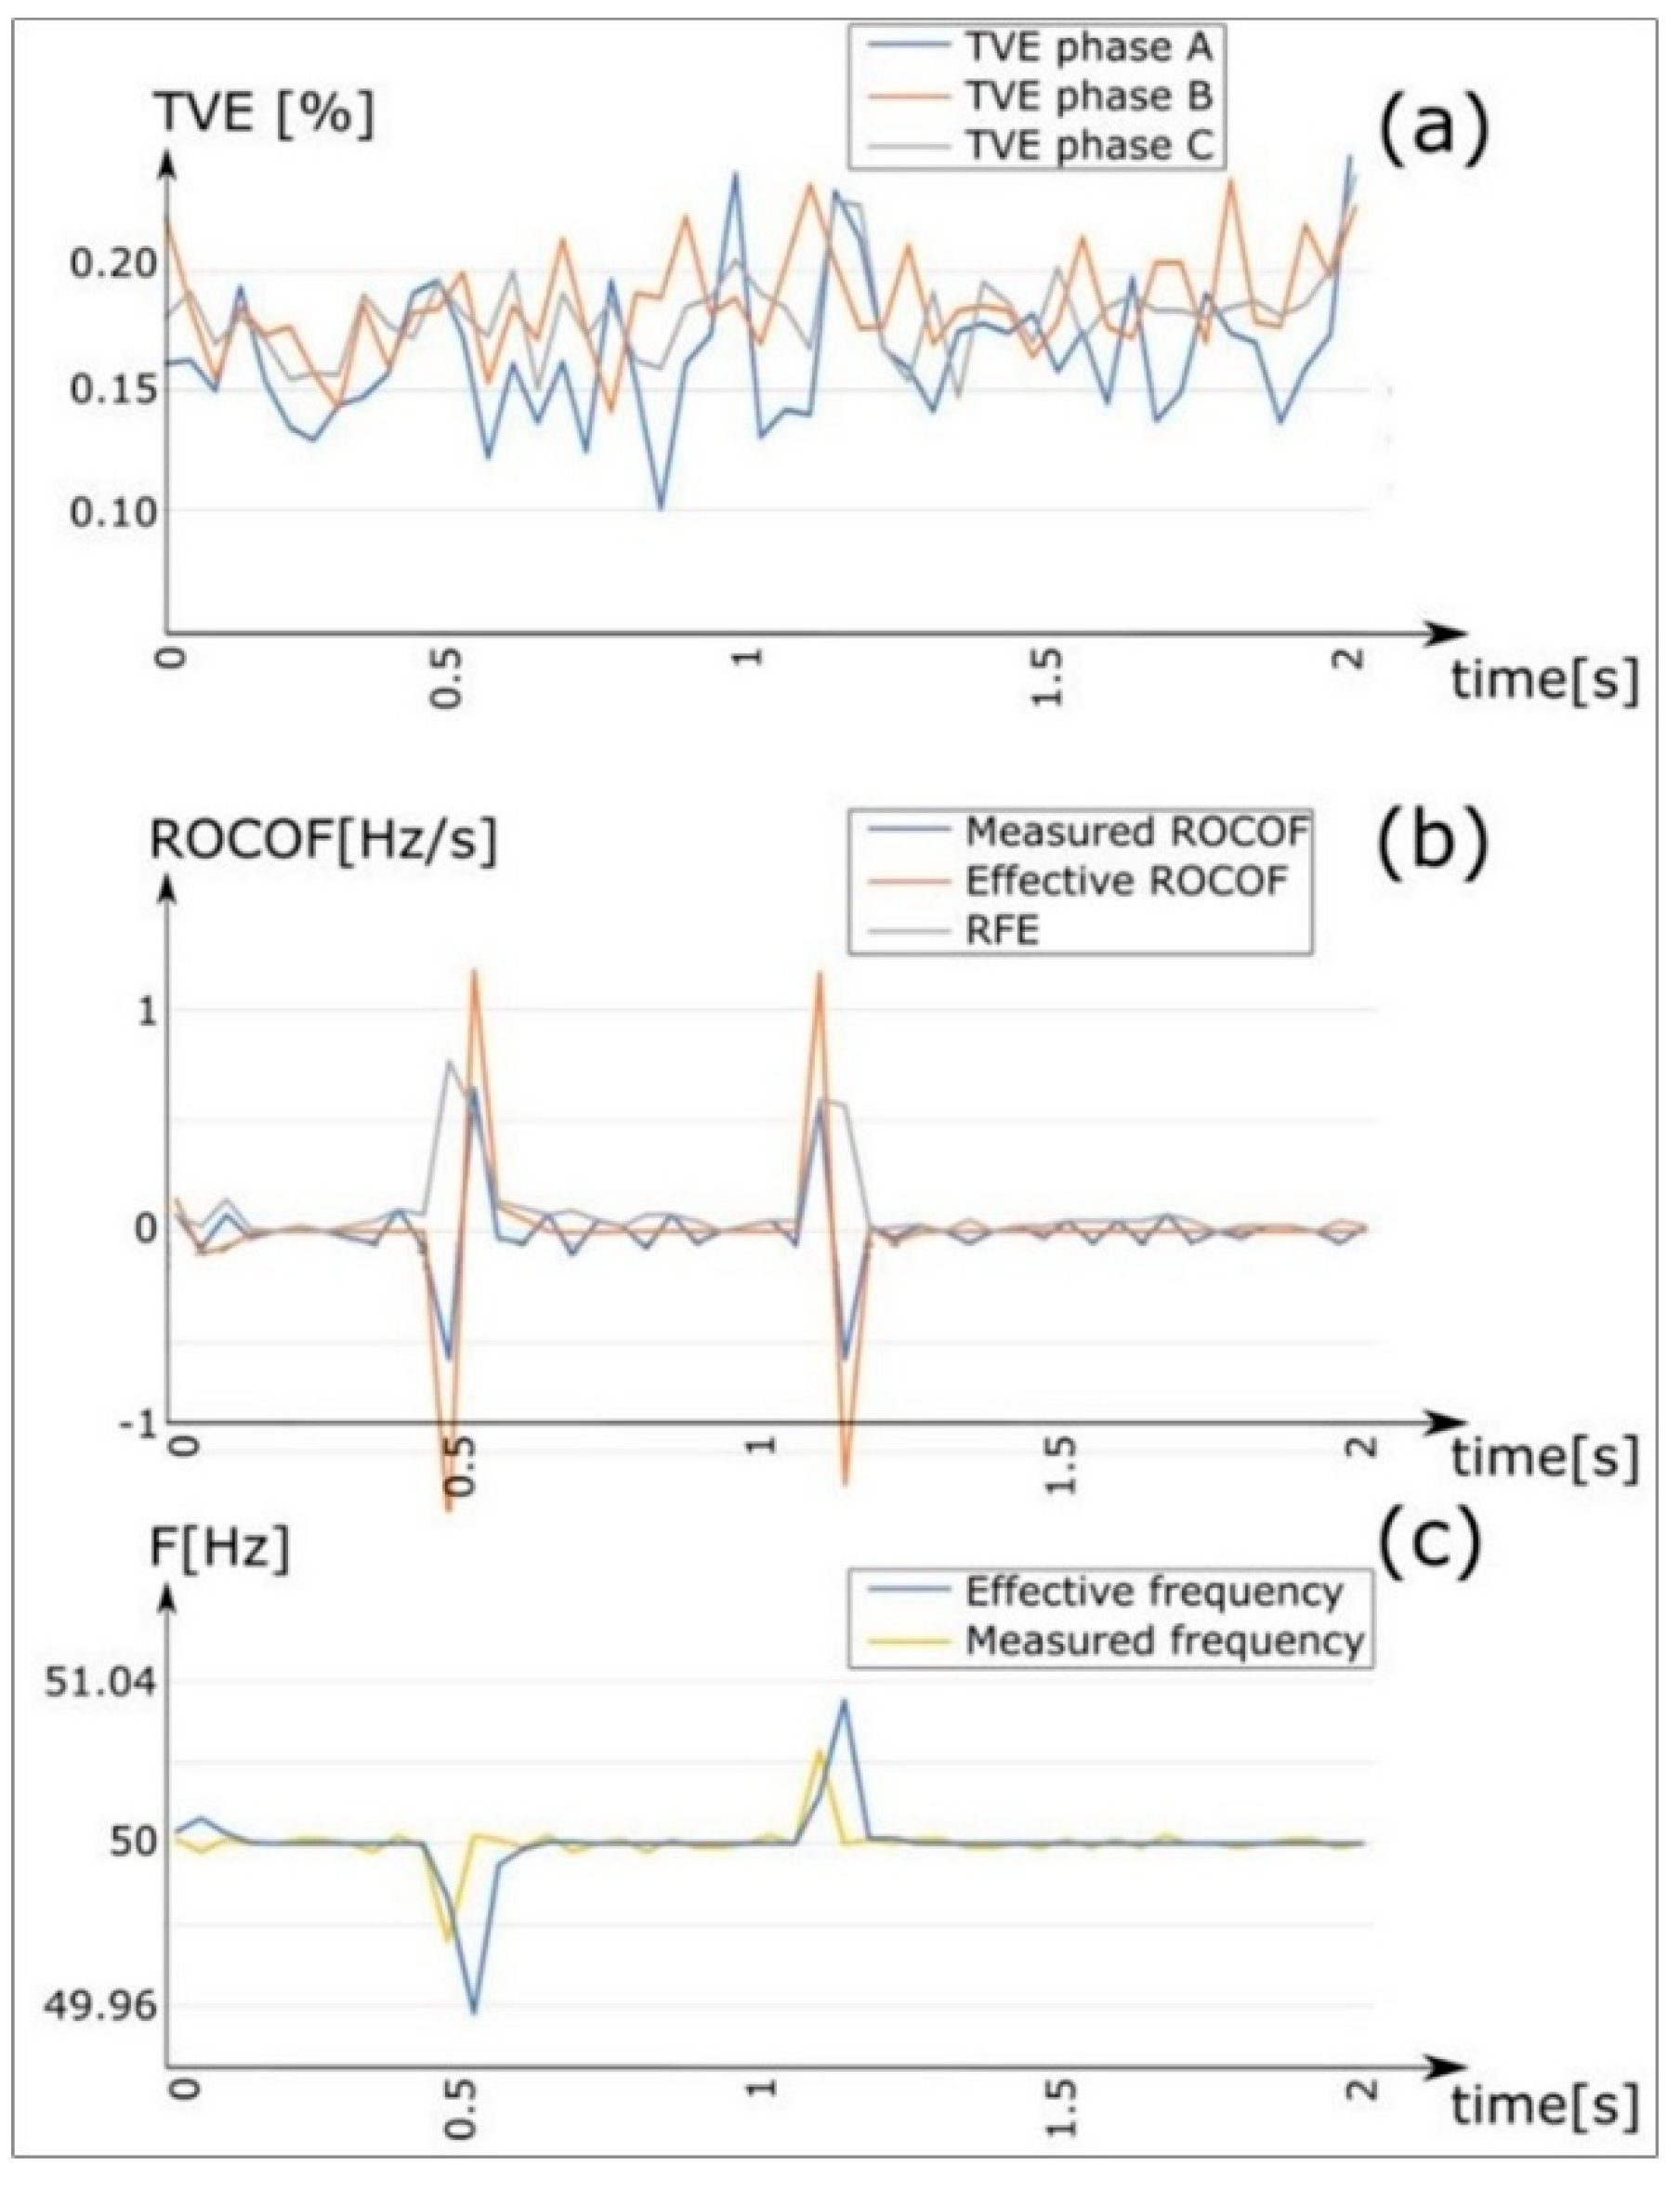
Figure 7 shows the rms value and angle voltages, as well as the frequency variation measured at the MVbus PS1, which were caused by the disconnection and reconnection of a load connected to the LV busbar SS10, to which the results of
Figure 8 correspond.
4. Discussion
Table 2 presents a structured summary of the quantitative comparison of the PMU performance metrics under the five different disturbance scenarios. Specifically, the table includes: (i) the maximum TVE observed across the three phases and (ii) the peak-to-peak differences for the measured frequency, effective frequency, measured ROCOF, effective ROCOF, and the RFE.
To ensure a consistent and meaningful assessment of the PMU’s data, the initial transient associated with the simulation startup phase was excluded from the analysis.
Under all steady-state conditions, whether photovoltaic generators are connected or not, and regardless of whether the grid is powered by the main or secondary substation, the results obtained from the measurements were excellent. The Total Vector Error (TVE) consistently remained stable below 1%, adhering to the standard’s limit value. Regarding the RFE, which represents the deviation between the measured ROCOF and the actual ROCOF, it consistently remains below the threshold stipulated by the standard. For a class M PMU, this threshold is set at 0.1 Hz/s in steady-state conditions.
However, when analyzing non-stationary scenarios involving grid operations, the 1% criterion is referenced to evaluate the accuracy, as the standard does not define parameters for real operating conditions. Instead, it imposes constraints based on well-defined test waveforms, such as amplitude steps or frequency ramps. Although the standard does not specify parameters for dynamic conditions, the 0.1 Hz/s limit under stationary conditions can still serve as a reference for assessing the RFE in transient regimes.
When examining faults, particularly three-phase short-circuits, it is essential to consider that voltages drop to zero at the fault point, leading to overcurrents and a reduction in voltage levels across all grid nodes. This reduction in voltage levels amplifies measurement errors as a percentage due to the denominator’s dependence on voltage values in TVE calculations.
However, during fault start and end transients, which are caused by the opening of upstream circuit breakers, there is a notable deterioration in the measurement quality. In these instances, the TVE can exceed 20%, rendering the measurement unreliable.
In instances where the fault occurs at low voltage, measurements tend to be more accurate, with the indices staying within acceptable limits even during the fault period. This is attributed to the lower energy involved, resulting in slower and less pronounced voltage transients.
However, it is important to acknowledge that fault scenarios can render the indices meaningless if a node is taken out of service due to the opening of an upstream switch.
Another factor to consider is the recovery times of the quality indices (TVE and RFE) within the standard-defined limits following transients, as discussed earlier. These recovery times are typically short, ranging from two to four cycles (between 40 and 80 ms), and vary based on the power of the upstream grid. A more powerful upstream grid tends to produce lower-amplitude transients, thereby reducing the recovery times.
Upon analyzing the frequency measurement results, minor fluctuations, typically on the order of 10−3 Hz around the true value, were observed. Nevertheless, across all tests, the measurements proved to be quite accurate, even in scenarios where transients caused a slight increase in the TVE, reaching around 10−2 Hz.
However, there are certain limitations regarding the system’s response times. Notably, the RFE tends to be relatively high during transients. This index, which represents the disparity between measured and actual ROCOF, reflects how quickly the system processes frequency changes. During transients, delays between the actual frequency change and the PMU’s detection of it may occur. This phenomenon was particularly evident in tests involving frequency modulation, where the frequency measurement exhibited a noticeable delay compared to the actual frequency change.
When considering faults, a different scenario emerges. Here, in terms of the RFE, a significant error in the frequency measurement, sometimes as high as 1 Hz, is observed. This discrepancy arises because during significant transients accompanying faults there are notable changes in the phase angles of the voltages. Consequently, the system encounters challenges in accurately performing the frequency measurement, especially given that these transients typically last around 2–4 cycles (equivalent to 40–80 ms). Moreover, the presence of a fault leads to voltage distortion due to harmonics and sub-harmonics, which operate at frequencies different from the standard 50 Hz. This introduces complexities that can compromise the calculation algorithm within the PMU system.
The findings of this study, therefore, align with a recent analysis assessing the impact of PMU placement, load characteristics, line disconnections, and measurement noise on system observability and stability monitoring [
37].
5. Conclusions
Distribution grids are increasingly intricate, with higher power flows created by the integration of distributed generation systems like photovoltaic and wind systems and cogeneration and electric vehicle charging infrastructure. This intricacy is enhanced by the automation of distribution networks to ensure optimal service continuity and from the possibility of the establishment of microgrids. The integration of various systems underscores the need for advanced monitoring and control mechanisms. Therefore, the volition to integrate PMU systems into distribution grids has sparked a surge in research aimed at developing innovative solutions.
Routine operations on an electric grid generally do not pose significant challenges to PMU systems, particularly considering the HV grid, for their high power. However, in the downstream network with lower power capacity, the system becomes more prone to complications. This susceptibility on the voltage wave, arises from the increased amplitude of transients due to the reduced damping capacity of the grid. Therefore, this issue seem minor when analyzing data from distribution grids, such as those supplied by HV/MV stations, and it becomes more pronounced during testing with cabinets featuring low short-circuit power, such as the MV/LV cabinet.
This work, therefore, aims to provide a testing method for PMUs used in the electrical distribution field through a process that involves simulating a real network and reproducing transient phenomena that can actually occur. This research, therefore, aims to reproduce in laboratory functioning the effects and modes during operation of the PMU that we could actually have in the field. It must be remembered that if there is a large disturbance in the accuracy of the measurements, this can lead to a devastating consequence such as a blackout.
For example, in this case, our tests revealed greater errors in the measurements, especially during transient voltage variations. Specifically, any event causing a transient variation in the voltage phasor resulted in measurement degradation. However, as the transient subsided, measurements returned within the ranges stipulated by the standard.
Regarding specific events, scenarios involving faults notably pushed the system to operate under the most critical conditions, given the higher amplitude and shorter rise time of transients.
Nevertheless, it is essential to emphasize that the measurements swiftly returned to comply with the parameters mandated by the standard, achieving acceptable accuracy within a few cycles once the transient had dissipated. This implies that the tested system, while requiring connection to the grid with appropriate protection systems to prevent damage during faults or critical events like overvoltages can still be utilized for synchrophasor measurement even in the presence of such events.
From a sustainability perspective, this work takes a small but meaningful step toward SDG 7, as it helps pave the way for more reliable and responsive monitoring tools that can ease the integration of renewable energy sources and improve power quality. At the same time, the proposed testing approach addresses SDG 9, by promoting innovation in energy infrastructure for digitalized and resilient power systems.
In future work, voltage transformer models can also be implemented in the simulation to study how these influence the quality of PMU measurements.


