

Net-Sufficiency Evaluation Method Focusing on Product Functions Based on the Living-Sphere Approach


Abstract
1. Introduction
2. Related Works and Approach to This Study
2.1. Index of Human Well-Being
2.2. Satisfaction of Human Needs
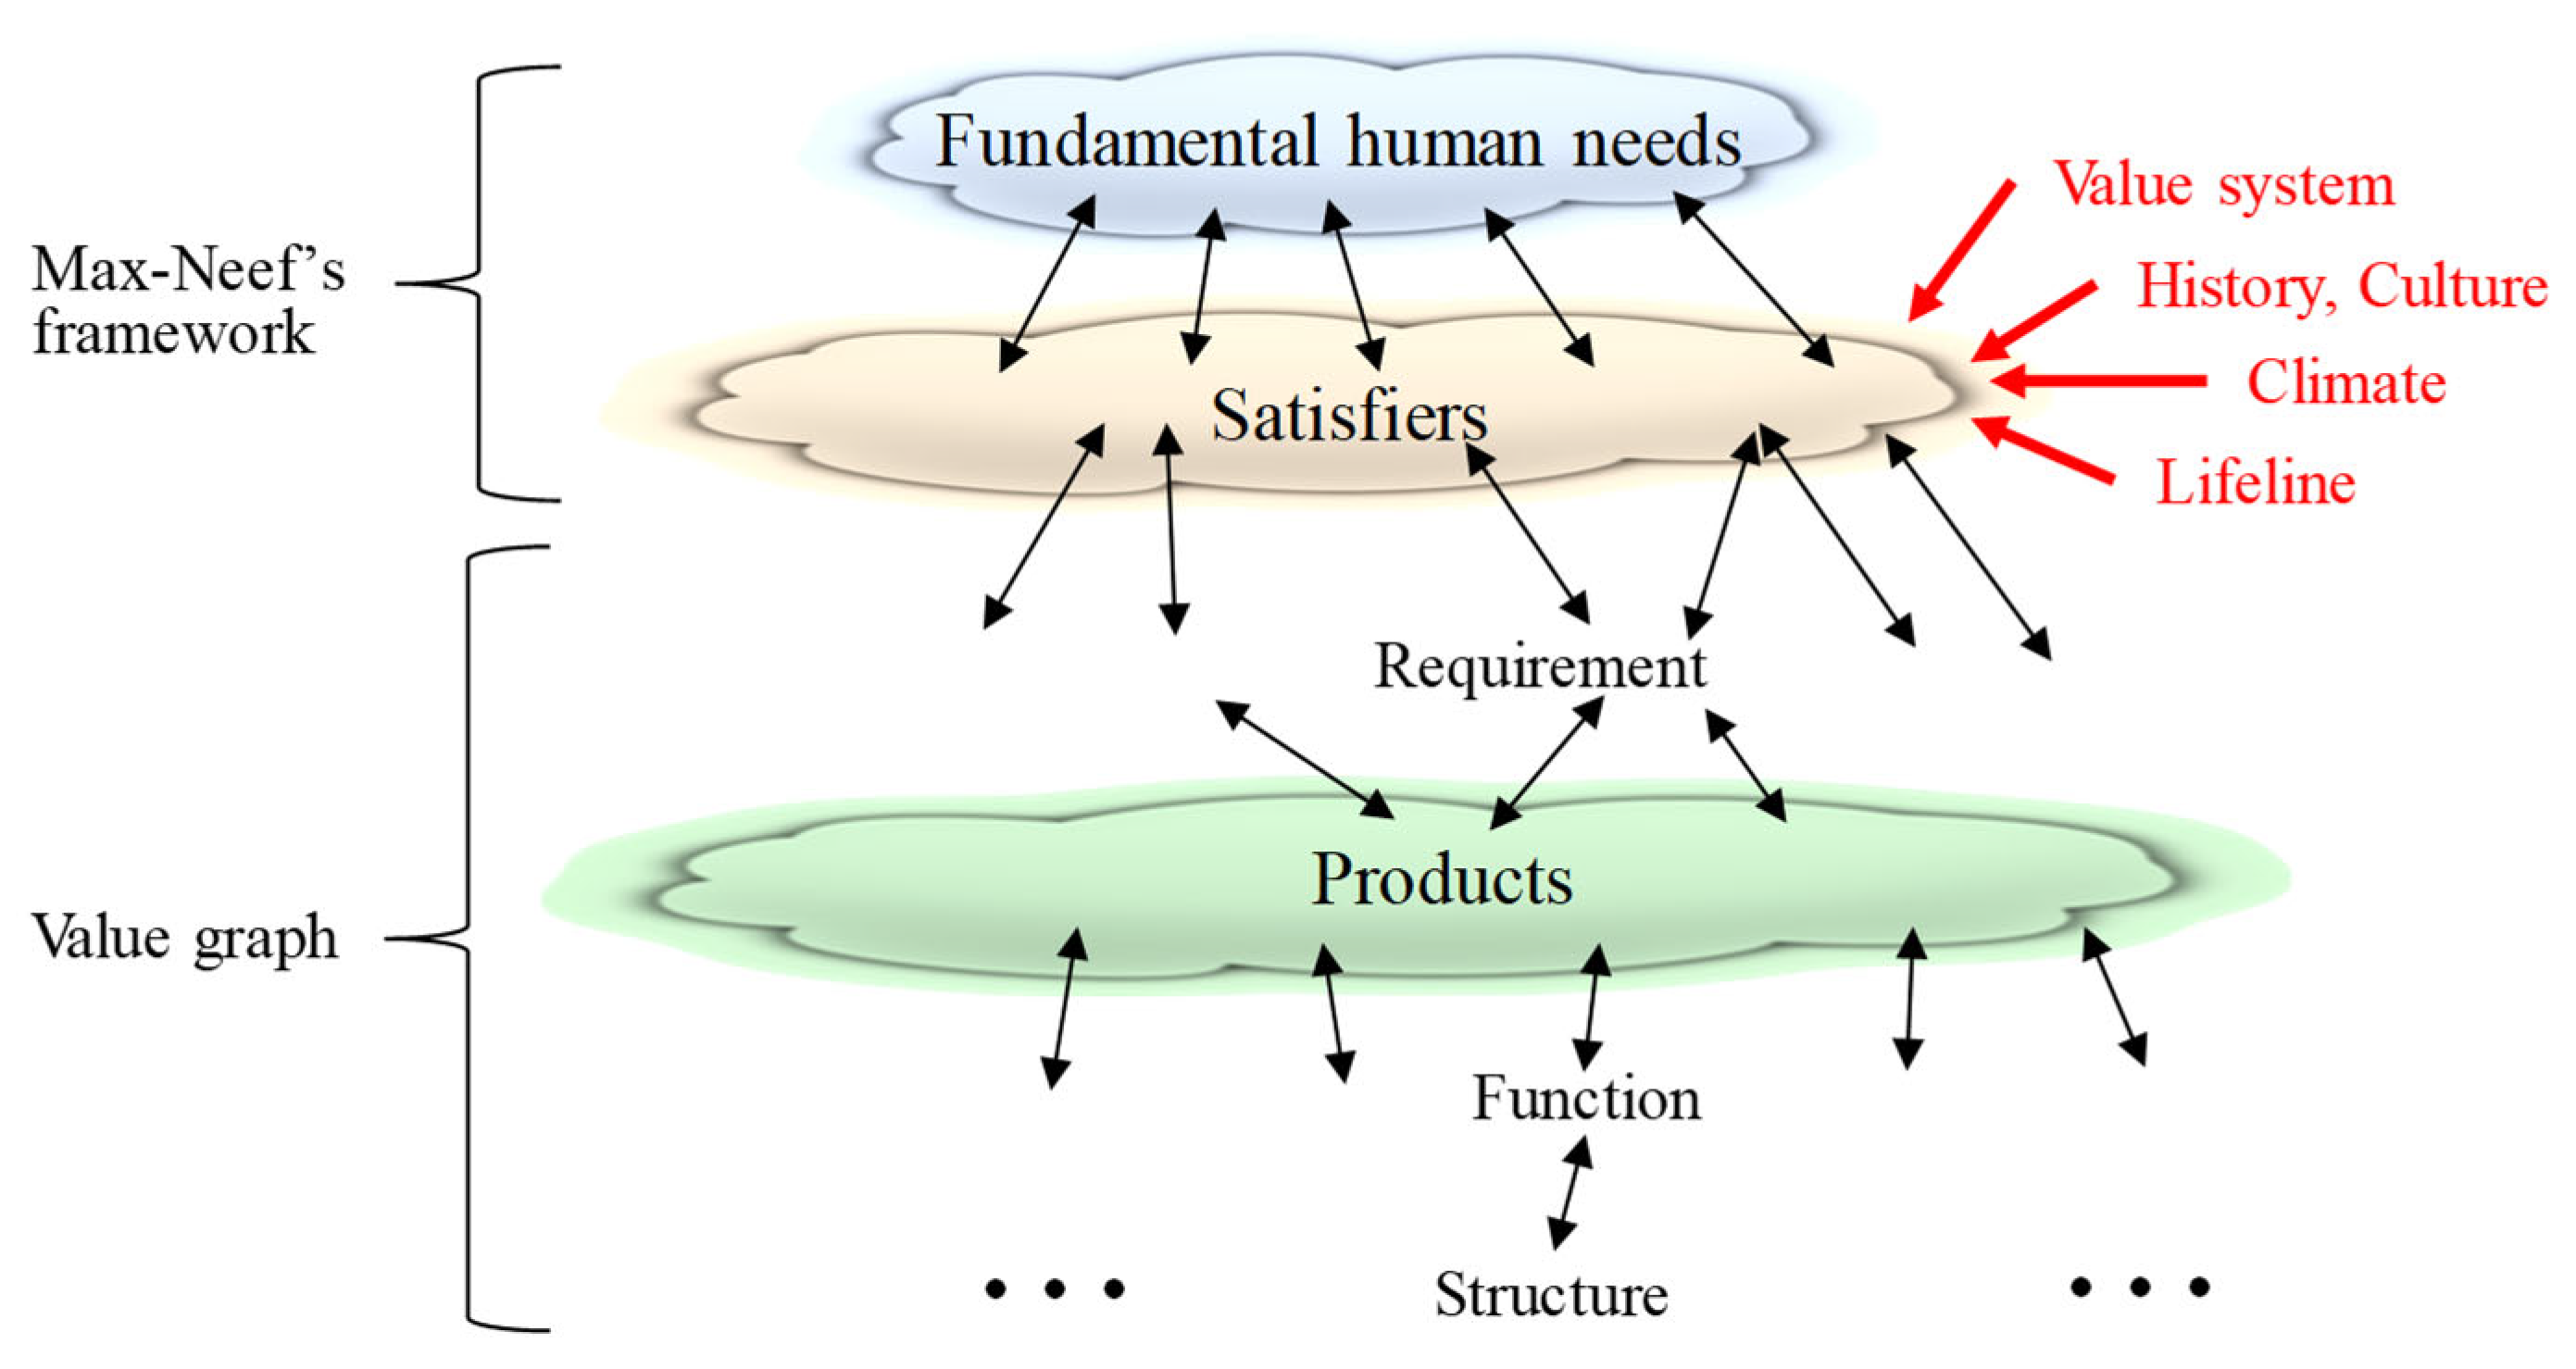
2.3. Concept Connection Method in Product Design
2.4. Approach of This Study
- Spatial: Max-Neef’s framework, originally proposed for Human Scale Development (HSD), is applicable at regional or local levels. This study similarly operates within the spatial scope of everyday life.
- Temporal: Satisfiers evolve over cultural cycles, typically spanning 10–20 years. The data used in this study—satisfiers, barriers, and product lists—were collected within such a timeframe.
- Individual: To reduce variability, satisfiers and barriers were aggregated from workshop data using the Max-Neef method, enabling the study to disregard outlier individual differences.
- Functional: In line with design engineering principles, a product’s function can be defined even if its structure is not. For example, a refrigerator’s primary function is understood as “cooling food”.
3. Method
3.1. Assumptions
- I.
- The nine fundamental needs proposed by Max-Neef are fulfilled simultaneously. As a result, the hierarchy of fundamental needs is eliminated, and all have equal importance. This assumption is based on that of Max-Neef.
- II.
- A fundamental human need can be satisfied to some extent by utilizing product functions. On the other hand, the same functions might cancel out the satisfaction of other human needs.
- III.
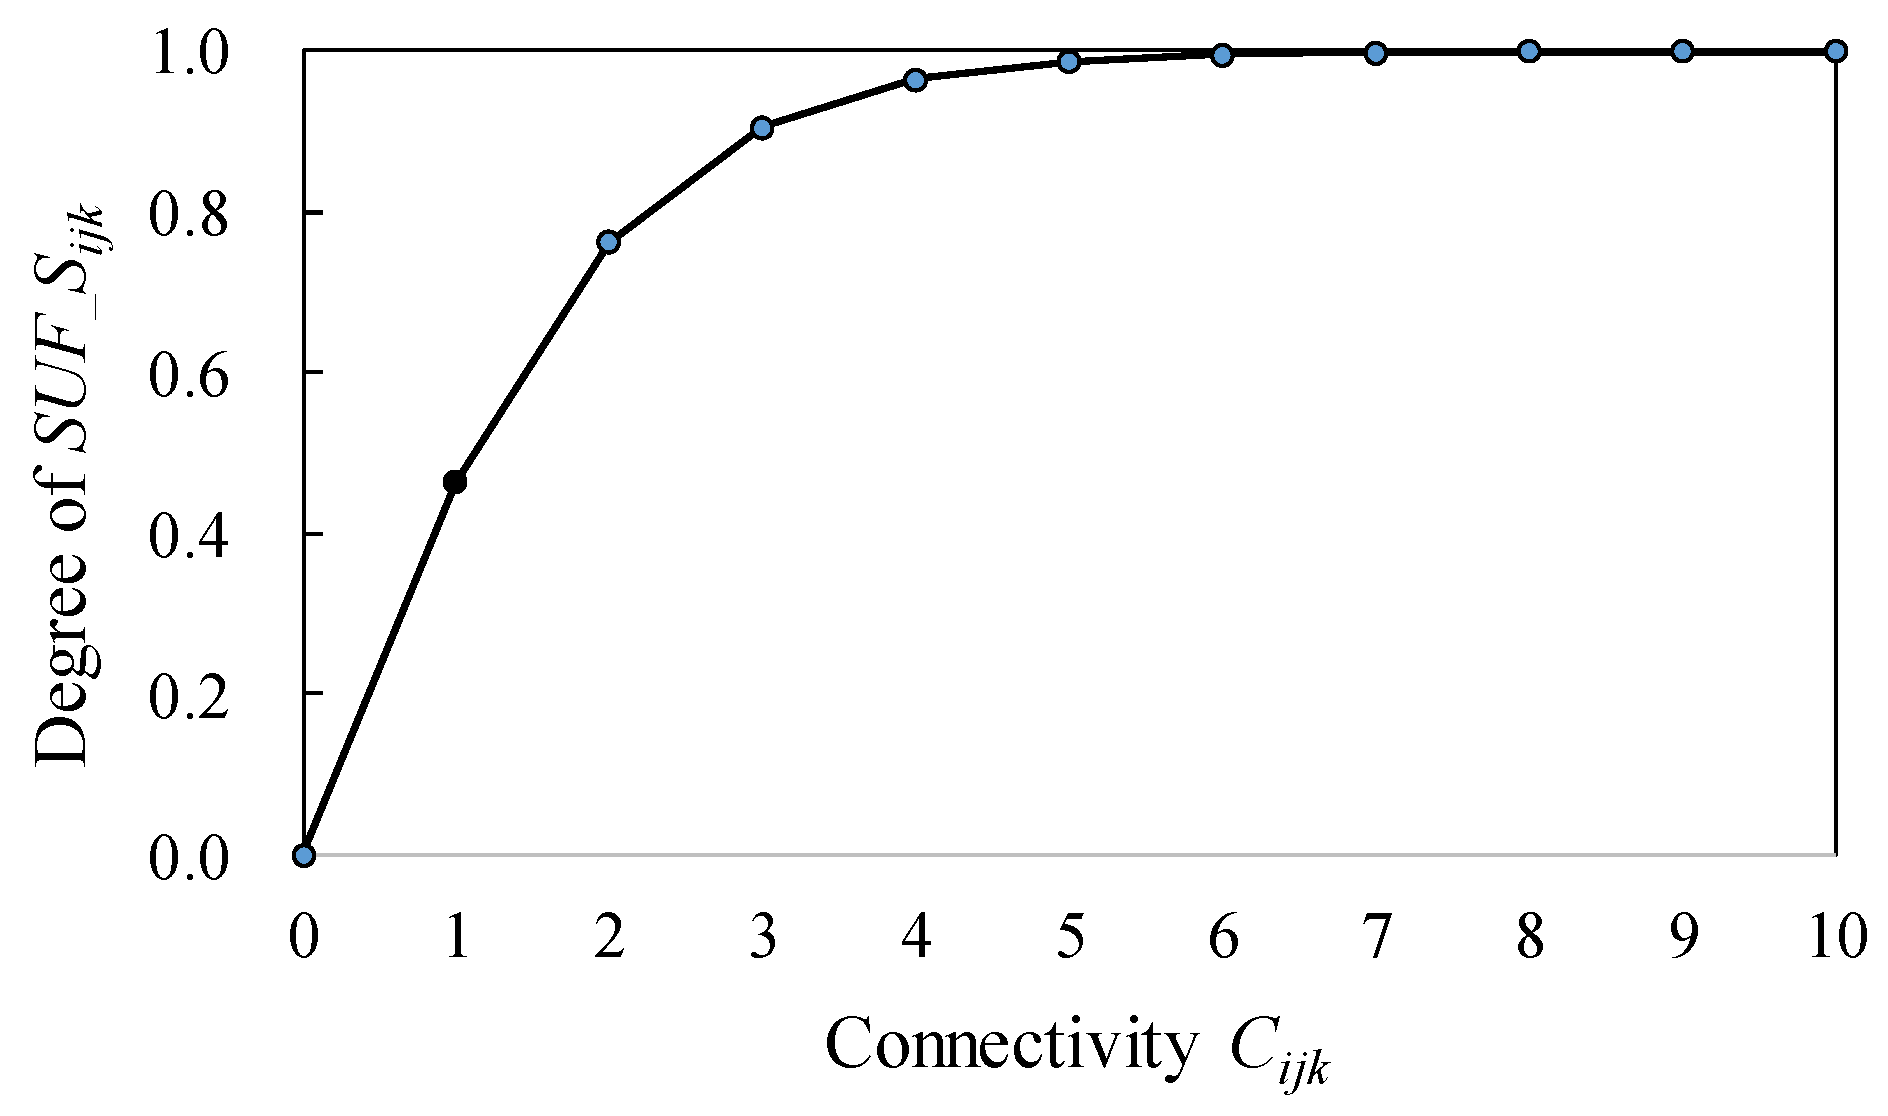
- The satisfaction of fundamental needs increases with increasing connections between product functions and satisfier concepts, and decreases with increasing corresponding barrier connections. In addition, the positive and negative aspects of product functions can be offset in daily life. This assumption is inspired by the “net affect,” which describes mood in the field of psychology [41] and is calculated by subtracting the average score of each negative emotion from that of each positive emotion felt during daily life. In the same way, a total evaluation method for a design concept consisting of multiple solution ideas, in which positive and negative functional effects of the concrete ideas are offset, is widely used in the field of design engineering [42]. In this way, this assumption is grounded in the knowledge integration of psychology and design engineering.
- IV.
- The satisfaction of fundamental needs has both upper and lower limits, and the convergent path to the upper limit is assumed to be similar to that of the diminishing sensitivity of the value function in the prospect theory proposed by Kahneman and Tversky [43] and of the must-be requirements in the model proposed by Kano et al. [44]. The reason for this is to clarify the distinction between satisfying fundamental needs and unlimited desires.
3.2. Evaluation Procedure
- Step 1: Setting the target areas, population, and products used in the target living sphere.
- Step 2: Identification and integration of satisfiers and barriers using Max-Neef’s workshop method.
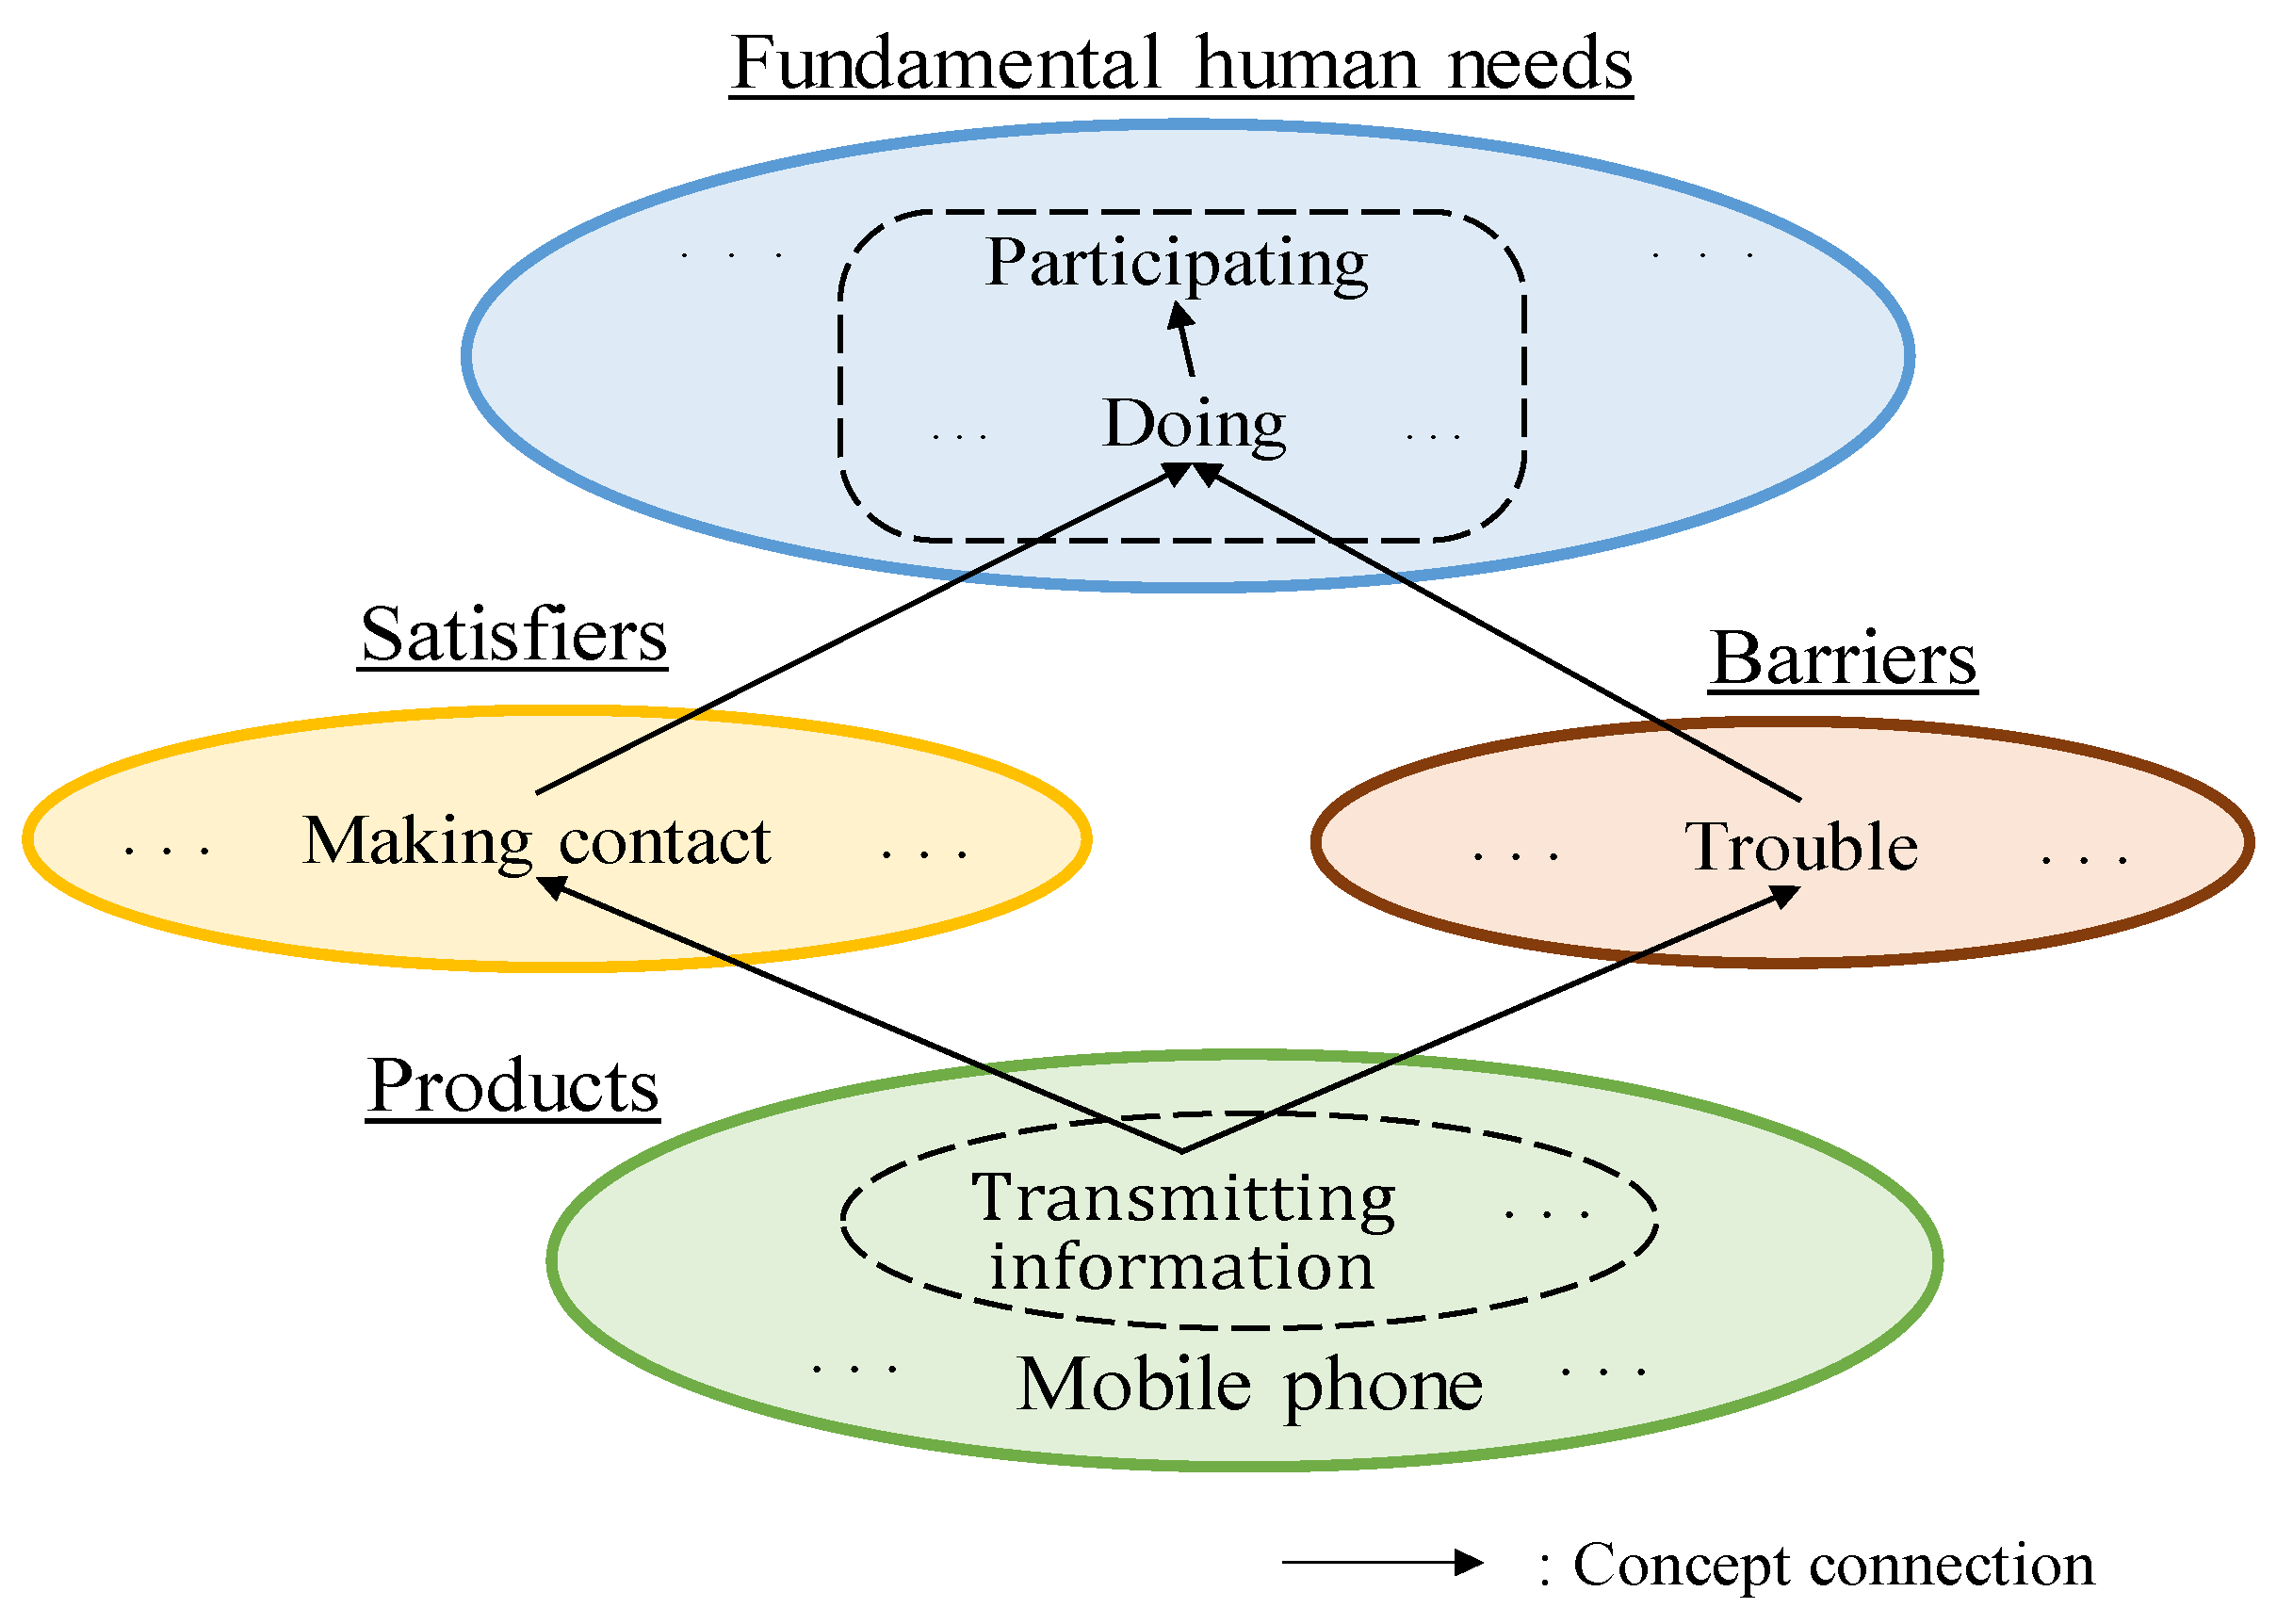
- Step 3: Identifying the conceptual connection from product functions to satisfiers and barriers.
- Step 4: Calculation of the net sufficiency of fundamental needs.
3.3. Formulation
4. Case Studies
4.1. Setting Target Areas, Population, and Products
4.2. Identification and Integration of Satisfiers and Barriers
- (1)
- For each matrix cell, only satisfiers and barriers that were supported by a majority within both subgroups (students and working adults) were retained.
- (2)
- The matrices from the 2018 and 2019 workshops were integrated by merging common items across the two years and preserving unique items from either year that were not contradictory.
4.3. Concept Connection
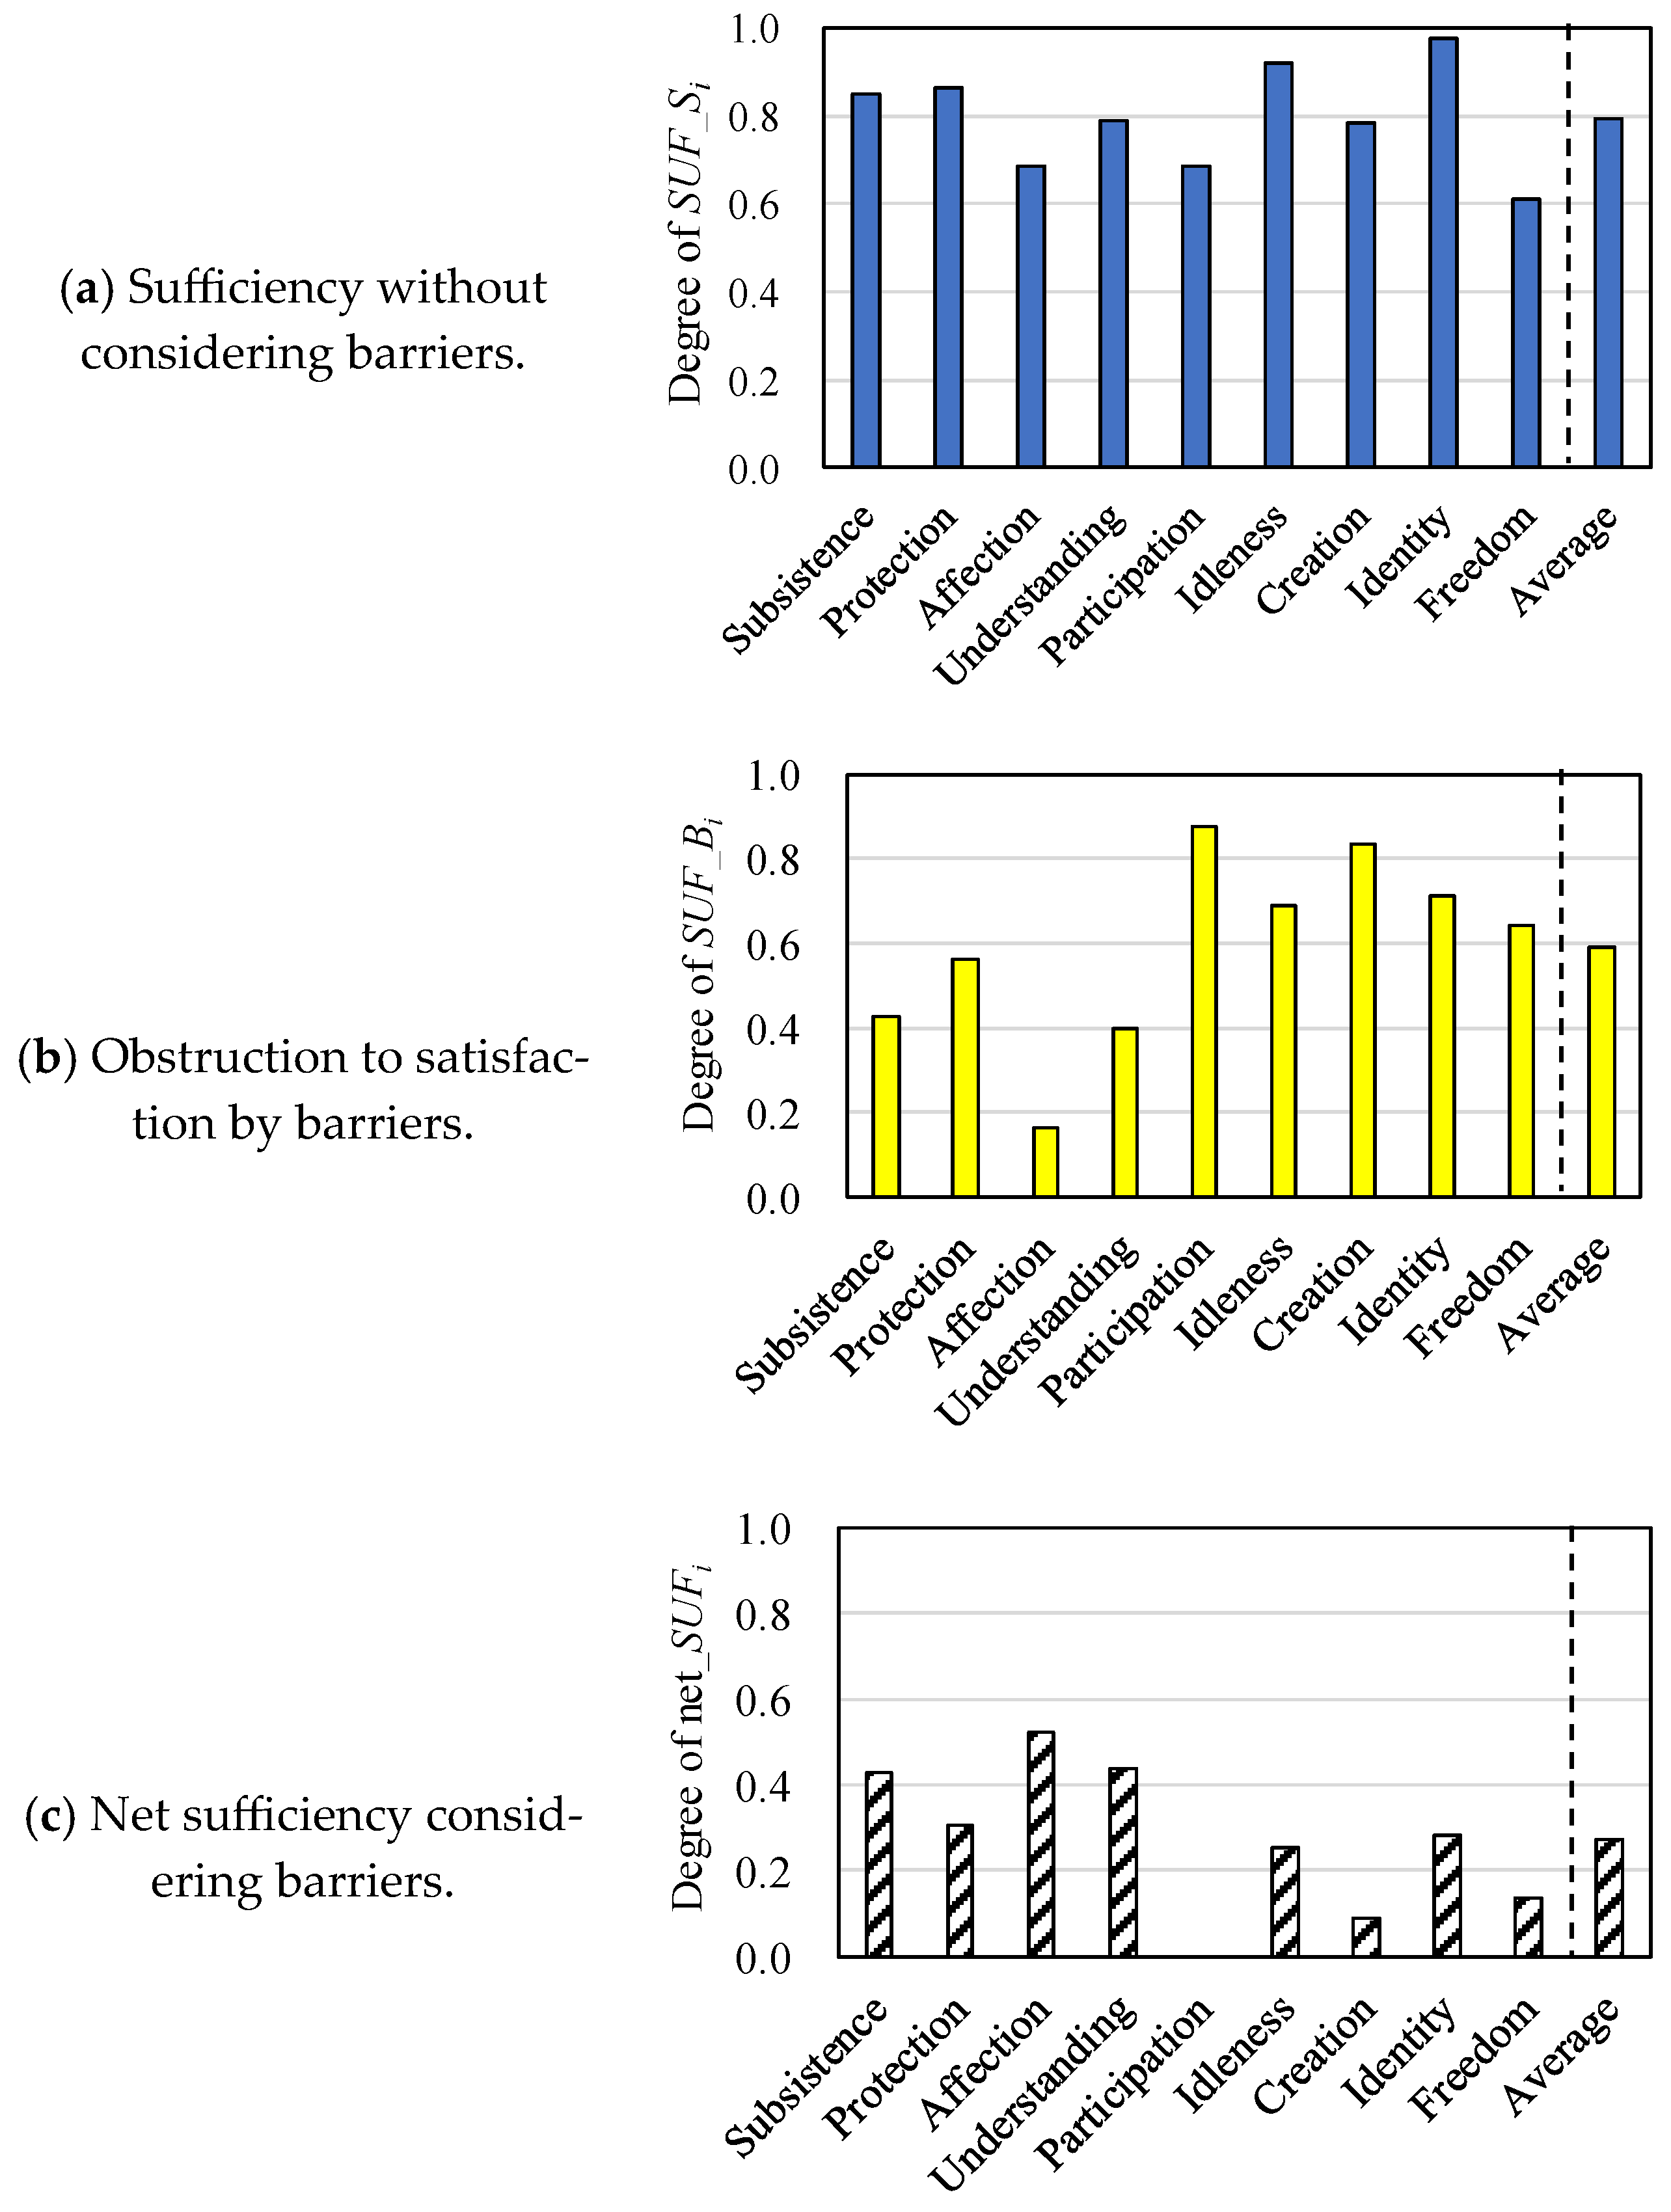
4.4. Calculation of the Net Sufficiency
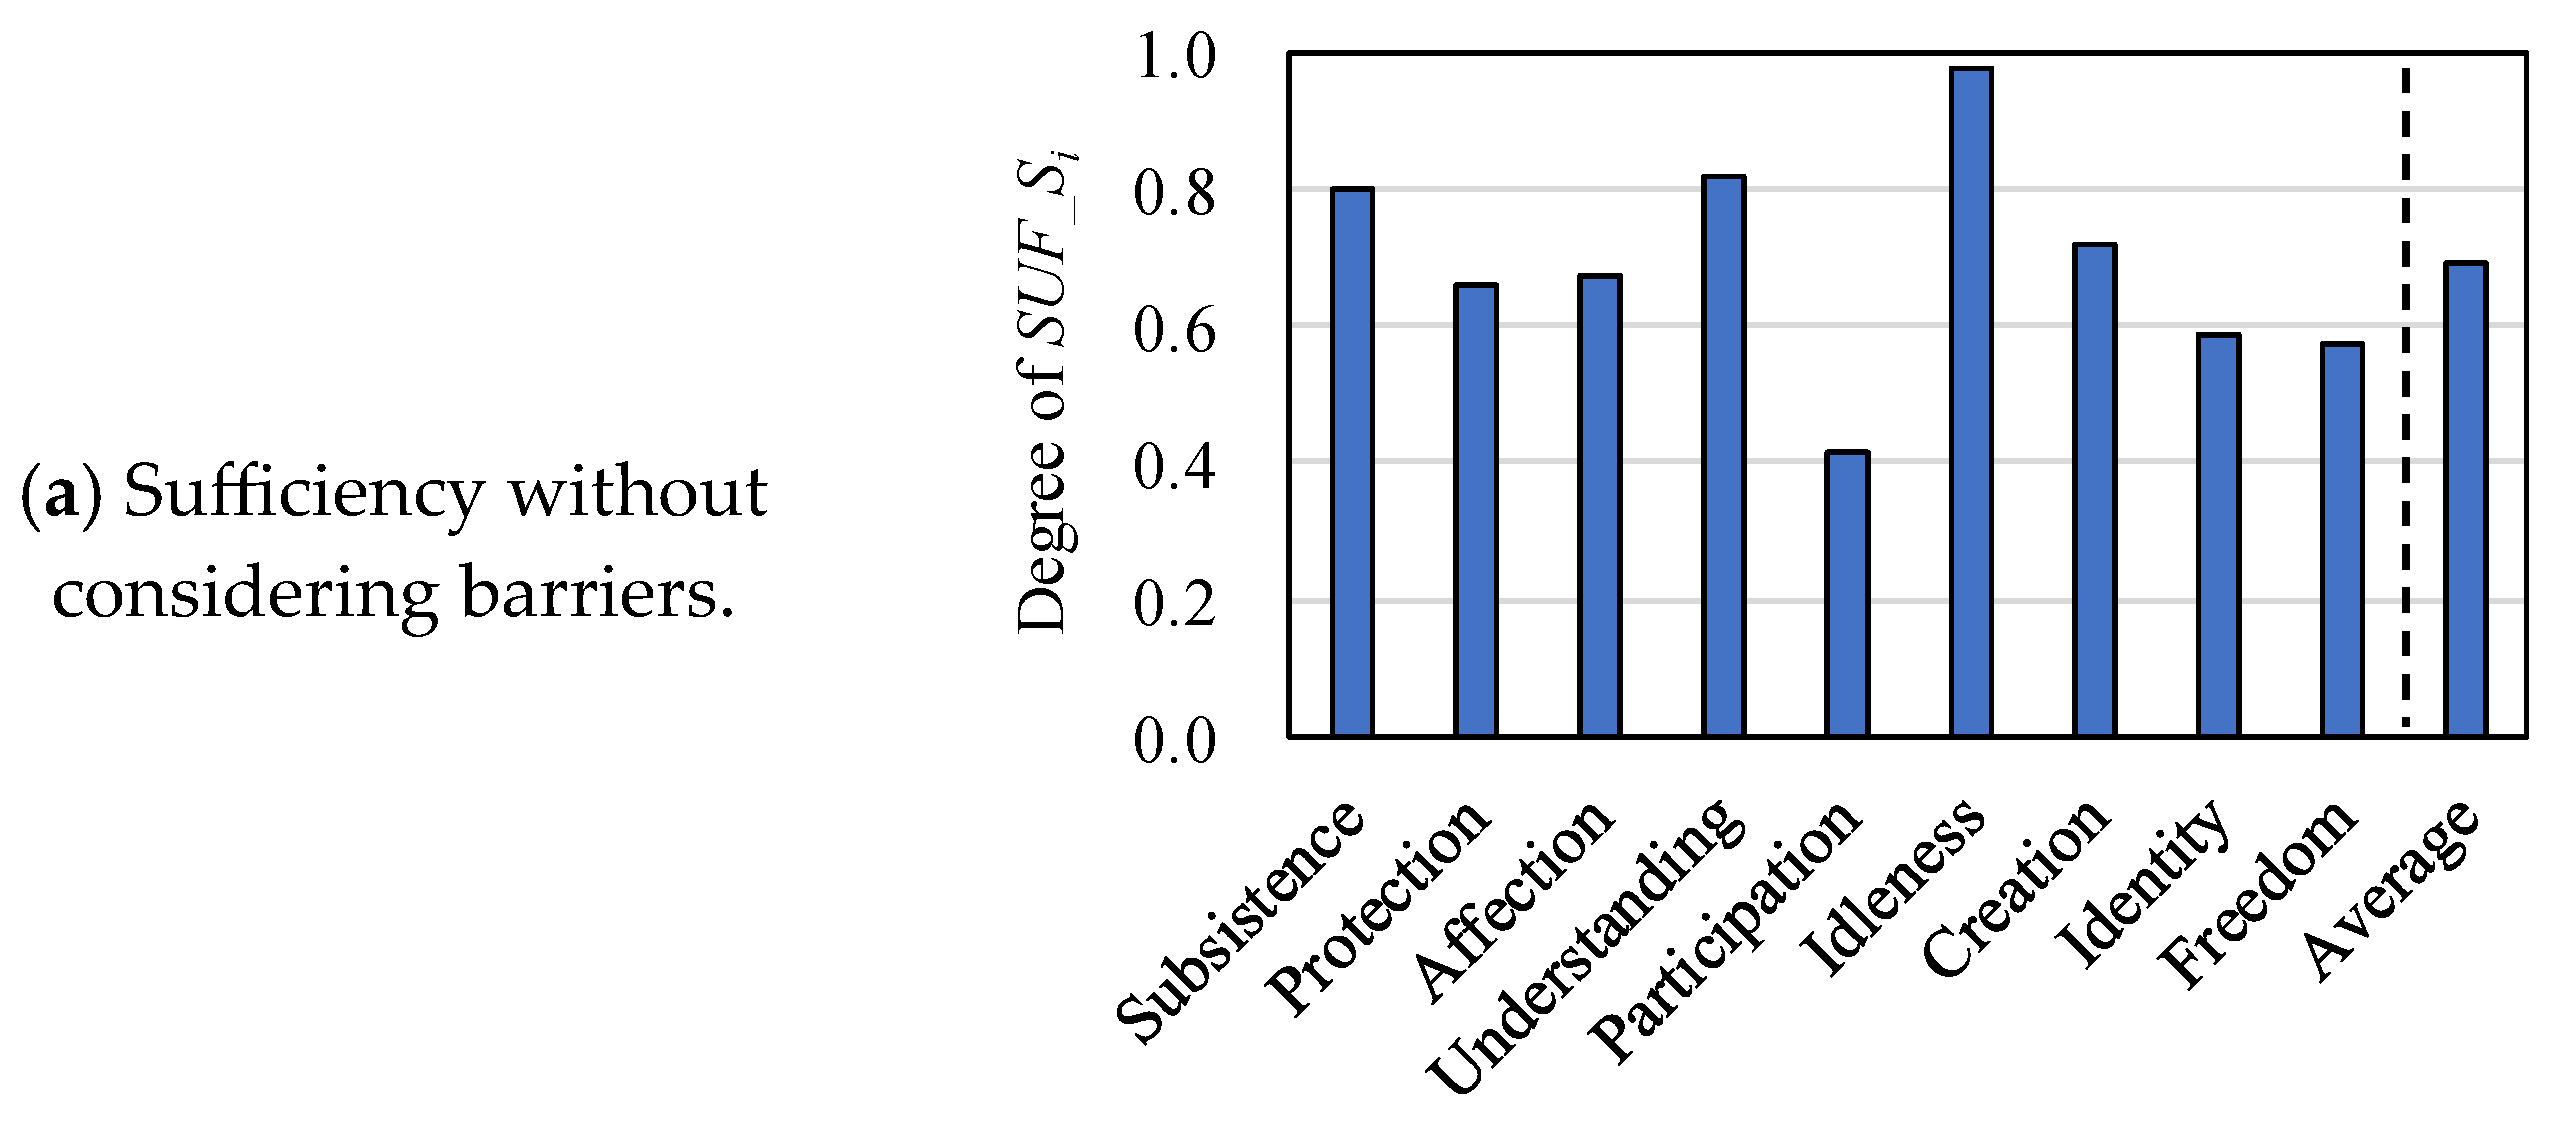
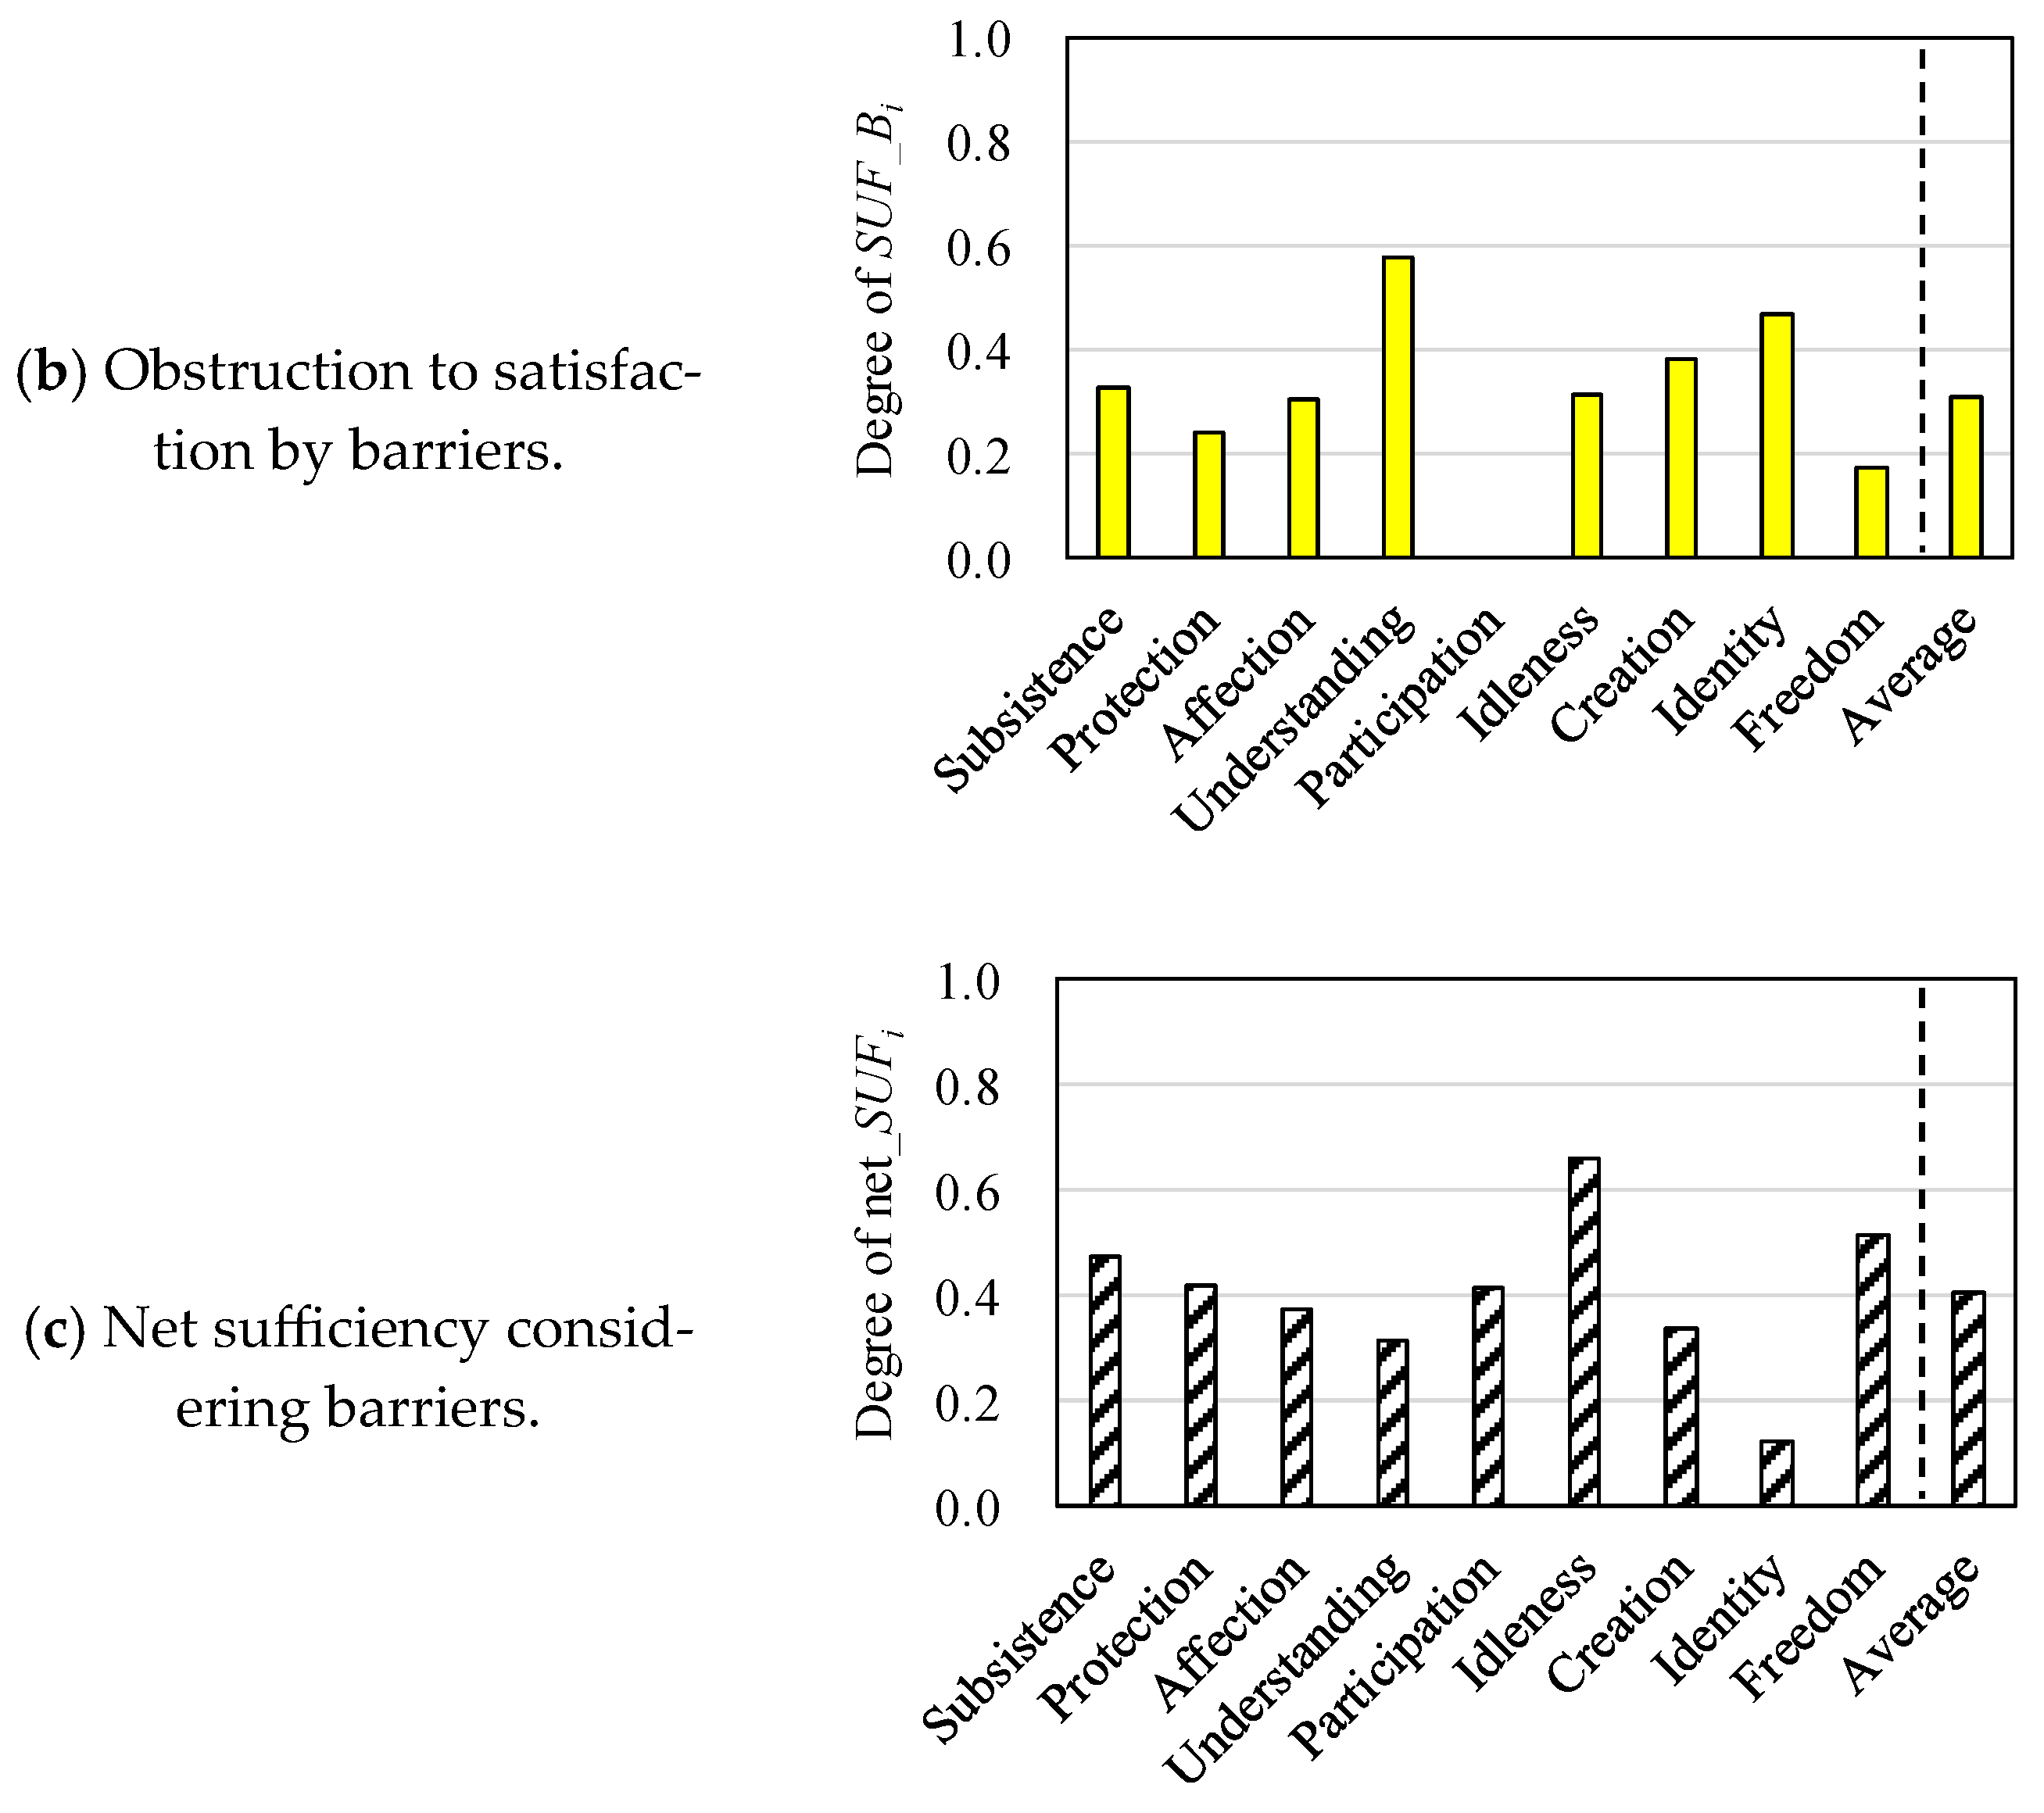
4.4.1. Results in Osaka
4.4.2. Results in Hanoi
5. Discussion
5.1. Calculation Method of the Net Sufficiency
- Policy subsidies could be implemented to promote the uptake of products connected to satisfiers.
- Policy support could also be provided to ban the use of products connected to barriers or to develop alternatives.
- Design products to increase the number of product functions connected to satisfiers or reduce the number of product functions connected to barriers.
- This evaluation information can be used to design a product set that provides the highest net sufficiency with the lowest total material consumption.
5.2. Uncertainty Analysis of the Intensity of Connection Between Product Functions and Satisfiers or Barriers
5.3. Limitations and Future Work
- Although the value of a product is determined by not only its functional use value but also its total economic and emotional values [52], this indicator focuses only on the function of the product during use and cannot reflect emotional aspects related to the product’s structure and attributes, such as memories and attachment, despite the fact that these are related to needs satisfaction. Furthermore, fundamental needs are not satisfied solely by artifacts, such as industrial products; they can also be fulfilled by human communication activities, such as family services and sporting activities, or natural objects, such as pets, wildlife, and the appreciation of mountains and seascapes. The proposed evaluation method excludes such possibilities and focuses solely on the contribution of the functions of products. Therefore, even if the net sufficiency of a product is 1, it does not necessarily mean that all fundamental needs are fully met. The value of net sufficiency is meaningful for relative comparisons when analyzing the artifact environment.
- In this study, regional and cultural differences reflected in satisfiers or barriers and daily-use products were taken into account. The proposed method is computable in any region of the world. However, computability does not necessarily mean that its application is appropriate. Two independent case studies were conducted during this research, and while they provide a reasonable explanation in their individual contexts, it is still too early to conclude whether the evaluation framework can be universally applied in a wider range of contexts.In order to discuss on possibility of cultural interpretation, qualitative comparisons between Osaka and Hanoi are shown. For example, “having food” for satisfying subsistence needs is focused (see Table A4 and Table A6). The number of product functions connected to “having food” was 18 in Osaka and 12 in Hanoi. These included the common products “rice cooker”, “microwave oven” and “refrigerator”, while products representing cultural differences included “system kitchen”, “sealed food containers”, and “plastic wrap” for the former and “threshing machine”, “chemical fertilizers”, and “household ceramics” for the latter (see Table A1 and Table A2).Japanese cuisine demonstrates significant diversity, particularly within urban households such as those in Osaka. In addition to traditional rice-based meals that utilize seasonal ingredients, culinary practices increasingly incorporate both Western and other Asian ingredients [53]. Modern kitchen appliances, sealed containers, and plastic wrap are commonly employed to facilitate the preparation and preservation of various food items. Conversely, in Hanoi, many caregivers—particularly mothers—express considerable concern regarding food safety, often distrusting supermarket claims due to potential chemical contamination [54]. Consequently, there is a growing tendency to cultivate food independently, including vegetables, in urban garden settings [55]. In these cases, the use of threshing machines and chemical fertilizers has been observed or inferred.As this example illustrates, regional and cultural differences can be effectively analyzed using the proposed method. Nonetheless, the study faces limitations arising from ambiguities in product listing and the identification of satisfiers or barriers. These issues warrant continued investigation.
- The inability to eliminate natural language dependency in the conceptual representation of satisfiers, barriers, and functions may have serious consequences for international comparisons. Specifically, the problem is that different languages express vocabulary, grammar, metaphors, and so on, in different ways, such that it is not easy to express subtle concepts, including nuances, equally in different natural languages. In this case study, all workshops to identify satisfiers and barriers in Japan and Vietnam were conducted by local people in each country, namely, facilitators and participants. The satisfiers and barriers written in Vietnamese were then translated into Japanese, and then, the authors developed the conceptual connections. Therefore, Vietnamese-specific nuances may not be reflected in the conceptual connections. The same problem would remain even if the analysts were Vietnamese.
- Another limitation lies in the demographic scope of the workshop participants. The workshops focused on young urban residents (students and working adults under the age of 40) because it was thought that this group would influence future consumption and sustainability trends. However, the values, preferences, and lifestyles of this group may not be representative of older populations, rural communities, or individuals with different cultural or socioeconomic backgrounds. This could affect the types of satisfiers and barriers identified, as well as the perceived importance of various product functions. To mitigate sampling-related bias, the study employed a dual integration process—first within subgroups (students and working adults), and then across two consecutive years—to enhance internal consistency. Nevertheless, the results may still reflect a limited social perspective. Future case studies should expand the scope of the sample to include a broader demographic range, exploring whether alternative or minority viewpoints generate significantly different sufficiency profiles.
- The net sufficiency value depends on the contents of the set of satisfiers and barriers. Although workshops for identifying satisfiers and barriers are proceduralized, uncertainty remains because of the participants, in addition to the facilitation, atmosphere, and circumstances of the workshop. In this study, to reduce the uncertainty caused by sampling participants as much as possible, common satisfiers and barriers were selected through two combinations: commonization within and integration between the workshop groups. Although this reduced the variation in the set of satisfiers and barriers, it also sacrificed diversity. When diversity is maintained, a trade-off occurs between diversity and the region representativity of the satisfiers and barriers. Furthermore, care is needed when making a product list. Critical products with high sensitivity to need fulfillment or obstacles have to be described in product lists.
- Essentially, a product’s function is the result of the subjective recognition of its potential use by users based on various motivations. The satisfiers and barriers are also concepts that share the subjective recognition of the workshop participants. Therefore, subjectivity in the analysis cannot be excluded when forming a connection between the product’s functions and the concepts of satisfiers or barriers. In this study, the validity of the connections was verified by several people to reduce personal bias while establishing the relationships.
- Product possession status, such as the diffusion rate, should be incorporated. In this case study, all households owned the products given in the list of products (i.e., the diffusion rate was assumed to be 100%); however, to assess the sufficiency of the average household in the target area, sufficiency should be assessed considering the diffusion rate of each product. Incorporating actual diffusion rates to the intensity of the connection between function and satisfier or barrier would significantly improve the actual applicability of the evaluation for policy and design decisions. Future versions of the model should be explored how changes in diffusion rates affect net sufficiency outcomes. Currently, statistical data on the diffusion rate of household products is limited to some durable appliances such as refrigerators and washing machines, and data on other small consumable products is not available. It is necessary to consider methods for estimating the actual diffusion rate of these small products.
- A method that considers differences in the level of functional value realization (i.e., grade and performance differences) and reflects this in the intensity of connectivity should be developed. Appropriate reflection of differences in the mode of function offering, such as product ownership or leasing, in connection intensity could also be an issue for the future.
- A verification method should be established. As the scope, target, and focus of this indicator differ from other similar indicators (e.g., SWB), a simple comparison with the evaluation results of other indicators is not possible. It may be useful to survey the residents of the target area regarding their degree of life satisfaction with the product groups considered to contribute to the fulfillment of fundamental needs, and to examine the relationship between this and the degree of fulfillment.
- The proposed method targets product functions within the living sphere and, as such, does not consider user experience or services directly provided by humans and the environment. In the future, a more comprehensive understanding of universal and fundamental needs sufficiency will be possible if a method is devised to combine or integrate the net sufficiency with such factors.
- The means–end hierarchy [36,37,38] has a somewhat similar structure to the proposed evaluation framework, in terms of the concept connection between a product’s attributes and functions and its psychological consequences and terminal values. However, the connection between a product’s functions and its satisfiers or barriers in the proposed framework differs. An application of means–end hierarchies for cross-cultural studies has been reported, and multivariate statistical analysis was adopted [56]. This method is applicable when the number of terminal values and product attributes is not too high. Therefore, if a standardized method for evaluating product functions and satisfiers or barriers is developed, then cross-cultural comparison of net sufficiency may be possible. Furthermore, the cognitive structure of means–end chains of high-context cultures, such as in China and Japan, tends to be more complex than that of low-context cultures, such as in the USA and Germany [57]. Therefore, it is suggested that the difficulty of the concept connection between a product’s function and its satisfier or barrier varies. Understanding the relationship between concept connection and cultural context is also a subject for future work.
- Integrating emotional or symbolic product value and usage value by product function is also future work. Generally, the emotional value of a product is strongly related to product appearance, namely attributes, structures, surfaces, materials, and so on. We have developed a method for connecting concepts from structures via functions to satisfiers or barriers by reverse engineering and the laddering method [40]. This concept connection method can be used to expand the proposed evaluation framework. Furthermore, Kansei Engineering is a technology that meets consumers’ emotional demands by quantifying their sensibilities through engineering methods to support product design [58,59]. In future applications, these methods could provide a way to incorporate the emotional aspect into the net sufficiency framework from an engineering perspective.
6. Conclusions
Author Contributions
Funding
Institutional Review Board Statement
Informed Consent Statement
Data Availability Statement
Acknowledgments
Conflicts of Interest
Correction Statement
Abbreviations
| HDI | Human Development Index |
| HSD | Human Scale Development |
| HWBI | Human Well-Being Index |
| QFD | Quality Function Deployment |
| SCP | Sustainable Consumption and Production |
| SSI | Sustainable Society Index |
| SWB | Subjective Well-Being |
Appendix A

| System bus | Warm water bidet seat | Water heater | System kitchen | Carport |
| Locks | Paint | Propane gas | Kerosene | Rice cookers |
| Microwave oven | Electric kettles | Gas stoves | Electric refrigerators | Electric vacuum cleaners |
| Electric washing machines | Electric irons | Room air conditioners | Oil heaters | Electric blankets |
| Air purifiers | Wardrobes | Kitchen cabinets | Dining sets | Alarm clocks |
| Lighting fixtures | Carpet | Curtains | Bedding | Sealed food containers |
| Tableware | Cookware | Scrub brushes | Lampshades | Towels |
| Mats | Clothes hangers for drying | Vinyl hoses | Health meters | Water purifiers |
| Plastic wrap | Plastic bags | Kitchen paper | Tissue paper | Toilet paper |
| Dishwashing detergent | Laundry detergent | Fabric softener | Insecticide | Insect repellent |
| Deodorant spray | Clothing | Men’s socks | Footwear | Fabric boots |
| Athletic shoes | Cold medicine | Fever and pain reliever | Nasal allergy medication | Digestive medicine |
| Vitamin supplements (vitamin-containing health supplements) | Vitamin supplements (vitamin-based medicinal preparations) | Energy drinks | Skin medication | Pain-relieving patches |
| Eye drops | Traditional Chinese medicine | Bath additives | Sanitary napkins | Face masks |
| Glasses | Thermometers | Disposable diapers (infant) | Disposable diapers (adult) | Contact lenses |
| Contact lens solution | Blood pressure monitors | Hearing aids | Support braces | City bicycles |
| Electric bicycles | Motorcycles | Gasoline for cars | Car tires | Car batteries |
| Car navigation systems | Electronic toll collection (ETC) devices for cars | Car wax | Landline phones | Mobile phones |
| Liquid crystal display (LCD) TVs | Portable audio players | Video recorders | Cameras | Video cameras |
| Educational study aids | Personal computers | Printers | Electronic dictionaries | Ballpoint pens |
| Markers | Notebooks | Transparent adhesive tape | Pencil cases | Scissors |
| Office paper | Printer ink | Gloves | Golf clubs | Tennis rackets |
| Fishing rods | Sports shoes | Training pants | Swimwear | Dolls |
| Handicap-accessible vehicles | Assembled assistive devices for people with disabilities | Home gaming consoles | Video games | Video software |
| Cut flowers (carnations) | Cut flowers (chrysanthemums) | Cut flowers (roses) | Horticultural fertilizers | Horticultural soil |
| Plant pots | Potted plants | Pet food | Pet litter box supplies | Dry batteries |
| Recordable disks | Memory cards | Newspapers | Electric shavers | Toothbrushes |
| Facial soap | Shampoo | Hair conditioner | Toothpaste | Hair dye |
| Body soap | Facial cleanser | Hair gel | Hair tonic | Body cream |
| Toner | Foundation makeup | Lipstick | Lotion | Men’s umbrellas |
| School backpacks | Rings | Watches | Handkerchiefs |
| Pet food | Towels | Socks | Leather shoes | Laundry soap |
| Paint | Glass and glassware | Light bulbs | Tobacco | Textiles |
| Clothing | Footwear | Boots | Athletic shoes | Paper and cardboard |
| Newspapers and other printed materials | Chemical fertilizers | Nitrogen, phosphorus, potassium (NPK) fertilizers | Insecticides | Pesticides |
| Shampoo | Conditioner | Toothpaste | Shower cream | Facial wash |
| Soap | Car tires | Motorcycle and bicycle tires | Car tire tubes | Motorcycle and bicycle tire tubes |
| Plastic packaging materials | Household ceramics | Sanitary ceramics | Bricks | Tiles |
| Printers | Telephones | Mobile phones | Televisions | Battery power source |
| Lighting fixtures | Rice cookers | Microwave oven | Home refrigerators and freezers | Vacuum cleaners |
| Water heaters | Home washing machines | Home fans | Air conditioning | Threshing machines |
| Automobiles | Motorcycles | Bicycles |
| Osaka | Hanoi | ||||||||
|---|---|---|---|---|---|---|---|---|---|
| Students | Young Working Adults | Students | Young Working Adults | ||||||
| Year | Gender | For Satisfiers | For Barriers | For Satisfiers | For Barriers | For Satisfiers | For Barriers | For Satisfiers | For Barriers |
| 2018 | Male | 2 | 3 | 2 | 3 | 3 | 3 | 2 | 3 |
| Female | 3 | 2 | 3 | 2 | 3 | 3 | 3 | 2 | |
| 2019 | Male | 3 | 3 | 3 | 2 | 2 | 3 | 3 | 2 |
| Female | 2 | 2 | 2 | 2 | 3 | 2 | 2 | 3 | |
| Being | Having | Doing | Interacting | |
|---|---|---|---|---|
| Subsistence | Healthy Food available Able to lead a daily life | Money Food A place to live A guardian Ability to think | Eating Sleeping Talking Exercising | Water Electricity Air Temperature Moderate temperature Family and friends |
| Protection | Protected by a home or building Loved | Family Insurance | Acting with consideration for others Treating others with love | No hindrance to survival Local community People are close to each other |
| Affection | Happy Able to help companions Considerate With a partner | Someone to love Compassion A partner A pet Friends | Having a conversation Being interested in someone Treating others with care Showing consideration Expressing feelings Meeting | N/A |
| Understanding | Able to have a conversation Understand the language Able to explain to others Able to think logically Empathic Understanding the other person’s thoughts | Knowledge An open mind Tolerance Language skills | Having a conversation Educating Having interests Obtaining information Trying to know someone | Environment for exchanging opinions Place to gain knowledge Same language Something to learn Social networking services (SNSs) |
| Participation | Belonging somewhere Motivated | Necessary knowledge A shared purpose Curiosity Determination Friends | Promoting oneself Making contact Taking the initiative Joining a community Going out Asserting an opinion Acting Belonging | Understandable language Freedom of speech Means of communication |
| Idleness | Unproductive Relaxed Well-rested At ease | Time A calming space Freedom A margin Wealth | Lying down Doing nothing Sleeping Resting | Uninterrupted Unrestricted Safe and relaxing place No impending danger Place to unwind |
| Creation | Mindful Relaxed mind Time enough Expressive In a writing state | Knowledge Skills and abilities Materials A purpose to create Imagination Money Experiences Tools to express oneself | Gathering information Gathering materials Challenging oneself | People to evaluate Freedom to act Ability to interact with others People willing to cooperate Unlimited resources, facilities |
| Identity | Recognized by others Affirmed | People who accept you Hobbies | Recognizing Becoming absorbed in something Knowing the difference from others Facing oneself | Acceptance Unrestricted environment Freedom to decide what to do |
| Freedom | Unburdened by time constraints Unrestrained | N/A | Doing what you want to do | Minimal bias in thinking Peaceful Respect for human rights Freedom of speech |
| Being | Having | Doing | Interacting | |
|---|---|---|---|---|
| Subsistence | Illness Affected by a disaster Sleep-deprived Short of money Stressed | An illness An earthquake-prone house | N/A | War Lack of infrastructure Food shortage Social isolation and individualism |
| Protection | Lonely | Grudges Prejudices | Rejecting | Lack of support Inadequate social security |
| Affection | Without family | N/A | Acting violent Refusing to have a conversation Dominating | Life without feeling loved |
| Understanding | Unable to communicate because of a language barrier Short on communication Prejudiced Selfish | Biases | N/A | N/A |
| Participation | Financially poor Unmotivated Busy Prejudiced | A job Children A sickness Tasks | Causing trouble | No means of transportation Busy environment Conformity pressure |
| Idleness | Busy | Work | Working | N/A |
| Creation | Financially poor | A satisfied life | Denying | Pressure to conform and be like everyone else Lack of outlets for self-expression |
| Identity | Under pressure | Preconceptions | Copying others | Conformity pressure Refusal to acknowledge differences Tendency to criticize quickly |
| Freedom | Busy | Responsibilities A family A job | Restraining or restricting Committing a crime | N/A |
| Being | Having | Doing | Interacting | |
|---|---|---|---|---|
| Subsistence | Joyful Fit Sufficient | A home Food Money Drinking water Clothes | Enjoying leisure time Breathing Eating Drinking Resting Exercising Working | Interactions Conversations Love Clean air Good society |
| Protection | Sound Protected | Protective gear Insurance | Staying healthy Having, showing interest Helping | Environmental protection Prevention of flood disasters Rule of law |
| Affection | Beloved Happy Enjoyable Interested | Spouse/partner/lover | Loving Sharing Kissing Hugging Taking care of someone Having, showing interest Communicating, exchanging | Interactions Care Love |
| Understanding | Knowledgeable | Books Knowledge Qualifications Life skills Learning materials | Researching Reading books Learning | Group learning Kind community |
| Participation | Enthusiastic Excited Fun Sociable Proactive Friendly | Responsibilities | Expressing opinions Participating in social activities Working Going out to play Becoming more proactive | N/A |
| Idleness | Refreshing Comfortable Restful | Games A car Time | Playing games Reading books Playing Participating in social activities | Group participation Talking |
| Creation | Imaginative Thoughtful | Wisdom Sensibility | Drawing pictures Understanding issues | Considering others’ opinions |
| Identity | Active Passionate Outgoing Diligent Mindful | N/A | Going to festivals | Cultural enlightenment activities Civilized and equal society Open society |
| Freedom | In control | Money Vested interests A private space | Talking Going on trips Doing things one likes Shopping Listening to music | N/A |
| Being | Having | Doing | Interacting | |
|---|---|---|---|---|
| Subsistence | Poor | No food No money | Losing a job | Illness War Disaster Environmental pollution |
| Protection | Threatened | Too much money | N/A | N/A |
| Affection | Lonely Heartbroken | N/A | Getting jealous Cheating on (a partner) | Lack of intimacy |
| Understanding | Conservative Arrogant Not eager to learn | No excellent teachers No access to the Internet Poor social skills | Unable to endure studying Neglecting to understand | Lack of interaction |
| Participation | N/A | Limited time | Acting irregularly | N/A |
| Idleness | Scared Boring | N/A | Doing a job Overthinking Getting married, having a family | Harsh weather |
| Creation | N/A | Lacking knowledge | Not thinking Imitating | N/A |
| Identity | Inferiority complex Unpassionate | N/A | Judgment from society Imitating a large crowd | Lack of respect |
| Freedom | Forbidden Anxious | N/A | N/A | Interstate conflicts |
References
- United Nations Environment Programme (UNEP). ABC to SCP. 2010. Available online: https://sustainabledevelopment.un.org/index.php?page=view&type=400&nr=945&menu=1515 (accessed on 26 March 2025).
- United Nations Development Program (UNDP). Sustainable Development Goals. 2023. Available online: https://www.undp.org/sustainable-development-goals (accessed on 26 March 2025).
- Jackson, T. Motivating Sustainable Consumption—A Review of Models of Consumer Behavior and Behavioral Change, A Report to the Sustainable Development Research Network. 2005. Available online: https://timjackson.org.uk/wp-content/uploads/2018/04/Jackson.-2005.-Motivating-Sustainable-Consumption.pdf (accessed on 26 March 2025).
- Jackson, T. Live better by consuming less?—Is there a “double divided” in sustainable consumption? J. Ind. Ecol. 2005, 9, 19–36. [Google Scholar] [CrossRef]
- Organisation for Economic Co-Operation and Development (OECD). How’s Life? 2020: Measuring Well-Being. 2020. Available online: https://www.oecd.org/en/publications/how-s-life/volume-/issue-_9870c393-en.html (accessed on 26 March 2025).
- Kobayashi, Y.; Kobayashi, H.; Hongu, A.; Sanehira, K. A practical method for quantifying eco-efficiency using eco-design support tools. J. Ind. Ecol. 2005, 9, 131–144. [Google Scholar] [CrossRef]
- Hauschild, M.; Kara, S.; Røpke, I. Absolute sustainability: Challenges to life cycle engineering. CIRP Ann.-Manuf. Technol. 2020, 69, 533–553. [Google Scholar] [CrossRef]
- Rawarth, K. Doughnut Economics; Random House Business Books: London, UK, 2017. [Google Scholar]
- Hirao, M.; Tasaki, T.; Hotta, Y.; Kanie, N. Policy development for reconfiguring consumption and production patterns in the Asian region. Glob. Environ. Res. 2021, 25, 3–14. [Google Scholar]
- Tsurumi, T.; Yamaguchi, R.; Kagohashi, K.; Managi, S. Material and relational consumption to improve subjective well-being: Evidence from rural and urban Vietnam. J. Clean. Prod. 2021, 310, 127499. [Google Scholar] [CrossRef]
- Cooper, T. Slower consumption–Reflections on product life spans and the “throwaway society”. J. Ind. Ecol. 2005, 9, 51–67. [Google Scholar] [CrossRef]
- Tukker, A.; Cohen, M.J.; Hubacel, K.; Mont, O. The impact of household consumption and options for change. J. Ind. Ecol. 2010, 14, 13–30. [Google Scholar] [CrossRef]
- Schlesier, H.; Schafer, M.; Dsing, H. Measuring the doughnut: A good life for all is possible within planetary boundaries. J. Clean. Prod. 2024, 448, 141447. [Google Scholar] [CrossRef]
- Kobayashi, H.; Fukushige, S.; Murata, H. A framework for locally-oriented product design using extended function-structure analysis and mixed prototyping. Glob. Environ. Res. 2021, 25, 43–50. [Google Scholar]
- Max-Neef, M.A. Human Scale Development; The Apex Press: New York, NY, USA, 1991. [Google Scholar]
- Kobayashi, H.; Fukushige, S. A living-sphere approach for locally oriented sustainable design. J. Remanufacturing 2018, 8, 103–113. [Google Scholar] [CrossRef]
- Hadar, A.; Hadas, I.; Lazarovits, A.; Alyagon, U.; Eliraz, D.; Zangen, A. Answering the missed call: Initial exploration of cognitive and electrophysiological changes associated with smartphone us and abuse. PLoS ONE 2017, 12, e0180094. [Google Scholar] [CrossRef] [PubMed]
- Fu, S.; Chen, X.; Zheng, H. Exploring an adverse impact of smartphone overuse on academic performance via health issues: A stimulus-organism-response perspective. Behav. Inf. Technol. 2021, 40, 663–675. [Google Scholar]
- Summers, J.; Smith, L.; Harwell, L.; Case, J.; Wada, C.; Straub, K.; Smith, H. An index of human well-being for the U.S.: A TRIO approach. Sustainability 2014, 6, 3915–3935. [Google Scholar] [CrossRef]
- United Nations Development Program (UNDP). Human Development Report 2020. Available online: https://hdr.undp.org/content/human-development-report-2020 (accessed on 26 March 2025).
- Sen, A. Capability and well-being. In The Quality of Life; Nussbaum, M., Sen, A., Eds.; Oxford University Press: New York, NY, USA, 1993; pp. 30–53. [Google Scholar]
- Organisation for Economic Co-operation and Development (OECD). Guidelines on Measuring Subjective Well-Being. 2013. Available online: https://www.oecd.org/en/publications/oecd-guidelines-on-measuring-subjective-well-being_9789264191655-en.html (accessed on 26 March 2025).
- Tsurumi, T.; Yamaguchi, R.; Kagohashi, K.; Managi, S. Sustainable consumption in terms of subjective well-being in Asia. Glob. Environ. Res. 2021, 25, 93–99. [Google Scholar]
- Van de Kerk, G.; Manuel, A. A comprehensive index for a sustainable society: The SSI—The sustainable society index. Ecol. Econ. 2008, 66, 228–242. [Google Scholar] [CrossRef]
- US EPA. Indicators and Methods for Constructing a U.S. Human Well-Being Index (HWBI) for Ecosystem Services Research; Report # EPA/600/R-12/023; US EPA: Washington, DC, USA, 2012.
- Smith, L.; Cas, J.; Harwell, L.; Smith, H.; Summers, J. Development of relative importance values as contribution weights for evaluating human wellbeing: An ecosystem services example. Hum. Ecol. 2013, 41, 631–641. [Google Scholar] [CrossRef]
- Kamenetzky, M. The economics of the satisfaction of needs. Hum. Syst. Manag. 1981, 2, 101–111. [Google Scholar] [CrossRef]
- Doyal, L.; Gough, I. Theory of human needs. Crit. Soc. Policy 1984, 4, 6–38. [Google Scholar]
- Maslow, A. A theory of human motivation. Psychol. Rev. 1943, 50, 370–396. [Google Scholar]
- Guillen-Royo, M. Sustainability and Wellbeing—Human Scale Development in Practice; Routledge: New York, NY, USA, 2016. [Google Scholar]
- Guillen-Royo, M.; Guardiola, J.; Garcia-Quero, F. Sustainable development in times of economic crisis: A need-based illustration from Granada (Spain). J. Clean. Prod. 2017, 150, 267–276. [Google Scholar] [CrossRef]
- Cuthil, M. From here to utopia: Running a human-scale development workshop on the Gold Coast, Australia. Local Environ. 2003, 8, 471–485. [Google Scholar] [CrossRef]
- Paul, G.; Beitz, W. Engineering Design: A Systematic Approach; The Design Council: London, UK, 1988. [Google Scholar]
- Akao, Y. Quality Function Deployment; CRC Press: New York, NY, USA, 2004. [Google Scholar]
- Clausing, D. Total Quality Development; ASME Press: New York, NY, USA, 1993. [Google Scholar]
- Gutman, J. A means-end chain model based on consumer categorization processes. J. Mark. 1982, 46, 60–72. [Google Scholar]
- Walker, B.; Olson, J. Means-end chains: Connecting products with self. J. Bus. Res. 1991, 22, 111–118. [Google Scholar]
- Sorakunnas, E.; Konu, H. Digitally customized and interactive laddering: A new way for examining tourists’ value structure. Empir. Res. Artic. 2022, 62, 626–643. [Google Scholar]
- Ishii, K. Textbook of ME217 Design for Manufacture: Product Definition; Stanford University: Stanford, CA, USA, 1998. [Google Scholar]
- Murata, H.; Kobayashi, H. Conceptual Modeling Method for Living-Sphere Approach. JSME Transactions of the JSME. 2020. Available online: https://www.jstage.jst.go.jp/article/transjsme/86/886/86_19-00390/_article/-char/en (accessed on 26 March 2025).
- Kahneman, D.; Krueger, A.B. Developments in the measurement of subjective well-being. J. Econ. Perspect. 2006, 20, 3–24. [Google Scholar]
- Kobayashi, H. Strategic evolution of eco-products: A life cycle planning methodology. Res. Eng. Des. 2005, 16, 1–16. [Google Scholar]
- Kahneman, D.; Tversky, A. Prospect theory: An analysis of decision under risk. Econometrica 1979, 47, 263–291. [Google Scholar]
- Kano, N.; Seraku, N.; Takahashi, F.; Tsuji, S. Attractive quality and must-be quality. J. Jpn. Soc. Qual. Control 1984, 14, 39–48. [Google Scholar]
- Kobayashi, H.; Sumimura, Y.; Dinh, C.N.; Tran, M.; Murata, H.; Fukushige, S. Needs-based workshops for sustainable consumption and production in Vietnam. In Smart Innovation, Systems and Technologies; Ball, P., Huatuco, L., Howlett, R., Setchi, R., Eds.; Springer: Singapore, 2019; Volume 155, pp. 35–47. [Google Scholar]
- Thurmond, V. The point of triangulation. J. Nurs. Scholarsh. 2001, 33, 253–258. [Google Scholar]
- Ministry of Internal Affairs and Communications. Retail Price Survey, Section of Trends. 2020. Available online: https://www.stat.go.jp/english/index.html (accessed on 26 March 2025).
- General Statistical Office of Vietnam, Statistical Yearbook of Vietnam. Niên giám thống kê; VISTA PS: Japan, 2016; pp. 223–227. ISBN 4907379390.
- Hanoi Statistical Office. Cục Thống kê Hà Nội, “Niên giám thống kê”. 2014; pp. 302–304. Available online: https://www.nso.gov.vn/du-lieu-va-so-lieu-thong-ke/2019/10/nien-giam-thong-ke-2014/ (accessed on 1 June 2025).
- Tateno, M.; Teo, A.; Ukai, W.; Kaanazawa, J.; Kaatsuki, R.; Kubo, H.; Kato, T. Internet addiction, smartphone addiction, and hikikomori trait in Japanese young adult: Social isolation and social network. Front. Psychiatry 2019, 10, 455. [Google Scholar] [CrossRef]
- McCauley, B.; Nguyen, T.; McDonald, M.; Wearing, S. Digital gaming culture in Vietnam: An exploratory study. Leis. Stud. 2020, 39, 372–386. [Google Scholar] [CrossRef]
- Chapman, J. Emotionally Durable Design, 2nd ed.; Routledge: New York, NY, USA, 2015. [Google Scholar]
- Bestor, T.; Bsetor, V. Cuisine and identity in contemporary Japan. Educ. About Asia 2011, 16, 13–18. [Google Scholar]
- Wertheim-Heck, S.; Raneri, J. Food policy and the unruliness of consumption: An intergenerational social practice approach to uncover transforming food consumption in modernizing Hanoi, Vietnam. Glob. Food Secur. 2020, 26, 100418. [Google Scholar] [CrossRef]
- Faltmann, N. Urban gardening in Ho Chi Minh city: Class, food safety concerns, and crisis of confidence in farming. Food Cult. Soc. 2023, 26, 927–944. [Google Scholar] [CrossRef]
- Valette-Florence, P. A causal analysis of means-end hierarchy in a cross-cultural context: Methodological refinements. J. Bus. Res. 1998, 42, 161–166. [Google Scholar] [CrossRef]
- Fu, C.; Wu, W. The means-end cognitions of web advertising: A cross-cultural comparison. Online Inf. Rev. 2010, 34, 686–703. [Google Scholar] [CrossRef]
- Nagamachi, M. Kansei engineering: A new ergonomic consumer-oriented technology for product development. Int. J. Ind. Ergon. 1995, 15, 3–11. [Google Scholar] [CrossRef]
- Nagamachi, M. Kansei engineering as a powerful consumer-oriented technology for product development. Appl. Ergon. 2002, 33, 289–294. [Google Scholar] [CrossRef]

| Index | Scale | Economic Well-Being | Environmental Well-Being | Subjective Well-Being |
|---|---|---|---|---|
| Human Development Index (HDI) [20] | N | X | ||
| Subjective Well-Being (SWB) [22] | N | X | ||
| Sustainable Society Index (SSI) [24] | N | X | X | |
| Human Well-Being Index (HWBI) [25] | L, R, N | X | X | X |
| Existential Category | |||||
|---|---|---|---|---|---|
| Being | Having | Doing | Interacting | ||
| Axiological category | Subsistence | ||||
| Protection | |||||
| Affection | |||||
| Understanding | |||||
| Participation | |||||
| Idleness | |||||
| Creation | |||||
| Identity | |||||
| Freedom | |||||
| Product Name | Function Name | Satisfier 1 | Satisfier 2 | Satisfier 3 | … |
|---|---|---|---|---|---|
| Product 1 | Function 1-1 | X | |||
| Product 2 | Function 2-1 | X | |||
| Function 2-2 | X | ||||
| Product 3 | Function 3-1 | X | X | ||
| … | … | … | … | … | … |
| Number # | ||
|---|---|---|
| Satisfiers | Barriers | |
| Subsistence | 18 | 11 |
| Protection | 10 | 6 |
| Affection | 15 | 5 |
| Understanding | 20 | 5 |
| Participation | 18 | 12 |
| Idleness | 18 | 3 |
| Creation | 21 | 5 |
| Identity | 11 | 6 |
| Freedom | 7 | 6 |
| Total | 138 | 59 |
| Number # | ||
|---|---|---|
| Satisfiers | Barriers | |
| Subsistence | 20 | 8 |
| Protection | 10 | 2 |
| Affection | 15 | 5 |
| Understanding | 11 | 10 |
| Participation | 12 | 2 |
| Idleness | 12 | 6 |
| Creation | 7 | 3 |
| Identity | 9 | 5 |
| Freedom | 9 | 3 |
| Total | 105 | 44 |
| net_SUFi | |||
|---|---|---|---|
| Mean | SE | ||
| Average | 0.283 | 0.012 | |
| Fundamental needs | Subsistence | 0.378 | 0.020 |
| Protection | 0.355 | 0.047 | |
| Affection | 0.442 | 0.023 | |
| Understanding | 0.402 | 0.014 | |
| Participation | 0.001 | 0.004 | |
| Idleness | 0.297 | 0.041 | |
| Creation | 0.126 | 0.037 | |
| Identity | 0.362 | 0.052 | |
| Freedom | 0.180 | 0.042 | |
| net_SUFi | |||
|---|---|---|---|
| Mean | SE | ||
| Average | 0.396 | 0.015 | |
| Fundamental needs | Subsistence | 0.501 | 0.041 |
| Protection | 0.421 | 0.037 | |
| Affection | 0.376 | 0.024 | |
| Understanding | 0.335 | 0.058 | |
| Participation | 0.357 | 0.016 | |
| Idleness | 0.603 | 0.039 | |
| Creation | 0.329 | 0.069 | |
| Identity | 0.151 | 0.053 | |
| Freedom | 0.489 | 0.024 | |
Disclaimer/Publisher’s Note: The statements, opinions and data contained in all publications are solely those of the individual author(s) and contributor(s) and not of MDPI and/or the editor(s). MDPI and/or the editor(s) disclaim responsibility for any injury to people or property resulting from any ideas, methods, instructions or products referred to in the content. |
© 2025 by the authors. Licensee MDPI, Basel, Switzerland. This article is an open access article distributed under the terms and conditions of the Creative Commons Attribution (CC BY) license (https://creativecommons.org/licenses/by/4.0/).
Share and Cite
Kobayashi, H.; Kaji, R.; Murata, H. Net-Sufficiency Evaluation Method Focusing on Product Functions Based on the Living-Sphere Approach. Sustainability 2025, 17, 5269. https://doi.org/10.3390/su17125269
Kobayashi H, Kaji R, Murata H. Net-Sufficiency Evaluation Method Focusing on Product Functions Based on the Living-Sphere Approach. Sustainability. 2025; 17(12):5269. https://doi.org/10.3390/su17125269
Chicago/Turabian StyleKobayashi, Hideki, Ryotaro Kaji, and Hidenori Murata. 2025. "Net-Sufficiency Evaluation Method Focusing on Product Functions Based on the Living-Sphere Approach" Sustainability 17, no. 12: 5269. https://doi.org/10.3390/su17125269
APA StyleKobayashi, H., Kaji, R., & Murata, H. (2025). Net-Sufficiency Evaluation Method Focusing on Product Functions Based on the Living-Sphere Approach. Sustainability, 17(12), 5269. https://doi.org/10.3390/su17125269