Article

An Accessibility Analysis of Emergency Shelters in Shenzhen Using the Gaussian-Based Two-Step Floating Catchment Area Method and Clustering

1
School of Safety Science and Emergency Management, Wuhan University of Technology, Wuhan 430070, China
2
School of Management, Wuhan University of Technology, Wuhan 430070, China
*
Author to whom correspondence should be addressed.
Sustainability 2025, 17(12), 5250; https://doi.org/10.3390/su17125250
Submission received: 10 March 2025 / Revised: 28 May 2025 / Accepted: 4 June 2025 / Published: 6 June 2025
(This article belongs to the Special Issue Sustainable Transport and Land Use for a Sustainable Future)

Abstract

The strategic planning of emergency shelters is vital for enhancing urban resilience against natural disasters, ensuring timely and equitable support for vulnerable populations. However, the existing studies often overlook the effects of fixed search radii and spatial heterogeneity in supply–demand matching. This study evaluated the spatial accessibility of emergency shelters in Shenzhen, a megacity in China, using a Gaussian two-step floating catchment area (G2SFCA) method integrated with K-means clustering. The analysis incorporated three service radii (1 km, 2.5 km, and 5 km) to assess accessibility levels across spatial scales. The results indicate the following: (1) The supply–demand balance of emergency shelters in Shenzhen varies significantly across service radii. A notable mismatch exists within 1000 m; at 2500 m, the demand in high-density areas is better met with reduced regional disparities, while at 5000 m, the spatial correlation between the supply and demand weakens considerably. (2) The cluster analysis revealed the distinct spatial clustering of supply–demand imbalances, primarily driven by population density. (3) The proposed method offers empirical support for optimized shelter allocation and improving the equity and efficiency of emergency resource distribution.

1. Introduction

Against the backdrop of global climate change, rapid urban population growth, and the increasing frequency of disasters, China is one of the countries most severely affected by natural hazards in terms of variety, frequency, and the magnitude of associated losses [1]. Enhancing the urban capacity to cope with emergencies has, thus, become a crucial component of promoting sustainable urban development and advancing the strategic vision of building “resilient cities”. International policy frameworks such as the United Nations’ 2030 Agenda for Sustainable Development and the Sendai Framework for Disaster Risk Reduction (2015–2030) by the UNDRR (United Nations Office for Disaster Risk Reduction) [2,3] emphasize the importance of strengthening urban emergency infrastructure and improving disaster response capacities. In particular, the scientific planning and equitable accessibility of emergency shelters are regarded as key measures for enhancing urban social resilience and promoting equal access to public services [4].
Shelters, as pivotal facilities offering safety and protection during natural disasters or emergencies, play an indispensable role in these endeavors [5,6]. In the face of disasters, shelters serve as secure havens for individuals, constituting the last line of defense for life [7,8]. Simultaneously, they function as vital hubs for emergency evacuation and refuge [9,10]. According to United Nations reports, disaster risk assessments of housing, schools, medical facilities, and workplaces are essential components in the formulation of land-use policies [11]. Therefore, evaluating the spatial accessibility of emergency shelters not only contributes to informed policymaking but also constitutes a critical element of disaster response planning and urban infrastructure layout.
Spatial accessibility, essentially the ease of reaching one location from another, is typically evaluated by supply and demand and their connectivity [12,13,14,15]. It serves as a key metric for assessing the equity and rationality of public facilities such as parks, hospitals, schools, and shelters [16,17,18]. The common assessment methods include indicator statistics, proximity distance, potential models, buffer and kernel analyses, and the cumulative opportunity approach [19,20,21,22,23,24]. The widely used 2SFCA method is simple but overlooks distance decay. To address this, variants such as D2SFCA, M2SFCA, CB2SFCA, E2SFCA, 3SFCA, and G2SFCA have been developed [25,26,27,28,29,30]. G2SFCA, using a Gaussian decay function and accounting for spatial barriers and the supply–demand scale, offers improved realism and is well-suited to emergency shelter accessibility analyses [31].
In rapidly urbanizing developing countries and emerging economies, uneven population distributions [32], limited spatial resources, and slow institutional responses often cause a paradox of simultaneous “facility redundancy” and “service gaps” in shelter layouts [33]. As one of the most urbanized countries, China’s megacities face overlapping risks and complex spatial patterns, highlighting the need to shift emergency shelter planning from reactive response to resilience.
Shenzhen, a densely populated and economically vibrant megacity exposed to significant climate risks [34], exemplifies this challenge. However, in such high-density areas, whether a structural mismatch exists between planned shelter locations and residents’ actual emergency accessibility remains unclear and understudied.
This study aimed to assess the accessibility of emergency shelters in megacities from the perspective of supply and demand. First, based on multi-source data, the shelter supply capacity was represented by the shelter area. Using a Gaussian two-step floating catchment area (G2SFCA) method combined with a road network analysis, the accessibility levels under different service radii were evaluated. Second, employing K-means clustering, the spatial mismatch between the shelter service capacity and residents’ actual demand in Shenzhen was analyzed at a fine-grained scale.
The remainder of this paper is organized as follows. Section 2 reviews studies about shelter accessibility. Section 3 describes the study area and data. Section 4 analyzes the experimental results, while Section 5 provides a discussion. Finally, Section 6 presents the conclusions.

2. Literature Review

2.1. Shelter Planning in the Urban Resilience Context

Emergency shelters are a fundamental element of urban disaster management and resilience, serving not only as physical infrastructure but also providing essential refuge services during emergencies [35]. The recent research has shifted focus from mere facility provision to service accessibility, highlighting equitable and effective access for diverse social groups [36]. This approach integrates spatial and social dimensions, emphasizing vulnerable populations such as the elderly and disabled.
Within the urban resilience framework, shelters are critical nodes linking disaster risk to population safety, with their spatial planning directly influencing the response efficiency and social stability [37]. Megacities face challenges including high density, limited land, and complex transport factors, often resulting in inadequate shelter provision, spatial imbalance, and overlapping services [38].
Thus, optimizing shelter allocation based on population distribution to enhance urban emergency resilience remains a key issue in urban planning and spatial analyses.

2.2. Methods for Analyzing Shelter Accessibility

Although a comprehensive theoretical system for emergency shelter accessibility has been established in Europe, the United States, and Japan [20], the research in China began in the 1990s [22], with a primary focus on suitability evaluations [39,40], site optimization [41,42], and emergency management [43]. In megacities such as Guangzhou [44], Nangjing [45], and Shanghai [46], where the spatial distribution of the shelters and population is highly complex, the in-depth analysis of shelter accessibility has become a key issue in enhancing urban safety and resilience [47]. Most studies adopt GIS-based spatial analysis methods [45], incorporating the population density, road networks, and shelter locations to examine the service coverage and transport accessibility of the shelters [48]. For instance, Liang et al. found that in Kunming, rapid urbanization has led to a sharp increase in population, resulting in an insufficient supply of shelters and significant service blind spots, particularly in newly developed and aging communities [49].
Accessibility, as a core component of spatial equity, emphasizes the spatial relationship between the geographic distribution of services and the population served [50]. Its quantification is critical for assessing the rationality of emergency shelter layouts. Urban spatial accessibility reflects residents’ ability to reach their destinations and is grounded in Hägerstrand’s time–geography theory, widely applied in urban planning [51], transportation [52], and social development [53]. For example, Yao et al. [53] applied a multi-criteria model to assess open space accessibility. Tiznado-Aitken et al. [54] revealed accessibility disadvantages in public transport for low- and middle-income communities. Wolff [55] validated the effectiveness of distance decay models using network characteristics. Merlin [56] utilized structural equation modeling to analyze the relationship between transport accessibility and passenger flow.
As researchers have refined and expanded the scope of accessibility models, they have also advanced toward finer spatial scales and higher analytical granularity. For instance, Nakai et al. [57] studied evacuation routes for children with neurodevelopmental disorders in Japan and analyzed their accessibility to safe spaces. Building on such efforts, the Gaussian two-step floating catchment area method (G2SFCA) was introduced to optimize distance decay weights using a Gaussian function, better reflecting the nonlinear decline in service efficiency over distance. Zhou [58] applied the enhanced two-step floating catchment area method (E2SFCA) to examine the spatial accessibility of emergency shelters in Beijing. Ghorbanzadeh [59] conducted a comparative analysis of the traditional two-step floating catchment area (2SFCA) method and its enhanced version (E2SFCA), systematically evaluating the spatial accessibility between COVID-19 patients and medical facilities in Florida. He also proposed an accessibility ratio of differences (ARD) index to quantify variations across models. These fine-scale, population-specific studies offer a methodological reference for conducting emergency shelter accessibility evaluations at the settlement scale.
However, most existing studies remain focused on static measurements of physical coverage, lacking a dynamic service-oriented perspective. As a result, they often overlook how fixed search radii influence accessibility outcomes.

2.3. Spatial Clustering Analyses of Shelter Supply and Demand

In urban emergency shelter planning, the supply–demand relationship is a core metric for evaluating system performance. “Supply” refers to the spatial distribution and service capacity of shelters, including the facility size, location, and coverage, representing the total shelter resources available to residents [10]. “Demand” reflects residents’ actual need for shelter services, typically determined by the population density, social structure, and local disaster exposure risk [60]. Accurate identification of both the supply and demand is essential for assessing the rationality and equity of shelter resource allocation.
However, in megacities, the shelter resources and resident demand exhibit high spatial heterogeneity and imbalances. Some areas suffer from insufficient shelter capacity amid high demand—so-called “service blind spots”—while others face resource redundancy [61]. Traditional supply–demand analyses often rely on static, aggregated data, limiting their ability to capture complex spatial structures and multidimensional relationships.
A spatial clustering analysis serves as an effective exploratory tool to address this limitation. By integrating multifactor data such as the shelter capacity, population distribution, and accessibility, it partitions the city into zones with similar supply–demand characteristics, thereby identifying spatial clusters of imbalance [62]. This zoning facilitates the detection of blind spots and redundancies, supporting differentiated regional planning strategies that enhance the overall service efficiency and equity [61]. Moreover, clustering reveals spatial synergies between shelter demand and supply, promoting coordinated development across urban units [60].
Building on these insights, this study innovatively combined the Gaussian two-step floating catchment area (G2SFCA) method with a clustering analysis. This approach not only captures the distance decay effect of the shelter service capacity but also uncovers spatial aggregation and coupling patterns between shelter resources and demand in Shenzhen. It overcomes the limitations of static supply–demand models and provides a more nuanced, dynamic tool for the scientific planning of emergency shelters in megacities.

2.4. Research Gaps and Motivation

The essence of emergency shelter accessibility lies in the evacuees’ choice of shelters, influenced by both distance and the quality of services provided. The existing studies on shelter accessibility have notable theoretical limitations: first, they focus mainly on “physical accessibility” while overlooking the critical aspect of “service accessibility” and the impact of fixed search radii; second, they often assess accessibility in isolation, neglecting spatial heterogeneity from a supply–demand matching perspective.
To address this gap, this study focused on planned emergency shelters in Shenzhen, accounting for variations in shelter quality and attractiveness. Using ArcGIS 10.4, the main urban area was divided into 1 km × 1 km grids. Combining the Gaussian two-step floating catchment area (G2SFCA) method with a road network analysis, shelter accessibility was evaluated at service radii of 1 km, 2.5 km, and 5 km. K-means clustering was then applied to explore the spatial heterogeneity of supply–demand imbalances, enabling a more precise quantitative analysis of urban shelter accessibility.

3. Materials and Methods

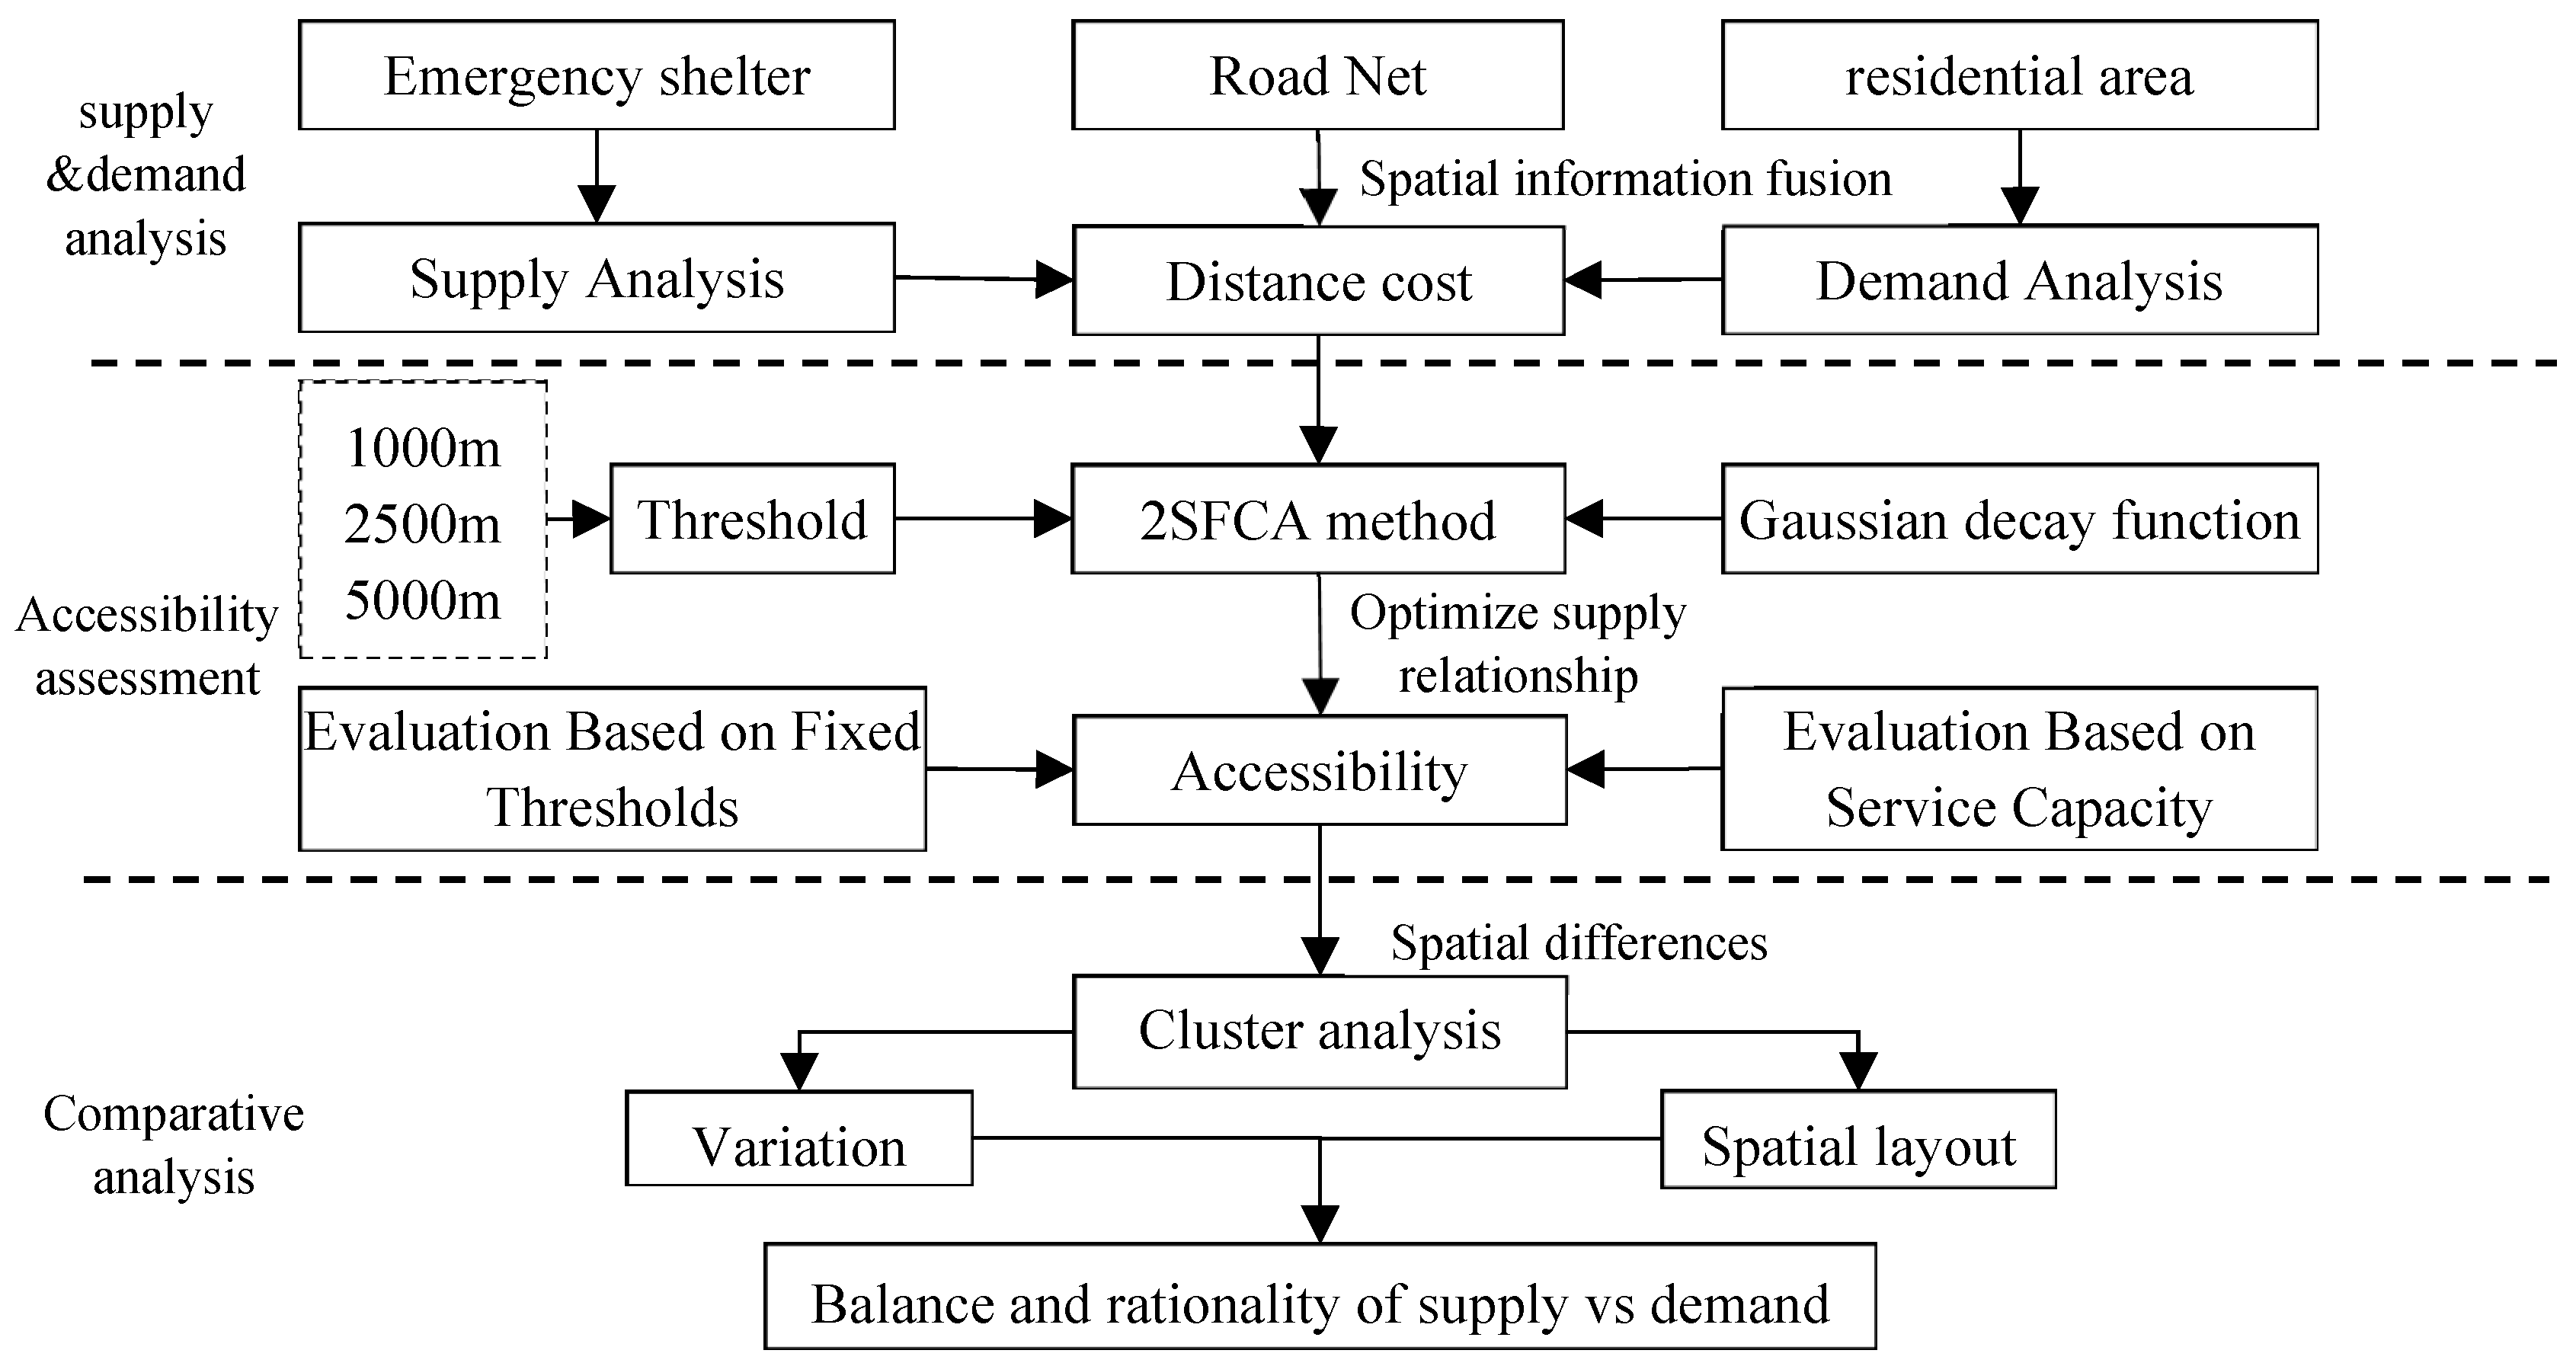
3.1. Research Framework

In emergency scenarios, the efficient accessibility of emergency service facilities is central to ensuring precise responses [63]. Based on functional characteristics, emergency services can be categorized into three types [64]: urgent emergency service facilities (e.g., hospitals, fire stations, and police stations) [65], which directly safeguard life and property; emergency shelters (e.g., parks, plazas, and stadiums) [66], which provide disaster-resilient spaces and basic living support; strategic resource reserves, which store essential supplies and specialized equipment for long-term disaster response [31].
This study focused on evaluating the accessibility of emergency shelters, constructing a meso–microscale research framework that integrates spatial supply–demand matching and a transportation network analysis. The demand was quantified using fishing grid units, based on WorldPop population data, while the supply capacity was characterized by shelter area. By combining the Gaussian two-step floating catchment area (G2SFCA) method with a road network analysis, the accessibility levels under varying service radii (also set as threshold) were assessed. In order to analyze the coverage of evacuation services between different regions more clearly, a classification analysis was needed.
K-means clustering further reveals spatial heterogeneity in supply–demand imbalances. The research transcends traditional static planning limitations, offering dynamic adaptation strategies for optimizing emergency shelter resources in high-density cities, thereby advancing resilience from “quantity-oriented coverage” to “efficiency-driven adaptation”.
The research framework of an accessibility analysis on emergency shelters is shown in Figure 1.
Figure 1 depicts accessibility via bidirectional searches between shelters and residents. The search process is often subjected to distance and corresponding costs. The search process is completed within a given distance (a threshold such as 1000 m) but the impact of the distance cost is subject to Gaussian decay, which makes the evacuation search process more practical in emergency situations.

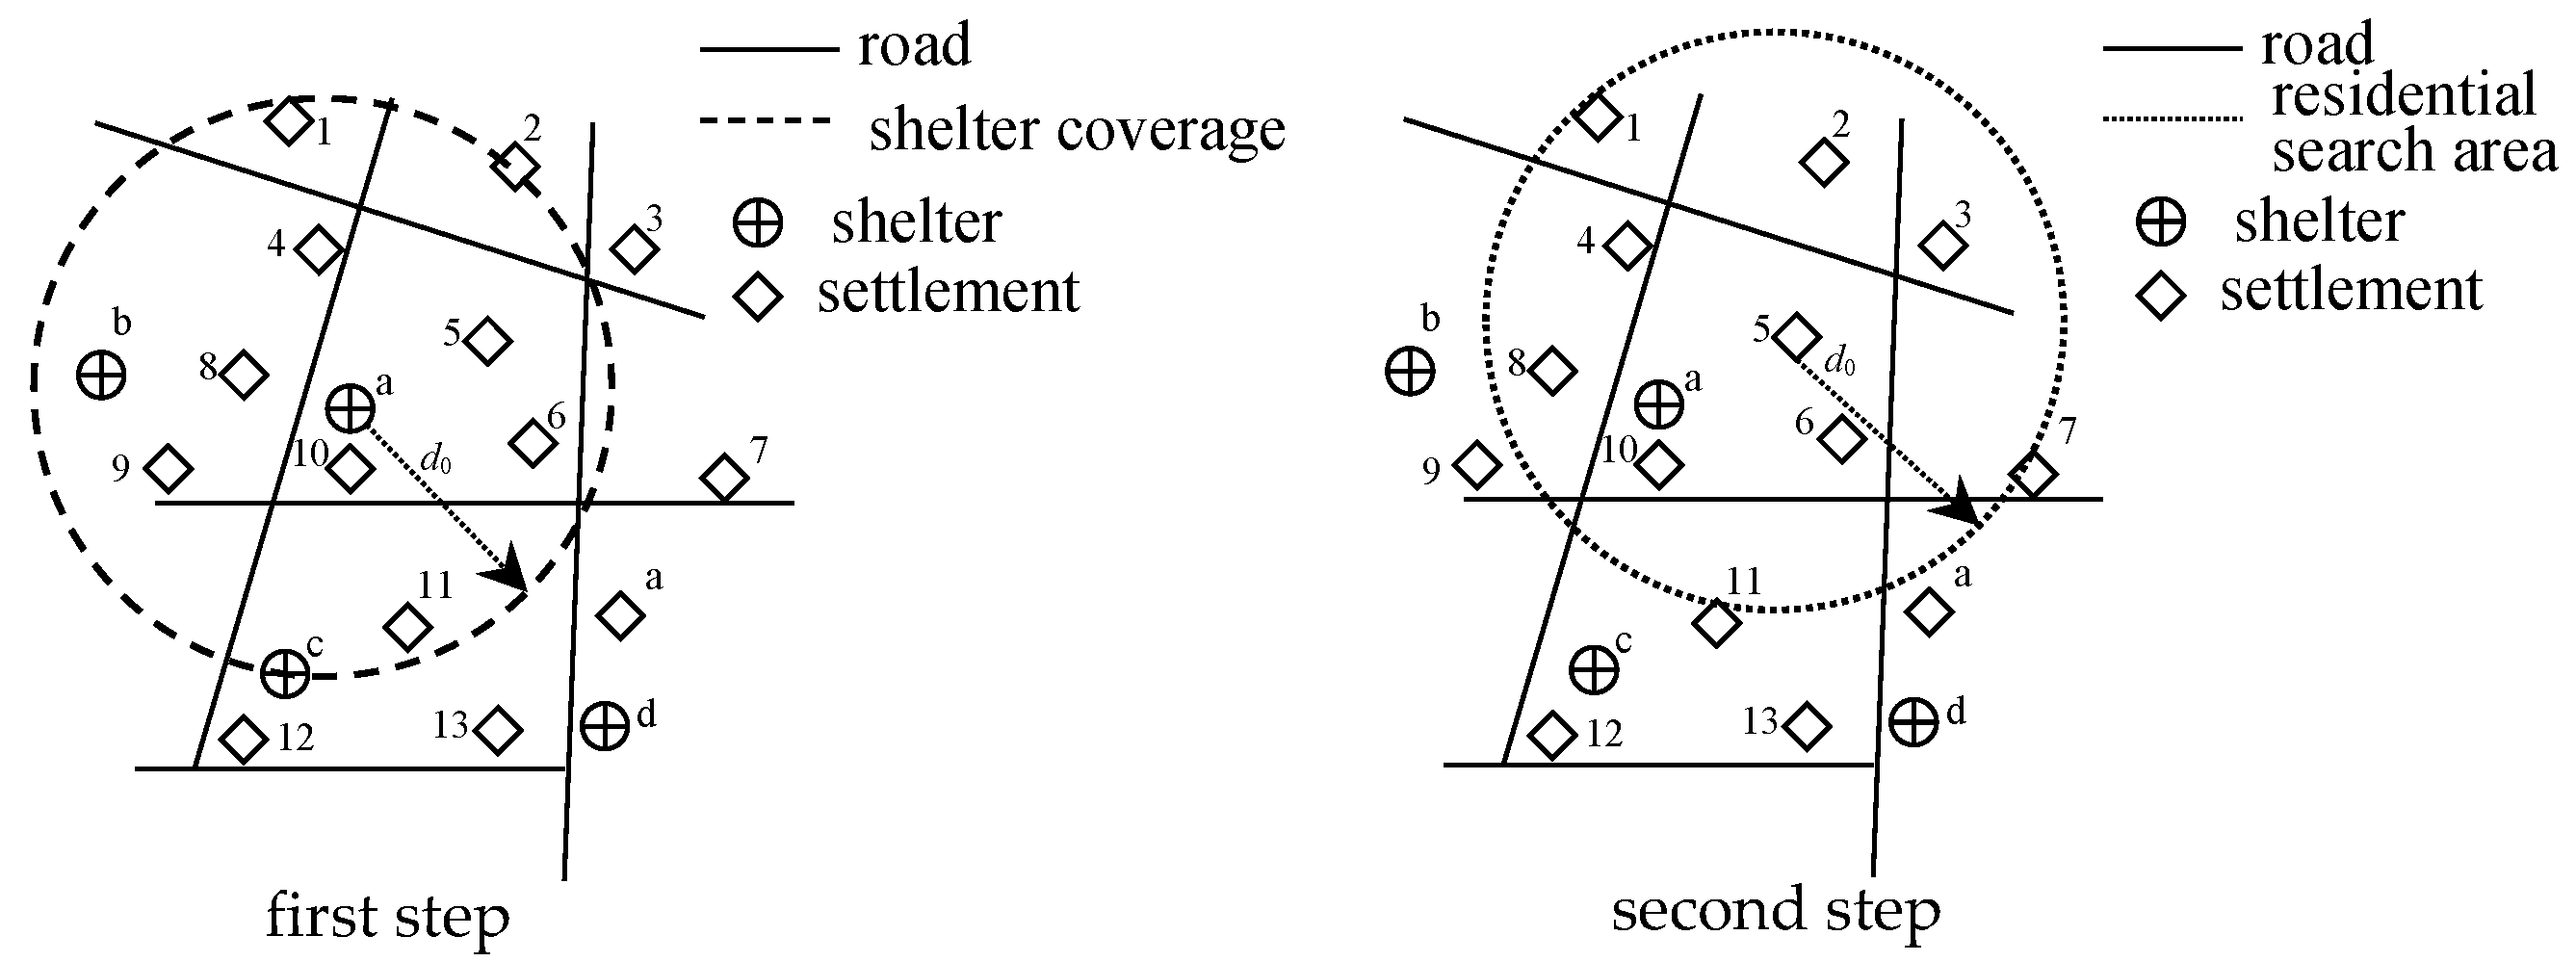
3.2. Gaussian-Based 2SFCA Method

The Gaussian-based 2SFCA method simultaneously considers both supply and demand factors, enabling a comprehensive and efficient assessment of emergency shelter accessibility. Among its various extensions, the Gaussian-function-based spatial decay rule is the most commonly applied approach [18]. This study refines the conventional Gaussian-based 2SFCA method, with the specific steps outlined below.
In the first step, each emergency shelter location j is designated as a supply point, and a search area j is established with a network-based maximum travel distance d0 as the radius. Within this search area, the total population is aggregated, and a Gaussian function is applied to assign distance-based weights following a spatial decay rule. The weighted population values are then summed to compute the supply-to-demand ratio Rj:
R j = S j d i j d 0 G ( d i j ) D k
Here, Dk represents the population of each demand unit k, and dkj is the network distance between demand unit k and emergency shelter j; for parks with multiple entrances, the network distance from the demand unit to the nearest entrance is selected. Unit k needs to fall within the search domain (dkjd0), while Sj is the area of park green space j; G(dij) is the Gaussian decay function that considers spatial friction, and its specific form can be expressed as
G ( d i j ) = e 1 2 × d i j d 0 2 e 1 2 1 e 1 2
There are three commonly used distance decay functions—linear, exponential, and Gaussian. Among them, the Gaussian function is particularly suitable for modeling accessibility, as it captures the nonlinear decline in service utility with increasing distance, which is initially gradual, then increasingly steep as the residents move farther from the facility [67].
The Gaussian two-step floating catchment area (G2SFCA) method incorporates this distance decay mechanism into accessibility modeling, while also accounting for the spatial supply–demand relationship between the facilities and users. It has been widely recognized as a robust and effective tool for evaluating accessibility to public services [68].
In this study, the G2SFCA method was applied to assess the accessibility of emergency shelters in the study area, reflecting their capacity to provide shelter services during emergencies. The model incorporates four key components—demand points, supply points, physical barriers, and search catchment areas.
An evaluation of the comprehensive service capacity of emergency shelters primarily encompasses the richness of relevant facilities and the density of the road network. In the second step, for a given demand point i, a search domain I is defined with a network-based maximum travel distance d0 as the radius. Within this domain, all emergency shelters j are identified, and their respective supply-to-demand ratios Rj are weighted using the Gaussian decay function and subsequently aggregated to compute the accessibility index Ai. A higher Ai value indicates a greater level of accessibility to emergency shelters.
A i = d j d 0 G ( d i j ) R j
The searching process of the Gaussian-based 2SFCA method is shown as Figure 2.
As Figure 2 shown, the numbers 1 to 13 represent the locations of residential areas, while a to d indicate the locations of emergency shelters. Figure 2 is a schematic diagram, and d0 refers to the search domain in formulas (1), (2), and (3). Accessibility evaluations using the Gaussian-based 2SFCA method focus on the service coverage of the shelters, and also on the search capabilities of the residents themselves in emergency situations. In the first step, the number of settlements could be got through shelter coverage in threshold d0. In the second step, the number of shelters can be obtained under the residential search area with same threshold d0. In practical situations, when emergencies occur, residents are often in a state of panic, making it difficult to quickly and accurately find a shelter; that is to say, evaluating residents’ ability to search for shelters is an important prerequisite for shelters to function effectively.
The construction and management of emergency shelters are essential components of emergency management. The 14th Five-Year Plan for the National Emergency System emphasizes the need to optimize the planning and distribution of emergency shelters, improve construction standards and post-evaluation mechanisms, and strictly prohibit the arbitrary alteration of emergency shelter functions and emergency infrastructure usage. A scientific and well-structured potential evaluation system serves as a fundamental prerequisite for the planning of emergency shelters, ensuring their effective functionality. In accordance with national standards such as the Urban Comprehensive Disaster Prevention Planning Standards (GB/T 51327-2018) [69] and the Design Code for Disaster Prevention Shelters” (GB 51143-2015) [70], the National Emergency Management and Disaster Reduction Standardization Technical Committee (SAC/TC 307) released the draft Emergency Shelter Classification and Grading for public consultation in July 2023, incorporating the prevailing emergency shelter construction guidelines in China. This study primarily adopts the classification and grading framework outlined in Emergency Shelter Classification and Grading for the parameter settings, as detailed in Table 1.

3.3. K-Means Clustering Analysis

The spatial layout of urban emergency shelters can be optimized either by upgrading the functions of existing facilities or by introducing new candidate sites. The main optimization objectives typically include minimizing travel times, maximizing coverage, and minimizing the number of required facilities [71].
Among these factors, the road network density serves as a critical reference for shelter site selection, as a denser emergency road network typically enhances the accessibility to emergency resources. Additionally, the spatial distribution of essential service facilities is often used as a key indicator in governmental pre-expropriation systems, reflecting the city’s baseline capacity for decentralized emergency supply and response [72].
As shown in Table 1, emergency shelters must meet specific requirements in terms of facilities, equipment, and supplies, which highlights their service-oriented function. This study focuses on evaluating the supply–demand matching of emergency shelters using spatial accessibility as a key metric. In disaster scenarios where roads may be damaged and emergency supplies delayed, localized resource deployment and grid-based self-help mechanisms become crucial.
To reflect the requirements of resilient urban systems, two structural factors—the road network density and facility richness—are integrated into the accessibility evaluation framework. Along with the population density and measured accessibility, these indicators form the basis of our evaluation. The four key metrics are:
Accessibility level—reflecting the service efficiency;
Population density—indicating the demand intensity;
Road network density—capturing the transportation infrastructure conditions;
Facility richness—representing the resource reserve capacity.
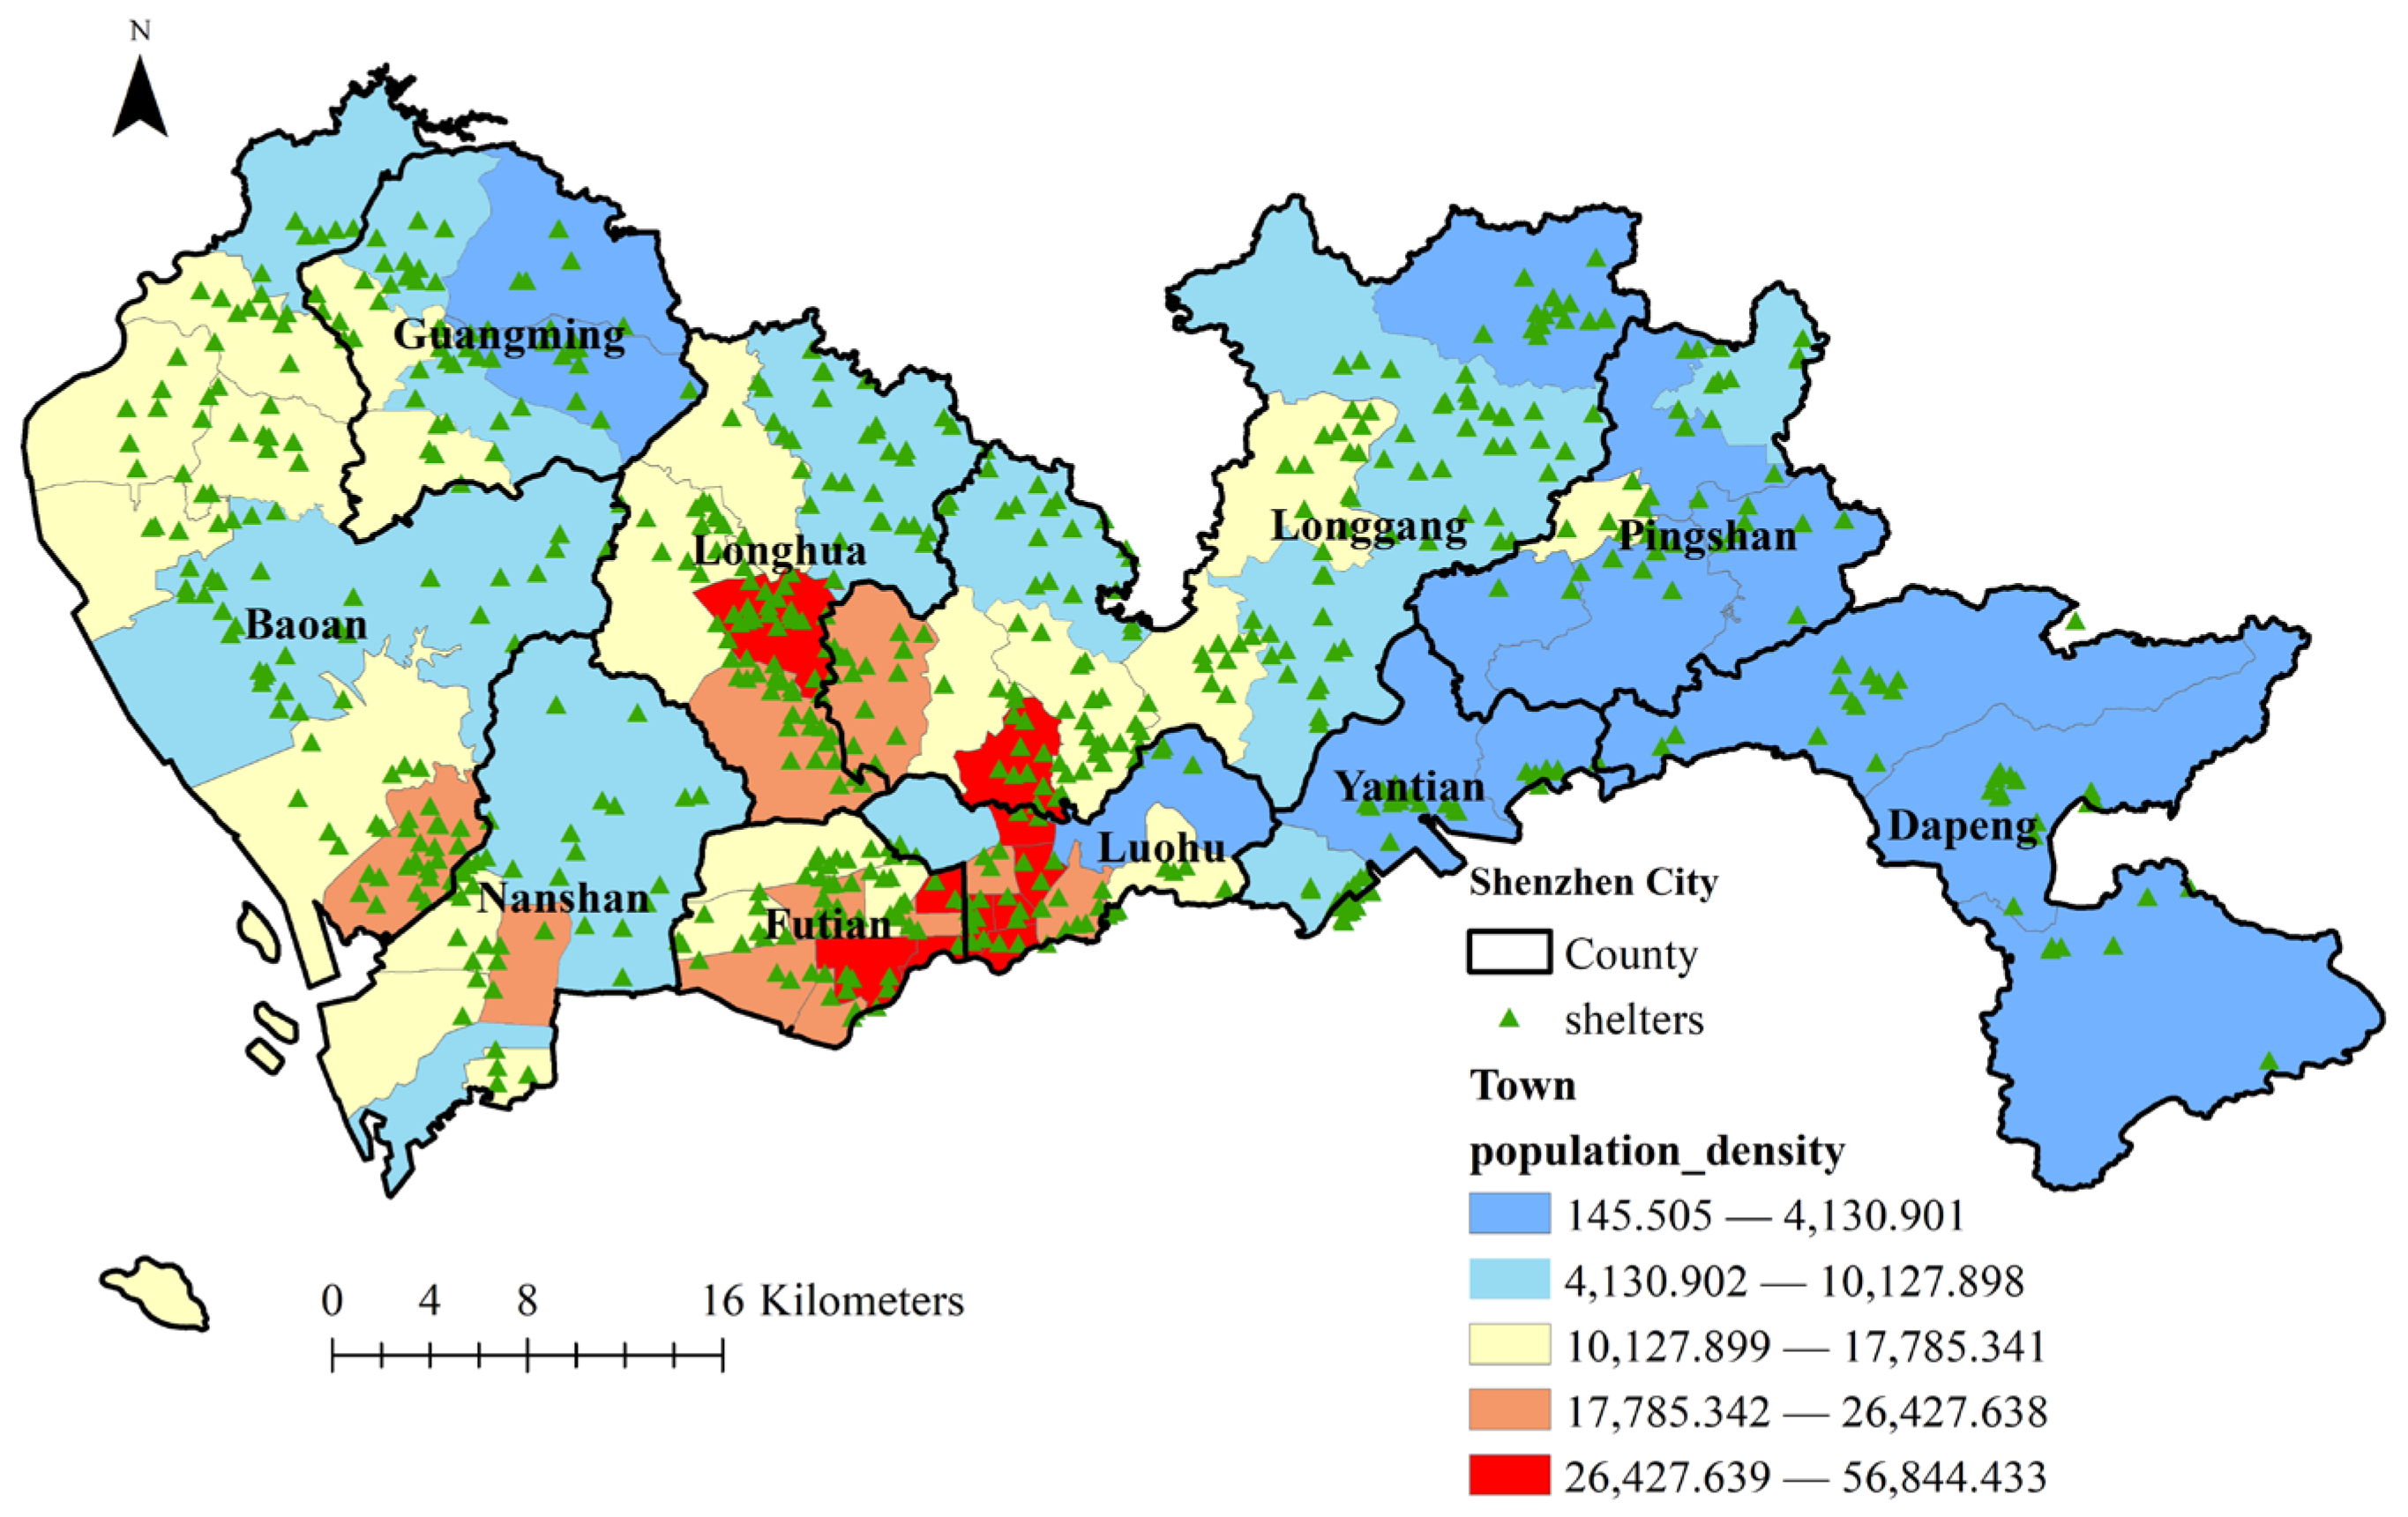
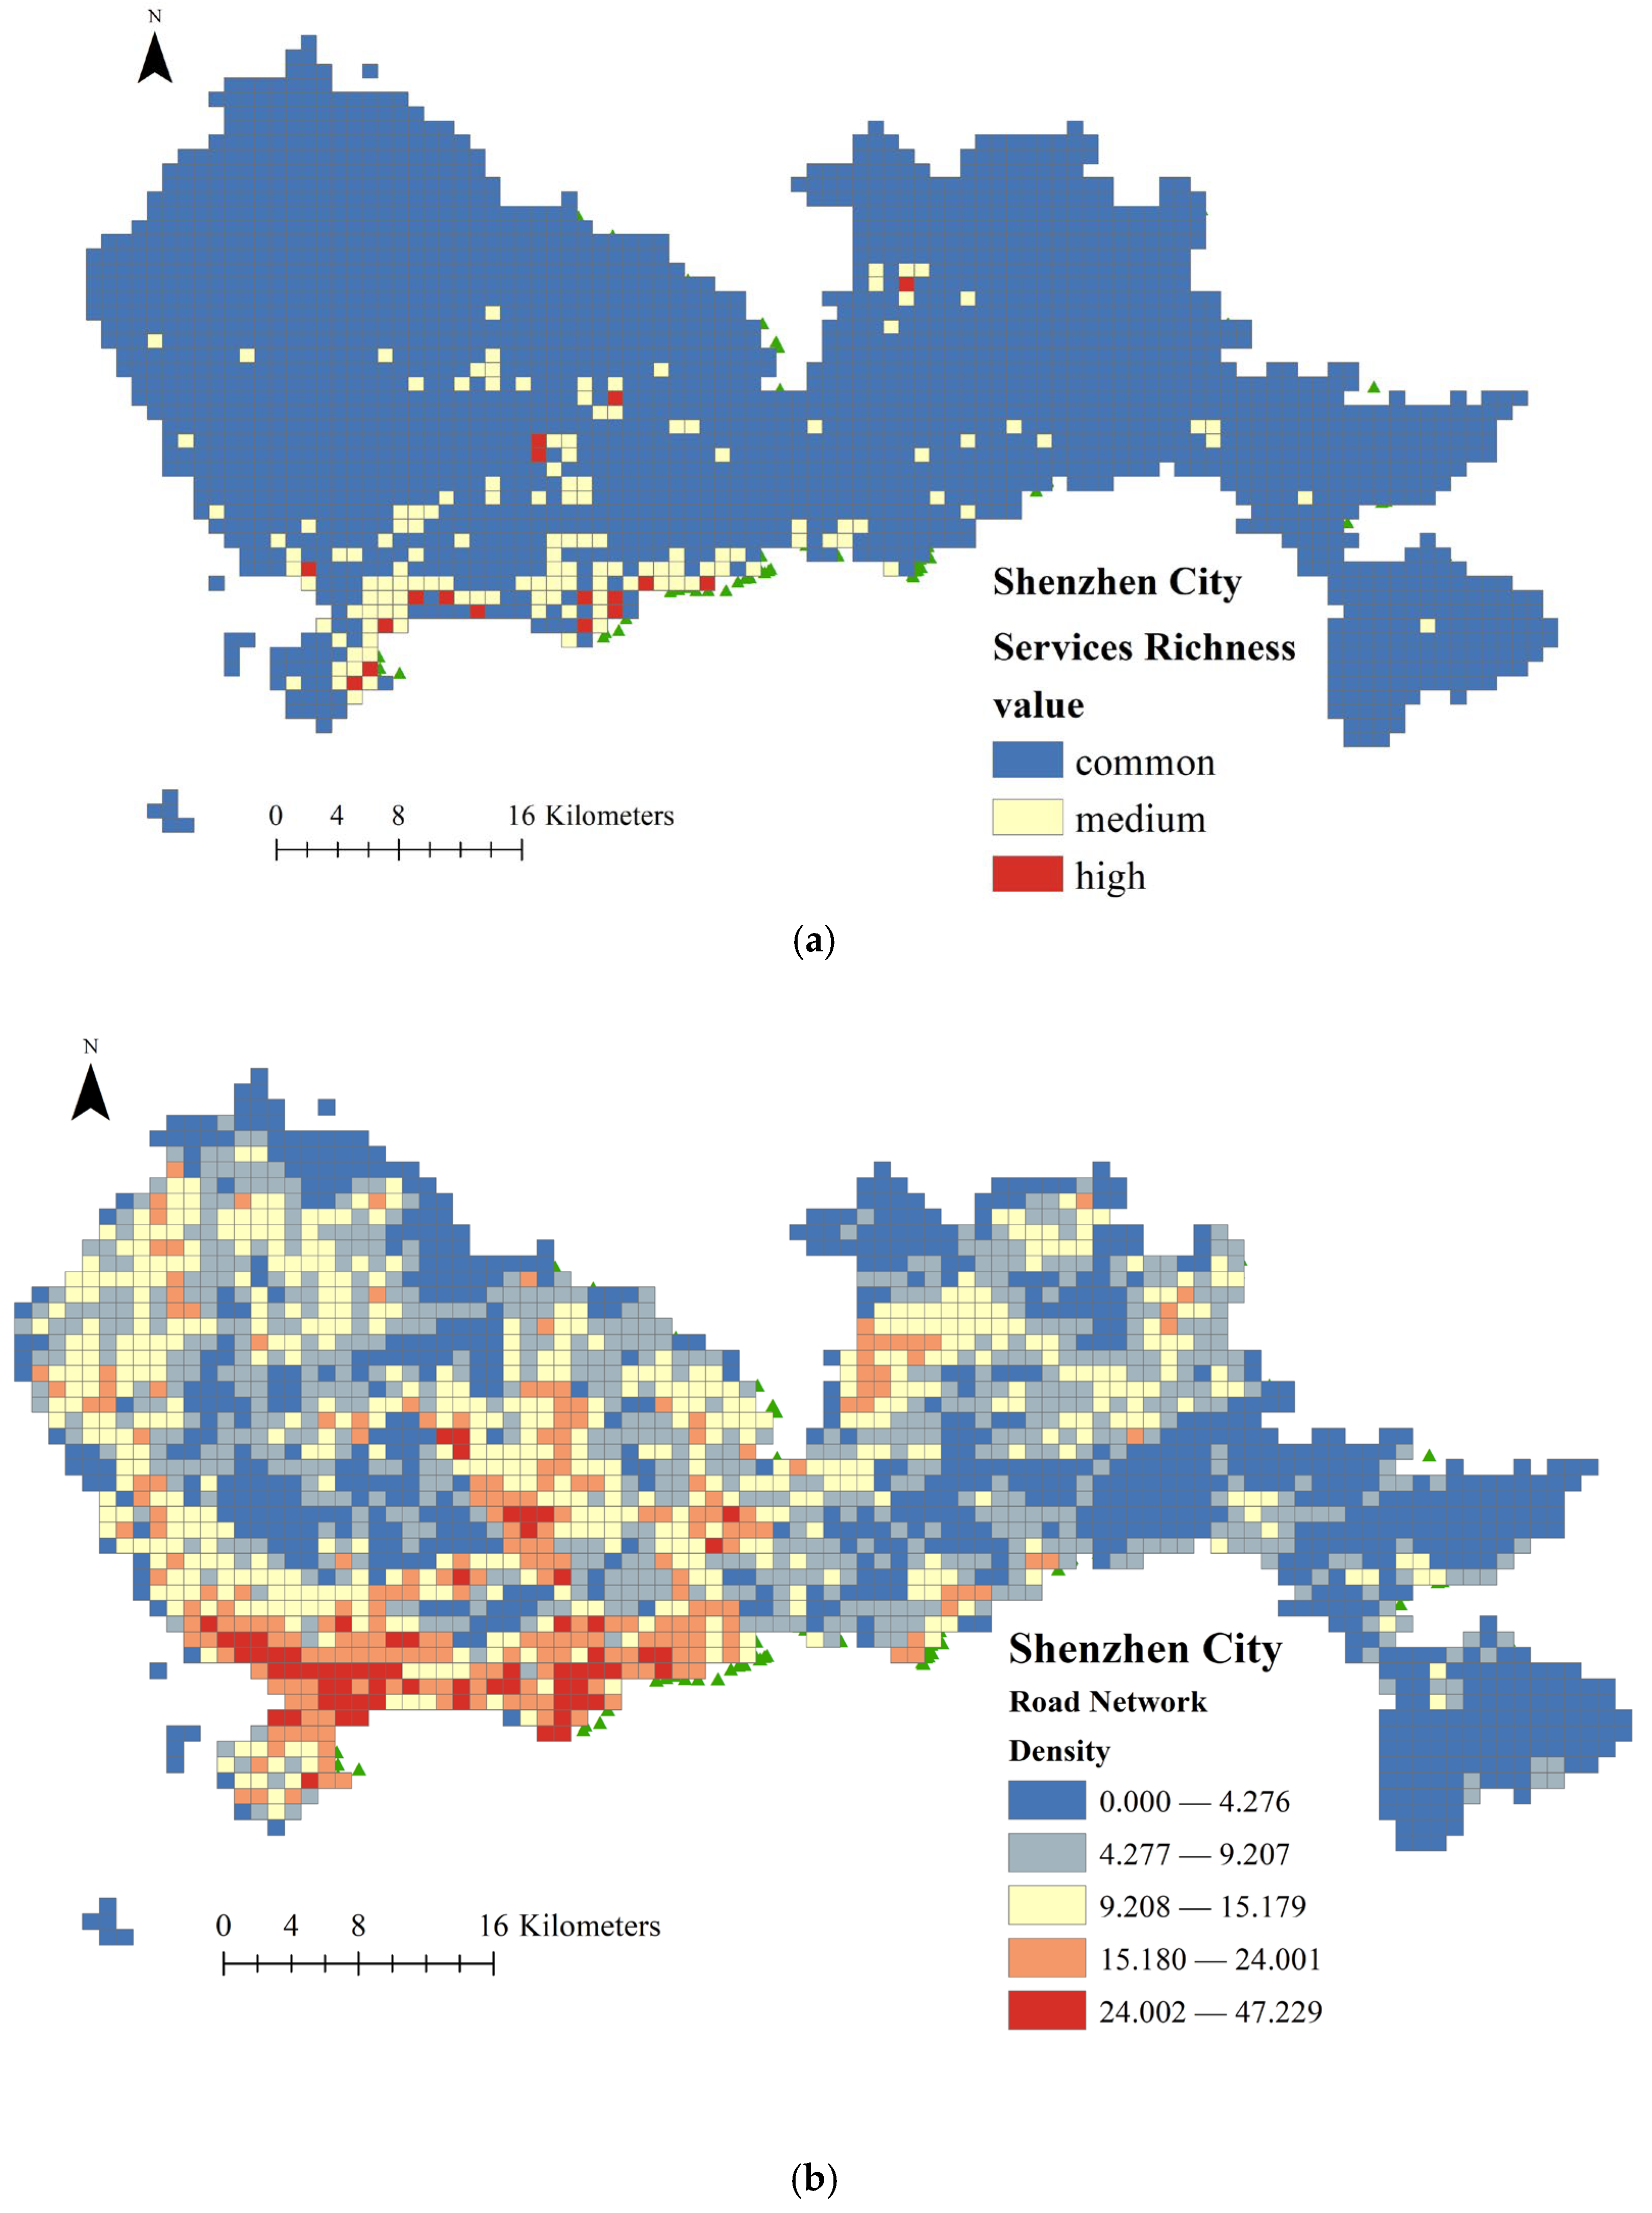
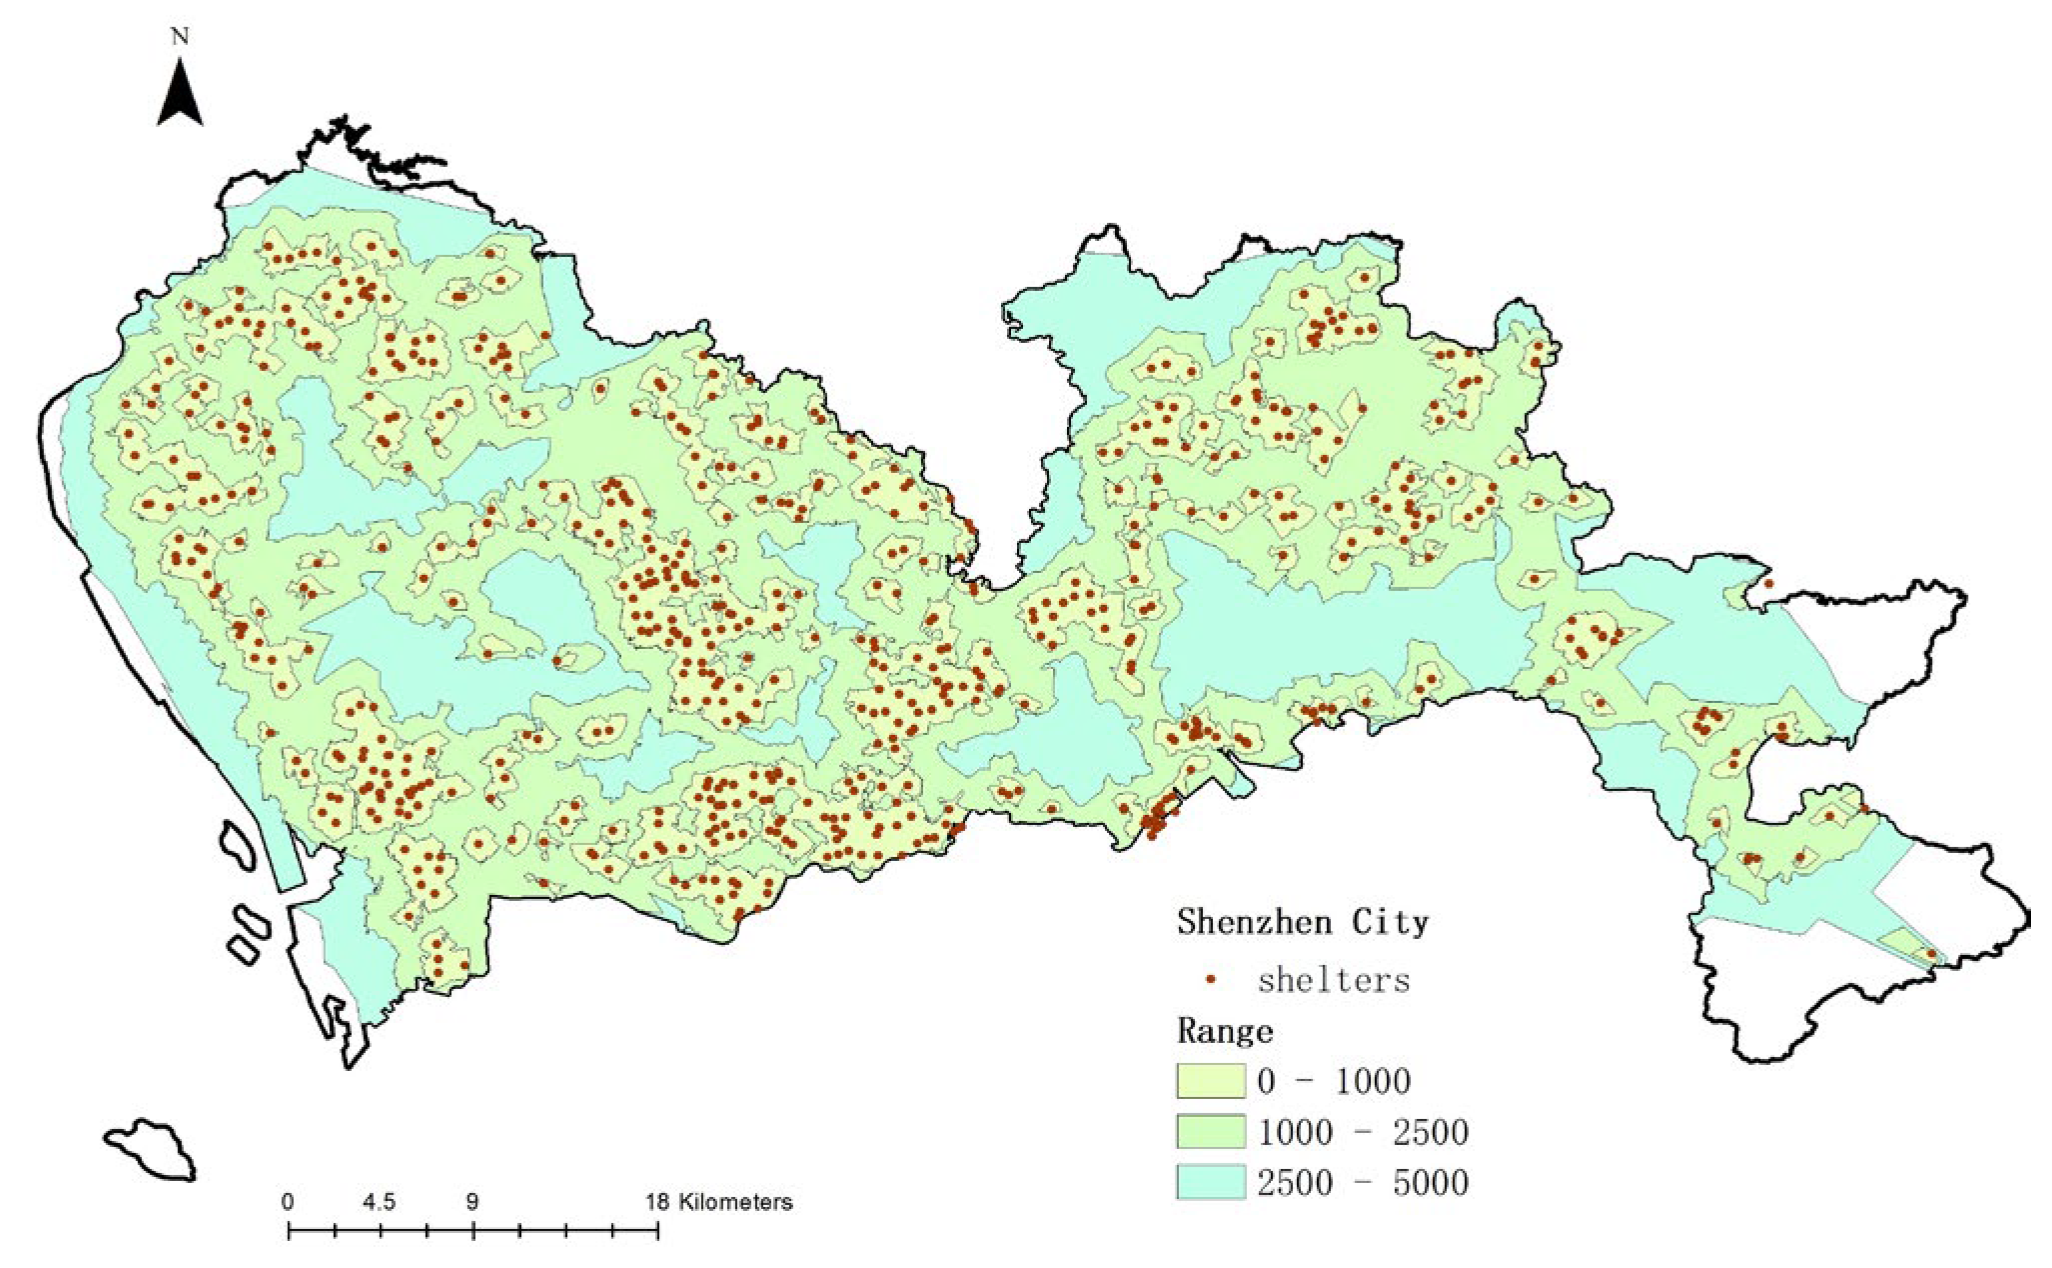
These indicators support two complementary evaluation frameworks—evaluations based on fixed thresholds and evaluations based on service capacity. Following this, a K-means clustering algorithm is employed to categorize accessibility patterns of emergency shelters. To determine the optimal number of clusters (K), the sum of squared errors (SSE) is plotted against varying K values. The inflection point—where the SSE reduction rate sharply decreases—is selected to ensure that the clustering results are both interpretable and stable. This clustering analysis supports targeted problem diagnoses and the formulation of differentiated optimization strategies for emergency shelter systems.
The clustering results reveal spatial heterogeneity in accessibility under diverse supply–demand patterns, such as “high demand–low supply” or “redundant resources–low accessibility” zones. By analyzing constraints such as traffic bottlenecks, uneven facility allocation, and imbalanced population distributions, the study provides zoned policy recommendations to optimize shelter resource layouts in high-density urban areas, ensuring targeted resilience enhancement.

3.4. Research Area

As a core city of the Guangdong–Hong Kong–Macao Greater Bay Area, Shenzhen is one of China’s most urbanized megacities, spanning 1997.47 km2 across 10 administrative districts. The First National Census on Comprehensive Risk of Natural Disasters in China reports significant increases in both the frequency and intensity of extreme rainfall and heatwave events, with heat-related hazards becoming more destructive.
As a densely populated, rapidly urbanizing, and climate-sensitive coastal megacity, Shenzhen faces multiple natural hazards such as typhoons, heavy rainstorms, and forest fires. It exemplifies both natural and social vulnerability, making it a key case for studying urban climate risk and adaptive strategies.
Characterized by its compact spatial layout and dense population clusters, the city’s early development centered on the original Special Economic Zones of Luohu, Futian, and Nanshan. However, Shenzhen faces significant public safety challenges due to natural hazards (e.g., earthquakes along the southeastern coastal seismic belt, frequent typhoons, and flooding) and anthropogenic risks (e.g., urban–wildland interface fires). To address these risks, the city has established a “5 + 1” hierarchical emergency system, comprising 24 central shelters, 150 long-term fixed shelters, and a multimodal evacuation network (17 disaster relief corridors and 123 helicopter landing sites), capable of accommodating 2.28 million people for medium- to long-term refuge. Regulatory measures integrate shelter construction into land-use policies and foster cross-regional resource-sharing mechanisms, advancing the goal of “multi-hazard resilience” and serving as a model for megacity disaster planning.
Shelter location data, including grade and geographic coordinates, were sourced from the Shenzhen Emergency Management Bureau and refined using the Baidu Map Coordinate Picker. Road network data from OpenStreetMap were calibrated for accuracy. Using ArcGIS, the urban core was divided into 1000 × 1000 m grids, with grid centers designated as population demand points. Population density data at a 100 × 100 m resolution were extracted from the WorldPop dataset. An enhanced Gaussian two-step floating catchment area (G2SFCA) model was applied to assess shelter accessibility, while a K-means clustering analysis identified spatial disparities in accessibility. This methodology aims to refine traditional evaluation frameworks and provide actionable insights for optimizing Shenzhen’s emergency shelter layout. The distribution of emergency shelters in Shenzhen is shown in Figure 3.
Figure 3 illustrates that the distribution of emergency shelters in Shenzhen is relatively uniform. Although areas with high population density have a greater number of emergency shelters, there are also a significant number of shelters located in low-density regions. This distribution is somewhat related to Shenzhen’s exceptionally high population density compared to the national average. Furthermore, Shenzhen continues to advance its emergency evacuation and rescue spatial planning, establishing itself as a benchmark for resilient urban safety in China. The distribution of service facilities and road networks in Shenzhen is shown in Figure 4.
Figure 4 clearly shows that Futian District, Luohu District, and Nanshan District exhibit a high richness of facilities (Figure 4a) and a dense road network (Figure 4b). These areas also feature relatively high population densities, host major ports connecting to Hong Kong and Macao, and are economically developed. In contrast, the Dapeng New District appears relatively less developed, although it still maintains certain facilities and areas with a high road network density.

4. Results

This paper explores the accessibility of emergency shelters from two perspectives. First, it assesses the bidirectional matching between shelter supply (emergency shelters) and demand (population), aiming to avoid excessive concentration of shelters in high-density areas that could reduce the overall service coverage, lead to inequitable resource distribution, and weaken the disaster backup capacity. Second, it examines the service capacity of shelters by focusing on the road network density and facility diversity to enhance residents’ self-rescue ability during emergencies.
Based on Shenzhen’s emergency shelter planning, three search radii—1 km, 2.5 km, and 5 km—are set to reflect varying disaster scenarios and evacuation behaviors. Specifically, for minor disasters, residents tend to seek nearby shelters within a small radius due to the rapid decline in the hazard impact, whereas for major disasters, the search radius expands significantly and hazards persist longer, necessitating centralized resource management and allocation.
As shown in Table 1, the service radius for emergency shelters in Shenzhen can be set at 1 km, 2.5 km, or 5 km. Based on a traditional transportation network service area analysis, the results are illustrated in Figure 5.
The service area with a 1000 m travel distance covers 574.05 km2, accounting for 26.7% of the total service area. The service area within the 1000–2500 m travel distance extends to 971.27 km2, representing 45.2% of the total, while the 2500–5000 m travel distance covers 601.83 km2, comprising 28% of the total service area. The total service area is 1975.17 km2, exhibiting a 1% deviation from Shenzhen’s total area of 1997.47 km2, as certain boundary regions are not fully covered. However, considering the potential extension of emergency shelter services to adjacent municipalities, the overall coverage can be regarded as comprehensive. The primary coverage area falls within the 1000–2500 m range, accounting for nearly 50% of the total service area, while the 2500 m service radius achieves a cumulative coverage rate of approximately 70%. Nevertheless, traditional network analyses primarily provide a macro-level assessment of service coverage and lack the capacity to accurately capture the spatial matching between the supply and demand. To address this limitation, this study applied the Gaussian-based 2SFCA method to evaluate emergency shelter accessibility, with the results presented in Figure 6, Figure 7 and Figure 8.
From Figure 6, it can be observed that when using the area of emergency shelter sites as the supply parameter and the population within a 1000 m grid as the demand parameter, the maximum accessibility value of emergency shelters within a 1000 m range is 0.510696, with an average of 0.01357 and a standard deviation of 0.034043. This indicates high accessibility but low coverage. For instance, in Futian, Nanshan, and Luohu, the demand for emergency shelters greatly exceeds the supply, whereas in Dapeng New District, despite limited the supply and lower demand, the 2SFCA method, which fully accounts for the bidirectional matching of the supply and demand, yields relatively high accessibility rates. Moreover, this high accessibility is distributed relatively evenly across Shenzhen’s districts, suggesting that each district has the potential for optimization. An optimized layout could, therefore, achieve an efficient match between supply and demand.
As shown in Figure 7, the maximum accessibility value of emergency shelters within the 2500 m range is 0.115725, with an average value of 0.012328 and a standard deviation of 0.015838. Compared to the accessibility distribution at 1000 m, the standard deviation decreases, indicating reduced variability, while the average value remains unchanged. However, the maximum value decreases significantly, suggesting that the 2500 m range enhances the service coverage for high-density population areas and reduces disparities among different districts. This indicates a substantial improvement in the likelihood that residents can access an emergency shelter within 30 min.
As shown in Figure 8, the maximum accessibility value for emergency shelters within the 5000 m range is 0.063335, with an average value of 0.01642 and a standard deviation of 0.010457. The maximum value decreases significantly, while the average value increases and the standard deviation further decreases. This indicates a substantial reduction in the correlation between supply and demand, suggesting that within a 5 km radius, Shenzhen residents experience relatively uniform emergency shelter accessibility. The increased number of available shelters within this range ensures that basic emergency shelter needs can be met without significant differences in accessibility.
To further identify and analyze the spatial disparities in emergency shelter accessibility and their underlying determinants in Shenzhen, a K-means clustering analysis was conducted for all grid units. This approach enables the classification of accessibility variation patterns within specific research units, allowing for a more systematic and targeted formulation of optimization strategies. The clustering process incorporates four standardized indicators, namely population density, road network density, service availability, and accessibility values at 1000 m, 2500 m, and 5000 m distances.
As shown in Table 2, the levels of demand, supply, and accessibility are divided into three grades, which are low, medium, and high. For type 1, the accessibility is high when the demand is low and supply is low. However, the accessibility is low when the demand is high and supply is high. In contrast, type 2 involves high supply and demand matching with low accessibility. Type 1 and type 2 exhibit imbalances in the shelter service distribution, while type 3 is a common situation. The distribution of each type with d0 = 1000 m is shown in Figure 9.
As shown in Figure 9, a supply–demand mismatch exists in the accessibility of emergency shelters within a 1000 m travel distance. The majority of areas fall into the categories of low demand–low supply–high accessibility and medium demand–medium supply–medium accessibility, indicating that such patterns are prevalent across all districts. In contrast, the high demand–high supply–low accessibility trend is primarily concentrated in economically developed districts such as Nanshan, Futian, and Luohu, reflecting deficiencies in the current planning of emergency shelters within the 1000 m service radius.
According to the G2SFCA method, accessibility requires considering the matching relationship between supply and demand. Generally, areas with high supply and low demand achieve high levels of accessibility, although regions with both high supply and high demand may exhibit varying outcomes. Shenzhen is the city with the highest population density in China. Nanshan, Futian, and Luohu are the most densely populated districts within Shenzhen. As a megacity with numerous high-rise buildings and extremely high population density, even though these areas have relatively dense road networks and rich facilities, they still cannot fully meet the emergency shelter service demands of the densely concentrated population.
As shown in Table 3, type 3 involves high accessibility with low demand and medium supply. Type 3 may offer some redundancy in evacuation resources, which holds positive significance for the functional guarantee of emergency evacuation processes. Type 1 and type 2 are common situations. Compared to Table 2, the accessibility has been significantly improved within a range of 2500 m. The distribution of each type with d0 = 2500 m is shown in Figure 10.
As shown in Figure 10, the spatial distribution of the emergency shelter accessibility within a 2500 m travel distance exhibits a clear pattern. The high demand–high supply–medium accessibility trend is primarily concentrated in densely populated and economically developed areas, demonstrating a certain degree of spatial positive correlation. This also reflects the integration of urban resilience principles into the planning of 30 min living circles. However, a significant number of areas fall into the medium demand–low supply–low accessibility type, indicating the need for further optimization to transition these areas into medium demand–low supply–medium accessibility or medium demand–medium supply–high accessibility, thereby enhancing the overall effectiveness of emergency shelter services.
High supply and high demand should be met by high accessibility, although as shown in Table 4 besides low supply and demand with high accessibility (type 2), high supply and demand with low accessibility (type 3) form major clusters. Compared to 1000 m and 2500 m, the overall accessibility has been significantly improved. The mismatch in accessibility is often influenced by various factors, such as large numbers of people, vehicles, and buildings and more complex road networks, making it difficult to improve the accessibility. The distribution of each type with d0 = 5000 m is shown in Figure 11.
As shown in Table 4 and Figure 11, the spatial distribution of the emergency shelter accessibility within a 5000 m travel distance exhibits a pattern similar to that of the 2500 m range, with an increase in low demand–low supply–high accessibility areas. This trend indicates a certain degree of resource redundancy in emergency shelters, which is beneficial for the long-term development of Shenzhen’s emergency shelter planning. However, the issue of low accessibility in high-density population areas remains prominent, demonstrating a spatially positive correlation. This necessitates enhanced government intervention to systematically plan emergency shelter resources, focusing on resource allocation, infrastructure optimization, and facility upgrades in these areas. This issue is closely related to the built environment, where the “peacetime and emergency integration” concept suggests that the distribution of emergency resources is influenced by market dynamics, further emphasizing the need for coordinated planning.

5. Discussion

5.1. Advantage

Compared to the majority of prior studies that primarily employ static measures such as “nearest distance” or facility-to-population ratios, this study utilized a dynamic supply–demand matching framework combined with a multi-scale analysis. This approach comprehensively accounts for route robustness within spatial proximity and the adaptive capacity of emergency resources, thereby providing a more systematic elucidation of the underlying spatial imbalances and localizing these imbalances at the cluster level. Such an approach more accurately captures the fragmented accessibility characteristic of disaster scenarios.
The findings indicate that in high-density urban contexts, even when the quantity or total area of emergency shelters reaches a certain threshold, the actual accessibility may remain limited if the spatial configuration and transportation connectivity are suboptimal. This observation aligns with the findings of Zhu et al. [71] regarding medical resource accessibility in Shenzhen, which emphasize that high supply does not necessarily equate to equitable access; rather, the spatial distribution pattern is the critical determinant of resource effectiveness.
Distinct from previous research studies that predominantly focus on metrics such as “coverage rates” or “average accessibility” [72,73,74], this study employed K-means clustering to uncover diverse patterns of supply–demand imbalance and their driving factors. While prior studies have concentrated on the distribution of firefighting, law enforcement, and medical facilities to enhance rapid disaster responses and emergency rescues, the present study extended the discourse by focusing on emergency evacuation. Concerning the terrain slope, emergency shelters are subject to stringent construction standards that mandate locations being upstream of water bodies and at elevated sites. Given that Shenzhen has published registries of designated emergency shelters, this study primarily serves as an assessment of the spatial rationality of existing shelter allocations.

5.2. Interpretation and Application

In dense urban areas, the relationship between the shelter locations and actual accessibility is complex. The results indicate that ample shelter supply in core urban zones does not guarantee accessible services. Without integrating the road connectivity, population density, and land-use structure during planning, residents may face difficulties reaching safe zones within critical time frames. This “high supply–low accessibility” structural mismatch exposes fundamental weaknesses in urban resilience. Thus, emergency shelter planning should shift from mere quantity expansion to service-accessibility-based structural optimization, and this approach can be extended to other dense cities as a tool to evaluate the public service equity and efficiency.
By employing fixed search radii, this study investigated their impact on accessibility, revealing that accessibility tends to equilibrate at longer distances (e.g., 5 km), whereas supply–demand mismatches are more pronounced at shorter distances (e.g., 1 km). This finding echoes Liu et al.’s [75] study on mid-to-long-term shelter layouts in Xuchang, China, which emphasizes the critical importance of short-distance service radii in the “first emergency response zone,” further highlighting the necessity of micro-scale spatial interventions. For “low demand–low supply–high-accessibility” clusters within a 5000 m radius—such as the Dapeng New District—the long-term planning should prioritize resource efficiency and redundancy reductions by establishing resilient resource buffers and reserving space for future population growth or functional expansion. Conversely, at the 1000 m service radius, “high demand–high supply–low accessibility” areas predominantly cluster in urban cores such as Futian, Luohu, and Nanshan. These zones face challenges of high population density, complex land use, and congested or fragmented road networks. For such clusters, promoting “multi-functional mixed-use” shelters by integrating everyday facilities such as schools and community parks into the emergency shelter system is critical to maintaining urban vitality while enhancing disaster resilience. Notably, the presence of “low demand–low supply–high accessibility” clusters in Shenzhen’s peripheral areas (e.g., the Dapeng New District) signals the spatial redundancy of the shelters in these fringe zones. This aligns with Wang et al.’s [76] evaluation of shelter layout rationality in Shanghai, which identified a high-to-low-to-medium distribution pattern from the city center outward, reflecting the structural complexity and uneven regional development of megacities, and reinforcing the view that “uniform standards” are inadequate for diverse urban patterns.
However, this study was based on an analysis of 652 registered indoor emergency shelters in Shenzhen, as documented by the Emergency Management Bureau of Shenzhen Municipality. These shelters primarily include schools, community workstations, and gymnasiums. Such emergency shelters are officially recognized in China’s Guidelines for the Preparation of Special Plans for Emergency Shelters, which mandate that the renovation and planning of emergency shelters should fully utilize existing public facilities and spaces, such as schools and cultural and sports venues, for optimized spatial allocation.

5.3. Model Limitations and Improvements

First, regarding factor selection, although this study integrated key elements such as the population density, road network density, and shelter capacity, it omitted hierarchical factors widely recognized as critical in emergency shelter planning. These include the terrain slope [4], spatial coupling with essential infrastructure such as hospitals [77] and schools [20], and specific vulnerable population distributions. Previous research studies indicate that these factors directly affect the evacuation route accessibility and shelter feasibility, forming the basis for functional integration and risk-sensitive planning.
Second, in terms of data, while the approach performs well in Shenzhen—a first-tier city with dense road networks and comprehensive data—its applicability elsewhere faces limitations. Population data are static, failing to capture diurnal population dynamics or commuting patterns influencing shelter demand. In smaller or topographically complex cities (e.g., mountainous areas), the limited road connectivity and low data granularity may reduce the accuracy of network-distance-based service simulations using the G2SFCA method. Future studies could incorporate dynamic data sources such as mobile signaling or POI trajectories for enhanced model precision. Additionally, the current model does not fully account for the terrain slope, building density, or spatial relationships with critical infrastructure such as hospitals or fire stations, which are vital for efficient disaster response.
For cities with significant population density disparities, complex terrain, or varied transport layouts, localized adjustments are recommended: (1) calibrate the service radii and distance decay functions based on actual travel behavior and road accessibility to better simulate evacuation routes; (2) incorporate local variables such as the slope, hazard vulnerability, and key infrastructure distribution to enrich the evaluation dimensions; (3) integrate urban functional zoning or administrative units into the clustering to support more actionable spatial planning. These targeted optimization steps would enable researchers and planners to adapt the framework flexibly within local emergency shelter assessment and optimization processes, improving the disaster response and spatial governance. Future research studies may extend this framework across cities or regions, establishing transferable spatial accessibility assessment systems to support national-scale comprehensive disaster mitigation strategies.

6. Conclusions

This study employed an improved Gaussian two-step floating catchment area method (G2SFCA) to evaluate the accessibility of emergency shelters in central Shenzhen across multiple service radii, and applied K-means clustering to uncover the spatial mechanisms underlying accessibility imbalances. The findings were as follows:
(1)
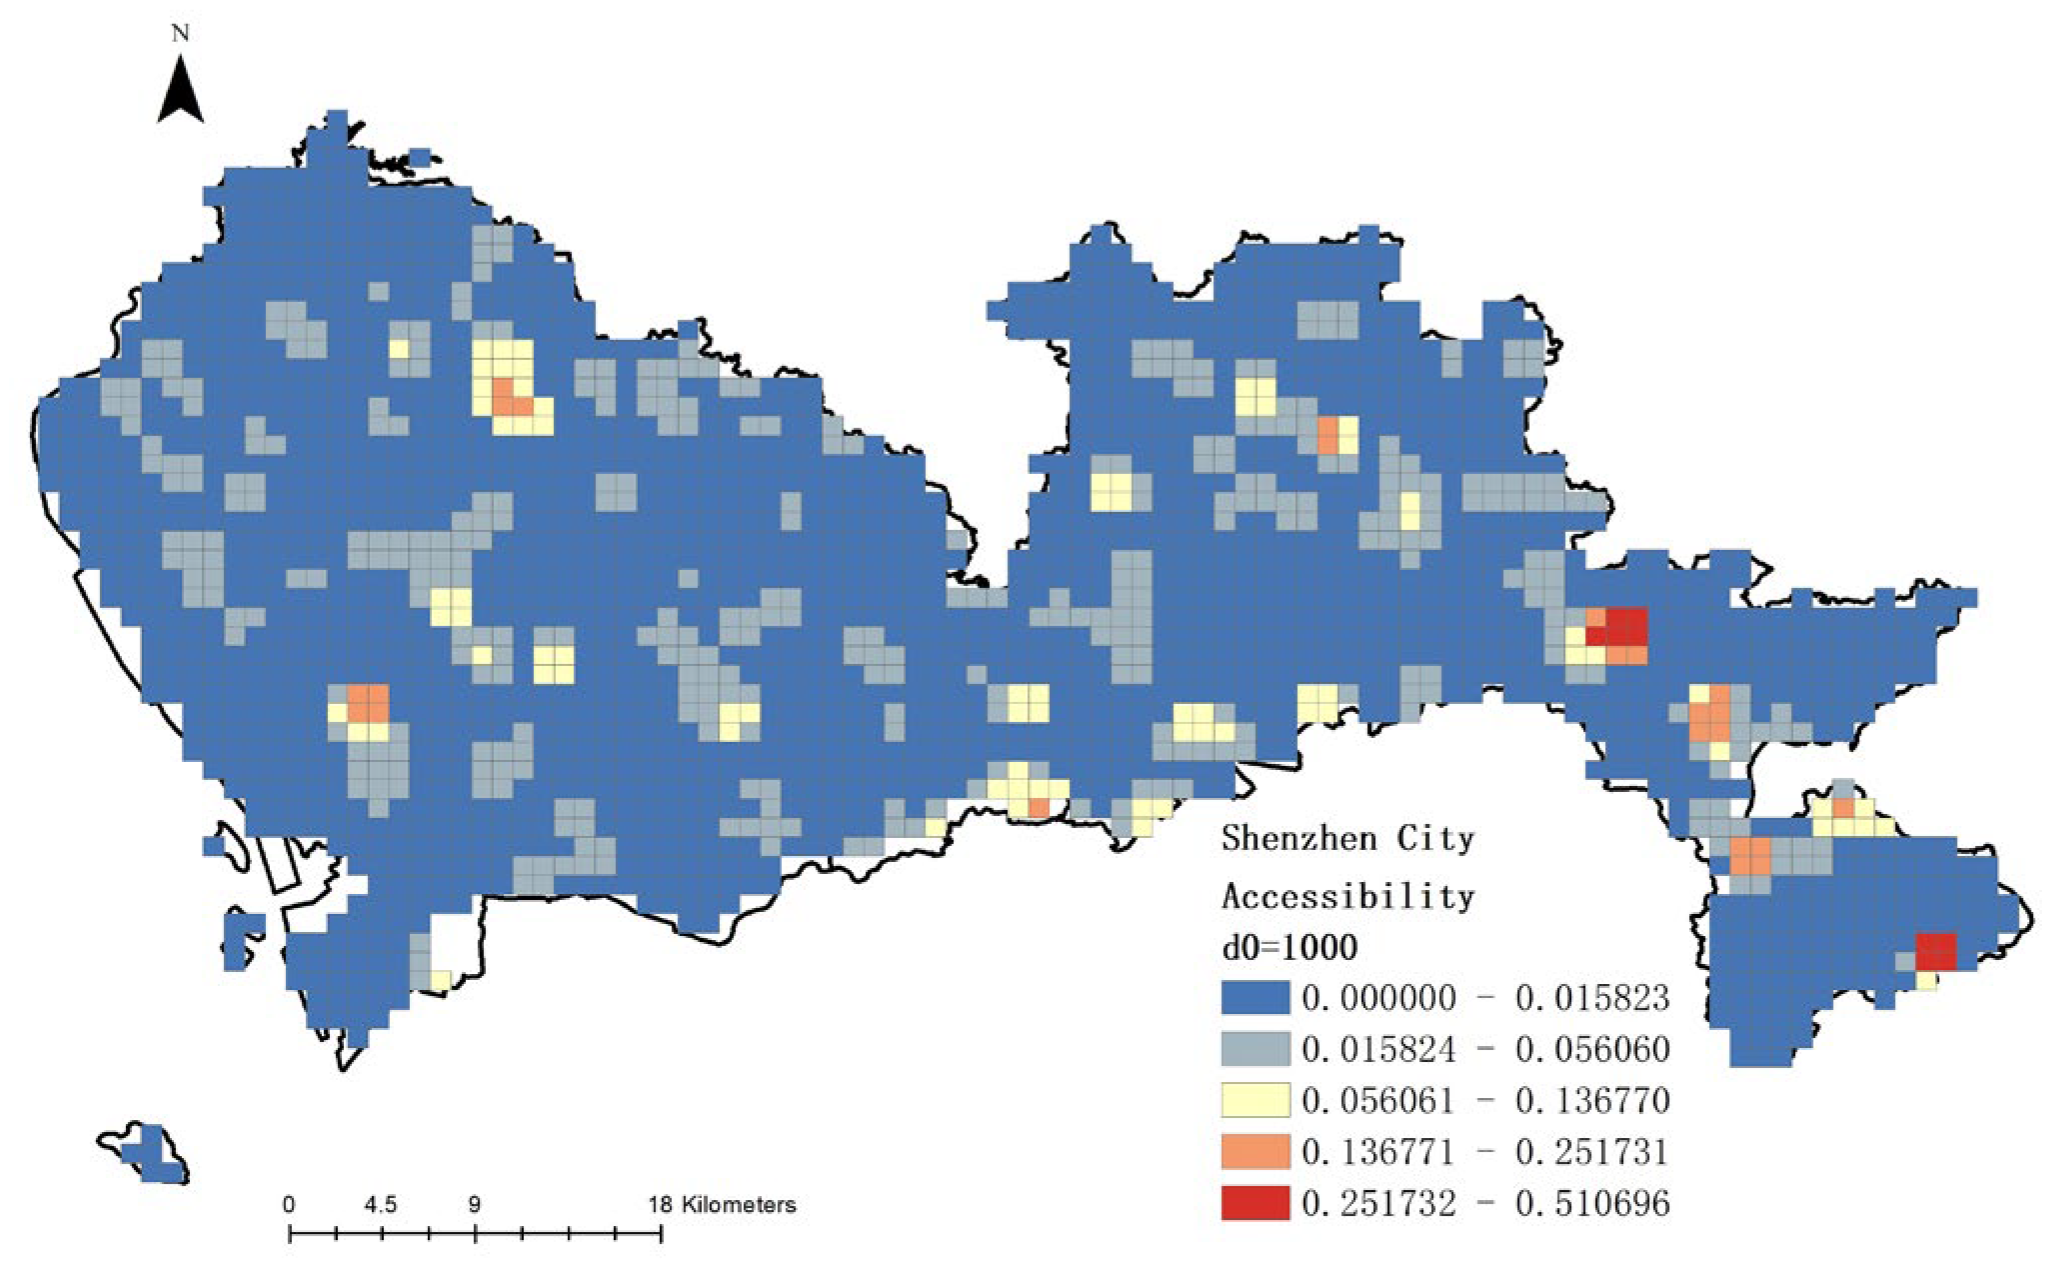
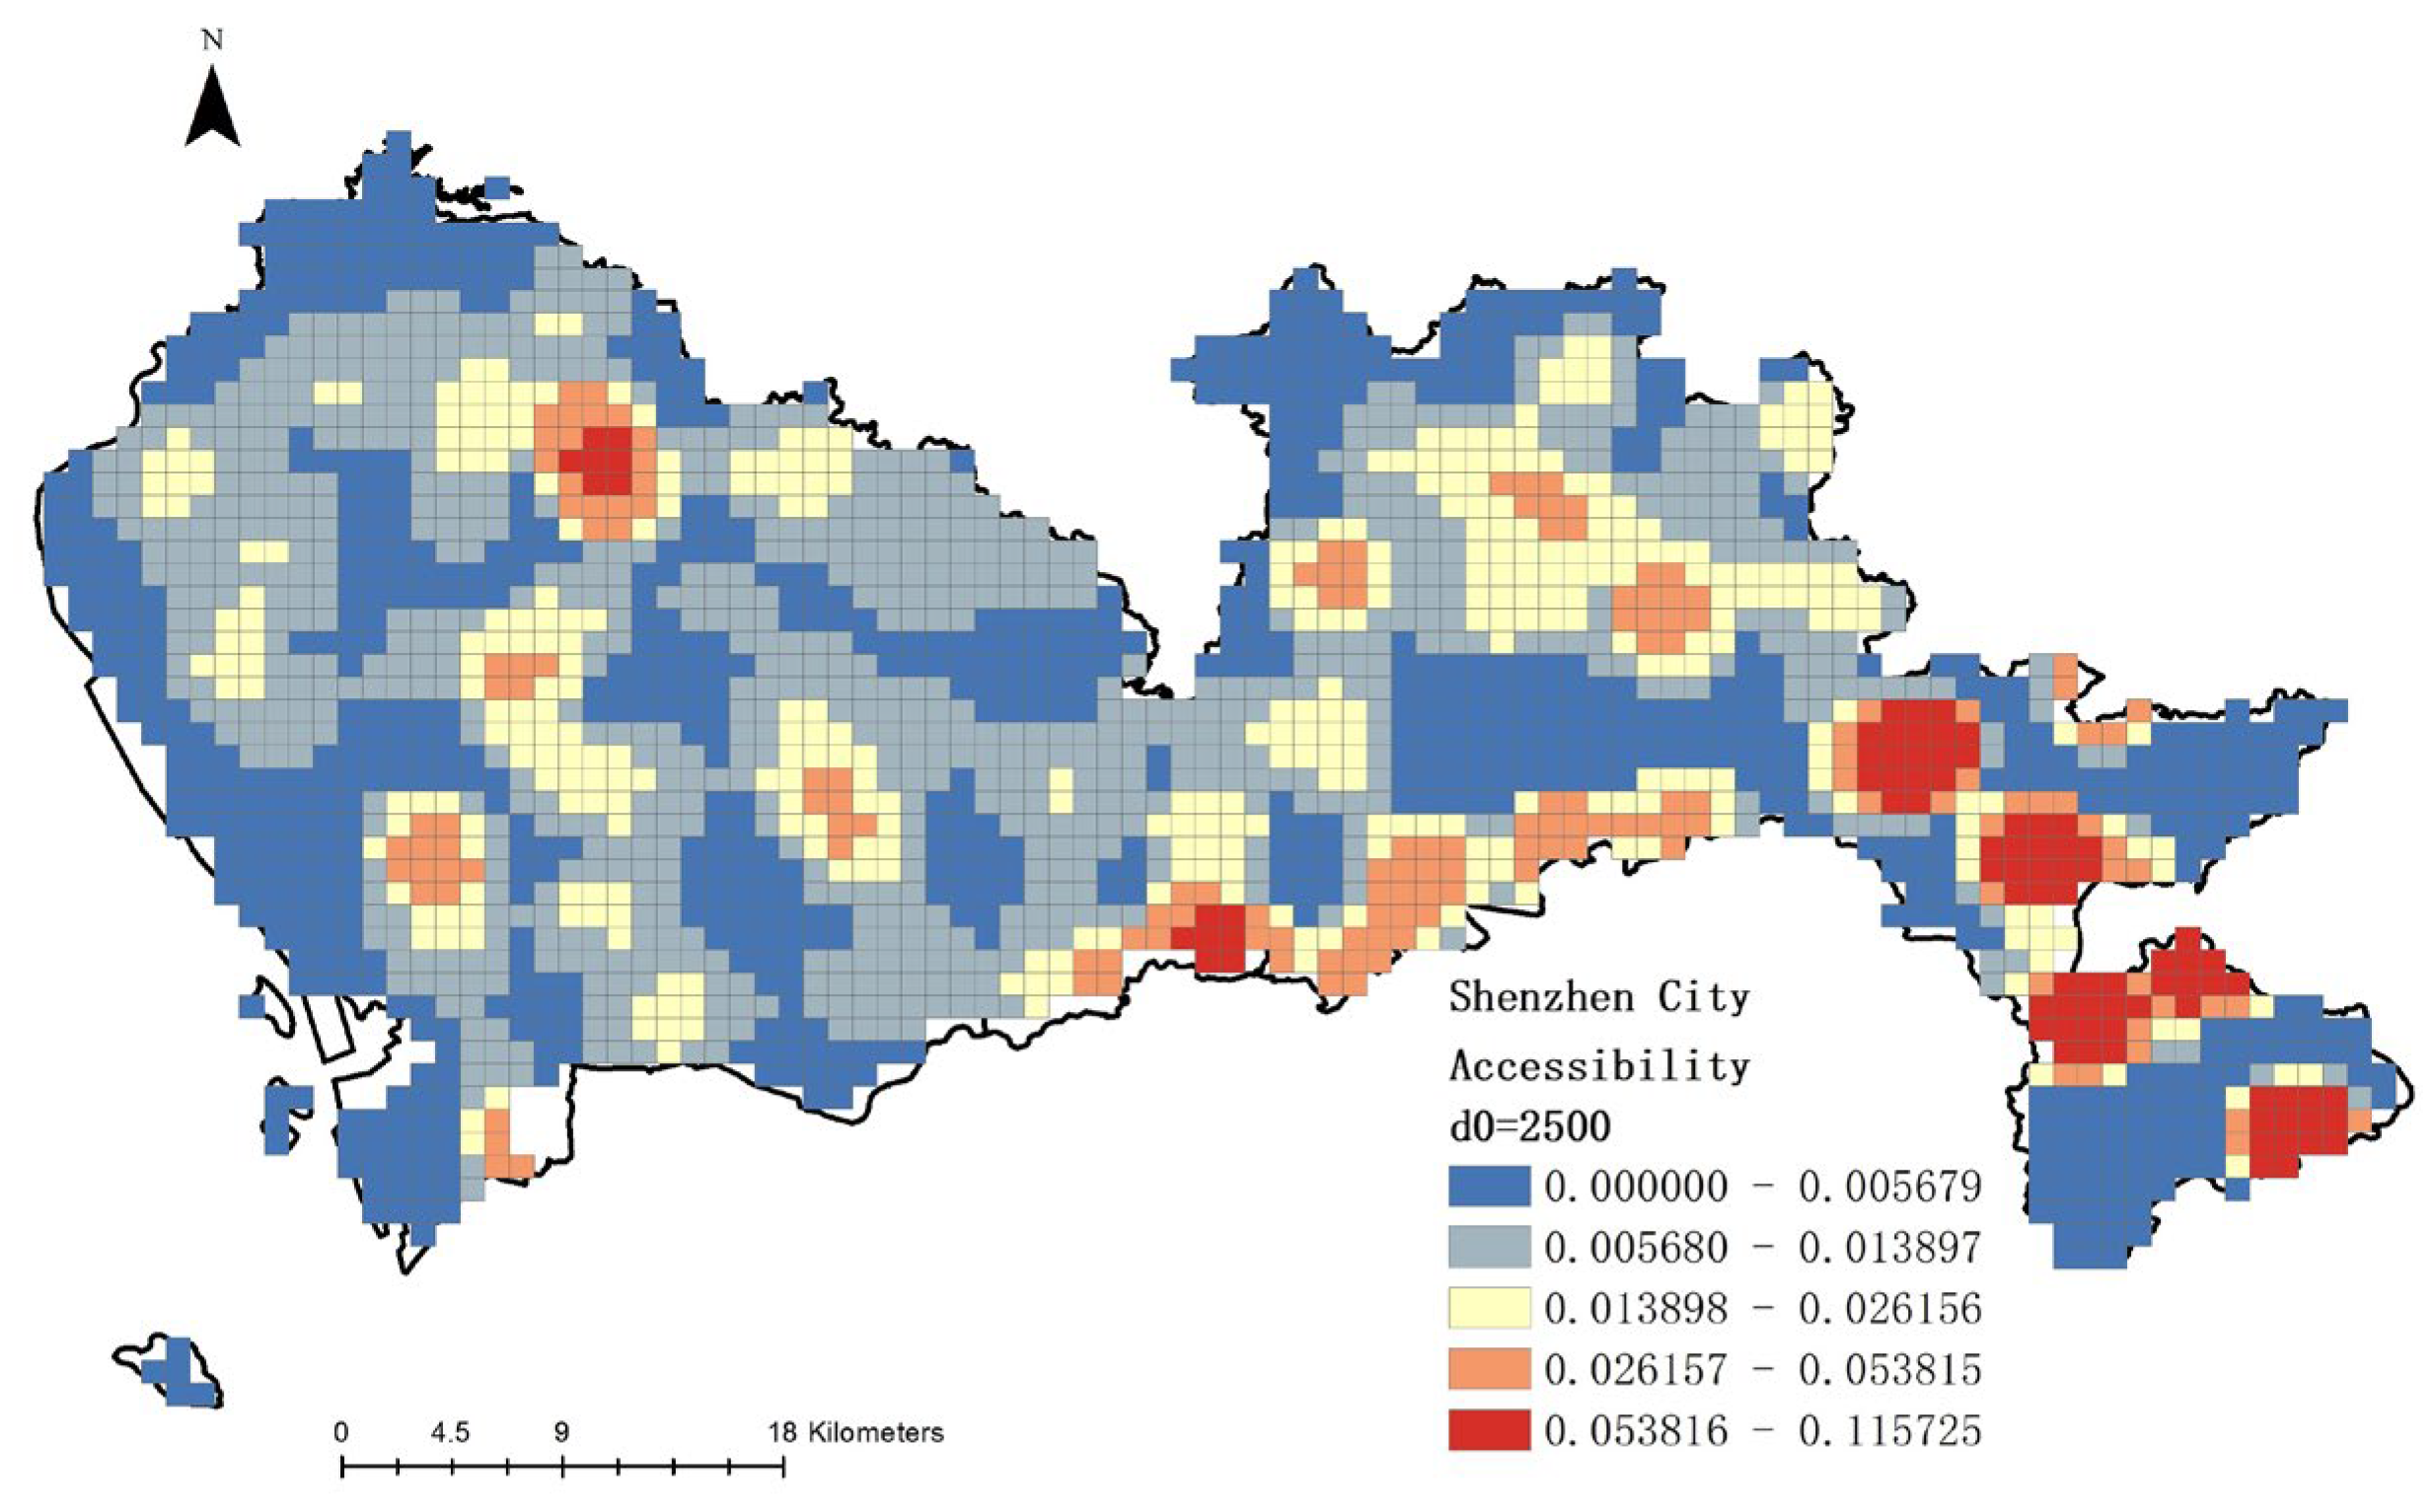
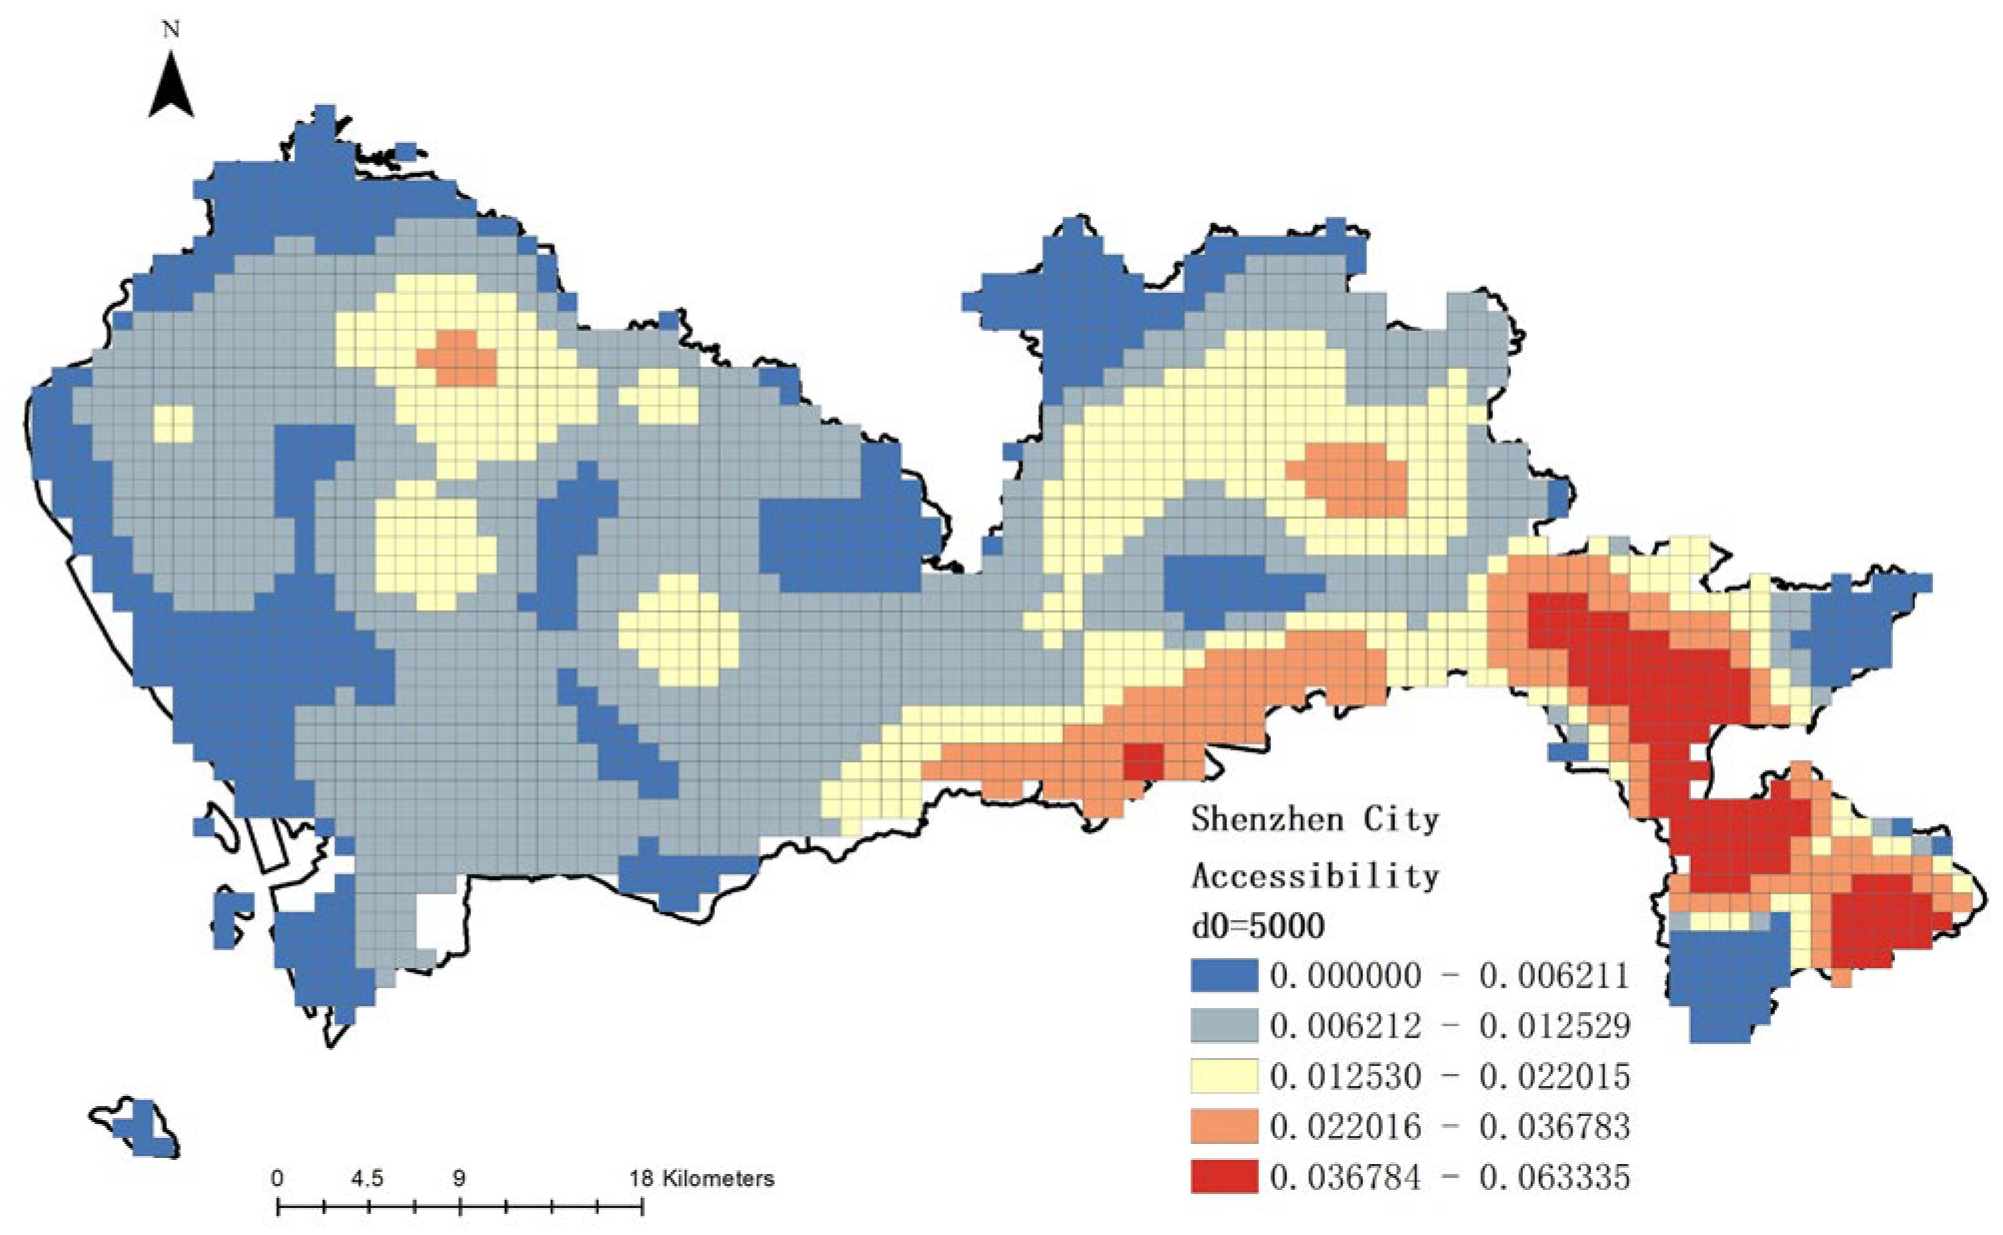
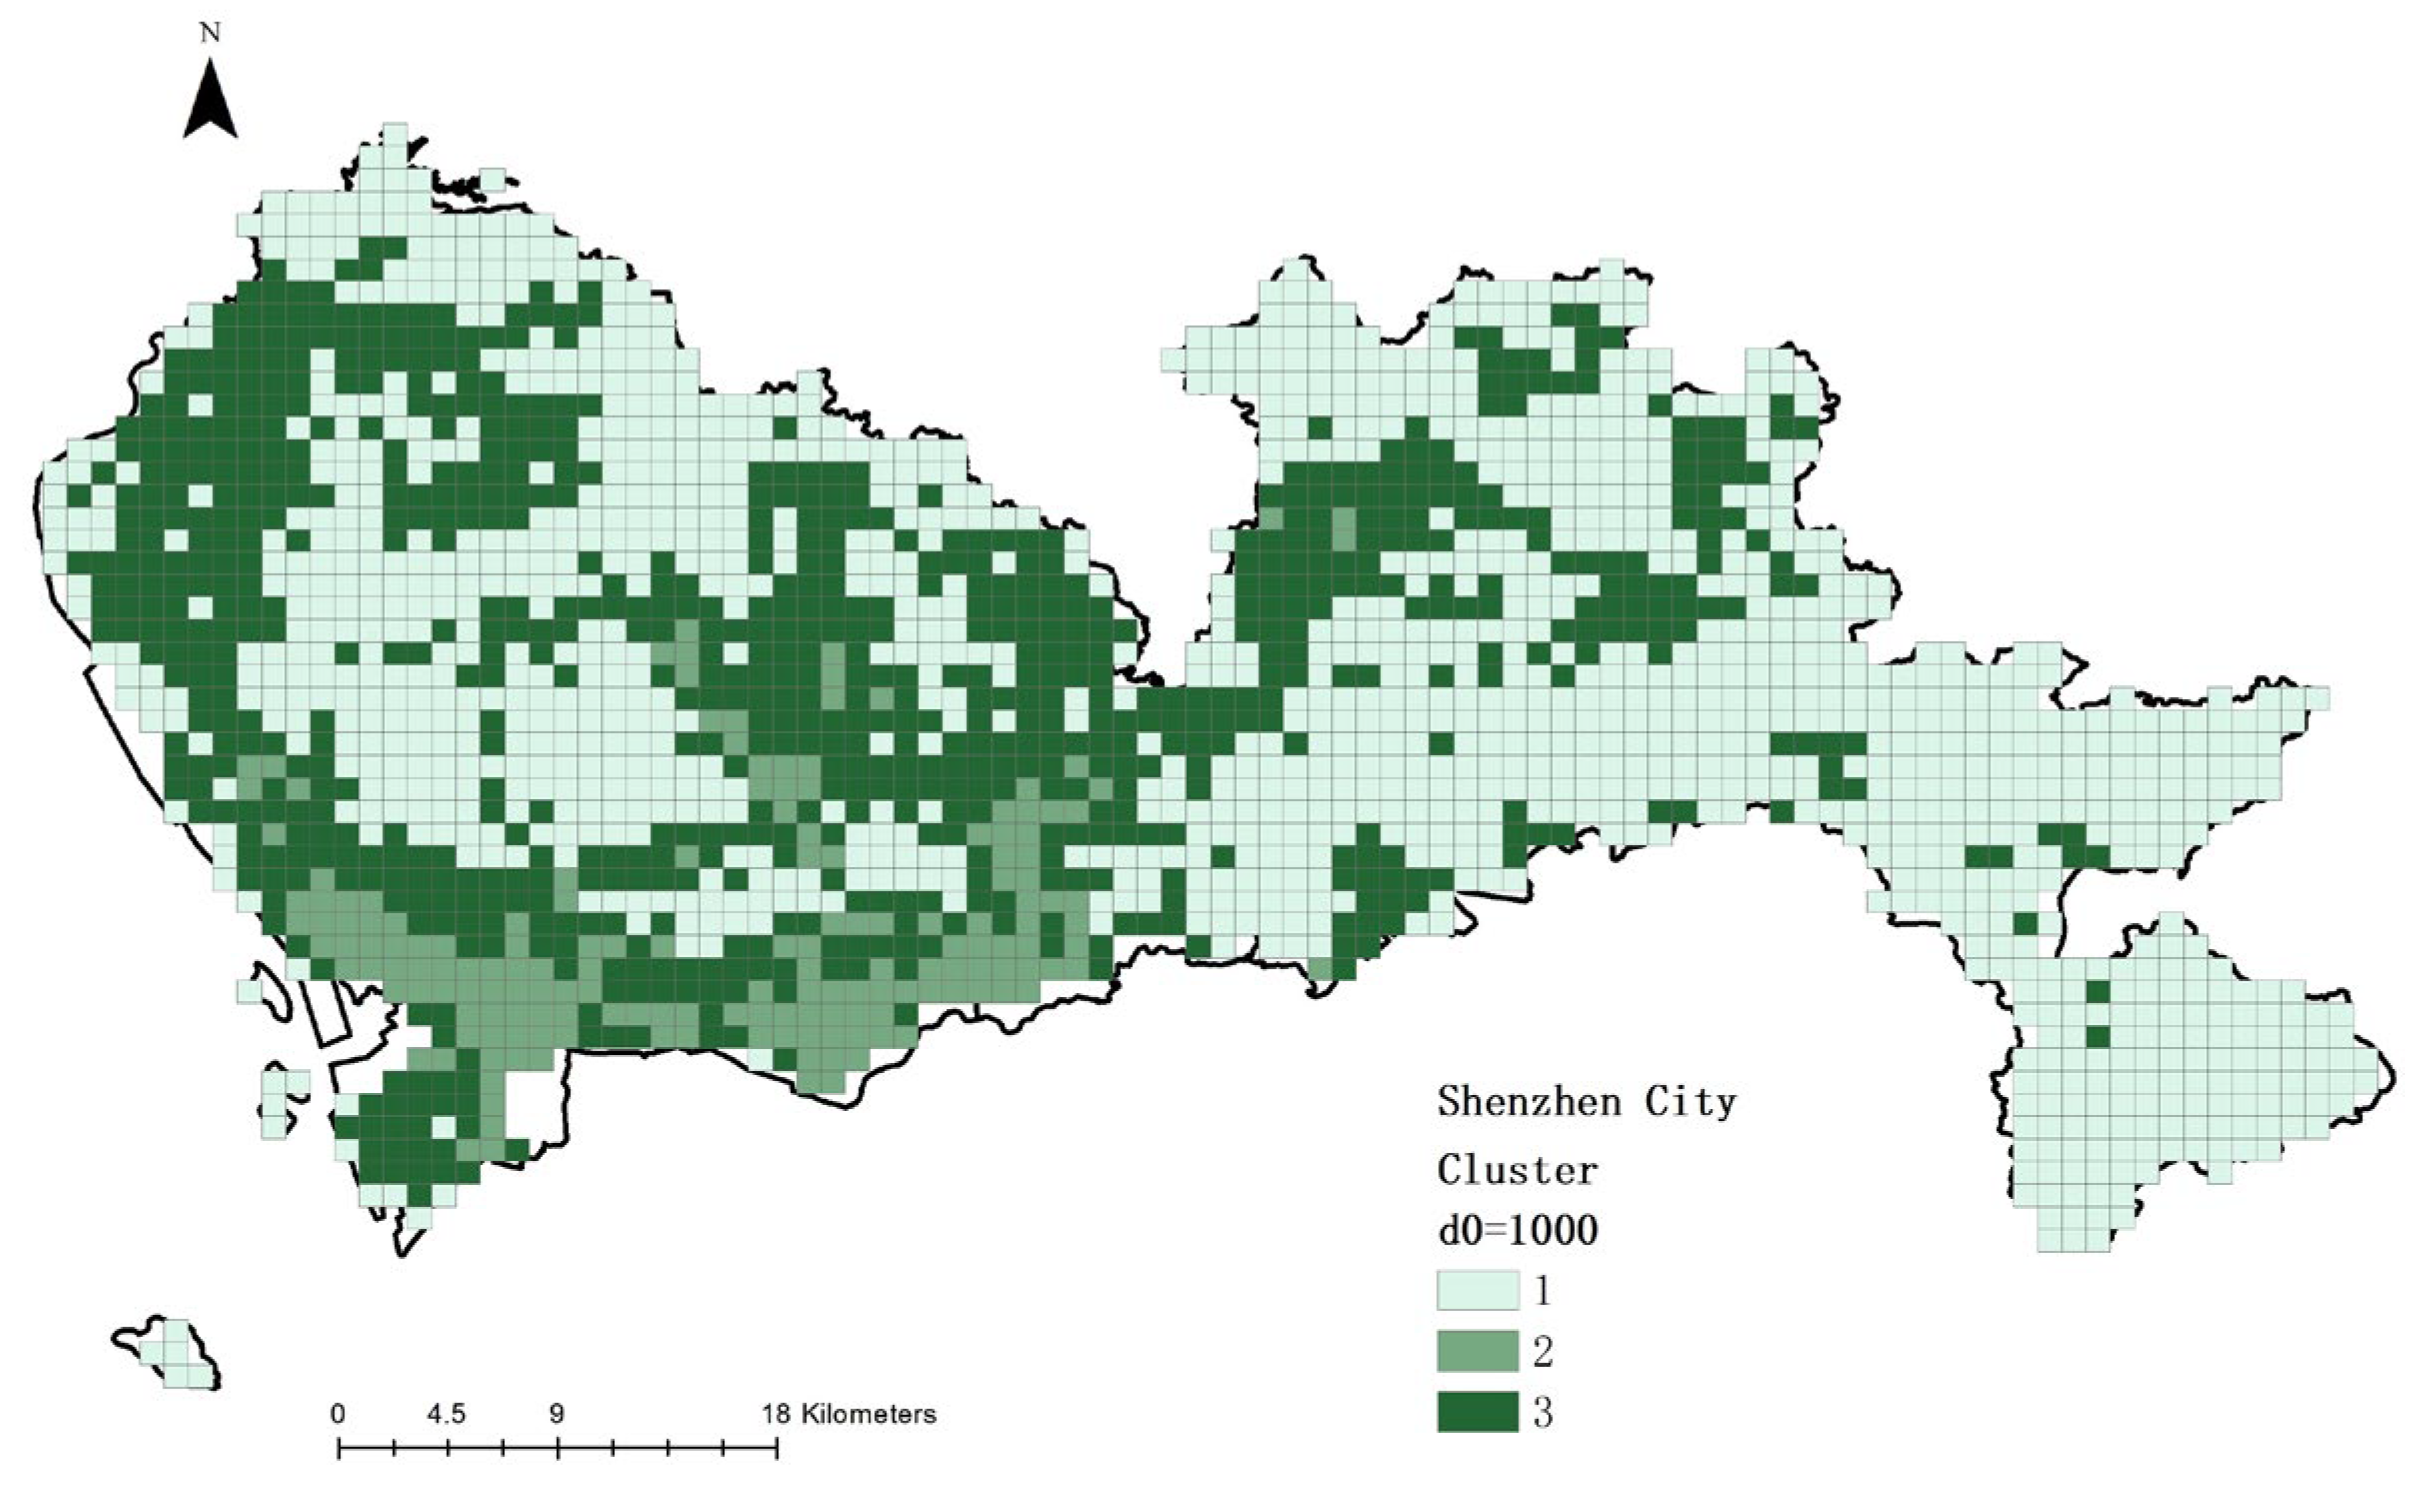
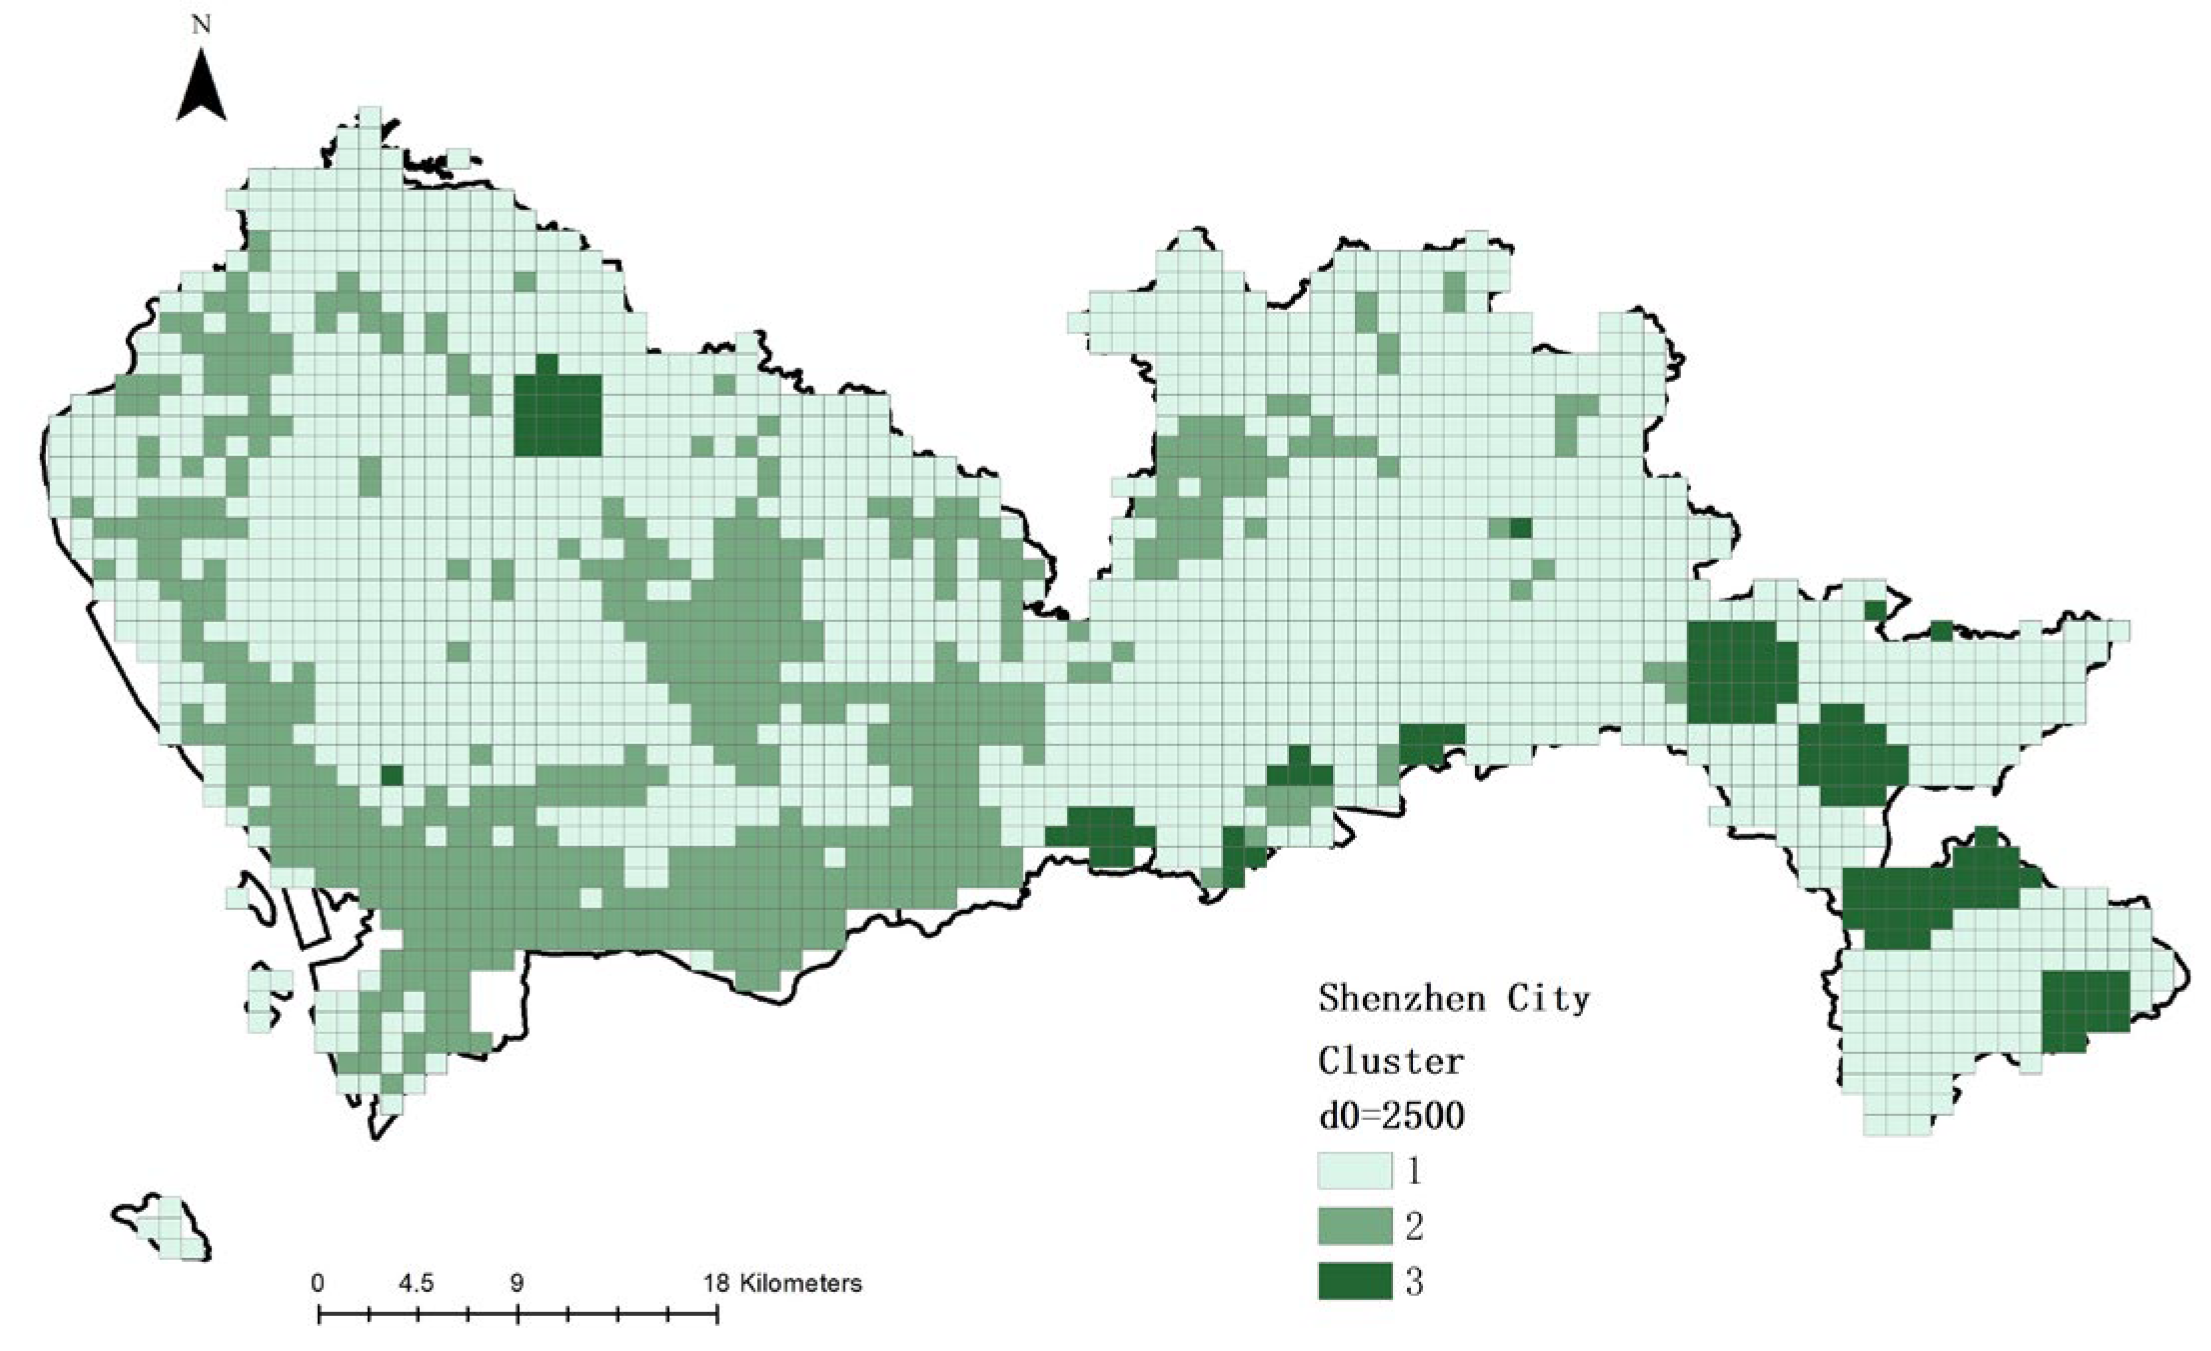
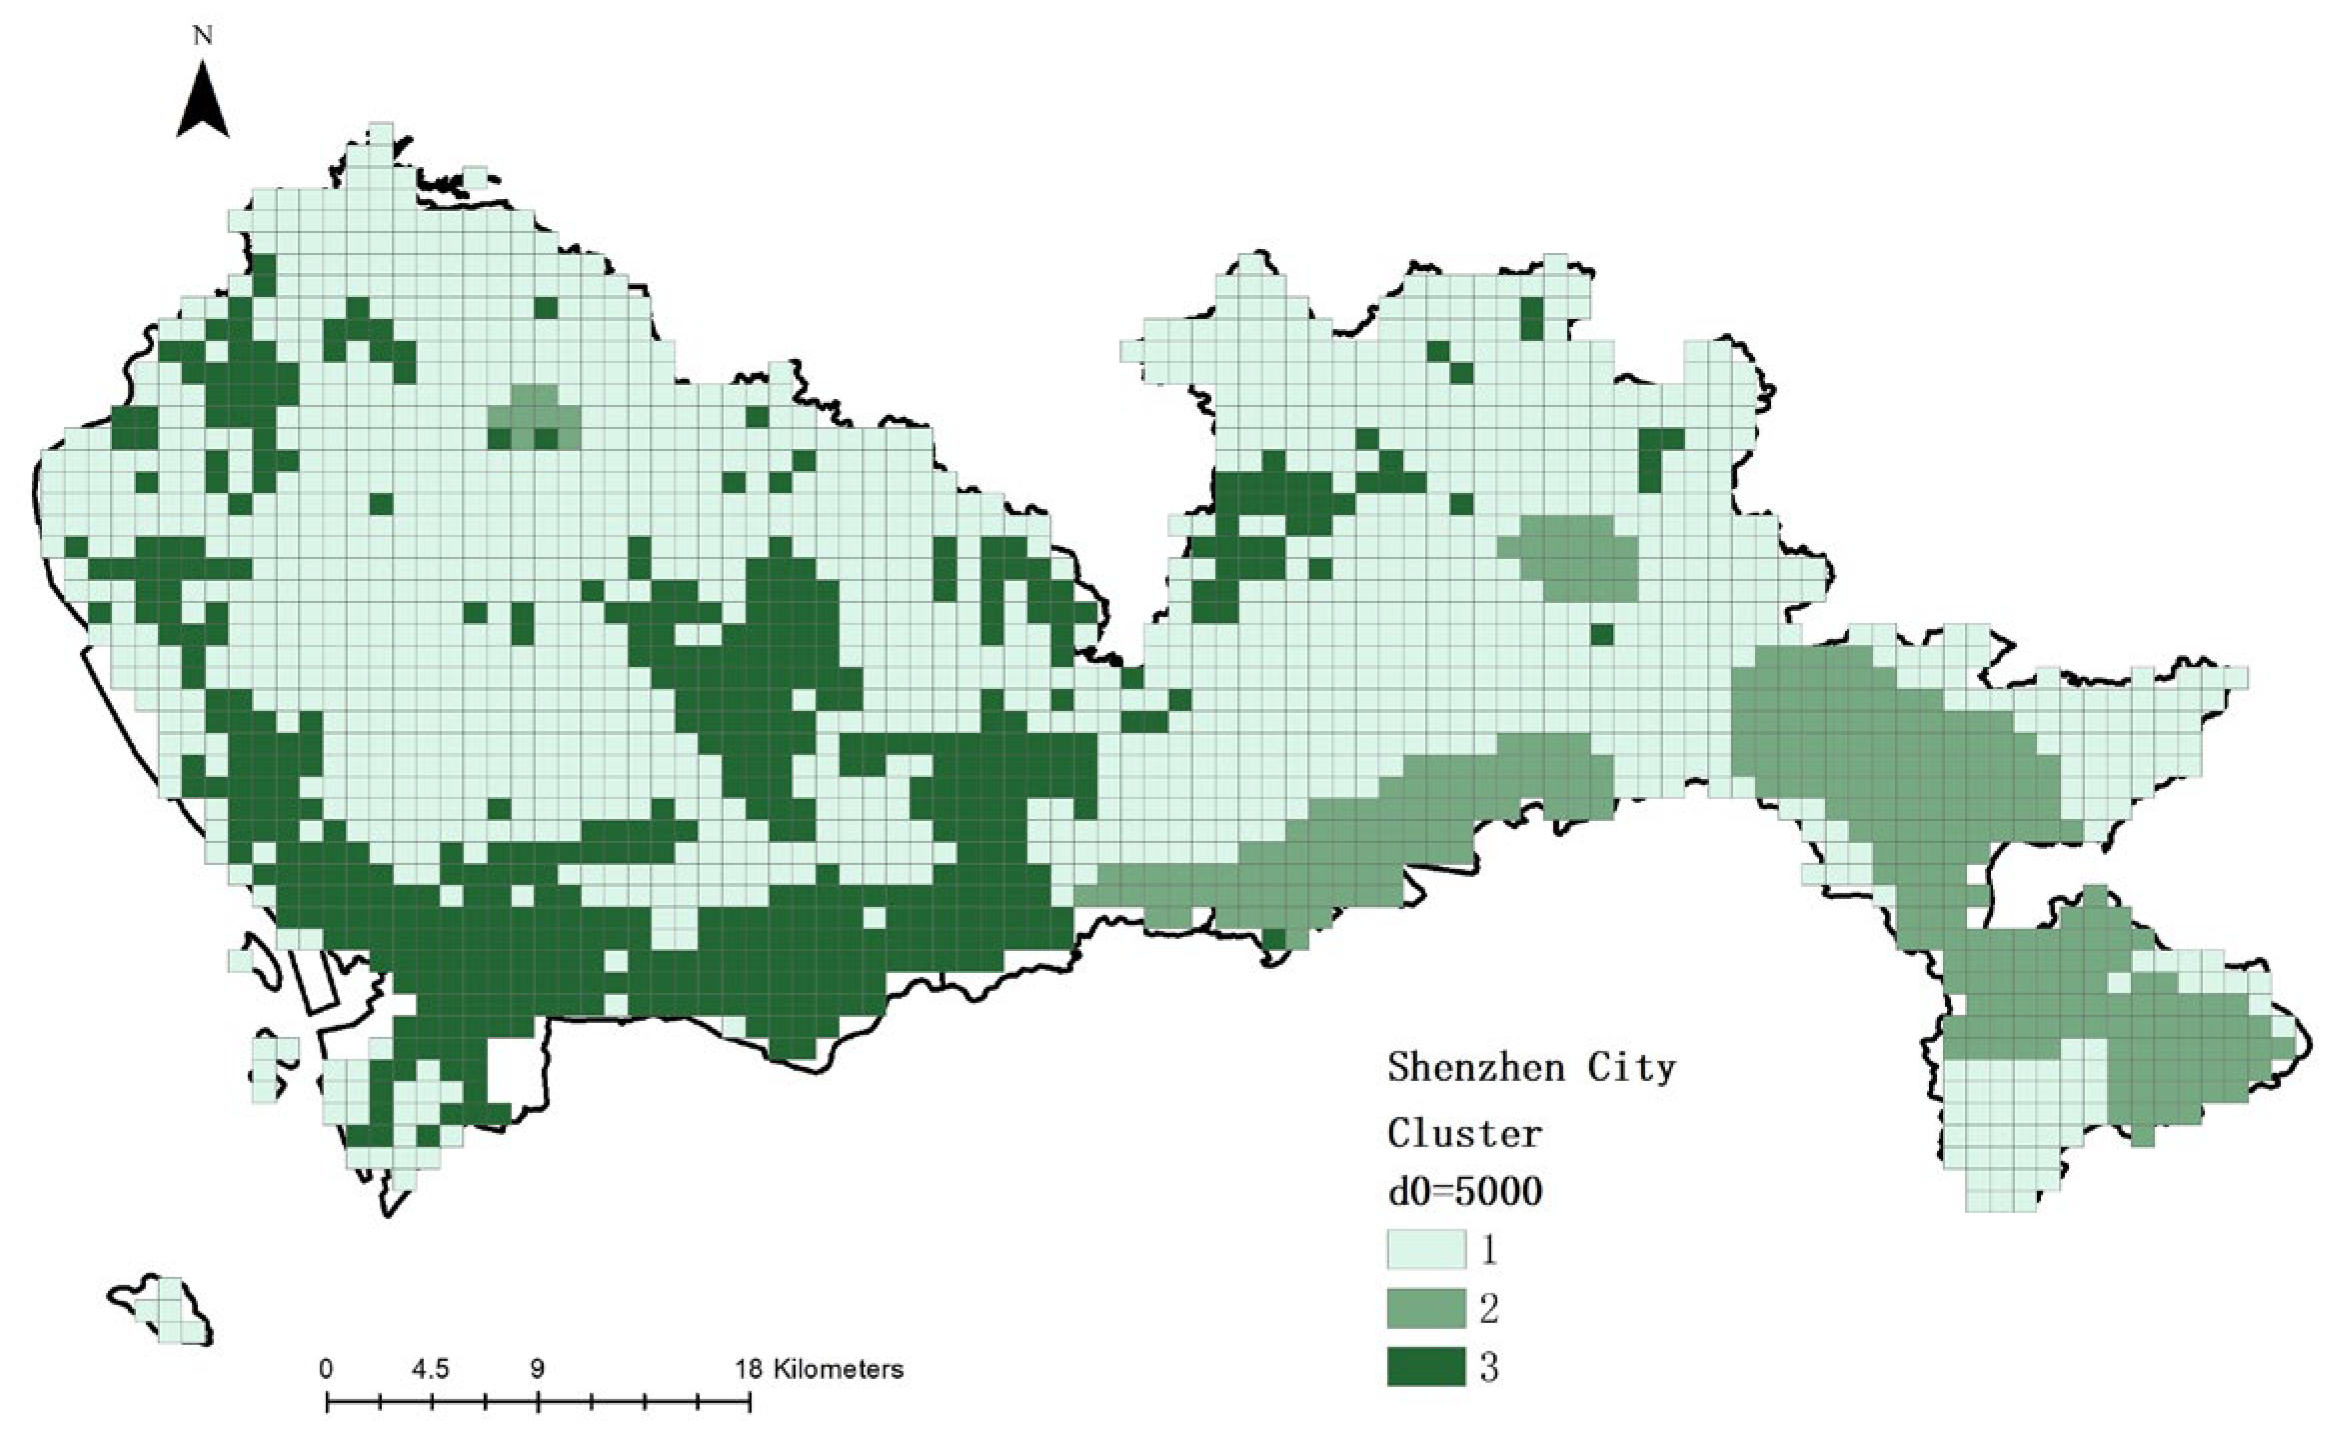
The shelter accessibility demonstrated significant spatial heterogeneity and scale effects. Across service radii of 1 km, 2.5 km, and 5 km, the accessibility showed a trend of decreasing maximum values, increasing averages, and narrowing disparities as the radius expands.
(2)
Typical spatial patterns—such as “high demand–high supply–low accessibility” and “low demand–low supply–high accessibility”—were observed in different areas, indicating resource strain in central districts and buffer potential in peripheral zones.
(3)
The population density and road network structure are key drivers of accessibility imbalances. The clustering analysis provides a basis for formulating differentiated optimization strategies tailored to local conditions.

Author Contributions

Conceptualization, Q.Y. and X.L.; methodology, Y.L.; software, X.L.; validation, Q.Y., X.L. and Z.D.; formal analysis, X.L.; investigation, Z.D.; resources, Y.L.; data curation, Y.L.; writing—original draft preparation, X.L.; writing—review and editing, Z.D. All authors have read and agreed to the published version of the manuscript.

Funding

This research was supported by the National Natural Science Foundation of China (code: 72374164).

Institutional Review Board Statement

Not applicable.

Informed Consent Statement

Not applicable.

Data Availability Statement

The data presented in this study are available on request from the corresponding author.

Acknowledgments

We thank the four anonymous reviewers for their useful comments. The scientific results and conclusions, as well as any views or opinions expressed herein, are those of the author(s).

Conflicts of Interest

The authors declare no conflicts of interest.

Abbreviations

The following abbreviations are used in this manuscript:
2SFCATwo-Step Floating Catchment Area
G2SFCAGaussian Two-Step Floating Catchment Area

References

  1. Liu, Y.; Yang, Y.; Li, L. Major natural disasters and their spatio-temporal variation in the history of China. Geogr. Sci. 2012, 22, 963–976. [Google Scholar] [CrossRef]
  2. Giupponi, C.; Gain, A.K. Integrated spatial assessment of the water, energy and food dimensions of the sustainable development goals. Reg. Environ. Change 2017, 17, 1881–1893. [Google Scholar] [CrossRef]
  3. United Nations Office for Disaster Risk Reduction. Sendai Framework for Disaster Risk Reduction 2015–2030; United Nations Office for Disaster Risk Reduction: Geneva, Switzerland, 2015; p. 32. [Google Scholar]
  4. Zhang, Z.; Hu, Y.; Lu, W.; Cao, W.; Gao, X. Spatial accessibility analysis and location optimization of emergency shelters in Deyang. Geomat. Nat. Hazards Risk 2023, 14, 2213809. [Google Scholar] [CrossRef]
  5. Bashawri, A.; Garrity, S.; Moodley, K. An overview of the design of disaster relief shelters. Procedia Econ. Financ. 2014, 18, 924–931. [Google Scholar] [CrossRef]
  6. Asgary, A.; Azimi, N. Choice of emergency shelter: Valuing key attributes of emergency shelters. Int. J. Disaster Resil. Built Environ. 2019, 10, 130–150. [Google Scholar] [CrossRef]
  7. Ma, Y.; Xu, W.; Qin, L.; Zhao, X. Site selection models in natural disaster shelters: A review. Sustainability 2019, 11, 399. [Google Scholar] [CrossRef]
  8. Fang, D.; Pan, S.; Li, Z.; Yuan, T.; Jiang, B.; Gan, D.; Sheng, B.; Han, J.; Wang, T.; Liu, Z. Large-scale public venues as medical emergency sites in disasters: Lessons from COVID-19 and the use of Fangcang shelter hospitals in Wuhan, China. BMJ Glob. Health 2020, 5, e002815. [Google Scholar] [CrossRef]
  9. Zhao, L.; Li, H.; Sun, Y.; Huang, R.; Hu, Q.; Wang, J.; Gao, F. Planning emergency shelters for urban disaster resilience: An integrated location-allocation modeling approach. Sustainability 2017, 9, 2098. [Google Scholar] [CrossRef]
  10. Wei, Y.; Jin, L.; Xu, M.; Pan, S.; Xu, Y.; Zhang, Y. Instructions for planning emergency shelters and open spaces in China: Lessons from global experiences and expertise. Int. J. Disaster Risk Reduct. 2020, 51, 101813. [Google Scholar] [CrossRef] [PubMed]
  11. Dean, K.; Kyei, D. Understanding associations between disasters and sustainability, resilience, and poverty: An empirical study of the last two decades. Sustainability 2024, 16, 7416. [Google Scholar] [CrossRef]
  12. Liu, X. General description of spatial accessibility. Urban Transp. China 2007, 6, 36–43. [Google Scholar]
  13. Hansen Walter, G. How accessibility shapes land use. J. Am. Inst. Plan. 1959, 25, 73–76. [Google Scholar] [CrossRef]
  14. Ashik, F.R.; Mim, S.A.; Neema, M.N. Towards vertical spatial equity of urban facilities: An integration of spatial and aspatial accessibility. J. Urban Manag. 2020, 9, 77–92. [Google Scholar] [CrossRef]
  15. Zhao, P.; Li, S.; Liu, D. Unequable spatial accessibility to hospitals in developing megacities: New evidence from Beijing. Health Place 2020, 65, 102406. [Google Scholar] [CrossRef] [PubMed]
  16. Zhang, X.; Hua, L.; James, B.H. Modeling spatial accessibility to parks: A national study. Int. J. Health Geogr. 2011, 10, 31. [Google Scholar] [CrossRef]
  17. Gong, S.; Gao, Y.; Zhang, F.; Mu, L.; Kang, C.; Liu, Y. Evaluating healthcare resource inequality in Beijing, China based on an improved spatial accessibility measurement. Trans. GIS 2021, 25, 1504–1521. [Google Scholar] [CrossRef]
  18. Xu, Y.; Zhou, C.; Hu, B. Measuring the accessibility of emergency shelters based on an improved two-step floating catchment area model. Int. J. Digit. Earth 2025, 18, 2479864. [Google Scholar] [CrossRef]
  19. Lam, C.Y.; Cruz, A.M. Topological network and fuzzy AHP modeling framework for the suitability analysis of evacuation shelters: A case study in Japan. Int. J. Disaster Risk Reduct. 2024, 111, 104696. [Google Scholar] [CrossRef]
  20. Zhang, W.; Yun, Y. Multi-scale accessibility performance of shelters types with diversity layout in coastal port cities: A case study in Nagoya City, Japan. Habitat Int. 2019, 83, 55–64. [Google Scholar] [CrossRef]
  21. Su, H.; Chen, W.; Wang, Z. Evaluating the crowdedness of urban emergency shelters based on the improved gravity model. IOP Conf. Ser. Earth Environ. Sci. IOP Publ. 2020, 502, 012046. [Google Scholar] [CrossRef]
  22. Kaplan, N.; Burg, D.; Omer, I. Multiscale accessibility and urban performance. Environ. Plan. B Urban Anal. City Sci. 2021, 49, 687–703. [Google Scholar] [CrossRef]
  23. Chen, X.; Kwan, M.-P.; Li, Q.; Chen, J. A model for evacuation risk assessment with consideration of pre-and post-disaster factors. Comput. Environ. Urban Syst. 2012, 36, 207–217. [Google Scholar] [CrossRef]
  24. Song, Z.; Chen, W.; Zhang, G.; Zhang, L. Spatial accessibility to public service facilities and its measurement approaches. Prog. Geogr. 2010, 29, 1217–1224. [Google Scholar]
  25. Delamater Paul, L. Spatial accessibility in suboptimally configured health care systems: A modified two-step floating catchment area (M2SFCA) metric. Health Place 2013, 24, 30–43. [Google Scholar] [CrossRef]
  26. McGrail Matthew, R.; Humphreys, J.S. Measuring spatial accessibility to primary health care services: Utilising dynamic catchment sizes. Appl. Geogr. 2014, 54, 182–188. [Google Scholar] [CrossRef]
  27. Fransen, K.; Neutens, T.; De Maeyer, P.; Deruyter, G. A commuter-based two-step floating catchment area method for measuring spatial accessibility of daycare centers. Health Place 2015, 32, 65–73. [Google Scholar] [CrossRef]
  28. Bryant, J., Jr.; Delamater, P.L. Examination of spatial accessibility at micro-and macro-levels using the enhanced two-step floating catchment area (E2SFCA) method. Ann. GIS 2019, 25, 219–229. [Google Scholar] [CrossRef]
  29. Li, C.; Wang, J. A hierarchical two-step floating catchment area analysis for high-tier hospital accessibility in an urban agglomeration region. J. Transp. Geogr. 2022, 102, 103369. [Google Scholar] [CrossRef]
  30. Reto, J.; Haldimann, L. MHV3SFCA: A new measure to capture the spatial accessibility of health care systems. Health Place 2023, 79, 102974. [Google Scholar]
  31. Ding, Z.; Dong, H.; Yang, L.; Xue, N.; He, L.; Yao, X. A study on the emergency shelter spatial accessibility based on the adaptive catchment size 2SFCA method. ISPRS Int. J. Geo-Inf. 2022, 11, 593. [Google Scholar] [CrossRef]
  32. Shao, D.; Xiong, W. Does High Spatial Density Imply High Population Density? Spatial Mechanism of Population Density Distribution Based on Population–Space Imbalance. Sustainability 2022, 14, 5776. [Google Scholar] [CrossRef]
  33. Hui, E.C.M.; Li, X.; Chen, T.; Lang, W. Deciphering the spatial structure of China’s megacity region: A new bay area—The Guangdong-Hong Kong-Macao Greater Bay Area in the making. Cities 2020, 105, 102168. [Google Scholar] [CrossRef]
  34. Shao, W.; Su, X.; Lu, J.; Liu, J.; Yang, Z.; Mei, C.; Liu, C.; Lu, J. Urban resilience of Shenzhen city under climate change. Atmosphere 2021, 12, 537. [Google Scholar] [CrossRef]
  35. Friedman, A.; Chaki, B. Form and Function of a Shelter. In Fundamentals of Planning and Designing Sustainable Post-Disaster Shelters; Springer Nature Switzerland: Cham, Switzerland, 2025; pp. 97–113. [Google Scholar]
  36. Spearing, L.A.; Stephens, K.K.; Faust, K.M. Shelter shopping: Where the built environment and social systems meet. Int. J. Disaster Risk Reduct. 2021, 58, 102161. [Google Scholar] [CrossRef]
  37. Beatini, V.; Rajanayagam, H.; Poologanathan, K. Structural and spatial minimal requirement efficacy of emergency shelters for different emergencies. Buildings 2023, 13, 32. [Google Scholar] [CrossRef]
  38. Xu, Y.; Wang, W.; Chen, H.; Qu, M. Multicriteria assessment of the response capability of urban emergency shelters: A case study in Beijing. Nat. Hazards Res. 2024, 4, 324–335. [Google Scholar] [CrossRef]
  39. Nath, R.; Shannon, H.; Kabali, C.; Oremus, M. Investigating the key indicators for evaluating post-disaster shelter. Disasters 2016, 41, 606. [Google Scholar] [CrossRef]
  40. Liu, S.; Wang, Y.; Zhou, D.; Kang, Y. Two-step floating catchment area model-based evaluation of community care facilities’ spatial accessibility in Xi’an, China. Int. J. Environ. Res. Public Health 2020, 17, 5086. [Google Scholar] [CrossRef]
  41. Tao, Z.; Cheng, Y.; Dai, T.; Rosenberg, M.W. Spatial optimization of residential care facility locations in Beijing, China: Maximum equity in accessibility. Int. J. Health Geogr. 2014, 13, 33. [Google Scholar] [CrossRef]
  42. Allan, D.P. Catchments of general practice in different countries—A literature review. Int. J. Health Geogr. 2014, 13, 32. [Google Scholar] [CrossRef]
  43. Chen, X.; Jia, P. A comparative analysis of accessibility measures by the two-step floating catchment area (2SFCA) method. Int. J. Geogr. Inf. Sci. 2019, 33, 1739–1758. [Google Scholar] [CrossRef]
  44. Tang, B.; Li, Z.; Chen, Y. Spatial suitability evaluation and layout optimization of emergency shelter: A case study in Tianhe District of Guangzhou City. Heliyon 2025, 11, e41122. [Google Scholar] [CrossRef] [PubMed]
  45. Mao, K.; Chen, Y.; Wu, G.; Huang, J.; Yang, W.; Xia, Z. Measuring spatial accessibility of urban fire services using historical fire incidents in Nanjing, China. ISPRS Int. J. Geo-Inf. 2020, 9, 585. [Google Scholar] [CrossRef]
  46. Huang, Y.; Yin, Z.; Chu, H. Suitability assessment of emergency shelters based on gis: A case study in urban function optimization area of shanghai. IOP Conf. Ser. Earth Environ. Sci. IOP Publ. 2019, 234, 012039. [Google Scholar] [CrossRef]
  47. Kaili, D.; Zhan, Q.; Li, S. GIS-based responsibility area subdivision for metropolitan emergency shelters—Case study of Wuchang district, Wuhan city. In Proceedings of the 2012 6th International Association for China Planning Conference (IACP), Wuhan, China, 17–19 June 2012; pp. 1–4. [Google Scholar]
  48. Liang, Y.; Xie, Z.; Chen, S.; Xu, Y.; Xin, Z.; Yang, S.; Jian, H.; Wang, Q. Spatial accessibility of urban emergency shelters based on Ga2SFCA and Its improved method: A case study of Kunming, China. J. Urban Plan. Dev. 2023, 149, 05023013. [Google Scholar] [CrossRef]
  49. Sritart, H.; Miyazaki, H.; Kanbara, S.; Hara, T. Methodology and application of spatial vulnerability assessment for evacuation shelters in disaster planning. Sustainability 2020, 12, 7355. [Google Scholar] [CrossRef]
  50. Rong, P.; Zheng, Z.; Kwan, M.-P.; Qin, Y. Evaluation of the spatial equity of medical facilities based on improved potential model and map service API: A case study in Zhengzhou, China. Appl. Geogr. 2020, 119, 102192. [Google Scholar] [CrossRef]
  51. Tang, B.; Wang, D.; Song, Y.; Qiu, J.; Yan, Y.; Zhang, Z. Research on the emergency shelter accessibility in urban communities. Risk Anal. Crisis Response 2017, 7, 230. [Google Scholar] [CrossRef]
  52. Lee, J.K.; Kim, S.H.; Park, S.H.; Kim, Y.O. A Study on the Facility Location Selection for Emergency Shelter-Catchment area and accessibility analysis of vacant space and shelter-in-place. J. Archit. Inst. Korea 2021, 37, 73–78. [Google Scholar]
  53. Yao, Y.; Zhang, Y.; Yao, T.; Wong, K.; Tsou, J.Y.; Zhang, Y. A GIS-based system for spatial-temporal availability evaluation of the open spaces used as emergency shelters: The case of Victoria, British Columbia, Canada. ISPRS Int. J. Geo-Inf. 2021, 10, 63. [Google Scholar] [CrossRef]
  54. Tiznado-Aitken, I.; Muñoz, J.C.; Hurtubia, R. Public transport accessibility accounting for level of service and competition for urban opportunities: An equity analysis for education in Santiago de Chile. J. Transp. Geogr. 2021, 90, 102919. [Google Scholar] [CrossRef]
  55. Wolff, M. Taking one step further–Advancing the measurement of green and blue area accessibility using spatial network analysis. Ecol. Indic. 2021, 126, 107665. [Google Scholar] [CrossRef]
  56. Merlin, L.A.; Singer, M.; Levine, J. Influences on transit ridership and transit accessibility in US urban areas. Transp. Res. Part A Policy Pract. 2021, 150, 63–73. [Google Scholar] [CrossRef]
  57. Nakai, H.; Itatani, T.; Kaganoi, S.; Okamura, A.; Horiike, R.; Yamasaki, M. Needs of children with neurodevelopmental disorders and geographic location of emergency shelters suitable for vulnerable people during a tsunami. Int. J. Environ. Res. Public Health 2021, 18, 1845. [Google Scholar] [CrossRef] [PubMed]
  58. Zhou, A.; Chen, L.; Zhu, H.; Chen, S. Reasonability of spatial distribution for urban emergency shelter in central district of Beijing at community scale. J. Saf. Environ. 2021, 21, 1662–1669. [Google Scholar]
  59. Ghorbanzadeh, M.; Ozguven, E.E.; Tenney, C.S.; Leonarczyk, Z.; Jones, F.R.; Mardis, M.A. Natural Disaster Accessibility of Small and Rural Libraries in Northwest Florida. Public Libr. Q 2020, 40, 310–329. [Google Scholar] [CrossRef]
  60. Su, H.; Chen, W.; Cheng, M. Using the variable two-step floating catchment area method to measure the potential spatial accessibility of urban emergency shelters. Geo J. 2021, 87, 2625–2639. [Google Scholar] [CrossRef]
  61. Tang, S.; Wang, J.; Xu, Y.; Chen, S.; Zhang, J.; Zhao, W.; Wang, G. Evaluation of emergency shelter service functions and optimization suggestions—Case study in the Songyuan City central area. Sustainability 2023, 15, 7283. [Google Scholar] [CrossRef]
  62. Ekaputra, R.A.; Lee, C.; Kee, S.H.; Yee, J.J. Emergency shelter geospatial location optimization for flood disaster condition: A review. Sustainability 2022, 14, 12482. [Google Scholar] [CrossRef]
  63. Yang, J.; Vijayan, L.; Ghorbanzadeh, M.; Alisan, O.; Ozguven, E.E.; Huang, W.; Burns, S. Integrating storm surge modeling and accessibility analysis for planning of special-needs hurricane shelters in Panama City, Florida. Transp. Plan. Technol. 2023, 46, 241–261. [Google Scholar] [CrossRef]
  64. Faruk, M.; Ashraf, S.A.; Ferdaus, M. An analysis of inclusiveness and accessibility of Cyclone Shelters, Bangladesh. Procedia Eng. 2018, 212, 1099–1106. [Google Scholar] [CrossRef]
  65. Zhang, D.; Gu, R.Y.; Huang, T.F.; Zhang, G.; Sun, Z.; Guo, H. Research on Spatial Distribution Pattern of Emergency Shelters in Hebei and Its Influencing Factors. J. Inst. Disaster Prev. 2020, 22, 84–91. (In Chinese) [Google Scholar]
  66. Bauer, J.; Groneberg, D.A. Measuring Spatial Accessibility of Health Care Providers—Introduction of a Variable Distance Decay Function within the Floating Catchment Area (FCA) Method. PLoS ONE 2016, 11, e0159148. [Google Scholar] [CrossRef] [PubMed]
  67. Liu, T.; Deng, Q.; Wang, S.; Wang, G. Equity Evaluation of Multilevel Medical Facility Allocation Based on Ga2SFCA. J. Urban Plan. Dev. 2023, 149, 14. [Google Scholar] [CrossRef]
  68. Bayram, V.; Tansel, B.Ç.; Yaman, H. Compromising system and user interests in shelter location and evacuation planning. Transp. Res. Part B Methodol. 2015, 72, 146–163. [Google Scholar] [CrossRef]
  69. GB/T 51327-2018; Urban Comprehensive Disaster Prevention Planning Standards. Chinese Standard: Beijing, China, 2018.
  70. GB 51143-2015; Code for Design of Disasters Mitigation Emergency Congregate Shelter. Chinese Standard: Beijing, China, 2015.
  71. Zhu, L.; Zhong, S.; Tu, W.; Zheng, J.; He, S.; Bao, J.; Huang, C. Assessing spatial accessibility to medical resources at the community level in Shenzhen, China. Int. J. Environ. Res. Public Health 2019, 16, 242. [Google Scholar] [CrossRef]
  72. Gong, Z.; Wang, L.; Yang, J.; Wang, Y.; Zhang, L. Urban Flood Risk Assessment and Optimization of Shelter Site Selection Following a Pre-Expropriation System. Nat. Hazards Rev. 2025, 26, 04025013. [Google Scholar] [CrossRef]
  73. Freer, E. Are resources out of reach? Analyzing the accessibility of domestic violence shelter services. Soc. Sci. Q. 2022, 103, 550–564. [Google Scholar] [CrossRef]
  74. Yang, J.; Alisan, O.; Vijayan, L.; Huang, W.; Ozguven, E.E. Critical Shelter Analysis Considering Social Vulnerability and Accessibility: A Case Study of Hurricane Michael Track Uncertainty. Appl. Spat. Anal. Policy 2025, 18, 30. [Google Scholar] [CrossRef]
  75. Liu, X.; Zhang, L.; Zhen, J.; Wang, W. Planning for service space of medium-and long-term shelters based on multi-agent evacuation simulation. Nat. Hazards 2024, 120, 12769–12796. [Google Scholar] [CrossRef]
  76. Wang, X.; Guan, M.; Dong, C.; Wang, J.; Fan, Y.; Xin, F.; Lian, G. A multi-indicator evaluation method for spatial distribution of urban emergency shelters. Remote Sens. 2022, 14, 4649. [Google Scholar] [CrossRef]
  77. Chelariu, O.E.; Iațu, C.; Minea, I. A GIS-based model for flood shelter locations and pedestrian evacuation scenarios in a rural mountain catchment in Romania. Water 2022, 14, 3074. [Google Scholar] [CrossRef]
Figure 1. Research framework for emergency shelter accessibility using the Gaussian-based 2SFCA method.
Sustainability 17 05250 g001
Figure 2. Gaussian-based 2SFCA method searching process.
Sustainability 17 05250 g002
Figure 3. Distribution of emergency shelters and the population in Shenzhen.
Sustainability 17 05250 g003
Figure 4. (a) Richness of service facilities in Shenzhen. (b) Road network density.
Sustainability 17 05250 g004
Figure 5. Service area map of emergency shelters in Shenzhen at 1000 m, 2500 m, and 5000 m radii.
Sustainability 17 05250 g005
Figure 6. Emergency shelter accessibility based on the Gaussian-based 2SFCA method (1000 m).
Sustainability 17 05250 g006
Figure 7. Emergency shelter accessibility using the Gaussian-based 2SFCA method (2500 m).
Sustainability 17 05250 g007
Figure 8. Emergency shelter accessibility using the Gaussian-based 2SFCA method (5000 m).
Sustainability 17 05250 g008
Figure 9. K-means clustering distribution of emergency shelter accessibility and service capacity (1000 m).
Sustainability 17 05250 g009
Figure 10. K-means clustering distribution of emergency shelter accessibility and service capacity (2500 m).
Sustainability 17 05250 g010
Figure 11. K-means clustering distribution of emergency shelter accessibility and service capacity (5000 m).
Sustainability 17 05250 g011
Table 1. Classification criteria for emergency shelters.
Key IndicatorsEmergency SheltersShort-Term SheltersLong-Term Shelters
Evacuation DurationWithin 1 day2–14 days15 days or more, generally not exceeding 180 days
Service Radius1 km, 10 min~15 min walkWithin 2.5 km, about 30–40 min walk70–90 min walk within 5 km
If emergency shelter needs exceed 50,000 in the service radius, add long-term shelters as conditions permit
Facilities, Equipment, and SuppliesEquipped with emergency facilities, equipment, and supplies necessary for emergency assembly, material storage, sanitation and washing, waste storage and transport, emergency parkingAugment existing emergency shelter resources to support accommodation, command offices, medical care, quarantine, catering, sewage management, and security functions. Based on the provision of emergency facilities and supplies in short-term shelters, it is essential to enhance the allocation of additional emergency facilities and resources that meet the functional requirements for cultural activities, temporary education, public services, and helicopter takeoff and landing.
Evacuation DurationWithin 1 day2–14 days15 days or more, generally not exceeding 180 days
Table 2. K-means clustering centers for emergency shelter accessibility and service capacity (1000 m).
TypeDemandSupplyAccessibility
Population DensityRoad Network DensityService Availability
10.0213510.0747050.0075420.028291
LowLowHigh
20.2911680.4912290.1658430.017046
High HighLow
30.1067690.255650.0196060.025775
MediumMediumMedium
Table 3. K-means clustering centers for emergency shelter accessibility and service capacity (2500 m).
TypeDemandSupplyAccessibility
Population DensityRoad Network DensityService Availability
10.0347480.1068380.0081050.077474
MediumLowLow
20.1885910.3594380.0694490.084127
HighHighMedium
30.0150360.113370.0145480.561101
LowMediumHigh
Table 4. K-means clustering centers for emergency shelter accessibility and service capacity (5000 m).
TypeDemandSupplyAccessibility
Population DensityRoad Network DensityService Availability
10.0386310.1136470.0076250.147429
MediumLowMedium
20.0204040.104950.0162370.542364
LowLowHigh
30.1976940.3696430.0740.137686
HighHighLow
Disclaimer/Publisher’s Note: The statements, opinions and data contained in all publications are solely those of the individual author(s) and contributor(s) and not of MDPI and/or the editor(s). MDPI and/or the editor(s) disclaim responsibility for any injury to people or property resulting from any ideas, methods, instructions or products referred to in the content.

