Article

Forecasting Air Pollutant Emissions Using Deep Sparse Transformer Networks: A Case Study of the Ekibastuz Coal-Fired Power Plant

by
Yurii Andrashko
1,
Oleksandr Kuchanskyi
2,3,4,
Andrii Biloshchytskyi
5,6,*,
Alexandr Neftissov
7 and
Svitlana Biloshchytska
2,6,*
1
Department of System Analysis and Optimization Theory, Uzhhorod National University, 88000 Uzhhorod, Ukraine
2
Department of Computational and Data Science, Astana IT University, Astana 010000, Kazakhstan
3
Department of Information Control Systems and Technologies, Uzhhorod National University, 88000 Uzhhorod, Ukraine
4
Department of Biomedical Cybernetics, National Technical University of Ukraine “Igor Sikorsky Kyiv Polytechnic Institute”, 03056 Kyiv, Ukraine
5
Department of Administration, Astana IT University, Astana 010000, Kazakhstan
6
Department of Information Technology, Kyiv National University of Construction and Architecture, 03037 Kyiv, Ukraine
7
Research and Innovation Center “Industry 4.0”, Astana IT University, Astana 010000, Kazakhstan
*
Authors to whom correspondence should be addressed.
Sustainability 2025, 17(11), 5115; https://doi.org/10.3390/su17115115
Submission received: 2 May 2025 / Revised: 24 May 2025 / Accepted: 26 May 2025 / Published: 3 June 2025

Abstract

:
It is important to predict air pollutant emissions from coal-fired power plants using real-time technological parameters to improve environmental efficiency. Since the relationship between emissions and parameters is nonlinear, machine learning models are needed to forecast emissions under various boiler operating modes. This study develops and tests Deep Sparse Transformer Networks for predicting pollutant time series, accounting for long-term dependencies. Data were collected from a 4000 MW coal-fired power plant in Ekibastuz, Kazakhstan, covering 67,527 records for 14 indicators at 10 min intervals. Fractal R/S analysis confirmed long-term memory in SO2, PM2.5, and NOx series, guiding window length selection. The results show that the model achieves slightly better accuracy for SO2 (R2 0.95–0.38), while NOx and PM2.5 have similar dynamics (R2 0.93–0.26). However, accuracy drops notably after 12 points, making the model best suited for short-term forecasts. These findings support environmental monitoring services and help optimize plant parameters, contributing to lower emissions and advancing carbon neutrality goals.

1. Introduction

In 2023, global energy-related greenhouse gas emissions exceeded 40 gigatons for the first time in history. This is due to a significant increase in global primary energy consumption. Coal production and use is the basis for ensuring this growth and maintaining the energy balance. Moreover, in Europe and the US, coal production and consumption are falling. In the Asia–Pacific region, on the contrary, coal consumption is growing. According to [1], in 2023, global coal production reached its highest level (179 EJ). An important aspect is that coal is often of poor quality and is burned on outdated equipment, which significantly pollutes the environment [2]. According to a study [3], coal combustion emits the highest rates of particulate matter PM10 and PM2.5 and SO2, CO2, and NOx, as well as carcinogenic metal pollutants. If a coal-fired power plant is located close to populated areas, its operation can result in significant health problems for the local population. The main diseases are respiratory diseases (bronchial asthma, chronic bronchitis) [4,5], cardiovascular diseases [6,7], and neurological and oncological diseases. This leads to significant expenditures by local authorities on public healthcare. At the same time, coal-fired power generation is still the main contributor to air pollution worldwide.
In recent years, governments and the international community have paid considerable attention to improving the population’s quality of life and reducing the level of diseases associated with coal production and consumption. In large cities, real-time air quality monitoring stations are being set up using the Internet of Things (IoT) [8,9]. This system consists of sensors that transmit information about air quality via the Internet. This makes it possible to monitor the pollution level at any given time and respond promptly to possible deviations. It is especially important to install such systems near industrial facilities and coal-fired power plants. IoT sensors measure the concentration of particulate matter (PM10, PM2.5), sulphur and nitrogen oxides (SO2, NOx), carbon dioxide (CO2), and other important indicators, including temperature, humidity, etc. These data are transmitted via Wi-Fi, mobile networks, or LoRa WAN to a server or cloud platform. The data are analyzed and visualized in the form of graphs and maps. Based on the results of the analysis, the monitoring system can send notifications about the state of the air so that the environmental service and government agencies can make decisions related to environmental safety and reducing risks to public health. Thus, the study’s results correspond to sustainable development strategies in terms of ensuring the health and quality of life of the population.
An important aspect of ensuring high-quality environmental monitoring is accurately forecasting changes in air pollution indicators. Traditional forecasting methods cannot effectively model the complex nonlinear process of generating a time series of air pollution indicators. Therefore, modern approaches that use a sufficient amount of retrospective data should be used to improve forecast accuracy. In this case, forecasting accuracy is related to environmental safety and the daily impact on the quality of life and human health. That is why the problem of forecasting such time series can be solved using a deep learning model based on transformer networks. In addition, the complexity of the input data, the presence of outliers, and outliers should be analyzed separately at the stage of pre-prediction analysis. Also, at this stage, a comprehensive analysis should be carried out to identify long-term dependencies in the time series.

2. Literature Review

As mentioned above, the operation of coal-fired power plants can significantly affect the quality of life and health of the population living near coal mining and consumption facilities [4,7]. An environmental monitoring system is used to monitor, collect, and analyze environmental indicators that arise during the operation of a coal-fired power plant. The purpose of the system is to identify and prevent the harmful effects of pollutant emissions on the environment. It also aims to control compliance with environmental standards and regulations. Environmental monitoring at coal-fired power plants includes the control of air pollutant emissions, control of water quality used by coal-fired power plants, monitoring of soils and waste heaps, etc. The objective of monitoring is to prevent environmental accidents and preserve resources for future plant upgrades, as well as to control compliance with environmental legislation.
Environmental monitoring is an important tool for industrial management. The use of approaches to managing the operation of coal-fired power plants allows for operational and strategic decisions to be made on the modernization of filter systems and the introduction of energy-efficient technologies. In addition, the use of industrial management and new monitoring approaches for coal-fired power plants helps improve the enterprise’s environmental reputation and facilitates the transition to sustainable production.
The implementation of environmental control as part of industrial management systems is an urgent problem for Kazakhstan. This is especially true for coal-fired power plants. As you know, Kazakhstan is among the ten countries with the largest coal reserves in the world, estimated at 33.6 billion tonnes of reserves in about 400 deposits. Coal is actively consumed by coal-fired power plants, whose operation is critical to maintaining the energy balance of the country and other Central Asian countries. At the same time, if Kazakhstan does not follow the priorities of the EU’s Carbon Border Adjustment Mechanism [10], this may significantly affect the country’s export revenues [11]. The Republic of Kazakhstan’s achievement of carbon neutrality by 2060 is a strategic goal of the state. This implies a significant reduction in greenhouse gas emissions, primarily carbon dioxide. However, in order to effectively reduce emissions, it is first necessary to learn how to measure and control them accurately. Without reliable data on the volume and composition of emissions, it is impossible to build either a monitoring system or an emission management policy.
Significant emissions from coal-fired power plants have a negative impact on the health of the local population. Papers [12,13,14] analyze the causes of the increased prevalence of chronic obstructive pulmonary disease and bronchial asthma in Kazakhstan. Paper [15] analyzes air quality and industrial emissions in the cities of Kazakhstan. Moreover, the situation with air pollution is particularly negative in industrial areas of Kazakhstan, particularly in the Karaganda and Pavlodar regions. According to a study [16], Kazakhstan ranked 71st among 138 countries in terms of pollution in 2024. Moreover, the level of pollution has been decreasing in recent years. The reduction in pollution is a result of the use of pollutant emission monitoring systems at industrial enterprises and coal mining and consumption facilities.
Part of air monitoring systems is the implementation of methods for analyzing the time series of pollution indicators for forecasting and studying the structure of such time series. Traditional statistical methods can be used for environmental monitoring and forecasting tasks. Such methods include the autoregressive moving average (ARMA), autoregressive integrated moving average (ARIMA) [17,18], etc. However, time series of air pollution indicators have a nonlinear structure and are difficult to predict using traditional approaches. Another direction is the use of machine learning methods that allow for nonlinearity. Examples of such methods include the support vector method (SVR) [19], neural networks [20], XGBoost [21], etc.
Using neural networks with different architectures is promising for implementation in environmental monitoring systems. The known architectures of neural networks for time series forecasting have certain disadvantages. A CNN does not allow for effective training when predicting nonlinear relationships of air pollution data. An RNN and LSTM have the problem of gradient vanishing and exploding. To solve these problems, we developed the transformer method, which has been used for machine translation [22], image classification [23], speech recognition [24], etc. The peculiarity of using neural networks based on transformers is that the model allows the modelling of long-term dependencies in time series. In [25], a deep learning model using transformer networks was proposed. The model was analyzed on the time series of PM2.5 concentrations in the air in Beijing and Taizhou. In [26], a transformer-based method for predicting hourly PM2.5 concentrations recorded at 12 stations in Beijing was described. To compare the developed model, the convolutional neural network long-short term memory–attention model was implemented. It was concluded that the developed model allows us to overcome the problems of the interdependence of influence factors in long sequences. This allows the model to be used for the long-term forecasting of time series of air pollution indicators. Paper [27] proposes a deep learning model for temporal difference-based graph transformer networks (TDGTNs). The model allows for analyzing complex relationships and long-term dependencies in the time series of air pollution, particularly the concentration of PM2.5 in the air. The model was verified using real data recorded in China. However, an important component of ensuring high forecasting accuracy is to study the structure of the time series before starting the forecast. That is, before applying the model, it is necessary to analyze the structure of the time series and the availability of long-term memory.
Since contamination propagates nonlinearly, the confirmation of the adequacy of using transformer-based neural network models for forecasting such time series should be based on methods that establish the presence of long-term memory in the structure of such time series. This can be realized based on predictive fractal analysis using the R/S analysis method [28], detrended fluctuation analysis (DFA) [29,30], and multifractal detrended fluctuation analysis (MF-DFA) [30]. In particular, in [31], the MF-DFA method was built, and the multifractal structure of air pollution time series in Zhengzhou (China) was revealed. In [32], the long-term memory in the time series of air pollutant concentrations (PM10, PM2.5) from four stations in the city of Astana (Kazakhstan) was studied using the R/S analysis method. It was found that the reason for the sharp increase in the concentration of pollutants in the air is the proximity of the coal-fired power plant to the city. For the most part, such time series have a long-term memory. That is, such series can be predicted using a neural network model with appropriate architecture.
Thus, this study aimed is to build and verify Deep Sparse Transformer Networks for forecasting the time series of air pollution indicators, considering the presence of long-term dependencies in the structure of such time series. The basis of the forecasting model is the process parameters that must be adjusted in real time. Thus, it is necessary to develop mathematical models at the stage of regime adjustment to predict the level of emissions under different boiler operating conditions. This will allow not only the timely detection of deviations but also the optimization of combustion processes to minimize emissions. The verification carried out using real data on the level of air pollution in the Ekibastuz coal-mining centre, which houses one of the largest coal-fired power plants in Kazakhstan and the world. The following tasks were set to achieve this goal:
  • To investigate the presence of long-term memory in the structure of the time series of air pollution indicators based on the fractal analysis method.
  • To implement and verify Deep Sparse Transformer Networks, as well as to evaluate the accuracy on a real dataset.

3. Materials and Methods

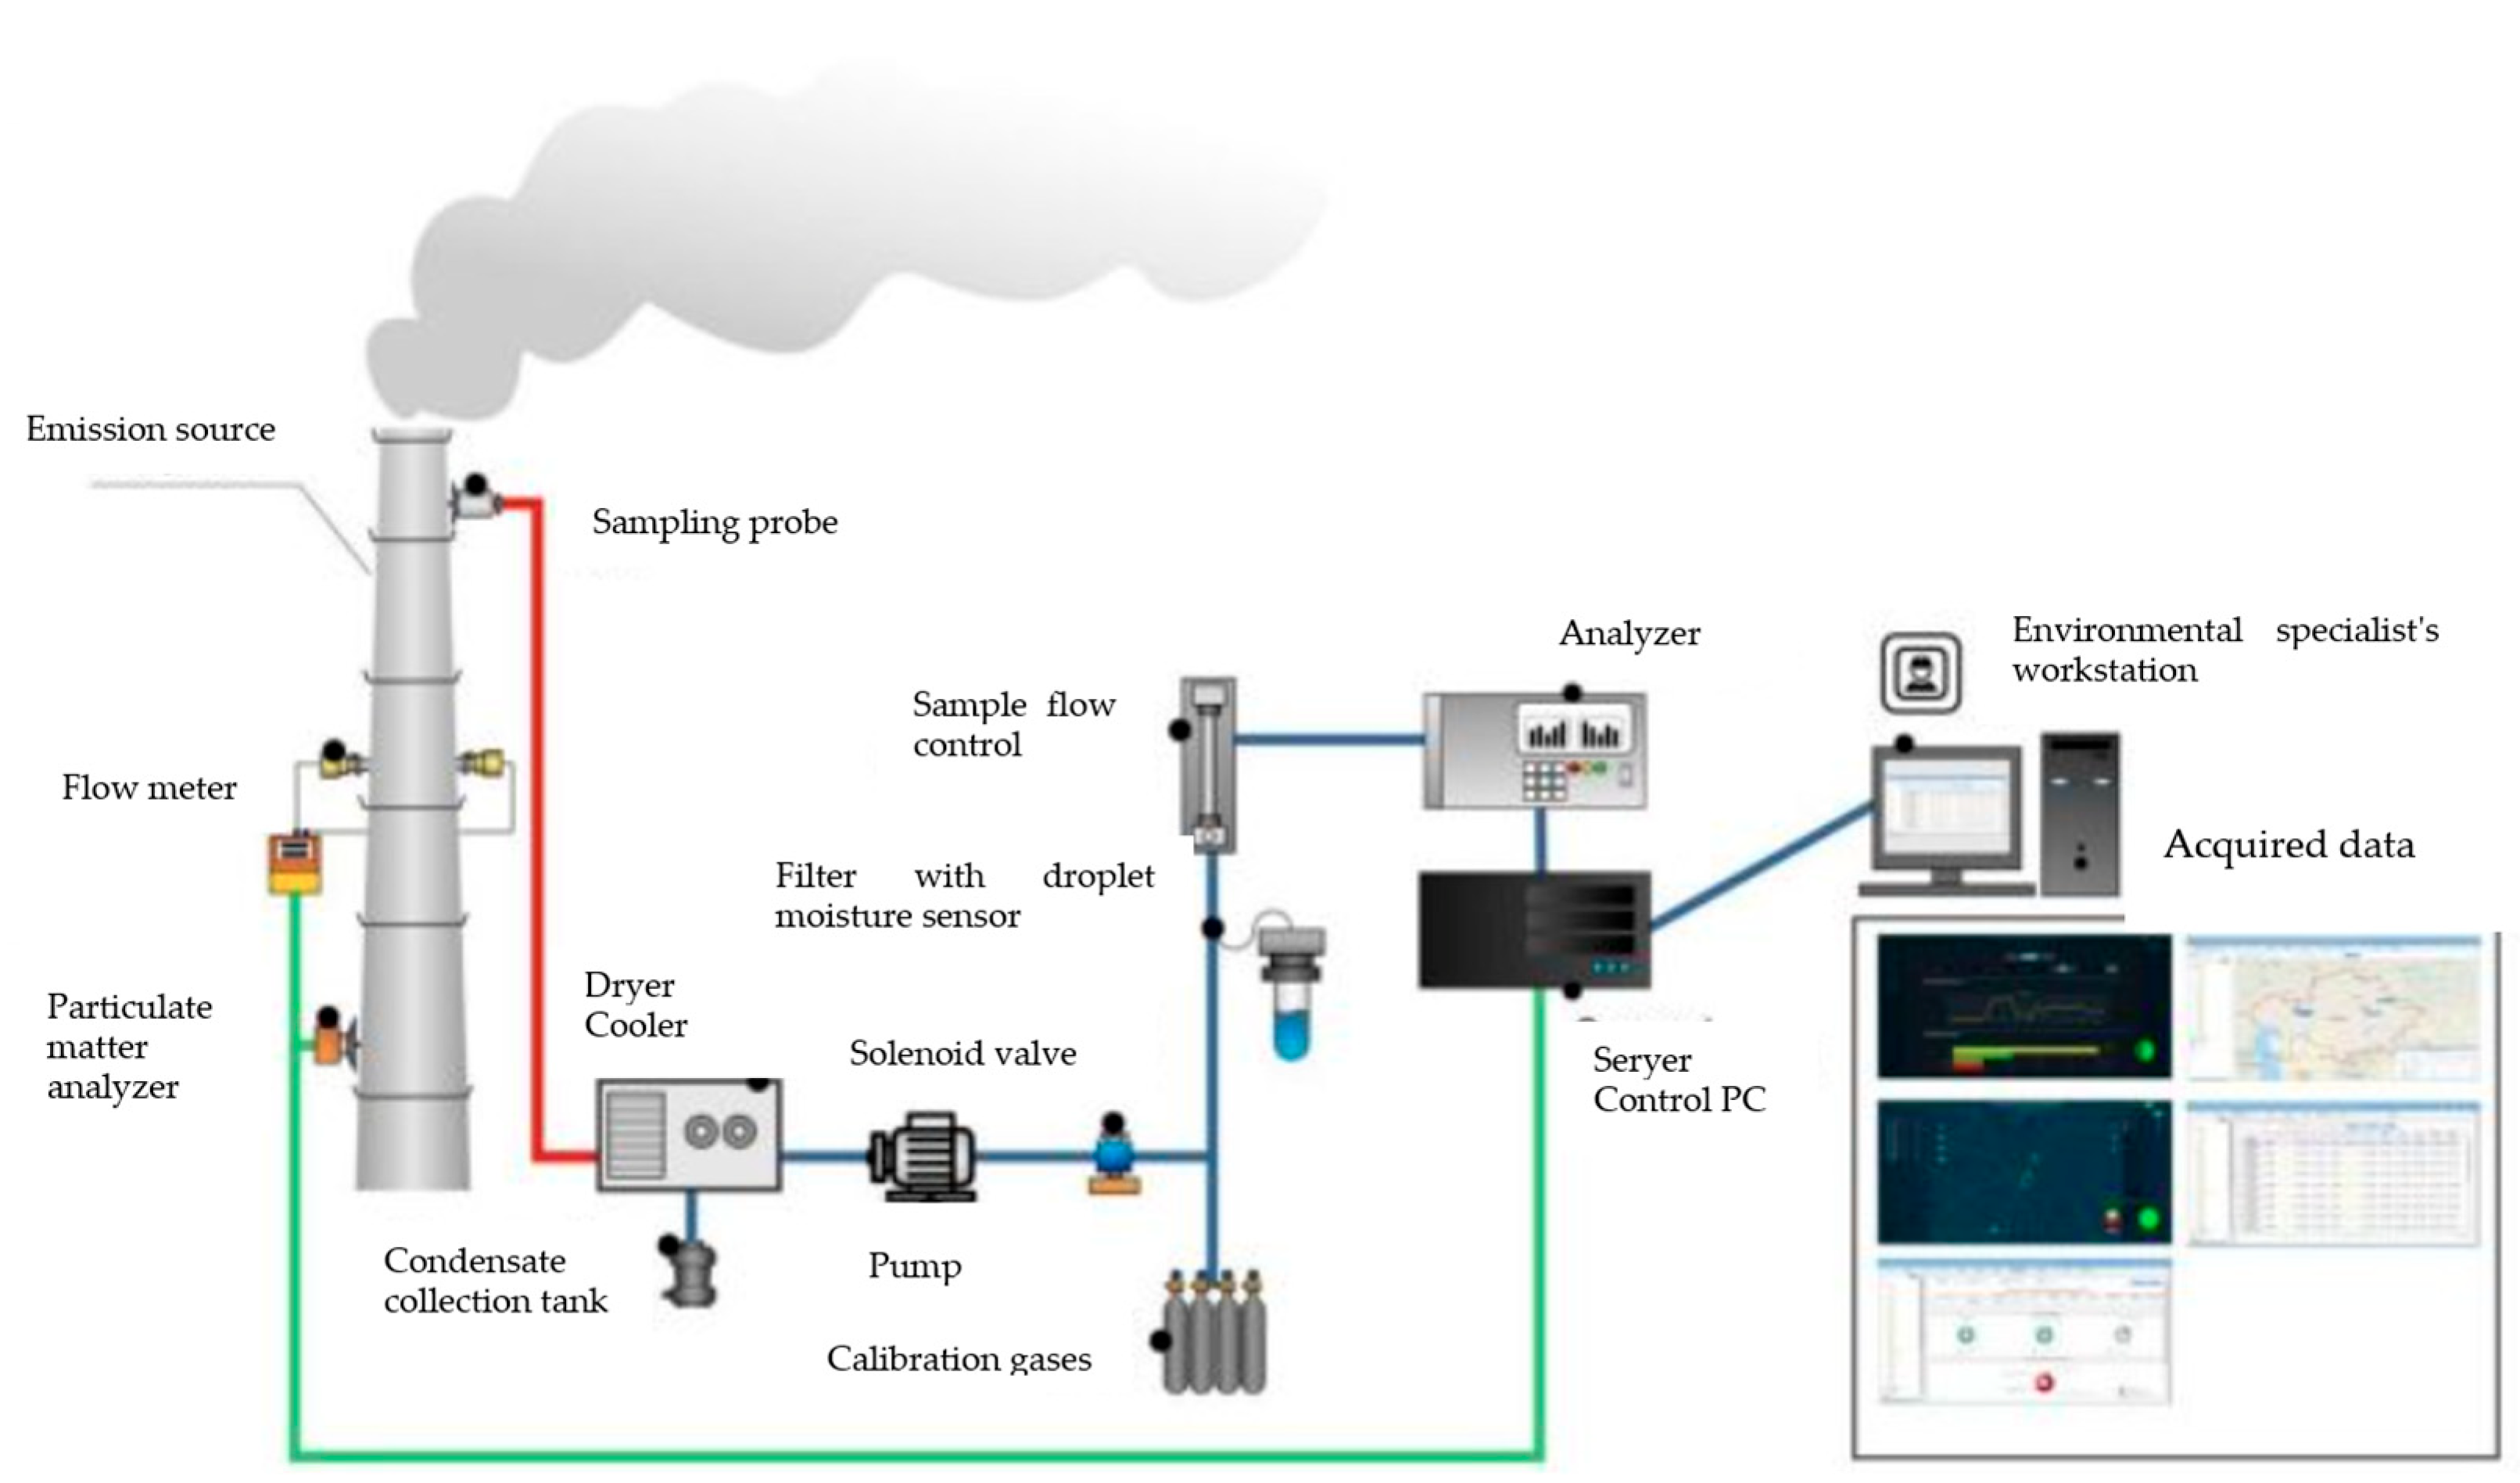
3.1. Area of Study and Collection of Data

The Ekibastuz coal-fired power plant was chosen for this study. The plant is located in the Pavlodar region in the northeast of the Republic of Kazakhstan and is one of the largest power-generating plants in Kazakhstan and the world, with a capacity of up to 4000 MW. The plant uses low-grade coal, which is mined in the area via open-pit mining. Electricity from this power plant satisfies the domestic market and is exported to neighbouring countries, thus being at the heart of the region’s energy security. However, the operation of the plant leads to significant man-made pollution, which affects Ekibastuz, with a population of more than 150,000 people, and the Pavlodar region, with a population of more than 750,000 people [33]. The location of the Ekibastuz coal-fired power plant near large, populated areas and its place in ensuring energy security determines the need for the detailed monitoring of emissions from this plant.
Emission data from the Ekibastuz coal-fired power plant were recorded using industrial sensors that were installed directly at the stationary emission facility. Dust metres were installed to record the transparency of the smoke stream. To measure sulphur and nitrogen, cells were used, which were installed on gas analyzers near the source of emissions. Gas was sampled from the stack, dried/cooled, and prepared for analysis in a gas generator. After analysis, information on the composition of elements in the gas was obtained and stored. Thus, information on the emissions of substances was collected: CO, NO, NO2, SO2, DUST, NOx. A detailed scheme of the indicator selection and monitoring system is shown in Figure 1. The described system is part of the industrial management of Ekibastuz coal-fired power plant. Coordinated management allows for detecting changes in the emissions of pollutants that deviate from the norm and responding promptly. In addition, an important task is to forecast emissions, considering the technical and technological parameters of the plant. These parameters are adjusted in real time. Therefore, at the stage of the regime adjustment of technological parameters, it is necessary to use mathematical forecasting models that allow for predicting the level of emissions in different modes of plant operation. This will make it possible to optimize combustion processes to minimize air pollutant emissions.
Emissions directly depend on the process parameters of the boiler. These parameters, in turn, are determined during the so-called commissioning process, which is carried out after the boiler is out of service. During this process, a mode map is generated, which is a document containing key parameters of the equipment, such as the furnace vacuum, oxygen content, velocity of the dust–air mixture, combustion temperature, and others.
The emissions of various pollutants emitted by coal-fired power plants were analyzed. The most observed emissions are sulphur dioxide (SO2), nitrogen oxides (NOx), particulate matter, and dust. The emission of these pollutions is closely related to the technological parameters of the plant, such as combustion temperature, oxygen content in the furnace, rarefaction, fuel feed rate, air distribution, and fuel composition. Therefore, these emission parameters were taken as the basis for a more detailed study. SO2 emissions depend on the sulphur content of coal. If the temperature in the boiler is too low, some of the sulphur may not be burned. At the same time, a temperature that is too high leads to an increase in the emission of sulphur dioxide emissions into the air. The dependence on the technical and technological parameters of a coal-fired power plant is close to linear.
The emission of NOx also depends on the time the fuel stays in the high-temperature zone, air distribution, and combustion characteristics. In this case, the dependence has a pronounced nonlinear character, since even slightly exceeding the temperature threshold can dramatically increase the level of NOx. Controlling this process requires precise adjustment of the air supply and temperature regime.
Dust emissions depend on the quality of fuel combustion, the efficiency of the collection systems, and the supply of fuel and air. In this case, the dependence is also nonlinear, since under certain combinations of temperature and oxygen deficiency, emissions can increase exponentially. Due to the high complexity and nonlinearity of combustion processes and the formation of air pollutant emissions, traditional methods of mathematical modelling are often not accurate enough. In such cases, machine learning methods, in particular neural networks, come to the fore. SO2, NOx, and PM2.5 emission indicators were selected as priorities for analysis due to their high toxicity and high frequency of follow-up in the dataset. In addition, these emissions are the main markers of air pollution from coal burning, according to the WHO and the European Environment Protection Agency. Other air pollution emissions were also analyzed during the study. However, there were no significant discrepancies with the presented results regarding the values of the Hurst exponent and the accuracy of the DSTN model.
To achieve the research objective, data on the operation of the Ekibastuz coal-fired power plant were collected from 1 March 2023 to 31 December 2024. In total, 67,527 values of air pollution indicators were analyzed during the period under review. The dataset of indicators is available in the Supplementary Materials.
The dataset was analyzed for omissions, and it was found that it contains a small number of omissions from 2 to 4, but these omissions have a long length (from 124 to 1560 points). This makes applying the interpolation method to fill in the omissions and implement the DSTN model and the R/S analysis method difficult. If the input dataset contains gaps of a short length, this means that filling in the gaps is possible using special interpolation methods. Therefore, in our case, it was decided to exclude from consideration parts of the time series containing gaps with a long length. Using the R/s analysis method and the DSTN model for time series with available gaps of this length makes no sense. As part of the study, statistical emissions in the sample were analyzed. For this purpose, the method of three times the standard deviation (3σ) from the mean value was used, which is one of the classical approaches to detecting anomalous values. As a result, 158 emissions of SO2 indicators, 346 emissions of NOx indicators, and no emissions for PM2.5 indicators were identified. This is 0.254% of the total data volume. At the same time, none of the detected values exceeds the threshold value of five standard deviations (5σ), which indicates the absence of extreme anomalies. Given the low proportion of emissions and their limited distance from the average, it was decided not to remove these observations from further analysis, since their impact on the overall data structure is insignificant.

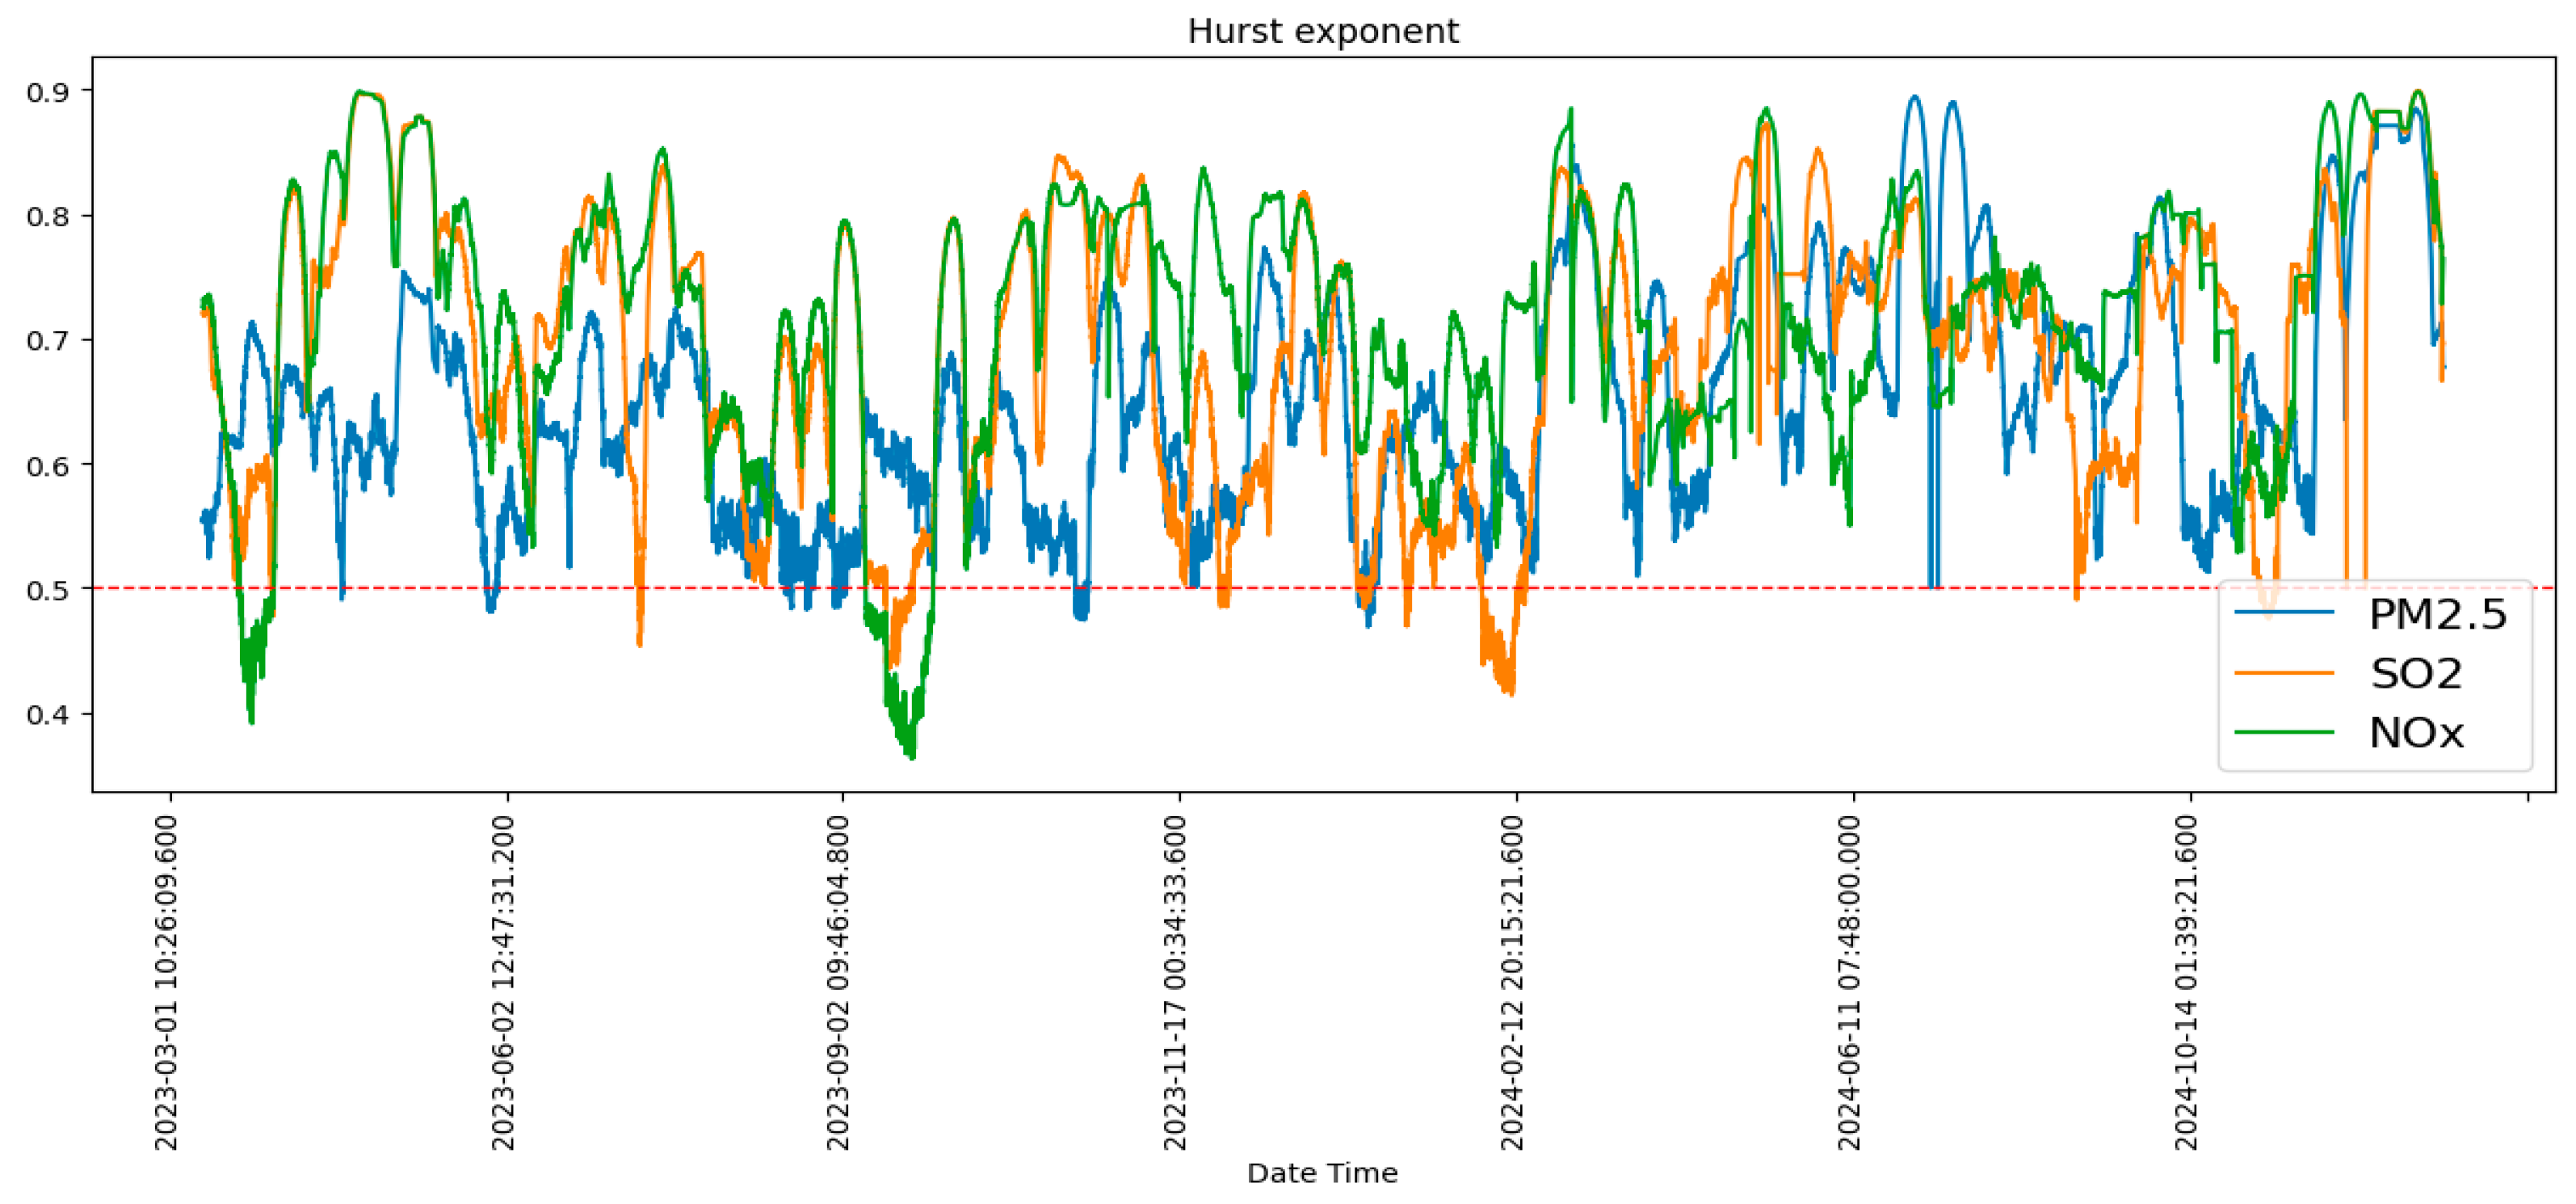
3.2. Investigation of the Presence of Long-Term Dependencies in the Structure of the Time Series of Air Pollution Indicators Based on the Fractal Analysis Method

At the first stage of this study, it is necessary to investigate the structure of the time series, particularly to establish the presence of long-term dependencies in the structure of the time series. The presence of long-term memory in time series can be determined based on fractal analysis. This pre-prognostic analysis is important for tuning the parameters of predictive models. It has also been shown in [32,34] that the results of the analysis, particularly the change in the values of the Hurst index in the dynamics, can be an effective tool for monitoring air quality and water pollution. To monitor the time series of pollutant emissions in the air and discharges of waste mine water from mining facilities, fractal analysis is an important component of ensuring effective industrial management.
Traditionally, detrended fluctuation analysis and R/S analysis are used for fractal analysis of time series. It is shown in [35] that detrended fluctuation analysis is more difficult to implement, and due to the accumulation of calculation errors, it is unsuitable and cannot be considered a good method for the predictive analysis of time series. Therefore, when there is sufficient time series available for analysis, the traditional R/S analysis is sufficient to determine the level of persistence, randomness, or anti-persistence of the time series. Such an estimate, which allows us to reliably determine the presence of long-term memory in the structure of time series, is the Hurst exponent.
Let Q = q t 1 , q t 2 , , q t n be a discrete time series of air pollution indicators. The values of the time series are recorded at regular intervals t 1 , t 2 , , t n [26,35]. Let us build a family of time series Q i = q t 1 , q t 2 , q t i , i = 3 , n ¯ , for each of which we calculate the arithmetic mean Q ¯ i and the deviation from the arithmetic mean ρ i , s using the following formulas:
Q ¯ i = 1 i j = 1 i q t j ,   i = 3 , n ¯
ρ i , s = j = 1 s q t j Q ¯ i ,   i = 3 , n ¯ ,   s = 3 , n ¯ .
The calculation of the indicators is carried out considering the empirical conditions presented in [35]. In particular, the minimum length of the time series Q i should be three. After that, we calculate the range and standard deviation for the input time series Q , and find their ratio Δ h using the following formula:
Δ i = max s = 1 , i ¯ ρ i , s min s = 1 , i ¯ ρ i , s 1 i j = 1 s q t j Q ¯ i 2 .
H is defined as the coefficient on the independent variable for the lg Δ i = H lg i + lg δ equation based on the least squares method. It is also possible to construct a family of time series using the fixed time window method and calculate the Hurst H for each time series using the R/S analysis method. As a result, you can obtain a time series of Hurst’s indicators and study how this indicator changes in dynamics. This allows you to track the moments when the structure of the time series shows an increased influence of random factors. This is especially important for time series of downwind pollution and building appropriate air quality monitoring systems. This is especially important in urban agglomerations where exceeding air pollutant standards can be harmful to the health of the local population. Such control is also necessary for effective industrial management at plants and facilities for the extraction and processing of minerals.
The interpretation of the results of the predictive fractal analysis for time series of air pollution indicators can be as follows [26]:
  • If T Q < H 1 , T Q = 2 π i 1 k = 1 i 1 i k k , i = 3 , n ¯ , then this indicates the presence of long-term memory in the structure of time series Q. That is, the time series is persistent, and the current trend of the time series is likely to continue in the future. The estimate of T Q depends on the length of the time series and is described in [36]. Such time series can be effectively forecasted based on both traditional forecasting models and machine learning models.
  • If 0.5 H T Q , then time series Q is random. This means that pollutant emissions are not stable, which does not allow for an accurate forecast. It may also indicate an accident at the facility where the time series values were recorded.
  • If 0 H < 0.5 , then time series Q is anti-persistent. This is a time series that changes faster than a random series. The interpretation for the time series of air pollution indicators is similar to that in the previous paragraph.
The obtained results of the predictive fractal analysis are the basis for the effective application of forecasting models based on machine learning. Also, the results are important for building air monitoring systems as part of industrial management or Smart City systems.

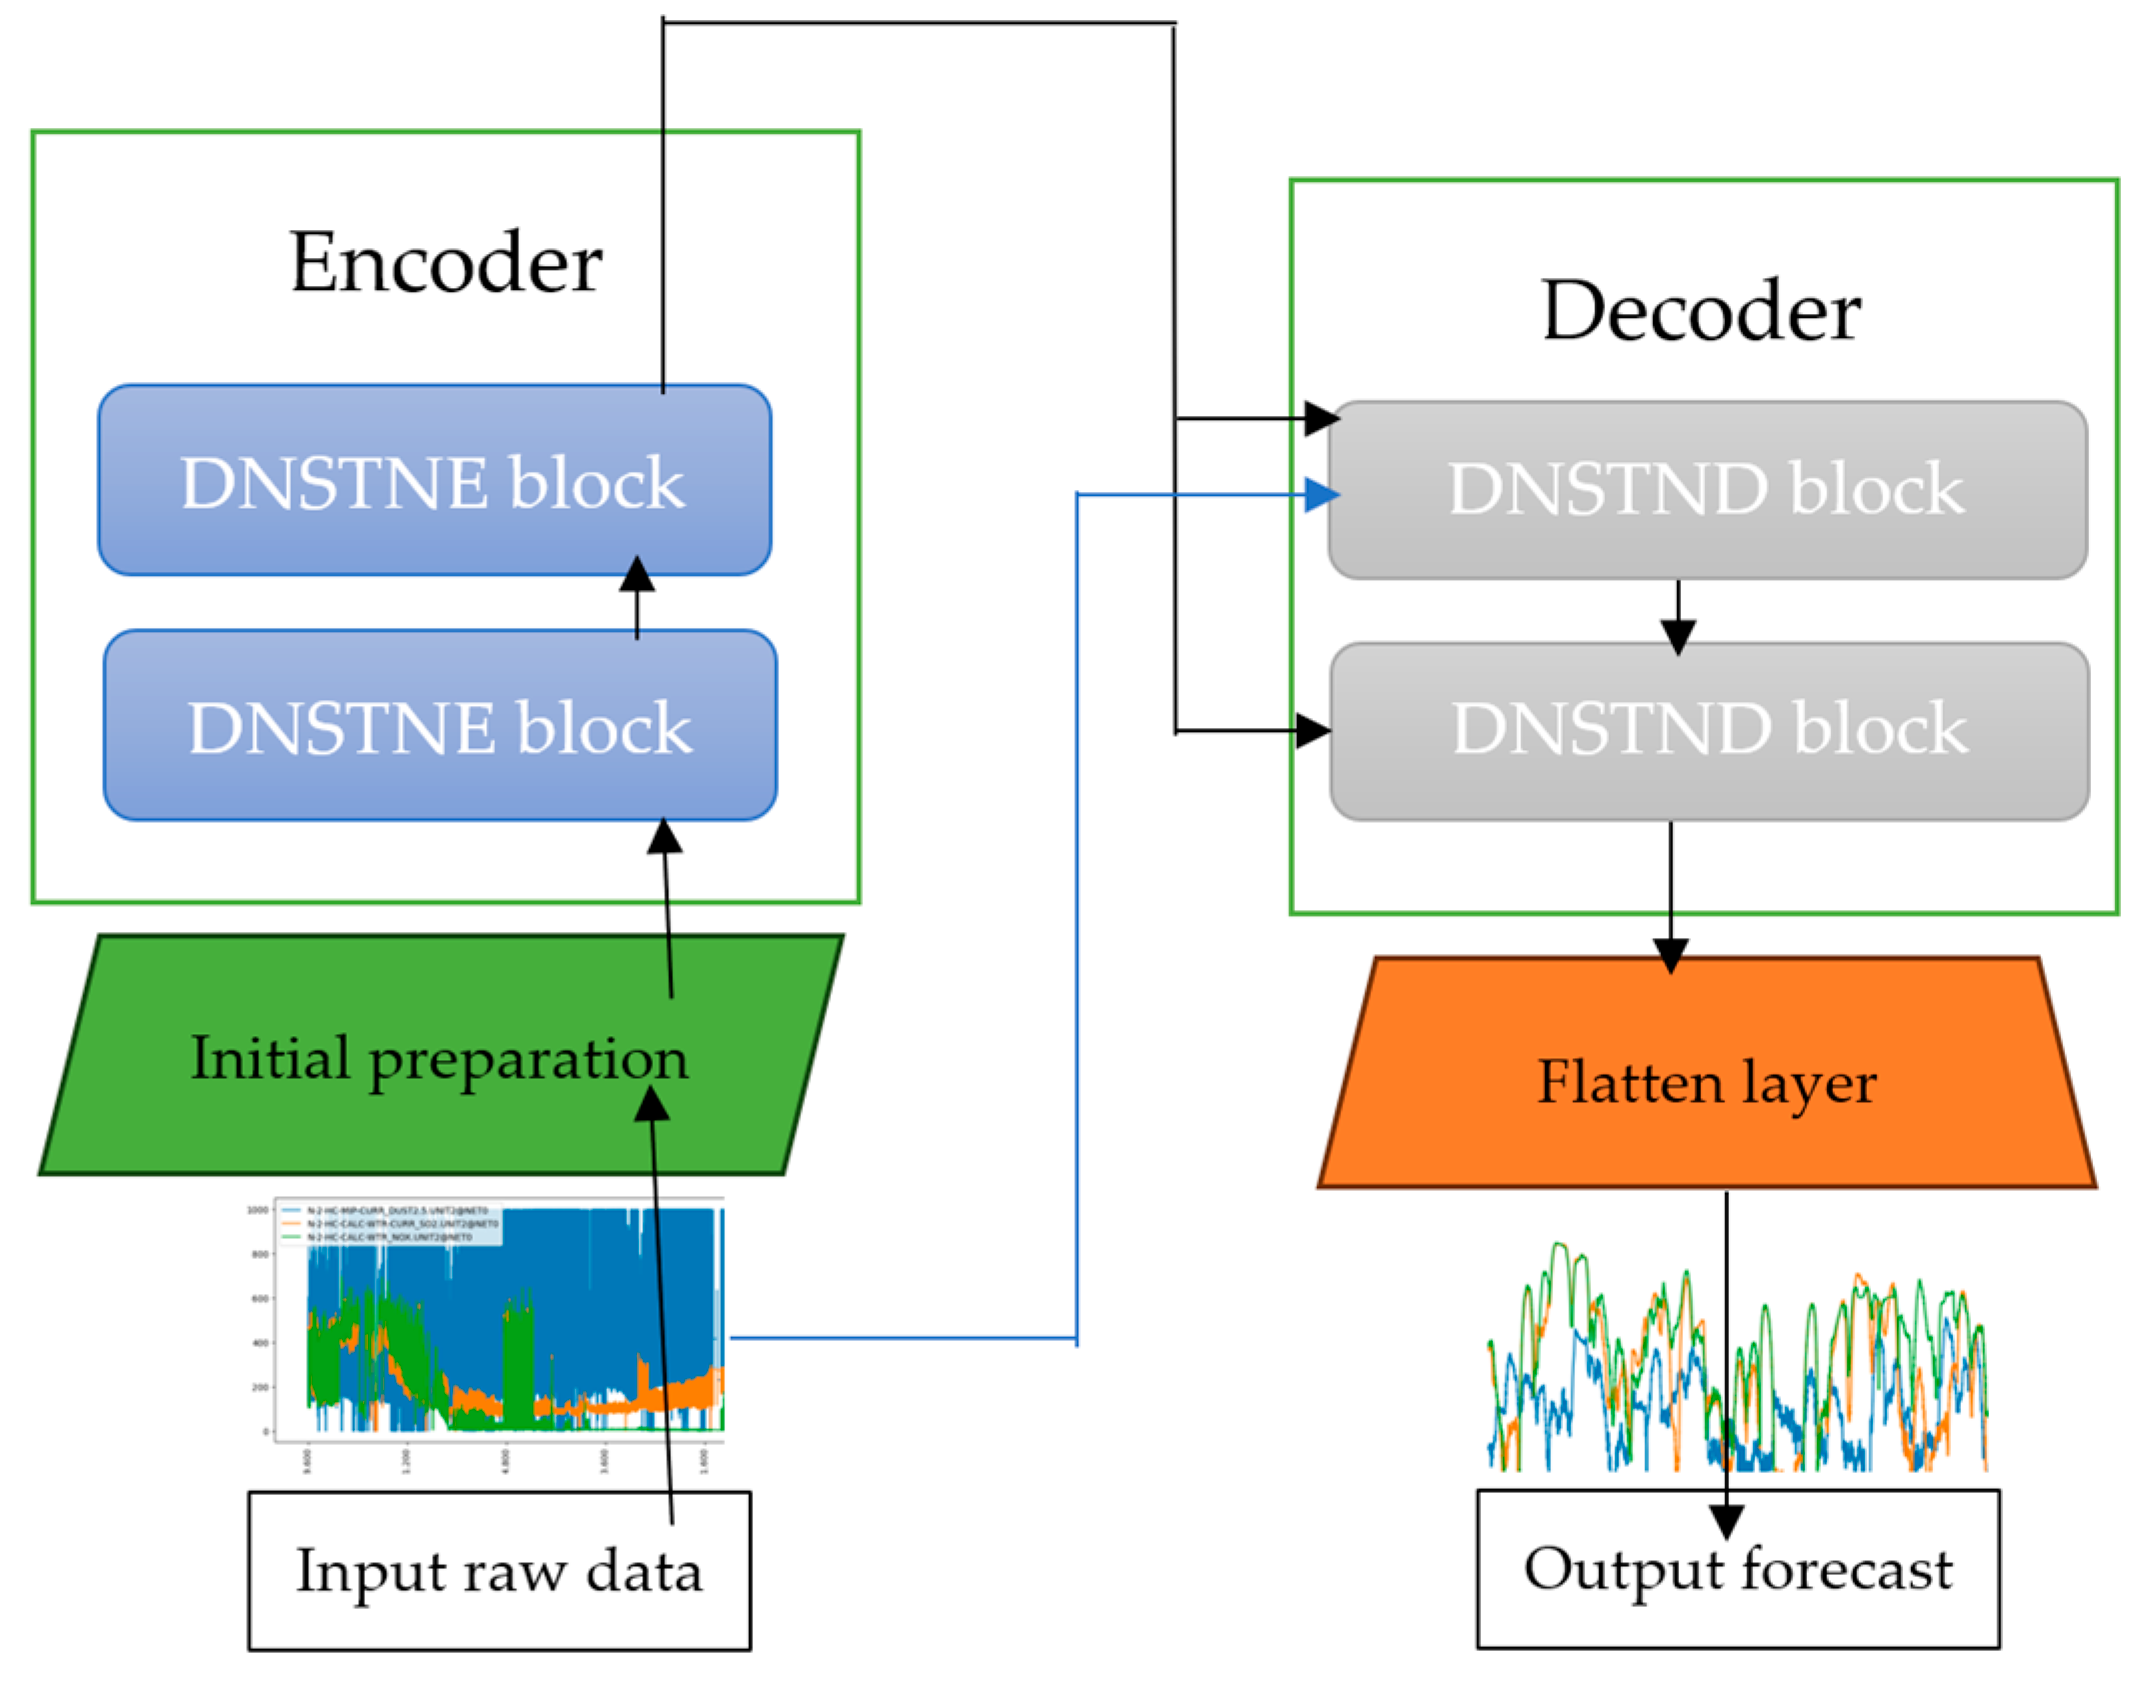
3.3. Time Series Forecasting with Deep Sparse Transformer Networks

Let Q = q t 1 , q t 2 , , q t n = q 1 , q 2 , , q n be the input time series, and let q t i d , where d is a fixed dimension of the data. The task is to calculate a forecast with a horizon, i.e., to find the values of the time series Q ^ = q ^ n + 1 , q ^ n + 2 , , q ^ n + p . Thus, the encoder transforms the time series Q = q 1 , q 2 , , q n into a hidden continuous representation of Z = z 1 , z 2 , , z w . At the same time, the decoder allows you to generate the original time series Q ^ = q ^ n + 1 , q ^ n + 2 , , q ^ n + p based on the specified representation Z (Figure 2). The process is iterative: At step k , the hidden value z k + 1 is calculated based on the previous values of the time series Z . Then, using the assumed value of z k + 1 , the next value of q k + 1 of time series Q can be predicted.
Paper [25] indicates that an encoder can use sparse self-attention to determine the relationship between time series data of air pollution indicators. In this case, attention weights are calculated based on scaled dot-product attention. Thus, the encoder has a sparse attention block and two sparse attention blocks that are cascaded by a 1D convolution with max-pooling. Accordingly, we propose a residual connection for two sublevels, which is described in [37]. The decoder is used to train and calculate a generative forecast of the time series of air pollution indicators. The decoder also uses a residual connection for three blocks with a preliminary normalization layer [25]: a masked sparse attention block, a multi-head attention layer, and a fully connected feed-forward network.
To evaluate the prediction efficiency, we used the traditional metrics of root mean square error (RMSE), mean absolute error (MAE), and coefficient of determination (R2) according to the following formulas:
R M S E ( Q , Q ^ ) = 1 p i = 1 p q n + i q ^ n + i 2 ,
M A E ( Q , Q ^ ) = 1 p i = 1 p q n + i q ^ n + i ,
R 2 = 1 i = 1 p q n + i q ^ n + i 2 i = 1 p q n + i q ¯ n + i 2 ,
where q ¯ n + i is the arithmetic mean for time series Q , and p is the number of observations.

4. Results

4.1. Results of a Study of Long-Term Memory in the Time Series of Atmospheric Pollutant Emissions

From the total dataset on air pollution in coal-fired power plant emissions, three main indicators were selected for further analysis, namely sulphur dioxide (SO2), nitrogen oxides (NOx), and fine dust PM2.5. They were chosen due to their environmental significance and the relatively small number of missing values in the time series, which significantly increases the reliability of further calculations. The existing gaps in the selected data were ignored at the calculation stage. Changes in the emissions of these pollutants during the study period are shown in Figure 3.
To analyze the dynamic properties of the signals, an R/S analysis was performed using the fixed-length flow window method, which allowed us to determine the change in the Hurst exponent over time. The results of this analysis are shown in Figure 4 and reflect the peculiarities of the autocorrelation structure of the pre-tested time series.
The analysis of changes in the Hurst exponent over time for the selected air pollution indicators shows that there is variability in the autocorrelation structure of the time series. The values of the exponents are not stable and show fluctuations: in some periods, they decrease to the level of 0.5 and even 0.4, which may indicate a decrease in the level of predictive power and a weakening of long-term dependencies in the data. At the same time, during most of the period under study, the values of the Hurst exponent exceed 0.7, which indicates the presence of long-term memory in time series and growing trends. The value of the Hurst exponent for the entire period of observation for sulphur dioxide (SO2) is 0.7196; for nitrogen oxides (NOx), 0.7658; and for fine dust (PM2.5), the value of the Hurst exponent is 0.7230. The obtained values confirm the predominance of stable correlations and auto dependencies in the dynamics of air pollution.

4.2. Verification Results of Deep Sparse Transformer Network for Predicting Air Pollution Indicators

To investigate the possibility of forecasting long-term memory for predicting air pollution indicators, a model based on the Deep Sparse Transformer Network (DSTN) was built. This model is a modification of the classical sparse transformer with sparse attention and is designed to work more efficiently with long series. For this study, we used an encoder consisting of two DSTNE blocks connected in series. The basic structure of the DSTNE block is shown in Figure 5.
Each DSTNE block starts with a sparse self-attention mechanism. This mechanism allows each element of the sequence to consider the values of several neighbouring elements, the number of which is determined by the window length. Sparse self-attention is the main mechanism that allows you to critically reduce the number of connections to be analyzed. The classical mechanism of attention activation involves analyzing n2 links, while the sparse attention mechanism analyzes only n*w links, where w is the window length. Self-attention is followed by residual connection. At this stage, we find the sum of the input tensor and the output from attention. This ensures that the original features are not lost, and we preserve it along with the transformed features with the context. The next step is normalization. Normalization is necessary to increase the convergence of the learning methods. The fourth element of the DSTNE block is the Feedforward Network (FFN). It is implemented using a two-layer interconnected perceptron. The FFN is responsible for the deeper processing of each token separately, without considering the connection with its neighbours. The DSTNE block is completed by normalizing the output from the FFN.
The decoder consists of two DSTND blocks connected in series. The key structural difference between these blocks is the use of two inputs. On one of the inputs, the Causal Sparse Self-Attention mechanism is used to input data. Casual means that each element analyzes the connections only with the previous elements and does not contain connections with the following elements. As in the encoder, the decoder uses sparsity to significantly reduce the number of connections to be analyzed. Scarification allows you to analyze no more than n*w links, where w is the length of the window. The other input of the decoder applies Cross-Attention to the context data received from the encoder. There is no causal constraint on this input, i.e., every element of the output sequence is associated with every element of the input sequence. The sum of the results of the two inputs is found, to which the FFN and normalization are applied (Figure 6).
After passing through all the DSTND blocks of the decoder, we obtain a tensor T containing the embedding of each token in the output sequence. This tensor does not yet contain the prediction of the next values of the sequence, but only abstract features that preserve the context of the previous values and the context of the input sequence. To obtain the prediction, another layer of neurons is used, this layer converts each feature vector into a scalar predicted value.
Given that additional features were used to predict the values of the pollutant, there was another embedding layer in the model before the encoder input. This is a fully connected layer that converts the input features of each token into a fixed-dimensional vector (embedding). The use of embedding is necessary to provide homogeneous data to the attention inputs, which allows the model to train the optimal representation of each token. As a result of training, we made predictions for 1, 6, 12, and 24 points ahead. The results of the accuracy assessment are shown in Table 1.
The Deep Sparse Transformer Network (DSTN) model was tested and trained locally on a laptop equipped with an NVIDIA RTX 3060 GPU with CUDA support. The PyTorch library with CUDA 11.8 and Python 3.12 was used for development. During training, the Adam optimizer with a learning rate of 0.001 and the MSE loss function was used. The model training took more than 2 h for each of the three contamination sequences. Despite the presence of a powerful GPU, frequent out-of-memory errors (OOM errors) were observed during the run. using long input sequences and using multi-fic inputs. The length of the window in the attention blocks was especially critical. We had to limit the window length to 20 steps.
To validate the developed model, time series forecasting was performed using the auto_arima function from the pmdarima package, which automatically selects optimal ARIMA parameters based on information criteria [38]. A forecast was generated for a horizon of 24 steps. Based on the comparison between predicted and actual values, key evaluation metrics were calculated. The corresponding results are presented in Table 1. According to the results, the DSTN-based method outperformed ARIMA, demonstrating significantly higher forecasting accuracy. Notably, the ARIMA model yielded a negative R2 value, indicating that its predictions were worse than a naïve forecast based on the mean. This highlights the limitations of ARIMA in capturing complex nonlinear patterns in the data, in contrast to the capacity of the proposed neural architecture.
The forecasting results show that the proposed model demonstrates slightly better accuracy for predicting SO2 levels compared to other pollutants. The value of the coefficient of determination R2 for SO2 varies from 0.95 for a one-point forecast to 0.38 for a 24-point forecast. For NOx and PM2.5, the results are similar, with a gradual decrease in R2 from 0.93 to 0.26, respectively.
One possible explanation for the higher accuracy of SO2 forecasts is that its emission is closer to linear in its dependence on the main parameters of power plant operation. This makes its dynamics more predictable for the model, unlike NOx and PM2.5, which may have a more complex, nonlinear relationship with technological modes and atmospheric conditions. At the same time, there is a significant deterioration in the quality of forecasting with an increase in the forecast horizon. A particularly sharp decline in accuracy occurs after the 12-point interval, which indicates the limited effectiveness of the model for long-term forecasts. Thus, the obtained results confirm the expediency of using the model mainly for short-term forecasts, no more than 12 points ahead.

5. Discussion

5.1. Findings

This study analyzes the presence of long-term memory in the time series of SO2, PM2.5, and NOx emissions, which were collected at one of the largest coal-fired power plants in Kazakhstan and the world with a capacity of 4000 MW, located in Ekibastuz (Kazakhstan). Based on fractal R/S analysis, it was found that these time series are characterized by the presence of long-term memory, and the time series are persistent. In particular, the Hurst exponent for the entire period of observation for sulphur dioxide (SO2) is 0.7196; for nitrogen oxides (NOx) it is 0.7658; and for fine dust (PM2.5), it is 0.7230. The change in the Hurst exponent in the dynamics for these time series was also constructed and studied. R/S analysis allowed us to select the length of the window for applying the Deep Sparse Transformer Network model to predict these time series. The model input consists of the technological parameters of the Ekibastuz coal-fired power plant. The DSTN architecture consists of two encoders and two DSTN block decoders, each with an attention window w = 20, embedding dimension equal to 64, learning rate of 0.001, the Adam optimizer, batch size of 64, and training/test distribution of 80/20. The training lasted two hours on an NVIDIA RTX 3060. When implementing the decoder part of the DSTN model, the window was used with a limited length of 20 points. If we had enough computing power, we could use a longer window to provide higher forecast accuracy for values with a horizon of more than 12 points. No other measures were taken to improve computational efficiency in this study.
In addition to R/S analysis, the DFA method was implemented, allowing us to confirm long-term dependencies in time series. Both methods yielded similar results for the Hurst exponent, which indicates the reliability of the data structure conclusion. Since R/S analysis is easier to implement and the input time series was cleaned of omissions, this study decided to focus on implementing R/S analysis.
In general, the results are important for adjusting the plant’s operating parameters and ensuring reduction in pollutant emissions. This corresponds to the implementation of the concept of achieving carbon neutrality and is important for ensuring the environmental safety of the region where the coal-fired power plant is located. Another important area of research is the creation of composite materials, particularly for removing elemental mercury gas (Hg0) from the flue gases of coal power plants. In particular, in study [39], a composite material Fe-UiO-66@BC was developed that combines the organometallic framework (MOF) of UiO-66, modulated with iron (Fe) ions, with biochar (BC). This composite is highly efficient in removing Hg0 from flue gas. It should be noted that excessive emissions from the Ekibastuz coal-fired power plant are a factor influencing the emergence of chronic diseases in the local population of Ekibastuz. Studies [12,13] indicate a significant prevalence of chronic lung diseases in this region. That is why ensuring the effective industrial management of the Ekibastuz coal-fired power plant and building air pollution monitoring systems in the region is important for ensuring public health and improving quality of life. Thus, the results of this study correspond to the following goals of sustainable development: SDG 3 (health and well-being), SDG 7 (affordable and clean energy), SDG 11 (sustainable cities), and SDG 13 (combating climate change) [40], correlating with the 2030 Agenda for Sustainable Development [41]. In particular, the introduction of new forecasting and environmental monitoring strategies is the key to ensuring the health and well-being of the population. In other words, the results have important social implications for regional development. In addition, the results have an impact on the formation of sustainable regional management strategies and the improvement of the regulatory framework in this area.

5.2. Limitations and Future Research Lines

In this study, a significant amount of data was collected on 14 indicators of both technological parameters of Ekibastuz coal-fired power plant and the emissions of various pollutants. However, the three indicators of SO2, PM2.5, and NOx emissions were selected for model verification, as they were found to have long-term memory. The time series of other indicators also had a persistent character, but in this study, only those that are most often recorded during the operation of coal-fired power plants were analyzed. Accordingly, in the future, it is necessary to verify the model for a larger number of pollutant emission indicators.
The difficulty in implementing the Deep Sparse Transformer Network model was due to the fact that the model is sensitive to emissions and omissions. Therefore, the collected time series of air pollution indicators were pre-processed. This should also be considered when implementing the R/S analysis method. Thus, the data containing many consecutive gaps complicates the analysis.
The specifics of the equipment and operating modes of a particular coal-fired power plant may limit the generalization of the DSTN model. Currently, there is information about monitoring the operation of one coal-fired power plant. However, this power plant generates high-capacity electricity and is of strategic importance for the sustainability of the entire region’s energy system. Research confirms that the developed DSTN model can be used in the work of other coal-fired power plants, but it may need to be finalized. This should be studied separately. It should also be noted that this study considered the performance of one coal-fired power plant. Each power plant has its own operation and equipment specifics and may also consume a specific type of coal. Accordingly, the mode setting of technological parameters may differ for other plants. This, to some extent, limits the generalization of the findings. Nevertheless, the results obtained allow us to improve the efficiency of the industrial management of coal-fired power plants to reduce air pollutant emissions.

6. Conclusions

It has been found that the use of neural network models makes it possible to create an environmental monitoring system that can predict the level of emissions even before the equipment starts operating in a particular mode, as well as recommend optimal parameters for the operation of a coal-fired power plant to minimize pollution. The integration of neural networks into the management and commissioning of a coal-fired power plant not only helps to achieve environmental goals but also improves the overall efficiency and safety of the plant.
This study analyzed the presence of long-term memory in the time series of air pollution indicators. The indicators were recorded at the Ekibastuz coal-fired power plant (Republic of Kazakhstan) for the period from 1 March 2023 to 31 August 2024. Three main indicators of air pollution at coal-fired power plants were analyzed: sulphur dioxide (SO2), nitrogen oxides (NOx), and fine dust (PM2.5). The Hurst exponents for these time series were calculated, and the presence of long-term memory in the structure of these time series was revealed. In particular, the Hurst exponent for the entire period of observation for sulphur dioxide (SO2) is 0.7196; for nitrogen oxide (NOx), it is 0.7658; and for fine dust (PM2.5), it is 0.7230. The change in the Hurst exponent in the dynamics for these time series was also plotted and studied. In general, it can be concluded that these time series are persistent, so they can be predicted using traditional forecasting models.
It was found that the change in the emission of nitrogen oxides and dust, depending on the setting of the technological parameters of the coal-fired power plant, is nonlinear. Therefore, to predict changes in the emission of these pollutants, it was decided to use the Deep Sparse Transformer Network, considering the values of technological parameters. The effective formation of a coal-fired power plant operation mode map and the setting of plant operation parameters critically affect the emission of pollutants into the air. Therefore, the described two-stage approach to predicting the time series of pollutant emissions (using fractal analysis and a neural network based on transformers) will allow a qualitative approach to the process control of the coal-fired power plant. The results of this study are important for the development of environmental monitoring systems at coal-fired power plants. This is especially important in the context of implementing the concept of achieving carbon neutrality.
The results of this study support the 2030 Agenda for Sustainable Development in terms of ensuring the health and well-being of the population, ensuring sustainable cities (SDG 3, SDG 11). In addition, the results define a strategy for providing affordable and clean energy (SDG 7), which is at the heart of combating climate change (SDG 13). In addition to ensuring the components of the 2030 Agenda for Sustainable Development, the creation of environmental monitoring systems can be part of the formation of sustainable regional management strategies in terms of ensuring energy security, environmental sustainability, and a high quality of life for the population living near objects releasing harmful substances.

Supplementary Materials

The following supporting information can be downloaded at https://doi.org/10.5281/zenodo.15202221 (accessed on 2 May 2025): Table S1: Data on air pollution indicators recorded at the Ekibastuz coal-fired power station from 1 March 2023 to 31 August 2024.

Author Contributions

Conceptualization, O.K. and Y.A.; methodology, O.K.; software, Y.A.; formal analysis, O.K. and Y.A.; investigation, O.K.; data curation, A.N. and A.B.; writing—original draft preparation, O.K.; writing—review and editing, Y.A., S.B., and A.N.; visualization, Y.A. and S.B.; supervision, A.N.; project administration, A.B. All authors have read and agreed to the published version of the manuscript.

Funding

This research was funded by the Science Committee of the Ministry of Science and Higher Education of the Republic of Kazakhstan within project BR21882258 “Development of Intelligent Information and Communication Systems Complex for Environmental Emission Monitoring to Make Decisions on Carbon Neutrality”.

Institutional Review Board Statement

Not applicable.

Informed Consent Statement

Not applicable.

Data Availability Statement

All data are available in this publication.

Acknowledgments

The authors thank the reviewers and editors for their generous and constructive comments that have improved this paper.

Conflicts of Interest

The authors declare no conflicts of interest.

References

  1. Energy Institute. Statistical Review of World Energy. 2024. Available online: https://www.energyinst.org/statistical-review (accessed on 12 April 2025).
  2. Finkelman, R.B.; Wolfe, A.; Hendryx, M.S. The future environmental and health impacts of coal. Energy Geosci. 2021, 2, 99–112. [Google Scholar] [CrossRef]
  3. Amster, E. Public health impact of coal-fired power plants: A critical systematic review of the epidemiological literature. Int. J. Environ. Health Res. 2019, 31, 558–580. [Google Scholar] [CrossRef]
  4. Chang, Q.; Zhang, H.; Zhao, Y. Ambient air pollution and daily hospital admissions for respiratory system–related diseases in a heavy polluted city in Northeast China. Environ. Sci. Pol. Res. 2020, 27, 10055–10064. [Google Scholar] [CrossRef]
  5. Yan, X.; Zang, Z.; Luo, N.; Jiang, Y.; Li, Z. New interpretable deep learning model to monitor real-time PM2.5 concentrations from satellite data. Environ. Int. 2020, 144, 106060. [Google Scholar] [CrossRef]
  6. Mahlangeni, N.; Kapwata, T.; Webster, C.; Howlett-Downing, C.; Wright, C.Y. Exposure to air pollution from coal-fired power plants and impacts on human health: A scoping review. Rev. Environ. Health 2025. [Google Scholar] [CrossRef] [PubMed]
  7. American Lung Association. Toxic Air: The Case for Cleaning Up Coal-Fired Power Plants. 2011. Available online: https://www.lung.org/getmedia/c3b2b744-7c7e-4941-b0cd-5a5e468515d1/toxic-air-report.pdf (accessed on 12 April 2025).
  8. Li, T.; Cheng, X. Estimating daily full-coverage surface ozone concentration using satellite observations and a spatiotemporally embedded deep learning approach. Int. J. Appl. Earth. Obs. Geoinf. 2021, 101, 102356. [Google Scholar] [CrossRef]
  9. Wang, Y.; Yuan, Q.; Li, T.; Zhu, L. Global spatiotemporal estimation of daily high-resolution surface carbon monoxide concentrations using Deep Forest. J. Clean. Prod. 2022, 350, 131500. [Google Scholar] [CrossRef]
  10. Carbon Border Adjustment Mechanism. 2025. Available online: https://taxation-customs.ec.europa.eu/carbon-border-adjustment-mechanism_en (accessed on 6 April 2025).
  11. Kuznetsova, E.; Vaillancourt, K. Energy Transition in Monocities. Coal Phase-Out Roadmap and Just Transition Action Plan for Ekibastuz (Kazakhstan). 2030 Roadmap and Action Plan. 2023. Available online: https://www.un-page.org/static/dc10131616a8f9f1411d844e623463c9/esmia-undp-kazakstan-ekibastuz-2023-06-29-final.pdf (accessed on 12 April 2025).
  12. Nugmanova, D.; Feshchenko, Y.; Iashyna, L.; Gyrina, O.; Malynovska, K.; Mammadbayov, E.; Akhundova, I.; Nurkina, N.; Tariq, L.; Makarova, J.; et al. The Prevalence, Burden and Risk Factors Associated with Chronic Obstructive Pulmonary Disease in Commonwealth of Independent States (Ukraine, Kazakhstan and Azerbaijan): Results of the CORE Study. BMC Pulm. Med. 2018, 18, 26. [Google Scholar] [CrossRef]
  13. Nugmanova, D.; Sokolova, L.; Feshchenko, Y.; Iashyna, L.; Gyrina, O.; Malynovska, K.; Mustafayev, I.; Aliyeva, G.; Makarova, J.; Vasylyev, A.; et al. The Prevalence, Burden and Risk Factors Associated with Bronchial Asthma in Commonwealth of Independent States Countries (Ukraine, Kazakhstan and Azerbaijan): Results of the CORE Study. BMC Pulm. Med. 2018, 18, 110. [Google Scholar] [CrossRef]
  14. Semenova, Y.; Zhunussov, Y.; Pivina, L.; Abisheva, A.; Tinkov, A.; Belikhina, T.; Skalny, A.; Zhanaspayev, M.; Bulegenov, T.; Glushkova, N.; et al. Trace Element Biomonitoring in Hair and Blood of Occupationally Unexposed Population Residing in Polluted Areas of East Kazakhstan and Pavlodar Regions. J. Trace Elem. Med. Biol. 2019, 56, 31–37. [Google Scholar] [CrossRef]
  15. Assanov, D.; Zapasnyi, V.; Kerimray, A. Air Quality and Industrial Emissions in the Cities of Kazakhstan. Atmosphere 2021, 12, 314. [Google Scholar] [CrossRef]
  16. IQAir. World’s Most Polluted Countries & Regions. 2024. Available online: https://www.iqair.com/world-most-polluted-countries (accessed on 12 April 2025).
  17. Cekim, H.O. Forecasting PM 10 concentrations using time series models: A case of the most polluted cities in Turkey. Environ. Sci. Pollut. Res. 2020, 27, 25612–25624. [Google Scholar] [CrossRef]
  18. Jian, L.; Zhao, Y.; Zhu, Y.-P.; Zhang, M.-B.; Bertolatti, D. An application of ARIMA model to predict submicron particle concentrations from meteorological factors at a busy roadside in Hangzhou, China. Sci. Total Environ. 2012, 426, 336–345. [Google Scholar] [CrossRef] [PubMed]
  19. Chu, J.; Dong, Y.; Han, X.; Xie, J.; Xu, X.; Xie, G. Short-term prediction of urban PM 2.5 based on a hybrid modified variational mode decomposition and support vector regression model. Environ. Sci. Pollut. Res. 2021, 28, 56–72. [Google Scholar] [CrossRef]
  20. Agarwal, S.; Sharma, S.R.S.; Rahman, M.H.; Vranckx, S.; Maiheu, B.; Blyth, L.; Janssen, S.; Gargava, P.; Shukla, V.K.; Batra, S. Air quality forecasting using artificial neural networks with real time dynamic error correction in highly polluted regions. Sci. Total Environ. 2020, 735, 139454. [Google Scholar] [CrossRef] [PubMed]
  21. Chen, T.; Guestrin, C. Xgboost: A scalable tree boosting system. In Proceedings of the 22nd ACM SIGKDD International Conference on Knowledge Discovery and Data Mining, San Francisco, CA, USA, 13–17 August 2016; pp. 785–794. [Google Scholar]
  22. Vaswani, A.; Shazeer, N.; Parmar, N.; Uszkoreit, J.; Jones, L.; Gomez, A.N.; Kaiser, L.; Polosukhin, I. Attention is all you need. In Proceedings of the Advances in Neural Information Processing Systems, Long Beach, CA, USA, 4–9 December 2017; pp. 5998–6008. [Google Scholar]
  23. Bazi, Y.; Bashmal, L.; Rahhal, M.M.A.; Dayil, R.A.; Ajlan, N.A. Vision Transformers for remote sensing image classification. Remote Sens. 2021, 13, 516. [Google Scholar] [CrossRef]
  24. Chen, X.; Wu, Y.; Wang, Z.; Liu, S.; Li, J. Developing real-time streaming transformer transducer for speech recognition on large-scale dataset. In Proceedings of the ICASSP IEEE International Conference on Acoustics, Speech and Signal Processing, Toronto, ON, Canada, 6–11 June 2021; pp. 5904–5908. [Google Scholar]
  25. Zhang, Z.; Zhang, S. Modeling air quality PM2.5 forecasting using deep sparse attention-based transformer networks. Int. J. Environ. Sci. Technol. 2023, 20, 13535–13550. [Google Scholar] [CrossRef]
  26. Cui, B.; Liu, M.; Li, S.; Jin, Z.; Zeng, Y.; Lin, Z. Deep learning methods for atmospheric PM2.5 prediction: A comparative study of transformer and CNN-LSTM-attention. Atmos. Pollut. Res. 2023, 14, 101833. [Google Scholar] [CrossRef]
  27. Zhang, Z.; Zhang, S.; Zhao, X.; Chen, L.; Yao, J. Temporal Difference-Based Graph Transformer Networks for Air Quality PM2.5 Prediction: A Case Study in China. Front. Environ. Sci. 2022, 10, 924986. [Google Scholar] [CrossRef]
  28. Xue, Y.; Pan, W.; Lu, W.Z.; He, H.D. Multifractal nature of particulate matters (PMs) in Hong Kong urban air. Sci. Total Environ. 2015, 532, 744–751. [Google Scholar] [CrossRef]
  29. Kantelhardt, J.W.; Zschiegner, S.A.; Koscielny-Bunde, E.; Havlin, S.; Bunde, A.; Stanley, H.E. Multifractal detrended fluctuation analysis of nonstationary time series. Phys. A Stat. Mech. Its Appl. 2002, 316, 87–114. [Google Scholar] [CrossRef]
  30. Thompson, J.R.; Wilson, J.R. Multifractal detrended fluctuation analysis: Practical applications to financial time series. Comput. Simul. 2016, 126, 63–88. [Google Scholar] [CrossRef]
  31. Liu, X.; Hadiatullah, H.; Tai, P.; Xu, Y.; Zhang, X.; Schnelle-Kreis, J.; Schloter-Hai, B.; Zimmermann, R. Air pollution in Germany: Spatio-temporal variations and their driving factors based on continuous data from 2008 to 2018. Environ. Pollut. 2021, 276, 116732. [Google Scholar] [CrossRef] [PubMed]
  32. Biloshchytskyi, A.; Neftissov, A.; Kuchanskyi, O.; Andrashko, Y.; Biloshchytska, S.; Mukhatayev, A.; Kazambayev, I. Fractal Analysis of Air Pollution Time Series in Urban Areas in Astana, Republic of Kazakhstan. Urban. Sci. 2024, 8, 131. [Google Scholar] [CrossRef]
  33. Bureau of National Statistics of Agency for Strategic Planning and Reforms of the Republic of Kazakhstan. The Population of Kazakhstan by Individual Ethnic Groups at the Beginning of 2021. 2021. Available online: https://stat.gov.kz/ (accessed on 12 April 2025).
  34. Biloshchytskyi, A.; Kuchanskyi, O.; Neftissov, A.; Andrashko, Y.; Biloshchytska, S.; Kazambayev, I. Fractal Analysis of Mining Wastewater Time Series Parameters: Balkhash Urban Region and Sayak Ore District. Urban. Sci. 2024, 8, 200. [Google Scholar] [CrossRef]
  35. Peters, E.E. Fractal Market Analysis: Applying Chaos Theory to Investment and Economics; John Wiley & Sons Inc.: Hoboken, NJ, USA, 1994; p. 336. [Google Scholar]
  36. Anis, A.; Lloyd, E. The expected value of the adjusted rescaled Hurst Range of independent normal summands. Biometrika 1976, 63, 111–116. [Google Scholar] [CrossRef]
  37. He, K.; Zhang, X.; Ren, S.; Sun, J. Deep residual learning for image recognition. In Proceedings of the IEEE Conference on Computer Vision and Pattern Recognition, Las Vegas, NV, USA, 27–30 June 2016; pp. 770–778. [Google Scholar]
  38. Smith, T.G. Pmdarima. Tips to Using Auto_Arima. Available online: https://alkaline-ml.com/pmdarima/tips_and_tricks.html (accessed on 23 May 2025).
  39. Zheng, Y.; Cheng, P.; Li, Z.; Fan, C.; Wen, J.; Yu, Y.; Jia, L. Efficient removal of gaseous elemental mercury by Fe-UiO-66@BC composite adsorbent: Performance evaluation and mechanistic elucidation. Sep. Purif. Technol. 2025, 372, 133463. [Google Scholar] [CrossRef]
  40. The 17 Goals. Department of Economic and Social Affairs. Sustainable Development. 2025. Available online: https://sdgs.un.org/goals (accessed on 23 May 2025).
  41. Transforming Our World: The 2030 Agenda for Sustainable Development. 2025. Available online: https://sdgs.un.org/2030agenda (accessed on 23 May 2025).
Figure 1. Schematic of air pollution monitoring by a coal-fired power plant.
Sustainability 17 05115 g001
Figure 2. The model for time series forecasting with Deep Sparse Transformer Networks.
Sustainability 17 05115 g002
Figure 3. Graph of air pollutant emissions of the Ekibastuz coal-fired power plant from 1 March 2023 to 31 December 2024.
Sustainability 17 05115 g003
Figure 4. Graph of Hurst exponent variation for the Ekibastuz coal-fired power plant from 1 March 2023 to 31 December 2024.
Sustainability 17 05115 g004
Figure 5. Architecture of the encoder block.
Sustainability 17 05115 g005
Figure 6. Architecture of the decoder block.
Sustainability 17 05115 g006
Table 1. Forecasting performance of the Deep Sparse Transformer Network trained on Ekibastuz coal-fired power plant data.
Pollution Performance MetricsDSTNARIMA
Forecast Horizon
16122424
PM2.5RMSE58.59137.07172.32209.87325.55
MSE34.7190.36119.88145.38298.82
R20.950.810.650.38−1.43
NOxRMSE63.3387.94105.16117.3735.14
MSE42.9963.3073.4586.8824.13
R20.930.750.520.26−0.16
SO2RMSE17.1223.7728.4831.8273.94
MSE11.6317.1919.8523.3858.50
R20.930.760.510.27−0.24
Disclaimer/Publisher’s Note: The statements, opinions and data contained in all publications are solely those of the individual author(s) and contributor(s) and not of MDPI and/or the editor(s). MDPI and/or the editor(s) disclaim responsibility for any injury to people or property resulting from any ideas, methods, instructions or products referred to in the content.

