1. Introduction
The term “spatial planning” originated in Europe for the purpose of achieving balanced regional development and spatial balanced coordination. Some countries have conducted various studies on it according to their national conditions and formed a sound and typical spatial planning system [
1]. With the continuous progress of industrialization, urbanization, and information technology in the world, the development and disturbance of human land space are increasing, and many effects such as urban sprawl, environmental pollution, and ecological degradation are frequent, posing severe challenges to the future survival and development of human beings [
2,
3,
4,
5,
6,
7]. Therefore, understanding the development of national land space and optimizing the layout of national land has always been the focus of attention of all countries [
8]. Recently, the development of industrialization and urbanization has caused many problems in China [
9], such as urban land crowding out ecological land and agricultural land, changes in the ecological environment, uncoordinated regional development, and extensive land. In order to deal with the above problems, taking into account food security, economic development, and ecological protection [
10], the Chinese government in land space planning formulated a “production–living–ecological space” (PLE) strategy [
11], and proposed a clear goal for the first time at the 18th CPC National Congress. After that, the 19th CPC National Congress proposed the scientific delineation of the PLE to coordinate production, life, and ecology development for sustainable economic and environmental growth [
12].
PLE is a comprehensive land space zoning method, which is the production–life–ecological space; research on PLE can provide direction for the optimization and development of land space in the future. At present, the research on PLE mainly involves theoretical connotation and framework [
13,
14]; identification of leading actions of land use types [
15,
16,
17,
18]; the spatial optimization and spatial carrying capacity [
19,
20,
21,
22,
23]; and spatio-temporal change in PLE land use pattern and eco-environmental effect analysis [
24,
25,
26]. In recent years, the prediction and simulation of the evolution of the PLE pattern have gradually emerged, and the simulation combined with mathematical models is a typical and effective quantitative method, including the cellular automata model, Markov chain model, and FLUS and PLUS models. In the early days, the first two models were dominant. However, they did not explore the relationship between spatial change in land use and spatial driving factors, which may lead to low simulation accuracy [
27,
28], but now, the FLUS and PLUS models have become the most extensive models for land prediction, such as Li et al. [
29] simulated and predicted the spatial changes in the PLE environment in Poyang Lake under various scenarios based on remote sensing and RF–Markov–FLUS models. Zhang et al. [
30] simulated and predicted the spatial pattern of PLE in Changsha City in 2030 based on the DTTD-MCR-PLUS model. Compared with other models, PLUS uses the random forest algorithm to explain the correlation between land spatial change and spatial driving factors better and uses the adaptive inertia cycle mechanism to predict the spatial distribution of different land types in the future [
30], which can obtain higher simulation accuracy and more similar landscapes [
31,
32,
33]. Therefore, this study uses the PLUS model to simulate and predict the changes in the spatial pattern of the region and quantitatively analyzes the impact of spatial changes on future eco-environment in different scenarios.
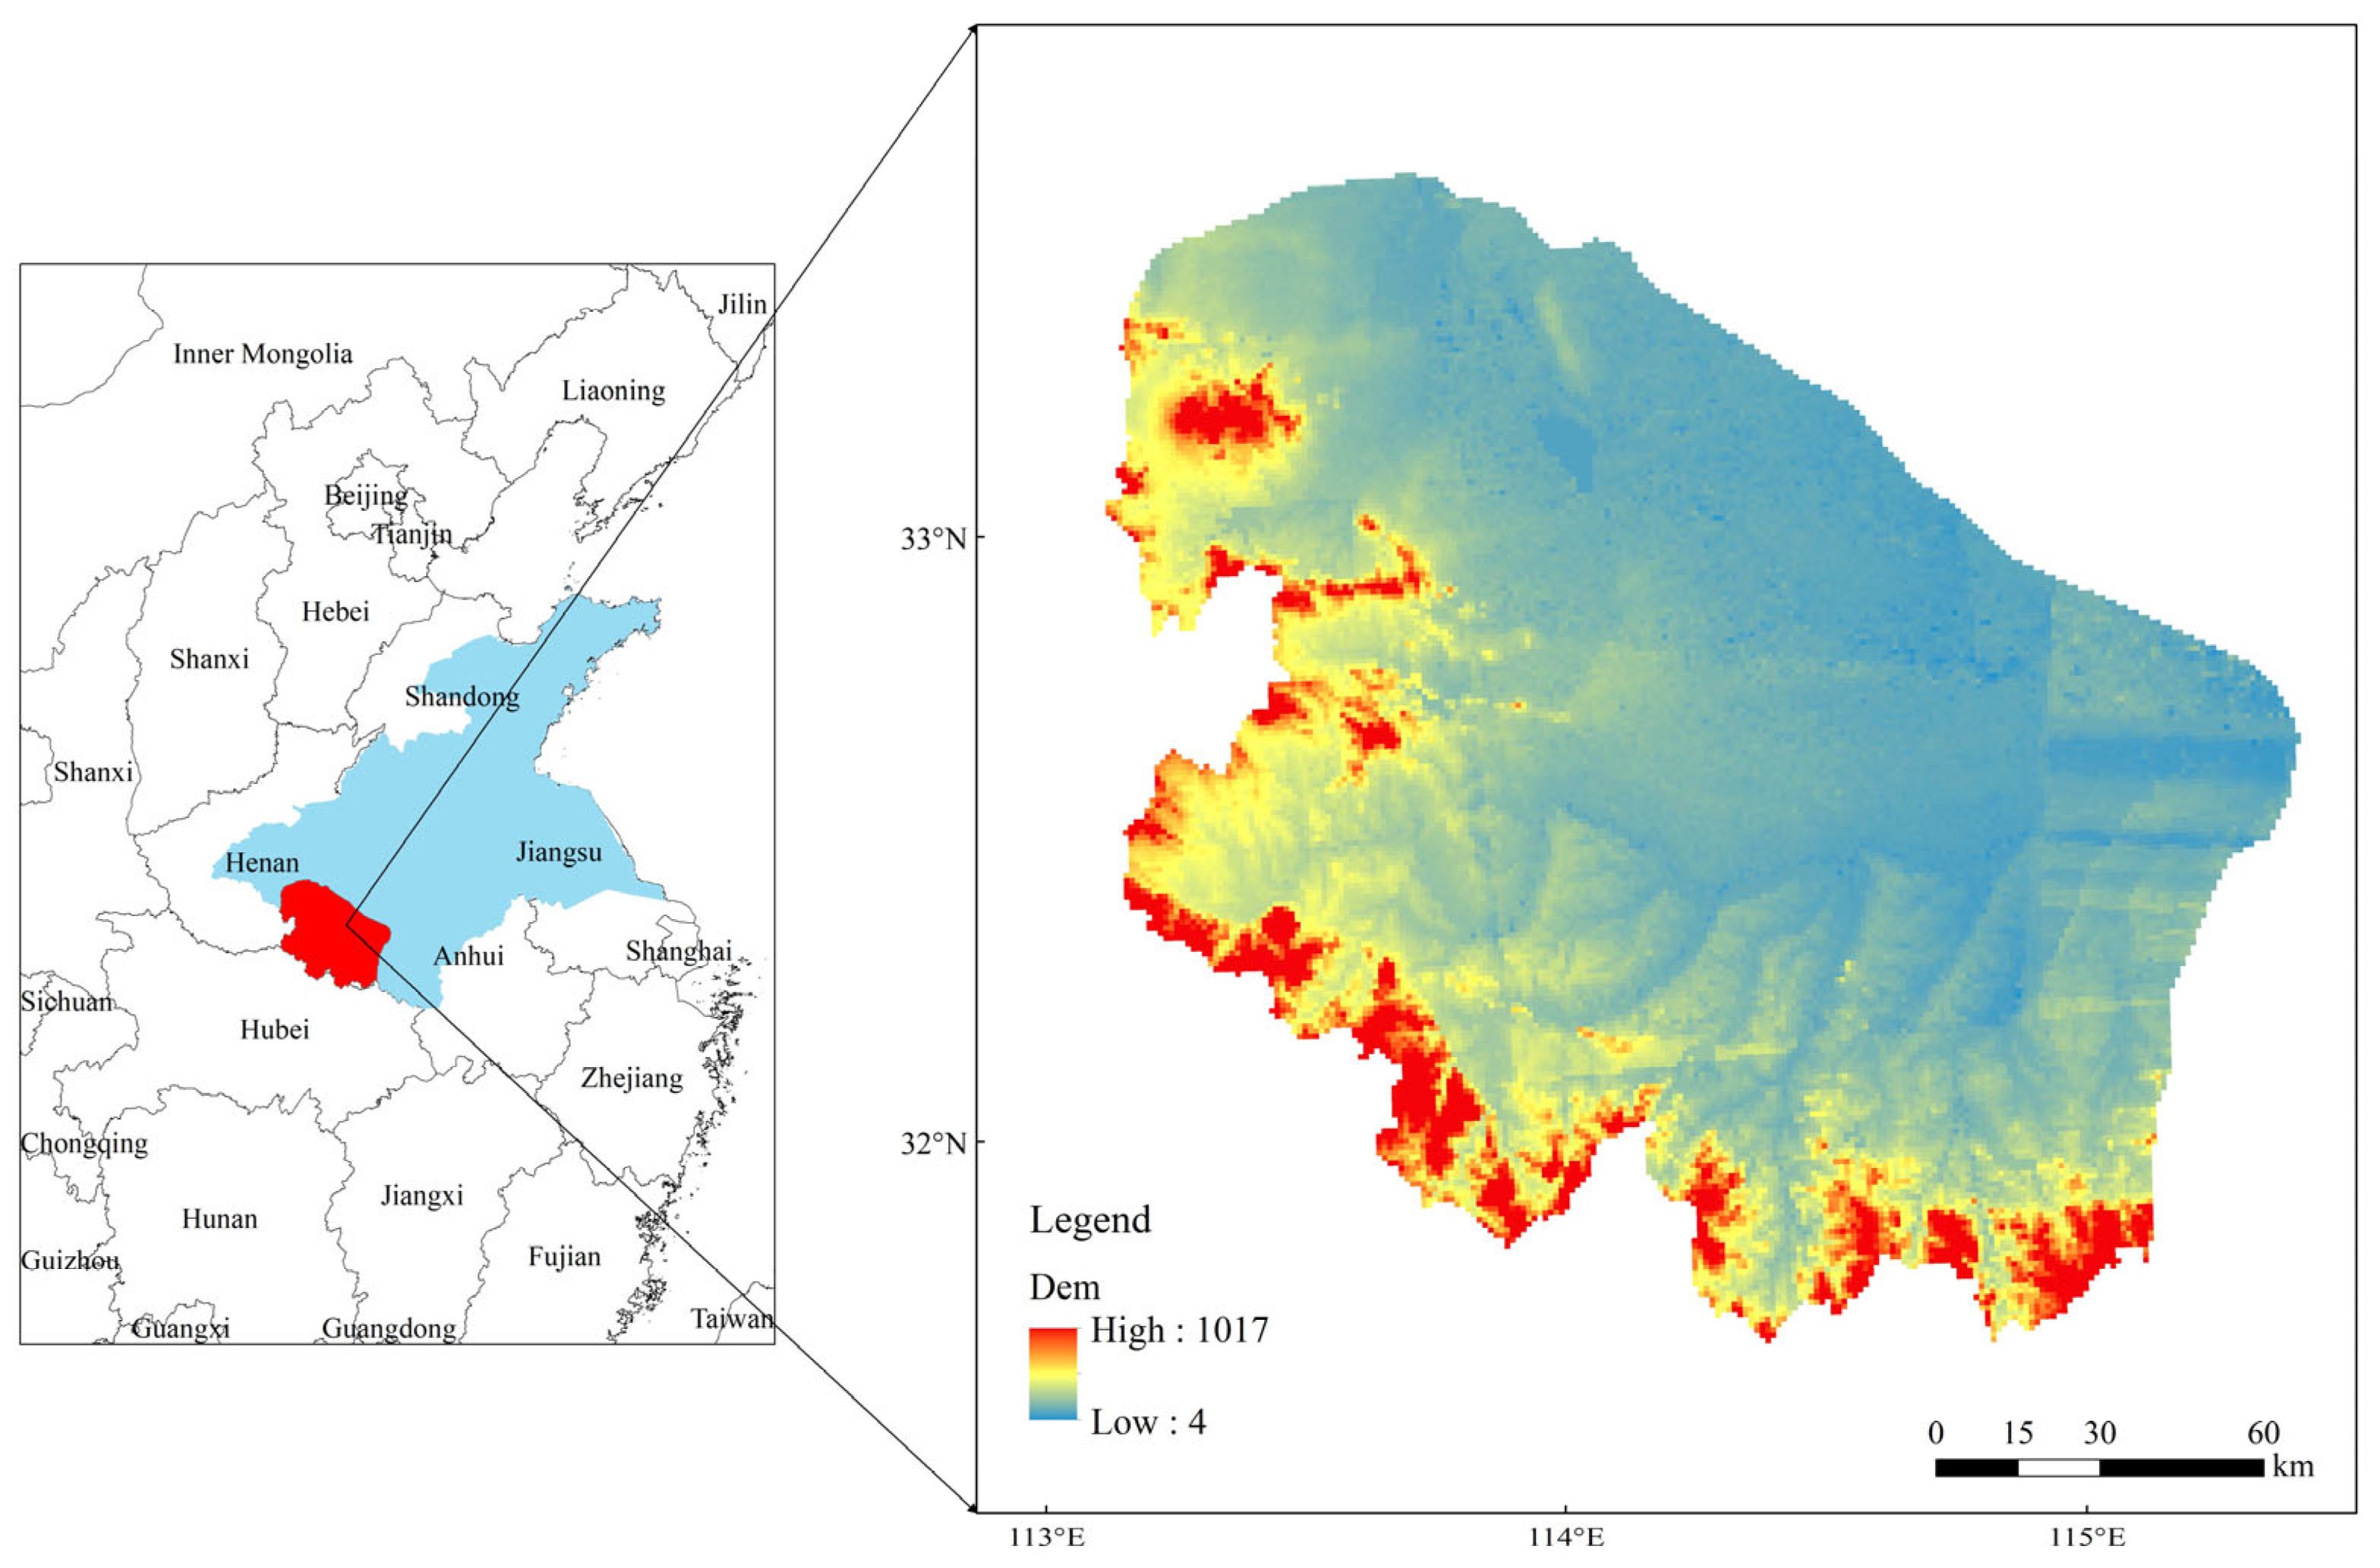
The Huaihe River Basin (HR), China’s food and population-intensive areas, is the transition zone between the north and south climates. As the source of the Huai River, the upper reaches of Huaihe River Basin (UHR) have a variety of terrains such as mountains, plains, and hills, and the distribution of its land use structure affects the regional eco-environment and thus has an impact on the ecological development of the lower reaches. Therefore, the future development of this region is of great significance to the Huaihe River Basin. The Huaihe River Basin is rich in water systems, so there are many studies on water resources, but the research on land pattern evolution and future simulation analysis is not perfect. At the same time, some scholars have conducted a comprehensive study of the whole basin ecosystem [
34,
35], such as Qiao et al. [
35] used the InVEST and GIS spatial analysis method to evaluate the temporal and spatial variation characteristics of ecosystem services in the Huaihe River Basin from 1995 to 2020. However, the impact of land changes in the UHR on the future ecological environment remains unclear. Therefore, in order to understand the future multi-scenario changes in UHR and their impact on eco-environmental quality (EQ), based on 30 m resolution land use data from 2010 to 2020, the PLUS model was applied to simulate and predict land use data of UHR from 2030 to 2050 under three scenarios of business as usual, ecological protection, and production priority. Then, we analyzed and evaluated the changes in PLE and EQ in historical periods and various scenarios. This research provides a basis for the optimization of territorial space and the construction of ecological civilization in UHR.
3. Results Analysis
3.1. Analysis of Spatial and Temporal Pattern Changes in PLE in the UHR from 1980 to 2020
According to the data (
Figure 2), the production space in the UHR exceeds 60% of the total area, the ecological space only accounts for about 22%, and the proportion of living space does not exceed 10%. In terms of time, from 1980 to 2020, the production space in the UHR presented a down–up–downward tendency. In 40 years, the production space area decreased by 873.24 km
2, the proportion of AP was the most, while the proportion of IMP was less than 2%, but it continued to increase. The ecological space presented a down-up-downward tendency from 1980 to 2020, with a total increase of 340.90 km
2. Among them, FE was the main ecological land, about 79%. In 40 years, FE, WE, and OE increased while GE decreased. The living space area continued to increase from 1980 to 2020, of which RL was the main one, and UL accounted for less than 20% of living space. Both types of land continued to grow, but the proportion of RL in living space decreased. It can be seen that the growth rate of RL is smaller than that of UL, which also shows an improvement in the urbanization level in the region.
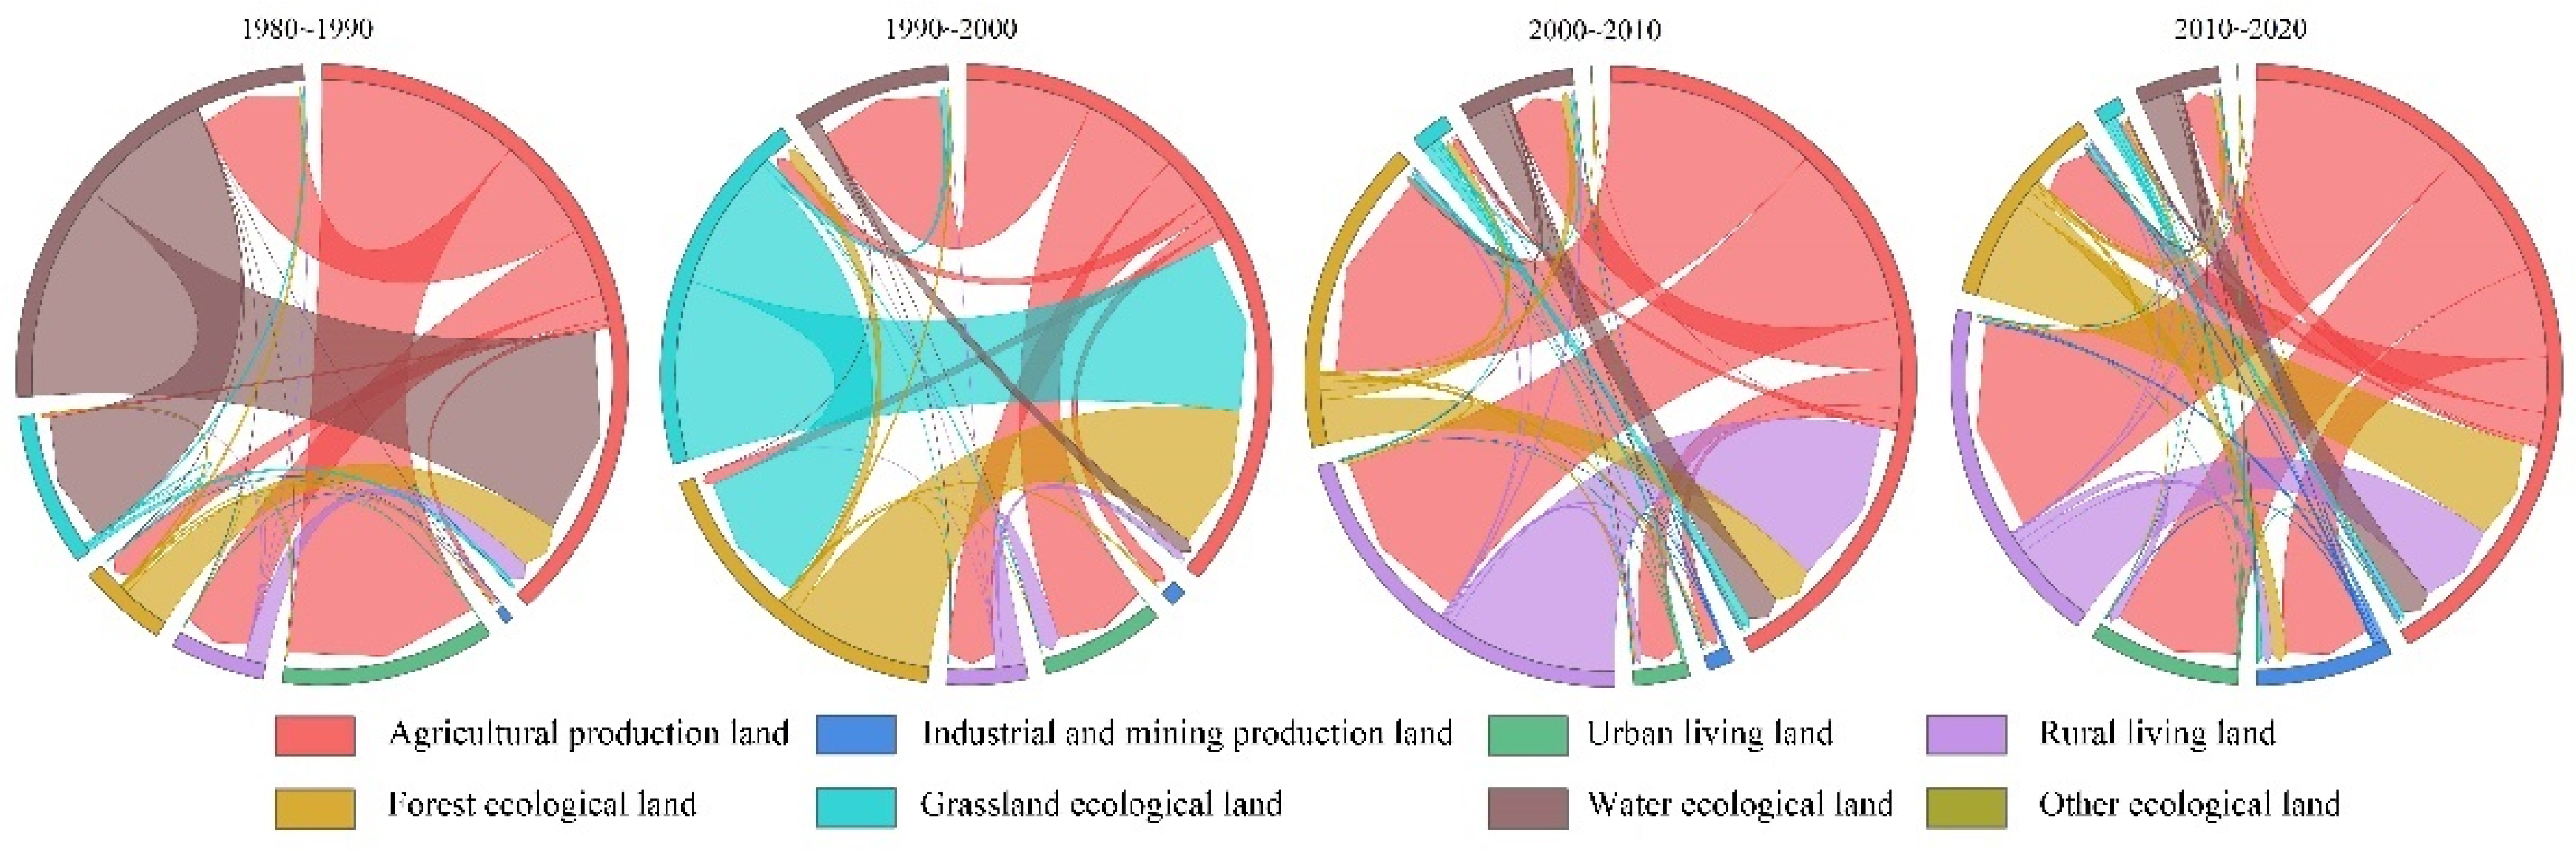
In order to more clearly understand the conversion of the area of PLE in the UHR from 1980 to 2020 among each land use type, this paper uses ArcGIS to overlay land use data from 1980 to 2020 in UHR and obtains land use transfer matrix from 1980 to 2020, and visualizes it (
Figure 3). From 1980 to 2020, except for OE, the rest of the land has been converted, the most obvious of which is the conversion of AP. At the same time, the AP has gradually developed from the exchange of ecological land to the exchange of living land. It can be seen that in recent years, the UHR has shifted from developing agriculture and economy to focusing on ecological and economic development.
In terms of space (
Figure 4), the distribution of various types of land from 1980 to 2020 is relatively consistent. AP is distributed in most areas of the UHR, and IMP is less distributed, mainly in the southwest and northwest regions. The distribution range of UL is large, and the area is concentrated. It is embedded in the AP in blocks, mostly distributed in southwest and northwest regions, while RL is sporadically distributed. FE is distributed along the border from the northwest to the southeast. The grassland ecosystem is distributed around the FE, mainly in the northwest and eastern. WE are mainly the Huaihe River and the Suyahu Reservoir in Zhumadian City, Henan Province. OE areas are small and do not explain too much. From 1980 to 2020, various types of land use have changed greatly or slightly. The changes are more obvious in UL and RL, mainly in the northwest and central regions. In the last 40 years, the population living demand in the UHR has been increasing, and urban and rural land has been expanding.
3.2. Analysis of Eco-Environmental Effects in the UHR from 1980 to 2020
3.2.1. Ecological Environment Quality Analysis
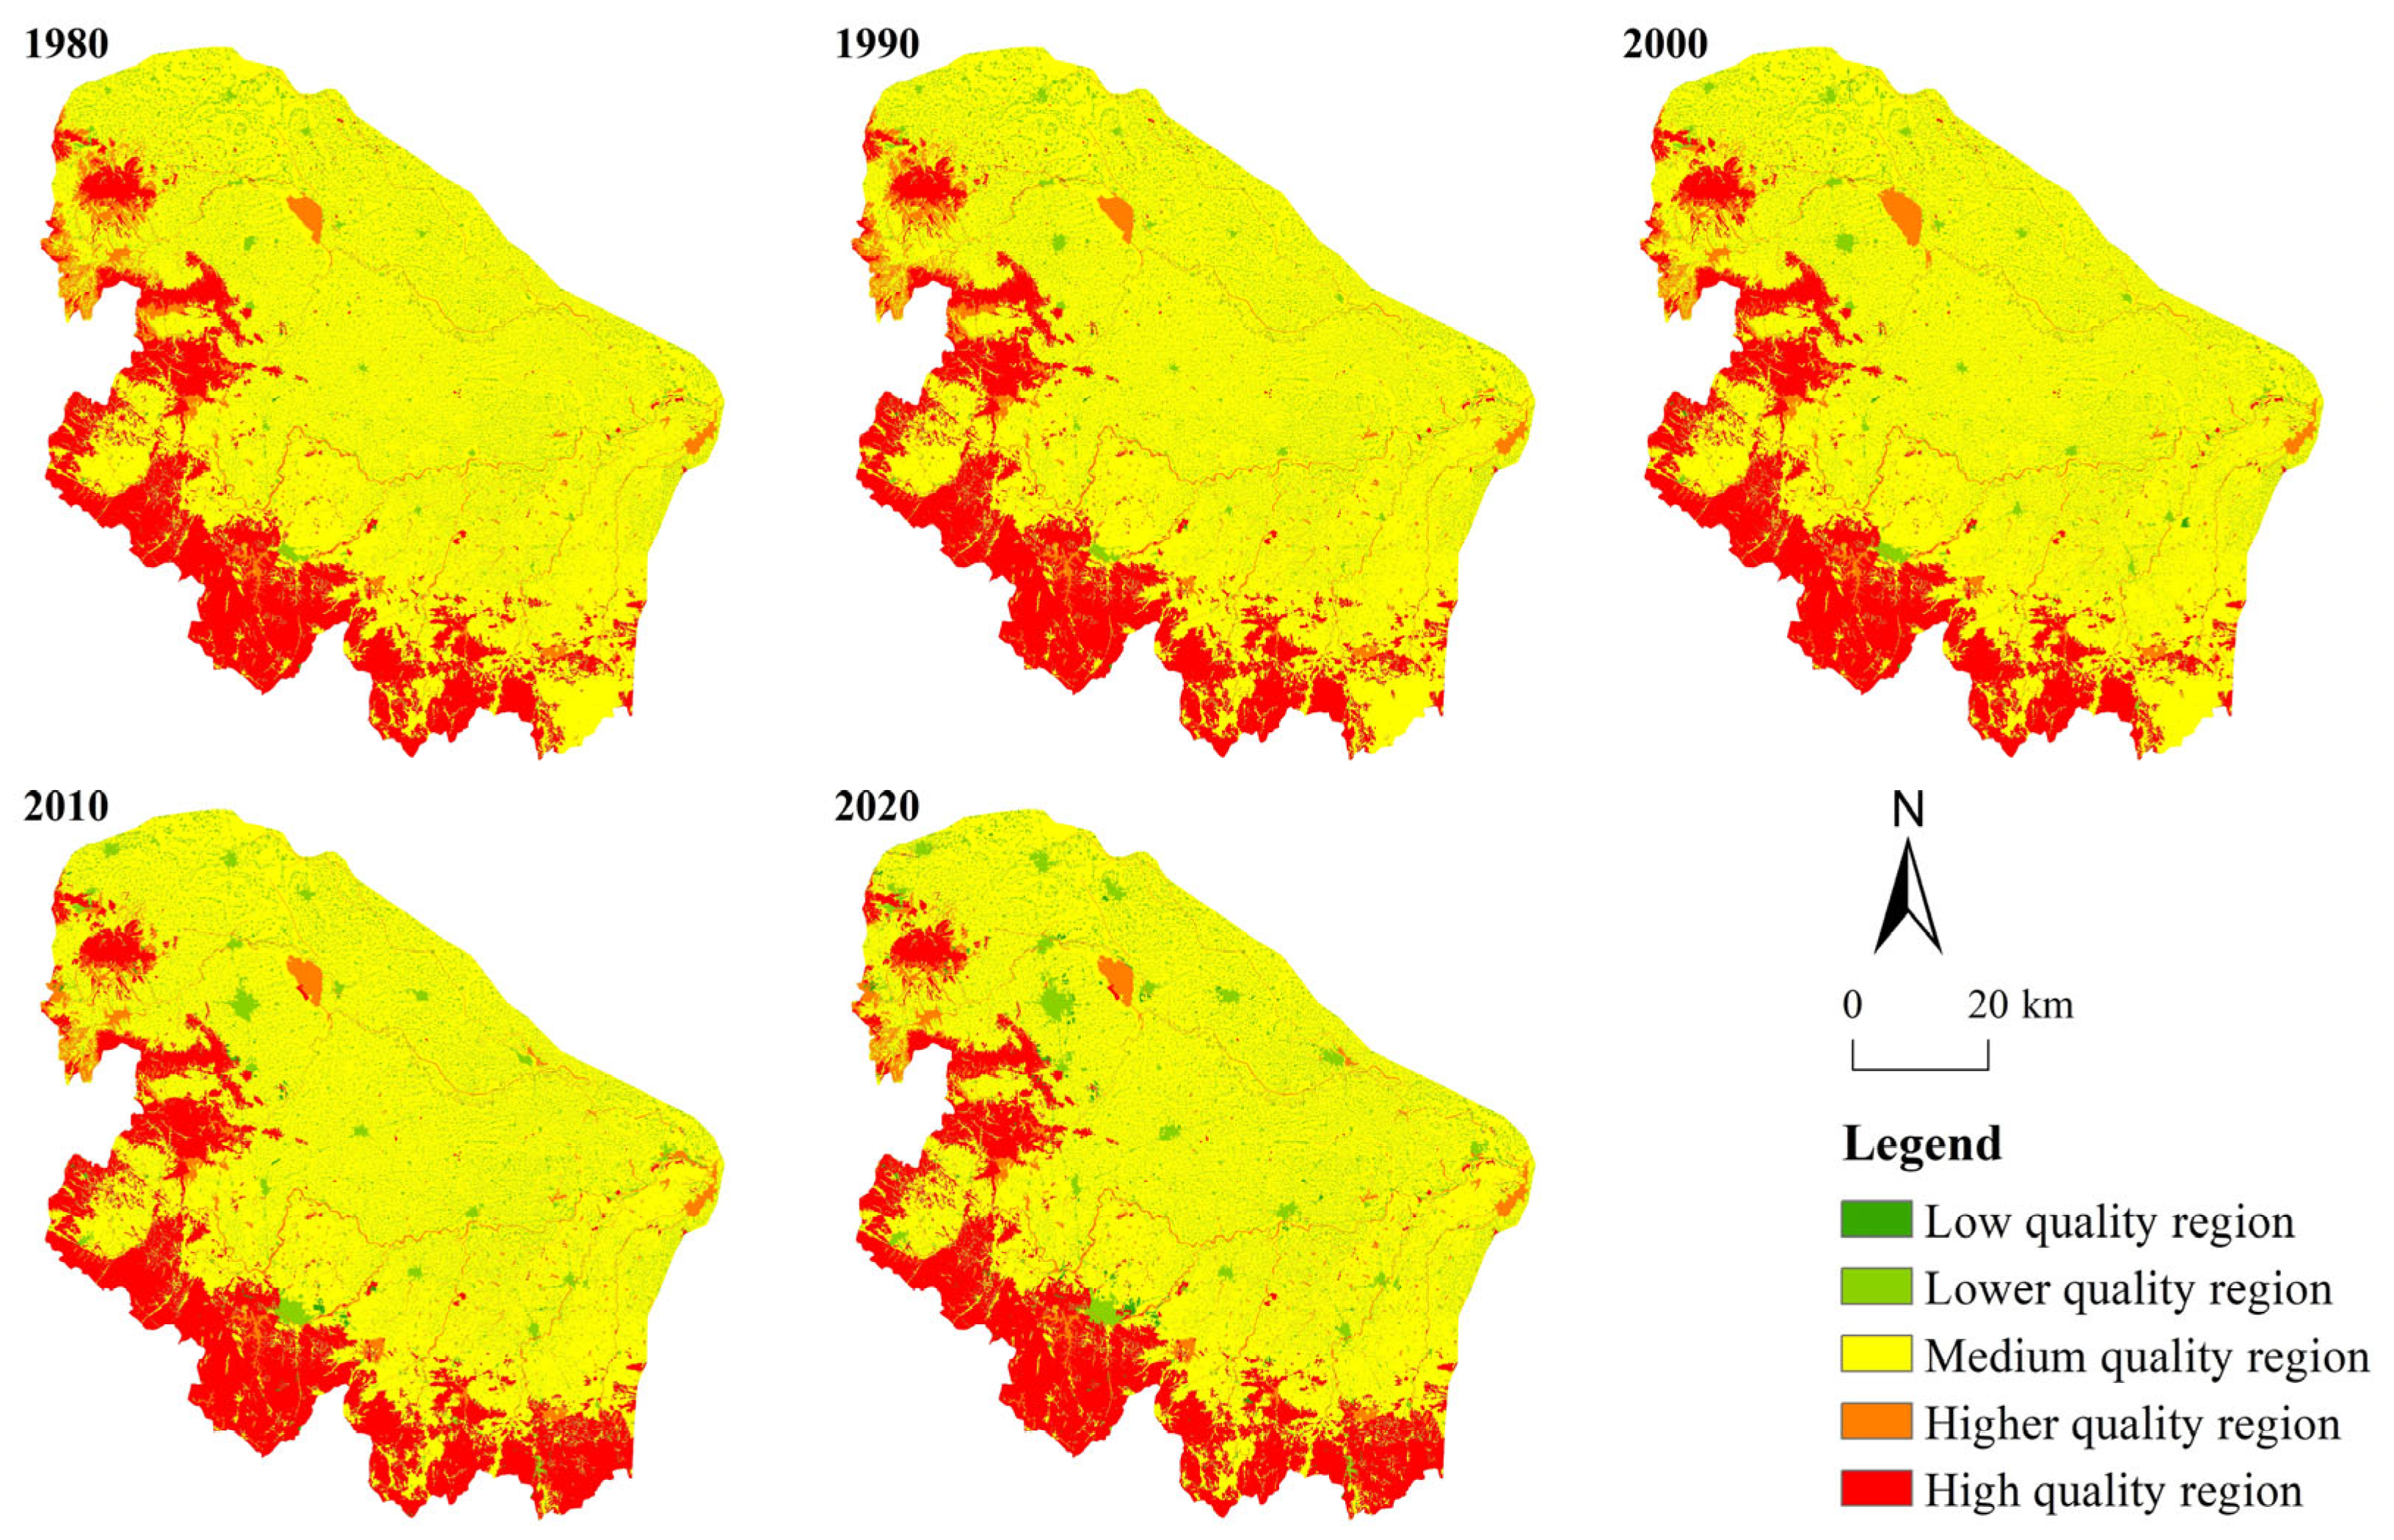
The EV of UHR was calculated by formula (2), and it was divided into low eco-quality (≤0.15), lower eco-quality (0.15~0.20), medium eco-quality (0.20~0.26), higher eco-quality (0.26~0.56) and high eco-quality (>0.56) by ArcGIS natural breakpoint method. The EQ distribution map of UHR from 1980 to 2020 was obtained (
Figure 5). The UHR is mainly dominated by medium eco-quality areas; the areas above the medium level are mainly distributed in the northwest to southeast regions, which are basically ecological land. Among them, the FE is a high eco-quality area, and the grassland and WE are high eco-quality areas. The lower eco-quality areas are mainly UL and RL, and the low eco-quality areas are less, mainly IMP and OE. From 1980 to 2020, the lower eco-quality area increased by 530.15 km
2, the medium eco-quality area decreased by 1043.83 km
2, and the other three types of area increased by no more than 230 km
2. From 1980 to 2000, the environmental quality index of the UHR continued to decline, from 0.3698 in 1980 to 0.3679 in 2000, and from 2000 to 2010, EV rose to 0.3769. The reason may be that the policy of returning farmland to forest and grassland has played an effective role. By 2020, EV has fallen to 0.3750. It can be seen that the eco-environment in UHR has been effectively improved in recent years, but the future eco-environment needs to be maintained and further improved.
Figure 6 shows the change in EQ from 1980 to 2020. It can be seen that the change in EQ from 1980 to 1990 was not obvious, and the change in EQ from 1990 to 2000 was mainly distributed in the northwest and south, and the change was small. From 2000 to 2010, EQ changed greatly; the most obvious was the improvement of EQ in the south, and the deterioration of EQ was mainly distributed in the middle, and the range was scattered. From 2010 to 2020, the deterioration area of EQ was more than the improvement area, and the improvement of EQ was mainly distributed in the southwest. On the whole, the improvement of EQ is mainly in the southern and northern mountains and waters, while the deterioration of EQ is mainly in the central plains, mostly living land occupying production land.
3.2.2. Ecological Contribution Rate Analysis
EV can only judge the environmental situation of the region as a whole. According to Formula (2), this paper calculates the variation in ecological contribution caused by the mutual conversion of each land type in UHR from 1980 to 2020 (
Table 5). Among them, the positive value of LEI indicates the improvement of environmental quality, and the negative value of the ecological contribution rate indicates the deterioration of EQ. At the same time, the proportion of LEI of all land conversions is obtained and used to indicate the impact of land conversion on ecology. Because there are many land conversions and some of the ecological contribution rates are small, this paper mainly selects the land conversion with a large ecological contribution rate for analysis.
From the perspective of environmental quality improvement, from 1980 to 1990 and 1990 to 2000, the largest proportion of environmental quality improvement was the conversion of AP to WE; the former accounted for 61.94%, and the latter accounted for 43.77%. At the same time, from 1990 to 2000, the conversion of GE to FE accounted for more than 40%. The land use change types that occupied a large proportion in the improvement of environmental quality from 2000 to 2010 and 2010 to 2020 were the same, and the transition of AP to FE occupied the largest proportion, with the former accounting for 77.98% and the latter accounting for 58.12%, while the contribution rates of the other two land use conversion were no more than 20%. From the perspective of environmental quality deterioration, WE was mainly converted into AP from 1980 to 1990, and FE was mainly converted into AP from 1990 to 2000, accounting for more than 50%. From 2000 to 2010, there were the most types of land change in the deterioration of environmental quality, and the proportion was relatively small. Among them, the highest proportion was the conversion of FE to AP, but it only accounted for 37.24%, and the rest of the land conversion did not exceed 20% of the deterioration of environmental quality. From 2010 to 2020, the largest proportion of EQ deterioration was the conversion of FE into AP. Therefore, land production and ecological transformation are the main causes of changes in environmental quality.
3.3. Analysis of the Change in PLE in UHR Under Multiple Scenarios in the Future
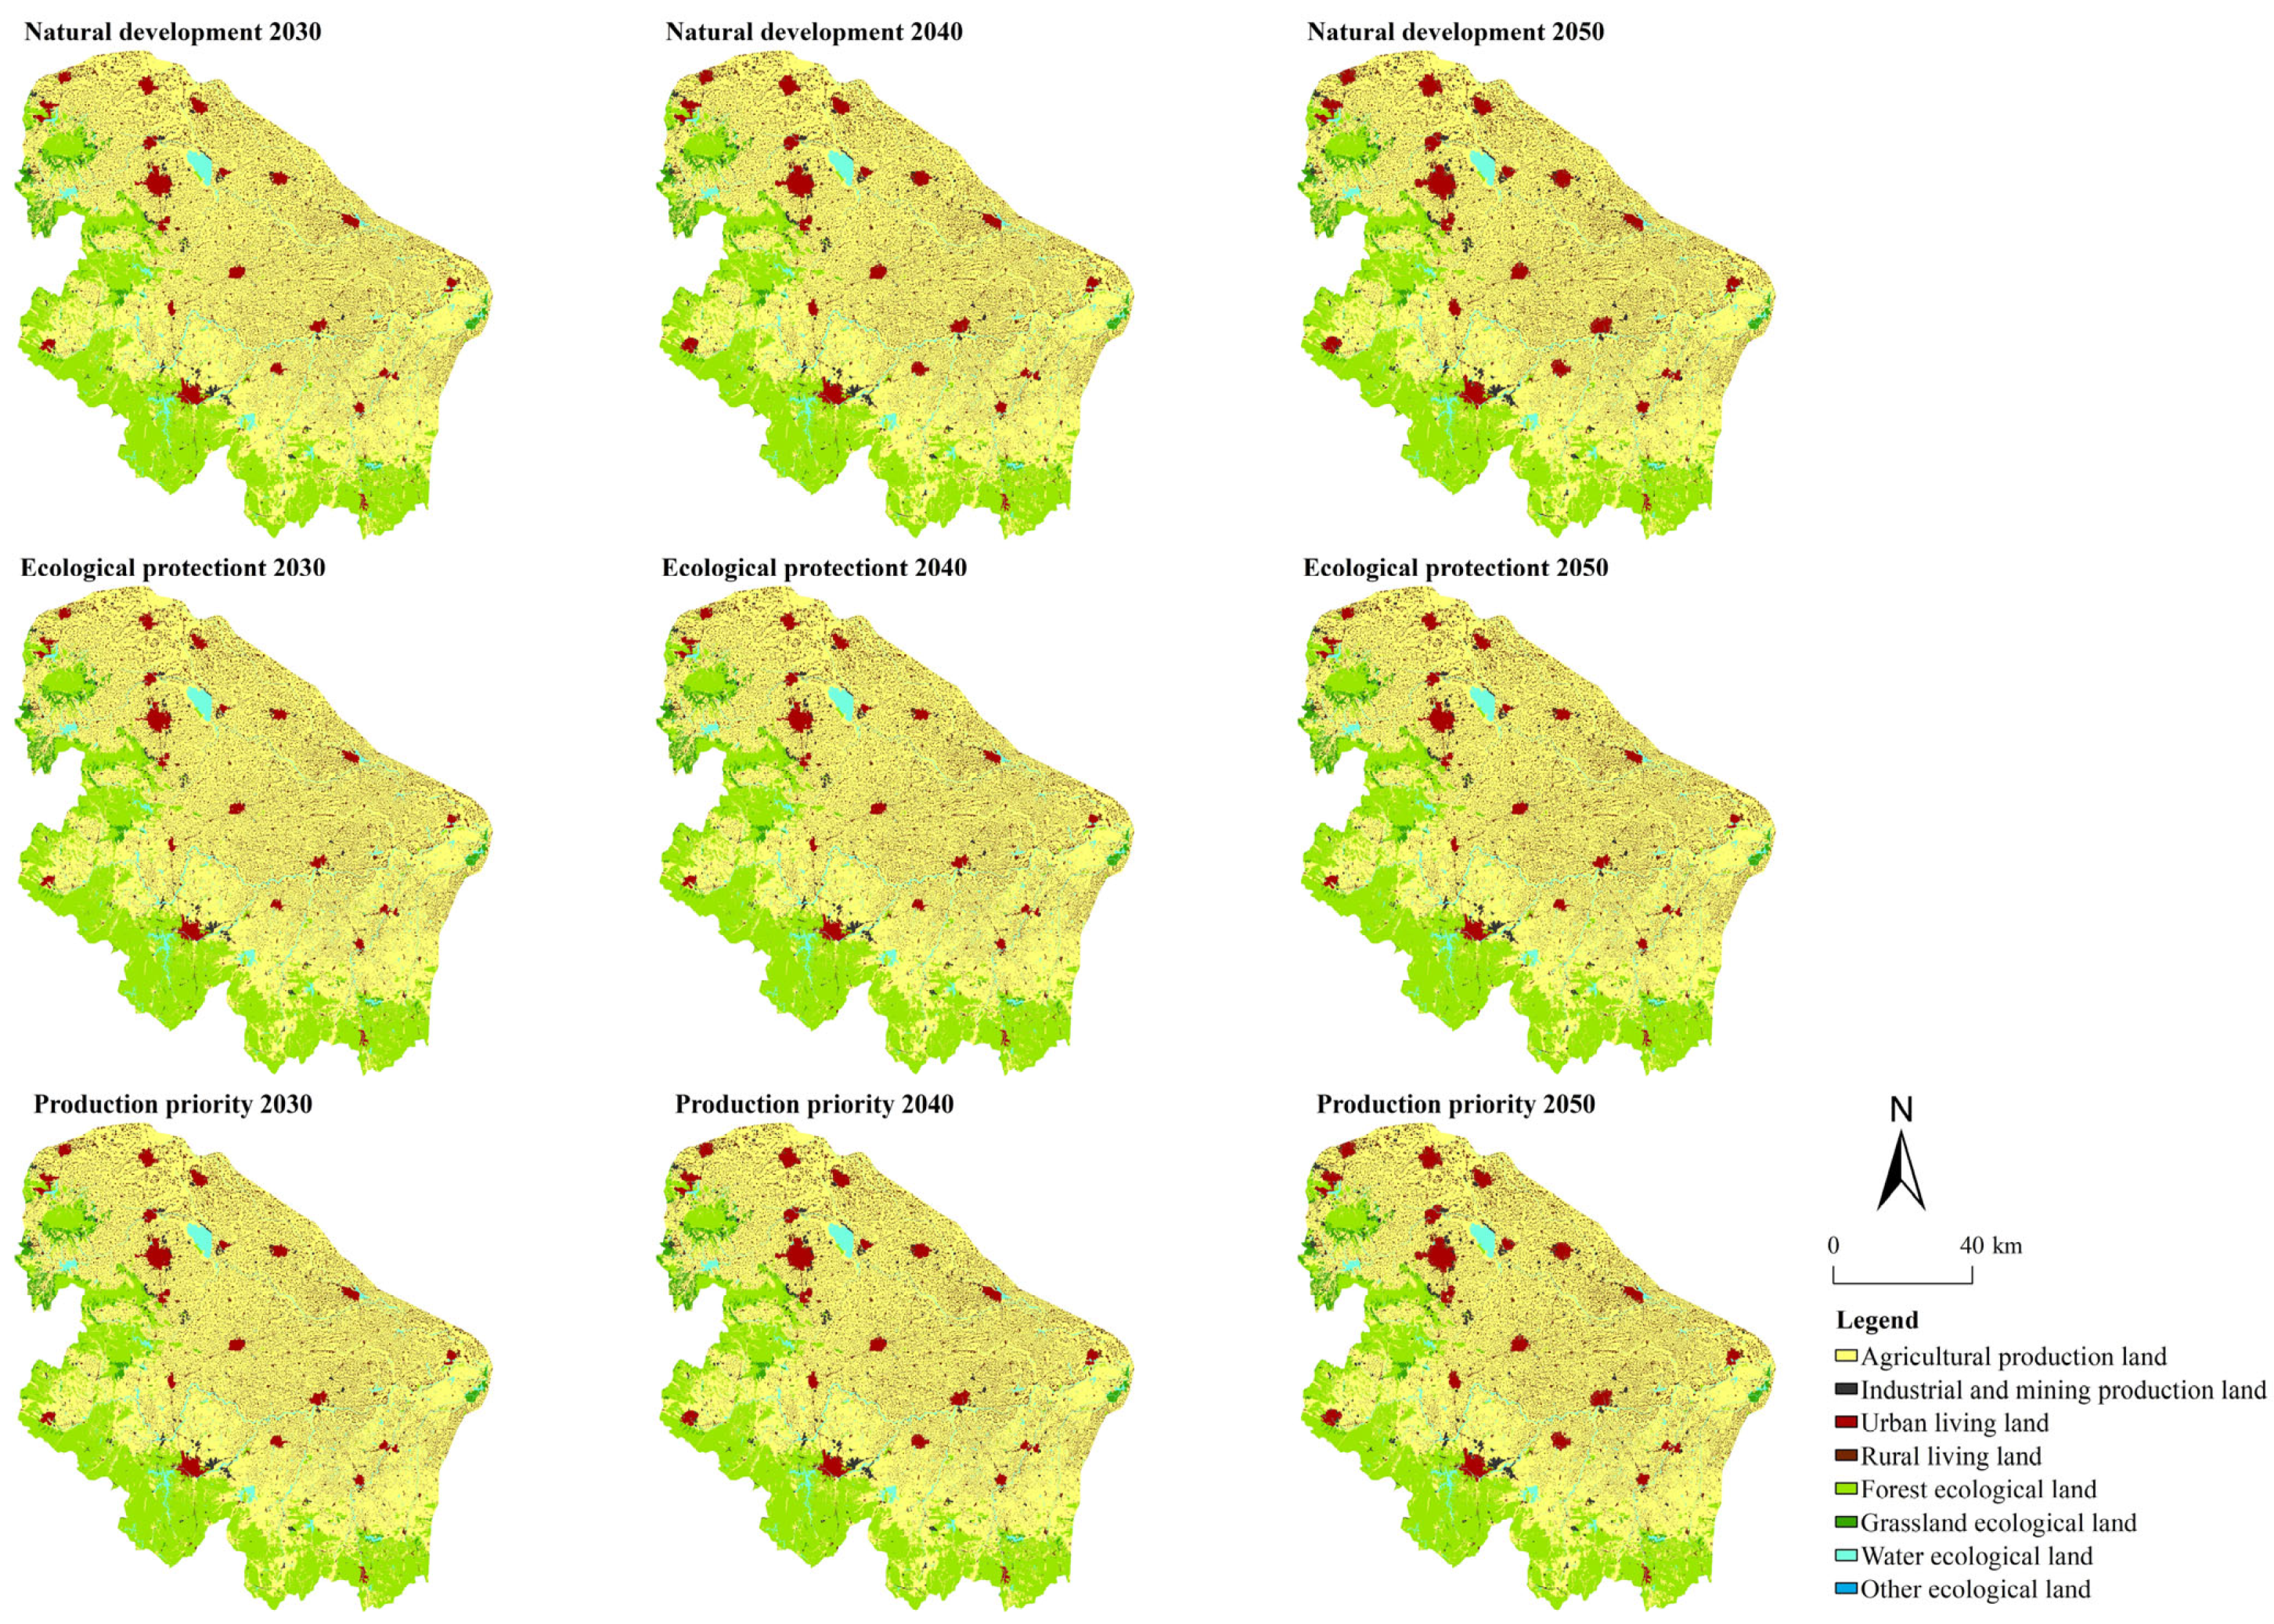
Based on land use data of the UHR from 2010 to 2020, this study uses the PLUS model to simulate and predict land use type data of the UHR from 2030 to 2050 under three scenarios, PLE in the UHR under three future situations is obtained (
Figure 7).
Under the business-as-usual situation, the production space area in the UHR continued to decrease; from 2020 to 2050, a total of 528.52 km2 was reduced, of which AP continued to decrease, while IMP continued to increase from 2020 to 2050. The living space area kept increasing from 2020 to 2050, and the urban and RL increased by 699.36 km2. From 2020 to 2050, the ecological space area kept reducing, but the degree of change was smaller than that of production and living space, with a total decrease of 170.85 km2, of which FE decreased the most.
Under the ecological protection situation, the production space area in UHR keeps reducing while the living and ecological space area continues to increase. From 2020 to 2050, the AP in the production space decreased by 819.80 km2, while the IMP increased by 147.70 km2. From 2020 to 2050, the living space area increased by 405.18 km2, and the urban and RL increased. The ecological space area continues to grow, which is in line with the development of this scenario. From 2020 to 2050, the ecological space area has increased by 266.92 km2. Among them, the increased area of FE was the largest, and the other three types of ecological land have changed little.
In a production priority situation, the production land is mainly developed, but due to social development, the production space area is still reduced. From 2020 to 2050, the production space area in the UHR decreased by 435.09 km2. However, compared to the other two scenarios, the declining trend of production space in this scenario was effectively alleviated. The living space area kept increasing, with an augment of 702.40 km2 from 2020 to 2050, of which the increase in urban and RL exceeds 300 km2. The ecological land area continued to reduce; from 2020 to 2050, a total of 267.31 km2 was reduced, of which the ecological land of forest land decreased by more than 200 km2, and the remaining three kinds of ecological land did not exceed 32 km2.
3.4. Analysis of Eco-Environmental Effects in the UHR Under Multiple Scenarios in the Future
3.4.1. Eco-Environment Quality Analysis
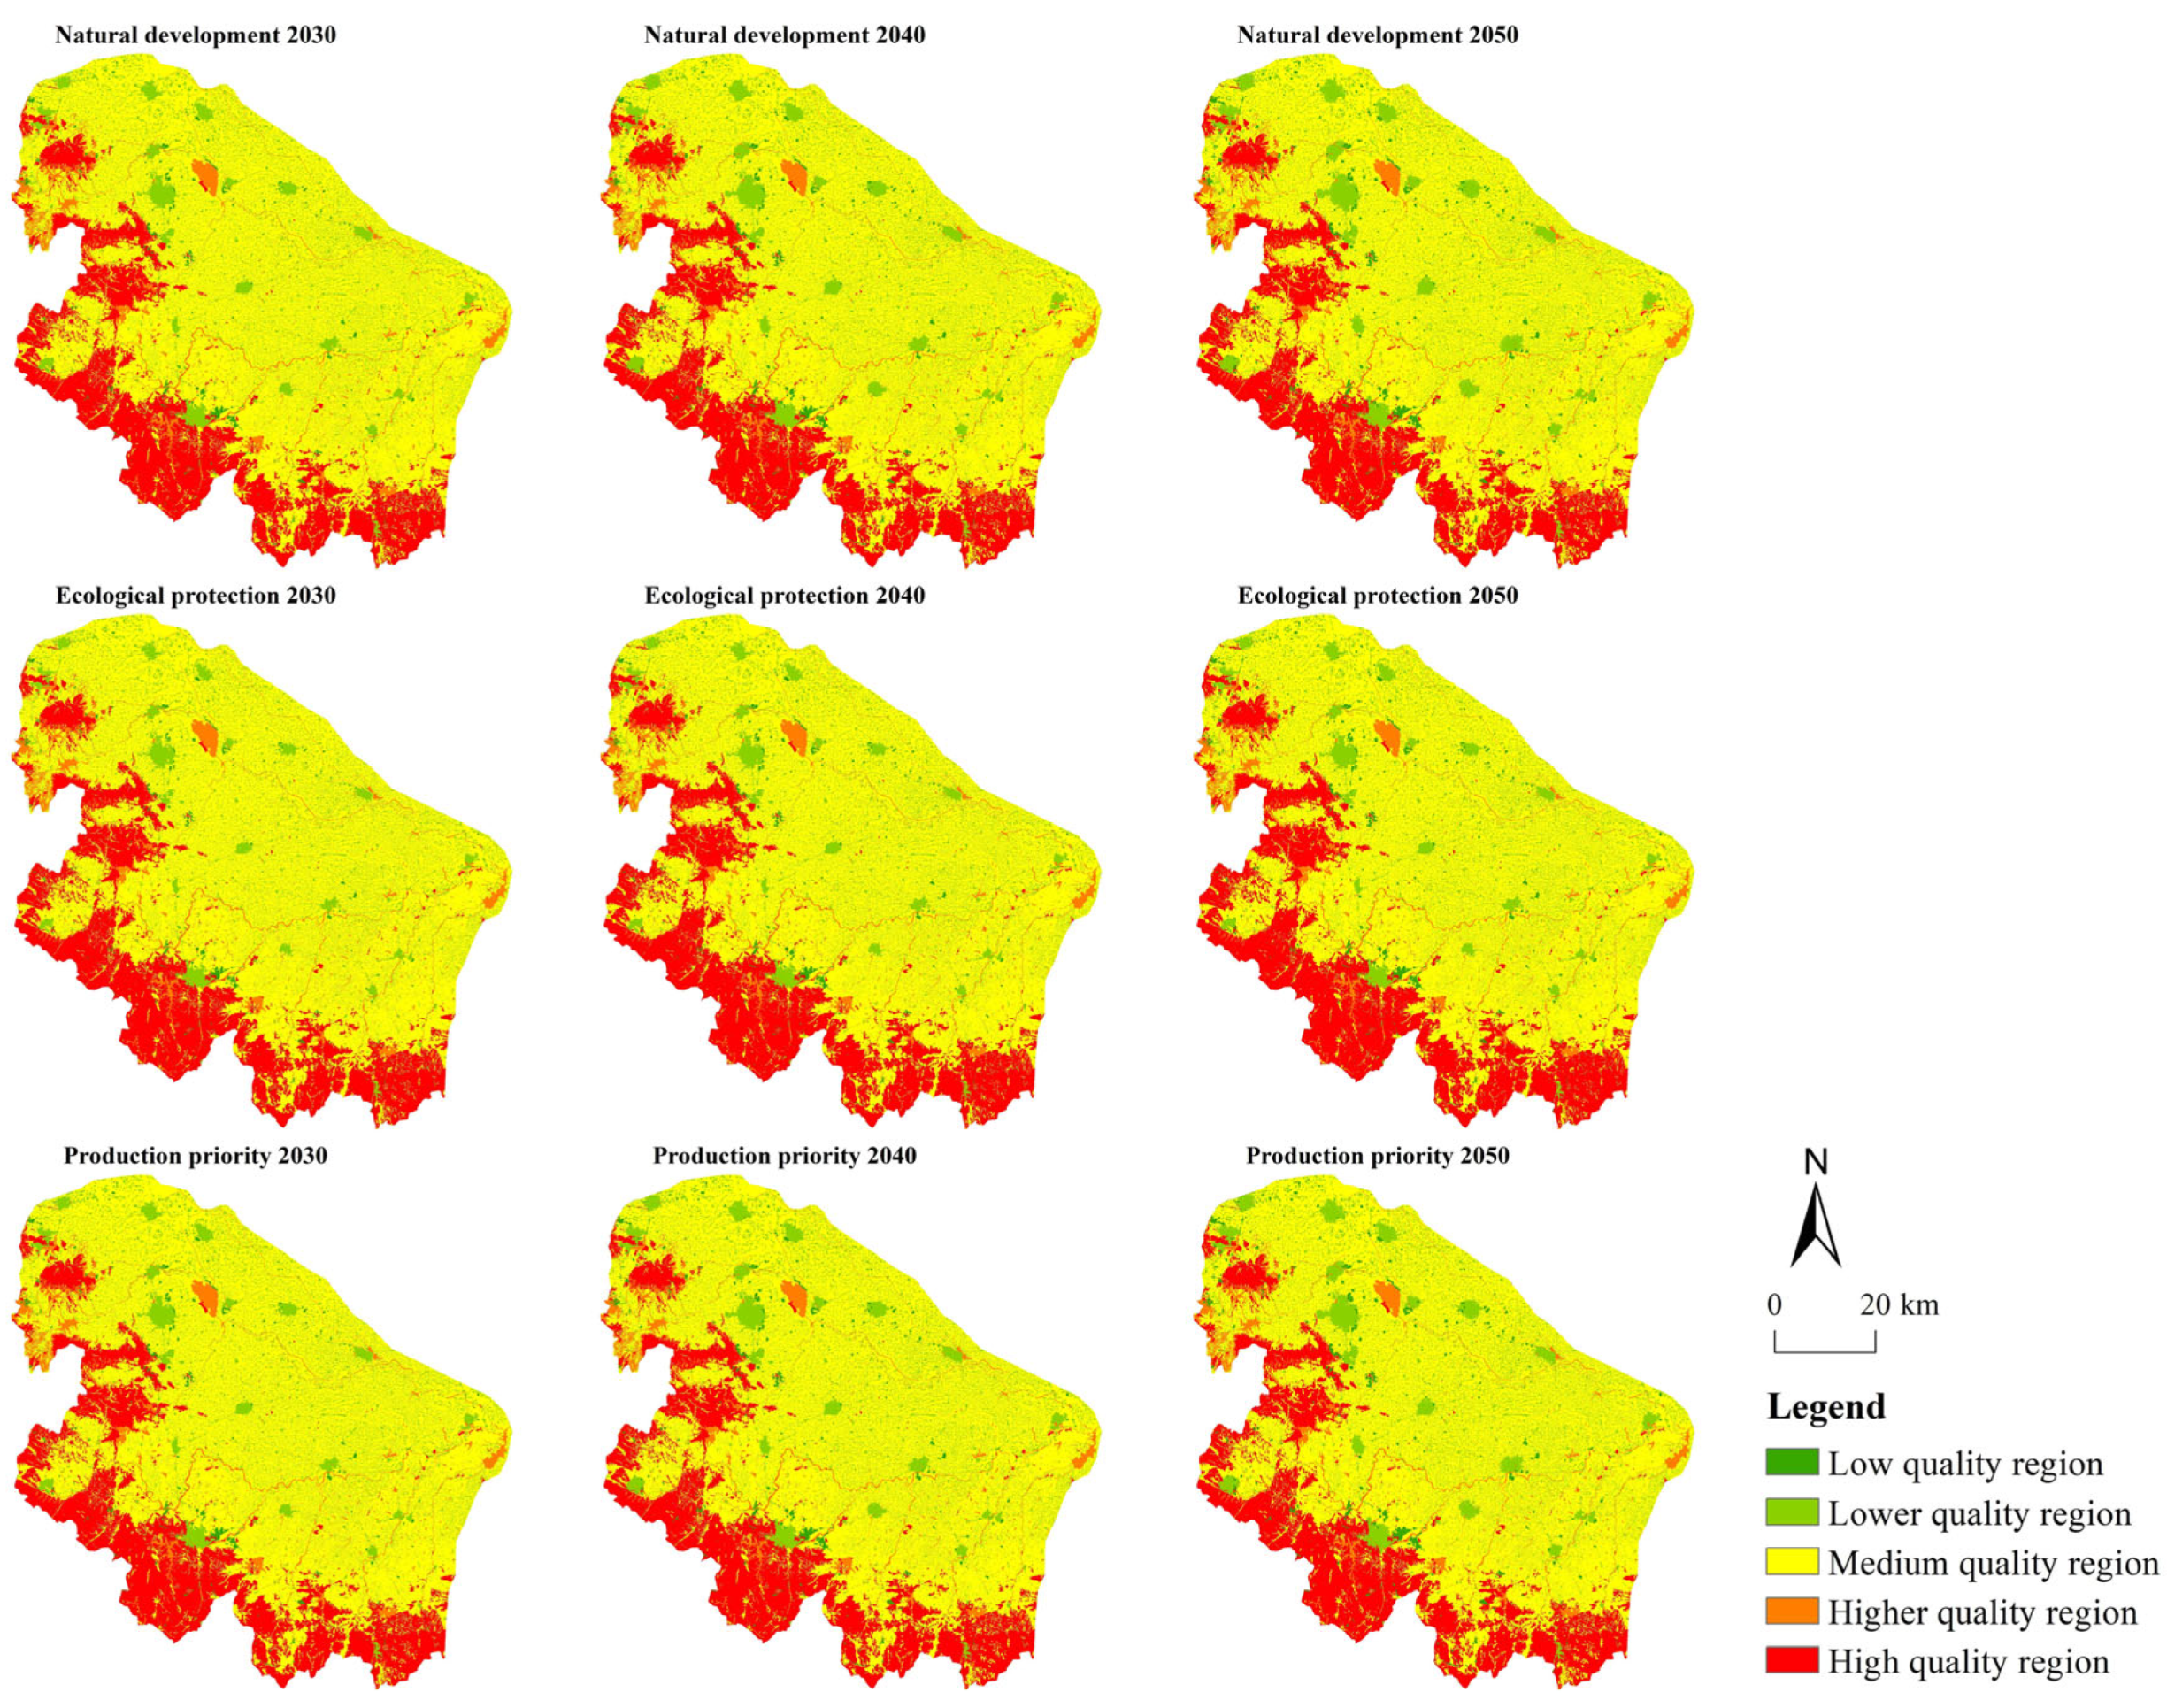
The EV of UHR under the three scenarios was calculated by Formula (2). According to the EV, the EQ distribution maps of the three scenarios from 2030 to 2050 were obtained (
Figure 8). The spatial distribution of EQ in UHR remained mostly unchanged across the three scenarios. Under the business-as-usual scenario, from 2020 to 2050, the EV of UHR continued to decline, from 3.750 in 2020 to 0.3698 in 2050. The expansion of the lower eco-quality area is more obvious from the map. From 2020 to 2050, the area of the lower eco-quality area increased by 699.37 km
2, while the low eco-quality area increased by 212.56 km
2. On the contrary, the high eco-quality and higher eco-quality areas were reduced, and the medium eco-quality area decreased by 741.50 km
2.
Under the ecological protection scenario, the EV of UHR continues to rise, from 0.3750 in 2020 to 0.3786 in 2050. The ecological protection scenario is the best EQ of the three scenarios, and it is also the only scenario in which EV continues to rise. Under this scenario, the high eco-quality and high eco-quality areas increased. From 2020 to 2050, the high eco-quality area increased by 266.12 km2, and the higher eco-quality area has changed weakly. The low eco-quality area and the lower eco-quality area both had a growth of 147.62 km2 and 405.18 km2, and the medium eco-quality area decreased by 819.80 km2. This shows that under this scenario, the expansion of low eco-quality areas has been effectively alleviated, and the expansion of high eco-quality areas has also gradually improved the EQ in UHR.
Under the production priority scenario, the EV of UHR continued to decline, from 0.3750 in 2020 to 0.3682 in 2050, which was the lowest in the three scenarios. From 2020 to 2050, the expansion area of low eco-quality and lower eco-quality areas in UHR reached 924.98 km2, the high eco-quality area decreased by 222.58 km2, the higher eco-quality area decreased far more than that of natural situation, and the medium eco-quality area decreased by 658.10 km2. It can be seen that in this scenario, the low eco-quality areas are too much outward expansion, crowding out the medium eco-quality and high eco-quality areas, resulting in a gradual decline in the EQ in UHR.
In order to understand the spatial changes in EQ from 2020 to 2050 under various scenarios, the EQ in 2020 and 2050 are superimposed to obtain the EQ changes from 2020 to 2050 (
Figure 9). In the business-as-usual scenario, there were more areas with deteriorating EQ in the UHR from 2020 to 2050 than those with improved EQ. The areas with deteriorating EQ are scattered throughout the UHR, mainly living land, and a small number of areas in the south have improved ecological environment quality. Under the ecological protection situation, from 2020 to 2050, the improvement areas of EQ in the UHR are mainly distributed from the west to the southern edge of the UHR, while the deterioration areas are mainly distributed in the north. Under the production priority scenario, from 2020 to 2050, the EQ deterioration area in UHR will be far more than the improvement area, mainly scattered everywhere.
3.4.2. Ecological Contribution Rate Analysis
According to Formula (3), this paper calculates the change in UHR’s ecological contribution from 2020 to 2050 (
Table 6). In the business-as-usual scenario, the conversion of AP to FE accounted for 85.99%, which was the main reason for the improvement of EQ. The other three types of land conversion accounted for no more than 5% of the improvement of EQ. In the deterioration of EQ, the conversion of FE to AP accounted for 55.78%, followed by the conversion of AP to UL and IMP, accounting for about 12%. In the ecological protection scenario, the conversion of AP to FE is the main factor for the improvement of EQ. The conversion area is 262.14 km
2, accounting for 96.53%. In the deterioration of EQ, the conversion area of AP to RL and IMP is 301.16 km
2 and 111.54 km
2, and the contribution rate of both is more than 40%. Under the production priority scenario, there are many types of land use changes to improve EQ, and the contribution rate is not more than 30%. Among them, grassland, WE, and IMP are converted into FE, accounting for more than 20%, and the rest accounts for less than 20%. In the deterioration of EQ, the conversion of FE into AP accounts for 55.50%, and the remaining four land use changes do not exceed 12% of the deterioration of EQ. It can be seen that the changes in AP and FE are the main reasons for the improvement and deterioration of EQ. At the same time, the proportion of ecological contribution rate is not necessarily large, which is also related to land use types.
In general, under the improvement of the eco-environment, the ecological contribution rate of business as usual and production priority scenarios is mainly in the range of 0.000028–0.000975, and LEI of ecological protection is mainly in 0.004818. The ecological contribution rate of business as usual and production priority scenarios under the deterioration of eco-environment is mainly in 0.000752–0.003838, and LEI of ecological protection is mainly in 0.000225–0.000608. It can be seen that the ecological protection scenario has a higher ecological contribution rate in the improvement of the eco-environment than the other two scenarios, while the ecological contribution rate in the deterioration of the ecological environment is lower than the other two scenarios.


