Abstract
Air-pollution-related issues, including the rise in carbon dioxide emissions, require, among others, solutions that include using electric vehicles supplied by the energy obtained from renewable sources. These solutions also include the infrastructure for electric vehicle charging. However, the existing systems mostly employ independent subsystems (such as subsystems for the control of electric vehicle chargers, subsystems for the control of smart battery storage, etc.), leading to hardware redundancy, software complexity, increased hardware costs, and communication link complexity. An architecture of a system for remotely controlling a renewable-energy-source-powered sustainable electric vehicle charging station, which overcomes these deficiencies, is presented in this paper. Consideration is also given to the sizes and combinations of different parts (renewable sources, batteries, chargers, etc.) for various purposes (households, replacing current gas stations, big parking spaces in shopping centers, public garages, etc.). The ability to integrate a wide range of features into one system helps to optimize the use of several subsystems, including the ones that control electric vehicle chargers remotely, smart storage battery remote control, smart electricity meter remote control, and fiscal cash register remote control, creating a sustainable and economically efficient solution. In this manner, consumers of electric vehicles will have easier access to renewable-energy-powered sustainable charging stations. This helps to reduce the amount of air pollution and its harmful effects, including climate change, by promoting the use of electric vehicles that are powered by renewable energy sources. The energy independence and sustainability of the station were considered in such a way that the owner of the station achieves maximum economic benefits.
1. Introduction
The importance of obtaining energy from renewable sources (hydroelectric, wind, and photovoltaic solar thermal power plants) is growing as air-pollution-related issues become more pressing [1]. The significant increase in carbon dioxide emissions as a result of fossil fuel use is one of the main causes of air pollution [2]. Using renewable energy sources is the only way to lower the amount of toxic gas released into the atmosphere. In this sense, by using fewer fossil fuels, the governments of many nations have pledged to cut back on the amount of carbon dioxide released into the atmosphere in the upcoming decades [3]. Parallel to this process, the proportion of energy derived from renewable sources will rise in order to fulfill the continuously rising needs for energy. The prices of parts that are essential to some renewable-energy-source power plants are declining because investments in the research and development of the corresponding technologies are growing. As a result, the cost of kilowatt-hours of electricity generated from renewable energy sources is rising relative to that of kilowatt-hours obtained from fossil-fuel-powered power plants.
Exhaust emissions from internal combustion vehicles are the main source of urban environmental pollution and greenhouse gases [4]. Because of the massive rise in the number of cars produced and used worldwide, air pollution, particularly, harmful PM particles, is becoming a bigger challenge and problem [5]. These particles are produced by the combustion of gasoline and diesel cars. It is predicted that, by 2030, the number of cars sold will have nearly doubled from 2016 levels in some of the world’s most populous nations. For instance, the number of automobiles sold in India in 2016 was approximately 21 million, and, by 2030, it is anticipated to be almost 10 times larger [6]. Similar to that, the transportation sector of China has been experiencing astonishing growth, resulting in severe environmental issues [7]. Elevated levels of air pollution, particularly in nations experiencing rapid economic growth (like China and India), contribute to a rise in both the number of pollution-related deaths and health issues among the populace.
The main ways that the issues mentioned can be resolved are by using more renewable energy sources and by using more electric vehicles, which require electricity generated from renewable sources. Put another way, a large decrease in air pollution would be made possible by the use of electric cars that are powered by chargers that draw power from renewable sources. As a result, managing renewable resources that are fueled by electric vehicle charging stations is necessary.
Solutions dealing with individual subsystems are known from the literature. For example, the hardware and software of the terminal in a system for the remote control of electricity meters are presented in [8], while the hardware and software of a system for the remote control of fiscal cash registers are described in [9]. Systems for the remote control of electric vehicle chargers are presented in [10,11,12]. A review of a solar-powered electric vehicle charging system is presented in [13], while a system for the remote control of smart batteries is described in [14]. The scheme of shared, direct-current, fast-charging stations to address electric vehicle charging issues in old residential communities is described in [15]. A system with electric vehicles, photovoltaic loads, and their influence on the power system when it is connected to a grid is presented in [16]. A system for plug-in electric vehicles and battery chargers is described in [17]. A solution for an electric vehicle charging platform based on an advanced metering infrastructure is proposed in [18]. The real-time monitoring of a solar battery charging station is described in [19]. A bidirectional, highly efficient electric vehicle DC charger integrated within a photovoltaic power system is presented in [20]. A photovoltaic charging station architecture, using a combination of a Z-source boost converter, based on the battery charging strategy, with a bidirectional PWM inverter–rectifier, based on the vehicle-to-grid strategy in smart grids, is proposed in [21]. A solar-powered electric vehicle charging station placed in a parking lot of a car-share service is described in [22]. A real-time energy management system for electric vehicle charging using photovoltaic and energy storage, connected to a microgrid, is presented in [23]. When considering the current solutions for the kind of system presented in this paper, it is important to keep in mind that the majority of comparable systems for energy management are found in commercial and industrial customers [24] or smart buildings [25]. These systems usually consist of smart meters, chargers for electric cars, and renewable energy sources, as well as the smart batteries and corresponding algorithms that save power [25]. Descriptions of some preliminary research findings are given in [26,27], which are included in this paper.
However, these existing systems mostly employ independent subsystems (such as the subsystem for the control of electric vehicle chargers, the subsystem for the control of smart battery storage, the subsystem for the control of smart meters or the subsystem for control of fiscal cash registers, etc.), or an integrated solution that comprises only a few of these subsystems, leading to hardware redundancy, software complexity, increased hardware costs, and communication link complexity.
The innovative contributions of this paper can be summarized as follows:
- The integration of four subsystems—the subsystem for the remote control of electric vehicle chargers, the subsystem for the remote control of smart batteries, the subsystem for the remote control of smart meters, and the subsystem for the remote control of fiscal cash registers—into one system, creating a sustainable and economically efficient solution with a wide range of features, optimizing the use of different subsystems and achieving dynamic energy optimization. This integrated solution allows for the elimination of the hardware redundancy and the reduction in software complexity of the system, as well as the reduction in hardware costs and communication link complexity.
- The analytical description of the sizing process for this system.
- Confirmation of the obtained results by appropriate simulations using HOMER software (Version 2.68 beta), solving various general problems for the optimal sizing of a microgrid under various constraints.
The architecture and sizing of the remote control system for a sustainable energy-independent electric vehicle charging station that runs on renewable energy sources will be described in this paper. The system architecture will be presented in Section 2, and subsystems will be described in Section 3, while an example of a synchronized decision-making process at the level of the integrated system for the remote control of a renewable-energy-powered station for electric vehicle charging will be presented in Section 4. Section 5 contains a comparison of the electric vehicle charging station proposed in this paper with other electric vehicle charging station solutions. Renewable energy sources, and types of electric vehicle chargers and batteries themselves will be described in Section 6. The categories of electric vehicle charging stations will be presented in Section 7, the sizing of the residential stations will be shown in Section 8, and, in Section 9, energy independence and sustainability will be discussed. Finally, the conclusion with a brief summary of the main findings from this paper will be presented in Section 10.
2. System Architecture
A block diagram of the architecture of a system for the remote control of a renewable-energy-powered, sustainable, energy-independent electric vehicle charging station is shown in Figure 1. In this diagram, both lines and arrows represent communication lines, i.e., communication signals. Therefore, this diagram illustrates the signals within the system.

Figure 1.
Block diagram of the architecture of a system for remote control of renewable-energy-source-powered, sustainable, energy-independent station for electric vehicle charging.
One important component of the system is the remote control terminal for the renewable-energy-powered electric vehicle charging station. It can communicate with other smart devices such as fiscal cash registers, smart meters, smart batteries, and electric vehicle chargers. The physical location of each of these system components is within the electric vehicle charging station. Therefore, a single device can perform the functions of multiple unique terminals, such as the remote control terminals of fiscal cash registers, terminals for the remote control of smart meters, terminals for the remote control of smart batteries, and terminals for the remote control of electric vehicle chargers. Moreover, the previously mentioned terminal can transfer the data stored in these peripheral system components—such as smart meters, cash registers, smart batteries, and electric vehicle chargers—as well as managing their settings and monitoring and enabling their additional processing.
Platforms like the one for electric vehicle charger users, which allows electric vehicle owners to access all relevant information about chargers, and the electricity trading platform, which facilitates electricity trade through the system, can also access this data. Additionally, the owner of the electric vehicle charging station, the Tax Administration information systems, and the electricity distribution system operator also have access to the aforementioned data.
This makes it possible for electricity suppliers, utility providers, regulatory agencies, and commercial and industrial consumers (who may also be energy producers) to collect vast amounts of data and to use cutting-edge algorithms and artificial intelligence technologies to analyze it. The intelligence and information gained can be used to launch the energy system more quickly, accomplish a variety of savings, and enable creative smart energy services. It can also be used to make better use of the distribution network by reducing or preventing outages through early anomaly detection and preventive maintenance [24].
If the facility already has an Internet connection, communication between the terminal and the aforementioned information systems and platforms can be carried out through the existing GSM or GPRS or 3G or 4G or 5G communication modem, or via the built-in Ethernet port. TCP/IP is the underlying protocol, while, at a higher level, primarily unique and non-standardized protocols are implemented for each information system or platform independently.
A suitable communication port, such as RS232, RS485, or a similar interface, is used to facilitate communication between the terminal and all of the system’s peripheral components. Some wireless technologies, such as LoRa and Zigbee, may potentially be adopted for this in the future. Each device uses a unique protocol defined by its manufacturer; these protocols are typically non-standardized. The DLMS/COSEM is a standardized protocol used by smart meters.
3. Description of Subsystems
Four subsystems make up the system for the remote control of the renewable-energy-powered, sustainable, energy-independent station for electric vehicle charging: the subsystem for controlling electric vehicle chargers remotely, the subsystem for controlling smart batteries remotely, the subsystem for controlling smart meters remotely, and the subsystem for controlling fiscal cash registers remotely.
3.1. The Subsystem for Remote Control of Electric Vehicle Chargers
The subsystem is composed of electric vehicle chargers, a terminal for the remote control of those chargers, and a platform for electric vehicle charger users [13]. Electricity for charging electric vehicles comes from a smart battery that stores energy from renewable sources. If needed, additional power can be obtained from the electricity distribution network. The terminal that remotely controls electric vehicle chargers receives data on power availability, charging programs, and prices directly from the chargers themselves. It then transmits these data via the Internet to the platform for users of electric vehicle chargers, making it accessible to end users (i.e., the users of electric vehicle chargers). The subsystem for the remote control of electric vehicle chargers enables the correction of electricity prices at different charging stations with the aid of suitable software algorithms and data exchange between charging stations and user platforms. For example, the price of electricity can be reduced at stations with a high power availability at any given time (thereby encouraging customers to charge their vehicles there), and increased at stations with a lower power availability (thus discouraging charging there). This approach optimizes the overall use of available energy. In the system for electric vehicle charger stations, powered by renewable energy sources, making and implementing such decisions, by using the technologies of artificial intelligence and cutting-edge algorithms, can be transferred to the terminal which has access to all these devices (chargers of electric vehicles, smart meters, smart batteries, and fiscal cash registers) and to the appropriate software platforms and information systems. On the other hand, these decisions in the separate subsystem for the remote control of electric vehicle chargers are created and implemented by the charger’s owner.
3.2. The Subsystem for Remote Control of Smart Batteries
The subsystem is made up of three fundamental parts [14]: terminals for remotely controlling smart batteries, a platform for electricity trading, and smart batteries used for energy storage. Energy obtained from renewable energy sources, such as photovoltaic, wind, hydroelectric, and solar thermal power plants, is used to charge smart batteries for electricity storage. The electricity trading platform receives information from the smart battery remote control terminal about the reserves of the amount of energy stored in the batteries at any given moment. In this way, the owners of electric vehicle charging stations that are temporarily short on energy can purchase energy from renewable energy producers with a surplus of available energy at that time. Similarly, the owners of electric vehicle charging stations with excess energy can sell it to electricity users who are currently experiencing a shortage. Additionally, the owners of electric vehicle charging stations can always purchase excess energy from renewable energy producers at favorable prices (due to the increased supply of produced renewable sources energy at a particular moment), and sell it later, during intervals of shortage, at higher prices. This is possible because energy purchased at any particular time can be stored in smart batteries. After the purchase of electricity from renewable sources, the terminal for smart battery remote control is responsible for directing the charging process.
The electricity trading platform also enables the electricity suppliers to discharge smart batteries into the power distribution network when electricity prices are high or charge them from the power distribution network when prices are low. To ensure the electricity trading platform is fully functional, easy to maintain, and cost-effective to operate, a third-party data center with the appropriate computing infrastructure (including servers, data storage devices, and network equipment) is used.
3.3. The Subsystem for Remote Control of Smart Meters
The subsystem is composed of three fundamental parts [28]: smart meters, smart meter remote control terminals, and the electricity distribution system operator’s information system. In addition to measuring the active and reactive energy, smart meters can also measure the electricity quality, record the maximum power over a configurable period, and display the relevant data on-screen. Smart meters ensure meter integrity, support flexible tariff policies, and can be read and adjusted even when de-energized. They record event logs and profiles of the corresponding measured quantities. Smart meters also offer remote functionalities, such as turning consumers on and off and limiting power. To collect data from meters, configure them, set parameters, and manage consumption, the smart meter remote control terminal facilitates communication with the smart meters. However, the terminal also communicates with the electricity distribution system operator’s information system, which manages subsystem components related to smart meter remote control, gathers and stores data, configures smart meters, and generates reports (including those related to communication quality and performance, status parameter analysis, and electricity quality, etc.).
3.4. The Subsystem for Remote Control of Fiscal Cash Registers
Fiscal cash registers, terminals for remote fiscal cash register management, and the Tax Administration’s information system are the components of this subsystem [29]. Fiscal cash registers are capable of storing data in different types of memory (fiscal and operational), printing specific types of data on fiscal receipts, and receiving commands from the cashier via a keyboard. They can also visually monitor the data on recorded transactions. Predefined data categories are grouped, summarized, and presented by the fiscal cash registers. Using the proper input–output port, they can export all relevant data in electronic format. Additionally, fiscal cash registers comply with the necessary security requirements (such as protecting against program and fiscal memory modifications, and preventing counter resets). Taxpayers can remotely access and control fiscal cash registers (including updating article databases, prices, and other relevant parameters) by using the remote control terminal. This terminal enables the programming of article prices and structures into the fiscal cash register. The following data are retrieved by the terminal from the fiscal cash register: the daily report, current turnover, daily turnover (by cashiers and by articles), and fiscal memory contents. The terminal then generates the required reports based on the collected data and sends them to the Tax Administration’s information system. The reports include transaction summaries by tax rate for a given period, reset logs, and tax rate specifications, among other data types received by the Tax Administration’s information system from the remote control terminal. The advanced features include generating various useful reports by leveraging a relational database that consolidates all relevant taxpayer information in one location. Through its information system, the Tax Administration monitors all transactions to ensure timely tax collection.
4. Integrated System
The four subsystems described in the previous section make up the integrated system for the remote control of a renewable-energy-powered, sustainable, energy-independent electric vehicle charging station. The application of an integrated terminal and system brings numerous advantages in comparison to the application of individual terminals and subsystems, such as a lower equipment and exploitation cost, a simpler implementation, and a synchronized decision-making process that takes into account all necessary and relevant information in one central location.
The following diagram illustrates such a situation:
As shown in Figure 2, the decision about selling the energy to the electricity distribution network, or buying the energy from the electricity distribution network is made based on data (electricity price, level of insolation, state of battery charge, and number of cars) collected from different subsystems into one central place. Information about the electricity price is taken from the electricity trading platform, information about the level of insolation is taken from the photovoltaic panels (which provide the energy from renewable sources to the station), and information about state of the battery charge is taken from the subsystem for the remote control of smart batteries, while information about the number of cars is taken from the subsystem for the remote control of electric vehicle chargers.
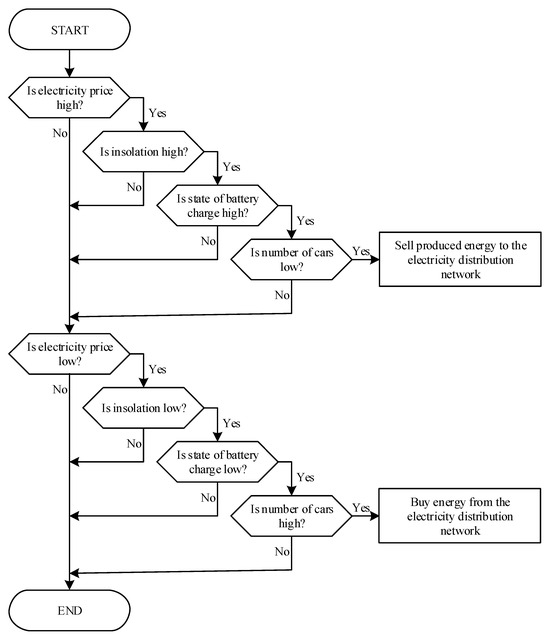
Figure 2.
The example of dynamic decision-making process at the integrated system level.
5. Comparison with Other Electric Vehicle Charging Station Solutions
A comparison of different solutions for electric vehicle charging stations, in terms of available functionalities (remote control of electric vehicle (EV) chargers, remote control of smart batteries (SBs), remote control of electricity meters (EMs), remote control of fiscal cash registers (FCRs), and powering by solar panels), hardware redundancy, and software complexity, has been presented in Table 1.

Table 1.
Comparison of various solutions for electric vehicle charging station.
As can be seen from Table 1, solutions [8,9,10,11,12,14] have low hardware redundancy and low software complexity, but they offer only one functionality. Solutions [16,17,18,19,20,21,22] comprise two different functionalities, but this comes at the cost of increased hardware redundancy and software complexity. Solution [23] comprises three different functionalities, but also has high hardware redundancy and high software complexity, making it a costly and complex solution. The solution for an electric vehicle charging station, presented in this paper, integrates all five functionalities (remote control of EV chargers, remote control of SB, remote control of SM, remote control of FCR, and powering by solar panels) into one system, optimizing the use of different subsystems. This integrated solution achieves the elimination of hardware redundancy, and a reduction in software complexity of the system, as well as a reduction in hardware costs and communication link complexity.
6. Types of Chargers, Renewable Energy Sources, and Batteries
Vehicles can receive electricity from electric vehicle chargers, either as direct current (DC) supply voltage or as alternating current (AC) supply voltage. This energy is controlled within the vehicle to be transformed into the best form suitable for battery charging. Generally speaking, chargers can be categorized into three levels depending on their power, although numerous approaches exist which can succeed at each level.
- Level 1 refers to single-phase chargers (both DC or AC), primarily utilized by residential users or households [30,31]. These chargers, which have an AC voltage up to 240 V and can supply maximum currents between 13 A and 16 A, are typically around 3 kW in Europe. Their power in North America is approximately 1.9 kW, and they can supply maximum currents of 16 A at 120 V of AC voltage.
- Level 2 refers to single-phase (DC or AC) chargers or three-phase (DC or AC) chargers, primarily utilized in public spaces and by industrial users [30,31]. Residential use is represented by these chargers less frequently. This type of charger can supply 80 A of maximum current, at an AC voltage between 208 V–240 V, with a typical power of about 20 kW.
- Level 3 describes DC chargers, primarily utilized in public areas for quick charging, particularly those that are accessible while traveling [30,31]. These chargers have 240 kW of power and can deliver 400 A of maximum current at 600 V DC of maximum voltage. From charger to charger, the voltages and currents differ in their values.
Renewable energy sources produce electricity that can be used again after being created from naturally renewable resources. They come from biomass and biofuel energy, and hydropower, wind, and solar energy. The most effective system uses a hybrid configuration of renewable sources, which combines various types of renewable sources, due to the varying availability of these sources throughout the year and at different times of the day [32]. The following sources can be combined or used to cover the needs of electric vehicle charging stations:
- Photovoltaic panels [33,34,35]—Because they have the greatest potential for use, they are the main power source for electric vehicle charging stations. They obtain electricity from solar energy. Electricity is then utilized to run the station’s batteries and/or chargers. If sufficient solar energy is captured during the day, only that source will be able to supply the station’s entire power needs. The panels are always improving and gaining new features every single day. Currently, a typical panel with 1.7 square meters of area typically has approximately 370 W of nominal power (when operating at maximum power) and produces approximately 40 V of DC voltage.
- Wind turbines [36,37]—They are utilized by electric vehicle charging stations as a secondary source of power. Renewable energy sources, such as wind, are used to generate electricity in regions where wind energy is sufficient to make its use economically feasible. For this reason, compared to photovoltaic panels, their chances of being used in various geographic locations are substantially reduced. Its ability to produce energy even at night gives it an advantage over photovoltaic panels, however. Additionally, solar energy and wind are compatible on a daily basis, as evidenced by the fact that wind usually occurs when solar radiation is low and vice versa. Their dimensions primarily determine their strength. Wind turbines with capacities ranging from a few kW to a few MW are available on the market, and they are manufactured in various ranges. There are currently 5 MW generators as well, since larger and bigger generators are being developed daily.
- Biomass-based generators [38,39,40]—These serve as a backup power supply for electric vehicle charging stations. They produce electricity by converting biomass energy. If there are spatial capacities, it can be used in any location. In case insufficient energy is produced by the photovoltaic panels or wind turbines, these sources are utilized as a supplement. For this purpose, biodiesel generators are also an option.
Electricity is stored in prismatic LiFePO4 (lithium iron phosphate) batteries [41], which belong to the lithium ion family of batteries. These batteries are known for their technological advancement in terms of safety, longevity, and thermal stability compared to other types of lithium ion batteries. The nominal voltage of this battery unit is 12 V. These battery units, which can have an up to 300 Ah capacity and 150 A maximum discharge current, are available on the market. Connecting in raw multiple battery units produces higher voltages, and that naturally makes the obtained battery’s capacity higher. If only the capacity needs to be increased, this can be carried out by connecting battery units in parallel. Fuel cells are an alternative to batteries for the storage of electrical energy. Ammonia and hydrogen fuel cells are available. When a hydrogen cell is being charged, the electricity produced is utilized to extract hydrogen from the surrounding water. After that, the hydrogen is collected and stored in a special tank. Electricity is produced during the discharge process by the chemical reaction of hydrogen and oxygen. There is a lot of hope for this technology’s future. The storage of hydrogen is currently the largest application-related issue due to its high explosive potential when combined with air. Ammonia fuel cells work on a similar principle to hydrogen fuel cells, but they use ammonia instead of hydrogen. Given the toxicity of ammonia and its compounds, there are certain storage issues in this instance.
7. Categories of Stations
Charging stations for electric vehicles can be divided into three different categories: residential, commercial, and industrial, depending on the size and requirements of each.
Residential charging stations are intended exclusively for domestic use. It is anticipated that these stations will have one or two electric vehicle chargers. Possible configurations that can meet the needs of a single household include the following: one electric vehicle charger of level 1 type; one electric vehicle charger of level 2 type; two electric vehicle chargers of level 1 type; or the maximum configuration—which is depicted in Figure 3—consisting of one electric vehicle charger of level 1 type and one electric vehicle charger of level 2 type. Photovoltaic panels alone are sufficient to power these stations. In the diagram, shown in Figure 3, solid lines represent energy flows, while dashed lines represent communication signals. Arrows represent directions of energy flows and communication signals; i.e., arrows show if energy and communication flows are unidirectional or bidirectional. Therefore, this diagram illustrates the physical layout of the system.

Figure 3.
Residential charging station for electric vehicles.
Small- and medium-sized commercial charging stations are designed to accommodate electric vehicles with frequent charging needs. Typically, these are stations designed to sell electricity to electric vehicle owners. Examples of these stations include medium-sized charging stations which have between 10 and 20 chargers, potentially replacing gas stations; smaller charging stations in homes with 1 or 2 chargers; and stations in small parking lots with up to 20 chargers. Stations for charging electric vehicles at smaller road transport hubs are also included in this group. Using level 2 and level 3 chargers makes sense at these stations. Certain locations—such as smaller parking lots in front of hotels, motels, and carriers—may benefit from using fewer level 1 chargers. It is not possible to meet these stations’ needs solely with photovoltaic panels. Using a wind generator makes sense where the terrain permits. If the available space permits, which it often does in rural areas, biomass-based generators can be used. In many urban areas, using energy from the electricity distribution network is the only way to compensate for lost electricity.
Large electric vehicle charging stations known as “industrial stations” are designed to support a fleet of several hundred electric vehicles. These stations are located in large parking lots, such as garages and shopping malls, at major transport hubs, and at electric vehicle manufacturing sites. Using all three groups of chargers makes sense, and it is necessary to determine how much of each group to use in relation to the others. Like commercial stations, these stations’ needs cannot be met by photovoltaic panels alone, and, frequently, drawing power from the electricity distribution network is the only way to compensate for the lost electricity.
8. Sizing of the Residential Stations
There are groups of papers that discuss determining the trends and components [42], communication technologies [43], residential demand response programs, and load scheduling techniques [44], as presented in the paper that provides an overview of the field of home energy management systems [45]. In contrast, this chapter discusses the methodology for sizing a home energy management system, and determining the appropriate size of an electric vehicle charging station that should be powered by renewable energy sources.
Figure 4 displays the general flowchart for sizing electric vehicle charging stations. Descriptions of the variables from Figure 4 are presented in Table 2. Since the residential station is only meant to serve the needs of a single household, we will begin with the supposition that there should be enough energy in a single day to charge two passenger cars:
where Nev represents the number of passenger cars. A typical passenger car battery has the following capacity:
where the energy storage capacity of the passenger car battery is denoted as Cevb in Figure 4, and a level 1 type charger (which can supply a maximum current of Icmax1 = 16 A) takes 7.8 h to charge the battery to 80% of its capacity, while a level 2 type charger (which can supply a maximum current of Icmax2 = 80 A) takes 1.2 h. This indicates that
of electricity are needed daily (which is denoted as Ccd in Figure 4) for the residential station shown in Figure 3. For an autonomous residential station (also known as a station that generates sufficient electricity independently of the power grid), its solar power plant must have the capacity to generate 48 kWh of energy per day.
Nev = 2
Cevb = 24 kWh
f1: Ccd = Nev ∙ Cevb = 48 kWh
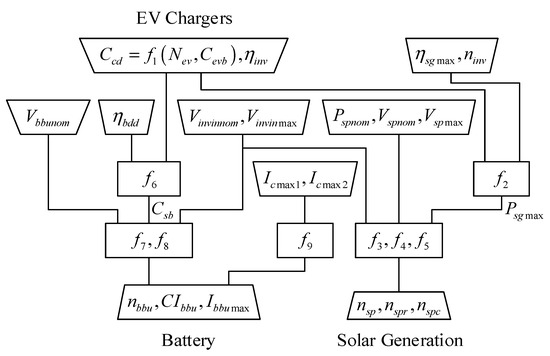
Figure 4.
Flowchart of sizing the electric vehicle charging stations.
Table 2.
Description of variables from Figure 4.
Depending on the Sun’s strength throughout the day, a solar power plant’s output varies and seldom surpasses 80% of the maximum power that solar panels can produce. According to empirical findings, the energy that a solar power plant can produce during the summer months can be calculated as the energy it would generate over a five-hour period at maximum power (which determines the efficiency ηsgmax).
Consequently, assuming no losses, it can be easily calculated that a self-sufficient residential electric vehicle station needs a solar power plant with a maximum power as follows:
Ccd/5 h = 9.6 kW.
However, we must account for the fact that losses occur during both energy conversion and storage, and we need to project total losses of approximately 14% (losses from the conversion of energy and losses from connections and cables). Since there is only one energy conversion from the panel’s DC voltage to the charger’s AC voltage, the losses would typically be between 7% and 8% (which means that corresponding efficiency is ηinv = 0.92−0.93) in cases where energy from the panel goes straight to the chargers. But, since the station typically operates in a dual-energy conversion mode (which is denoted as ninv = 2), the losses between 14% and 16% are expected. Therefore, in case the energy conversion from the panel’s DC voltage to the charger’s AC voltage is 7%, the total losses for the two-energy conversion mode are as follows:
7% ∙ ninv = 14%.
Energy from the panel is converted and stored in batteries during the day, and, during the night, the voltage from the DC batteries is converted into the AC charger voltage. Accordingly, a solar power plant with a maximum power output (which is denoted as Psgmax in Figure 4)
should be realistically designed. The total number of available solar panels (which is denoted as nsp in Figure 4), each with a nominal power of 370 W (denoted as Pspnom in Figure 4),
is needed for such solar power plant. The 51 m2 area required for these panels can essentially fit on one half of the typical house’s roof, assuming the house has a base area of 100 m2. For maximum efficiency, it is best to place these panels on the southern and southeastern sides of the roof.
f2: Psgmax = 9.6 kW/(1 − ((1 − ηinv) ∙ ninv)) = 11.1 kW
f3: nsp = Psgmax/Pspnom = 30
An inverter and a battery make up the smart battery system. Optimizing the performance of the connected batteries and the inverter is a key component of smart battery management. Empirical findings indicate that, when selecting an inverter for a solar power plant, it is advisable to select one with a maximum power rating equivalent to 80% of the panel’s maximum power. As long as the operating panels do not produce more power than this, the system functions dependably. This type of inverter has the advantage of having a lower starting voltage, which allows it to function even in situations where the sunlight intensity is lower. As a result, the solar power plant will have an increased efficiency. The input voltage of the inverter, either nominal or mean (which is denoted as Vinvinnom in Figure 4), is usually about 300 V DC (generally, it can withstand a maximum voltage of 500 V DC, denoted as Vinvinmax, or a starting voltage of 100 V DC, denoted as Vinvinmin) when generating single-phase AC power, or usually around 600 V DC (with a maximum voltage of 1000 V DC, or a starting voltage of 200 V DC) when generating three-phase AC power. Given that the maximum voltage that a solar panel can generate (which is denoted as Vspmax in Figure 4) is 36 V and its nominal voltage (which is denoted as Vspnom in Figure 4) is typically 24 V, it can be concluded that at least 13 solar panels should be connected in series in order to reach the Vinvinnom voltage:
Vinvinnom/Vspnom = 12.5.
In this scenario, two columns of 13 solar panels connected in series, and the third column of 4 solar panels connected in series would be necessary to reach the total number of solar panels, denoted as nsp. However, the better solution is to use two columns (the number of columns is denoted as nspc in Figure 4) connected in parallel of 15 connected-in-series solar panels (which is denoted as nspr in Figure 4), i.e.,
f4: nspr = 15,
f5: nspc = 2.
Although the inverter can run at lower voltages, its nominal voltage is where it performs at its best. The inverter uses DC voltage generated by the solar panels to convert it into either 300 V DC voltage for battery charging or 240 V AC voltage for the charger’s direct power supply. These are two fundamental ways the inverter can function. There is an additional basic operating mode, which is the third one, in which the inverter transforms the energy and DC voltage from the batteries to 240 V AC voltage so that the charger can receive direct power. Moreover, the inverter is able to combine different basic operating modes. One example of a combined mode of operation is when the battery and charger are powered by the inverter using the energy from solar panels. In addition to being able to automatically change its operating mode in response to external commands, the inverter can also sense environmental changes and respond accordingly. In this instance, the terminal sends these commands to the inverter. Because the inverter operates with the lowest losses and with the best performance at its nominal voltage, the batteries are used in order to provide 300 V DC voltage. Since both chargers are turned on, a maximum current of
should be delivered by the inverter in the worst case.
Icmax1 + Icmax2 = 96 A
It is important to calculate the batteries’ capacity to ensure that they have enough storage to hold the entire daily electricity production of the autonomous residential station solar power plant. This is due to the fact that household cars are typically charged during the night, and energy is collected only during the day when the sunlight is present. Therefore, the ideal battery would be one that can store the following:
Ccd = 48 kWh.
The losses between 7% and 8% that occur during the transfer of energy to the charger from the battery, however, require us to increase this figure. Furthermore, a battery with a nominal energy storage capacity of roughly 65 kWh (which is denoted as Csb in Figure 4) must be provided, since the battery should not be discharged beyond an 80% depth of discharge (which corresponds to ηbdd = 0.8), i.e., below 20% of capacity of the battery. This can be calculated as follows:
f6: Csb = Ccd/((1 − 0.08) ∙ ηbdd) = 65 kWh.
The total number of 25 elementary battery units (which is denoted as nbbu in Figure 4) with a 12 V voltage (which is denoted as Vbbunom in Figure 4) must be connected in series to reach a voltage of 300 V (Vinvinnom). This can be calculated as follows:
f7: nbbu = Vinvinnom/Vbbunom = 25.
If so, the current capacity of each of these battery units (which is denoted as CIbbu in Figure 4) should be at least the following:
f8: CIbbu = Csb/(nbbu ∙ 12 V) = 216.7 Ah.
It means that a commercially available battery unit with a 12 V voltage and a current capacity of 260 Ah can be used for this purpose. The batteries’ maximum discharge current (which is denoted as Ibbumax in Figure 4) should be at least the following:
f9: Ibbumax = Icmax1 + Icmax2 = 96 A.
A lithium ion battery unit with a 12 V voltage and a current capacity of 260 Ah has the following standard dimensions: 0.520 m × 0.268 m × 0.220 m. This implies that the household must allocate approximately 0.77 m3 in order to install the batteries in their entirety.
This kind of solar power plant which contains an inverter and battery is also capable of meeting the requirements of a self-sufficient residential charging station equipped with two electric vehicle chargers of the level 1 type. The only distinction is that the battery and inverter are sufficient to provide a maximum current up to 32 A rather than 96 A. A solar power plant that has a two-times-lower capacity and a maximum current of up to 16 A is adequate for the requirements of an autonomous residential charging station equipped with one electric vehicle charger of the level 1 type. A solar power plant that has a two-times-lower capacity and a maximum current of up to 80 A is required to meet the needs of an autonomous residential charging station equipped with one electric vehicle charger of the level 2 type.
The most routine tasks performed by a residential station on a daily basis are considered in this analysis. There might be variations of this kind of station operation, like in the following scenarios: more or fewer electric vehicle charges in a given day, varying amounts of solar energy in a given day, etc. These are all instances in which an autonomous residential station experiences either a surplus or a shortage of generated electricity. That is why it is advantageous that the station is linked to the electrical distribution network, allowing the transfer of all surplus electricity to it, as well as the taking of any shortages.
9. Energy Independence
Moreover, in this analysis, sizing was carried out for the situation when the solar power plant produces as much energy as the station needs in the summer. In winter, autumn, and spring, the station needs additional energy, which it can take from the power distribution network. For situations when the price of the energy delivered to the network is significantly lower than the price of the energy taken from the network, it is in the economic interest of the station to use the energy produced from its own resources (solar power plant) for its own needs as much as possible, i.e., to deliver it minimally to the network. In order to implement this request, it is necessary to have a battery and an energy management terminal in the residential hybrid charging station in question. The aforementioned situation has been present in most countries since the introduction of renewable sources of electricity. Electricity distribution companies, i.e., electricity suppliers, are mostly not interested in paying for the purchased energy from prosumers from private solar power plants or other renewable sources. We can call this case partial energy independence.
However, in recent times, political will has appeared in some countries, which imposes on state electricity distribution companies, that is, state electricity suppliers, to take over the energy obtained from renewable sources from prosumers at the same price at which they are charged for the delivered energy. This is mostly limited to some lower powers. In such situations, the role of the battery is taken over by the electric distribution network, and it is possible to dimension the solar power plant so that the energy taken from the network on an annual basis is equal to the energy delivered to the network. In this case, the electricity bill for the prosumer practically becomes zero. We can call this case optimal energy independence.
Along with the mentioned trends, prosumers also appear who also have a satisfactory contracted price for the produced energy, and who do not have a power limit, that is, where the only limit is the installed power. Such prosumers can dimension their solar power plant so that, even in the winter months when the power plant produces the least amount of energy, it is still enough to cover the energy needs of the prosumer. We can call this case full energy independence.
These three cases of energy independence of the residential hybrid electric vehicle charging station can be simulated using HOMER software. HOMER (Hybrid Optimization of Multiple Energy Resources) software, micropower optimization model Version 2.68 beta (24 July 2009), developed and supported by HOMER Energy, LLC 1790 30th St., Suite 100 Boulder, CO 80301 USA, is used for non-commercial educational purposes. HOMER software has been used broadly in the research community [46], as well as in a previous work in Serbia [47]. On the basis of the entered geographic latitude and longitude, the HOMER software pulls the clarity index (Clearness Index) and average radiation (Daily Radiation) for the given location from the database. These values, which are used in the simulation for the subject location in Serbia, are given in Table 3 and Figure 5. Generally, all data presented in the figures and tables in this section have been generated in simulations by HOMER software.
Table 3.
Solar resources.
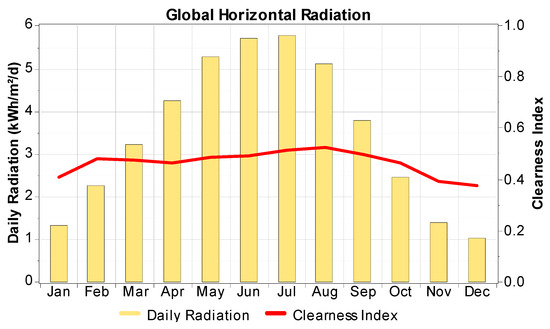
Figure 5.
Solar resource (synthesized data).
Figure 6 shows the load profile (Load Profile) by hour (Hour) for charger type 1, whose load (Demand) is non-deferrable, for a working day.
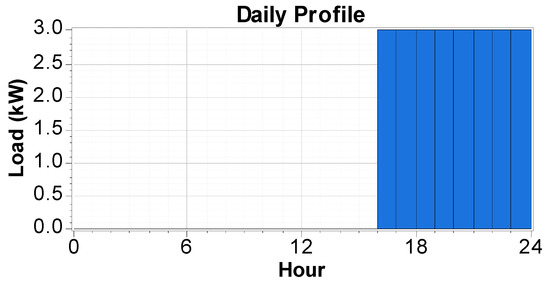
Figure 6.
Load profile.
9.1. Partial Energy Independence
Table 4 shows the distribution of electricity use from own production and energy use from the power distribution network, and Figure 7 shows an overview of the average values of energy use from own production and the network by month (Monthly Average Electric Production).
Table 4.
Components of used energy.
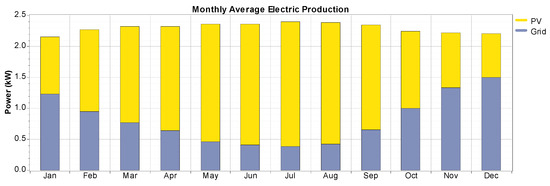
Figure 7.
Overview of the monthly mean value of energy use.
From Table 5, we see what percentage of consumption is engaged in the non-deferrable load, what percentage is deferrable, and how much energy is delivered to the distribution network.
Table 5.
Consumption components.
Table 6 shows the capacity of the photovoltaic panels, as well as the hours of operation and total electricity production over the course of the year, and Figure 8 shows in more detail the output values of the power of the photovoltaic panels (PV Output) by month and period of the day (Hour of Day) in which they were active.
Table 6.
Photovoltaic panels.
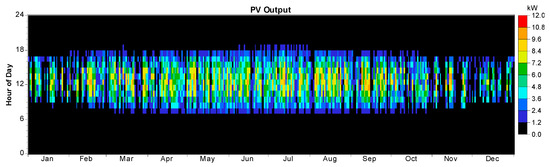
Figure 8.
Power output values of photovoltaic panels.
Table 7 shows the characteristics of a battery composed of battery cells used in the simulation. In order to present the charging characteristics of the batteries in more detail, Figure 9, Figure 10 and Figure 11 show the Frequency Histogram of the percentage of battery charge, Monthly battery charge statistics (SOC—State of Charge) by month, and the state of charge (Battery Bank State of Charge) of the batteries by month and period of the day (Hour of Day).
Table 7.
Battery characteristics.
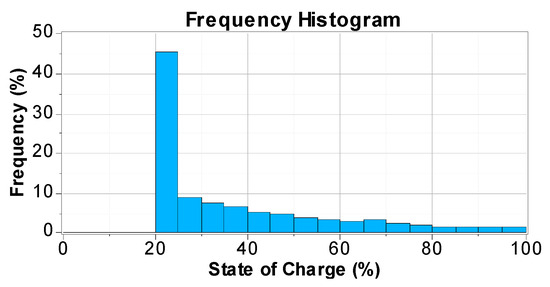
Figure 9.
Frequency histogram.
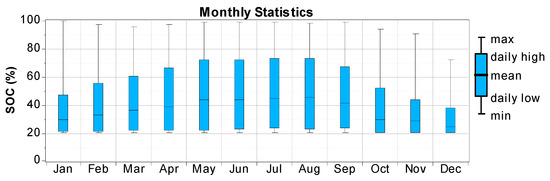
Figure 10.
Monthly battery charge statistics.
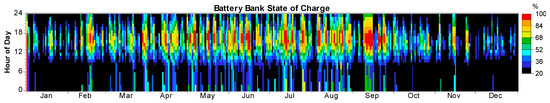
Figure 11.
State of battery charging.
From Table 8, we see the operation statistics of the three-phase hybrid inverter. Figure 12 shows the output power of the inverter (Inverter Output Power), i.e., the power of electricity that is delivered to the power distribution network, and Figure 13 shows the output power of the rectifier (Rectifier Output Power), that is, the power of electricity that is taken from the power distribution network by month and period of the day.
Table 8.
Performance statistics of the three-phase hybrid inverter.
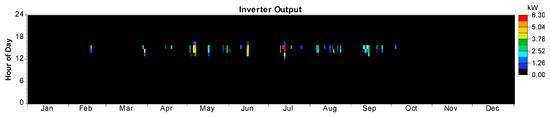
Figure 12.
Inverter output power.
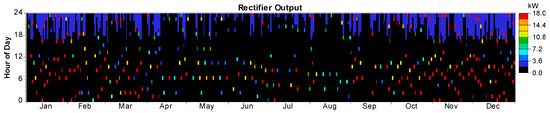
Figure 13.
Output power of the rectifier.
Table 9, Table 10 and Table 11 show the amounts of energy taken from the network and delivered to the network by month and in total, for both the day and night tariffs, as well as the total amount of energy taken from and delivered to the network.
Table 9.
Network—daily tariff.
Table 10.
Network—night tariff.
Table 11.
Network—total.
The simulation shows that the terminal managed the energy in the subject residential hybrid EV charging station in such a way as to ensure that the energy produced from its own resources (solar panels) is used maximally for its own needs, and minimally delivered to the grid. Of the produced 13,013 kWh (Table 4), only 204 kWh (Table 11) was delivered to the grid, while the rest—almost 99% of the produced energy—was consumed for its own purposes. This type of management is of great interest in stations that do not receive compensation for the energy delivered to the power distribution network, or receive some minimal, significantly lower amount than the price paid for the energy received. This is the case in many countries, because electricity distribution companies, i.e., suppliers, are mostly not interested in paying for the energy taken from private solar power plants.
If the residential station did not have the terminal and battery installed, all of the battery output of 8651 kWh (Table 7) would be delivered to the power distribution network. By adding 204 kWh to this value, the total energy delivered to the grid amounts to 8855 kWh out of the 13,013 kWh produced. That much energy would be additionally taken from the grid, while only 4158 kWh, or 32% of the energy produced from one’s own sources, would be consumed for one’s own needs. The price of electricity has recently ranged from 100 to 300 EUR/MWh. If we calculate that the average price of electricity is 200 EUR/MWh, this means that, in the operating mode without a terminal and battery, the owner of the station would have to pay an additional 1770 EUR per year for the costs of the electricity taken over. This shows the utility of using a terminal in this basic situation. It should be noted that the terminal brings even greater savings, that is, even greater income in the advanced mode in which it is used for electricity trading.
9.2. Full Energy Independence
Table 12 shows the distribution of electricity use from own production and energy use from the power distribution network, and Figure 14 shows an overview of the average values of energy use from own production and the network by month (Monthly Average Electric Production).
Table 12.
Components of used energy.
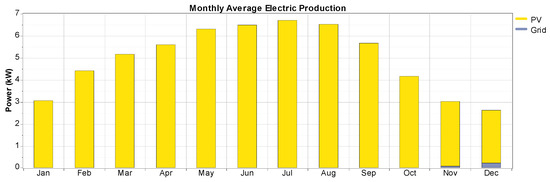
Figure 14.
Overview of the monthly mean value of energy use.
From Table 13, we see what percentage of consumption is engaged in the non-deferrable load, what percentage is deferrable, and how much energy is delivered to the distribution network.
Table 13.
Consumption components.
Table 14 shows the capacity of the photovoltaic panels, as well as the hours of operation and total electricity production over the course of the year, and Figure 15 shows in more detail the output values of the power of the photovoltaic panels (PV Output) by month and period of the day (Hour of Day) in which they were active.
Table 14.
Photovoltaic panels.
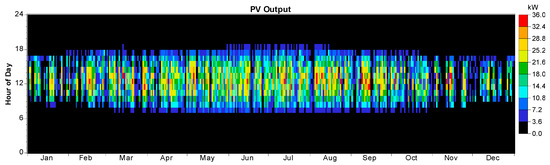
Figure 15.
Power output values of photovoltaic panels.
Table 15 shows the characteristics of a battery composed of battery cells used in the simulation. In order to present the charging characteristics of the batteries in more detail, Figure 16, Figure 17 and Figure 18 show the Frequency Histogram of the percentage of battery charge, Monthly Statistics of the battery charge (SOC—State of Charge) by month, and the state of charge (Battery Bank State of Charge) of the batteries by month and period of the day (Hour of Day).
Table 15.
Battery characteristics.
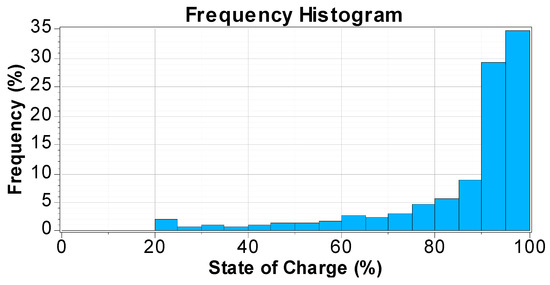
Figure 16.
Frequency histogram.
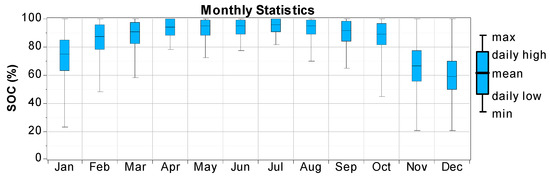
Figure 17.
Monthly battery charge statistics.
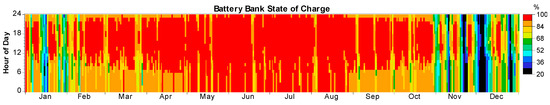
Figure 18.
State of battery charging.
From Table 16, we see the operation statistics of the three-phase hybrid inverter, Figure 19 shows the output power of the inverter (Inverter Output Power), i.e., the power of electricity that is delivered to the power distribution network, and Figure 20 shows the output power of the rectifier (Rectifier Output Power), that is, the power of electricity that is taken from the power distribution network, by month and period of the day.
Table 16.
Performance statistics of the three-phase hybrid inverter.
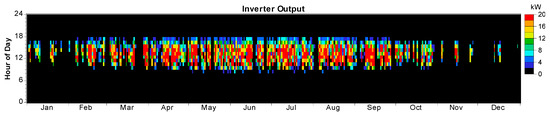
Figure 19.
Inverter output power.
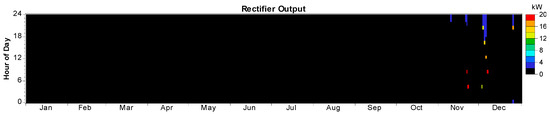
Figure 20.
Output power of the rectifier.
Table 17, Table 18 and Table 19 show the amounts of energy taken from the network and delivered to the network by month and in total, for both the day and night tariffs, as well as the total amount of energy taken from and delivered to the network.
Table 17.
Network—daily tariff.
Table 18.
Network—night tariff.
Table 19.
Network—total.
In one scenario of this case, prosumers may have a fixed price for the electricity produced, which is usually close to the price at which they buy the energy. In another scenario, prosumers may have a price that is linked to the price of electricity on the exchange. In the first case, the terminal and battery are not needed, because the energy distribution network performs their function. In the second scenario of this case, a battery and a terminal are necessary to achieve the best possible electricity trading. The terminal brings even greater savings, that is, even greater income, in this advanced mode in which it is used for electricity trading. Then, the terminal monitors the price of electricity on the stock exchange, which changes from hour to hour, and transfers energy to the grid when the price is high, i.e., withdraws energy from the grid when the price is low. Of course, in preparation for such a response, the terminal uses the forecast of the price movement on the electricity market, and the forecast of the amount of electricity that will be produced from its own renewable sources, as well as the forecast of consumption needs, which are obtained by applying artificial intelligence techniques.
9.3. Optimal Energy Independence
Table 20 shows the distribution of electricity use from own production and energy use from the power distribution network, and Figure 21 shows an overview of the average values of energy use from own production and the network by month (Monthly Average Electric Production).
Table 20.
Components of used energy.
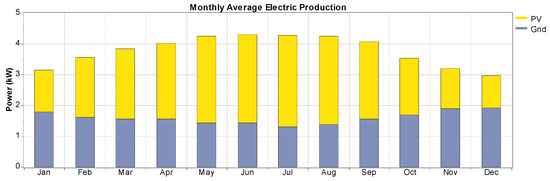
Figure 21.
Overview of the monthly mean value of energy use.
From Table 21, we see what percentage of consumption is engaged in the non-deferrable load, what percentage is deferrable, and how much energy is delivered to the distribution network.
Table 21.
Consumption components.
Table 22 shows the capacity of the photovoltaic panels, as well as hours of operation and total electricity production over the course of a year, and Figure 22 shows in more detail the output values of the power of the photovoltaic panels (PV Output) by month and period of the day (Hour of Day) in which they were active.
Table 22.
Photovoltaic panels.
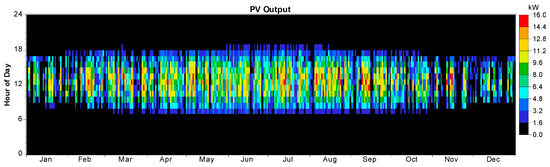
Figure 22.
Power output values of photovoltaic panels.
From Table 23, we see the operation statistics of the three-phase hybrid inverter, Figure 23 shows the output power of the inverter (Inverter Output Power), i.e., the power of electricity that is delivered to the power distribution network, and Figure 24 shows the output power of the rectifier (Rectifier Output Power), that is, the power of electricity that is taken from the power distribution network, by month and period of the day.
Table 23.
Performance statistics of the three-phase hybrid inverter.
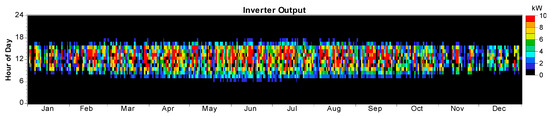
Figure 23.
Inverter output power.
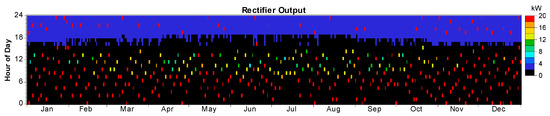
Figure 24.
Output power of the rectifier.
Table 24, Table 25 and Table 26 show the amounts of energy taken from the network and delivered to the network by month and in total, for both the day and night tariffs, as well as the total amount of energy taken from and delivered to the network.
Table 24.
Network—daily tariff.
Table 25.
Network—night tariff.
Table 26.
Network—total.
In this simulation, the role of the battery is taken over by the electric distribution network, and it is designed to dimension the solar power plant so that the energy taken from the network on an annual basis is equal to the energy delivered to the network. In this case, the electricity bill for the prosumer practically becomes zero.
9.4. Interpretation of Obtained Simulation Results
From the point of view of the initial investment, it is cheapest to apply the scenario of optimal energy independence, because there are no costs for the battery. Such a scenario is applicable in countries that have enabled prosumers to compensate the consumed electricity with delivered electricity at the same price. However, it should be taken into account that the electricity bill is not zero, because there is still a cost for the approved electrical power of the connection, maximum power, network fee, excise, and tax. Bearing in mind that compensation is carried out within the tariffs, and not in total, there is also a cost for the consumed electricity in night-time tariffs, because the solar power plant does not produce electricity during the night. On the other hand, part of the electricity delivered in the daytime tariffs often remains uncompensated, as a surplus that cannot be compensated with the energy consumed during night tariffs.
In order to avoid that situation with unpaid delivered electricity, it is possible to add a battery, as in the scenario of partial energy independence. This results in a significant reduction in the cost of the electricity consumed at night tariffs. Considering that, in this scenario, all the delivered energy is consumed on-site, i.e., nothing is delivered to the network, the costs will be significantly reduced for the network fee, as well as for maximum power. Therefore, the scenario of partial energy independence significantly reduces the costs for the consumed electric energy at night tariffs, network fee, and maximum power, while the costs for the approved electrical power of the connection, excise, and tax still remain. These are the benefits of the scenario of partial energy independence applied in countries where the supplier compensates the consumed electricity with the delivered electricity at the same price, and, of course, as already mentioned above, this scenario is very useful in countries where the delivered electricity costs significantly less than the electricity consumed.
The scenario of full energy independence also reduces the costs for the consumed electricity in night tariffs, maximum power, and network fee to zero, because it practically does not take energy from the network. Only the costs for the approved electrical power of the connection, excise, and tax remain. But that is a side effect, and the main purpose of this scenario is its application in those countries where it is possible to sell the electricity delivered by prosumers at market prices.
10. Conclusions
The system architecture for the remote control of a sustainable energy-independent electric vehicle charging station that uses renewable energy sources is discussed in this paper. The sizing process for this system has been analytically described and confirmed by the appropriate simulations. An overview of batteries, renewable energy sources, and chargers is provided. There are three types of electric vehicle charging stations: residential, commercial, and industrial. With the current state of technology, it has been demonstrated that the residential station for electric vehicle charging can be implemented and simply integrated into the typical household’s framework, creating a sustainable and economically efficient solution. The energy independence and sustainability of such stations were considered, and three types were defined—partial, full, and optimal energy independence. For each type, the application is described, a simulation is performed, and the advantages and disadvantages are presented. It has been shown that, for an electric vehicle charging station which provides two charging processes per day and which has a total energy capacity of 48 kWh, a solar power plant of 11.1 kW power and a battery with an energy storage capacity of 65 kWh are necessary for partial energy independence, a solar power plant of 37.1 kW power and a battery with an energy storage capacity of 216 kWh are necessary for full energy independence, and a solar power plant of 16.4 kW power without a battery is necessary for optimal energy independence. The necessity for a single terminal type for the remote control of these stations has also been shown, combining the features of the four different terminal types currently in use for the remote control of smart electricity meters, fiscal cash registers, smart battery management, and electric vehicle chargers. This type of terminal manages energy flows in the station and provides a sustainable solution and significant economic savings for the station owner. Future research should consider expanding the capabilities of such a terminal to include controlling household appliances. Moreover, in future work, special attention should be paid to the simulation of the energy management of commercial and industrial stations.
Author Contributions
Conceptualization, J.V. and G.S.; methodology, J.V. and I.B.B.; software, I.B.B.; validation, J.V., G.S., I.B.B. and Ž.D.; formal analysis, J.V. and G.S.; investigation, J.V., G.S., I.B.B. and Ž.D.; resources, J.V. and I.B.B.; data curation, J.V. and I.B.B.; writing—original draft preparation, J.V. and G.S.; writing—review and editing, J.V., G.S. and Ž.D.; visualization, G.S. and I.B.B.; supervision, J.V., G.S. and Ž.D.; project administration, J.V. and G.S.; funding acquisition, J.V., G.S. and Ž.D. All authors have read and agreed to the published version of the manuscript.
Funding
This work was funded by the Ministry of Science, Technological Development and Innovation of the Republic of Serbia under contract numbers 451-03-137/2025-03/200103 and 51-03-136/2025-03/200034.
Institutional Review Board Statement
Not applicable.
Informed Consent Statement
Not applicable.
Data Availability Statement
The data are available upon request.
Conflicts of Interest
The authors declare no conflicts of interest.
References
- Ersoz, B.; Bulbul, H.I. A Research on Importance of Using Renewable Energy Sources by Organizations within The Scope of Green Deal Preparations. In Proceedings of the 11th International Conference on Renewable Energy Research and Application (ICRERA), Istanbul, Turkey, 18–21 September 2022. [Google Scholar]
- Al-Haija, Q.A.; Smadi, M. Parametric prediction study of global energy-related carbon dioxide emissions. In Proceedings of the International Conference on Electrical, Communication, and Computer Engineering (ICECCE), Istanbul, Turkey, 12–13 June 2020. [Google Scholar]
- Nongnong, G. Energy-saving target prediction from the perspective of carbon dioxide emissions reduction. In Proceedings of the International Conference on Electronics, Communications and Control (ICECC), Ningbo, China, 9–11 September 2011. [Google Scholar]
- Lei, X.; Shang, Y.; Shao, Z.; Jia, Y.; Jian, L. Grid integration of electric vehicles for optimal marginal revenue of distribution system operator in spot market. In Proceedings of the 5th International Conference on Electrical Engineering and Green Energy (CEEGE), Berlin, Germany, 8–11 June 2022. [Google Scholar]
- Yu, H.; Liu, Y.; Li, J.; Fang, M. Investigations on the Emission Characteristics of China VI Gasoline Passenger Cars. In Proceedings of the 4th International Conference on Power and Energy Engineering (ICPEE), Xiamen, China, 19–21 November 2020. [Google Scholar]
- India|International Council on Clean Transportation. Available online: http://www.theicct.org/india (accessed on 31 October 2017).
- Zheng, Y.; Shao, Z.; Zhang, Y.; Jian, L. A systematic methodology for mid-and-long term electric vehicle charging load forecasting: The case study of Shenzhen, China. Sustain. Cities Soc. 2020, 56, 102084. [Google Scholar] [CrossRef]
- England, B.S.; Alouani, A.T. Multiple Loads-Single Smart Meter for Measurement and Control of Smart Grid. In Proceedings of the IEEE Innovative Smart Grid Technologies—Asia (ISGT Asia), Chengdu, China, 21–24 May 2019. [Google Scholar]
- Prokin, M.; Prokin, D. Improved fiscal devices with additional services. In Proceedings of the 5th Mediterranean Conference on Embedded Computing (MECO), Bar, Montenegro, 12–16 June 2016. [Google Scholar]
- Zhang, C.; Huang, Q.; Tian, J.; Chen, L.; Cao, Y.; Zhang, R. Smart grid facing the new challenge: The management of electric vehicle charging loads. Energy Procedia 2012, 12, 98–103. [Google Scholar] [CrossRef]
- Xu, G.; Bai, L. Heuristic methods for optimal electric vehicle charging scheduling in smart grid. Int. J. Autom. Logist. 2013, 1, 22–46. [Google Scholar] [CrossRef]
- Rajakaruna, S.; Shahnia, F.; Ghosh, A. Plug in Electric Vehicles in Smart Grids—Charging Strategies; Power Systems; Springer: Singapore, 2015. [Google Scholar]
- Khan, S.; Ahmad, A.; Ahmad, F.; Shemami, M.S.; Alam, M.S.; Khateeb, S. A Comprehensive Review on Solar Powered Electric Vehicle Charging System. Smart Sci. 2018, 6, 54–79. [Google Scholar] [CrossRef]
- Sonnen Batterie. Available online: https://sonnengroup.com/sonnenbatterie/ (accessed on 20 October 2024).
- Tu, J.; Yu, H.; Zhong, J.; Jian, L. User-needs-oriented shared DC charging resources optimal configuration and operation for improving EV penetration in old residential communities. Sustain. Cities Soc. 2024, 114, 105796. [Google Scholar] [CrossRef]
- Gong, C.; Ma, L.; Chi, Z.; Zhang, B.; Shi, R.; Jiao, R.; Zeng, S.; Chen, J. Study on the impacts and analysis of EV and PV integration into power systems. In Proceedings of the 5th International Conference on Electric Utility Deregulation and Restructuring and Power Technologies (DRPT), Changsha, China, 26–29 November 2015. [Google Scholar]
- Yilmaz, M.; Krein, P.T. Review of battery charger topologies, charging power levels, and infrastructure for plug-in electric and hybrid vehicles. IEEE Trans. Power Electron. 2013, 28, 2151–2169. [Google Scholar] [CrossRef]
- Lam, L.K.; Ko, K.T.; Tung, H.Y.; Tung, H.C.; Lee, W.C.; Tsang, K.F.; Lai, L.L. Advanced metering infrastructure for electric vehicle charging. Smart Grid Renew. Energy 2011, 2, 312–323. [Google Scholar] [CrossRef]
- Priyanka, M.K.; Chowdhury, A.A.; Mahmud, B.; Chowdhury, S.J.; Azad, A. Real-time monitoring of solar battery charging station. In Proceedings of the International Conference on Computation of Power, Energy Information and Communication (ICCPEIC), Melmaruvathur, India, 20–21 April 2016. [Google Scholar]
- Traube, J.; Lu, F.; Maksimovic, D. Electric vehicle DC charger integrated within a photovoltaic power system. In Proceedings of the 27th Annual IEEE Applied Power Electronics Conference and Exposition (APEC), Orlando, FL, USA, 5–9 February 2012. [Google Scholar]
- Shi, L.; Xu, H.; Li, D.; Zhang, Z.; Han, Y. The photovoltaic charging station for electric vehicle to grid application in smart grids. In Proceedings of the IEEE 6th International Conference on Information and Automation for Sustainability, Beijing, China, 27–29 September 2012. [Google Scholar]
- Lee, S.; Iyengar, S.; Irwin, D.; Shenoy, P. Shared solar-powered EV charging stations: Feasibility and benefits. In Proceedings of the 7th International Green and Sustainable Computing Conference (IGSC), Hangzhou, China, 7–9 November 2016. [Google Scholar]
- Bhatti, A.R.; Salam, Z.; Ashique, R.H. Electric vehicle charging using photovoltaic based microgrid for remote islands. Energy Procedia 2016, 103, 213–218. [Google Scholar] [CrossRef]
- Icentic|Smart Energy. Available online: http://icentic.com/smart-energy/ (accessed on 20 October 2024).
- Hannan, M.A.; Faisal, M.; Ker, P.J.; Mun, L.H.; Parvin, K.; Mahlia, T.M.I.; Blaabjerg, F. A Review of Internet of Energy Based Building Energy Management Systems: Issues and Recommendations. IEEE Access 2018, 6, 38997–39014. [Google Scholar] [CrossRef]
- Vujasinovic, J.; Savic, G.; Djurisic, Z. Arhitecture of system for remote controle of the renewable energy sources powered station for electric vehicles charging. In Proceedings of the 64th Conference on Electronics, Telecommunications, Computing, Automation and Nuclear Engineering (ETRAN), Belgrade, Serbia, 28–29 September 2020. [Google Scholar]
- Vujasinovic, J.; Savic, G.; Despotovic, Z. Architecture and Sizing of System for Remote Control of Renewable Energy Sources Powered Station for Electric Vehicles Charging. In Proceedings of the IEEE 7th International Energy Conference (ENERGYCON), Riga, Latvia, 9–12 May 2022. [Google Scholar]
- Marjanovic, S.; Vujasinovic, J.; Savic, G.; Manojlovic, S.; Ninkovic, B.; Medjedovic, P. System for electric power remote reading and load management. In Proceedings of the VI Advising the Bosnia and Herzegovina Committee CIGRE, Neum, Bosnia and Herzegovina, 1 November 2003. [Google Scholar]
- Vujasinovic, J. Terminal for Remote Reading and Management of Fiscal Cash Registers. Master’s Thesis, Faculty of Electrical Engineering, University of Belgrade, Belgrade, Serbia, 2013. [Google Scholar]
- EvoCharge. Available online: https://evocharge.com/resources/the-difference-between-level-1-2-ev-chargers (accessed on 5 February 2025).
- U.S. Department of Transportation. Available online: https://www.transportation.gov/rural/ev/toolkit/ev-basics/charging-speeds (accessed on 5 February 2025).
- Al Wahedi, A.; Bicer, Y. Development of an off-grid electrical vehicle charging station hybridized with renewables including battery cooling system and multiple energy storage units. Energy Rep. 2020, 6, 2006–2021. [Google Scholar] [CrossRef]
- Girard, A.; Roberts, C.; Simon, F.; Ordoñez, J. Solar electricity production and taxi electrical vehicle conversion in Chile. J. Clean. Prod. 2019, 210, 1261–1269. [Google Scholar] [CrossRef]
- Cui, T.; Xuan, Y.; Li, Q. Design of a novel concentrating photovoltaic-thermoelectric system incorporated with phase change materials. Energy Convers. Manag. 2016, 112, 49–60. [Google Scholar] [CrossRef]
- Daneshazarian, R.; Cuce, E.; Cuce, P.M.; Sher, F. Concentrating photovoltaic thermal (CPVT) collectors and systems: Theory, performance assessment and applications. Renew. Sustain. Energy Rev. 2019, 81, 473–492. [Google Scholar] [CrossRef]
- Notton, G. Hybrid Wind-Photovoltaic Energy Systems. In Stand-Alone and Hybrid Wind Energy Systems; Woodhead Publishing Limited: Sawston, UK, 2010; pp. 216–253. [Google Scholar]
- Cadu, M.; Huijbregts, M.A.J.; Althaus, H.; Koehler, A.; Hellweg, S. Wind power electricity: The bigger the turbine, the greener the electricity? Environ. Sci. Technol. 2012, 46, 4725–4733. [Google Scholar]
- Nixon, J.D.; Dey, P.K.; Davies, P.A. The feasibility of hybrid solar-biomass power plants in India. Energy 2012, 46, 541–554. [Google Scholar] [CrossRef]
- Ghasemi, A.; Heidarnejad, P.; Noorpoor, A. A novel solar-biomass based multi-generation energy system including water desalination and liquefaction of natural gas system: Thermodynamic and thermoeconomic optimization. J. Clean. Prod. 2018, 196, 424–437. [Google Scholar] [CrossRef]
- Suresh, N.S.; Thirumalai, N.C.; Dasappa, S. Modeling and analysis of solar thermal and biomass hybrid power plants. Appl. Therm. Eng. 2019, 160, 114121. [Google Scholar] [CrossRef]
- All In One Battery Technology. Available online: https://www.ainbattery.com/deep-cycle-12v-250ah-battery-pack-300ah-lithium-ion-solar-battery-can-build-48v.html (accessed on 5 February 2025).
- Vujasinovic, J.; Savic, G.; Prokin, M. Terminal for Remote Control of Renewable Energy Sources Powered Station for Electric Vehicles Charging. In Proceedings of the 10th Mediterranean Conference on Embedded Computing, Budva, Montenegro, 7–10 June 2021. [Google Scholar]
- Arunkumar, P.; Vijith, K. IOT Enabled Smart Charging Stations for Electric Vehicle. Int. J. Pure Appl. Math. 2018, 119, 247–252. [Google Scholar]
- Vujasinovic, J.; Savic, G. Demand Side Management and Integration of a Renewable Sources Powered Station for Electric Vehicle Charging into a Smart Grid. In Proceedings of the 15th International Conference on Applied and Theoretical Electricity (ICATE), Craiova, Romania, 27–29 May 2021. [Google Scholar]
- Zafar, U.; Bayhan, S.; Sanfilippo, A. Home energy management system concepts, configurations, and technologies for the smart grid. IEEE Access 2020, 8, 119271–119286. [Google Scholar] [CrossRef]
- Connolly, D.; Lund, H.; Mathiesen, B.V.; Leahy, M. A review of computer tools for analysing the integration of renewable energy into various energy systems. Appl. Energy 2010, 87, 1059–1082. [Google Scholar] [CrossRef]
- Batas Bjelic, I.; Ciric, R.M. Optimal distributed generation planning at a local level—A review of Serbian renewable energy development. Renew. Sustain. Energy Rev. 2014, 39, 79–86. [Google Scholar] [CrossRef]
Disclaimer/Publisher’s Note: The statements, opinions and data contained in all publications are solely those of the individual author(s) and contributor(s) and not of MDPI and/or the editor(s). MDPI and/or the editor(s) disclaim responsibility for any injury to people or property resulting from any ideas, methods, instructions or products referred to in the content. |
© 2025 by the authors. Licensee MDPI, Basel, Switzerland. This article is an open access article distributed under the terms and conditions of the Creative Commons Attribution (CC BY) license (https://creativecommons.org/licenses/by/4.0/).