Article

Spatial Differentiation Characteristics and Influencing Factors of Public Cultural Facilities in Xinjiang

1
College of Geography and Tourism, Xinjiang Normal University, Urumqi 830017, China
2
Xinjiang Tourism Development Research Center, Urumqi 830017, China
*
Author to whom correspondence should be addressed.
Sustainability 2025, 17(11), 4994; https://doi.org/10.3390/su17114994
Submission received: 17 April 2025 / Revised: 26 May 2025 / Accepted: 27 May 2025 / Published: 29 May 2025

Abstract

Public cultural facilities are the cornerstone of the construction of the public cultural service system. Exploring the spatial pattern of public cultural service facilities is significant for clarifying regional differences in public cultural services, optimizing the allocation of urban cultural facilities, and promoting the equalization of public cultural services. This study constructs a dual-dimensional equalization evaluation system of geographical density and per capita quantity to reveal the spatial mismatch phenomenon of public cultural facilities in Xinjiang. Using methods such as the nearest neighbor index and kernel density analysis, combined with the geodetector, the distribution patterns of public cultural facilities in 14 prefectures and cities in Xinjiang are systematically analyzed. The results show that public cultural facilities in Xinjiang exhibit significant agglomeration characteristics, with museums having the most prominent spatial agglomeration degree (NNI = 0.523) and imbalance degree (S = 0.284). A spatial pattern centered on Urumqi characterized by “dense in the northwest and sparse in the southeast” has formed. There exists a spatial mismatch phenomenon between high-density and low-per capita population and low-density and high-per capita population in terms of geographical density and population distribution. Population size is the key factor in facility distribution, while cultural demand and economic level are the main factors, and fiscal capacity and education level are secondary factors, with transportation conditions being general factors. In this paper, we analyze the spatial differentiation characteristics of public cultural facilities in Xinjiang and the influencing factors in order to provide typical cases and practical references for optimizing the allocation of urban cultural facilities and promoting their equalization.

1. Introduction

Public cultural service is a crucial step in creating a strong cultural nation and province, and it serves as the institutional foundation for defending citizens’ fundamental cultural rights and interests. Public cultural facilities, which comprise an array of cultural locations like museums, libraries, cultural centers, theaters, and different cultural squares, are significant providers of public cultural services [1]. From the public baths and libraries of ancient Rome to the churches and monasteries of the Middle Ages to the museums, libraries, and theaters of the present, these establishments serve a variety of purposes, including the exchange of ideas, the display of art, and the dissemination of knowledge [2,3]. In addition to social, economic, and environmental sustainability, culture is commonly acknowledged as the fourth pillar of sustainable development, as it is a fundamental component of societal creativity [4]. The layout of public cultural facilities has a direct impact on the sustainable and equitable development of metropolitan area culture. It is also a crucial metric for gauging the living standards and spiritual and cultural requirements of the populace [5,6]. In recent years, China has taken multiple measures to promote the high-quality development of public cultural services. In 2024, a total of CNY 4.57 million was allocated by the central government for the construction of public cultural service systems in local areas. This expenditure has led to the achievement of phased results in the construction of public cultural service systems, with the establishment of public cultural facilities expanding from nothing to something, and basic cultural facilities such as community libraries and city cultural centers gradually achieving widespread distribution. With the development of society and the improvement of people’s material standards, residents’ cultural demands are increasing day by day. The planning and management of public cultural facilities have received increasing attention [7]. In recent years, Xinjiang has adhered to the people-centered development philosophy. The government has paid high attention to the construction of public cultural services in Xinjiang, increased investment in public cultural infrastructure construction, and focused on building a public cultural service network covering both urban and rural areas, striving to meet the increasingly growing spiritual and cultural needs of all ethnic groups. Remarkable achievements have been made. However, compared with the eastern and central regions of China, Xinjiang has a significant gap in public cultural facility construction and development. It needs to transform its resource advantages into sustainable development advantages, enhance the resilience of urban cultural development, and promote the balanced development of the public cultural service system [8,9].
Museums, cultural centers, and libraries are important components of public cultural service facilities and are also key areas in regional development [10]. They can reflect the level of regional cultural supply and are crucial indicators for measuring the quality of public cultural services. In the “National Municipal-level Public Cultural Facilities Construction Plan”, jointly developed by the National Development and Reform Commission, the Ministry of Culture, and the National Cultural Heritage Administration, special planning has been made for museums, cultural centers, and libraries. Museums are cultural organizations that integrate the collection, research, and display of cultural relics and public education [11]. They conduct educational activities such as archeological research and cultural exhibitions, and academic lectures. Cultural centers are comprehensive cultural facilities that integrate the organization of mass cultural activities, art training, and the inheritance of intangible cultural heritage, including performances, various forms of characteristic activities such as singing and dancing, drama, and training in traditional ethnic skills [12]. Libraries are public spaces centered on the provision of literature resources, with functions of knowledge dissemination and cultural exchange [13]. They include children’s book courses, reading sharing sessions, and various themed lectures. These three types of facilities are not only closely related to residents’ cultural lives but also reflect the concentration effect and radiation capacity of regional cultural resources. Their distribution pattern, operation mode, and service efficiency can directly reflect the actual effectiveness of public cultural facilities in meeting people’s spiritual and cultural needs, promoting cultural inheritance and innovative practices.
Public cultural facilities are a focus of urban planning and geography research. As urbanization accelerated during the 1970s, Western nations saw a slow emergence of culture-oriented urban redevelopment. To address the increasing demand for urban construction, government agencies use regional planning to establish a suitable arrangement of urban public cultural facilities. Currently, the spatial arrangement of urban cultural facilities or cultural industries, the supply and demand relationship or utilization efficiency of urban cultural facilities, and the planning and construction management of cultural facilities are the three main areas of geographical research on public cultural facilities [14,15,16,17,18,19]. From the standpoint of balance and justice theory, foreign nations primarily research one type of public cultural facility, such as public libraries and museums [20,21,22]. The methodical analysis of cultural facilities as a whole, as well as the facilities’ overall design and level of service effectiveness, is given more consideration in China [23,24]. Early on, the academic circles mostly employed descriptive qualitative analysis as a research tool. Researchers started using a range of quantitative analysis techniques as their work progressed. Exploring the variables that affect spatial distribution using a geodetector [25], the coordination degree model was used to analyze the supply–demand relationship involving urban development and service level [26], and GIS spatial analysis methods served to analyze the spatial organization and accessibility disparities among these facilities [27,28]. These techniques give researchers access to more methodical and scientific analysis tools.
Although domestic scholars have achieved certain results in the research on public cultural facilities, the existing achievements still have limitations. Firstly, the research areas are mostly concentrated on the developed urban clusters in the east or at the single-city scale, and there is a significant lack of exploration for the multi-ethnic border areas in the west, especially insufficient attention to Xinjiang. As the largest and most culturally rich border autonomous region in China, Xinjiang faces complex challenges in the layout of its public cultural facilities, such as “wide land and sparse population, interwoven cultures, and significant disparities in regional economic development”. However, the related research is mainly based on case analyses at the municipal level [29], lacking spatial heterogeneity analysis and exploration of driving mechanisms covering the entire Xinjiang region. Secondly, in terms of research methods, traditional evaluations only explore the level of equality from single-dimensional indicators such as geographical density or per capita quantity, which makes it difficult to reveal the structural contradictions in resource allocation. Within a single-dimensional framework, it is difficult to identify the spatial demand–supply mismatch problems caused by the “facility congestion effect” due to high density and low demand or “service vacuum” caused by low density and high demand. In response to these limitations, this study has developed a dual-dimensional evaluation method based on geographical density and per capita quantity, breaking through the one-sidedness of traditional single-dimensional analysis, accurately revealing the structural contradictions in the spatial coverage efficiency and population demand adaptation of public cultural facilities and comprehensively assessing the equality level of the facilities. Therefore, this study systematically reveals the distribution patterns of cultural facilities in Xinjiang in terms of geographical space and the influencing factors, which is conducive to accurately analyzing the issues of spatial configuration, resource allocation, and service equality of these facilities. It also provides a scientific basis and practical guidance for regional cultural facility planning and the balanced development of the public cultural service system [30]. To this end, the study focuses on the following issues: Does the spatial distribution of public cultural facilities in Xinjiang have a significant agglomeration effect? Does this agglomeration effect vary by facility type? Can the dual perspectives of geographical density and per capita quantity effectively identify the spatial supply–demand mismatch of public cultural facilities? How are the explanatory powers of factors such as population size, economic level, and cultural demand for facility distribution ranked? How can we achieve equal development and enhance service efficiency by optimizing the layout of facility spaces? How does Xinjiang’s unique geographical and socio-cultural background as a multi-ethnic region impact the spatial distribution of public cultural facilities, and how might this impact differ from other regions?
Xinjiang has a vast area, accounting for one-sixth of China’s land area, but its permanent population is only 25.98 million, presenting the characteristic of a large area with a sparse population. The unique landform of three mountains sandwiching two basins has led to the fragmented distribution of the oasis economy and culture, thereby exacerbating the spatial imbalance in facility allocation. At the same time, as a multi-ethnic settlement area in the northwest of China, Xinjiang possesses a unique cultural and historical heritage and features of diverse cultural integration. It holds an important position in the process of cultural inheritance and development in China, and its rich intangible cultural heritage, Silk Road relics, and multi-ethnic artistic forms are the core elements of cultural resources, laying the foundation for the construction of a distinctive public cultural service system in the border areas. However, due to the influence of multiple factors such as vast territory, sparse population, weak economic foundation, and poor transportation, the construction of public cultural facilities in different regions varies greatly during the process of converting cultural resources into inclusive public cultural services. There are problems such as spatial imbalance in configuration and insufficient service efficiency, and the gap in the level of public cultural service equality is also widening. Therefore, taking Xinjiang as the research case area has certain typicality and representativeness, and the research conclusions can provide reference for similar regions such as Inner Mongolia and Tibet.
This study takes 14 prefectures in Xinjiang as the research units and comprehensively employs methods such as the nearest neighbor analysis and kernel density to analyze the spatial differentiation patterns of public cultural facilities from dimensions including distribution quantity, type, balance, and density characteristics. A dual-dimensional evaluation framework of geographical density and per capita quantity is constructed to explore the level of regional facility equalization and identify spatial mismatch issues. Through the geodetector, the driving effects of factors such as economic level, population size, and cultural demand on facility distribution are quantified, and significant influencing factors are then selected. Finally, based on the goal of equalization of public cultural services, spatial layout optimization suggestions are proposed to provide a geographical perspective for the study of spatial balance of cultural facilities and also offer practical references for the rational allocation of facility resources in border areas.

2. Materials and Methods
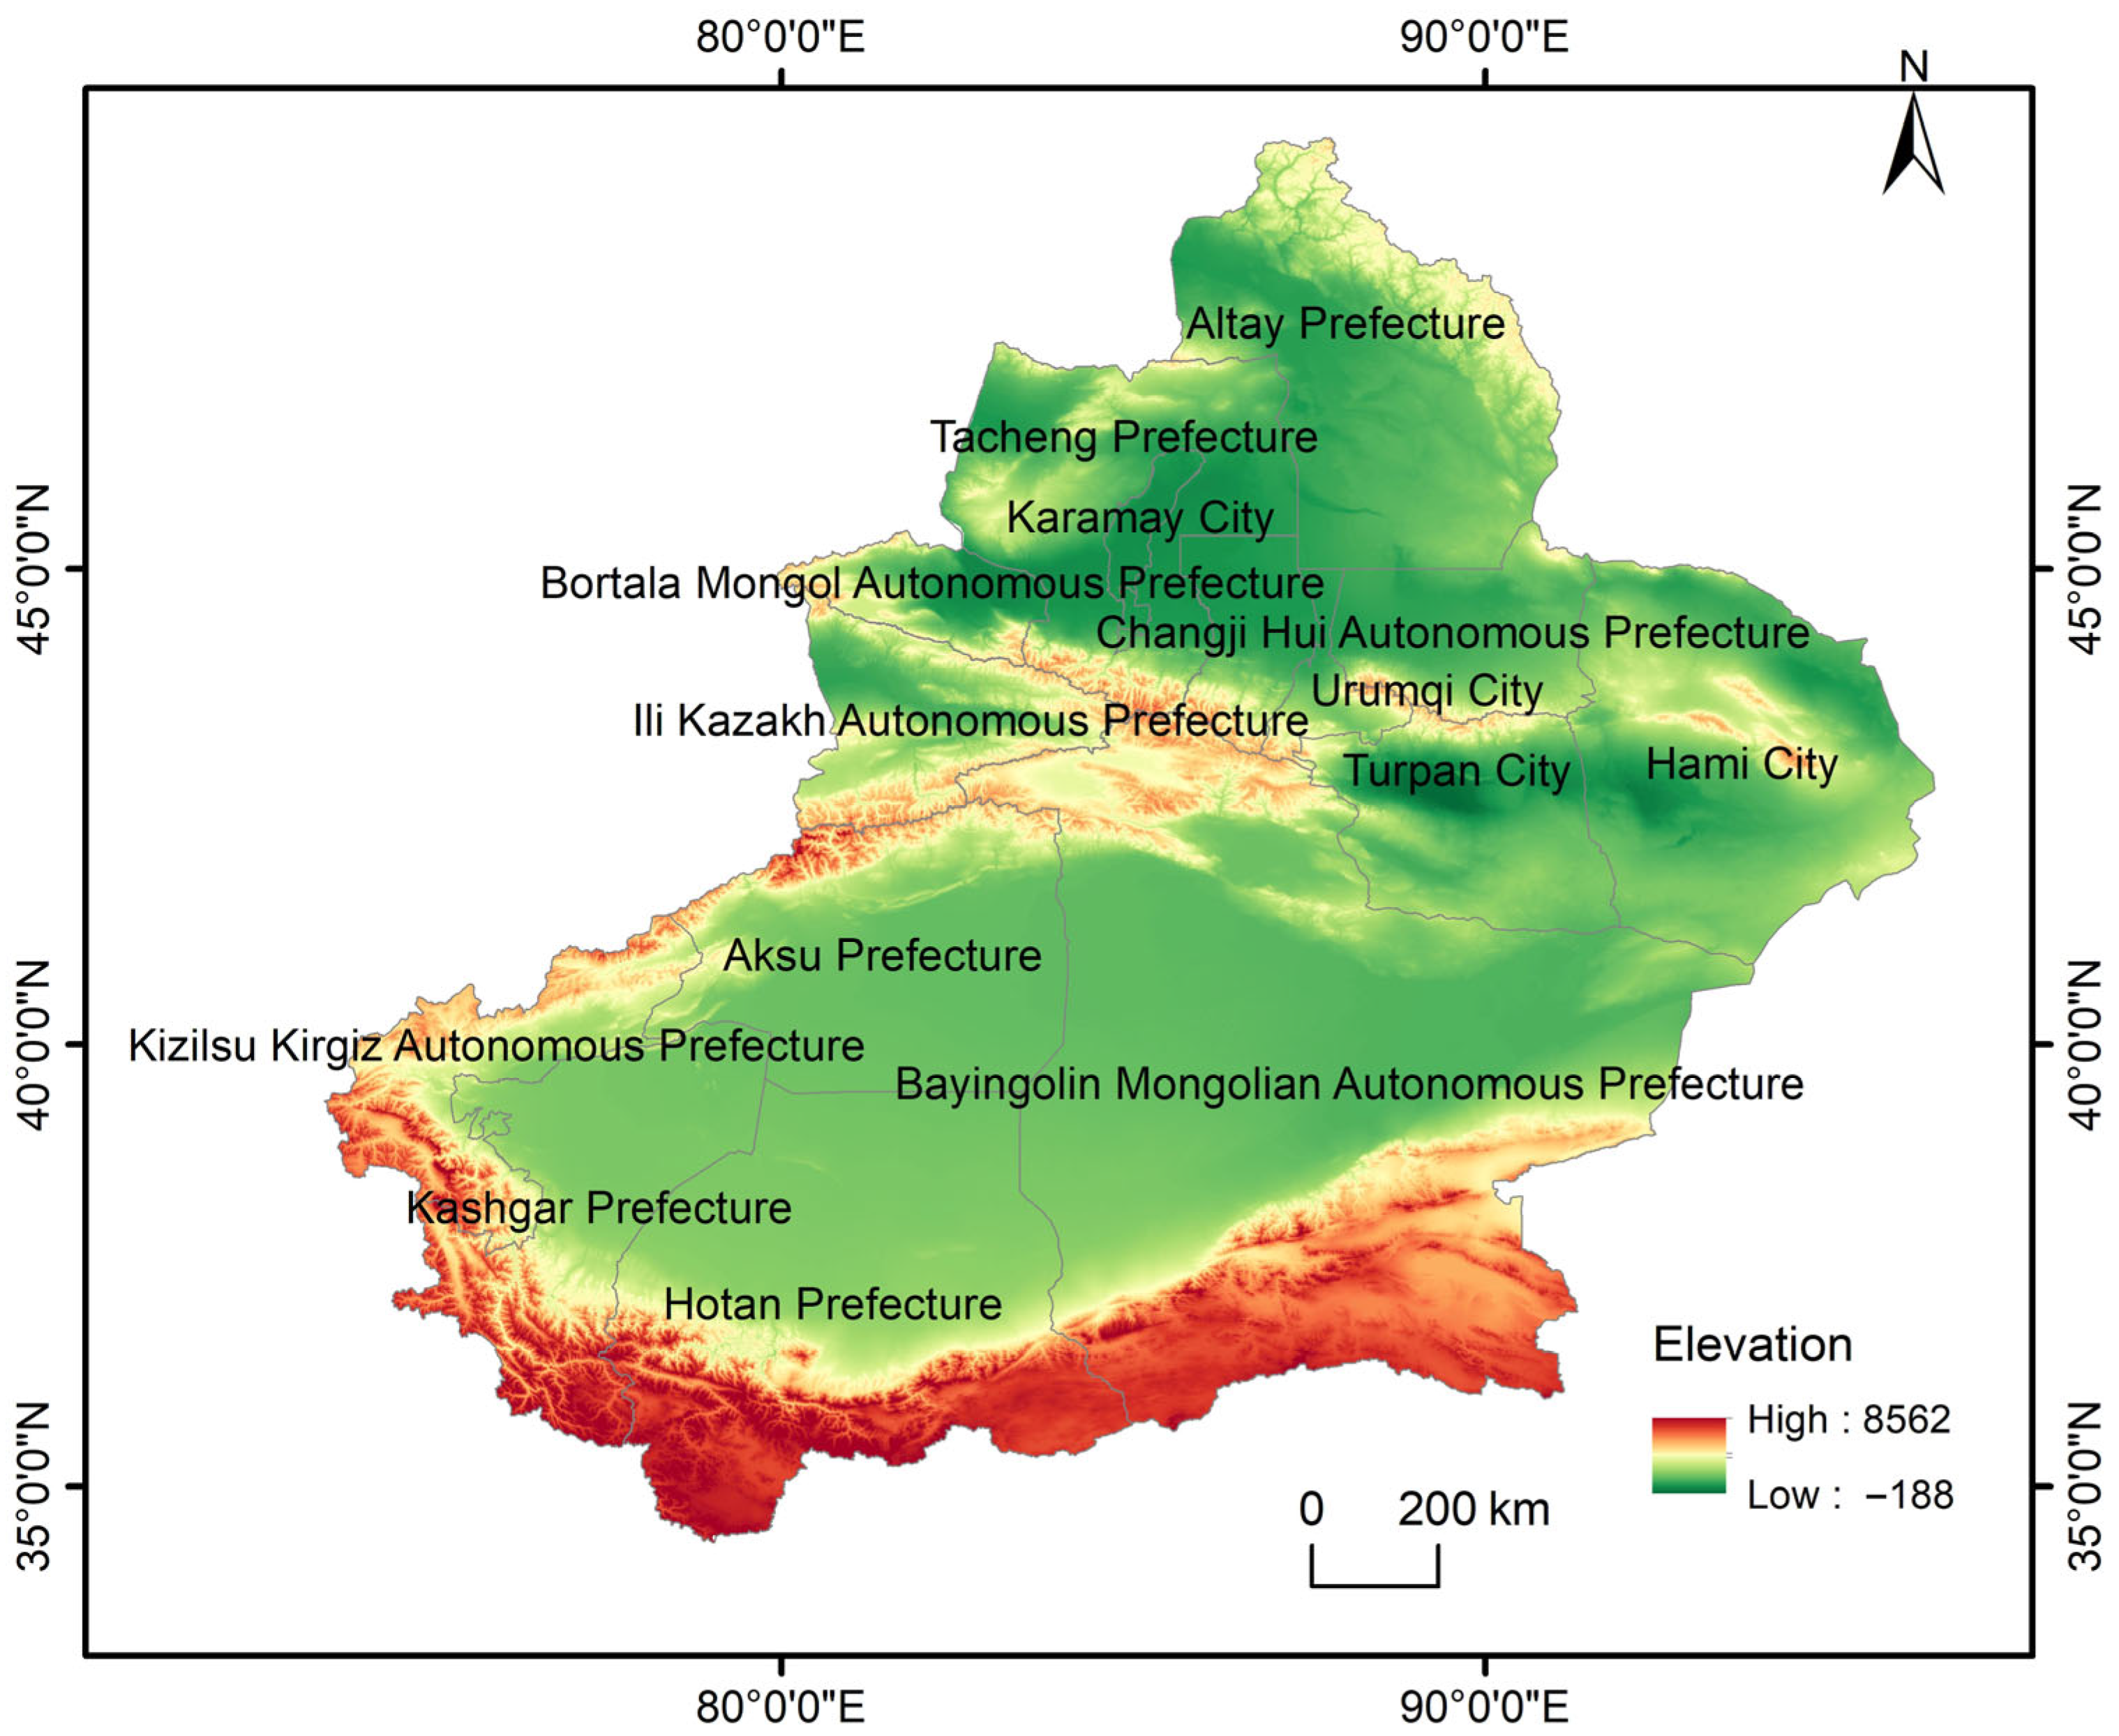
2.1. Study Area

The Xinjiang Uygur Autonomous Region is located in the country’s northwestern frontier, spanning a total of 1.6649 million square kilometers. It has jurisdiction over 5 prefecture-level cities, 5 autonomous prefectures, and 4 regions (Figure 1). As of 2024, the permanent population is about 25.98 million. Xinjiang, with its unique landform features of three mountains and two basins, has shaped the distribution pattern of the oasis economy and culture. Xinjiang is a multi-ethnic and multi-cultural convergence zone. It has given birth to the splendid culture of 13 ethnic groups, including the Uyghur and Kazakh, and six world cultural heritage sites, including the Jiaohe and Gaochang Ancient Cities. Since the implementation of the strategy of enriching Xinjiang with culture in 2020, Xinjiang has worked diligently to create a contemporary system of public cultural services, and incredible progress has been made in building public cultural institutions, such as museums, cultural centers, and libraries. By the end of 2024, Xinjiang had built 136 museums, 118 cultural centers, and 110 libraries. However, constrained by natural geographical conditions and socioeconomic development levels, the geographical arrangement of these facilities exhibits a pronounced disparity. Based on the economic–geographical characteristics and multicultural background of the oasis in Xinjiang. This study aims to offer theoretical underpinnings and a practical framework for enhancing public cultural service systems in border regions.

2.2. Data Sources

This study selects three typical facilities, namely museums, cultural centers, and libraries, as the basic data of public cultural facilities. The data on museums came from the National Museum Annual Report Information System. The data on cultural centers and libraries were based on the Directory of Cultural Centers of Xinjiang Uygur Autonomous Region and the Directory of Public Libraries of Xinjiang Uygur Autonomous Region, published on the official webpage of the Xinjiang Culture and Tourism Department. The longitude and latitude coordinate data of public cultural facilities were collected by using the Baidu coordinate picking system, and a total of 365 sample points were collected. Among them, there are 136 museums, 118 cultural centers, and 111 libraries. The GDP and resident population of Xinjiang are derived from the Xinjiang Statistical Yearbook in 2024. Socioeconomic data for all regions (prefectures and cities) originate from the 2023 Statistical Bulletin published by their respective local governments. Traffic data are derived from the National Basic Geographic Information System. ArcGIS 10.8.1 software was used to visualize the above data and establish a database of public cultural facilities in Xinjiang.

2.3. Research Methods

This study employs methods such as the nearest neighbor analysis, kernel density, and others to analyze the spatial differentiation patterns from dimensions including distribution quantity, type, balance, and density characteristics. A dual-dimensional evaluation framework of geographical density and per capita quantity is constructed to explore the level of regional facility equalization and identify spatial mismatch issues. Through the geodetector model, this study quantifies the driving effects of factors on facility distribution and then selects significant influencing factors. The research framework diagram of this study is illustrated in Figure 2.

2.3.1. Nearest Neighbor Index

The nearest neighbor index is an index to measure the proximity extent of public cultural facilities in geographical space. This study uses the nearest neighbor index to represent the spatial distribution type of public cultural facilities in Xinjiang [31]. Its calculation formula is
R = r ¯ 1 r ¯ E ,     r ¯ E = 1 2 D ,     D = n A ,
where R is the average nearest neighbor index, r ¯ 1 represents the actual nearest neighbor distance, r ¯ E is the theoretical nearest neighbor distance, A is the area of the study area, D is the facility density, and n is the number of facilities. When R > 1, the facilities are dispersed uniformly. When R = 1, the facilities are distributed randomly. When R < 1, the facilities are concentrated.

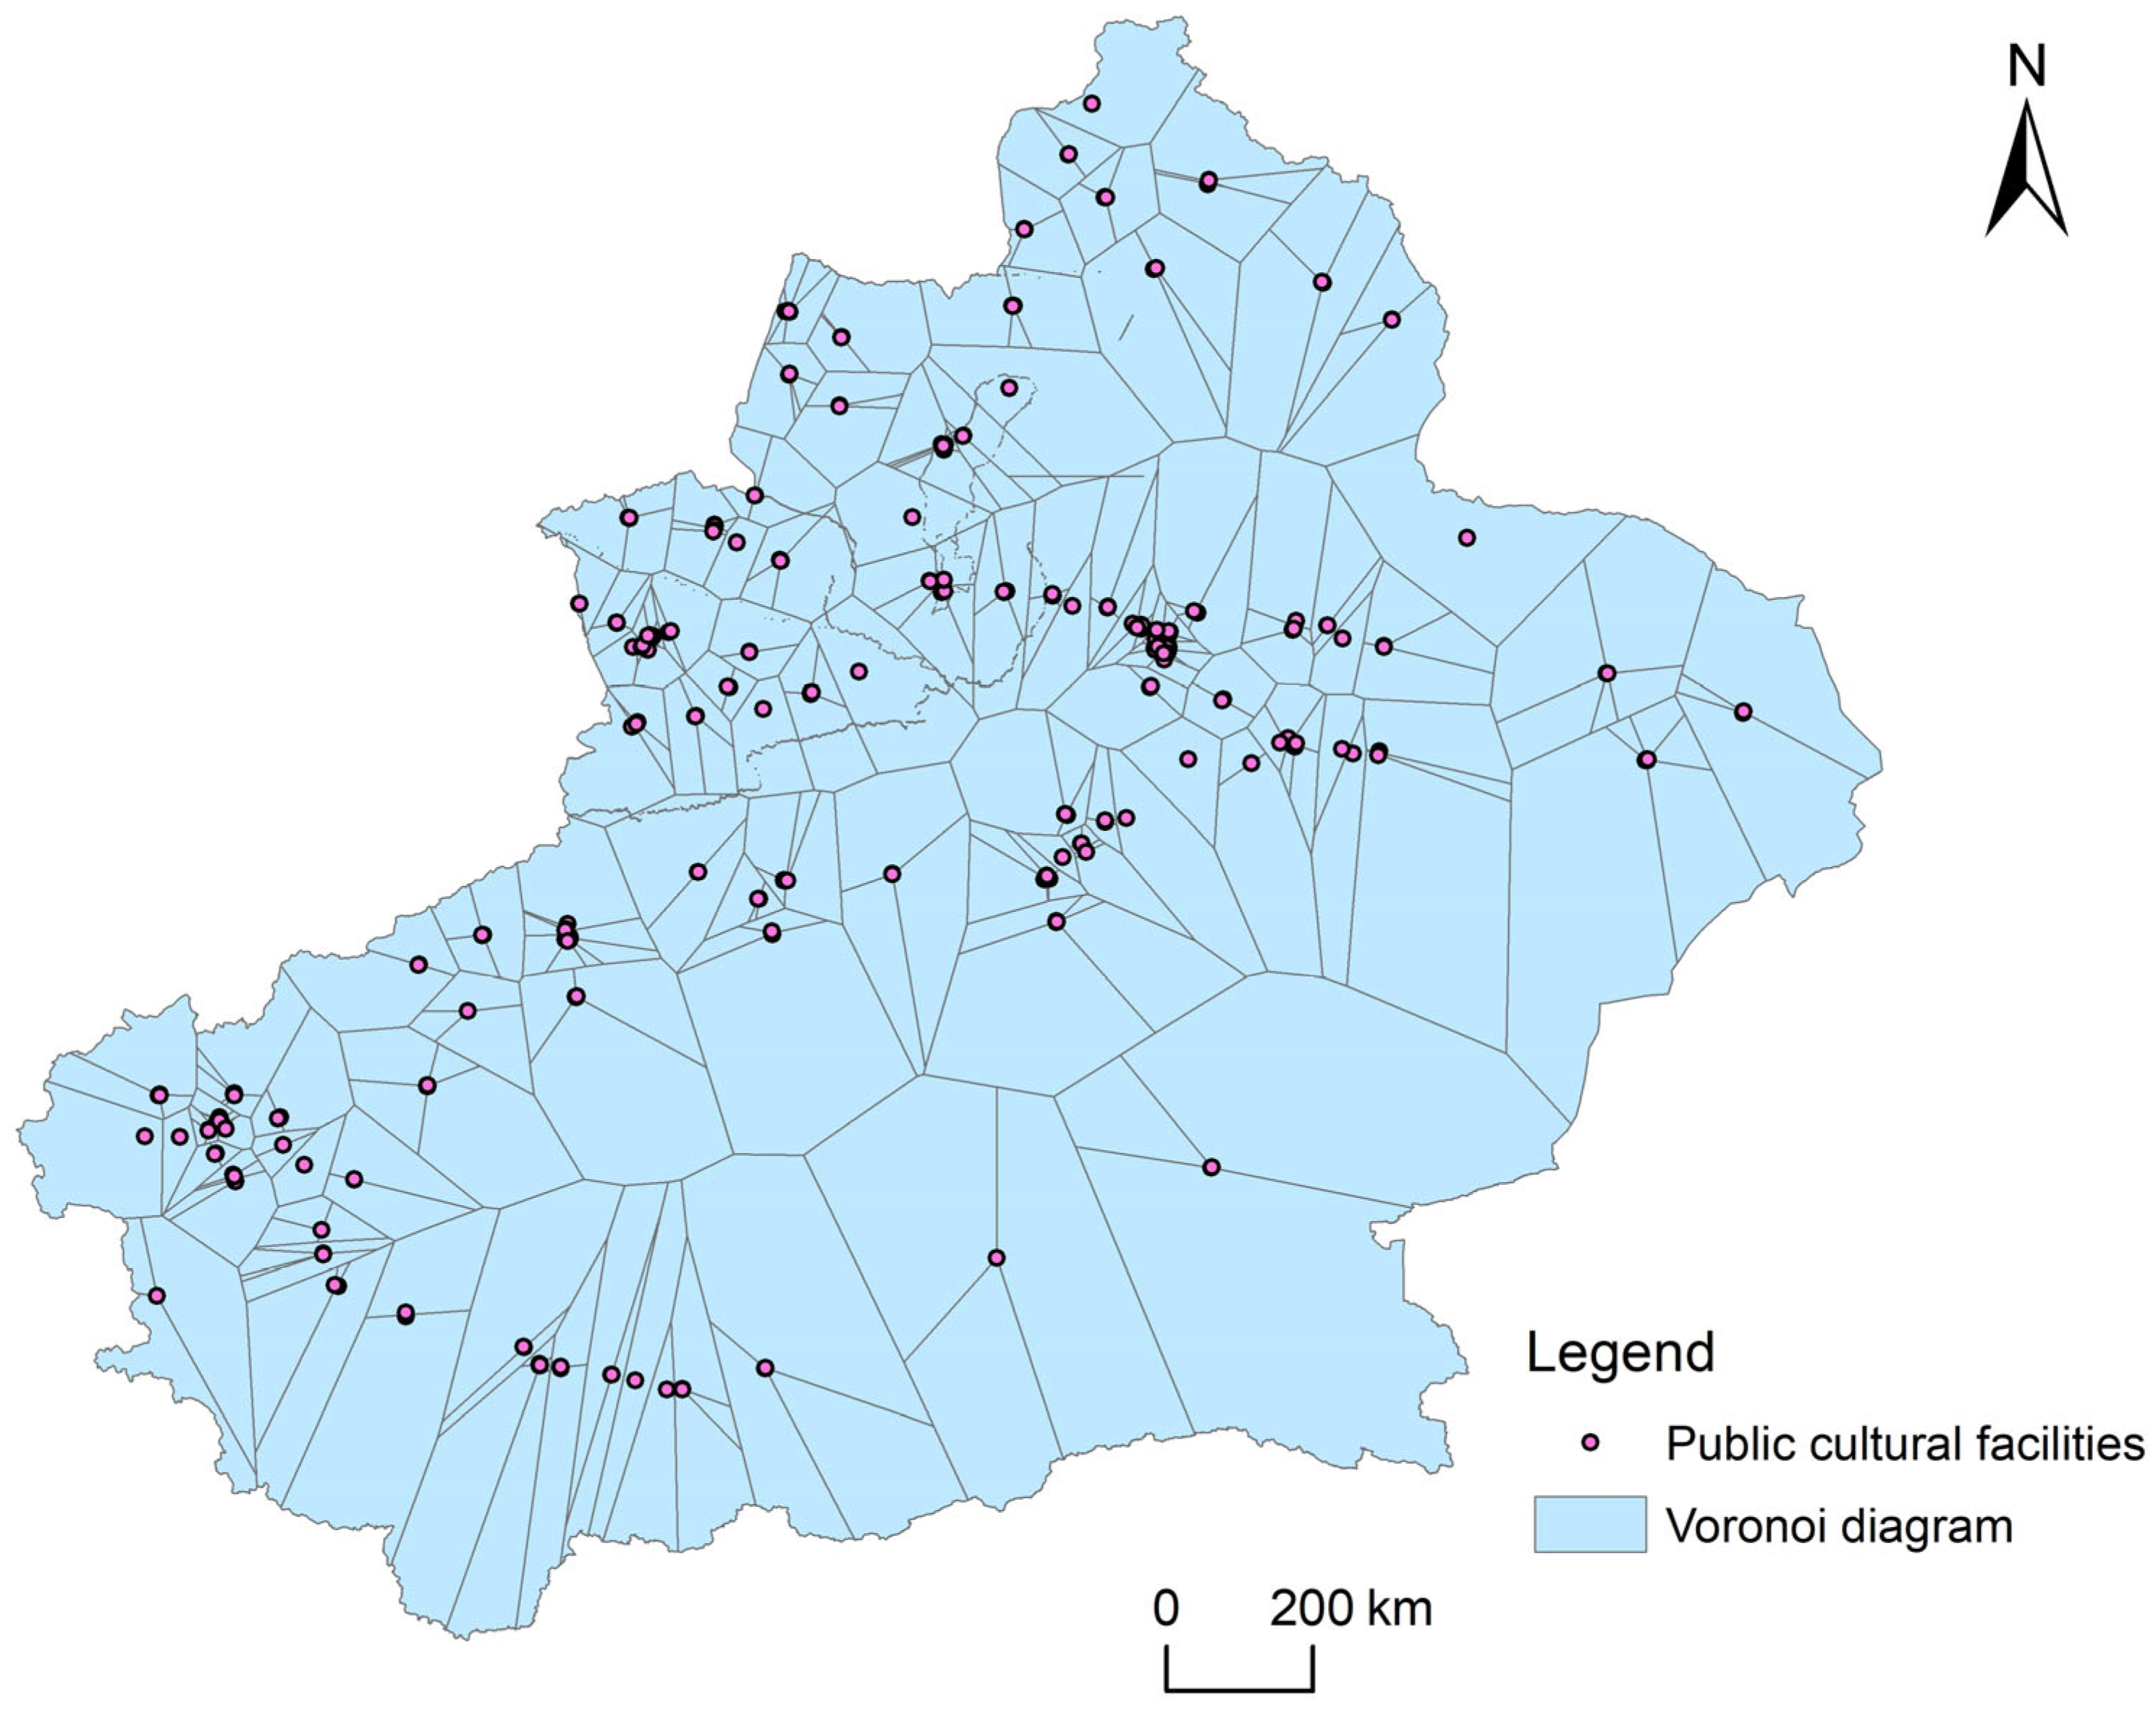
2.3.2. Thiessen Polygons

The Thiessen polygon, also known as the Voronoi diagram, is one of the common methods used to divide discrete sampling points into regions [32]. By calculating the variation coefficient of the Thiessen polygon area, the findings of the nearest neighbor index analysis are further verified. The calculation formula is
C V = S V × 100 % ,
where CV represents the coefficient of variation, which can reflect the discrete nature of point features. When 33% ≤ CV ≤ 64%, the public cultural facilities display a random distribution. When CV > 64%, the distribution of cultural facilities tends to be concentrated. When CV < 33%, the cultural facilities are distributed uniformly.

2.3.3. Disequilibrium Index

The disequilibrium index can measure the unevenness in the distribution of a specific indicator across different regions. Through this index, the degree of the uneven allocation of service offerings in Xinjiang can be measured [33]. The mathematical expression of this index is as follows:
S = i = 1 n Y i 50 n + 1 100 n 50 n + 1 ,
where n is the count of regions, Y represents the cumulative percentage of the number of elements in each region relative to the overall count, arranged in descending order across the i regions, and S has a value between 0 and 1. When S = 0, it implies that the elements are evenly distributed among all regions. When S = 1, all elements are concentrated in one city.

2.3.4. Kernel Density

Kernel density measures point density via the distance decay effect, visually reflecting the clustering degree and spatial clustering areas of public cultural facilities in Xinjiang [34]. The formula is as follows:
f x = 1 n h i = 1 n k x x i h ,
where f x is the estimate of kernel density, k x x i h is the kernel function, n counts the public cultural facilities in Xinjiang, h is the search bandwidth, and x x i measures the distance from valuation point x to facility x i .

2.3.5. Geodetector

Geodetector 2015, a statistical technique based on spatial stratified heterogeneity, includes two key methods: factor detection and interaction detection. Factor detection quantifies the explanatory power of independent variables on dependent variables, while interaction detection measures the combined influence of two factors on the dependent variable. The strength of these influences is measured by the q value [35]. The formula is as follows:
q = 1 h = 1 L N h σ h 2 N σ 2 ,
where q is the detection value of the explanatory ability of the influence factor that plays a role in the process of spatial variation in public cultural facilities. The range of values is [0, 1]. A higher q signifies stronger explanatory capacity for the factor. L is the stratification of the influence factor; N counts the research units; and σ h 2 and σ 2 denote the detected variances of the elemental stratum and the entire region, respectively.

3. Results

3.1. Spatial Differentiation Characteristics of Public Cultural Facilities in Xinjiang

3.1.1. Spatial Quantity Characteristics

The spatial distribution of public cultural facilities in Xinjiang shows a significant imbalance. There are a total of 365 facilities in the region, including 136 museums, 118 cultural centers, and 110 libraries. Based on the average number of facilities per prefecture-level city of 26, the prefectures with a higher number include Kashgar Prefecture (45), Urumqi City (40), Ili Kazakh Autonomous Prefecture (37), Bayingolin Mongolian Autonomous Prefecture (34), Changji Hui Autonomous Prefecture (31), and Aksu Prefecture (30). The regions with a lower number include Tacheng Prefecture (26), Altay Prefecture (24), Hotan Prefecture (24), Bortala Mongol Autonomous Prefecture (18), Hami City (15), Karamay City (15), Turpan City (13), and Kizilsu Kirgiz Autonomous Prefecture (13). From the perspective of facility types, this imbalance is even more prominent. In terms of museums, Urumqi City has the most facilities, with 20, reflecting the dominant role of administrative centers in the allocation of cultural resources. Kizilsu Kirgiz Autonomous Prefecture has the fewest, with only 3. In the fields of cultural centers and libraries, Kashgar Prefecture leads with 17 cultural centers and 13 libraries, which are related to the preservation of intangible cultural heritages such as Kyrgyz folk music and dance. Meanwhile, Turpan City and Hami City have the fewest in these two types of facilities, both with 4. These two regions have smaller populations, highlighting the impact of population size on the allocation of basic services. The results show the imbalance in the spatial distribution of various public cultural facilities among regions in Xinjiang.

3.1.2. Spatial Distribution Type

In the above study, the imbalance in the distribution of spatial quantities was discovered. Through the nearest neighbor index and the Thiessen polygon analysis, the spatial distribution types of public cultural facilities in Xinjiang were further explored (Table 1). The findings indicate that the nearest neighbor index and Z value of the overall distribution are 0.087 and −33.363 (p < 0.01), and the distribution of public cultural facilities in geographical space is clustered. The spatial heterogeneity was tested using the Thiessen polygon variation coefficient to validate this finding (Figure 3). The results show that the average area of the Thiessen polygon is 9453.94 km2, the standard deviation is 4624.43 km2, and the coefficient of variation is as high as 204.43%, which is much higher than the criterion of agglomeration distribution (64%). This result is in line with the results of the nearest neighbor index analysis. The results of these two methods are consistent, indicating that public cultural facilities in Xinjiang are distributed in clusters, and the degree of clustering is quite obvious. Further classification analysis of three types of cultural facilities reveals the following nearest neighbor index (NNI) values: museums have an NNI of 0.523, cultural centers 0.617, and libraries 0.684. All these values are less than 1, indicating an agglomerated distribution pattern, though there are differences in agglomeration intensity. Among them, museums have the highest degree of agglomeration (the lowest NNI value), followed by cultural centers, and finally libraries. Museums are usually built based on historical and cultural resources and high-level urban construction, with a wide service scope and strong radiation capability. They need to concentrate their superior resources on creating landmark cultural venues, thus having the highest degree of concentration. Cultural centers and libraries have a smaller service radius and pay more attention to covering communities and grassroots levels. Their distribution is relatively scattered but still shows a certain trend of concentration.

3.1.3. Spatial Distribution Equilibrium

To assess the balanced spatial allocation of public cultural facilities in Xinjiang, we examined the relative differences in how cultural facilities are distributed across cities, calculated the disequilibrium index, and used Origin 2024 software to plot a Lorenz curve for an intuitive visualization of spatial disparities in public cultural resource distribution [36]. The calculation results show that the disequilibrium index of public cultural facilities in Xinjiang is 0.238, which falls within the range of 0 to 1. This indicates a marked equilibrium in the spatial allocation of facilities across cities. In terms of categories, the disequilibrium index of museums, cultural centers, and libraries is S2 = 0.284, S3 = 0.241, and S4 = 0.217, respectively, all falling within the range of 0 to 1. It indicates that all three categories of facilities belong to the disequilibrium type. The larger the Lorenz curve bulges, the greater the uneven distribution of facilities between regions (Figure 4). On the whole, the quantity in Kashgar, Urumqi, and Ili Kazakh Autonomous Prefecture is larger, accounting for more than 30% of the total. Kizilsu Kirgiz Autonomous Prefecture is the lowest, with a relatively low proportion of all types of facilities. Regions such as Urumqi and Kashgar have high population density, with a permanent population of over four million. The total demand for public cultural facilities is large, which prompts the government and social resources to concentrate their investment. The population of Kizilsu Kirgiz Autonomous Prefecture is small and scattered in mountainous areas, making it difficult to support the construction of large-scale cultural facilities, resulting in a relatively small number of facilities. It can be seen that the five prefectures and cities of Urumqi, Kashgar, Changji Hui Autonomous Prefecture, Bayingolin Mongolian Autonomous Prefecture, and Ili Kazakh Autonomous Prefecture occupy nearly 60% of the museums, while the top five cities with a high proportion of cultural centers and library facilities account for nearly 50% of the total facilities. It shows that the distribution of facilities in museums is the most unbalanced, while the distribution of facilities in libraries is relatively balanced. The disequilibrium of cultural centers is between museums and libraries.

3.1.4. Spatial Distribution Density

To further reveal the fairness of spatial allocation, combined with kernel density analysis, the calculation and analysis of the kernel density values of various public cultural facilities in Xinjiang were conducted, and the following conclusions were drawn: the extreme values of kernel density have obvious administrative center orientation, the kernel density values of state capital cities are generally higher than those of the surrounding areas, and the spatial diffusion follows the law of distance attenuation (Figure 5). The spatial distribution generally shows a “1 + 3” differentiation feature of “dense in the northwest and sparse in the southeast”, namely one high-density core agglomeration area and three secondary core agglomeration areas. Among them, the one high-density core agglomeration area is formed with Urumqi as the core, relying on the political, economic, and cultural resource advantages of the capital, and the policy support and financial input intensity far exceed those of other regions, forming a significant central agglomeration effect. While the three secondary core agglomeration areas in Ili Kazakh Autonomous Prefecture, Bayingolin Mongolian Autonomous Prefecture, and Kashgar Prefecture although their facility density is lower than that of the core agglomeration area, it is significantly higher than that of the surrounding areas, making them secondary cultural hubs that undertake regional cultural radiation functions. At the same time, the belt-shaped agglomeration areas formed along the northern and southern slopes of the Tianshan Mountains have a facility distribution density gradient between the core area and the peripheral area, forming a spatial corridor connecting “one core and three poles”. The Tianshan Mountains, as the geographical central axis of Xinjiang, have oasis belts along their northern and southern slopes as the main distribution areas of population and cities. The transportation trunk lines connect the urban agglomerations, reducing the construction and operation costs of cultural facilities and promoting their agglomeration along the belts. However, in the southeastern areas such as Ruoqiang County and Qiemo County in Bayingolin Mongolian Autonomous Prefecture, due to their location on the edge of the Taklimakan Desert, with vast land and sparse population and inconvenient transportation, the construction and maintenance costs of facilities are high, resulting in a significantly lower core density and forming a “sparse in the southeast” pattern. In terms of classified facilities, museums have the highest concentration intensity, with Urumqi City and Changji Hui Autonomous Prefecture as the core agglomeration areas, radiating around, with banded distribution in the north and dotted distribution in the south. The spatial pattern of cultural centers shows the characteristics of dual-core agglomeration, forming two high-density agglomeration areas in the Urumqi metropolitan area and Kashgar Cultural Area. The library presents the characteristics of multi-center agglomeration, with wide coverage and relatively balanced distribution.

3.2. Measurement of Equalization Level

Xinjiang is a vast region with significant spatial heterogeneity in a regional area and population distribution. To systematically evaluate the level of equalization in the distribution of public cultural facilities, drawing on existing research findings [37,38], the equalization level of the distribution was measured from two dimensions: geographical density and per capita number. Among them, geographical density reflects the spatial coverage efficiency of facilities by calculating the number of facilities per unit area and evaluates the adaptability of resource allocation to geographic space. The per capita number (facilities per person) serves as an indicator of public cultural resource accessibility and a tool to evaluate the balance between facility distribution and demographic needs.

3.2.1. Analysis of Geographical Density Equalization

From the results of the geographical density analysis (Table 2), the average geographical density of public cultural facilities in Xinjiang is 2.147 units per 10,000 km2. Regarding regional distribution, the geographical density of public cultural facilities in northern Xinjiang (4.760 units per 10,000 km2) markedly surpasses that in southern Xinjiang (1.341 units per 10,000 km2), indicating that the distribution in northern Xinjiang is more intensive, and the quantity of facilities in each unit area is significantly greater than that in southern Xinjiang. Looking at the situation of each prefecture and city, there are significant differences in the geographical density. The densities of the three categories of facilities in Urumqi and Karamay are significantly higher than the regional average, forming a dual-core spatial pattern. The densities of the three types of facilities in Urumqi rank first in the region, verifying the agglomeration effect of cultural resources in the capital city. As a secondary high-density center, Karamay has a balanced distribution of the three facilities, showing the characteristic of homogeneous facilities in resource-based cities. Together with Urumqi, they form a significant small-space and strong agglomeration phenomenon. The facility coverage rates in Bayingolin Mongol Autonomous Prefecture, Hotan Region, etc., are less than 50% of the regional average, reflecting the obvious lag in the construction of public cultural facilities in southern Xinjiang. In contrast, the construction of the three categories of public cultural facilities in Ili Kazakh Autonomous Prefecture and Bortala Mongol Autonomous Prefecture is relatively complete. Further classification analysis shows that the three categories of public cultural facilities in Xinjiang show a highly consistent trend in geographical density distribution (Figure 6). Among them, the polarization distribution difference in the geographical density of museums is the most significant (the range is up to 40 times), while cultural centers and libraries show a relatively balanced trend, reflecting differing sensitivities among facility categories to regional development conditions.

3.2.2. Analysis of Equalization of per Capita Quantity

The per capita distribution of public cultural facilities in Xinjiang was visualized (Figure 7). The data show that Xinjiang’s average per-capita count of public cultural facilities reaches 0.149 per 10,000 people. Regionally, high -per-capita clusters emerged in the northeastern areas—Karamay City, Altay Prefecture, and Boltala Mongolian Autonomous Prefecture—with Karamay leading in both geographical density and per-capita numbers. Low-value clusters, characterized by continuous spatial distribution, dominated Aksu, Kashgar, and Hotan, where per-capita counts remained minimal, Hotan’s 0.096/10,000 people was the lowest in the region. A central subsidence zone appeared in Urumqi City. By facility type, museums exhibited the starkest polarization: high-value areas concentrated in Altay and Boltala, while low-value zones included Hotan, Aksu, Kashgar, Ili, and Kizilsu. Altai’s per capita count was six times Hotan’s. In contrast, cultural centers showed stable, balanced distributions: median-value regions dominated, high-values spread broadly in the east, and only Urumqi remained a low-value outlier. Libraries mirrored cultural centers’ trends, with relatively uniform distributions—Urumqi and Kashgar stood as primary low-value areas. Comparative analysis revealed spatial inequalities in both geographical density and per-capita availability of these facilities. Geographical density disparities far exceeded per-capita gaps, indicating lower equality in density than in per capita access.

3.2.3. Dual-Dimensional Regional Equalization Classification

To systematically identify the structural differences in resource allocation among regions, this study divides the threshold based on the means of geographical density and per capita quantity, constructs a “geographical density–per capita quantity” evaluation matrix, and conducts regional equalization classification. Taking geographical density as the horizontal axis, it is divided into high-density (2.147–28.986] and low-density (0.721–2.147]. Taking per-capita quantity as the vertical axis, it is divided into high per capita (0.149–0.369] and low per capita (0.096–0.149]. Through cross-classification, four development types are formed (Table 3).
The geographical density and per-capita number of public cultural facilities in Xinjiang exhibit significant spatial heterogeneity. The classification of four regional types highlights the structural contradiction between the spatial allocation of these facilities and the population distribution pattern. Dual-dimensional analysis reveals that they present a spatial dislocation of “high density–low per capita” and “low density–high per capita.” Karamay City, Changji Hui Autonomous Prefecture, Boltala Mongolian Autonomous Prefecture, and the Tacheng area are categorized as high-density and high per-capita regions. Karamay benefits from its energy-based economy, strong fiscal capacity, small population, and abundant per-capita cultural resources tied to these facilities. Changji and Tacheng, driven by the radiation effect of the Urumqi metropolitan area, achieve inter-regional resource sharing and optimal allocation through factor flow, elevating both density and per-capita availability. Bortala Mongol Autonomous Prefecture has attained a higher level in both dimensions via endogenous development. Hami, Bayingolin Mongolian Autonomous Prefecture, Kizilsu Kirgiz Autonomous Prefecture, and Altai belong to low-density and high per-capita regions. Although the per-capita occupancy of these facilities exceeds the regional average, their geographical density remains below par due to vast territories and sparse populations. High-density and low per-capita regions include Urumqi, Aksu, Kashgar, and Ili Kazak Autonomous Prefecture. As a regional core, Urumqi’s rapidly growing population and expanding urban scale mean that while the total number of public cultural facilities has increased, population growth has outpaced facility construction, reducing per capita shares. In Aksu, Kashgar, and Ili, large population bases and rapid growth lead to facility increments lagging behind demand, resulting in low per capita cultural resources and hindering service equalization. The Hotan area is the sole low-density and low per-capita region. Constrained by natural conditions and economic limitations, they face challenges in facility construction, such as high costs and limited financial investment stall progress. A large population further dilutes cultural resources, creating a dual-dimensional low level in both density and per-capita availability of these facilities.

3.3. Influencing Factors of the Spatial Distribution of Public Cultural Facilities in Xinjiang

3.3.1. Selection of Indicators

The spatial distribution of public cultural facilities in Xinjiang is affected by multiple factors. Based on the existing research results [27,39,40] and the availability of indicators, this study constructs an explanatory variable system based on the administrative unit scale of 14 prefectures and cities in Xinjiang from six dimensions, including population size, economic level, cultural demand, fiscal capacity, education level, and transportation conditions (Table 4). Here, the annual population number (X1) was selected to indicate the population size. GDP (X2) represented the economic level. The Baidu Index (X3) with “cultural activities” as the keyword quantifies the intensity of cultural demand. Public budget expenditures (X4) represent the fiscal capacity. The number of students in university enrollment (X5) represents the education level. Road network density (X6) measures transportation conditions. The spatial correlation linking the number of cultural facilities to each impact factor was quantitatively analyzed using the geographical detector model. Factor influence q values were calculated to identify leading drivers and their interactive effects on public cultural facility layout, thereby revealing the mechanisms driving spatial differentiation.

3.3.2. Factor Detection

This study employed the geodetector to reveal the explanatory strength of various influencing factors on the distribution of public cultural facilities through spatial heterogeneity analysis. The q value (0 ≤ q ≤ 1) represents the explanatory power of a factor, with higher values indicating greater dominance. The research results (Table 5) show that the explanatory power of each factor, from greatest to least, is population size > cultural demand > economic level > financial capacity > education level > transportation conditions. All of these factors have passed the significance test (p < 0.05), indicating that the index system is well constructed.
Population size is the core driving factor, having the strongest influence on the distribution of public cultural service facilities. The layout of facilities is highly matched with the population quantity. In densely populated areas, facility density coverage is formed through the scale effect of demand, such as in Urumqi and Kashgar, where the number of facilities is positively correlated with the population proportion. Cultural demand and economic level are the main factors, with an explanatory power exceeding 0.70. This indicates that the strength of residents’ participation in cultural activities constitutes the fundamental basis for facility planning, and areas with strong cultural demand tend to have concentrated development of cultural facilities. Cultural facilities are driven by regional economic development, and the layout of facilities needs to consider the economic development status. Financial capacity directly affects the construction standards of facilities, and the service radius of libraries in university concentration areas is 37% shorter than in non-educational areas. Fiscal capacity and education level are secondary factors. The level of fiscal capacity directly affects the planning, implementation, and construction quality of infrastructure. Education level drives the layout of facilities through the demand of the youth group, and the service radius of libraries in university concentration areas is shorter than that in non-educational areas. Transportation conditions are a general factor, having a relatively weak impact on the distribution of facilities. The transportation level affects the convenience for residents to reach cultural facilities.
There are significant differences in the influencing factors and their impact degrees on the spatial distribution of different types of public cultural service facilities. The spatial distribution of museums is mainly influenced by the economic level, with an influence of 0.881. This is because the management and operation costs of museums are high, and their distribution is highly dependent on local finance and capital support. The spatial distribution of cultural centers is most affected by population size, as their services are inclusive and need to cover the grassroots population. Education level is the primary influencing factor for the spatial distribution of libraries, with an influence of 0.792, indicating that the higher the education level and the more universities there are, the more libraries tend to be distributed. Overall, different types of cultural facilities are influenced by different factors, which is in line with the functional positioning of each type of public cultural facility and is in harmony with the surrounding environment.

3.3.3. Interactive Detection

The interaction effects of six factors on the total number of public cultural facilities’ spaces were detected using the interactive detector (Table 6). The interaction effects of each influencing factor all exhibited a dual-factor enhancement phenomenon, that is, the combined effect of the two factors was greater than the individual effects of each factor, presenting a nonlinear characteristic of 1 + 1 > 2. This indicates that the spatial differentiation pattern of public cultural facilities in Xinjiang is the result of the collaborative effect of multiple factors, rather than being dominated by a single factor. Among them, the interaction effect between fiscal capacity and transportation conditions had the most significant impact on the number of facilities, with its factor detection q value being the highest at 0.977. This shows that better fiscal revenue and transportation conditions laid a good foundation for the layout of public cultural service facilities. Through coordinated optimization of fiscal investment and transportation construction, it is possible to promote the sustainable development of regional public cultural service construction. In addition, the interaction effects of population size and transportation conditions (0.946) and population size and cultural demand (0.943) were also relatively significant. This indicates that the population factor holds a core position in the layout of cultural facilities. In areas with dense population and convenient transportation, the accessibility and usage efficiency of cultural facilities are higher, while in areas with dense population and strong cultural demand, the construction scale and density of cultural facilities are larger. This collaborative effect can effectively enhance the spatial coverage and service efficiency of cultural facilities, thereby promoting the rational allocation of cultural resources.

4. Discussion

Based on the above results, further discussion is conducted on the spatial differentiation characteristics and influencing factors of public cultural facilities in Xinjiang. Compared with the studies of previous scholars, this research is innovative to some extent, but it also has limitations.
From the perspective of spatial distribution characteristics, by comprehensively considering the dimensions of quantity, type, balance, and density, an in-depth discussion was conducted on the spatial layout of public cultural facilities. The results show that the distribution of public cultural facilities in Xinjiang presents an agglomeration state characterized by the orientation of administrative centers, which is consistent with Zhang’s conclusion on the agglomeration of facilities in the urban center of Tianjin [41]. Urumqi, as the capital of the autonomous region, has strong public cultural financial support, which attracts a large number of facilities and forms a single-core radiation structure. The sub-central regions, such as Ili Kazakh Autonomous Prefecture, Bayingolin Mongolian Autonomous Prefecture, and Kashgar Prefecture, have developed grassland- and Silk Road-themed facility clusters through culture-tourism integration, creating a spatial pattern of diversified key clusters. From the analysis of type characteristics, consistent with He’s research on the spatial distribution of cultural facilities in Beijing [42], the spatial distribution equilibrium of different categories of facilities is significantly different, reflecting the heterogeneity of their functional positioning and service objects. In the analysis of the three types of public cultural facilities, the multi-ethnic cultural background of Xinjiang has led to diverse characteristics in the functions and types of these cultural facilities. Among them, museums exhibit the highest concentration and disequilibrium, largely clustering in highly developed economic regions with abundant historical and cultural resources. This stems from the strong dependence of museum function orientation on resource elements, including historical and cultural foundations and economic-financial support. Ili Kazakh Autonomous Prefecture and Kashgar Prefecture have established a museum cluster centered on the display of ethnic history, relying on rich historical sites and intangible cultural heritage. The layout of these museums closely overlaps with the core area of ethnic culture. In contrast, the distribution of libraries and cultural centers is more widespread. In total, 85% of the cultural centers offer regular activities such as artistic performances and art training. However, the north and south regions of Xinjiang have different focuses. Cultural centers in the southern region place more emphasis on the inheritance of ethnic culture, while those in the north region incorporate modern art exhibitions and digital cultural experiences. The balance of libraries is related to the demand for basic education. Due to the high concentration of universities in the north region of Xinjiang, libraries in the south region focus more on providing basic reading services. In cities like Karamay in the north region, where residents have a higher education level, library resource allocation is more focused on the construction of professional literature and digital resources.
The reason for choosing to study the equality level based on geographical density and population quantity is that Xinjiang has a vast territory with a sparse population, and there are significant differences in regional areas among various prefectures and cities. Therefore, it is necessary to conduct an examination from the two aspects of geographical density and population quantity. The analysis reveals a significant north–south disparity in the equality levels of public cultural facilities across Xinjiang, with the northern region markedly outperforming the south. Geographical conditions and economic factors play a decisive role in the spatial layout of regional facilities. The dual-dimensional equalization evaluation matrix based on geographical density and per capita number breaks through the limitation of traditional single dimensions and reveals the structural contradiction between facility coverage efficiency and population demand adaptation in Xinjiang. It is found that public cultural facilities in Xinjiang have spatial dislocation of high density—low per capita and low density—high per capita. There is a mismatch between high density and low per capita in Urumqi. Keyimu also pointed out this point in his research on cultural facilities in Urumqi [29]. Urumqi has a large population. Although the government has implemented a high-intensity investment in cultural resources, the population growth rate of the core city far exceeds the speed of facility construction, resulting in the dilution effect of public services and showing a spatial mismatch phenomenon. This contradiction arises from lagging service supply during rapid urbanization, leading to a discrepancy between supply and population demand, findings consistent with Deng’s research [43]. In addition, the equalization level of geographical density is significantly lower than the equalization level of per capita number, indicating that natural conditions more prominently constrain the spatial equilibrium in Xinjiang. This reveals the dilemma of facility layout under the characteristics of low population in Xinjiang, which in essence reflects the contradiction between geographical service radius and population density, and reflects the lack of spatial justice. Hotan, as the only double-low region, has low facility coverage and high construction cost, which is consistent with Yu’s conclusion that the vast expanse of territory and low population density result in high costs for facility coverage, exacerbating the issue of spatial equity, and has universal reference significance for ethnic minority areas in western China [44].
Prior research has highlighted that the distribution pattern of public cultural facilities is shaped by multiple factors. The geodetector further validated the comprehensive impacts of population size, cultural demand, economic level, fiscal capacity, education level, and transportation conditions on Xinjiang’s public cultural facility spatial distribution [45]. Population size, cultural demand, and economic level together constitute the main influencing factors, forming the basic framework of facility layout. Population size is the core driving force for the spatial distribution of facilities, echoing the conclusion drawn by Jing et al. based on the public cultural and leisure space in Wuhan [46]. The explanatory power of cultural demand exceeds that of the economic level, which is in sharp contrast to the urban spatial pattern dominated by the economic level in Chengdu [47]. The reason may be that Xinjiang, as a multi-ethnic frontier region, has diversified cultural demand shaped by the unique historical and cultural traditions and living customs of various ethnic groups, which makes cultural demand occupy a more important position in the influence. Fiscal capacity and education level are secondary factors affecting the spatial distribution. The fiscal capacity directly guarantees the scale and quality of facility construction through resource allocation, while the educational level indirectly enhances the utilization rate of facilities through the improvement of cultural consumption capacity [48]. Regions with fiscal endowment advantages usually have more complete financial guarantee mechanisms. The Kashgar region has the strongest fiscal capacity among the 14 prefectures and cities. In 2023, its fiscal expenditure reached CNY 77.341 billion, an increase of 6.2% compared to the previous year. The fiscal expenditure accounted for 51.28% of the regional GDP, demonstrating a strong potential for fiscal resource allocation and providing a strong guarantee for regional infrastructure construction. The influence of education level is lower than expected, which may be related to the highly concentrated layout of colleges and universities in Xinjiang. Most colleges and universities are concentrated in Urumqi, which limits the radiation range of educational resources to the grassroots cultural demand. Contrary to the conclusion put forward by Zhao et al. that transportation conditions are the core elements of the layout of cultural facilities [49], the direct influence of transportation conditions is weak. Xinjiang accounts for 1/6 of the country’s total area, but the population density is only 15.6 people per square kilometer, and it is difficult to cover all areas by relying on transportation networks alone. Transportation conditions are general factors and have a relatively weak impact on the distribution of facilities. The level of transportation affects the convenience for residents to access cultural facilities. In cities with important transportation hubs like Urumqi, the utilization rate of cultural facilities is relatively high. In remote areas due to poor transportation, the accessibility and utilization rate of facilities are low. The construction and improvement of transportation facilities can expand the coverage of facilities, enhance service quality, strengthen the connection between remote areas and urban centers, and improve overall efficiency.

5. Conclusions

In order to reveal the significant differences in the spatial distribution of public cultural facilities in Xinjiang, this study employed methods such as the nearest neighbor index and kernel density estimation to systematically analyze their spatial distribution characteristics from dimensions such as the quantity, types, balance, and density of the facilities. The results show that public cultural facilities in Xinjiang exhibit a significant clustering feature, with an extremely uneven distribution among different prefectures and cities. There are also significant differences in the clustering intensity of different types of facilities, among which the clustering degree of museums is the highest, followed by cultural centers, and libraries are relatively more balanced. The high concentration of museums (NNI = 0.523) is directly related to the concentration of resources in economically developed areas, while the relatively balanced distribution of libraries (S = 0.217) reflects the universal coverage of basic education needs. The density distribution shows a characteristic of “denser in the northwest and sparser in the southeast”, forming a “1 + 3” pattern with Urumqi as the core and Ili Kazakh Autonomous Prefecture, Bayingolin Mongolian Autonomous Prefecture, and Kashgar Prefecture as secondary clustering centers. This model is highly consistent with the “one circle, one belt, and one cluster” strategy proposed in the urban system planning of Xinjiang. It validates the synergy between administrative planning and market mechanisms. The scale effect of Urumqi as the core area and the cultural characteristics of secondary centers such as Kashgar, complement each other, conforming to the hierarchical radiation law of the central place theory. There are significant differences in the levels of equalization of geographical density and per capita quantity, and the level of equalization of geographical density is significantly lower than that of per capita quantity, indicating that natural conditions have a more prominent constraint on the spatial balance of public cultural facilities in Xinjiang. The dual-dimensional analysis shows that there is a spatial misalignment phenomenon of high density—low per capita and low density—high per capita in public cultural facilities in Xinjiang. Through the geodetector to further explore the influencing factors, population size is the key factor affecting the spatial distribution of public cultural facilities, cultural demand and economic level are the main factors, fiscal capacity and education level are secondary factors, and the influence of transportation conditions is relatively weak. The interaction between various factors is significant, especially the interaction between fiscal capacity and transportation conditions is the most prominent.
These findings reveal that the spatial distribution of public cultural facilities in Xinjiang is influenced by the combined effects of natural geography, population distribution, and economic development. For local governments, the planning of public cultural facilities should focus on matching population and geographical conditions, avoiding excessive concentration of facilities, enhancing service coverage in remote areas, optimizing spatial planning and allocation, and promoting regional balance [50]. Our specific suggestions are as follows: Establish a network layout model with core radiation and node linkage, strengthen the function of Urumqi as a cultural hub, promote the matching of facility distribution with population demand and regional area, formulate differentiated allocation standards, and improve the balance and accessibility of services. Based on the type and function of facilities, promote differentiated development of museums, cultural centers, and libraries, and pay attention to the equalization of facilities. For example, museums can focus on showcasing and inheriting Xinjiang’s rich historical and cultural heritage, cultural centers can pay more attention to the promotion of ethnic cultural arts and the organization of mass cultural activities, and libraries can strengthen the construction of literature resources and knowledge dissemination services. Strengthen policy support and assistance and increase fiscal investment in disadvantaged areas. Given that the density of public cultural facilities in the northern part of Xinjiang is relatively high, while it is relatively low in the southern part, more financial investment should be made in cultural infrastructure in the southern region, formulate special policies and establish special funds, and narrow the gap between the north and the south [51]. Regularly conduct dynamic assessment and adjustment of the spatial distribution and resource supply of public cultural facilities throughout Xinjiang. This not only includes paying attention to the balance of facility distribution, but also should focus on the quality and standards of facilities, shifting from merely providing spatial supply to more emphasizing the creation of public satisfaction, in order to better meet the cultural needs of all ethnic groups and enhance cultural soft power [52].
This study has certain limitations. Firstly, due to the limited availability of data and the uniformity of statistical standards, the study selected three types of public cultural facilities—museums, cultural centers, and libraries—as the research objects. The facility data relied on information released by official systems and departments. Other types of cultural facilities were not included in the study scope because the information was not updated in a timely manner or was not included in the public information. Secondly, the list of these three types of facilities was derived from the latest statistics on the official website of Xinjiang in 2024. Subsequent follow-up on the update of statistical information will be conducted to promptly supplement the data, ensuring the timeliness and reliability of the research conclusions. Finally, the dual-dimensional evaluation system of geographical density and per capita quantity takes into account both spatial coverage and population needs. However, it has not yet incorporated internal factors such as facility quality, service level, and the implementation effect of ethnic policies.
Future research can be further deepened by integrating ethnographic fieldwork to analyze the usage preferences of cultural facilities by ethnic minorities. By incorporating subjective indicators such as cultural identity and community participation, a more comprehensive evaluation system can be constructed. Exploring the quality, service level, and policy implementation effect of cultural facilities, comparative studies with other cities can provide experience for Xinjiang to discover its own strengths and weaknesses and promote the optimization of cultural facility layout.

Author Contributions

Conceptualization, X.L. and J.H.; methodology, X.L.; software, X.L.; validation, X.L. and J.H.; formal analysis, X.L.; investigation, X.L.; resources, X.L.; data curation, X.L.; writing—original draft preparation, X.L.; writing—review and editing, X.L. and J.H.; visualization, X.L.; funding acquisition, X.L. All authors have read and agreed to the published version of the manuscript.

Funding

This research was funded by the Philosophical and Social Science Innovation Platform of the Autonomous Region “Xinjiang Normal University Institute for Cultural Nourishment of Xinjiang” Think Tank Project (grant number: ZK2024C02), the Xinjiang Social Science Foundation Project (grant number: 2023BYJ030), and the Doctoral Research Startup Funded Project of Xinjiang Normal University (grant number: 2022D01A97).

Institutional Review Board Statement

Not applicable.

Informed Consent Statement

Not applicable.

Data Availability Statement

The original contributions presented in this study are included in the article. Further inquiries can be directed to the corresponding author.

Acknowledgments

We express our gratitude to the anonymous reviewers and editors for their professional comments and suggestions.

Conflicts of Interest

The authors declare no conflicts of interest.

References

  1. Jennings, V.; Larson, L.; Yun, J. Advancing Sustainability through Urban Green Space: Cultural Ecosystem Services, Equity, and Social Determinants of Health. Int. J. Environ. Res. Public. Health 2016, 13, 196. [Google Scholar] [CrossRef]
  2. Burlacu, S.; Rădulescu, C.-V.; Bălu, E.P.; Dobre, F. Socio-Cultural Sustainability for Resilience in Public Services: Strategies for Achieving Inclusive and Equitable Service Delivery. Eur. J. Sustain. Dev. 2023, 12, 3. [Google Scholar] [CrossRef]
  3. Zhao, X.; Moon, J. Analysis of Urban Spatial Accessibility of Museums within the Scope of Seoul. Buildings 2022, 12, 1749. [Google Scholar] [CrossRef]
  4. Sheng, X.; Zhou, Y.; Liu, Y. Can the National Public Cultural Service System Demonstration Zone Promote the Sustainable Development of Urban Culture? Sustainability 2024, 16, 9323. [Google Scholar] [CrossRef]
  5. Aguome, N.M.; Ewurum, N.I.; Ifeanacho, K.P.; Abaa-Okorie, L.C.; Ugwu, C.G. Public recreational facilities as catalyst for urban aging-in-place decision in developing countries. Cities 2024, 155, 105448. [Google Scholar] [CrossRef]
  6. Mouratidis, K. Urban planning and quality of life: A review of pathways linking the built environment to subjective well-being. Cities 2021, 115, 103229. [Google Scholar] [CrossRef]
  7. Cui, X.; Ma, L.; Tao, T.; Zhang, W. Do the supply of and demand for rural public service facilities match? Assessment based on the perspective of rural residents. Sustain. Cities Soc. 2022, 82, 103905. [Google Scholar] [CrossRef]
  8. Herrero-Jauregui, C.; Arnaiz-Schmitz, C.; Herrera, L.; Smart, S.M.; Montes, C.; Pineda, F.D.; Fe Schmitz, M. Aligning landscape structure with ecosystem services along an urban-rural gradient. Trade-offs and transitions towards cultural services. Landsc. Ecol. 2019, 34, 1525–1545. [Google Scholar] [CrossRef]
  9. Ouyang, X.; Tang, L.; Wei, X.; Li, Y. Spatial interaction between urbanization and ecosystem services in Chinese urban agglomerations. Land Use Policy 2021, 109, 105587. [Google Scholar] [CrossRef]
  10. Mariano, R.; Vårheim, A. Libraries, museums and cultural centers in foreign policy and cultural diplomacy: A scoping review. J. Doc. 2022, 78, 651–672. [Google Scholar] [CrossRef]
  11. Liu, H.; Liu, M.; Hu, X.; Guo, X. Temporal and spatial evolution of Chinese museums and their causes analysis. Trop. Geogr. 2022, 42, 469–480. [Google Scholar]
  12. Pfeifere, D. The issues of defining and classifying cultural centres. Econ. Cult. 2022, 19, 28–37. [Google Scholar] [CrossRef]
  13. Li, G.; Jiang, G. Construction and planning of library service facilities system based on public digital culture education in international cultural metropolis. Open House Int. 2019, 44, 64–67. [Google Scholar] [CrossRef]
  14. Zhu, B.; Ma, R.; Luo, M.; Wu, L.; Fu, W. An Identification Method of the Externality of Cultural Facilities from the Perspective of Spatial Distribution of Cultural Industry: A Case Study of Ningbo, China. Buildings 2023, 13, 692. [Google Scholar] [CrossRef]
  15. Jiang, Z. Exploring the spatial dynamics of cultural facilities based on multi-source data: A case study of Nanjing’s art institutions. Open Geosci. 2023, 15, 20220532. [Google Scholar] [CrossRef]
  16. Awad, J.; Jung, C. Extracting the Planning Elements for Sustainable Urban Regeneration in Dubai with AHP (Analytic Hierarchy Process). Sustain. Cities Soc. 2022, 76, 103496. [Google Scholar] [CrossRef]
  17. Wu, T.; He, J.; Li, Q. Research on the suitability of urban cultural facilities supply and demand based on multi-source data. In Proceedings of the International Conference on Smart Transportation and City Engineering (STCE 2023), Chongqing, China, 16–18 December 2023; SPIE: Bellingham, WA, USA, 2024; Volume 13018, pp. 1094–1100. [Google Scholar]
  18. Huang, S.; Wei, Z. Planning for Public Cultural Facilities in the Municipal Area from the Perspective of Territory Planning. ICCREM 2024 2025, 1201–1210. [Google Scholar] [CrossRef]
  19. Liu, Z.; Huang, Q.; Yang, H. Supply-demand spatial patterns of park cultural services in megalopolis area of Shenzhen, China. Ecol. Indic. 2021, 121, 107066. [Google Scholar] [CrossRef]
  20. Peng, J.; Liu, Y.; Ruan, Z.; Yang, H. Study on the optimal allocation of public service facilities from the perspective of living circle—A case study of Xiangyang High-tech Zone, China. J. Urban Manag. 2023, 12, 344–359. [Google Scholar] [CrossRef]
  21. Mansour, S.; Alahmadi, M.; Abulibdeh, A. Spatial assessment of audience accessibility to historical monuments and museums in Qatar during the 2022 FIFA World Cup. Transp. Policy 2022, 127, 116–129. [Google Scholar] [CrossRef]
  22. Cheng, W.; Wu, J.; Moen, W.; Hong, L. Assessing the spatial accessibility and spatial equity of public libraries’ physical locations. Libr. Inf. Sci. Res. 2021, 43, 101089. [Google Scholar] [CrossRef]
  23. Liu, J.; Zhang, L.; Zhang, N. Analyzing the South-North Gap in the High-Quality Development of China’s Urbanization. Sustainability 2022, 14, 2178. [Google Scholar] [CrossRef]
  24. Wang, H.; Chen, J.; Xu, K. Spatial Distribution and Territorial Justice of Public Service for Disadvantaged Groups: Evidence from China. Soc. Indic. Res. 2024, 172, 741–763. [Google Scholar] [CrossRef]
  25. Chen, W.; Yang, L.; Wu, J.; Wu, J.; Wang, G.; Bian, J.; Zeng, J.; Liu, Z. Spatio-temporal characteristics and influencing factors of traditional villages in the Yangtze River Basin: A Geodetector model. Herit. Sci. 2023, 11, 111. [Google Scholar] [CrossRef]
  26. Yuan, C.; Gan, L.; Zhuo, H. Coupling Mechanisms and Development Patterns of Revitalizing Intangible Cultural Heritage by Integrating Cultural Tourism: The Case of Hunan Province, China. Sustainability 2022, 14, 6994. [Google Scholar] [CrossRef]
  27. Chen, Y.; He, S.; Zhang, M.; Cai, Y. Resident demand-oriented selection and spatial layout strategy for public sports facilities. Proc. Inst. Civ. Eng. Munic. Eng. 2024, 177, 130–143. [Google Scholar] [CrossRef]
  28. Zhou, X.; Zhang, X.; Dai, Z.; Hermaputi, R.L.; Hua, C.; Li, Y. Spatial Layout and Coupling of Urban Cultural Relics: Analyzing Historical Sites and Commercial Facilities in District III of Shaoxing. Sustainability 2021, 13, 6877. [Google Scholar] [CrossRef]
  29. Keyimu, M.; Abulikemu, Z.; Abudurexiti, A. Quantitative Evaluation of the Equity of Public Service Facility Layout in Urumqi City for Sustainable Development. Sustainability 2024, 16, 4913. [Google Scholar] [CrossRef]
  30. Chen, C. Discussion on the Optimization Method of Public Service Facility Layout from the Perspective of Spatial Equity: A Study Based on the Central City of Shanghai. Land 2023, 12, 1780. [Google Scholar] [CrossRef]
  31. Jia, A.; Liang, X.; Wen, X.; Yun, X.; Ren, L.; Yun, Y. GIS-Based Analysis of the Spatial Distribution and Influencing Factors of Traditional Villages in Hebei Province, China. Sustainability 2023, 15, 9089. [Google Scholar] [CrossRef]
  32. Yang, L.; Zhao, Y.; Yuan, W.; Jia, X. GIS-Based Analysis of the Regional Typology of Neolithic Archaeological Cultures in the Taihu Lake Region of China. Land 2024, 13, 244. [Google Scholar] [CrossRef]
  33. Song, J.; Jiang, W.; He, L. Spatial distribution characteristics and influencing factors of star-level rural tourism areas in Jiangsu Province. Chin. J. Eco-Agric. 2021, 29, 366–378. [Google Scholar]
  34. Qi, J.; Lu, Y.; Han, F.; Ma, X.; Yang, Z. Spatial Distribution Characteristics of the Rural Tourism Villages in the Qinghai-Tibetan Plateau and Its Influencing Factors. Int. J. Environ. Res. Public Health 2022, 19, 9330. [Google Scholar] [CrossRef] [PubMed]
  35. Zhang, Z.; Li, Q.; Hu, S. Intangible Cultural Heritage in the Yellow River Basin: Its Spatial-Temporal Distribution Characteristics and Differentiation Causes. Sustainability 2022, 14, 11073. [Google Scholar] [CrossRef]
  36. Xu, R.; Yue, W.; Wei, F.; Yang, G.; Chen, Y.; Pan, K. Inequality of public facilities between urban and rural areas and its driving factors in ten cities of China. Sci. Rep. 2022, 12, 13244. [Google Scholar] [CrossRef]
  37. Zeng, P.; Zong, C. Research on the relationship between population distribution pattern and urban industrial facility agglomeration in China. Sci. Rep. 2023, 13, 16225. [Google Scholar] [CrossRef]
  38. Lou, X. Research on multidimensional impact assessment model of public cultural service facilities in Henan Province rural. Appl. Math. Nonlinear Sci. 2024, 9. [Google Scholar] [CrossRef]
  39. Wang, W.; Fu, M.; Hu, Q. The Behavioral Pattern of Chinese Public Cultural Participation in Museums. Sustainability 2020, 12, 2890. [Google Scholar] [CrossRef]
  40. Li, S.; Liu, S.; Ding, X. Exploring the spatial distribution pattern and influencing factors of Shanghai’s cultural functional elements based on the point of interest data. Open House Int. 2023, 48, 504–520. [Google Scholar] [CrossRef]
  41. Zhang, S.; Xu, S.; Wan, D.; Liu, H.; Zhao, L.; Guo, L.; Ren, J. Equalization Measurement and Optimization of the Public Cultural Facilities Distribution in Tianjin Central Area. Sustainability 2023, 15, 4856. [Google Scholar] [CrossRef]
  42. He, D.; Chen, Z.; Ai, S.; Zhou, J.; Lu, L.; Yang, T. The Spatial Distribution and Influencing Factors of Urban Cultural and Entertainment Facilities in Beijing. Sustainability 2021, 13, 12252. [Google Scholar] [CrossRef]
  43. Deng, Y.; Liu, J.; Luo, A.; Wang, Y.; Xu, S.; Ren, F.; Su, F. Spatial Mismatch between the Supply and Demand of Urban Leisure Services with Multisource Open Data. ISPRS Int. J. Geo-Inf. 2020, 9, 466. [Google Scholar] [CrossRef]
  44. Yu, Y. Spatial Distribution and Influencing Factors of Public Cultural Service Facilities in Inner Mongolia. Front. Econ. Cult. 2024, 2, 11–14. [Google Scholar]
  45. Zhao, K.; Cao, X.; Wu, F.; Chen, C. Spatial Pattern and Drivers of China’s Public Cultural Facilities between 2012 and 2020 Based on POI and Statistical Data. ISPRS Int. J. Geo-Inf. 2023, 12, 273. [Google Scholar] [CrossRef]
  46. Jing, Y.; Liu, Y.; Cai, E.; Liu, Y.; Zhang, Y. Quantifying the spatiality of urban leisure venues in Wuhan, Central China—GIS-based spatial pattern metrics. Sustain. Cities Soc. 2018, 40, 638–647. [Google Scholar] [CrossRef]
  47. Li, Q.; Cui, C.; Liu, F.; Wu, Q.; Run, Y.; Han, Z. Multidimensional Urban Vitality on Streets: Spatial Patterns and Influence Factor Identification Using Multisource Urban Data. ISPRS Int. J. Geo-Inf. 2022, 11, 2. [Google Scholar] [CrossRef]
  48. Liang, L.; Wu, Y.; Chu, J. Applying Spatial Techniques in Understanding Evolution and Accessibility of Cultural Facilities based on Multi-Source Data: A Case Study in Xiamen, China. J. Eng. Res. 2022, 10. [Google Scholar] [CrossRef]
  49. Zhao, H.; Yu, D.; Miao, C.; Li, G.; Feng, Y.; Bie, Q. The Location Distribution Characteristics and Influencing Factors of Cultural Facilities in Zhengzhou Based on POI Data. Sci. Geogr. Sin. 2018, 38, 1525–1534. [Google Scholar]
  50. Chiu, Y.-H.; Lee, M.-S.; Wang, J.-W. Culture-led urban regeneration strategy: An evaluation of the management strategies and performance of urban regeneration stations in Taipei City. Habitat Int. 2019, 86, 1–9. [Google Scholar] [CrossRef]
  51. Zarei, H.; Yazdifar, H.; Ghaleno, M.D.; Namazi, N. National culture and public-sector budgeting: The mediating role of country-level institutions using a structural equation modeling approach. J. Appl. Account. Res. 2021, 23, 686–714. [Google Scholar] [CrossRef]
  52. Goussios, D.; Faraslis, I. Integrated Remote Sensing and 3D GIS Methodology to Strengthen Public Participation and Identify Cultural Resources. Land 2022, 11, 1657. [Google Scholar] [CrossRef]
Figure 1. Location of the study area.
Sustainability 17 04994 g001
Figure 2. Research framework diagram.
Sustainability 17 04994 g002
Figure 3. Thiessen polygons of public cultural facilities in Xinjiang.
Sustainability 17 04994 g003
Figure 4. (a) Lorenz curve of overall public cultural facilities; (b) Lorenz curve of museums; (c) Lorenz curve of cultural centers; and (d) Lorenz curve of libraries.
Sustainability 17 04994 g004
Figure 5. (a) Kernel density of overall public cultural facilities; (b) Kernel density of museums; (c) Kernel density of cultural centers; and (d) Kernel density of libraries.
Sustainability 17 04994 g005aSustainability 17 04994 g005b
Figure 6. The geographical density of three types of public cultural facilities in prefectures and cities of Xinjiang.
Sustainability 17 04994 g006
Figure 7. (a) Per-capita quantity of overall public cultural facilities; (b) per-capita quantity of museums; (c) per-capita quantity of cultural centers; and (d) per-capita quantity of libraries.
Sustainability 17 04994 g007
Table 1. Spatial distribution categories of public cultural facilities in Xinjiang.
Type of Public Cultural FacilityNNIZ ScoreConfidence Level
(p Value)
Spatial Distribution Type
Overall0.087−33.3630.000significant agglomeration
Museum0.523−10.6480.000significant agglomeration
Cultural center0.653−7.2090.000significant agglomeration
Library0.684−6.3630.000significant agglomeration
Table 2. The geographical density of public cultural facilities in prefectures and cities of Xinjiang.
Prefecture/City Number of FacilitiesArea (10,000 km2)Geographical Density
(units/10,000 km2)
Urumqi City401.3828.986
Turpan City136.981.862
Hami City1514.211.056
Kizilsu Kirgiz Autonomous Prefecture137.201.806
Tacheng Prefecture2610.502.476
Karamay City150.7320.548
Changji Hui Autonomous Prefecture317.354.218
Altay Prefecture2411.802.034
Bayingolin Mongolian Autonomous Prefecture3447.150.721
Kashgar Prefecture4516.202.778
Ili Kazakh Autonomous Prefecture375.656.549
Hotan Prefecture2424.810.967
Bortala Mongol Autonomous Prefecture182.726.618
Aksu Prefecture3013.252.264
Total/Average Density365169.982.147
Table 3. Regional development types based on geographical density and per-capita quantity.
Classification DimensionGeographical Density Range (units/10,000 km2)Per-Capita Quantity Range (units/10,000 people)Prefecture/City
high density—high per capita(2.147–28.986](0.149–0.369]Karamay City, Changji Hui Autonomous Prefecture, Tacheng Prefecture, Bortala Mongol Autonomous Prefecture
low density—high per capita(0.721–2.147](0.149–0.369]Turpan City, Hami City, Bayingolin Mongolian Autonomous Prefecture, Kizilsu Kirgiz Autonomous Prefecture, Altay Prefecture
high density—low per capita(2.147–28.986](0.096–0.149]Urumqi City, Aksu Prefecture, Kashgar Prefecture, Ili Kazakh Autonomous Prefecture
low density—low per capita(0.721–2.147](0.096–0.149]Hotan Prefecture
Table 4. Influencing Factors on the Spatial Distribution.
Detection FactorSpecific IndicatorFactorVariable Explanation
Population SizeAnnual Population NumberX1Regional population scale
Economic LevelGDPX2Regional economic scale
Cultural DemandBaidu IndexX3Annual average Baidu index of “culture”
Fiscal CapacityPublic Budget ExpenditureX4Regional public budget expenditure scale
Education LevelUniversity EnrollmentX5Number of university students
Transportation ConditionsRoad Network DensityX6Road length per km2
Table 5. Factor detection results of the quantity of public cultural facilities.
Detection FactorOverallMuseumCultural CenterLibrary
Population Size0.8060.7460.8200.774
Economic Level0.7430.8810.5830.583
Cultural Demand0.7770.6980.6870.752
Fiscal Capacity0.6070.4960.6200.764
Education Level0.5940.3710.6390.792
Transportation Conditions0.3600.2930.3960.312
Table 6. Interactive detection results of the quantity of public cultural facilities.
Detection FactorX1X2X3X4X5X6
X10.806
X20.9370.743
X30.9430.8140.777
X40.8710.8860.8900.607
X50.8780.8770.8750.6200.594
X60.9460.8160.9090.9770.8320.360
Disclaimer/Publisher’s Note: The statements, opinions and data contained in all publications are solely those of the individual author(s) and contributor(s) and not of MDPI and/or the editor(s). MDPI and/or the editor(s) disclaim responsibility for any injury to people or property resulting from any ideas, methods, instructions or products referred to in the content.

