Predicting Business Failure with the XGBoost Algorithm: The Role of Environmental Risk
Abstract
1. Introduction
2. Literature Review
3. Objective, Sample, and Explanatory Variables
3.1. Objective of the Study
3.2. Strength and Environmental Indicators: VADIS and TRUCAM
- (a)
- Propensity of a company to bankruptcy (P2BB): measures the probability that a company will declare bankruptcy within the next 18 months;
- (b)
- Propensity of a company to be sold (P2BSold): measures the likelihood of a company being sold within the next 18 months.
- (c)
- Estimated operational value of the company (VPI EDV): estimates the future operational value of companies associated with a P2BSold indicator and is expressed as a confidence interval (i.e., it has an upper and lower limit).
- Financial and industrial sector data available in databases;
- Publicly disclosed environmental data by a company, if available;
- Trucost’s sector-level environmental profile database covering 464 industry sectors;
- Trucost’s proprietary supply chain mapping model.
- Greenhouse gases;
- Water;
- Waste;
- Air pollutants;
- Land and water pollutants;
- Use of natural resources.
- (a)
- Automated error checking: Inconsistencies and anomalies in the data are checked;
- (b)
- Comparison with previous years: the disclosures of a company are compared with its own models and actual data from previous years;
- (c)
- Adjustments: data are adjusted when companies correct errors in their disclosures.
3.3. Sample Selection
3.4. Selection and Definition of Explanatory Variables
4. Analysis of Variables
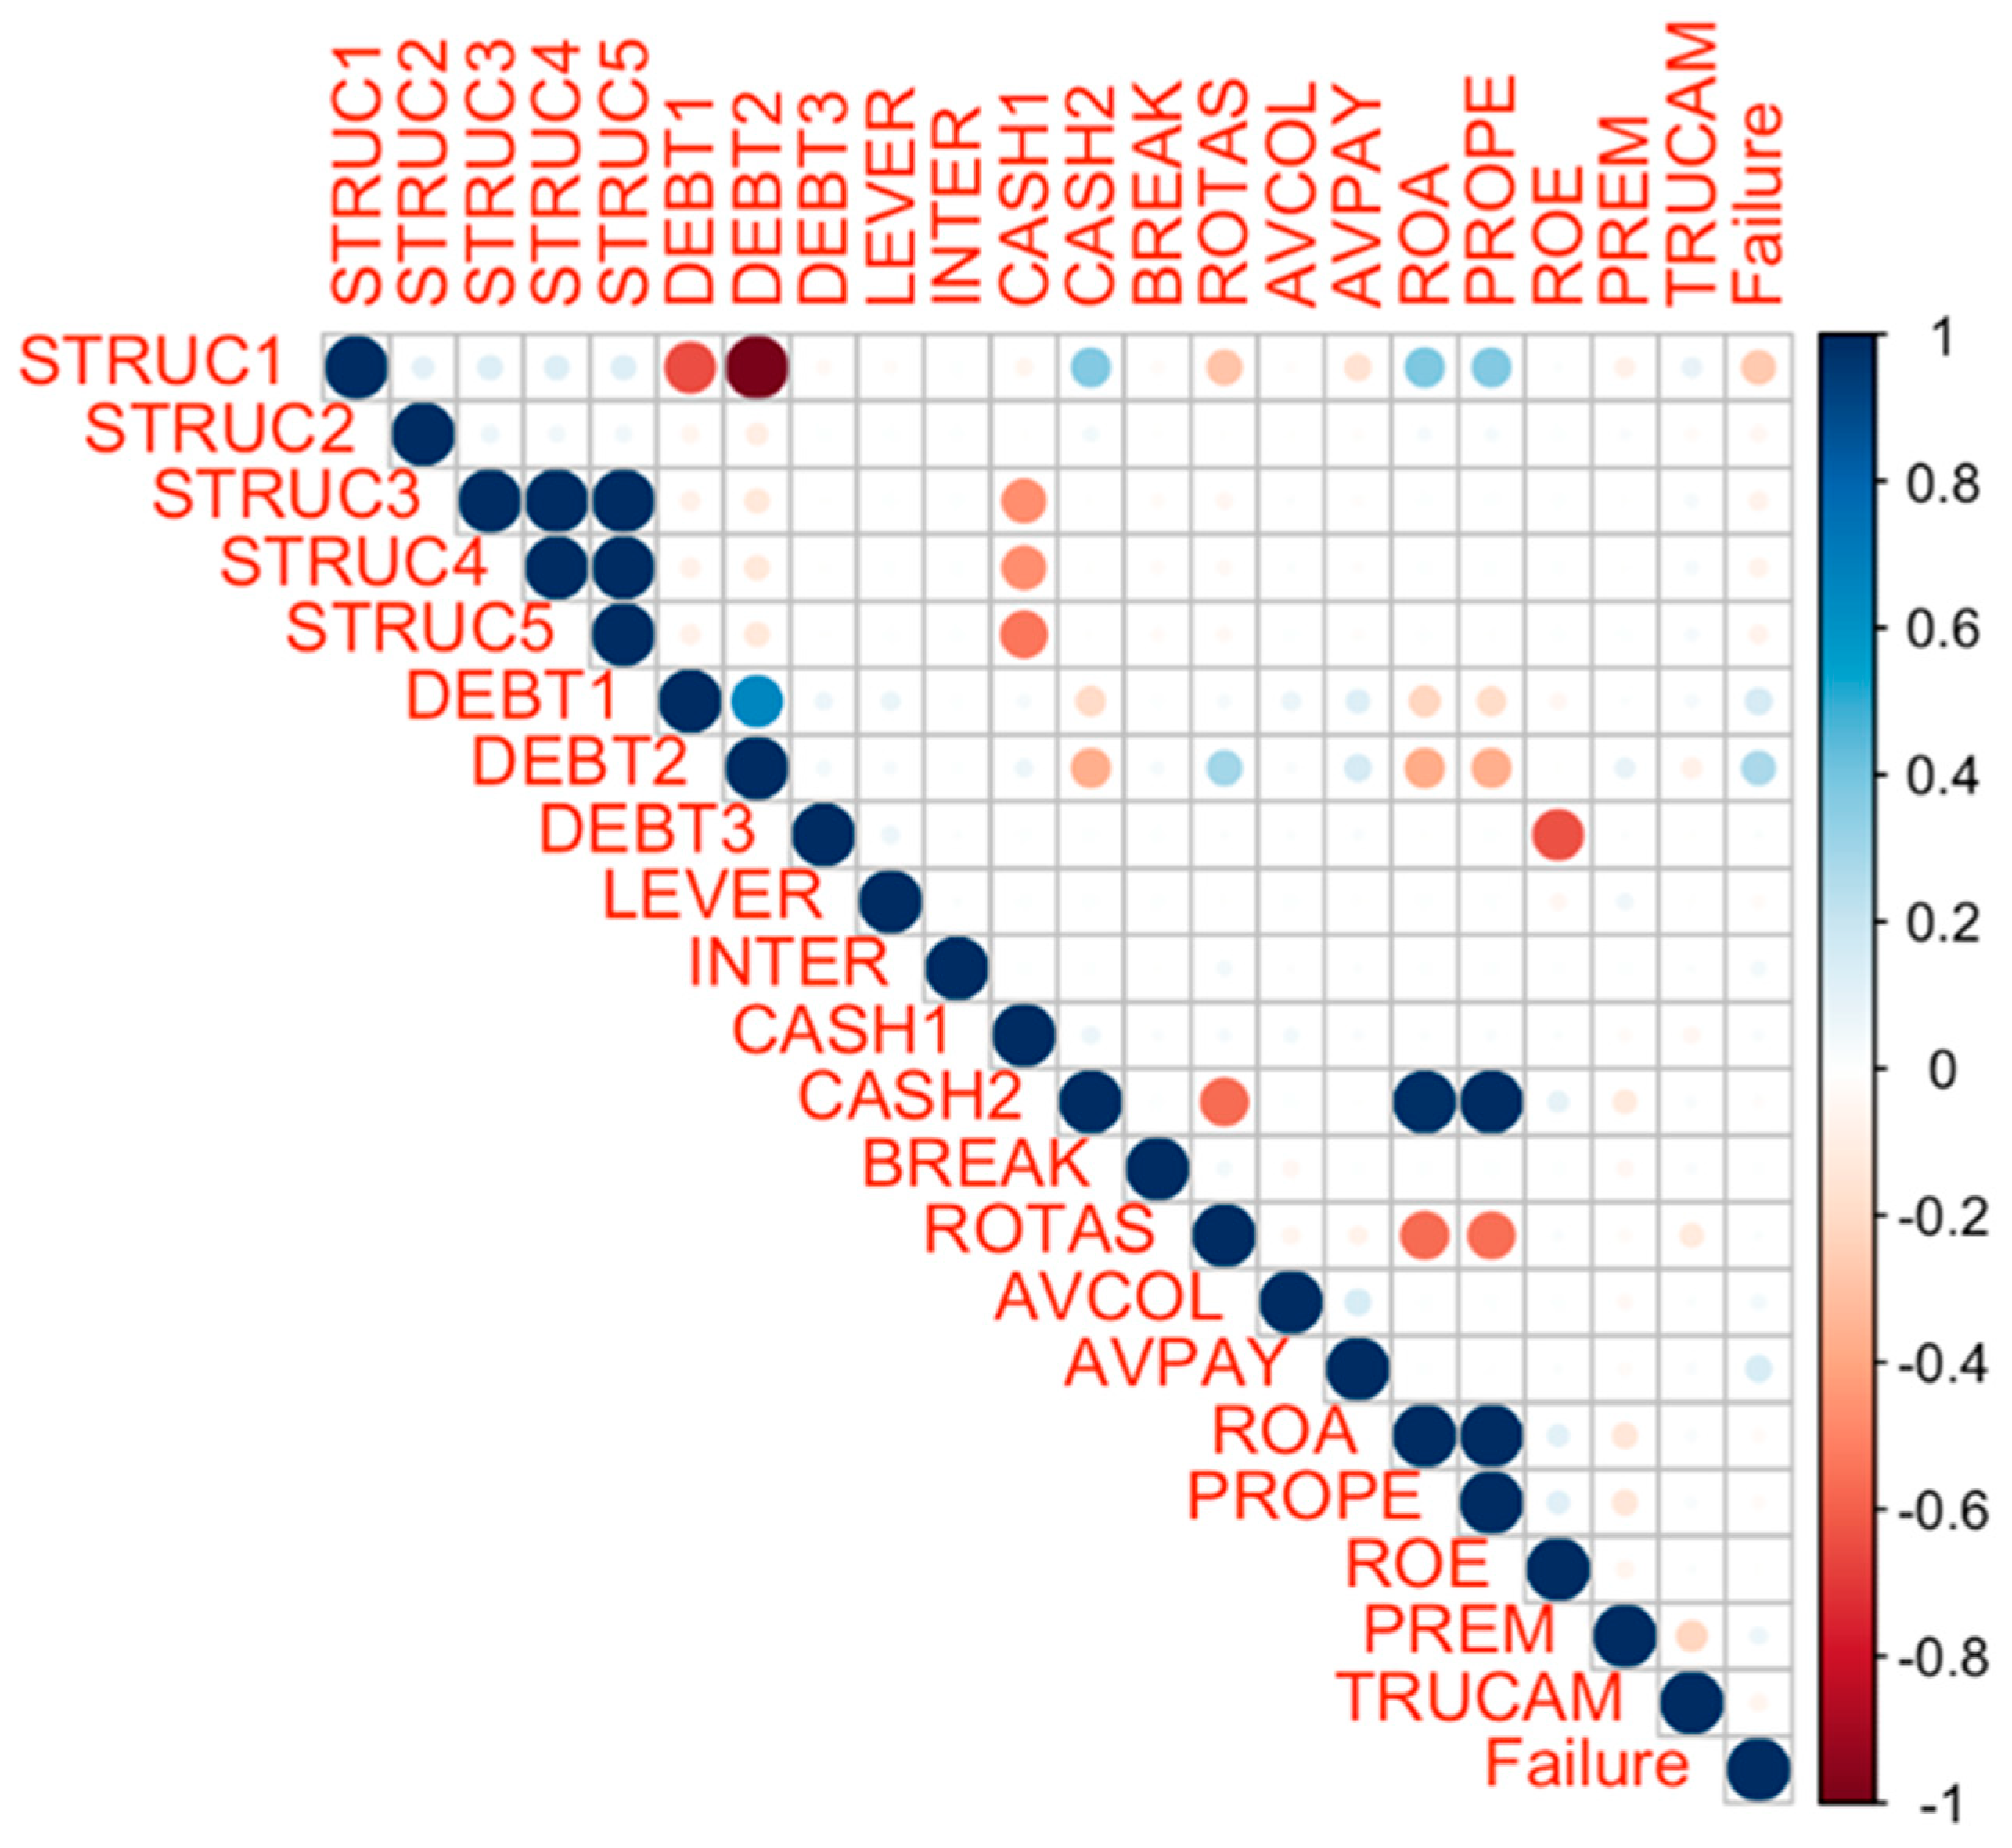
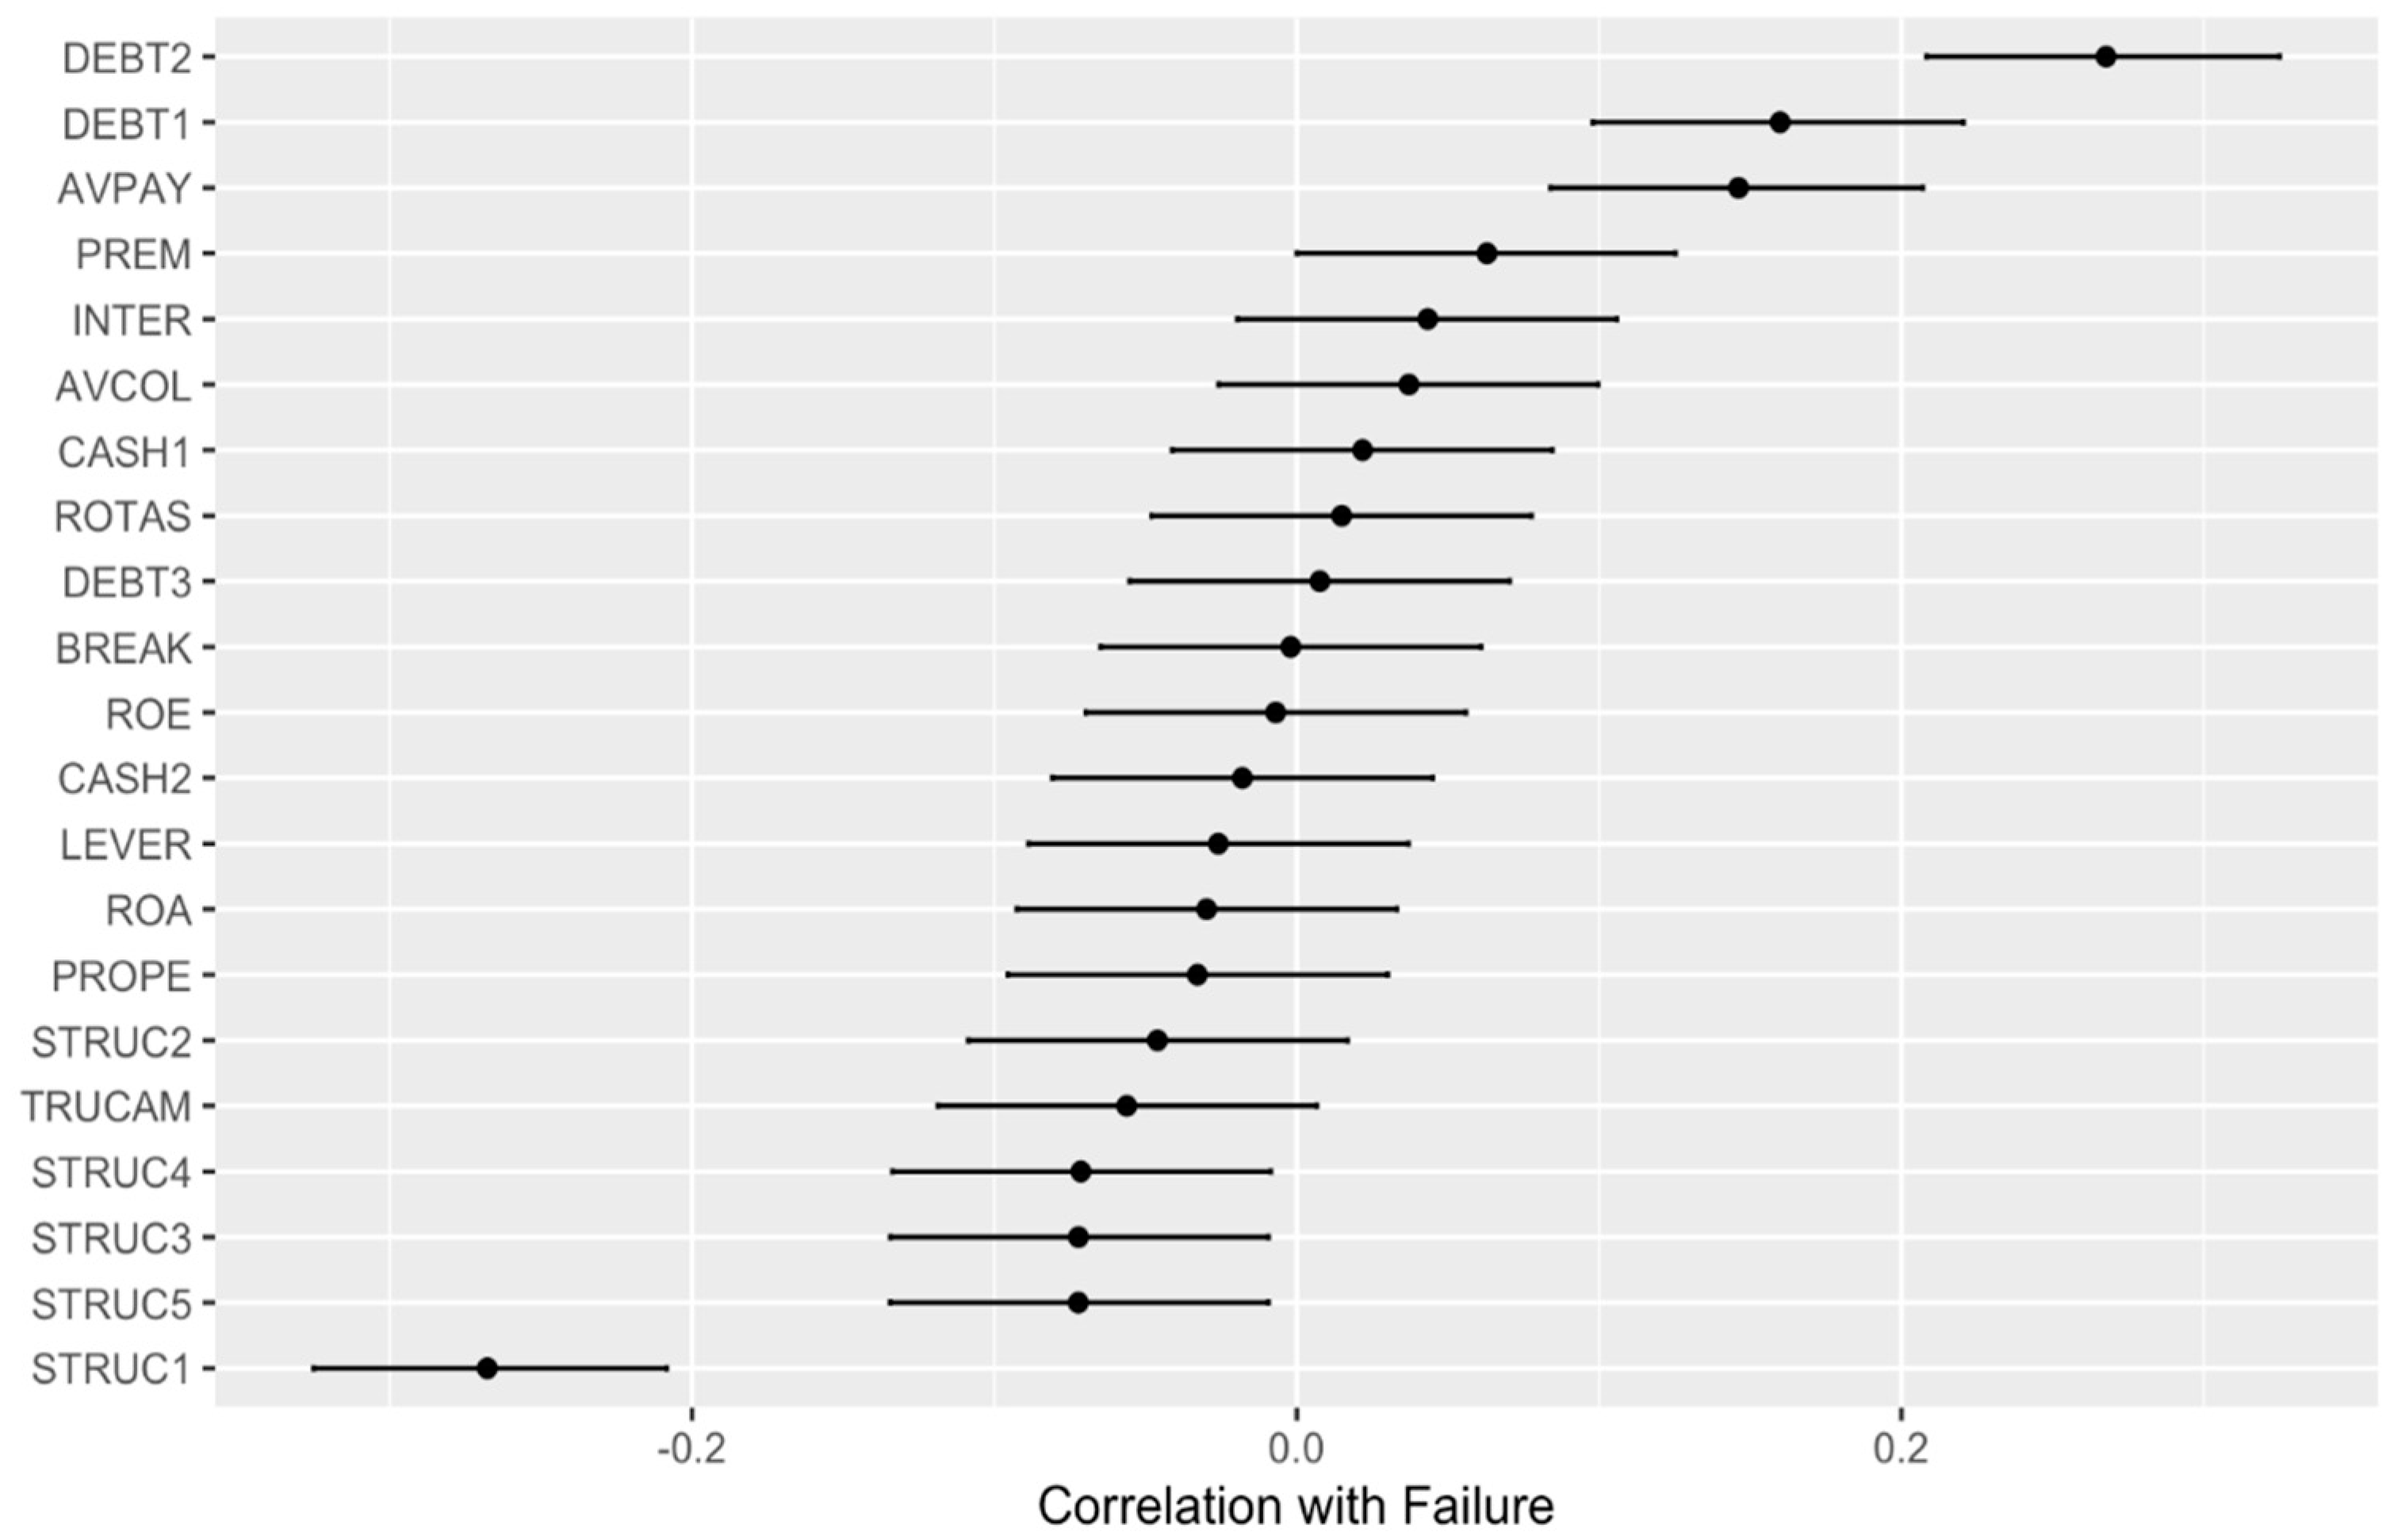
4.1. Analysis of Correlations
- –
- XGBoost includes integrated regularization mechanisms that penalize model complexity, reducing the impact of variable correlations. It prunes decision tree branches that do not provide significant information, minimizing the overload caused by correlations.
- –
- XGBoost emphasizes identifying nonlinear interactions between variables rather than solely considering their individual effects. This approach allows the algorithm to leverage the information contained in correlations without being adversely affected by their presence.
- –
- XGBoost has proven to be robust in handling multicollinearity, i.e., high correlations among independent variables. Multiple studies have shown that its performance remains largely unaffected in such scenarios.
4.2. Descriptive Analysis
- STRUC1 (Solvency Ratio): the solvency ratio reflects a company’s ability to meet its short-term obligations relative to its adjusted net equity. With a median of 45.33 and a standard deviation of 40.75, there is considerable variability in this indicator among the companies.
- DEBT2 (Indebtedness): this metric measures the proportion of assets financed by debt relative to total assets. With a median of 54.67 and a standard deviation of 40.75, a significant variability is evident in the level of indebtedness among the companies.
- DEBT1 (Total Debt Percentage Ratio): This ratio assesses a company’s level of indebtedness relative to its net equity and total liabilities. With a median of 17.34 and a standard deviation of 30.62, a moderate level of variability in indebtedness is observed across the companies.
- AVPAY (Average Payment Period): this variable indicates the average time a company takes to settle its trade debts. The high standard deviation of 247.13 highlights considerable variability in payment periods among the companies.
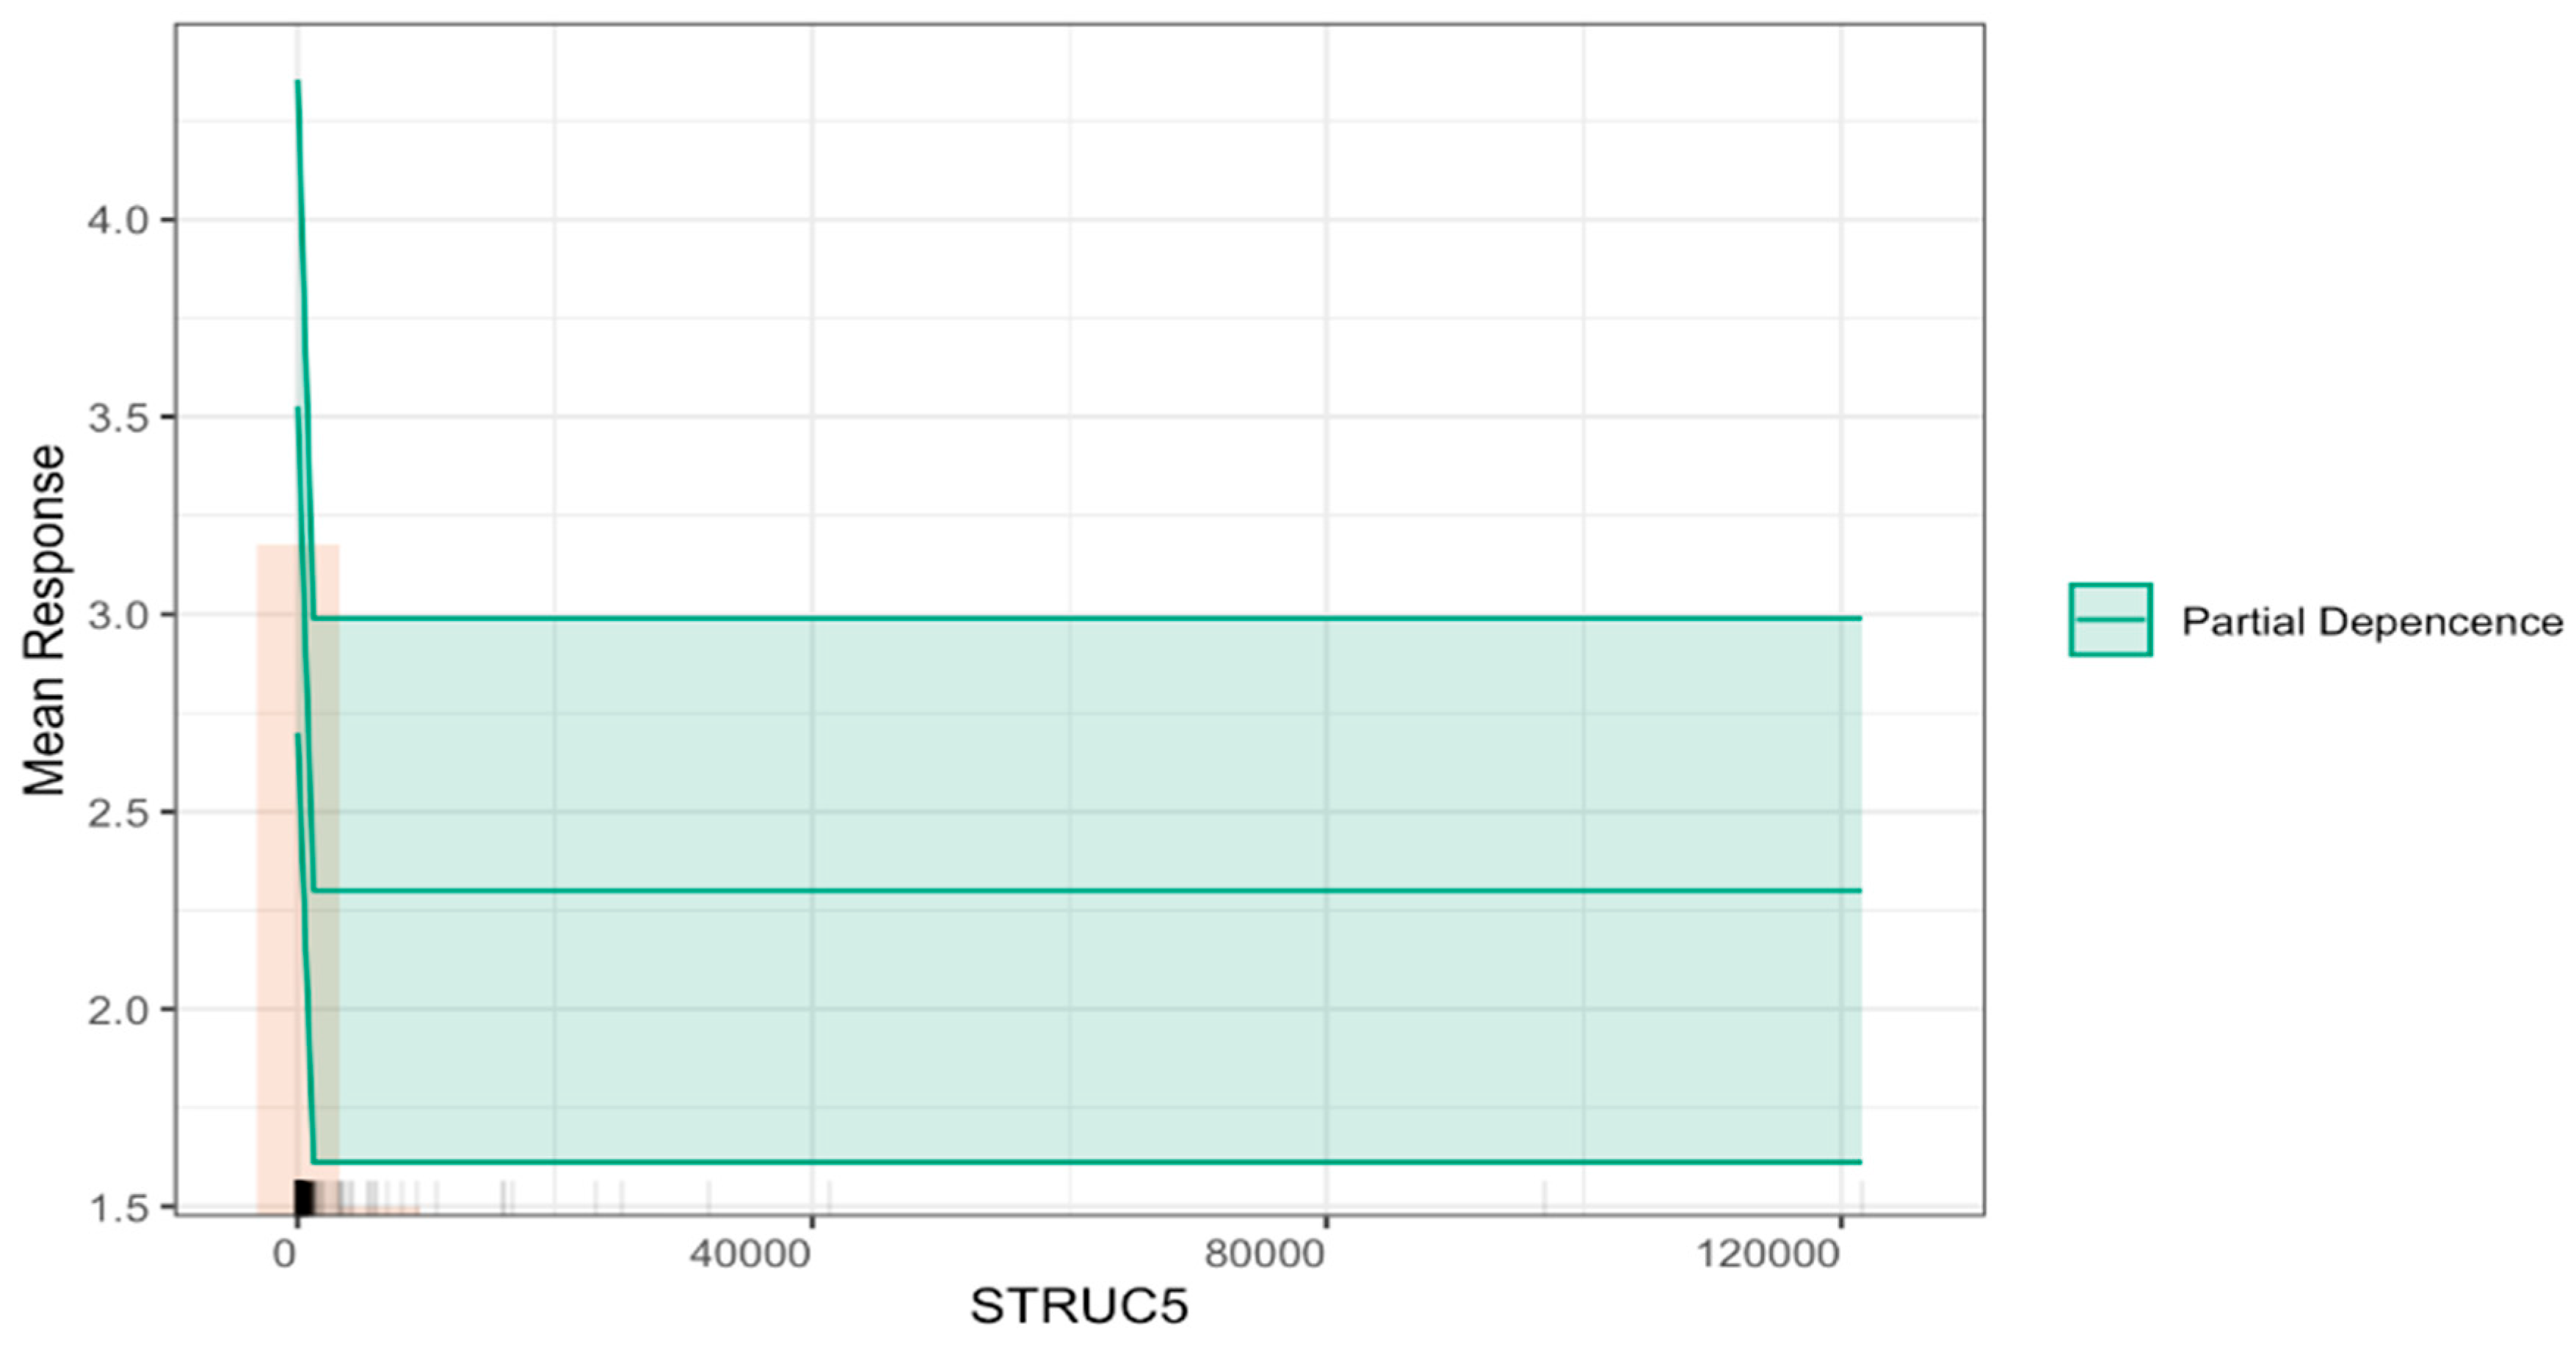
- STRUC5 (Immediate Liquidity Ratio): this ratio measures a company’s ability to cover its short-term liabilities with its most liquid assets. With a median of 49.91 and a staggering standard deviation of 5480.31, the indicator reveals extreme variability, suggesting significant differences in immediate liquidity among the companies.
- STRUC3 (General Liquidity Ratio): this metric assesses the company’s ability to meet short-term liabilities with its current assets. A median of 157.18 and a standard deviation of 6636.64 indicate substantial variability in general liquidity across the sample.
- STRUC4 (Acid Test Ratio): this ratio provides a stricter measure of liquidity by excluding inventory from current assets. With a median of 123 and a high standard deviation of 6603, there is considerable variability in companies’ ability to cover short-term liabilities without relying on inventory.
- PREM (Worker Costs/Operating Income): This metric measures the proportion of labor costs relative to operating income. A median of 17.69 and a standard deviation of 27.78 indicate moderate variability in this ratio across the sample.
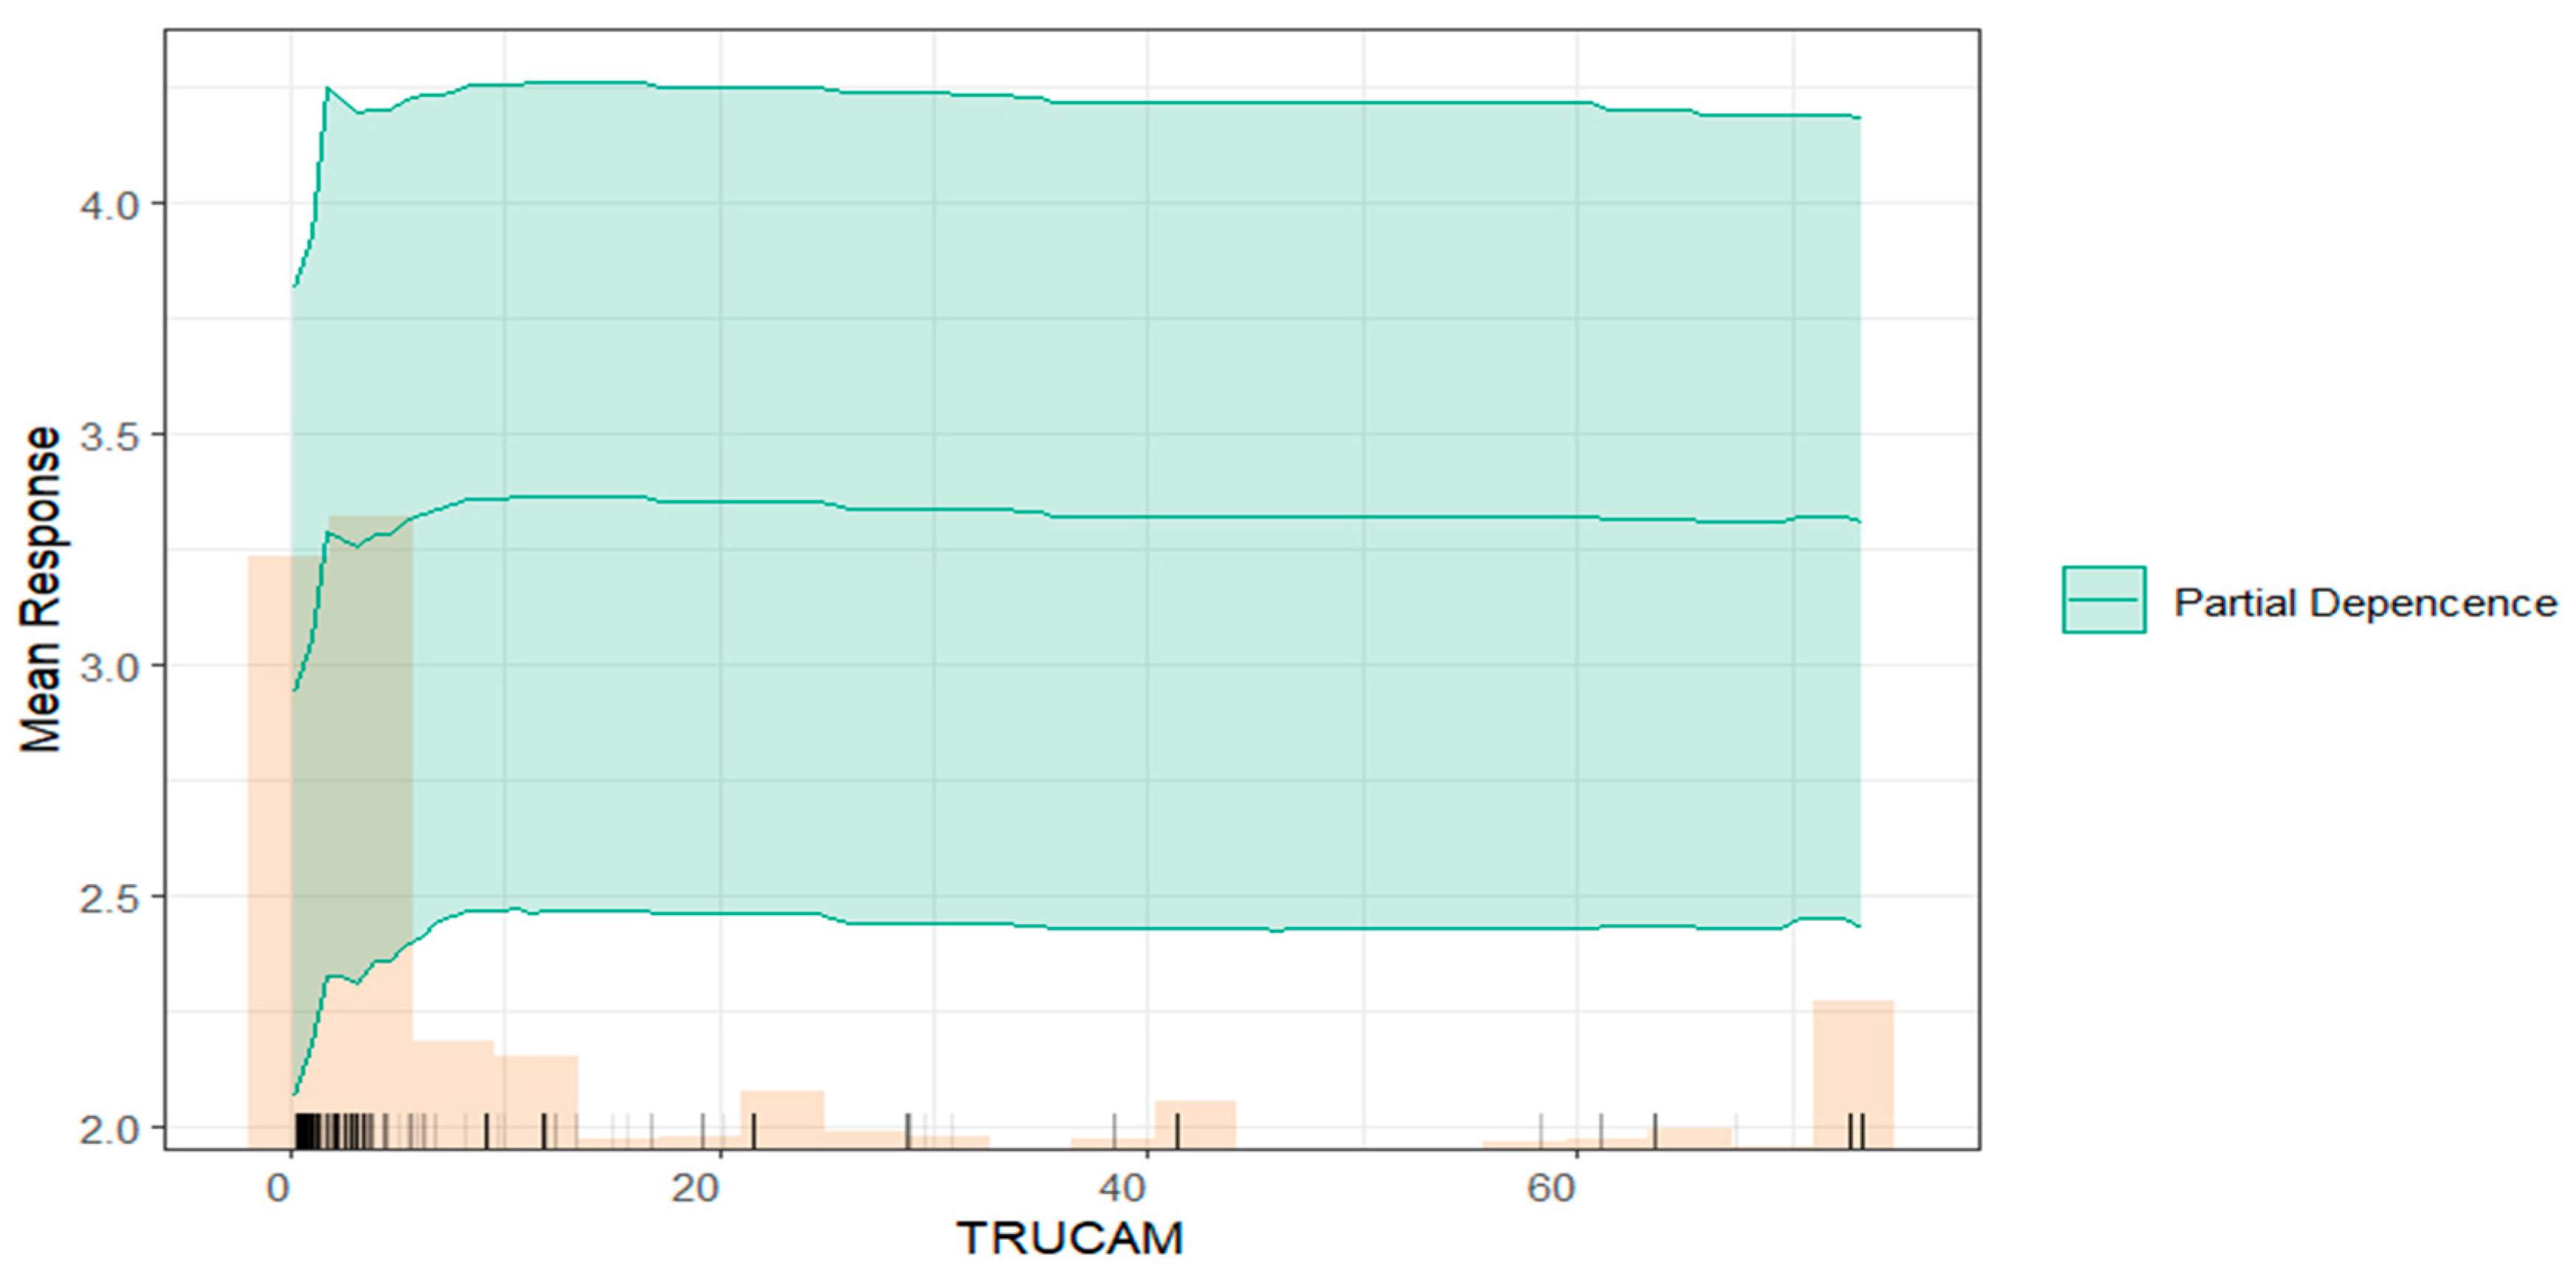
- TRUCAM (Environmental Risk Score): this score evaluates the environmental risk faced by companies. With a median of 3.16 and a standard deviation of 21.60, the data shows moderate variability in environmental risk scores across the sample.
- STRUC2 (Solidity Ratio): this ratio assesses a company’s ability to meet long-term liabilities based on its net equity and non-current assets. The median of 104 indicates a relatively low level of solidity on average, though the extremely high standard deviation of 16,570.81 reflects significant dispersion in the data.
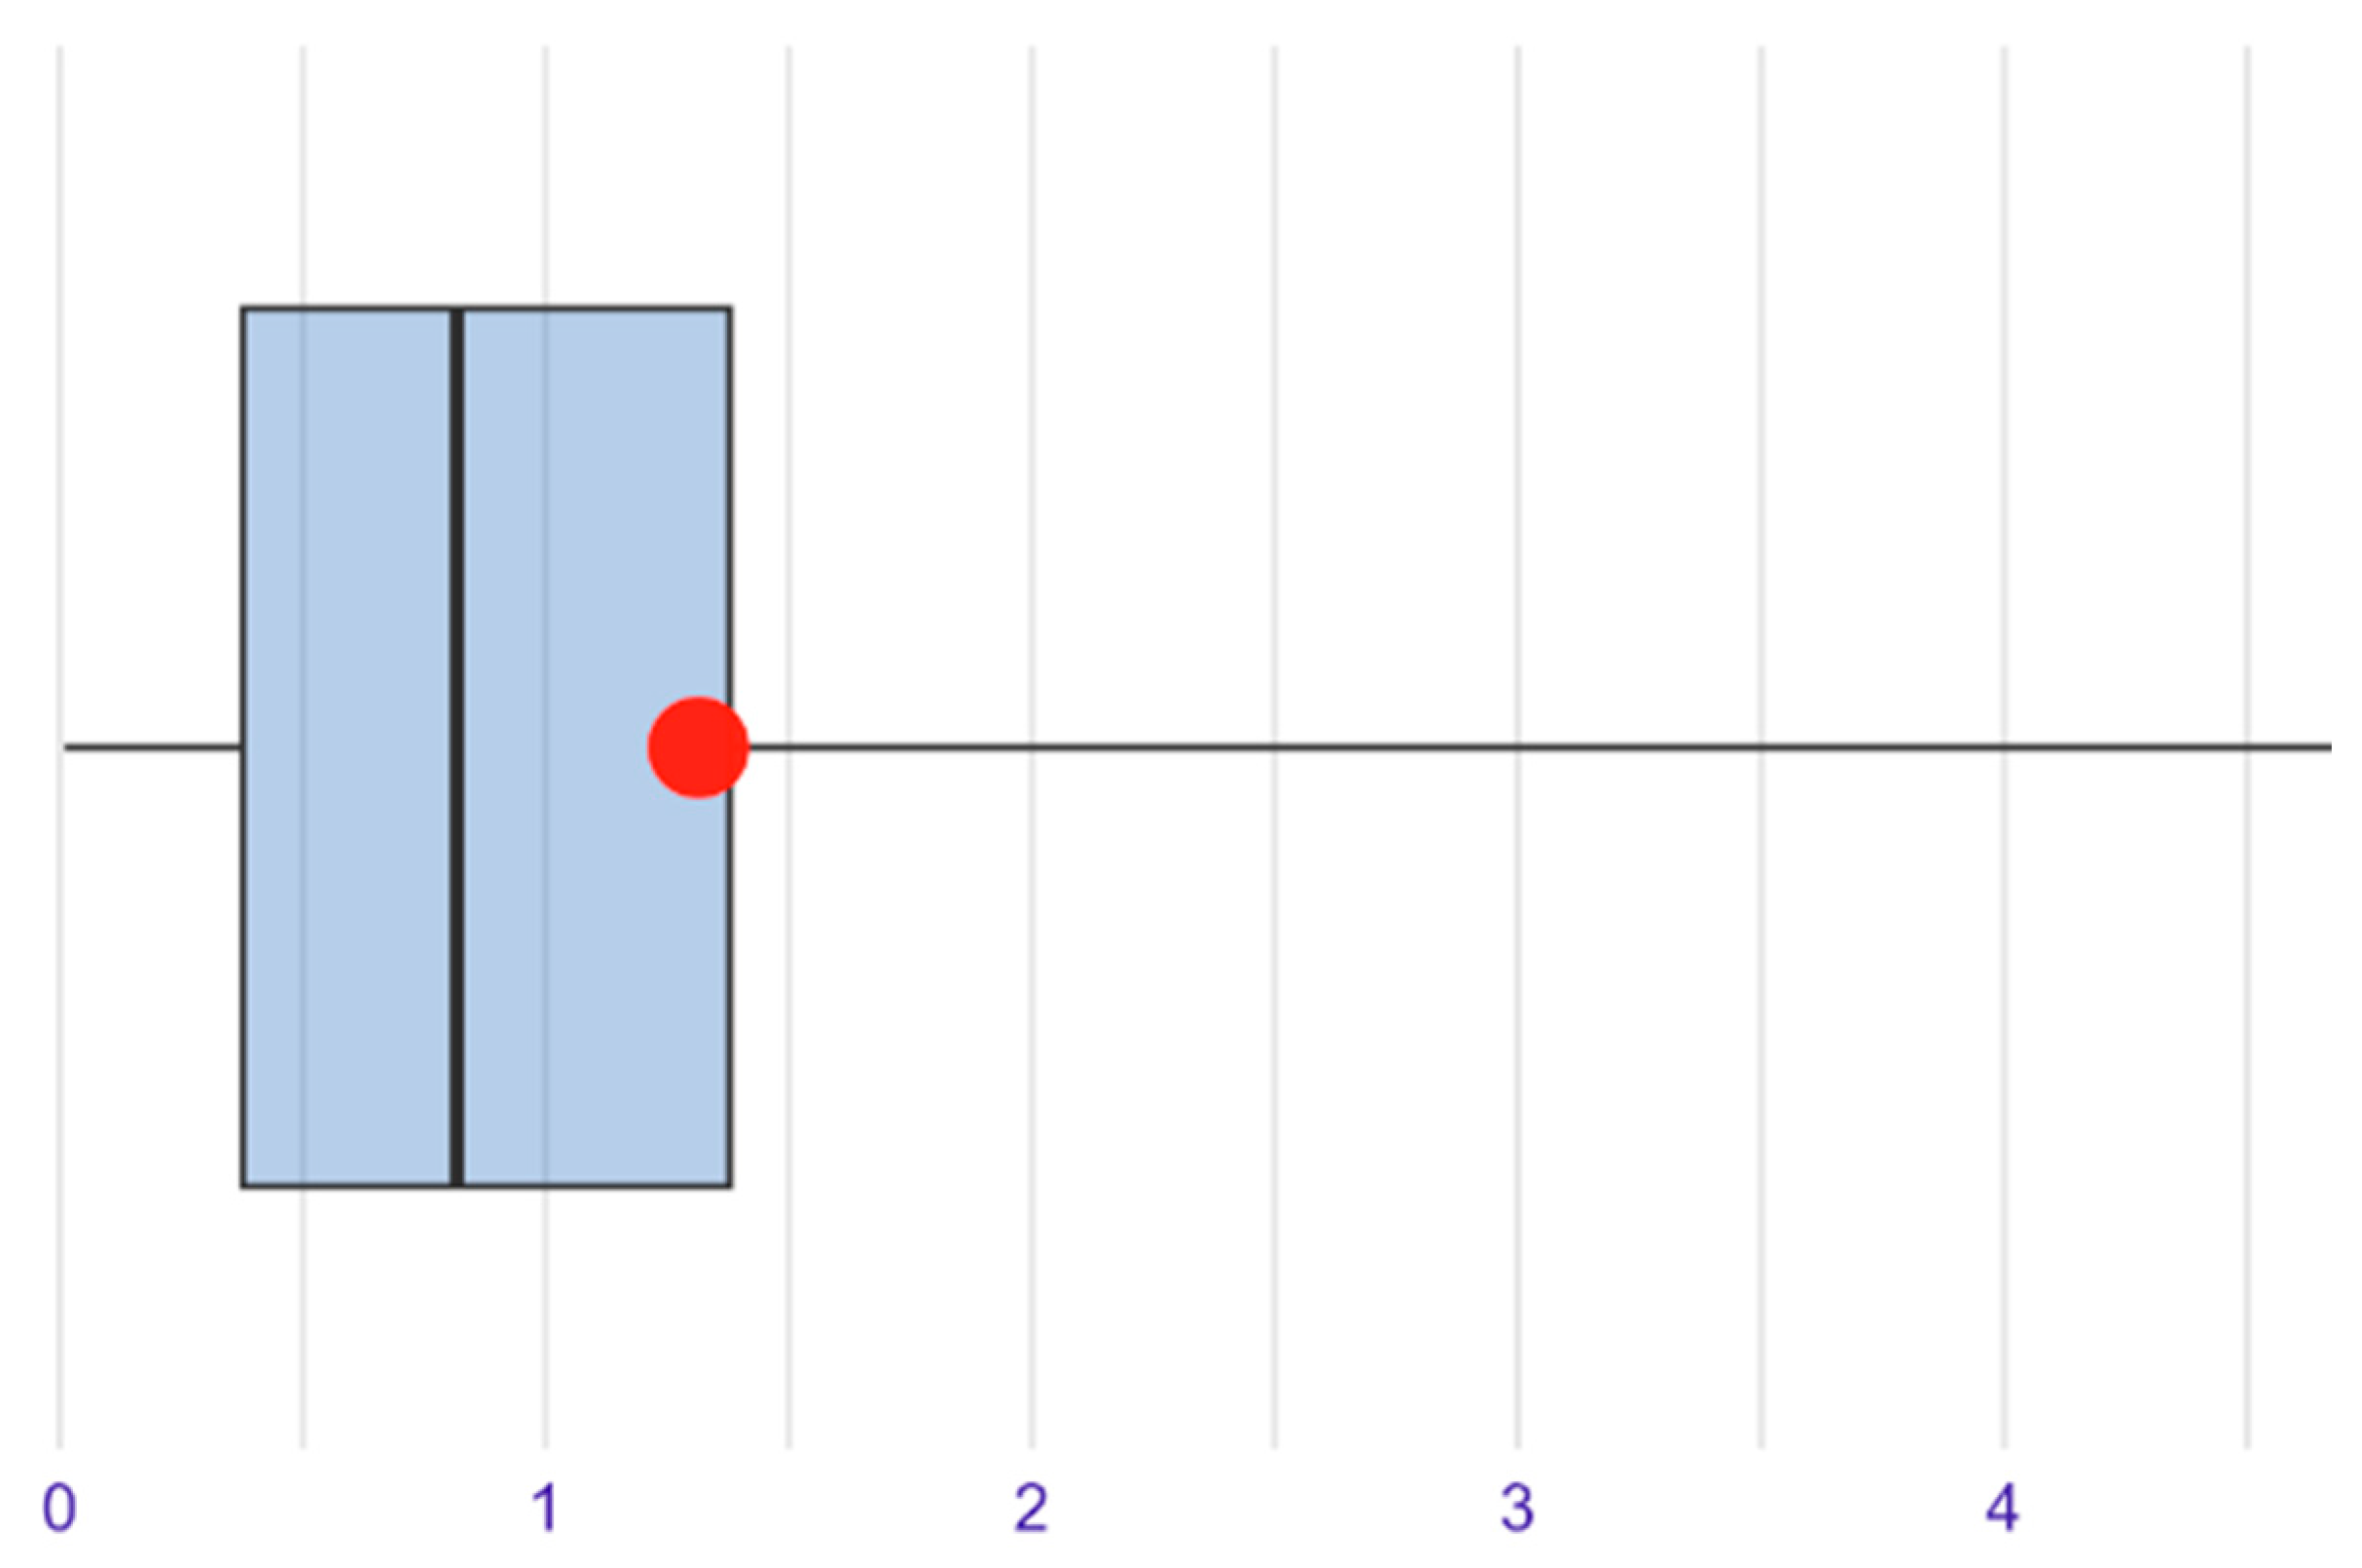
- Failure (Propensity to Fail, VADIS 2PBB): this indicator represents the likelihood of business failure. With a median of 3 and a standard deviation of 1.44, there is some variability in failure rates in the data
4.3. Data Analysis
4.3.1. Applied Methodology
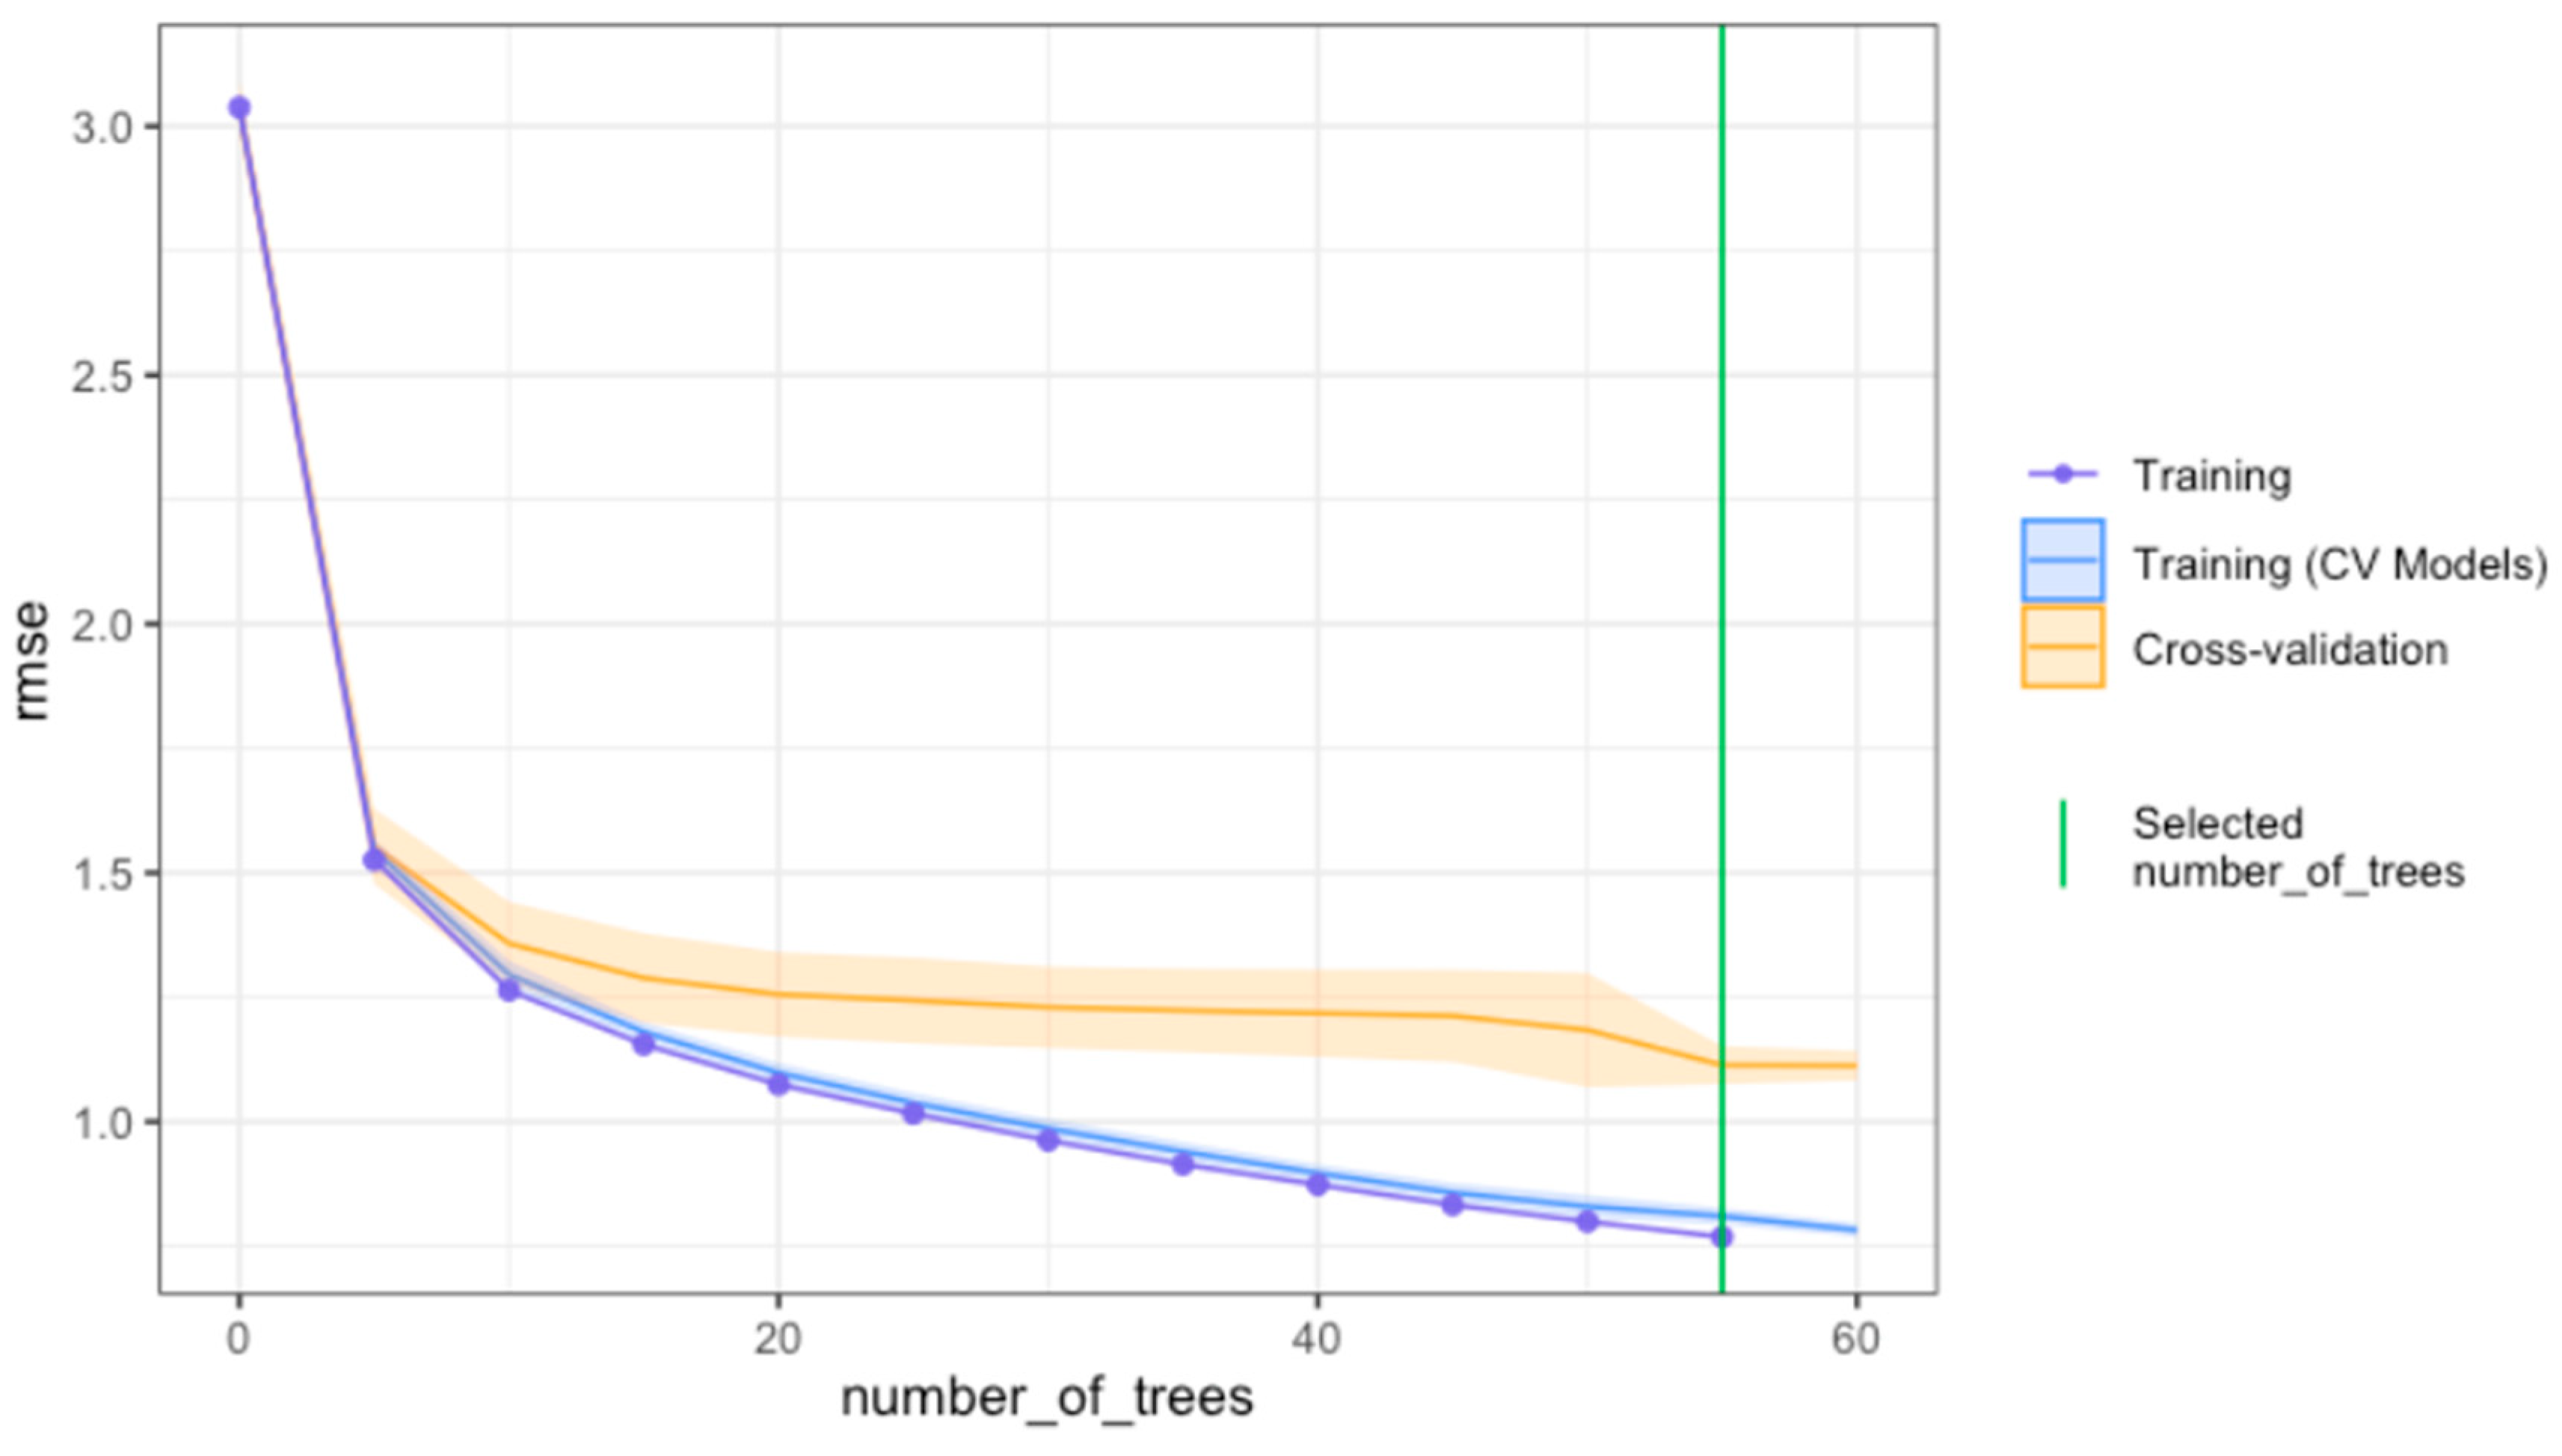
4.3.2. Procedure for Tuning the XGBoost Model
4.3.3. Model Performance of the Fitted XGBoost Model
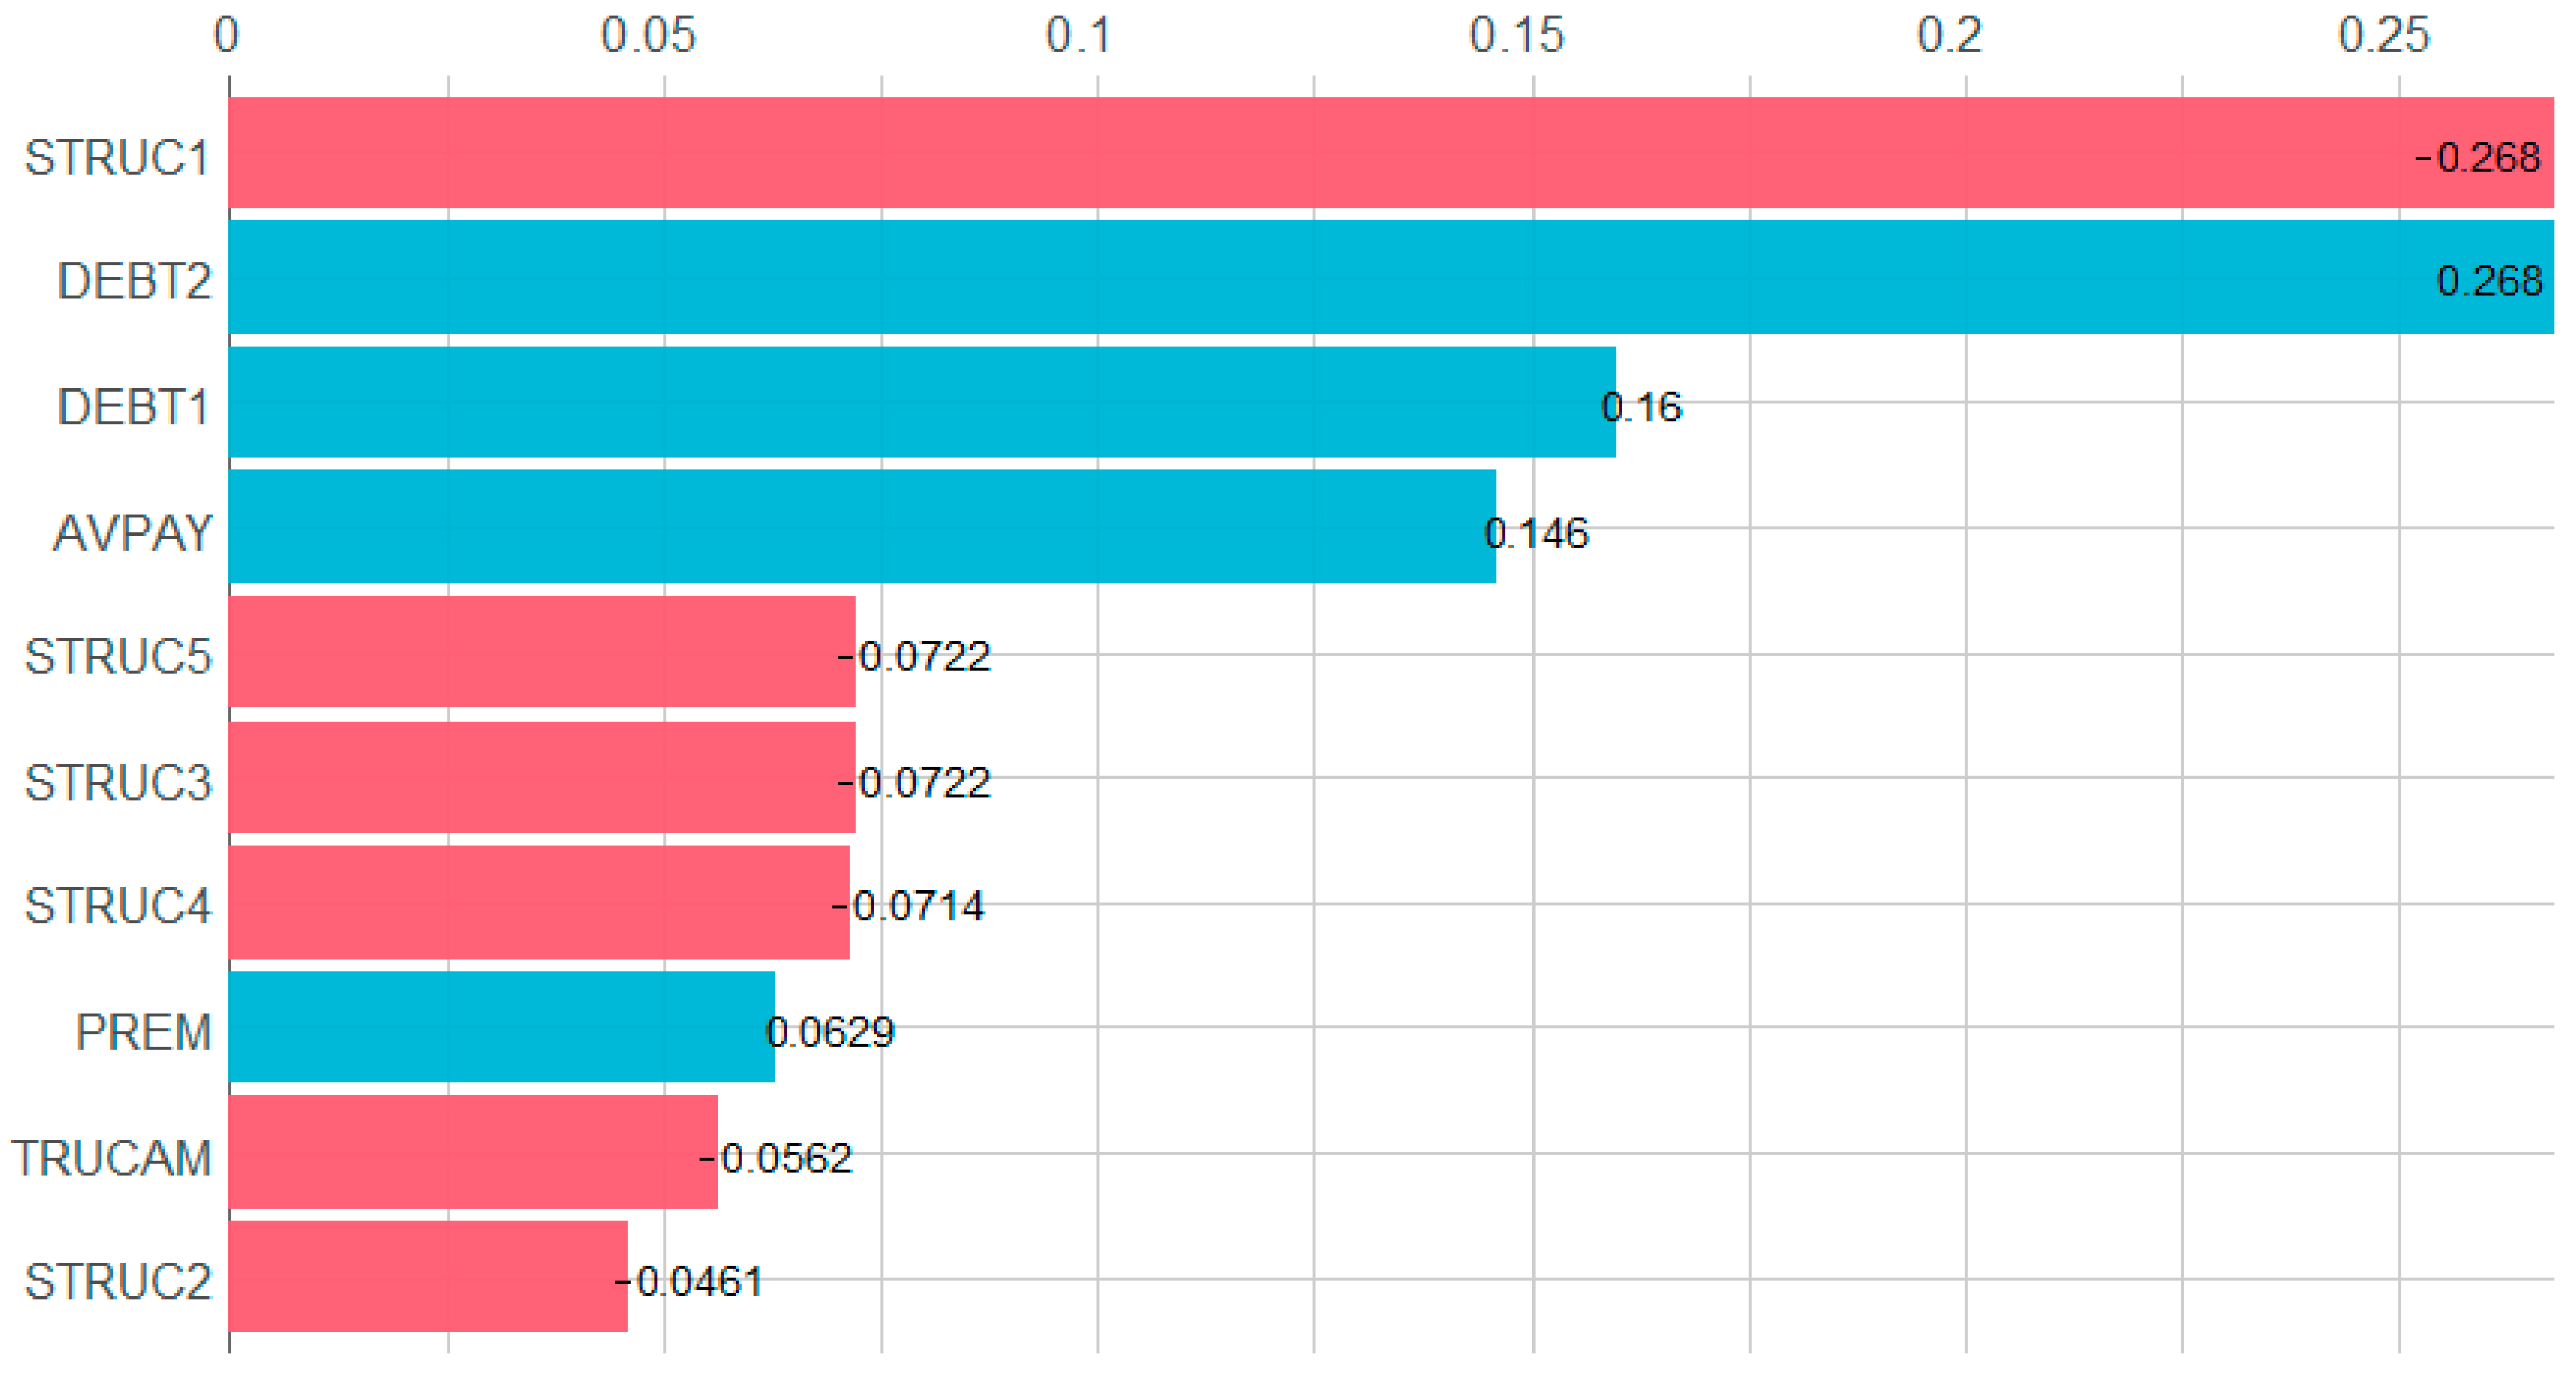
4.3.4. Most Relevant Variables in the XGBoost Model
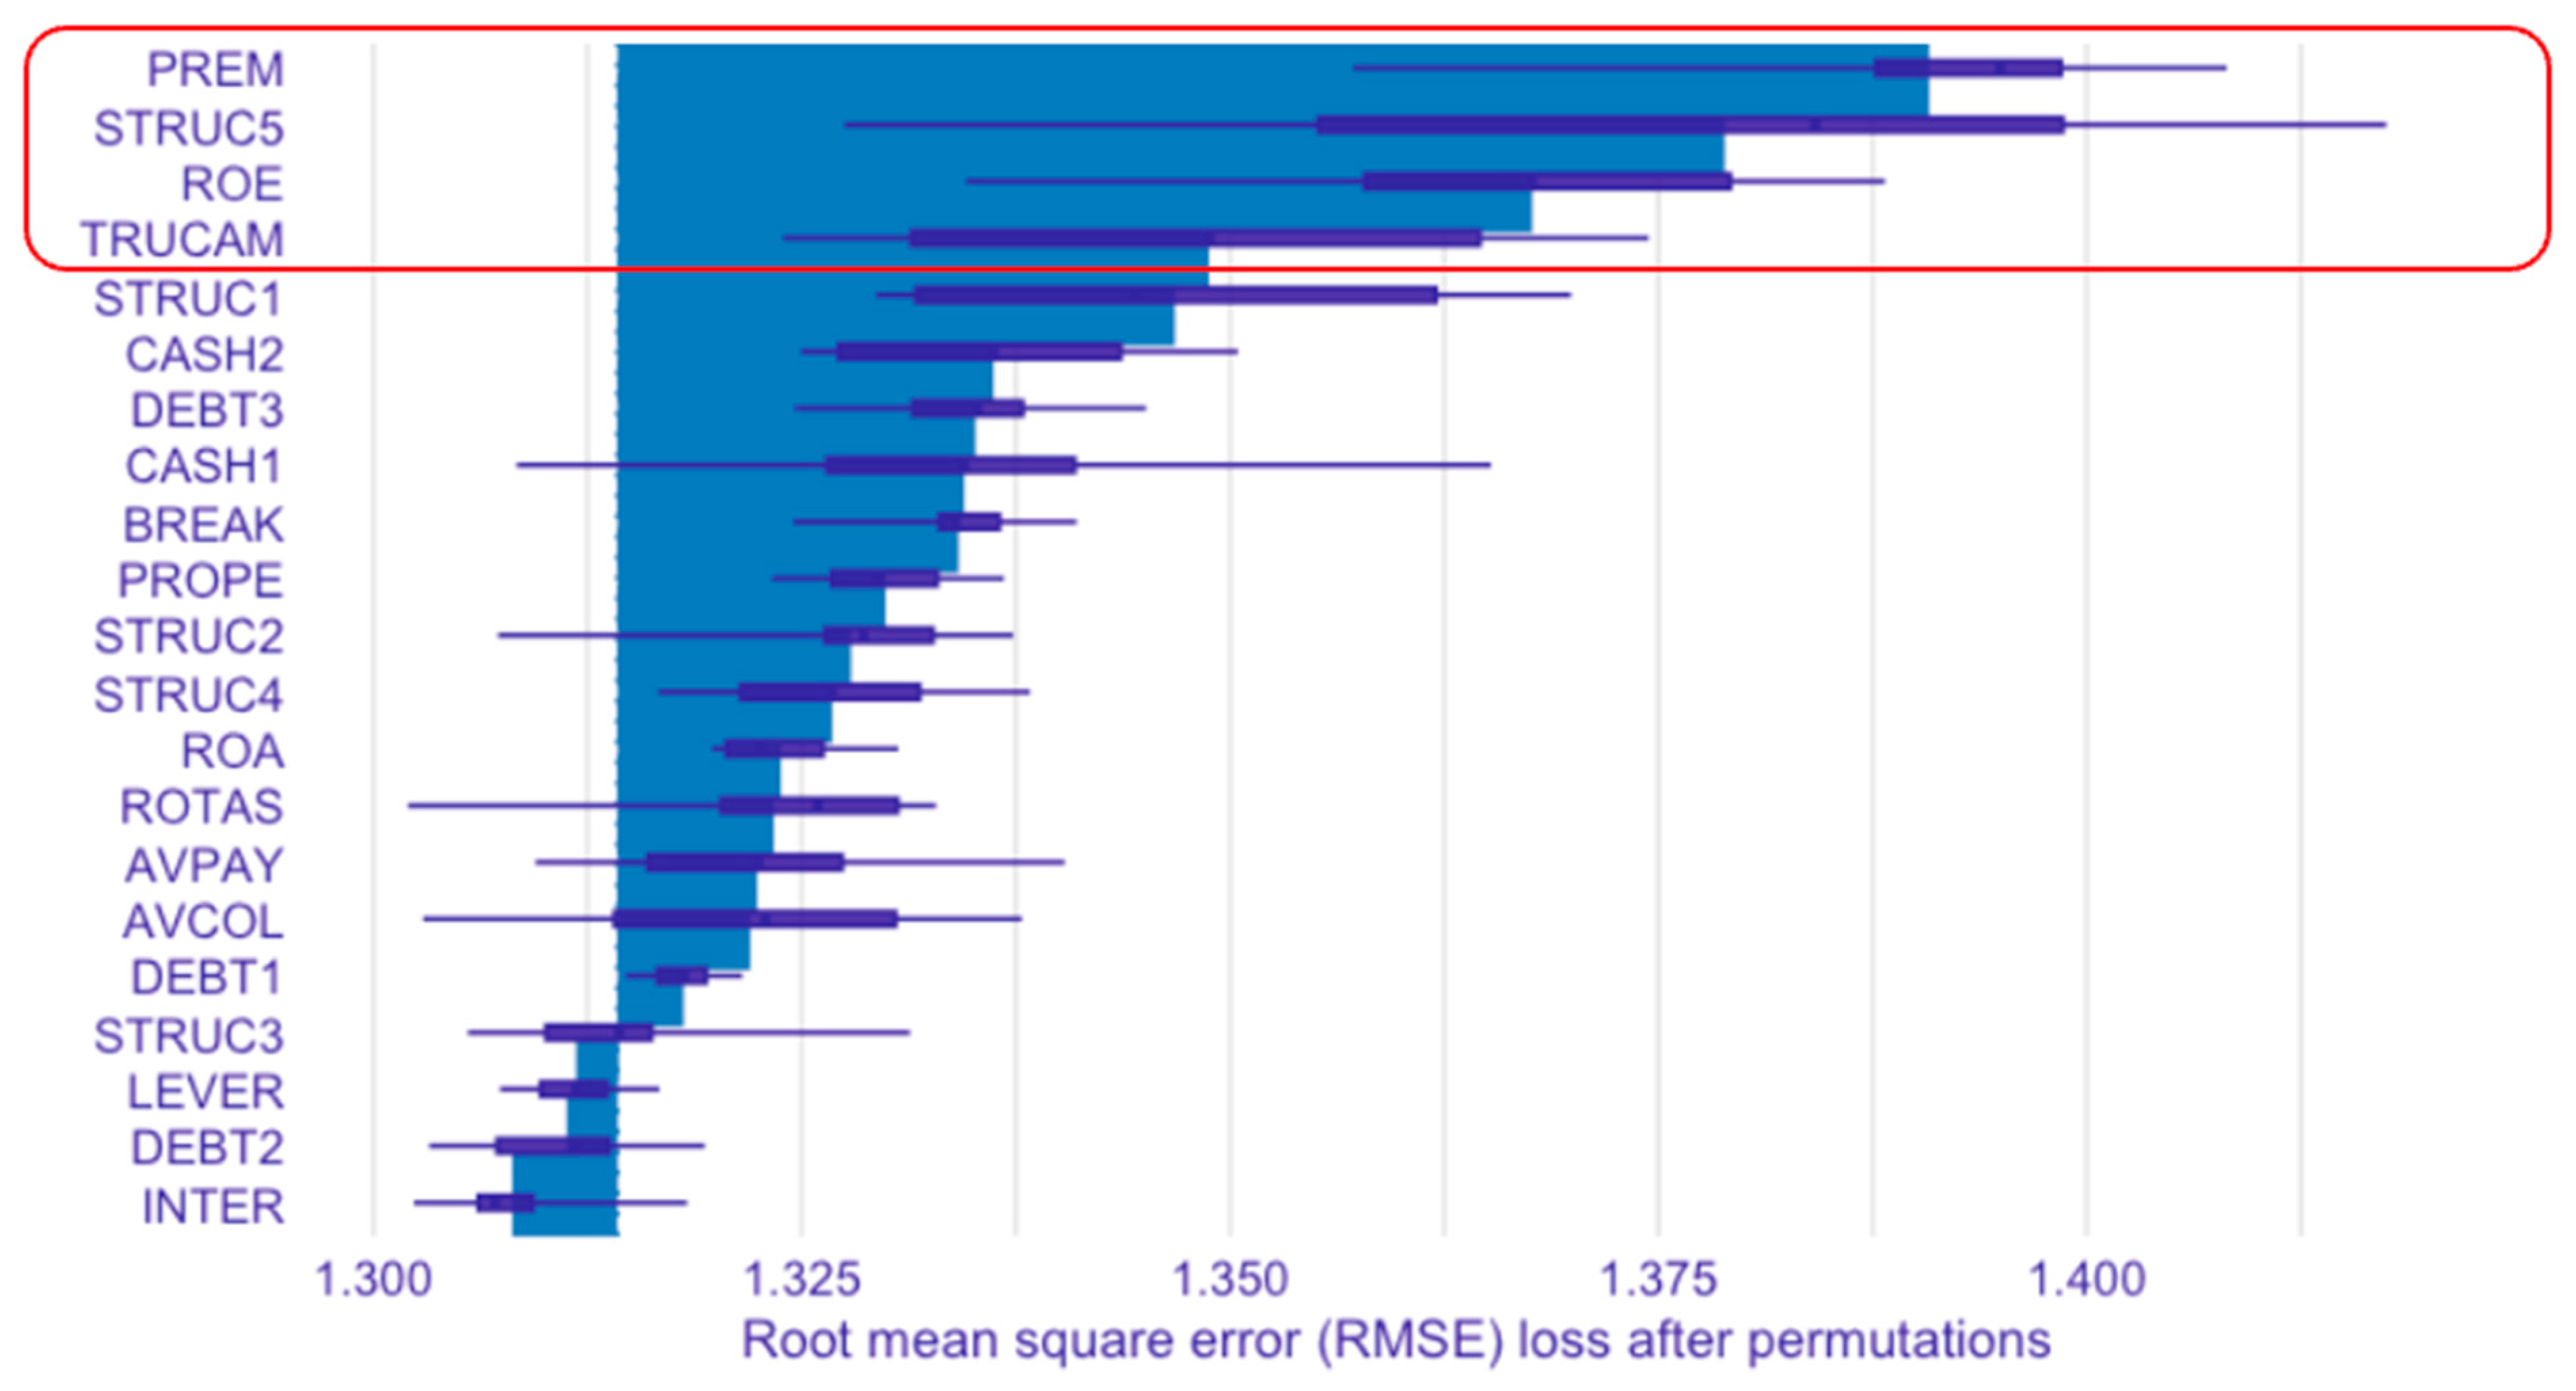
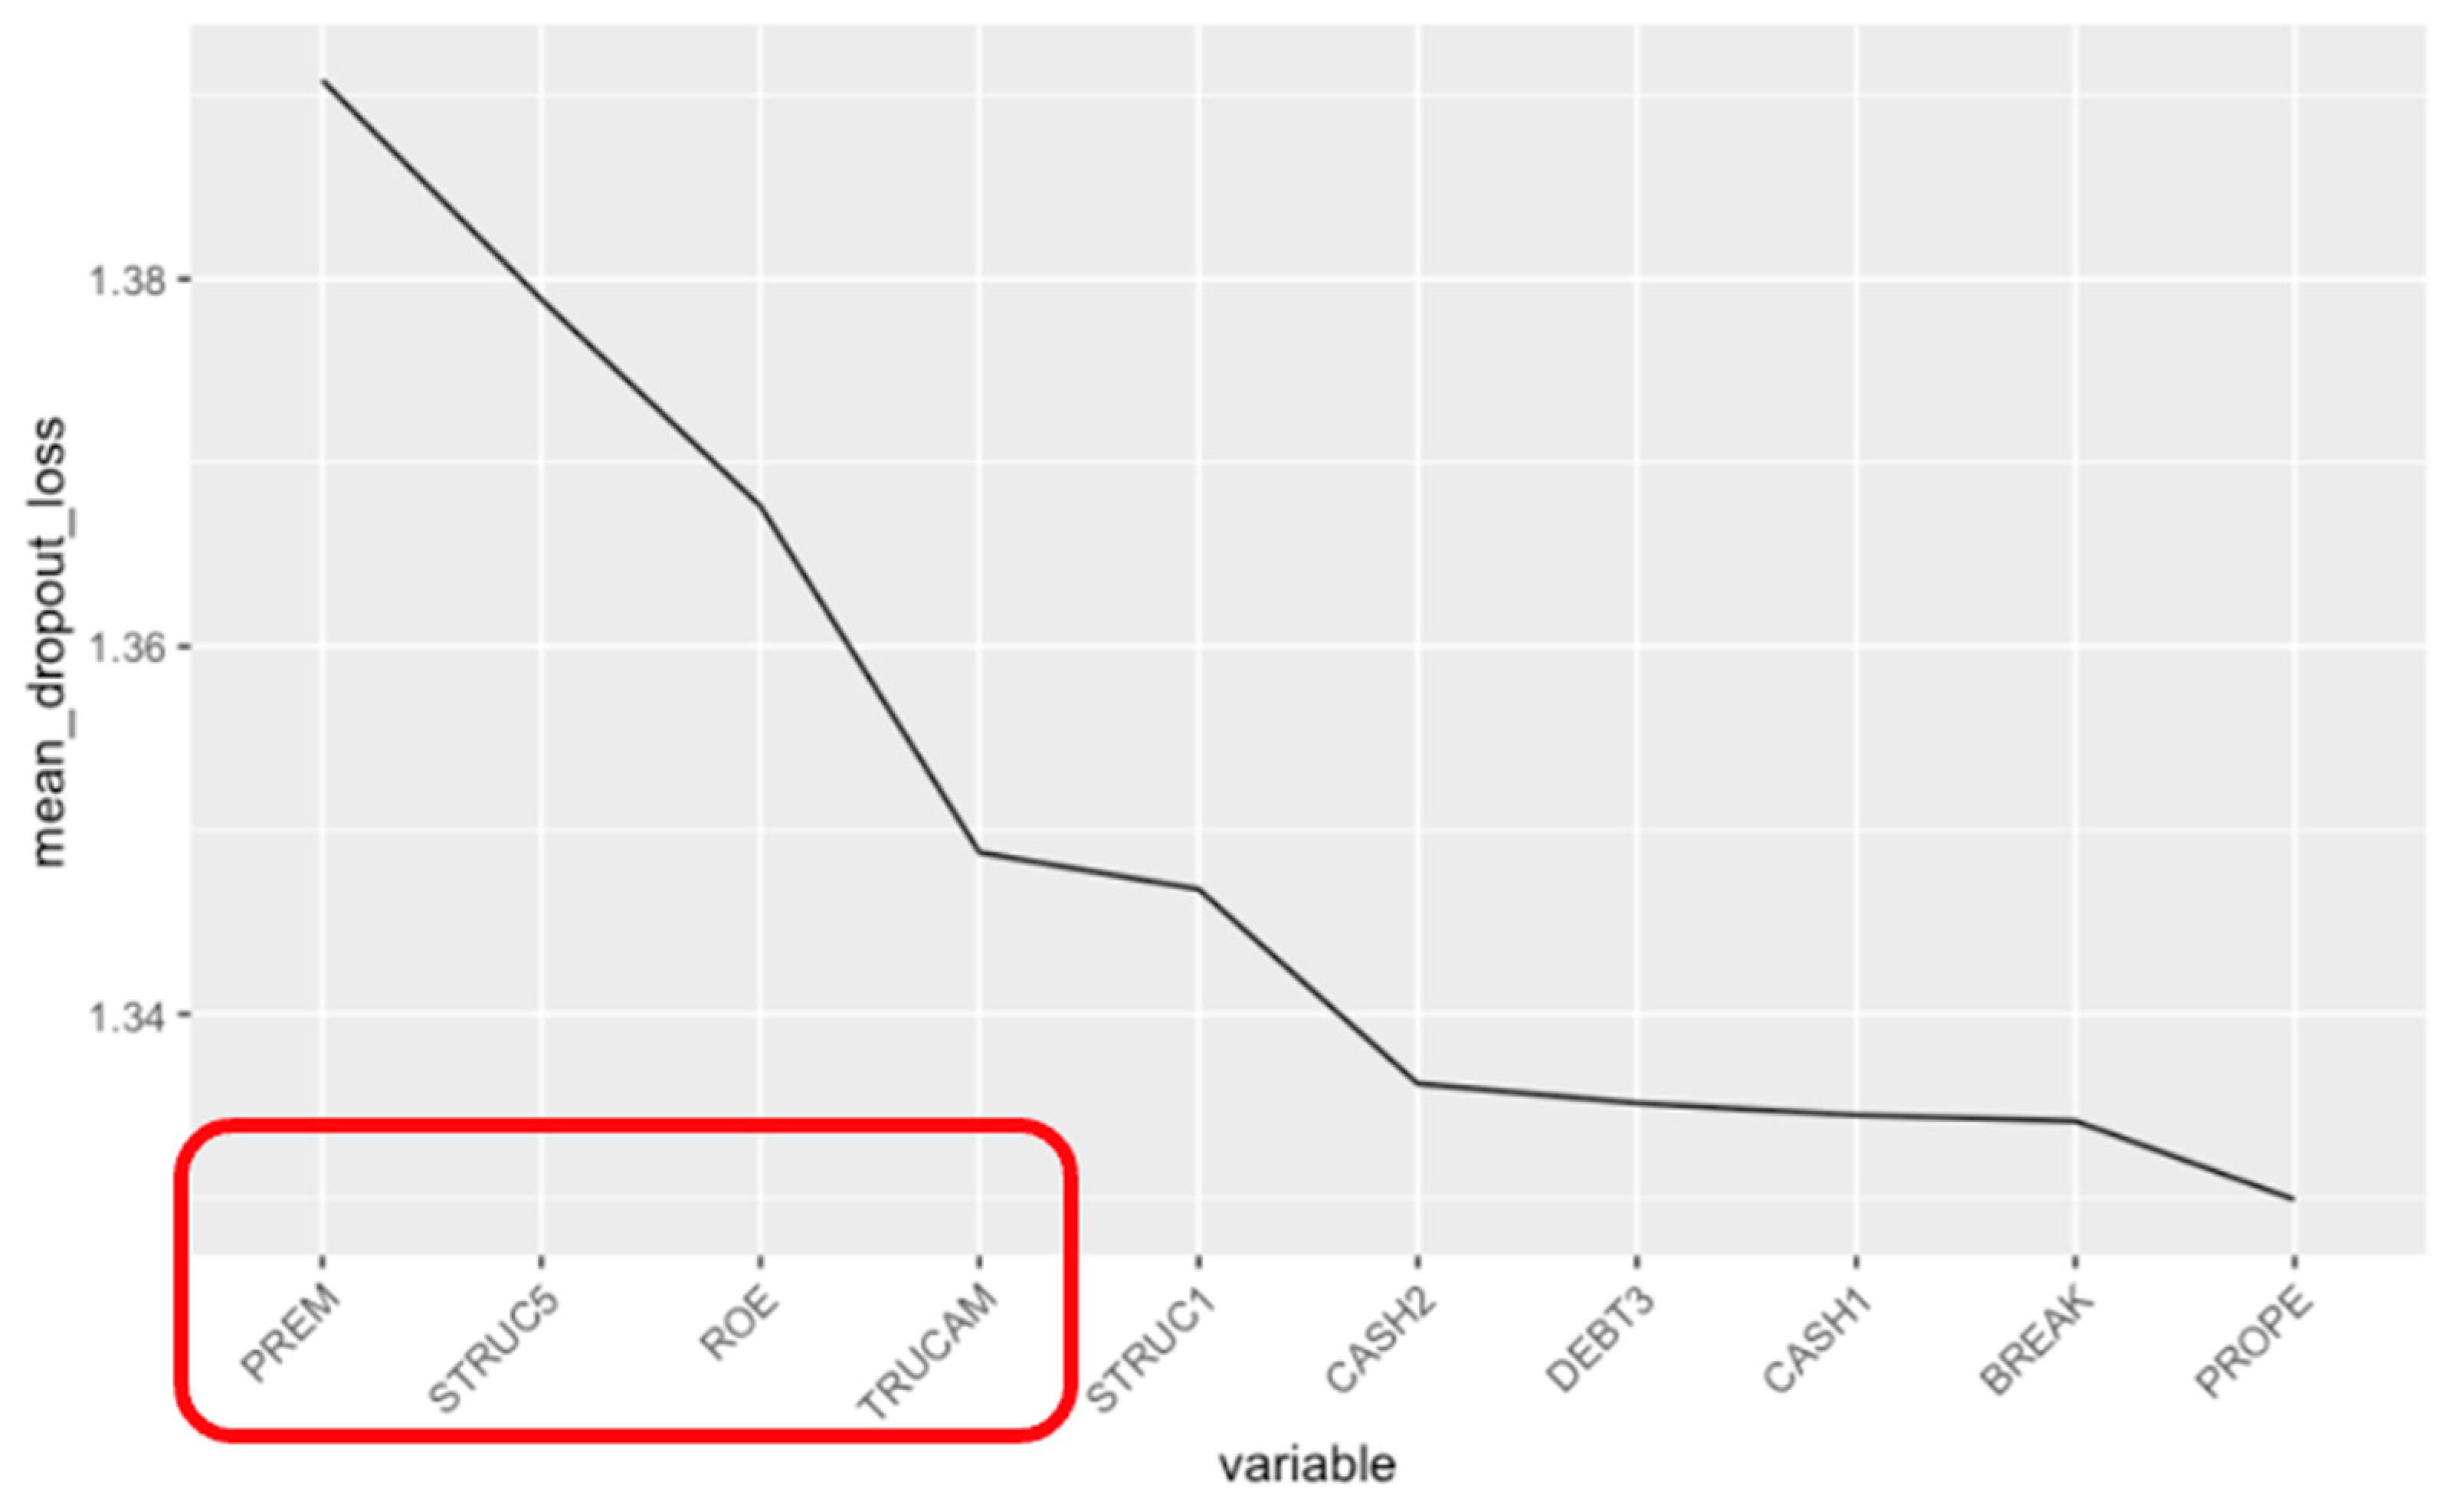
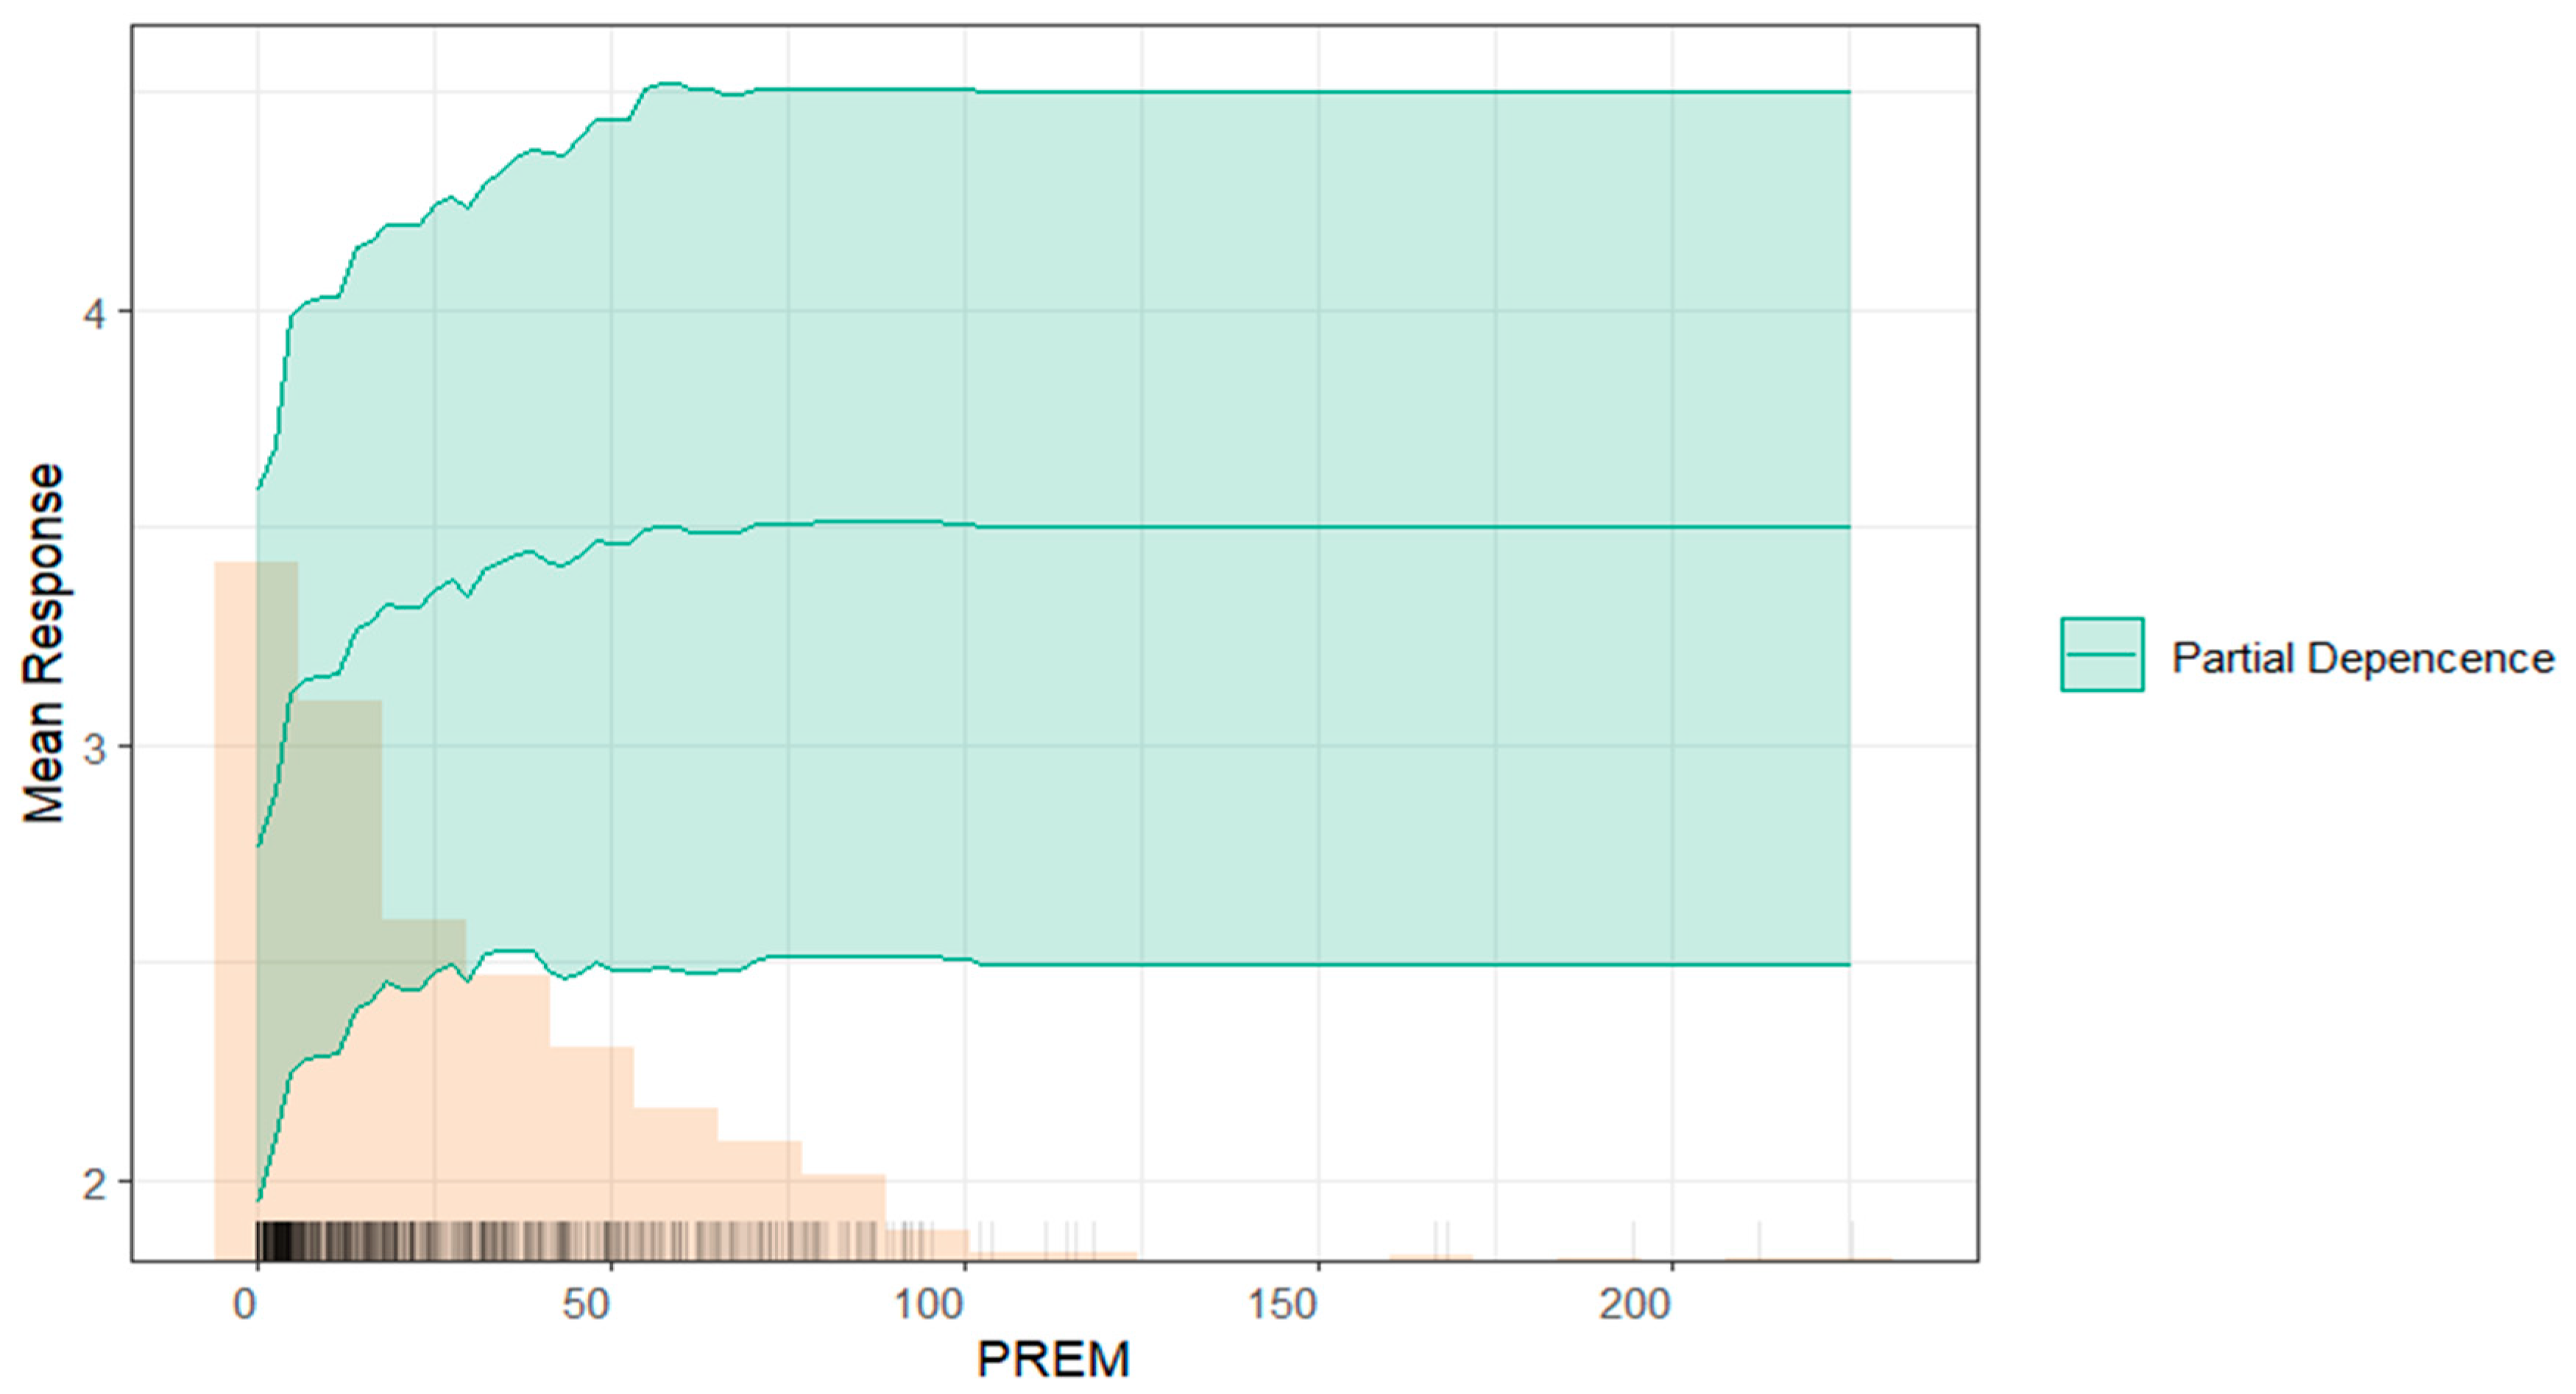
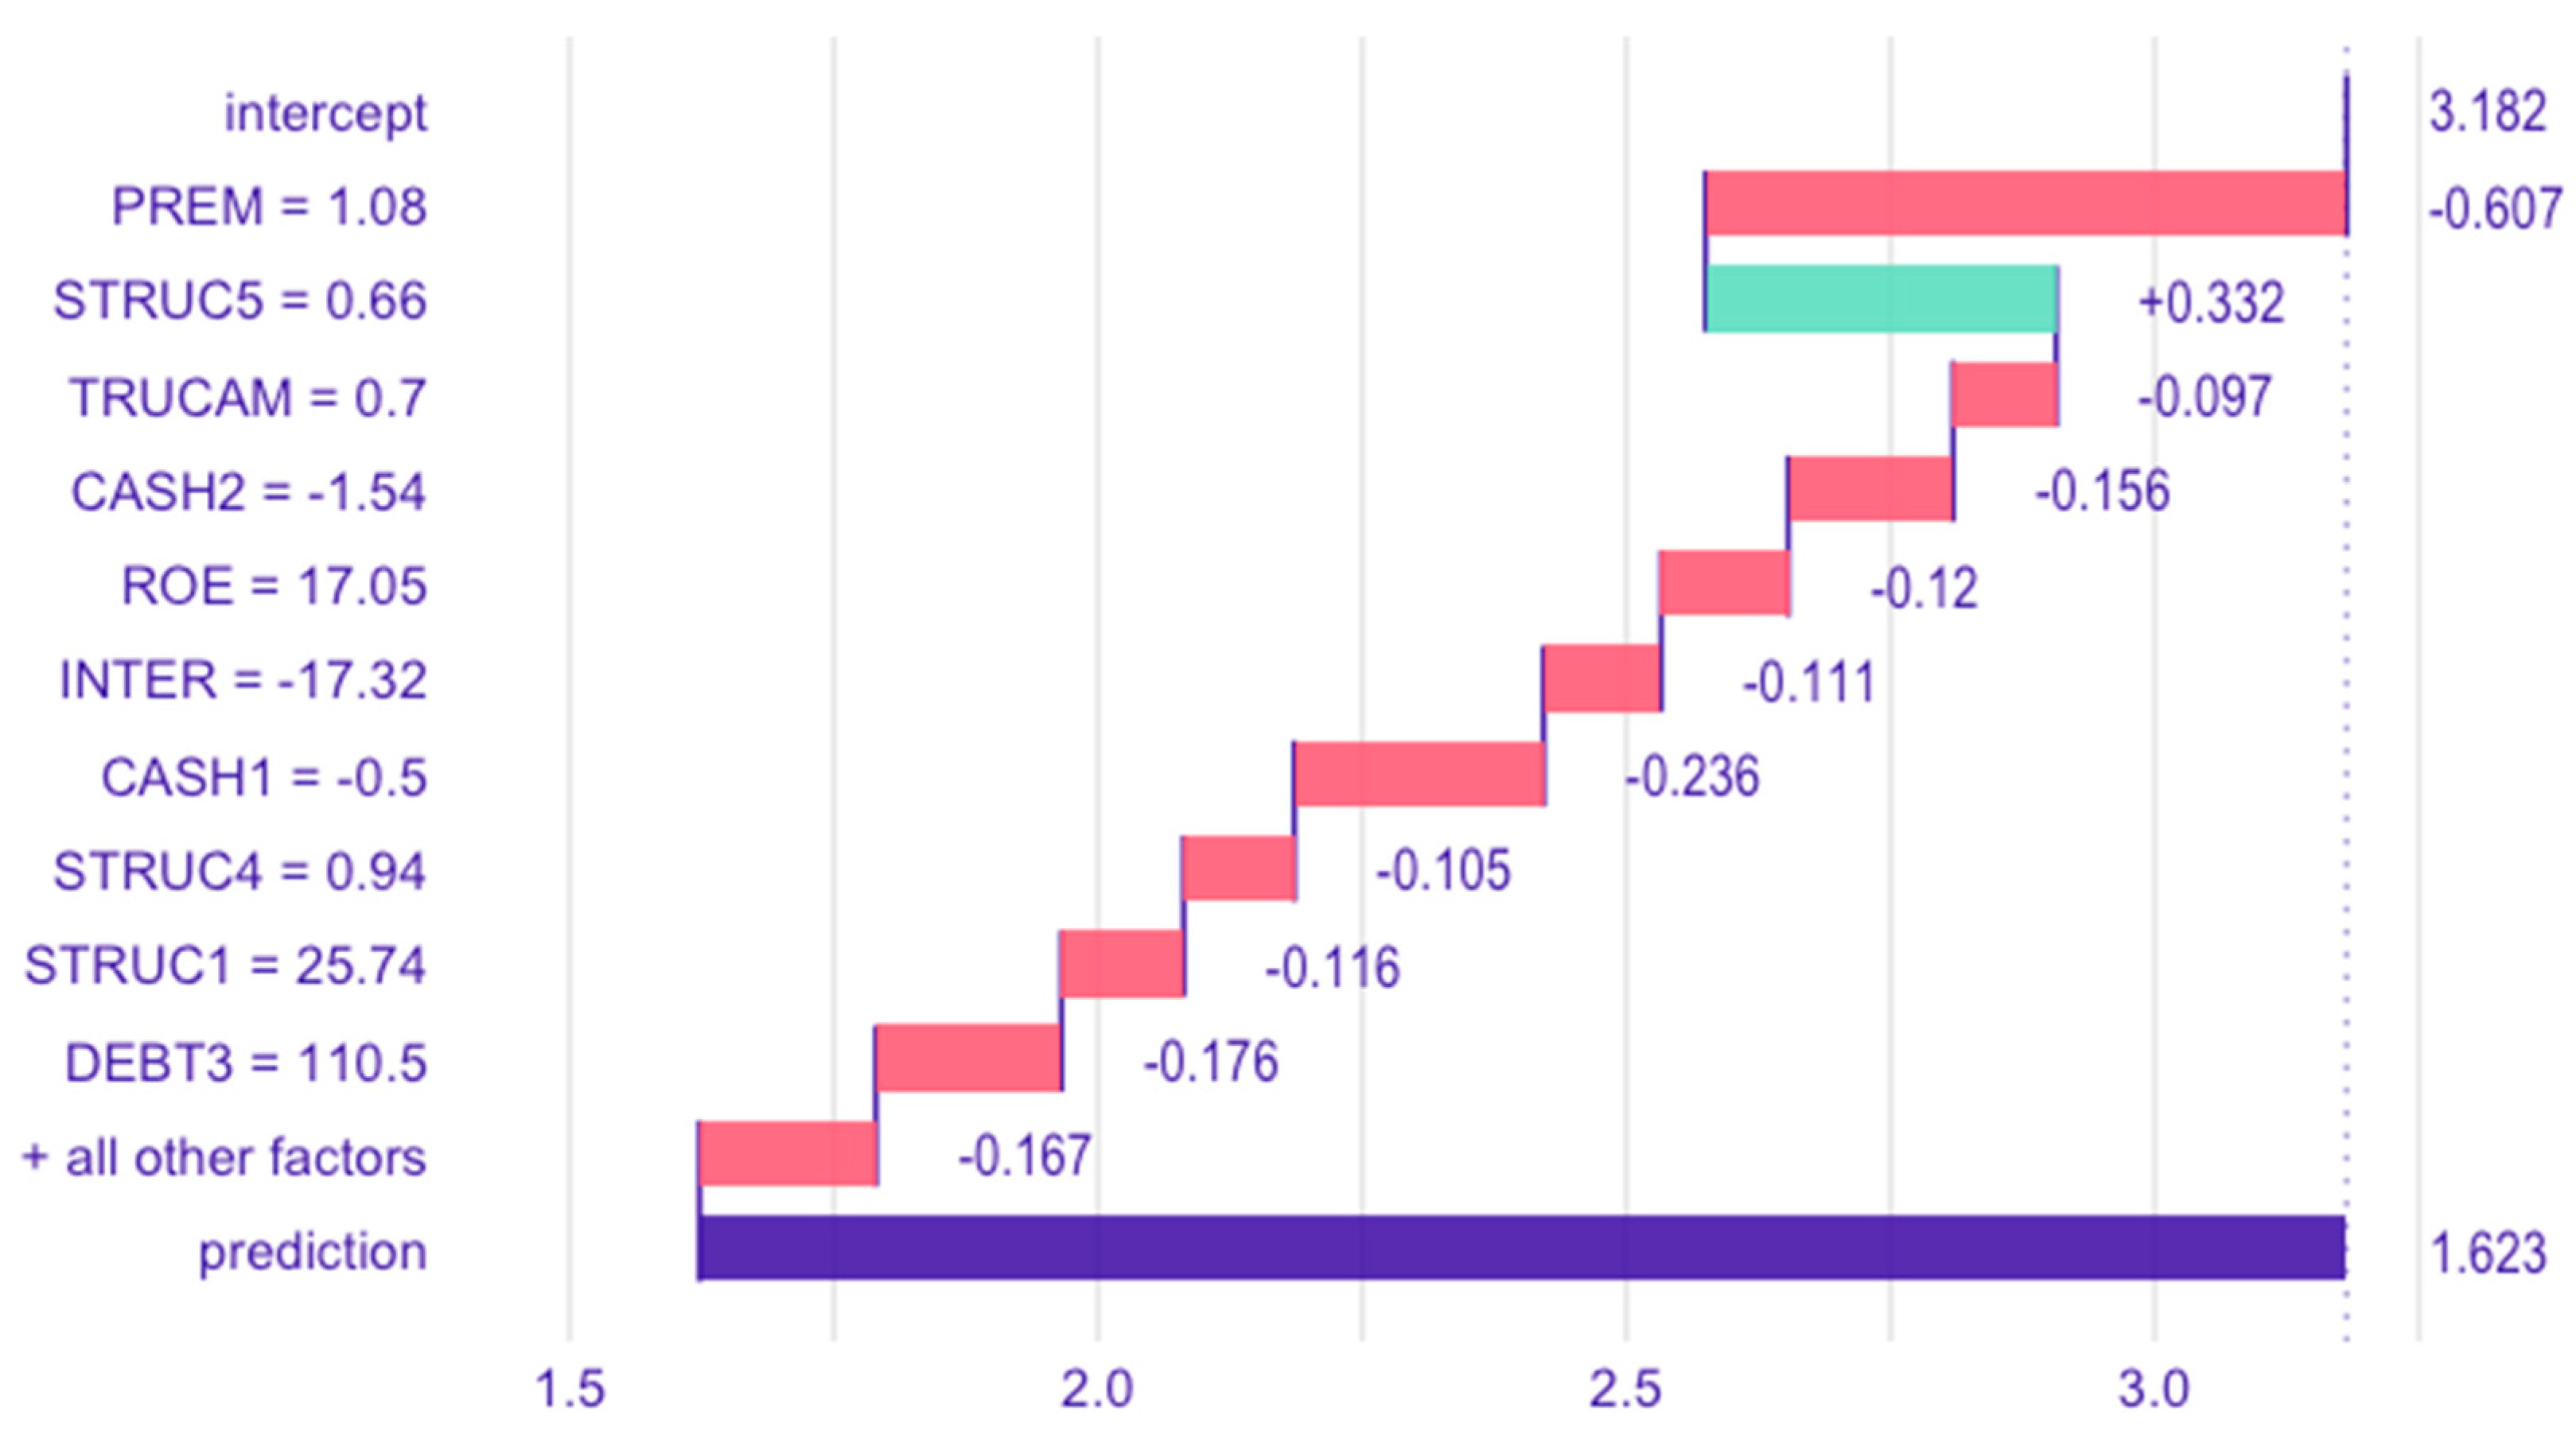
- PREM (Worker Costs/Operating Income): this variable stands out as the most significant predictor, highlighting the critical role of labor cost efficiency in determining the financial stability of companies in the sample;
- TRUCAM (Environmental Risk Score): ranked among the top four variables, TRUCAM underscores the relevance of environmental risk and their impact on the organization. This finding emphasizes the need for effective environmental risk management to ensure sustainability among the sample of companies.
4.3.5. Effect of Variables on Model Predictions at the Individual Observation Level
5. A Comparison of XGBoost with Two Other Classification Models
- Y denotes the dependent variable.
- β0 represents the intercept of the regression line.
- β1, β2, …, βp are the coefficients corresponding to the independent variables X1, X2, …, Xp, respectively. These coefficients quantify the change in the dependent variable associated with a one-unit change in the corresponding independent variable, holding all other variables constant.
- ϵ indicates the error term, which accounts for the unexplained variance in the dependent variable.
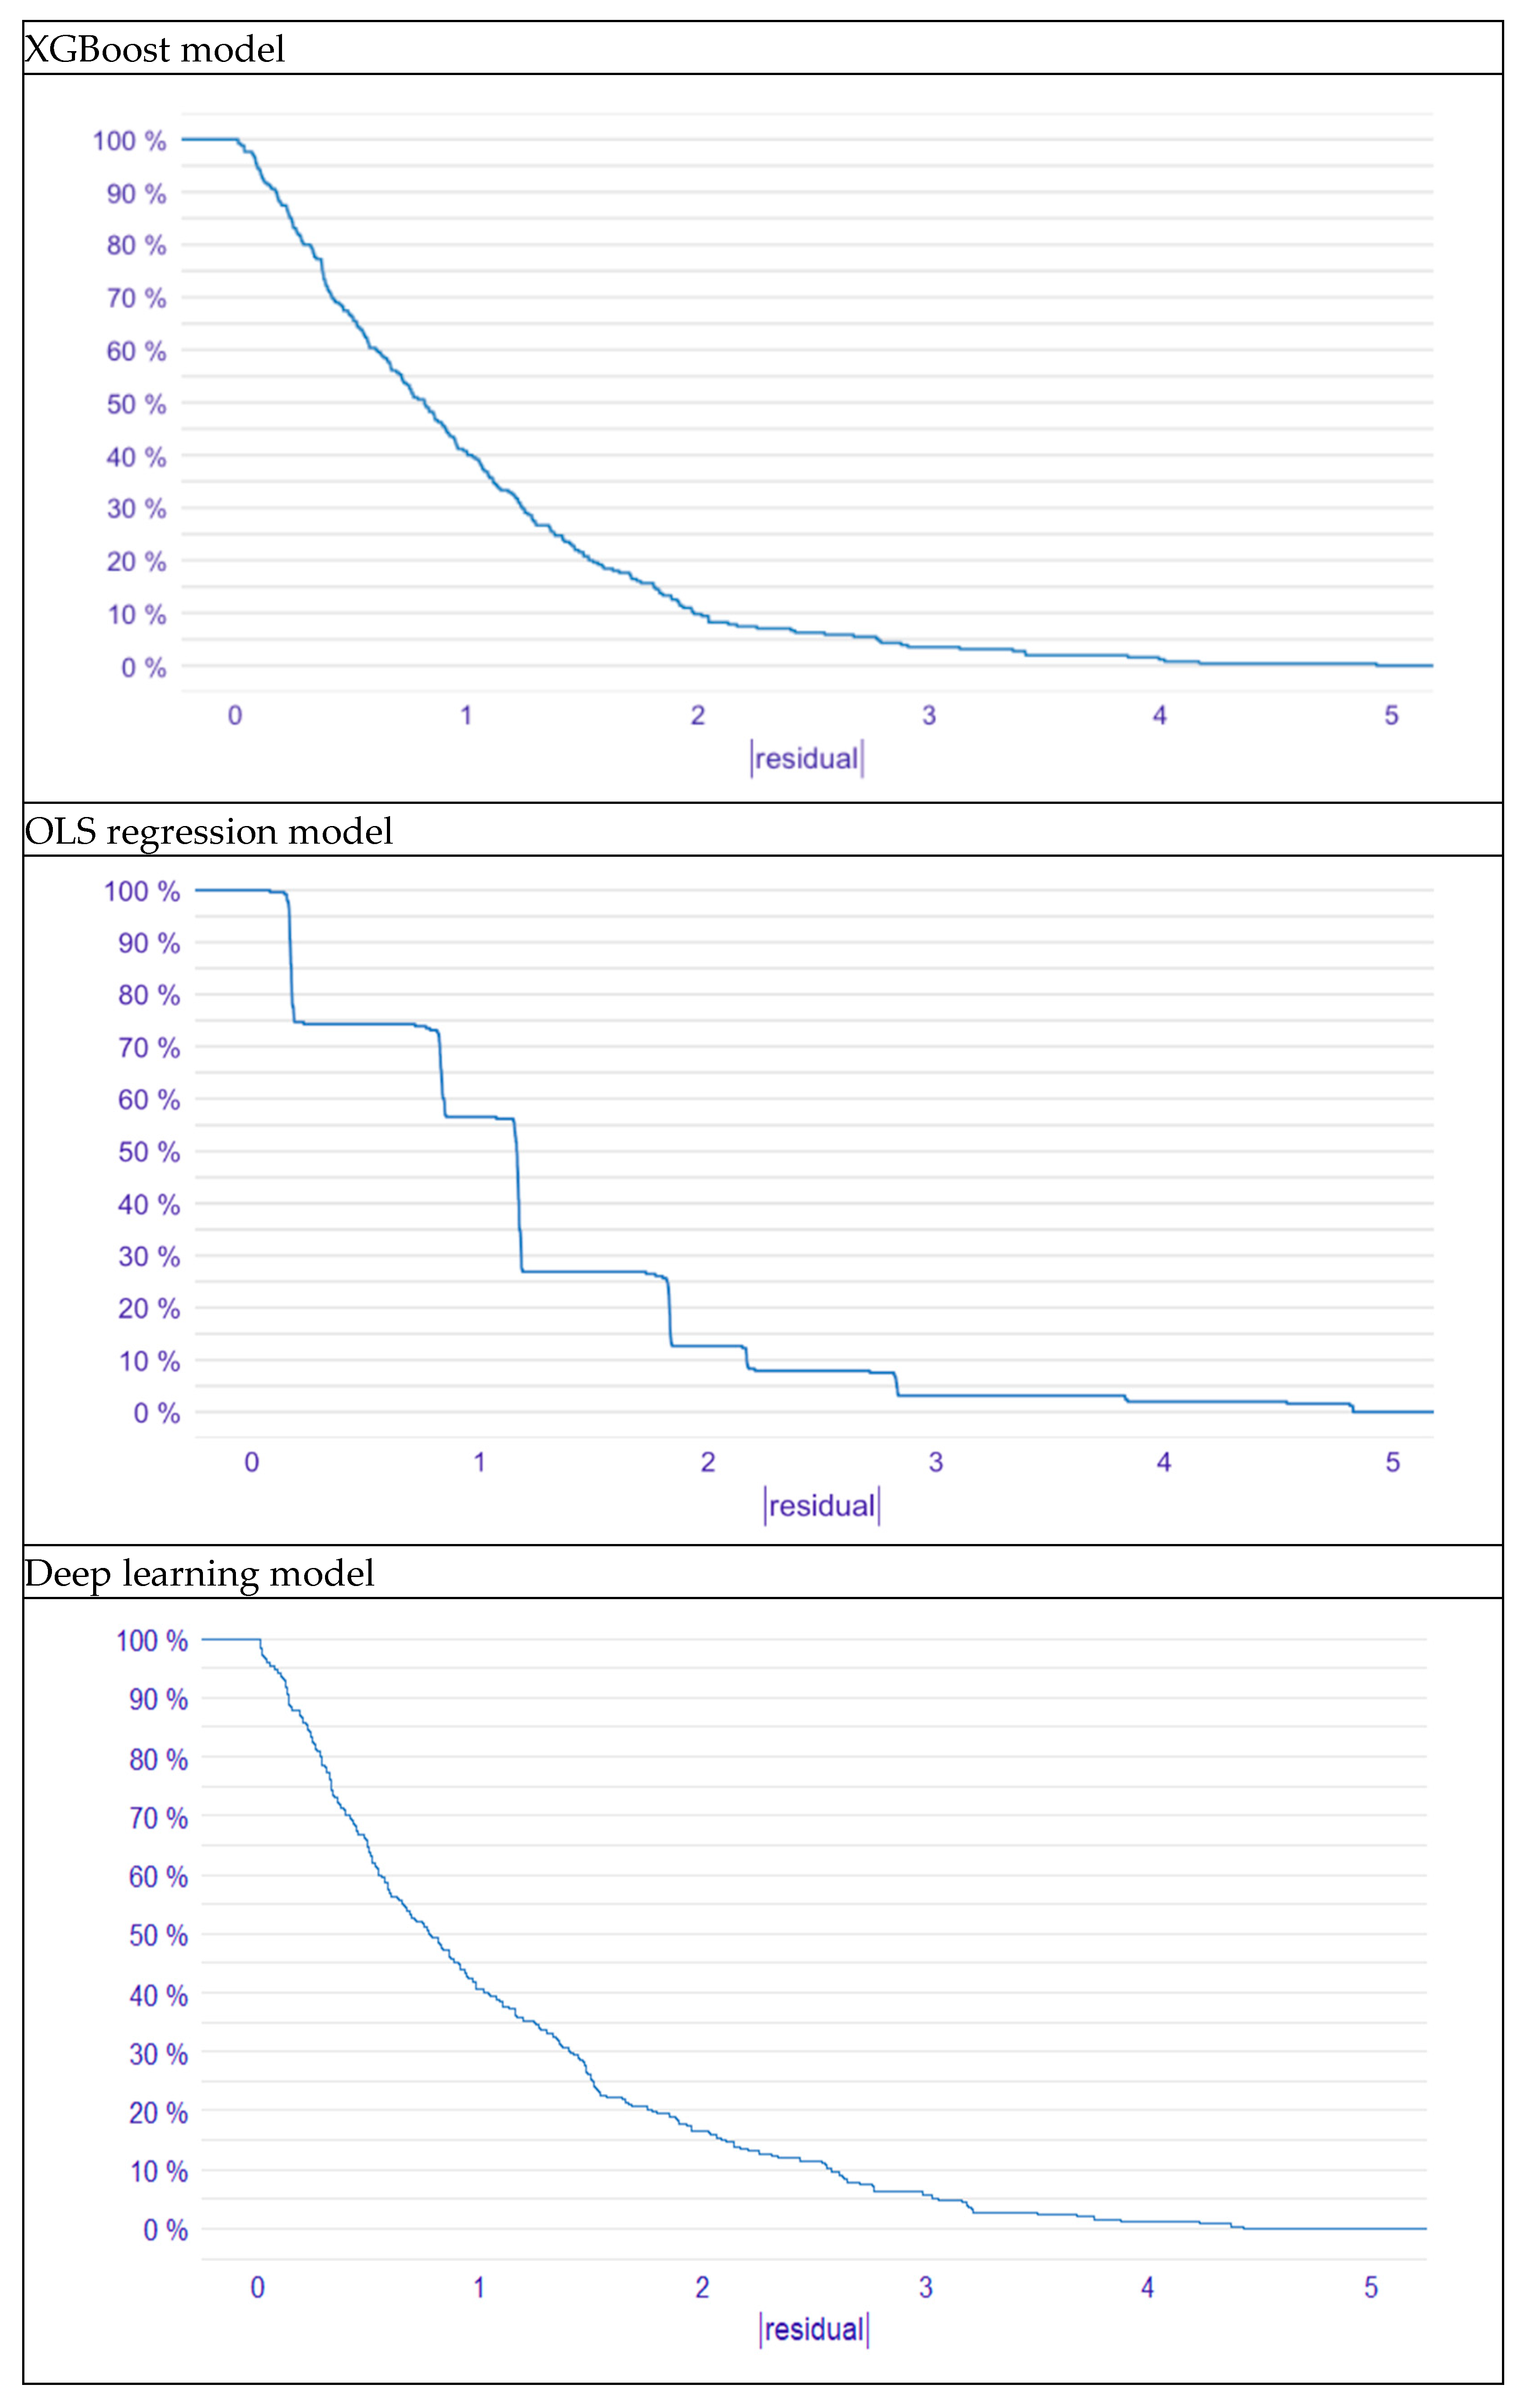
- The model exhibits very few errors exceeding a magnitude of 2, accounting for less than 10% of the total residuals.
- Errors greater than 3 constitute less than 5% of the total in the XGBoost model.
6. Discussion
6.1. Interpretation of Significant Results
6.2. Methodological Limitations
6.3. Limitations in Establishing Causality
6.4. Limitations Regarding Endogeneity
6.5. Theoretical Implications
6.6. Practical Implications
6.7. Implications for Policymakers
6.8. Current Study Limitations and Future Research Work
7. Conclusions
- 1.
- Environmental Risk as a Critical Predictor: higher TRUCAM values—reflecting costs linked to environmental impact, such as pollution management, supply chain vulnerabilities, and regulatory compliance—associate with increased failure propensity. This highlights the importance of environmental risks and their potential to reduce profitability and operational stability.
- 2.
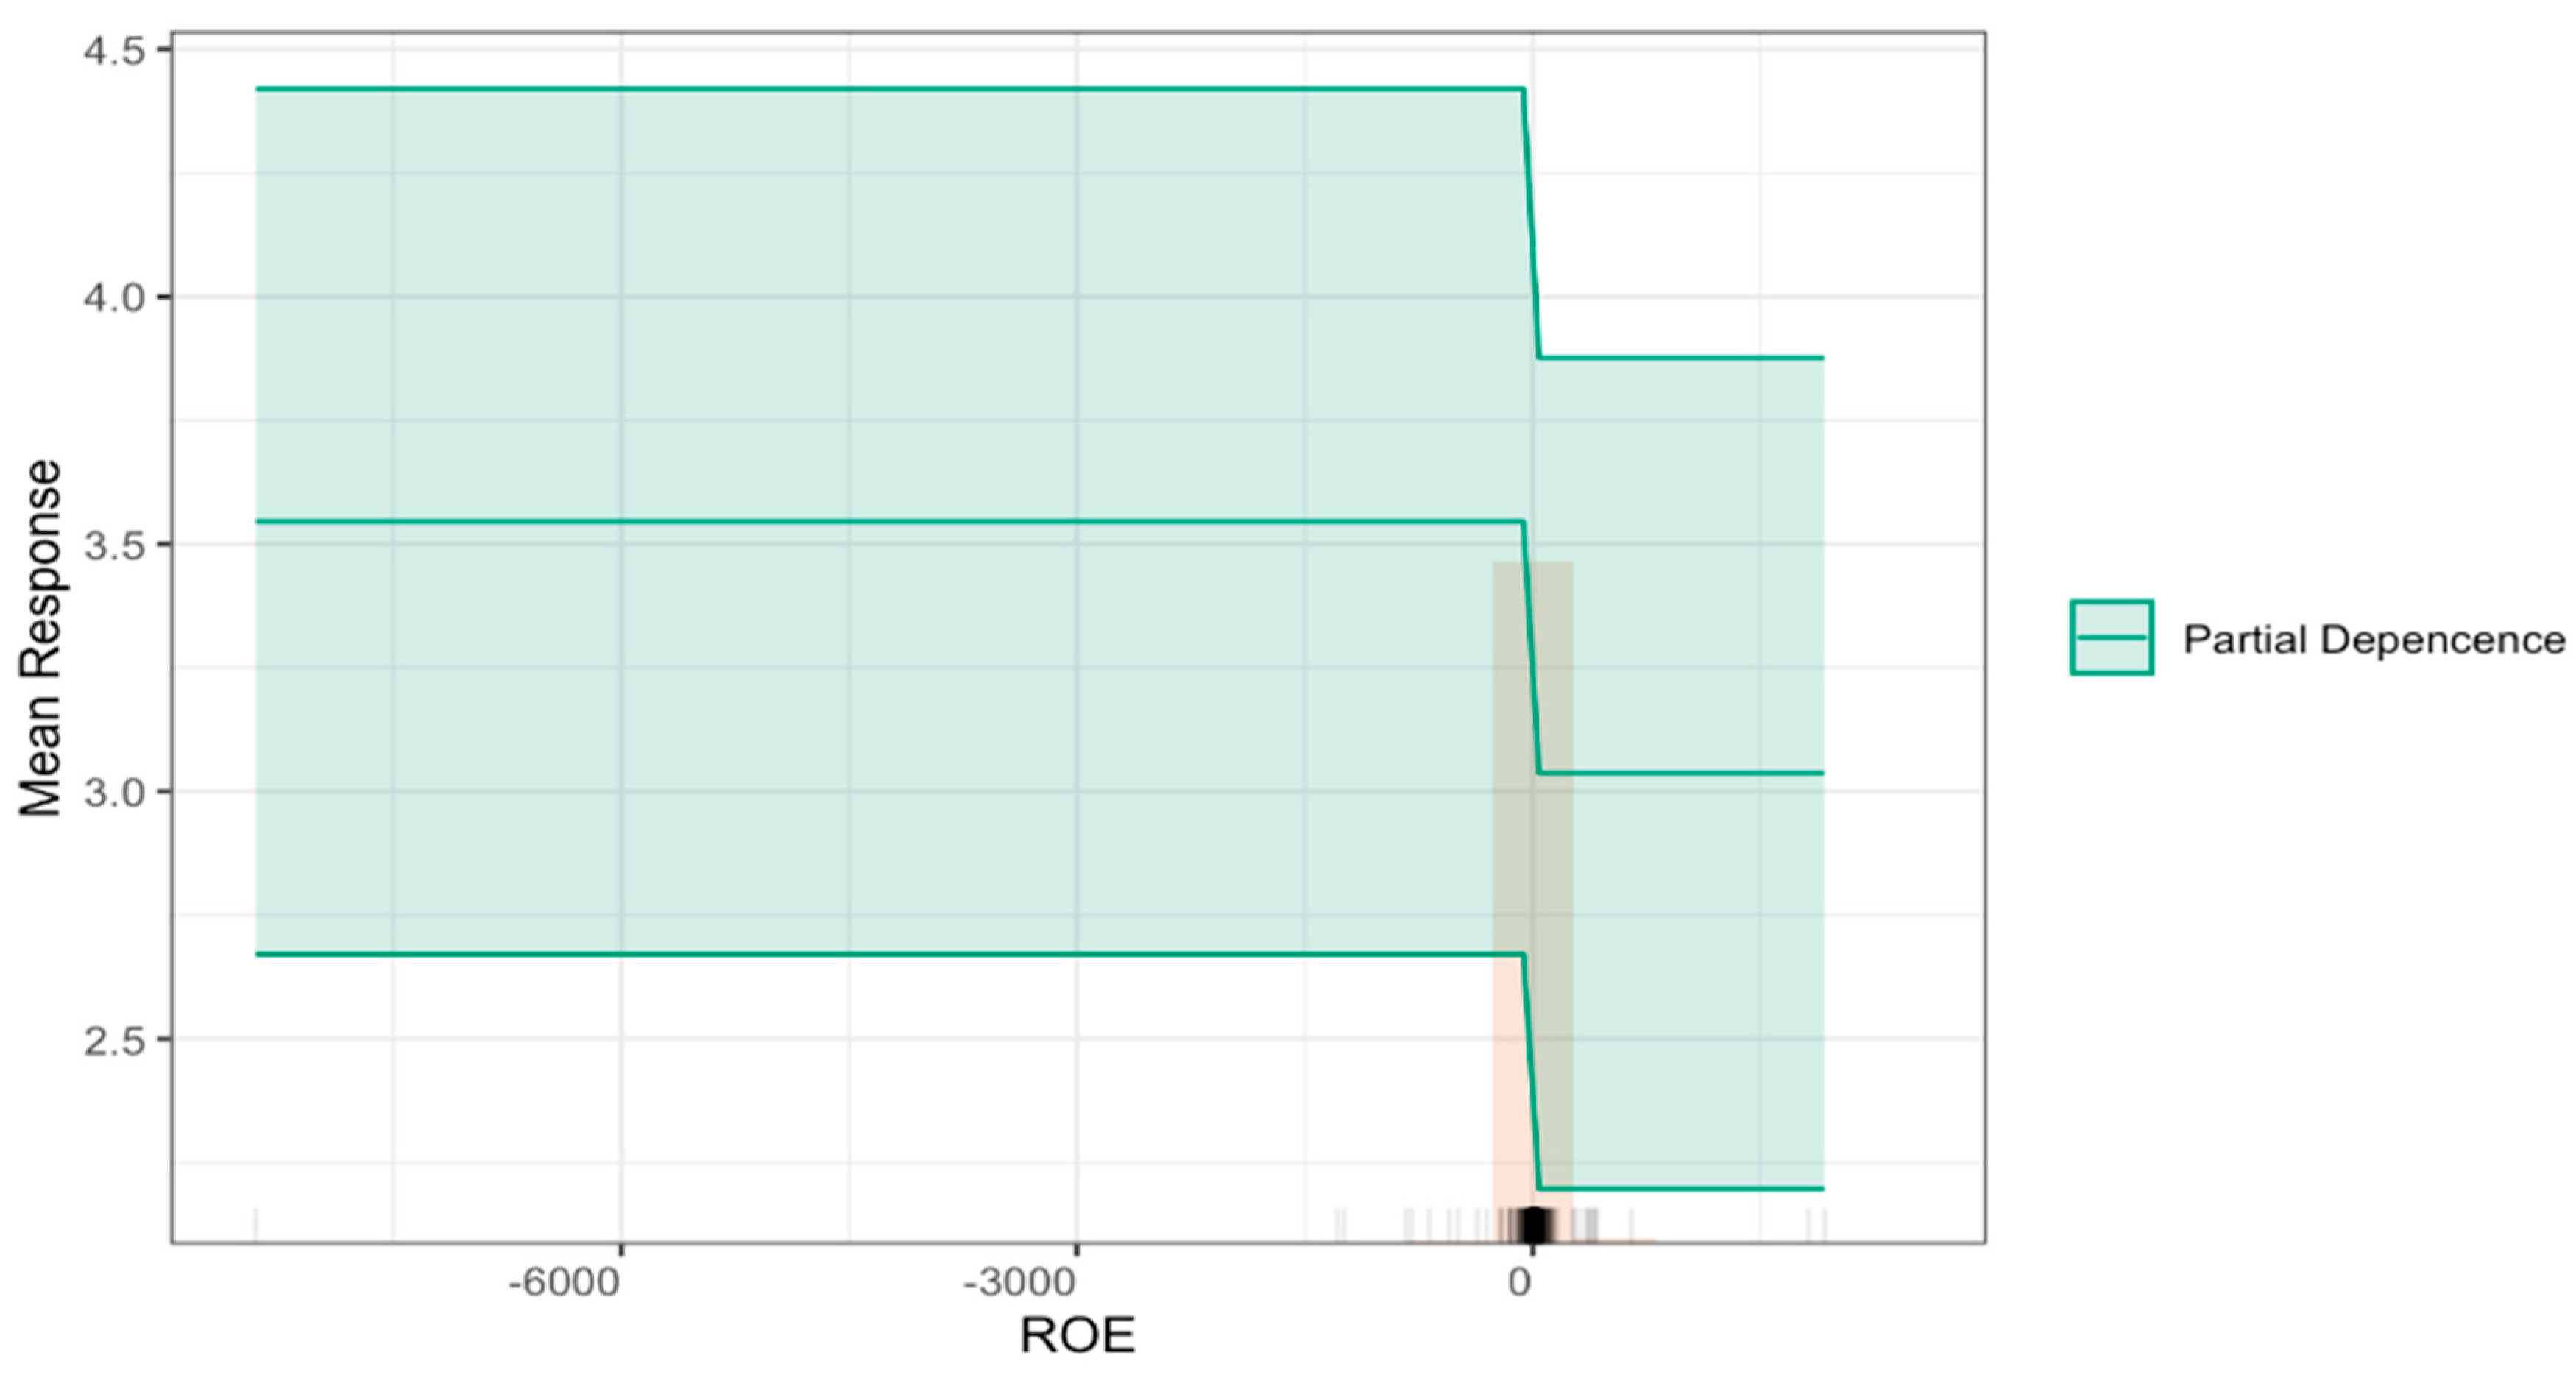
- Synergy of Financial and Non-Financial Factors: liquidity (STRUC5), financial profitability (ROE), and labor costs (PREM) remain robust predictors of failure, consistent with prior studies. However, TRUCAM’s prominence highlights the necessity of integrating sustainability metrics into financial risk assessments to enhance predictive performance metrics.
- 3.
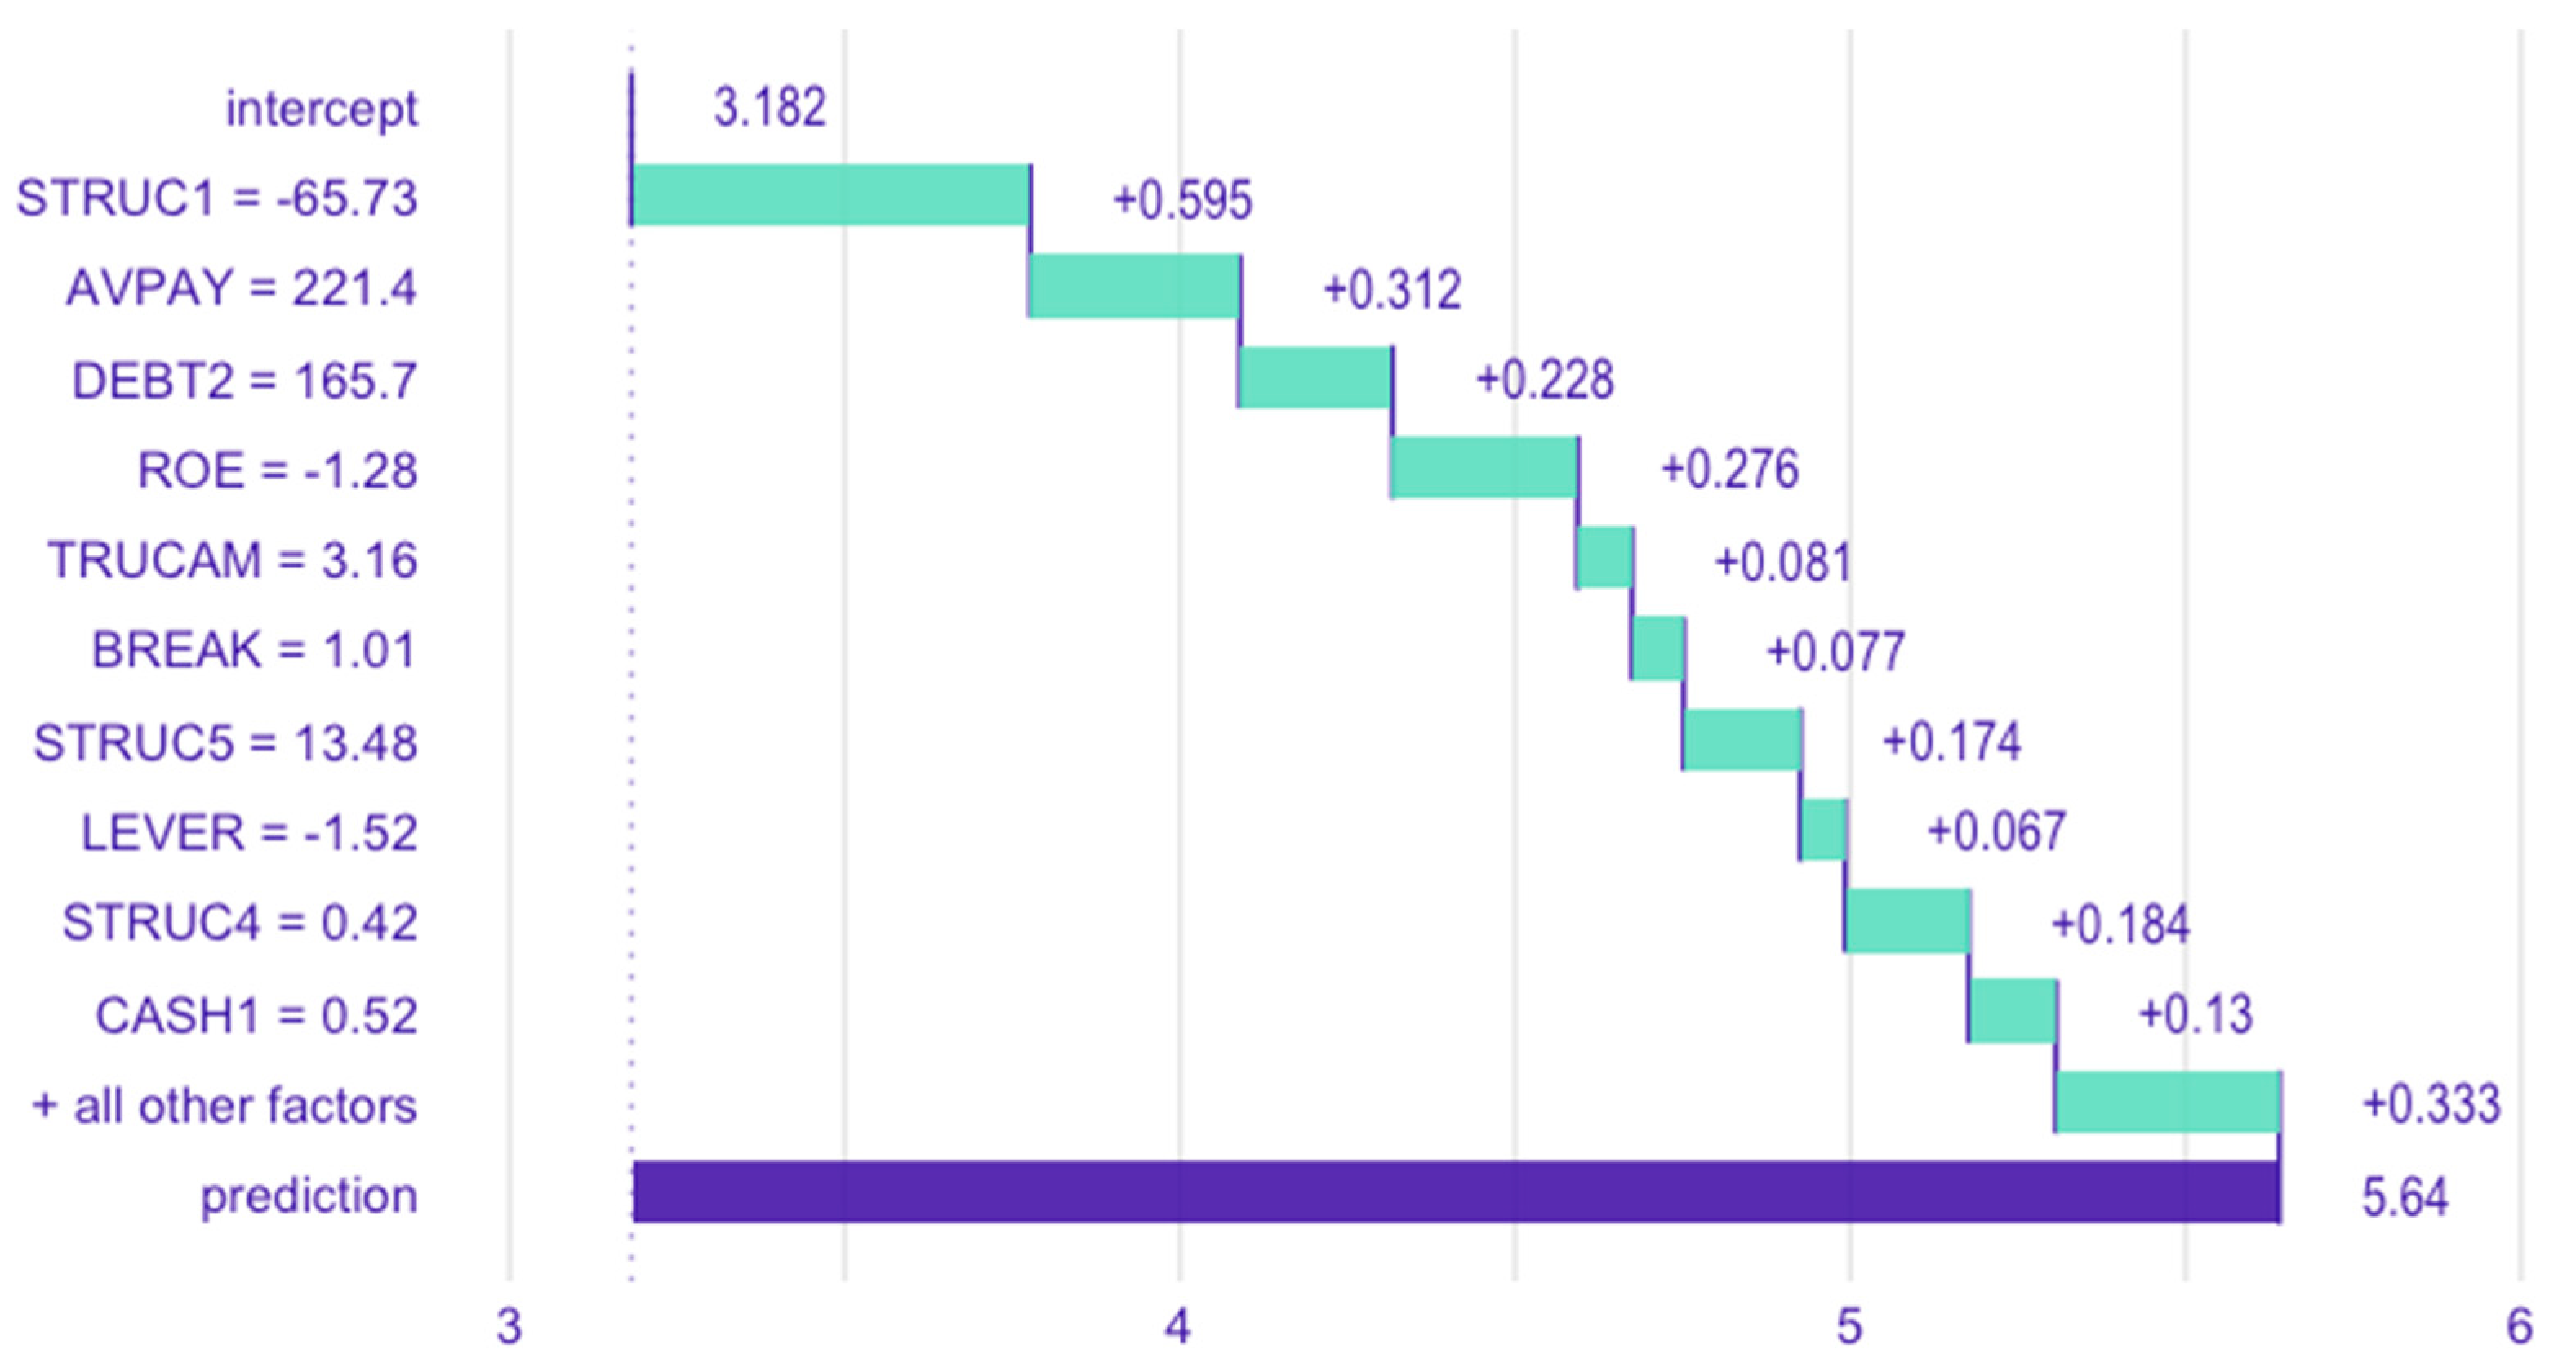
- Algorithmic Efficacy and Transparency: the XGBoost algorithm proved highly effective in handling multicollinearity and nonlinear relationships. Techniques such as variable importance analysis, partial dependence plots, and break-down plots mitigated the “black box” concern, offering actionable insights into how individual variables influence specific predictions [27,41].
Author Contributions
Funding
Institutional Review Board Statement
Informed Consent Statement
Data Availability Statement
Conflicts of Interest
References
- Altman, E. Financial ratios, discriminant analysis and the prediction of corporate bankruptcy. J. Financ. 1968, 23, 589–609. [Google Scholar] [CrossRef]
- Zavgren, C.V. Assessing the vulnerability to failure of American industrial firms: A logistic analysis. J. Bus. Financ. Account. 1985, 12, 19–45. [Google Scholar] [CrossRef]
- Ohlson, J.A. Financial Ratios and the Probabilistic Prediction of Bankruptcy. J. Account. Res. 1980, 18, 109–131. [Google Scholar] [CrossRef]
- Alfaro, E.; Gámez, M.; García, N. A boosting approach for corporate failure prediction. Appl. Intell. 2007, 27, 29–37. [Google Scholar] [CrossRef]
- Delgado, M. Discurso de apertura de la Jornada “El papel de los inversores en el modelo de transición energética”. Banco De España 2019, 1–9. Available online: https://repositorio.bde.es/handle/123456789/21730. (accessed on 1 April 2024).
- United Nations. Transforming Our World: The 2030 Agenda for Sustainable Development (A/RES/70/1); UN General Assembly: New York, NY, USA, 2015; Available online: https://sdgs.un.org/2030agenda (accessed on 1 March 2024).
- Directive (EU) 2022/2464 of the European Parliament and the Council (CSRD). 2022. Available online: https://eur-lex.europa.eu/eli/dir/2022/2464/oj (accessed on 1 March 2024).
- United Nations Department of Economic and Social Affairs. Global Sustainable Development Report 2023; Times of Crisis, Times of Change—Science for Accelerating Transformations to Sustainable Development; United Nations Publications: New York, NY, USA, 2023. [Google Scholar] [CrossRef]
- Castilla-Polo, F.; García-Martínez, G.; Guerrero-Baena, M.D.; Polo-Garrido, F. The cooperative ESG disclosure index: An empirical approach. Springer Environ. Dev. Sustain. 2024, 1–26. [Google Scholar] [CrossRef]
- Yakar-Pritchard, G.; Tunca-Çalıyurt, K. Sustainability Reporting in Cooperatives. Risks 2021, 9, 117. [Google Scholar] [CrossRef]
- Duguid, F.; Rixon, D. The development of cooperative-designed indicators for the SDGs. In Handbook of Research on Cooperatives and Mutuals; Elliott, M., Boland, M., Eds.; Edward Elgar Publishing: Cheltenham, UK, 2023; pp. 333–353. [Google Scholar] [CrossRef]
- Abdul Aris, N.; Marzuki, M.; Othman, M.; Abdul Rahman, R.S.; Hj Ismail, N. Designing indicators for cooperative sustainability: The Malaysian perspective. Soc. Responsib. J. 2018, 14, 226–248. [Google Scholar] [CrossRef]
- Beaver, W.H. Financial ratios as predictors of failure. J. Account. Res. 1966, 4, 71–111. [Google Scholar] [CrossRef]
- Freeman, R.E. The Politics of Stakeholder Theory: Some Future Directions. Bus. Ethics Q. 1994, 4, 409–421. [Google Scholar] [CrossRef]
- Elkington, J. The Triple Bottom Line. Environ. Manag. Read. Cases 1997, 2, 49–66. [Google Scholar]
- Ben Jabeur, S.; Stef, N.; Carmona, P. Bankruptcy Prediction using the XGBoost Algorithm and Variable Importance Feature Engineering. Comput. Econ. 2023, 61, 715–741. [Google Scholar] [CrossRef]
- Zmijewski, M.E. Methodological issues related to the estimation of financial distress prediction models. J. Account. Rev. 1984, 22, 59–82. [Google Scholar] [CrossRef]
- Frydman, H.; Altman, E.I.; Kao, D.L. Introducing recursive partitioning for financial classification: The case of financial distress. J. Financ. 1985, 40, 269–291. [Google Scholar] [CrossRef]
- Wilson, G.I.; Sharda, R. Bankruptcy prediction using neural network. Decis. Support Syst. 1994, 11, 545–557. [Google Scholar] [CrossRef]
- West, D.; Dellana, S.; Qian, J. Neural network ensemble strategies for financial decision applications. Comput. Oper. Res. 2005, 32, 2543–2559. [Google Scholar] [CrossRef]
- Verikas, A.; Kalsyte, Z.; Bacauskiene, M.; Gelzinis, A. Hybrid and ensemble-based soft computing techniques in bankruptcy prediction: A survey. Soft Comput. 2010, 14, 995–1010. [Google Scholar] [CrossRef]
- Sun, J.; Li, H.; Huang, Q.H.; He, K.Y. Predicting financial distress and corporate failure: A review from the state-of-the-art definitions, modeling, sampling, and featuring approaches. Knowl.-Based Syst. 2014, 57, 41–56. [Google Scholar] [CrossRef]
- Kim, M.J.; Kang, D.K. Ensemble with neural networks for bankruptcy prediction. Expert Syst. Appl. 2010, 37, 3373–3379. [Google Scholar] [CrossRef]
- Kim, S.Y.; Upneja, A. Predicting restaurant financial distress using decision tree and adaboosted decision tree models. Econ. Model. 2014, 35, 354–362. [Google Scholar] [CrossRef]
- Wang, G.; Ma, J.; Yang, S. An improved boosting based on feature selection for corporate bankruptcy prediction. Expert Syst. Appl. 2014, 41, 2353–2361. [Google Scholar] [CrossRef]
- Jones, S.; Johnstone, D.; Wilson, R. An empirical evaluation of the performance of binary classifiers in the prediction of credit ratings changes. J. Bank. Financ. 2015, 56, 72–85. [Google Scholar] [CrossRef]
- Zieba, M.; Tomczak, S.K.; Tomczak, J.M. Ensemble Boosted Trees with Synthetic Features Generation in Application to Bankruptcy Prediction. Expert Syst. Appl. 2016, 58, 93–101. [Google Scholar] [CrossRef]
- Simti, S.; Soui, M.; Ghedira, K. Tri-XGBoost model improved by BLSmote-ENN: An interpretable semi-supervised approach for addressing bankruptcy prediction. Knowl. Inf. Syst. 2024, 66, 3883–3920. [Google Scholar] [CrossRef]
- Díaz, Z.; Fernández, J.; Segovia, M.J. Sistemas de inducción de reglas y árboles de decisión aplicados a la predicción de insolvencias en empresas aseguradoras. In Documentos de Trabajo de la Facultad de Ciencias Económicas y Empresariales; Universidad Complutense de Madrid: Madrid, Spain, 2004; Volume 9. [Google Scholar]
- Alfaro, E.; Gámez, M.; García, N. Linear discriminant analysis versus adaboost forfailure forecasting. Rev. Española Financ. Contab. 2008, 37, 13–32. [Google Scholar]
- Alfaro, E.; García, N.; Gámez, M.; Elizondo, D. Bankruptcy forecasting: An empirical comparison of adaboost and neural networks. Decis. Support Syst. 2008, 45, 110–122. [Google Scholar] [CrossRef]
- Momparler, A.; Carmona, P.; Climent, F.J. La predicción del fracaso bancario con la metodología Boosting Classification Tree. Rev. Española Financ. Y Contab. 2016, 45, 63–91. [Google Scholar] [CrossRef]
- Climent, F.; Momparler, A.; Carmona, P. Anticipating bank distress in the Euro-zone: An extreme gradient boosting approach. J. Bus. Res. 2019, 101, 885–896. [Google Scholar] [CrossRef]
- Carmona, P.; Climent, F.; Momparler, A. Predicting bank failure in the U.S. Banking sector: An extreme gradient boosting approach. Int. Rev. Econ. Financ. 2019, 61, 304–322. [Google Scholar] [CrossRef]
- Pozuelo, J.; Romero, M.; Carmona, P. Utility of fuzzy set Qualitative Comparative Analysis (fsQCA) methodology to identify causal relations conducting to cooperative failure. CIRIEC-España Rev. Econ. Pública Soc. Y Coop. 2023, 107, 197–225. [Google Scholar] [CrossRef]
- Romero, M.; Carmona, P.; Pozuelo, J. La predicción del fracaso empresarial de las cooperativas españolas. Aplicación del Algoritmo Extreme Gradient Boosting. CIRIEC-España Rev. Econ. Pública Soc. Y Coop. 2021, 101, 255–288. [Google Scholar] [CrossRef]
- Roffé, M.A.; González, F.A.I. El impacto de las prácticas sostenibles en el desempeño financiero de las empresas: Una revisión de la literatura. Rev. Científica Visión E Futuro 2024, 28, 195–220. [Google Scholar] [CrossRef]
- Confederación Española de Organizaciones Empresariales-CEOE. Catálogo 2024 de Buenas Prácticas Ambientales de las Empresas Españolas—El Esfuerzo Empresarial en la Transición Ecológica y la Descarbonización. 2025. Available online: https://www.ceoe.es/es/publicaciones/sostenibilidad/catalogo-2024-de-buenas-practicas-ambientales-de-las-empresas. (accessed on 1 March 2025).
- Mozas-Moral, A.; Fernández-Uclés, D.; Medina-Viruel, M.J.; Bernal-Jurado, E. The role of SDGs as enhancers of the performance of Spanish wine cooperatives. Technol. Forecast. Soc. Change 2021, 173, 121176. [Google Scholar] [CrossRef]
- Chen, T.; Guestrin, C. XGBoost: A scalable tree boosting system. In Proceedings of the 22nd ACM SIGKDD International Conference on Knowledge Discovery and Data Mining, San Francisco, CA, USA, 13–17 August 2016; pp. 785–794. [Google Scholar] [CrossRef]
- Carmona, P.; Dwekat, A.; Mardawi, Z. No more black boxes! Explaining the predictions of a machine learning XGBoost classifier algorithm in business failure. Res. Int. Bus. Financ. 2022, 61, 101649. [Google Scholar] [CrossRef]
- Tascón, M.T.; Castaño, F.J. Variables y Modelos para la Identificación y Predicción del Fracaso Empresarial: Revisión de La Investigación Empírica Reciente. Rev. Contab. 2012, 15, 7–58. [Google Scholar] [CrossRef]
- Jánica, F.; Fernández, L.H.; Escobar, A.; Pacheco, G.J.V. Factores que explican, median y moderan el fracaso empresarial: Revisión de publicaciones indexadas en Scopus (2015–2022). Rev. Cienc. Soc. 2023, 29, 73–95. [Google Scholar] [CrossRef]
- Romero, M.; Pozuelo, J.; Carmona, P. Ethical transparency in business failure prediction: Uncovering the black box of XGBoost algorithm. Span. J. Financ. Account./Rev. Española Financ. Y Contab. 2024, 54, 135–165. [Google Scholar] [CrossRef]
- SABI. Database. 2024. Available online: https://login.bvdinfo.com/R1/SabiNeo (accessed on 1 April 2024).
- ORBIS. Bureau Van Dijk Database. A Moody’s Analysis Firm. 2024. Available online: https://orbis.bvdinfo.com/version-20250325-3-0/Orbis/1/Companies/Search (accessed on 1 April 2024).
- Thomas, S.; Reppetto, R.; Dias, D. Integrated Environmental and Financial Performance Metrics for Investment Analysis and Portfolio Management. Corporate Governance: Int. Rev. 2017, 15, 421–426. [Google Scholar] [CrossRef]
- Meric, I.; Watson, C.D.; Meric, G. Company green score and stock price. Int. Res. J. Financ. Econ. 2012, 82, 15–23. [Google Scholar]
- Bolton, P.; Reichelstein, S.J.; Kacperczyk, M.T.; Leuz, C.; Ormazabal, G.; Schoenmaker, D. Mandatory Corporate Carbon Disclosures and the Path to Net Zero. Manag. Bus. Rev. 2021, 1, 21–28. [Google Scholar] [CrossRef]
- Bellovary, J.L.; Giacomino, D.E.; Akers, M.D. A review of bankruptcy prediction studies: 1930 to present. J. Financ. Educ. 2007, 33, 1–42. Available online: https://www.jstor.org/stable/41948574 (accessed on 5 May 2024).
- Friedman, J.H. Greedy function approximation: A gradient boosting machine. Ann. Stat. 2001, 29, 1189–1232. Available online: https://www.jstor.org/stable/2699986 (accessed on 5 May 2024). [CrossRef]
- Probst, P.; Wright, M.N.; Boulesteix, A.-L. Hyperparameters and tuning strategies for random forest. Wiley Interdiscip. Rev. Data Min. Knowl. Discov. 2019, 9, e1301. [Google Scholar] [CrossRef]
- Cabrera-Malik, S. Is XGBoost immune to multicollinearity? Medium. 2024. Available online: https://medium.com/@sebastian.cabrera-malik/is-xgboost-inmune-to-multicolinearity-4dd9978605b7 (accessed on 5 May 2024).
- James, G.; Witten, D.; Hastie, T.; Tibshirani, R. An Introduction to Statistical Learning. Springer: New York, NY, USA, 2017. [Google Scholar]
- Friedman, J.; Hastie, T.; Tibshirani, R. Additive logistic regression: A statistical view of boosting (with discussion and a rejoinder by the authors). Ann. Stat. 2000, 28, 337–407. [Google Scholar] [CrossRef]
- Hastie, T.; Tibshirani, R.; Friedman, J. The Elements of Statistical Learning; Springer: New York, NY, USA, 2009. [Google Scholar]
- XGBoost Parameters. Available online: https://xgboost.readthedocs.io/en/stable/parameter.html (accessed on 2 November 2024).
- R Core Team. R: A Language and Environment for Statistical Computing; R Foundation for Statistical Computing: Vienna, Austria, 2024; Available online: http://www.R-project.org/ (accessed on 2 November 2024).
- Fryda, T.; LeDell, E.; Gill, N.; Aiello, S.; Fu, A.; Candel, A.; Click, C.; Kraljevic, T.; Nykodym, T.; Aboyoun, P.; et al. h2o: R Interface for the ‘H2O’ Scalable Machine Learning Platform. R Package Version 3.44.0.3. 2024. Available online: https://CRAN.R-project.org/package=h2o (accessed on 2 October 2024).
- Molnar, C. Interpretable Machine Learning. 2023. Available online: https://christophm.github.io/interpretable-ml-book/ (accessed on 2 May 2024).
- Hall, P.; Gill, N. An Introduction to Machine Learning Interpretability, 2nd ed.; O’Reilly Media, Inc.: Sebastopol, CA, USA, 2019. [Google Scholar]
- Biecek, P.; Burzykowski, T. Explanatory Model Analysis. Pbiecek.github.io. 2021. Available online: https://pbiecek.github.io/ema/preface.html (accessed on 5 May 2024).
- Heaton, J.; Goodfellow, I.; Bengio, Y.; Courville, A. Deep learning. Genet. Program. Evolvable Mach. 2018, 19, 305–307. [Google Scholar] [CrossRef]
- LeCun, Y.; Bengio, Y.; Hinton, G. Deep learning. Nature 2015, 521, 436–444. [Google Scholar] [CrossRef]
- Candel, A.; Ledell, E. Deep Learning with H2O. 2018. Available online: https://h2o-release.s3.amazonaws.com/h2o/rel-wheeler/4/docs-website/h2o-docs/booklets/DeepLearningBooklet.pdf (accessed on 5 June 2024).
- Romero, M.; Carmona, P.; Pozuelo, J. Utilidad del Deep Learning en la predicción del fracaso empresarial en el ámbito europeo. Rev. Métodos Cuantitativos Para Econ. Empresa 2021, 32, 392–414. [Google Scholar] [CrossRef]
- Barboza, F.; Kimura, H.; Altman, E. Machine learning models and bankruptcy prediction. Expert Syst. Appl. 2017, 83, 405–417. [Google Scholar] [CrossRef]
- Mullainathan, S.; Spiess, J. Machine learning: An applied econometric approach. J. Econ. Perspect. 2017, 31, 87–106. [Google Scholar] [CrossRef]
- Natekin, A.; Knoll, A. Gradient boosting machines, a tutorial. Front. Neurorobotics 2013, 7, 21. [Google Scholar] [CrossRef]
| Vadis P2BB Financial Strength Indicator Scale According to Propensity to Bankruptcy: | |
|---|---|
| Value | The Company’s Risk of Bankruptcy in the Next 18 Months Is: |
| 9 | More than 10 times the national average |
| 8 | Between 5 and 10 times the national average |
| 7 | Between 3 and 5 times the national average |
| 6 | Between 2 and 3 times the national average |
| 5 | Between 1 and 2 times the national average |
| 4 | Between 1/2 and 1 of the national average |
| 3 | Between 1/5 and 1/2 of the national average |
| 2 | Between 1/10 and 1/5 of the national average |
| 1 | Less than 1/10 of the national average |
| Key | Variables |
|---|---|
| Structural Ratios | |
| STRUC1 | Solvency ratio (%) = (Equity/Total Assets) × 100 |
| STRUC2 | Equity to Fixed Assets Ratio (%) = (Equity/Non-Current Assets) × 100 |
| STRUC3 | Current ratio (%) = (Current Assets/Current Liabilities) × 100 |
| STRUC4 | Acid test ratio (%) = [(Current Assets − Inventories)/Current Liabilities] × 100 |
| STRUC5 | Cash Ratio (%) = (Cash + Cash Equivalents)/Current Liabilities) × 100 |
| DEBT1 | Debt to Capital Ratio (%) = [Non-commercial Liability/(Equity + Total Liabilities)] × 100 |
| DEBT2 | Liabilities to Equity Ratio = (Total Liabilities/Equity) × 100 |
| DEBT3 | Gearing (%) = (Non-Current Liabilities + Loans/Equity) × 100 |
| LEVER | Leverage Ratio = Return on Assets (ROE)/Return on Equity (ROA) |
| INTER | Debt Service Coverage Ratio (%) = (Non-Commercial Liability/Cash Flow) × 100 |
| CASH1 | Cash Flow Margin (%) = (Cash Flow/Net Turnover) × 100 |
| CASH2 | Cash Return on Assets (%) = (Cash Flow/Total Assets) × 100 |
| BREAK | Break-even Ratio = Net turnover/(Net Turnover − EBIT) × 100 |
| Operating Ratios | |
| ROTAS | Asset Turnover Ratio = Net Turnover/Total Assets |
| AVCOL | Average Collection Period (days) = (Debtors/Net Turnover) × 360 |
| AVPAY | Average Payment Period (days) = [Suppliers/(Procurement + External Services)] × 360 |
| Profitability Ratios | |
| ROA | Return on Assets (%) = (EBIT/Total Assets) × 100 |
| PROPE | Operating Profitability (%) = (EBITDA/Total Assets) × 100 |
| ROE | Return on Equity (%) = (Net Income/Equity) × 100 |
| PREM | Cost of employee/Oper. Rev = (Personnel Expenses/Operating Revenue) × 100 |
| Environmental Variable | |
| TRUCAM: Trucost Environmental Scores | |
| Mean | SD | Median | Min | Max | Skew | SE | |
|---|---|---|---|---|---|---|---|
| STRUC1 | 42.99 | 40.75 | 45.33 | −392.09 | 100.00 | −3.29 | 1.31 |
| DE BT2 | 57.01 | 40.75 | 54.67 | 0.00 | 492.09 | 3.29 | 1.31 |
| DEBT1 | 25.74 | 30.62 | 17.34 | 0.00 | 358.77 | 3.23 | 0.98 |
| AVPAY | 60.16 | 247.13 | 23.17 | −958.45 | 5936.34 | 16.30 | 7.93 |
| STRUC5 | 626.03 | 5480.31 | 49.91 | 0.00 | 121,634.29 | 17.54 | 175.87 |
| STRUC3 | 895.58 | 6636.64 | 157.18 | 1.33 | 160,265.24 | 18.71 | 212.98 |
| STRUC4 | 827.00 | 6603.00 | 123.00 | 0.00 | 16,065.00 | 1898.00 | 212.00 |
| PREM | 26.80 | 27.78 | 17.69 | 0.00 | 225.54 | 1.88 | 0.89 |
| TRUCAM | 12.48 | 21.60 | 3.16 | 0.26 | 73.18 | 2.07 | 0.69 |
| STRUC2 | 1130.40 | 16,570.81 | 104 | −126,016 | 393,412 | 17.66 | 531.78 |
| Failure | 3.23 | 1.44 | 3.00 | 1.00 | 9.00 | 1.06 | 0.05 |
| XGBoost | |
|---|---|
| RMSE (Training sample) | 0.768 |
| RMSE (Cross-validation samples) | 1.209 |
| RMSE (Validation sample) | 1.314 |
| Model | MSE | RMSE | MAE | Mean Residual Deviance |
|---|---|---|---|---|
| XGBoost | 1.727 | 1.314 | 1.003 | 1.727 |
| OLS Regression | 2.598 | 1.612 | 1.226 | 2.598 |
| Deep Learning | 2.505 | 1.583 | 1.400 | 2.505 |
Disclaimer/Publisher’s Note: The statements, opinions and data contained in all publications are solely those of the individual author(s) and contributor(s) and not of MDPI and/or the editor(s). MDPI and/or the editor(s) disclaim responsibility for any injury to people or property resulting from any ideas, methods, instructions or products referred to in the content. |
© 2025 by the authors. Licensee MDPI, Basel, Switzerland. This article is an open access article distributed under the terms and conditions of the Creative Commons Attribution (CC BY) license (https://creativecommons.org/licenses/by/4.0/).
Share and Cite
Romero Martínez, M.; Carmona Ibáñez, P.; Martínez Vargas, J. Predicting Business Failure with the XGBoost Algorithm: The Role of Environmental Risk. Sustainability 2025, 17, 4948. https://doi.org/10.3390/su17114948
Romero Martínez M, Carmona Ibáñez P, Martínez Vargas J. Predicting Business Failure with the XGBoost Algorithm: The Role of Environmental Risk. Sustainability. 2025; 17(11):4948. https://doi.org/10.3390/su17114948
Chicago/Turabian StyleRomero Martínez, Mariano, Pedro Carmona Ibáñez, and Julián Martínez Vargas. 2025. "Predicting Business Failure with the XGBoost Algorithm: The Role of Environmental Risk" Sustainability 17, no. 11: 4948. https://doi.org/10.3390/su17114948
APA StyleRomero Martínez, M., Carmona Ibáñez, P., & Martínez Vargas, J. (2025). Predicting Business Failure with the XGBoost Algorithm: The Role of Environmental Risk. Sustainability, 17(11), 4948. https://doi.org/10.3390/su17114948


