Article

Sustainable Governance of the Global Rare Earth Industry Chains: Perspectives of Geopolitical Cooperation and Conflict

by
Chunxi Liu
1,
Fengxiu Zhou
2,*,
Jiayi Jiang
2 and
Huwei Wen
3,*
1
School of Mathematics and Statistics, Jiangxi Normal University, Nanchang 330022, China
2
School of Economics and Management, Jiangxi Normal University, Nanchang 330022, China
3
School of Economics and Management, Nanchang University, Nanchang 330031, China
*
Authors to whom correspondence should be addressed.
Sustainability 2025, 17(11), 4881; https://doi.org/10.3390/su17114881
Submission received: 9 April 2025 / Revised: 13 May 2025 / Accepted: 21 May 2025 / Published: 26 May 2025
(This article belongs to the Section Economic and Business Aspects of Sustainability)

Abstract

:
As critical strategic mineral resources underpinning high-tech industries and national defense security, rare earth elements have become a central focus of international competition, with their global industrial chain configuration deeply intertwined with geopolitical dynamics. Leveraging a novel multilateral database encompassing 140 countries’ geopolitical relationships and rare earth trade flows (2001–2023), this study employs social network analysis and temporal exponential random graph models (TERGMs) to decode structural interdependencies across upstream mineral concentrates, midstream smelting, and downstream permanent magnet sectors. Empirical results show that topological density trajectories reveal intensified network coupling, with upstream/downstream sectors demonstrating strong clustering. Geopolitical cooperation and conflict exert differential impacts along the value chain: downstream trade exhibits heightened sensitivity to cooperative effects, whereas midstream trade suffers the most pronounced obstruction from conflicts. Cooperation fosters long-term trade relationships, whereas conflicts primarily impose short-term suppression. In addition, centrality metrics reveal asymmetric mechanisms. Each unit increase in cooperation degree centrality amplifies the mid/downstream trade by 3.29 times, whereas conflict centrality depresses the midstream trade by 4.76%. The eigenvector centrality of cooperation hub nations enhances the midstream trade probability by 5.37-fold per unit gain, in contrast with the 25.09% midstream trade erosion from conflict-prone nations’ centrality increments. These insights provide implications for mitigating geopolitical risks and achieving sustainable governance in key mineral resource supply chains.

1. Introduction

Rare earth elements, often termed the industrial vitamins of the 21st century, serve as critical raw materials for strategic industries, including clean energy technologies, advanced equipment manufacturing, and national defense [1]. The UNCTAD Critical Minerals and Energy Transition (2023) highlights rare earths’ dual strategic role in both the digital economy and green technologies. CSIS research reveals a 480% surge in major economies’ rare earth supply chain during 2017–2022, demonstrating their evolution beyond traditional economic parameters into a form of technological power currency in great power competition [2]. This evidence clearly illustrates the significant impact of rare earth resources on national strategic landscapes and the development of cutting-edge industries. The uneven distribution of rare earth resources due to their natural endowments has resulted in their concentration in a limited number of countries, necessitating international trade for resource redistribution. Concurrently, contemporary international relations emphasize principles of respect, justice, fairness, and mutual benefit, advocating for transcending geopolitical constraints through expanded cooperation and conflict resolution [3,4], while stressing equality, moral values, and inclusive development in interstate relations that shape strategic mineral resource trade [5,6]. However, the frequent occurrence of geopolitical conflicts in recent years—from technological embargoes in the U.S.–China trade war to the scramble for critical minerals triggered by the Russia–Ukraine conflict—has repeatedly disrupted the fragile global rare earth supply chain [7]. Although economic globalization theoretically optimizes resource allocation through comparative advantages, the reality of interstate competition is increasingly fragmenting rare earth trade networks into geopolitically aligned blocks [8]. Therefore, investigating the impact of geopolitical relations on rare earth trade networks from both cooperative and conflicting perspectives is crucial for promoting the sustainable development of the rare earth trade.
Existing research has focused primarily on descriptive analyses of the current state of the rare earth trade [9,10,11], whereas some studies have employed complex network methods to construct international rare earth trade networks and examine their structural characteristics from various perspectives [12,13,14]. As research has progressed, scholars have begun exploring the driving mechanisms of the rare earth trade across political, economic, and cultural dimensions [15,16]. However, when examining the influence of political factors on trade networks, existing studies often oversimplify geopolitical relations as unidimensional continuous variables, failing to account for the fundamental differences in the mechanisms between cooperative and conflictual networks. Moreover, the rare earth trade is typically treated as a monolithic entity without a detailed examination of its distinct segments. Methodologically, most approaches are limited to static cross-sectional analyses, neglecting the long-term impacts of dynamic geopolitical changes on rare earth trade networks and lacking in-depth investigations into the evolutionary patterns of these networks. Traditional trade theories rooted in static economic rationality cannot adequately explain the coevolution of political conflict–cooperation networks and the interdependent relationships across upstream, midstream, and downstream industries. Addressing this gap requires a network-oriented framework capable of capturing how geopolitical relations asymmetrically reshape rare earth trade activities spanning upstream extraction, midstream processing, and downstream manufacturing.
To address these research gaps, this study employs complex network methods to construct cooperative networks, conflict networks, and rare earth trade dependency networks encompassing the entire industrial chain by systematically analyzing their structural characteristics and dynamic evolutionary trends. By developing a temporal exponential random graph model, we examine how geopolitical relationships influence the dynamic evolution of rare earth trade networks through the dual pathways of cooperation and conflicts. The results demonstrate gradient differences in the transmission effects of geopolitical networks across various industrial chain segments; the establishment of cooperative relationships between nations has long-term positive effects on rare earth trade dependencies, whereas the inhibitory impact of conflicts is significant in the short term but limited in the long run. Furthermore, network centrality indicators reveal a pronounced asymmetric influence mechanism, highlighting the complex interplay between geopolitical dynamics and trade network evolution.
The marginal contributions of this study are threefold. First, by employing social network analysis and complex modeling approaches, we explore the multidimensional pathways through which geopolitical relations influence strategic resource trade from both cooperative and conflictual perspectives, thereby expanding the analytical dimensions of the international political economy. Second, this research transcends the limitations of conventional single-segment analyses of the rare earth trade by systematically examining the comprehensive impacts of geopolitical cooperation and conflicting relationships on rare earth trade dependency networks from a full industrial chain perspective, addressing the literature’s insufficient attention to heterogeneous effects across different industrial segments. Third, by constructing a TERGM that incorporates endogenous network structural effects, actor–relation attributes, and exogenous network effects, we effectively capture both the short-term and long-term influences of geopolitical factors on upstream, midstream, and downstream rare earth trade dependency networks. This methodological advancement overcomes the limitations of traditional studies that focus primarily on exogenous network factors such as geographical and cultural distances. Additionally, by analyzing the impact of national centrality positions on rare earth trade networks through network centrality metrics, this study provides scientific foundations for the sustainable development of the rare earth industrial chain trade within the context of globalization. Figure 1 illustrates the empirical framework of this study.

2. Literature Review

2.1. Evolution of Rare Earth Trade Network Patterns

The synergistic effects of accelerating globalization and the digital technology revolution have driven rapid development in strategic industries such as high-end equipment manufacturing and national defense. As industrial gold, rare earth elements, characterized by an uneven global distribution due to heterogeneous natural resource endowments, necessitate redistribution through international trade [17]. This dynamic has significantly increased the complexity of global rare earth supply chains, prompting increasing attention to the structural and evolutionary mechanisms of rare earth trade networks [18,19]. The literature has focused primarily on rare earth trade networks through three analytical lenses: the trade network scale [5,15,20,21,22], spatial flow patterns [22,23,24], and policy impact pathways [7,12,24,25]. Longitudinal analysis reveals that global rare earth trade volumes have followed a fluctuating yet upward trajectory characterized by successive phases of expansion, contraction, and renewed expansion. Through the application of a complex network methodology, Hou et al. (2018), Wang et al. (2017), and Wang et al. (2019) systematically established global rare earth trade networks and conducted comprehensive analyses of network structural patterns and core clusters, revealing three fundamental evolutionary characteristics: significant dynamic fluctuations in trade volume, consistent growth in overall trade magnitude, and progressive enhancement of network connectivity and complexity over recent decades [7,15,26]. Structural examinations further demonstrate that these trade networks exhibit an oligopolistic configuration with distinct core–periphery stratification [22], where a select group of nations leverages either resource endowments or technological capabilities to maintain central positions, whereas the remaining states occupy peripheral roles within the global trade architecture [21,23]. The rare earth trade network includes pronounced community structures characterized by intensive intracommunity trade linkages [24]. Spatial flow analysis reveals an upstream-concentrated, downstream-dispersed pattern, forming a tripartite hierarchical structure of resource countries, processing countries, and consumer countries with significant disparities in trade volume across different tiers [5]. Policy analysis has demonstrated that rare earth trade governance is predominantly shaped by great power competition, with nations adopting various strategies, including export restrictions, supply chain localization, and multilateral cooperation, to reduce external dependencies [12,24,25].

2.2. Geopolitical Relations and Their Impacts on Rare Earth Trade Networks

In the field of geopolitical research, qualitative analysis predominantly relies on textual analysis as its primary paradigm. Bouzarovski et al. (2009) employed a systematic textual analysis approach to investigate the transformation of the energy sector in Central Europe and its geopolitical implications [27]. In contrast, Daras et al. (2015) adopted a quantitative research framework based on the geopolitical theory of Imre Lakatos and developed two generalized mathematical models for predicting geopolitical events [28]. This approach introduces a novel analytical paradigm for the quantitative assessment of geopolitical relationships.
The GDELT news database, with its extensive bilateral event data, offers distinct advantages for analyzing interstate interactions, providing a robust quantitative approach to examine macroeconomic and geopolitical events. A growing body of scholarship has leveraged this dataset to construct geopolitical networks, enabling the study of bilateral geopolitical relations. For example, Zhai et al. (2021) extracted GDELT data and employed complex network theory to systematically analyze geopolitical relationships among nations [29]. The GDELT database categorizes geopolitical events by their nature, distinguishing between geopolitical conflicts and cooperation. Emerging scholarship has begun examining geopolitical relations through this dual lens of cooperation and conflict. Geopolitical cooperation has been shown to facilitate the rare earth trade by ensuring stable supply–demand dynamics and improving domestic rare earth trade structures [8,30]. Conversely, geopolitical conflicts may disrupt rare earth supplies, potentially threatening global strategic mineral security [2,21,31].
The complexity of geopolitical relations lies in their dual cooperative–conflictual nature. While traditional studies often treat geopolitical relations as an undifferentiated whole, analyzing them through specific case studies and contextual frameworks [13,14], most fail to structurally disaggregate these relations into distinct cooperation and conflict networks [3,10,32]. This methodological limitation hinders a deeper investigation into their heterogeneous effects on rare earth trade patterns.

2.3. Methodologies and Modeling Approaches for Complex Trade Networks

In recent years, complex network analysis has been widely applied to global rare earth trade network studies because of its advantages in characterizing multilateral interactions and identifying systemic vulnerabilities. As a powerful analytical tool, the complex network methodology enables the examination of both structural characteristics and dynamic behaviors within systems [33]. Early research primarily employed complex network analysis to reveal the static structural features of trade networks. These studies emphasized the integrated and globalized nature of trade networks while utilizing methodologies such as centrality analysis, cohesive subgroups, and core–periphery structures to identify key nodes and assess their influence [34].
Recent scholarly focus has shifted toward understanding the dynamic evolutionary mechanisms of trade networks. The interdependent nature of geopolitical networks and rare earth trade networks, both rooted in complex network theory, necessitates alternative analytical approaches beyond traditional measurement methods to examine their mutual influences. Unlike conventional regression models, the TERGM extends this framework by effectively addressing temporal dependencies in longitudinal network data, contributing to their widespread adoption [35]. These models enable a more sophisticated analysis of network structural dynamics, overcoming the limitations of static network analysis and successfully capturing temporal dependencies in network evolution [36]. Empirical applications demonstrate their utility, including Xu et al.’s (2021) analysis of the evolution of the global waste paper trade network from 2000 to 2018 via the TERGM [37].
The literature has employed four primary methodological approaches to investigate the influence mechanisms of geopolitical relationships on rare earth trade networks: descriptive network metrics analysis [15,38], QAP [17], ERGM [39], and panel causality testing methods [40]. The progressive evolution of these methodologies has gradually elucidated how external factors shape the formation and transformation of rare earth trade networks. While current studies have examined geopolitical impacts on trade networks, relatively few have directly analyzed the relationship between geopolitical networks and rare earth trade networks via the TERGM, which represents a significant gap in the existing research landscape that warrants further scholarly attention.
This study leverages the DEGLT database to decompose geopolitical relationships into two distinct dimensions—cooperation and conflict—and systematically examines their differential impacts on the dynamic evolution of rare earth trade networks. By adopting a comprehensive value-chain perspective, we meticulously analyze the heterogeneous evolutionary patterns across the upstream, midstream, and downstream sectors of the global rare earth industrial chain. By utilizing TERGM, which incorporates network structures, behavioral relationships, and network covariates, we provide robust empirical evidence on how geopolitical cooperation and conflict propagate differently through various industrial segments. Building on these findings, we derive data-driven policy recommendations to foster sustainable development throughout the global rare earth value chain.

3. Theoretical Mechanism Framework

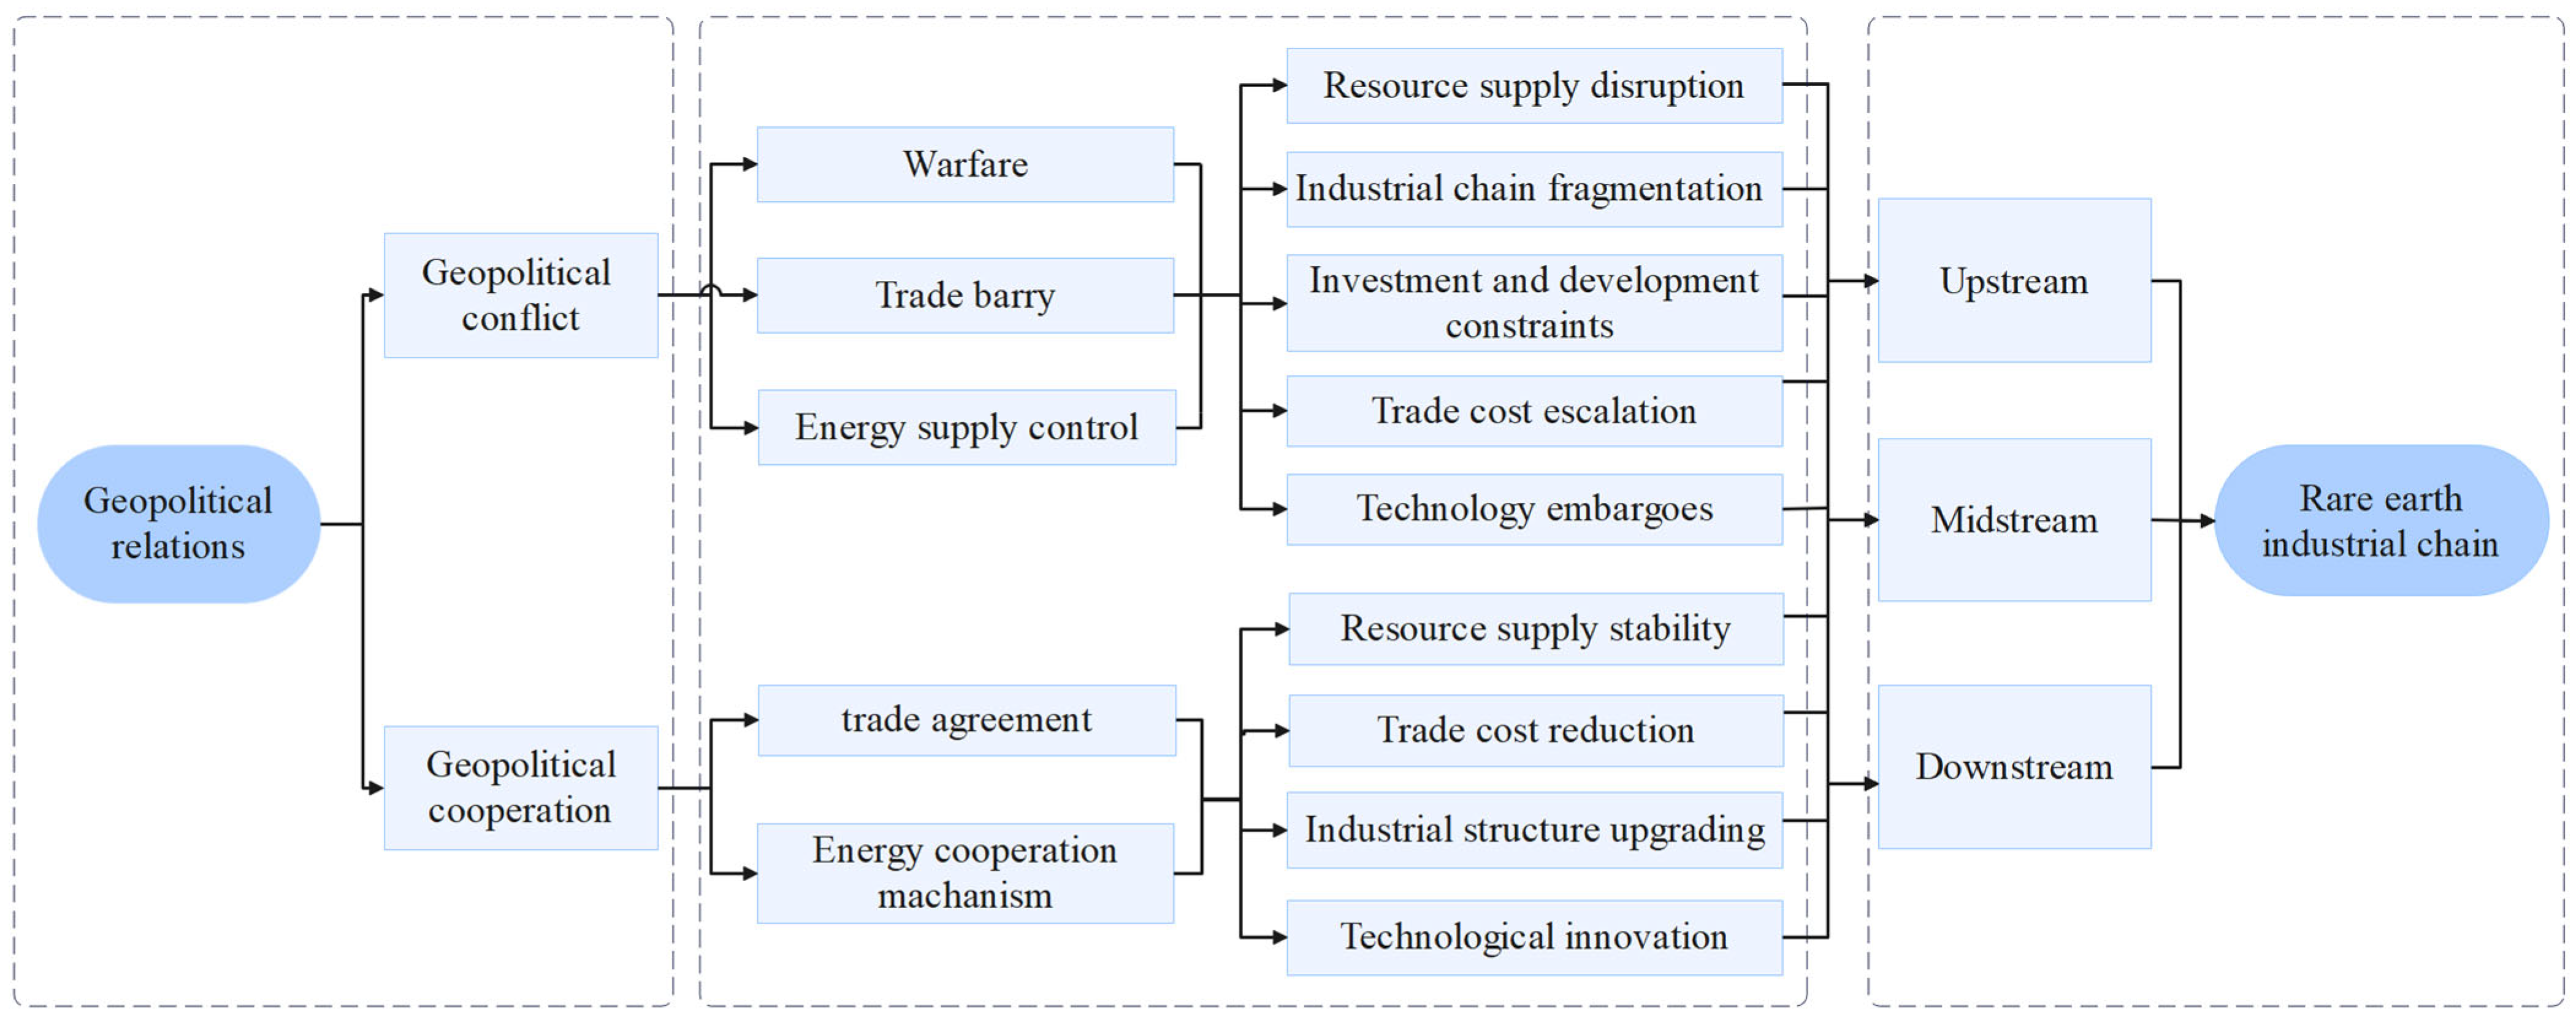
This study categorizes the geopolitical relationship network into cooperation networks and conflict networks, while the rare earth trade dependency network is segmented into upstream, midstream, and downstream trade networks. We examine how political cooperation and conflict influence rare earth trade from an industrial chain perspective. The theoretical framework illustrating the mechanisms through which the geopolitical network affects the rare earth trade dependency network is presented in Figure 2.
Geopolitical cooperation primarily manifests through mechanisms such as the signing of regional trade agreements and the establishment of energy collaboration frameworks. Such cooperation facilitates technological exchange among nations in rare earth mining, smelting, separation, and processing, thereby promoting innovation and industrial upgrading. It also helps break monopolies in resource supply [8,30], enhancing the risk resilience of the industrial chain. Energy cooperation mechanisms between states contribute to the optimization of resource transportation routes, reducing trade costs. Furthermore, international collaboration enables greater coordination in setting rare earth application standards, fostering the sustainable development of the industry.
Conversely, geopolitical conflicts impact the rare earth supply chain primarily through warfare, trade barriers [2,29], and resource control strategies. Armed conflicts may disrupt trade relationships between supplier and consumer nations, block critical transportation routes, and impose hidden trade cost escalations, potentially leading to complete trade suspension. Trade barriers introduce elevated political risk in rare earth development, deterring foreign investment and joint ventures while often accompanying technology embargoes and industrial decoupling, thus restricting the flow of advanced technologies. As rare earths constitute strategically vital resources, malicious control over their supply can destabilize global demand–supply dynamics, increasing the likelihood of industrial chain fragmentation [41].
The upstream region is highly geographically concentrated, with a limited number of export-dependent nations controlling most global resources. This creates asymmetric dependencies, where import-reliant states face supply chain vulnerabilities. Geopolitical cooperation facilitates resource flow stability, whereas conflicts risk entrenching monopolistic practices, thereby constraining the evolutionary dynamics of upstream trade networks. In the midstream region, technological sophistication creates distinct challenges. Cooperation relationships enable cross-border knowledge transfer and joint innovation, whereas geopolitical tensions may trigger technology hoarding behaviors, particularly in separation techniques and the processing of patents. The downstream area has market-driven characteristics. International collaboration promotes market integration and risk diversification, enhancing systemic resilience. Conversely, conflicts induce trade discontinuities, generate cascading cost effects, and may precipitate value chain decoupling.

4. Data and Methods

4.1. Data

GDELT (Global Database of Events, Language, and Tone) is an open global event database that monitors and analyzes content from more than 3000 mainstream media outlets, television broadcasts, and internet news in more than 200 languages worldwide. It extracts critical information such as time, location, actors, and event types on the basis of the textual features of the content. GDELT employs the conflict and mediation event observation coding system, categorizes events into 20 major classes and over 300 subclasses, and meticulously records the initiator (Actor1) and receiver (Actor2) of each event, along with specific event details. Each record in the database represents an event, comprising 58 fields. The fields are categorized by event type, with codes 1, 2, 3, and 4 representing verbal cooperation, material cooperation, verbal conflict, and material conflict, respectively. The fields Actor1Geo_CountryCode and Actor2Geo_CountryCode denote the country codes of the initiator and receiver, whereas Actor1Type1Code and Actor2Type1Code indicate the roles of the initiator and receiver.
This study extracts geopolitical relationship data from GDELT, applying strict filtering criteria to ensure government-level interactions. To enhance the official authority of the news sources and accurately reflect geopolitical interactions between countries, this study restricts both Actor1Type1Code and Actor2Type1Code to government roles.
This study extracts rare earth product data from UN Comtrade. To address the bilateral asymmetry issue caused by statistical discrepancies in the UN Comtrade Database, this study follows the widely accepted practice in international academia [22,42,43] by using importers’ reported data as the benchmark. On the basis of rare earth processing flow and value-added characteristics, the rare earth industrial chain is divided into three segments: the upstream industrial chain, which is represented by rare earth ores (HS253090); the midstream industrial chain, which is represented by rare earth metals and their compounds (HS284610, HS284690, and HS280530); and the downstream industrial chain, which is represented by rare earth magnetic materials (HS850511), as shown in Table 1.
National development levels are measured using GDP, with data sourced from the World Bank’s World Development Indicator (WDI) database. The GDP data were used to measure the overall economic scale of each country, and logarithmic transformation was applied to reduce data skewness. Geographic distance data, language similarity data, and colonial relationship data are sourced from the CEPII and UNCTAD databases.

4.2. Method

4.2.1. Network Construction

Some countries were excluded because only links with a dependency strength greater than 0 were retained and the number of nodes in each network differed (from 130 to 207); this heterogeneity necessitated standardized country matching. To ensure data continuity and maximize sample country coverage, we used ISO 3166-1 alpha-3 codes via the pycountry package and secondary alignment for nonstandard entries via the fuzzywuzzy package with manual verification of ambiguous cases. The final dataset contains 140 countries, representing 92.7% of the total rare earth trade volume.
(1)
Geopolitical relationship network
Drawing on the ‘credibility of commitments’ theory in international relations research, substantive actions carry greater weight than verbal promises do, and we adopt a differentiated weighting approach by assigning distinct weights to material cooperation and verbal cooperation events. Material cooperation events (e.g., economic aid and military deployment) are assigned a weight of 1, as they involve tangible resource commitments and exert a more direct and enduring impact on bilateral relations. In contrast, verbal cooperation events (e.g., joint statements and diplomatic expressions) primarily convey symbolic significance and exhibit weaker binding effects, hence receiving a weight of 0.5. Moreover, we employ an aggregation method that sums event values within the same time window to compress information, thereby reducing the impact of stochastic fluctuations. For repeated interactions between a country pair within the same period, we apply nonoverlapping time windows to cumulatively sum weighted values.
These weights are summed to derive the cooperation intensity and conflict intensity. Countries are used as nodes, while cooperation or conflictual relationships are used as edges, and cooperation or conflict intensity are used as edge weights to construct separately directed cooperation networks and directed conflict networks.
(2)
Rare earth trade dependency network
Common trade dependence indicators primarily measure the proportion of rare earth trade in a nation’s total trade volume. These indicators mainly utilize flow-based relationships such as bilateral rare earth trade values or input–output linkages, emphasizing the trade value of rare earth elements. To better capture the strategic dimension of rare earth trade dependencies that may lead to supply chain vulnerabilities, this study employs the PMI index to quantify bilateral rare earth trade dependence under the influence of the overall network structure. The PMI reflects how such dependencies may either foster international cooperation or, conversely, create threats through excessive reliance, thereby more accurately aligning with this paper’s investigation of geopolitical mechanisms shaping the rare earth trade network.
Specifically, in the trade dependency network of a specific segment k of the rare earth industry chain in year t , each country is represented as a node. If a dependency relationship exists between any two countries, the nodes are connected by a directed edge, with the dependency intensity serving as the weight of the edge [41]. The nodes and their connections collectively form the rare earth trade network. Thus, the rare earth trade network for segment k in year t can be represented by an N t k × N t k adjacency matrix G t k , where N t k denotes the number of countries participating in the rare earth trade for segment k in year t . The element g i j in the adjacency matrix G t k indicates whether country i depends on country j in the rare earth trade network for segment k in year t : if a dependency relationship exists, g i j equals the pointwise mutual information P M I i j ; if no dependency relationship exists, g i j equals 0. The specific value of P M I i j reflects the intensity of the dependency relationship of country i on country j . The larger the value, the stronger the dependency of country i on country j . The calculation of P M I i j is based on trade data, and the specific formula is as follows:
P M I i j = y i j y w y i y w x j x w g i j = m a x ( P M I i j , 0 ) ,
where y i j represents the import value (in USD) from country i to country j ; y i denotes the total import value (in USD) of country i from the world; x j represents the total export value (in USD) of country j to the world; and x w and y w represent the total import and export values (in USD) of all countries globally, respectively. Through these definitions, P M I i j can quantify the intensity of the dependency relationship of country i with country j from a global perspective, providing a crucial theoretical foundation for analyzing the structural characteristics and evolutionary patterns of the rare earth trade dependency network.
According to the literature, export data and import data often do not align in international trade statistics [44]. Since customs inspections and clearance procedures for imported goods are typically more stringent than those for exported goods are, this study adopts import data to construct a trade dependency matrix, aiming to characterize the dependency relationships between countries more accurately [45].
(3)
Other networks
This study constructs a geographic proximity network using countries as nodes, geographical adjacency relationships as edges, and actual geographical distances as edge weights; establishes a common language network by assigning edge weights of 1 when trading partner countries share an official language and 0 otherwise; and builds a colonial relationship network by assigning edge weights of 1 when trading nations have historical colonial ties and 0 when they do not.

4.2.2. Network Indicators

Global Network Indicators

(1)
Degree
In directed networks, the degree of a node represents the total number of its directly connected neighbors, which is decomposed into out-degree D e g r e e i o u t and in-degree D e g r e e i i n [46,47]. A nation’s higher out-degree (in-degree) reflects its greater tendency to send (receive) relations; thus, we utilize geopolitical cooperation/conflict network out-degree (in-degree) metrics to quantify the sender effect (receiver effect) on rare earth supply chain trade network formation.
D e g r e e i i n = j = 1 n a i j ,
D e g r e e i o u t = j = 1 n b i j ,
(2)
Weighted degree
For a directed weighted network, if a node has n edges and the weight of each edge is g i j , then the weighted degree of this node is calculated as the sum of all edge weights connected to it.
D W i = j = 1 n g i j ,
(3)
Clustering coefficient
The clustering coefficient is a metric used to measure the closeness of trade partnerships in the rare earth trade, reflecting the strength of relationships and the degree of clustering between a node and its neighboring nodes. A higher clustering coefficient C ( k ) indicates that the node and its neighboring nodes have tightly knit trade partnerships, with a greater likelihood of maintaining long-term and stable trade relationships. Conversely, a lower clustering coefficient suggests that the trade partnerships are loose and unstable.
K i = Y i k i × ( k i 1 ) ,
C k = 1 N j = i | k i = k C i ,
where K i represents the clustering coefficient of node v i , k i refers to the number of neighboring nodes of node v i , k i × ( k i 1 ) denotes the total number of possible connecting edges among the neighboring nodes of node v i , and Y i represents the actual number of connecting edges among these k i neighboring nodes in the network. Additionally, C ( k ) is the average clustering coefficient of all nodes with degree k , where C k [ 0,1 ] .
(4)
Average path length
The average path length can explain the transmission efficiency and connectivity in the rare earth trade network. It is defined as the average value of the shortest paths between any two nodes in the network. The more edges a trade relationship requires between two trading countries, the lower the trade transmission efficiency. The formula for the average path length is
L = 1 n ( n 1 ) i j d i j ,
where d i j is the shortest path between node i and node j .
(5)
Density
Network density is an indicator used to measure the prosperity, activity level, and trade scale in rare earth trade activities. It provides an intuitive representation of the closeness between various trading entities in the trade network. n ( n 1 ) represents the theoretical maximum number of edges, and the network density is calculated as
Density = 2 n n ( n 1 ) ,
where m is the number of existing edges in the rare earth trade network and n is the total number of nodes. A higher network density indicates more frequent rare earth trade interactions and closer connections between trading entities, whereas a lower value suggests less active trade and a smaller trade scale, where D e n s i t y [ 0,1 ] .
(6)
Modularity
Modularity is a metric that quantifies the degree of community segregation within a network, where countries belonging to the same community exhibit strong trade connections, whereas those in different communities demonstrate relatively loose relationships. Higher modularity values indicate greater regionalization within the network structure, whereas lower values suggest the opposite pattern of integration.
M = 1 2 m i j ( u i j A i A j 2 m δ ( C i , C j ) ,
where u i j represents the weight of the edge from node i to nodes j ; A i and A j denote the sums of the weights of all the edges connected to nodes i and j , respectively; C i and C j are the sets of all the communities containing nodes i and j , respectively; and δ ( C i , C j ) is an indicator function, where δ C i , C j = 1 if nodes i and j are in the same community and δ C i , C j = 0 otherwise.

Node-Level Indicators

(1)
Degree centrality
Degree centrality is commonly used to measure the importance of a node within a network, serving as an indicator of the strength of connections between a specific node and other nodes. Generally, the more connections it has within the network, the more significant its position in the network, and the higher the degree centrality of a node country. Using this metric, we evaluate how a nation’s centrality position in the geopolitical network influences the formation of rare earth industrial chain trade dependency networks. Degree centrality is often expressed as
C D i = D e g r e e i i n + D e g r e e i o u t ,
(2)
Eigenvector centrality
Eigenvector centrality is a measure of a node’s influence within a network. Eigenvector centrality posits that the importance of a node depends not only on the number of adjacent nodes but also on the centrality of those adjacent nodes. Let x i denote the eigenvector centrality measure of node v i ; then,
λ x i = j = 1 n a i j x j ,
where λ is the eigenvalue of matrix A . When there is an edge between nodes v i and v j , a i j = 1 ; otherwise, a i j = 0 . Letting x = [ x 1 , x 2 , , x n ] T after multiple iterations until a steady state is reached, the following equation can be obtained:
λ x = A x ,
Solving this equation reveals that x is the eigenvector corresponding to the eigenvalue of matrix A . The formula for eigenvector centrality is
E C i = λ 1 j = 1 n a i j x j ,

4.2.3. Temporal Exponential Random Graph Model (TERGM)

Current methodological approaches for examining geopolitical influences on rare earth trade networks, including descriptive network metrics [38], the QAP [17], the ERGM [39], and panel causality tests, have significant limitations [15,40]. The emerging SOAM presents a promising alternative through its agent-based stochastic simulation framework, which models strategic interactions among actors under institutional constraints, capturing dynamic games of sanctions and alliance formation while emphasizing microlevel strategic behaviors in network evolution. Nevertheless, this study employs the TERGM as its core analytical approach rather than the SOAM because of the following methodological considerations.
While SOAM demonstrates superior capability in simulating microlevel decision-making behaviors and their subsequent network evolution processes, the present study specifically investigates macrolevel network statistical patterns and influence mechanisms at the global scale. This fundamental discrepancy in research objectives renders SOAM methodologically incongruent with our analytical focus. The SOAM framework requires granular data on individual behavioral rules and interaction patterns, whereas the GDELT event data and rare earth trade statistics employed in this study are methodologically better suited for the maximum likelihood estimation approach of the TERGM.
Both rare earth trade networks and geopolitical networks exhibit significant temporal evolution characteristics. Compared with the conventional static ERGM, the TERGM provides superior capability in capturing dynamic network structural changes, making it particularly suitable for analyzing the 2001–2023 longitudinal dataset in this study. The TERGM offers dual analytical capability to simultaneously examine endogenous network structural properties and exogenous variable effects. This methodological advantage aligns precisely with our research objectives of investigating both the self-organizing characteristics of rare earth trade networks and the external influences of geopolitical cooperation/conflict networks.
The TERGM constructs a temporal probabilistic model for networks on the basis of the principles of discrete-time Markov chains, assuming that the network at time t depends only on the preceding periods. It employs maximum likelihood estimation (MLE) for model fitting, simulation, diagnostics, comparison, and refinement. The innovation lies in incorporating the temporal dependency characteristics of networks into the analysis, enabling the simultaneous investigation of endogenous and exogenous mechanisms driving dynamic network evolution [48]. This study integrates the pure structure effect, actor–relationship attribute effects, and network covariate effects into the TERGM via complex network analysis methods. This framework is applied to examine the influence of geopolitical relationships on the formation and evolution of the rare earth trade dependency network, with empirical validation conducted. The specific model is as follows:
P ( Y t | θ t 1 , Y t 1 ) = 1 c e x p ( θ 0 E d g e s + θ 1 M u t u a l + θ 2 D e l r e c i p + θ 3 S t a b i l i t y + θ 4 G w o d e g + θ 5 G w i d e g + θ 6 G w e s p + θ 7 G w e d s p + θ 8 T i m e c o v + θ 9 N o d e c o v . l n G D P + θ n 1 E d e g e c o v . c o o p + θ n 2 E d g e c o v . c o n f + θ n 3 E d g e c o v . d i s t + θ n 4 E d g e c o v . l a n g + θ n 5 E d g e c o v . c o l o )
where Y t and Y t 1 denote the rare earth trade dependency network in periods t and t 1 , respectively; θ represents the unknown parameters of the model; 1 c ( 0,1 ) is the normalization constant; and the subscripts s , r , and n for θ correspond to the sender effect, receiver effect, and network covariates between economies. In this study, we employ Y t 1 (the first-order lagged variable of Y t ) to examine time lag effects and address potential endogeneity issues. By incorporating the lagged term, we are able to capture the delayed effects of variable influences while mitigating simultaneity bias, thereby ensuring the robustness of causal inference in our empirical analysis.
We implemented the TERGM via the btergm package in R (v4.4.2), with parallel computation through 4 CPU cores. The model specification includes the following:
  • Memory term: memory (type = “stability”) to capture network persistence.
  • Temporal dependence: handled via autoregressive network structures ( t 1 implicitly included through the memory term).
  • Goodness-of-fit: by generating 100 simulated networks from the fitted TERGM using the btergm gof function and comparing observed versus simulated degree distributions, geodesic distances, triad census patterns, and so on.
(1)
Pure Structure Effects
Network patterns originate from the intrinsic formation mechanisms of the network system and are thus termed endogenous structural effects. These effects reflect the self-organizing property of the network itself, which is not solely determined by the attributes of individual actors but is influenced by other relational dynamics within the network. This self-organization arises from degree distribution effects; for instance, countries with higher node degrees in a trade network often attract more partners. The sign of the coefficient indicates whether the variable increases or decreases the likelihood of tie formation in the network.
This study selects Edge, Mutual, Gwesp, Gwdsp, Gwideg, Gwodeg, Delrecip, Stability, and Timecov as the pure structure effect variables for the TERGM.
(2)
Actor–relationship attribute effects
The actor–relationship attribute effects can be understood as the influence of an actor’s economic level, cultural background, resource endowment, and other characteristics on the formation and maintenance of network relationships. In network relationships, nodes with certain attributes tend to initiate more relationships, whereas nodes with other attributes tend to receive more relationships, which are referred to as sender effects and receiver effects, respectively. In network structures, the Matthew effect manifests as the concentration of resources or relationships, often leading to the formation of a rich-club phenomenon, where core nodes are densely interconnected, whereas peripheral nodes struggle to enter the core network. The sender effect and receiver effect are often manifestations of the Matthew effect in complex networks.
This study examines the influence of actor–relationship effects on trade dependency networks by incorporating node countries’ cooperation attributes, conflict attributes, and economic development levels.
(3)
Network covariate effects
Additional external factors may also influence relationship formation, as external networks can be used to examine how internodal relationships within a network are constructed upon other relational frameworks. When the estimated parameter has a positive value, it indicates that under the precondition of other established relationships, the connections among nodes within the network and those expressed by external networks exhibit co-occurrence or mutual reinforcement, thereby substantiating that external network relationships serve a facilitative function in shaping intra-network connections.
This study selects geopolitical relationship networks, geographical distance networks, common language networks, and colonial relationship networks as network covariate effects.
The relevant variable descriptions are provided in Table 2.

5. Network Analysis

5.1. Geopolitical Relationship Networks

5.1.1. Network Characteristics

This study conducts a statistical analysis of network metrics of global cooperation and conflict networks from 2001 to 2023, revealing significant structural differences and dynamic evolutionary trends between these two types of networks. Given the extensive dataset, this research focuses on four key temporal cross-sections (2001, 2008, 2015, and 2023) for detailed examination, with the 7–8-year intervals being sufficiently long to capture structural transformations in rare earth trade networks while mitigating interference from short-term price fluctuations. This methodological approach enables the robust observation of fundamental network changes while filtering out transient noise, allowing for clearer identification of geopolitical influences on the long-term development patterns of the rare earth trade system. The selected time points strategically correspond to major geopolitical and economic shifts, including China’s WTO accession, the global financial crisis, rare earth export quota disputes, and recent supply chain restructurings, thus providing representative snapshots of the evolving network dynamics.
Compared with conflict networks, cooperative networks present significantly greater node counts, edge numbers, and network density, demonstrating that cooperative relationships possess substantially broader scopes and greater complexity than conflictual relationships. The shorter average path lengths and smaller network diameters observed in cooperative networks indicate tighter connectivity among nodes and more efficient information transmission. In contrast, conflict networks display longer average path lengths and larger diameters, reflecting the sparser and more dispersed nature of adversarial relationships. The mutuality in cooperative networks markedly exceeds that of conflict networks, revealing that cooperative ties demonstrate stronger bidirectional and symmetric characteristics, whereas conflict relationships predominantly manifest as unidirectional interactions.
Collectively, these findings establish that cooperative networks outperform conflict networks across multiple structural dimensions, including scale, density, connection efficiency, and reciprocity, with their more stable growth trajectory further evidencing the deepening and expansion of collaborative relationships within the context of globalization (Table 3).

5.1.2. Geographical Distribution of Geopolitical Relationship Networks

As shown in Figure 3 and Figure 4, both cooperation and conflict relationships among nations have increased, with cooperation relationships growing more significantly than conflict relationships [49,50]. In cooperation networks, the United States, China, the United Kingdom, France, and Russia exhibit strong cooperation intensity and occupy prominent positions. In conflict networks, the United States, the United Kingdom, France, and the Russian Federation demonstrate high intensity and ranking. The densifying changes in both cooperation and conflict networks from 2000 to 2023 reveal that global geopolitics displays complex characteristics of intertwined cooperation and conflict. Most nations simultaneously seek to establish cooperative relationships for mutual benefit while pursuing their own interests without generating conflicts with others, making the coexistence of cooperation and conflict a norm in international political relations [51,52].

5.1.3. Evolutionary Analysis of Network Centrality Metrics

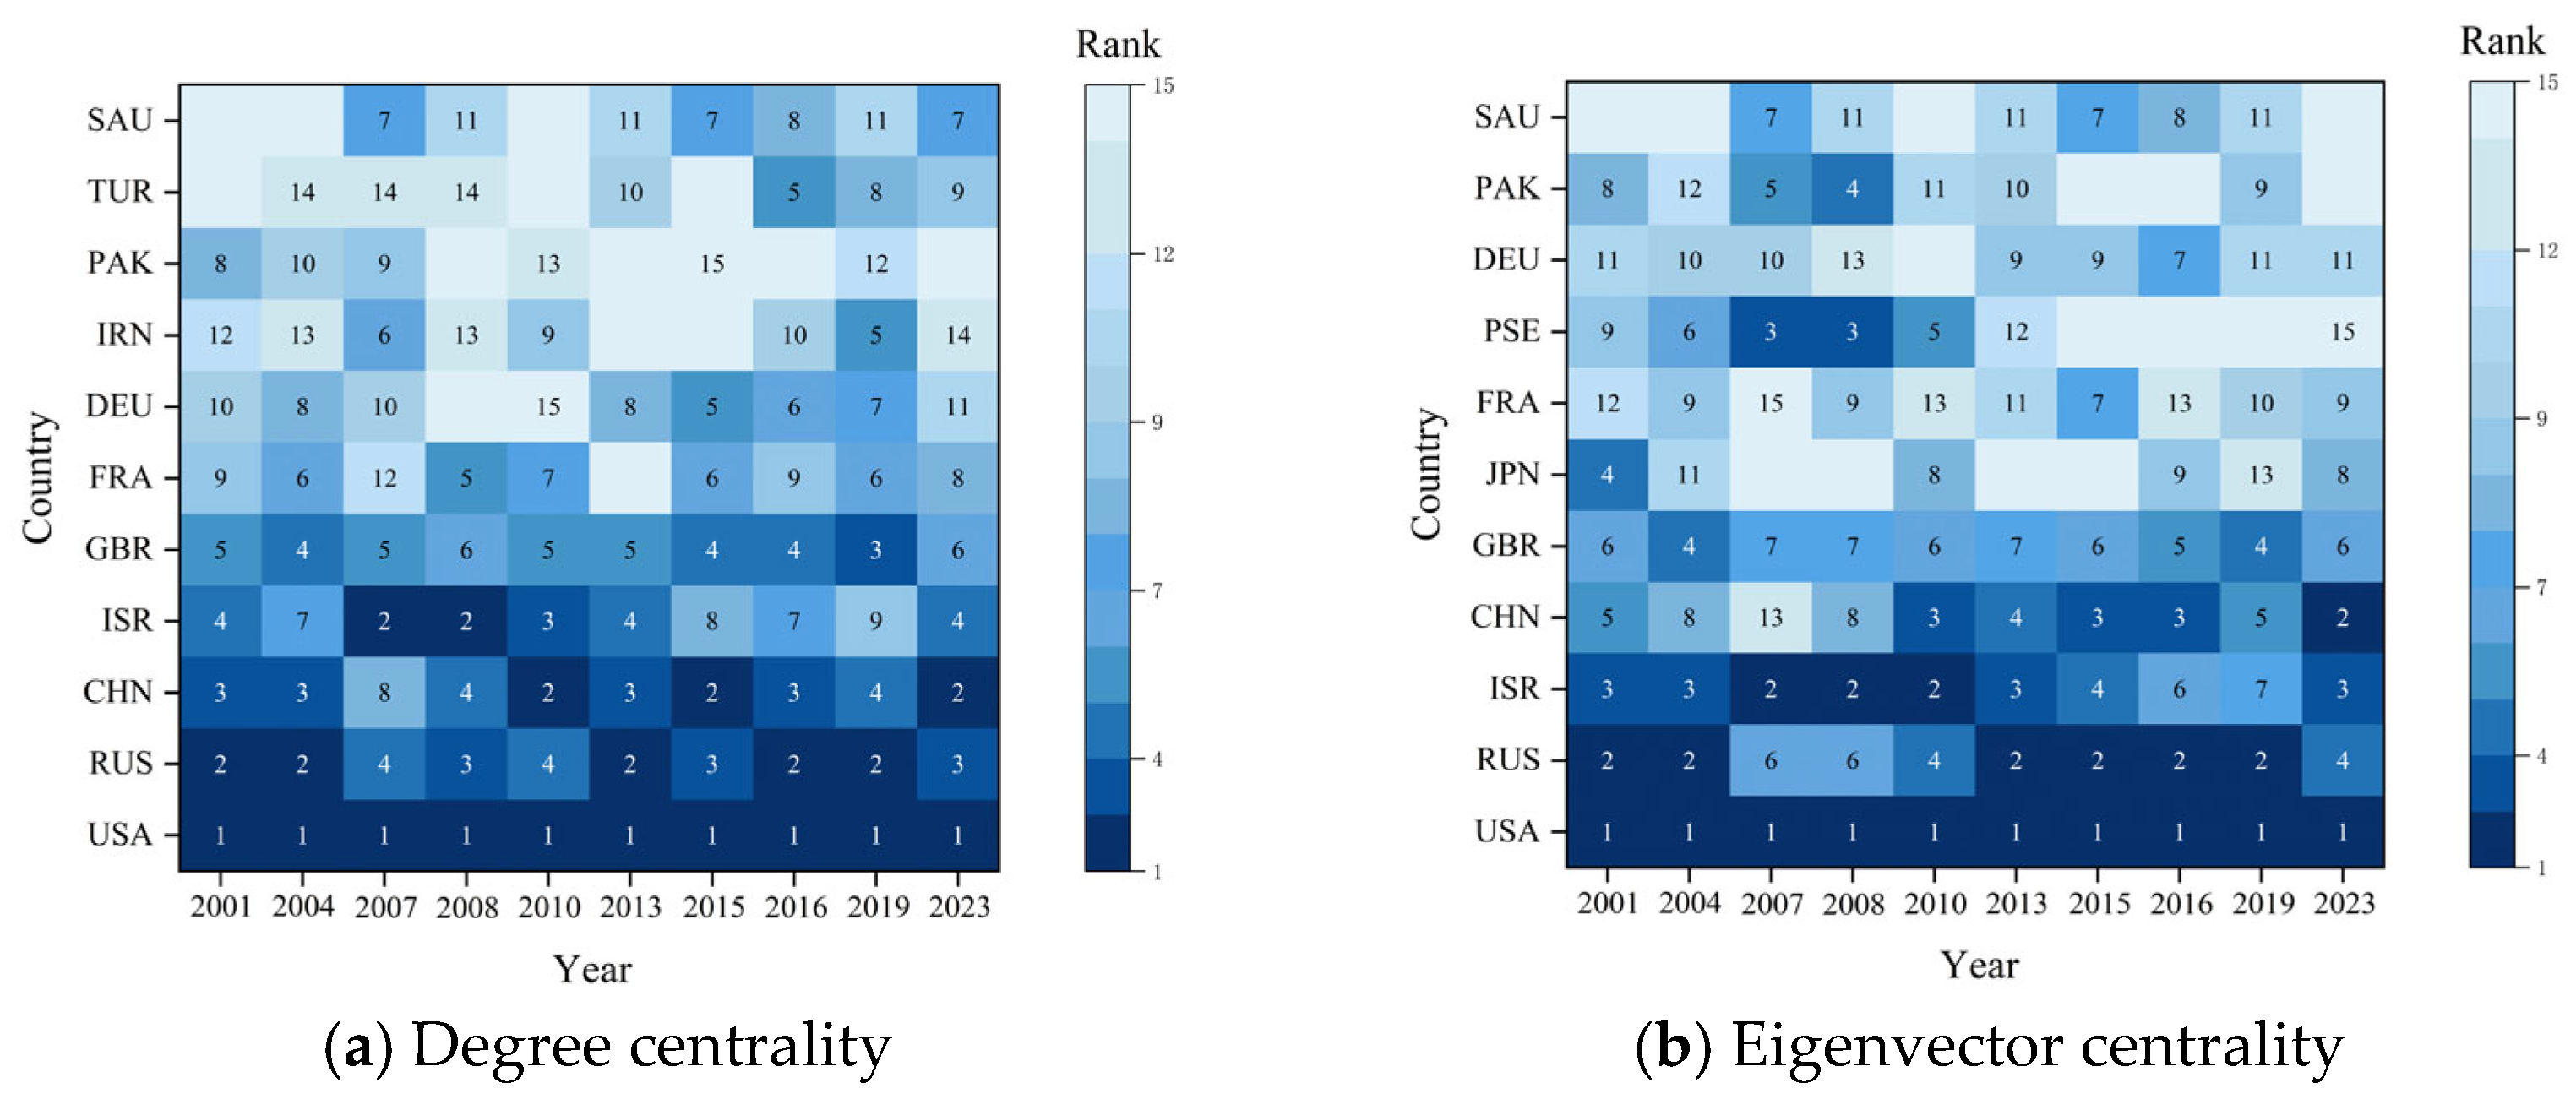
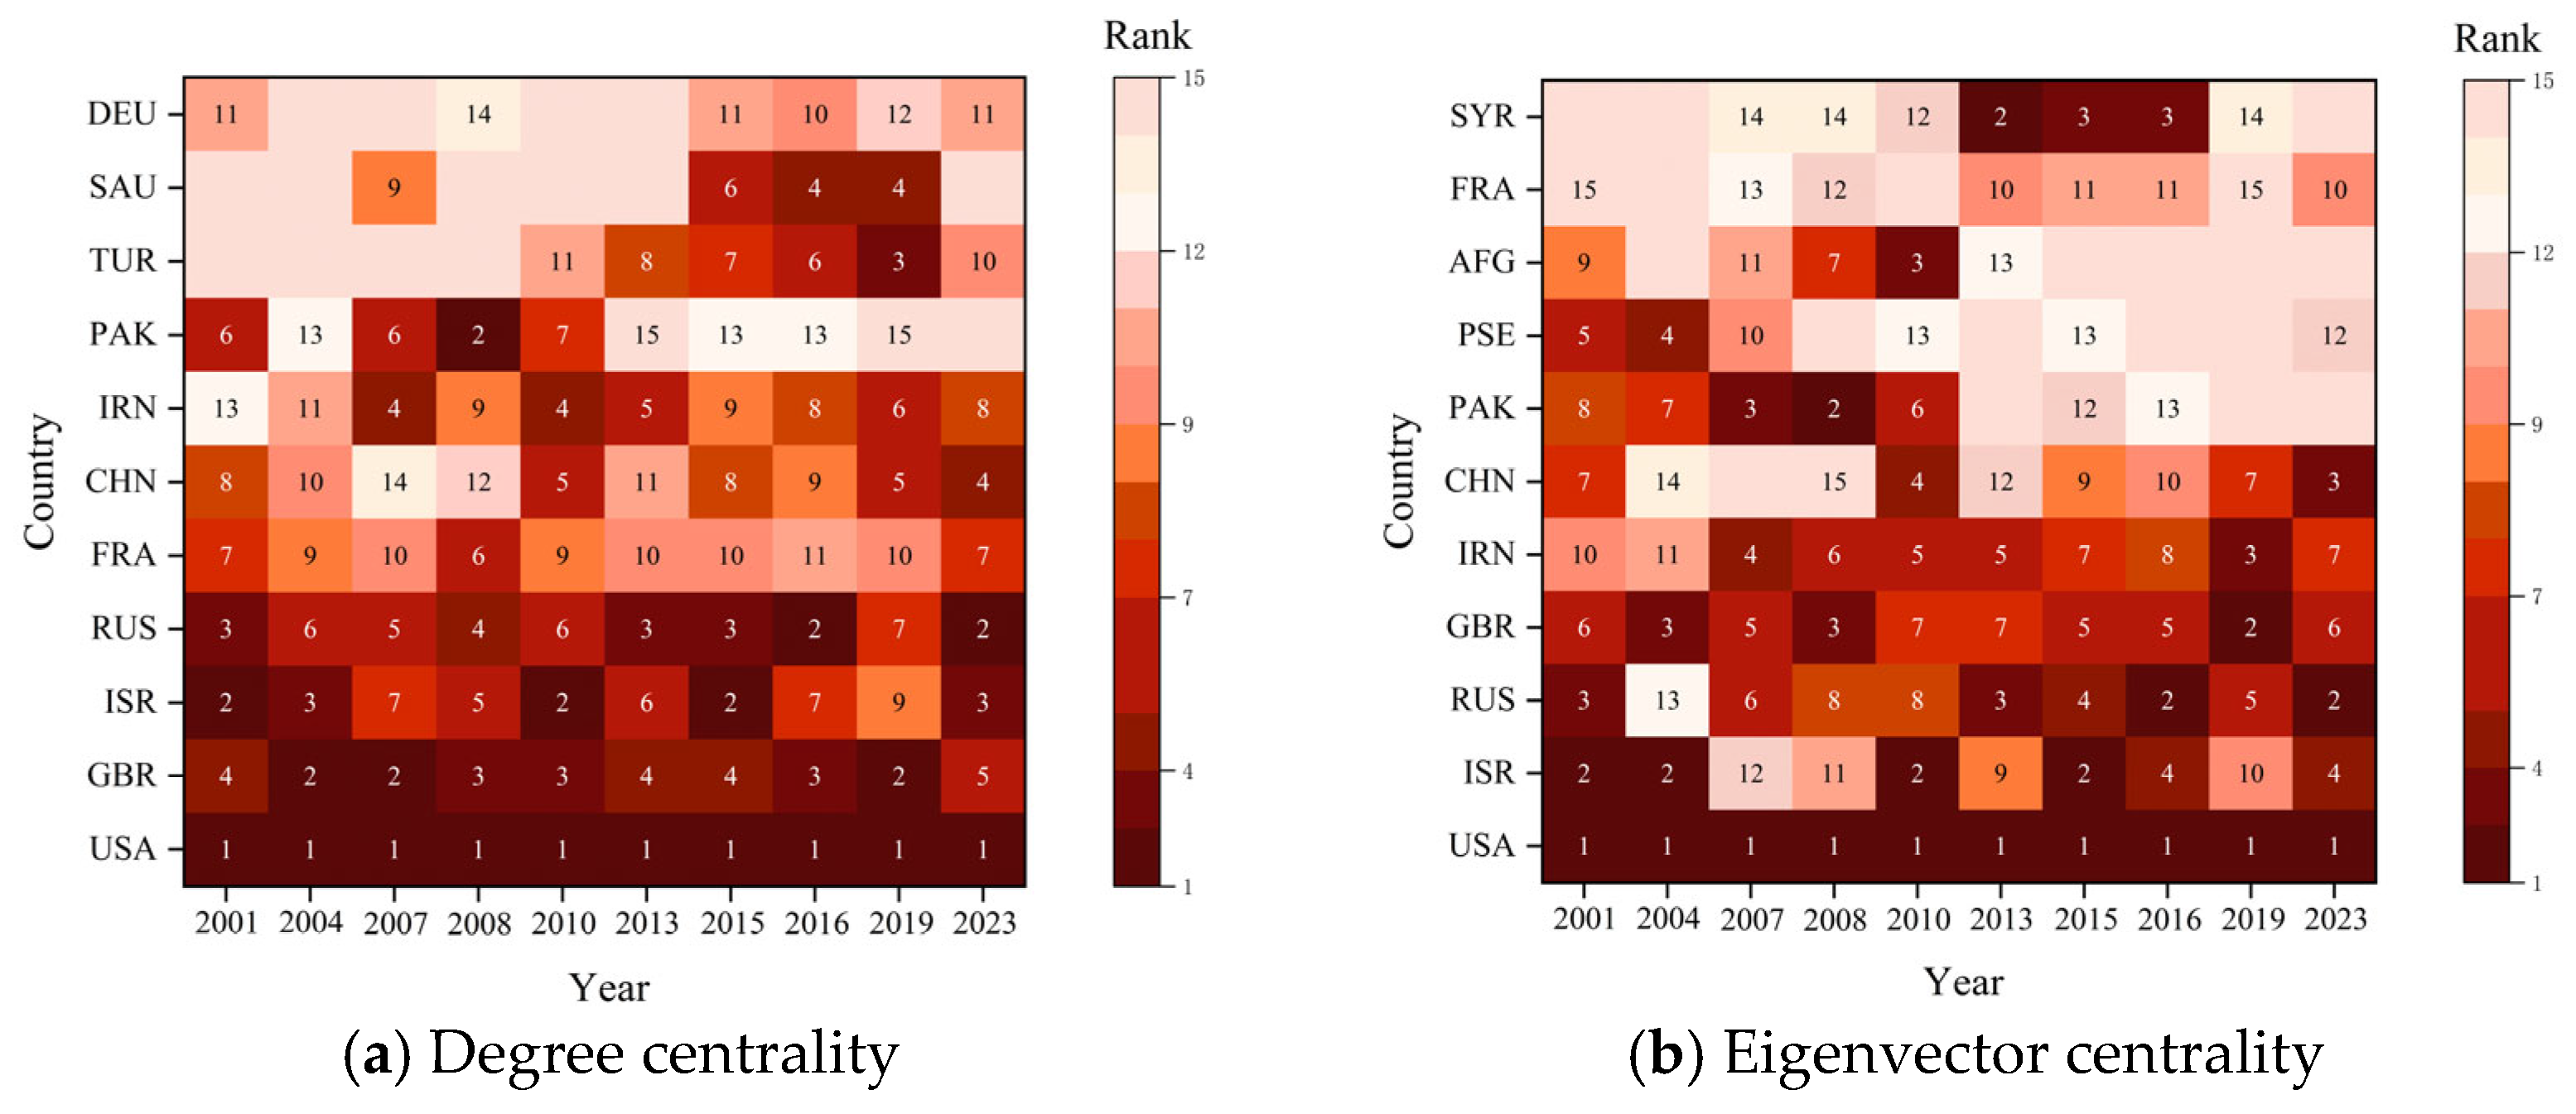
Figure 5 and Figure 6 present the analyses of degree centrality and eigenvector centrality for countries within the cooperation and conflict networks, respectively. For enhanced clarity in network interpretation, we visualize the top 15 nations ranked by each centrality measure, with numerical annotations explicitly denoting their ordinal centrality rankings. Blanks indicate the absence of a country in the top 15 rankings for that year.
(1)
Cooperation network
From the perspective of degree centrality in the global cooperation network, the United States consistently maintains its top position, demonstrating its role as the central hub of the network with extensive and direct connections to numerous key node countries. China’s ascending ranking reflects its significantly enhanced connectivity and deepening engagement within the network. While countries such as the United Kingdom and France exhibit stable rankings, others such as Turkey and Germany display fluctuating trends, illustrating the dynamic evolution of direct cooperative relationships among nations. This pattern of centrality distribution reveals the structural characteristics of international collaboration networks and the shifting influence of major actors in global affairs.
From the eigenvector centrality perspective, the United States’ consistently high ranking indicates its dual position as both a core network node and a highly interconnected hub with other pivotal actors, demonstrating substantial indirect influence. China’s rising eigenvector centrality suggests its evolving role as a strategic nexus connecting key nations within the global network. The observed fluctuations in Turkey’s and Pakistan’s centrality metrics reflect the dynamic nature of their bridging functions in response to shifting patterns of international cooperation. These evolving centrality patterns reveal how nations simultaneously operate as direct participants and indirect influencers within the global cooperation network, highlighting the complex interplay between positional advantage and relational power in international relations.
(2)
Conflict network
In terms of degree centrality, the United States consistently occupies the top position, demonstrating its pivotal role as a central hub in the global conflict network. Nations such as the United Kingdom, Israel, and the Russian Federation maintain relatively high rankings, reflecting their stable positions as key nodes in regional conflicts. The rankings of China, Iran, and Germany exhibit notable volatility, with China’s sustained upward trajectory being particularly prominent. This trend indicates that China’s influence within the international system is undergoing substantial enhancement, gradually evolving into one of the core actors in the global geopolitical conflict network [18].
From the perspective of eigenvector centrality, the United States and the United Kingdom maintain their entrenched positions, whereas significant fluctuations among Middle Eastern nations, particularly Israel, Iran, and Syria, reflect the structural complexity of regional conflict dynamics. The steady ascent of Russia and China in this metric not only demonstrates their growing connectivity with primary conflict actors but also marks their successful integration into the core stratum of the global conflict network.
These patterns reveal that states with high conflict centrality constitute the structural pillars of the global conflict system, with eigenvector centrality dynamics precisely delineating the evolutionary trajectories of national influence within conflict networks. The dual metrics jointly capture both the direct engagement level of states in international conflicts and their indirect influence propagated through complex network relationships.

5.2. Rare Earth Industry Chain Trade Network

5.2.1. Community Structure Analysis

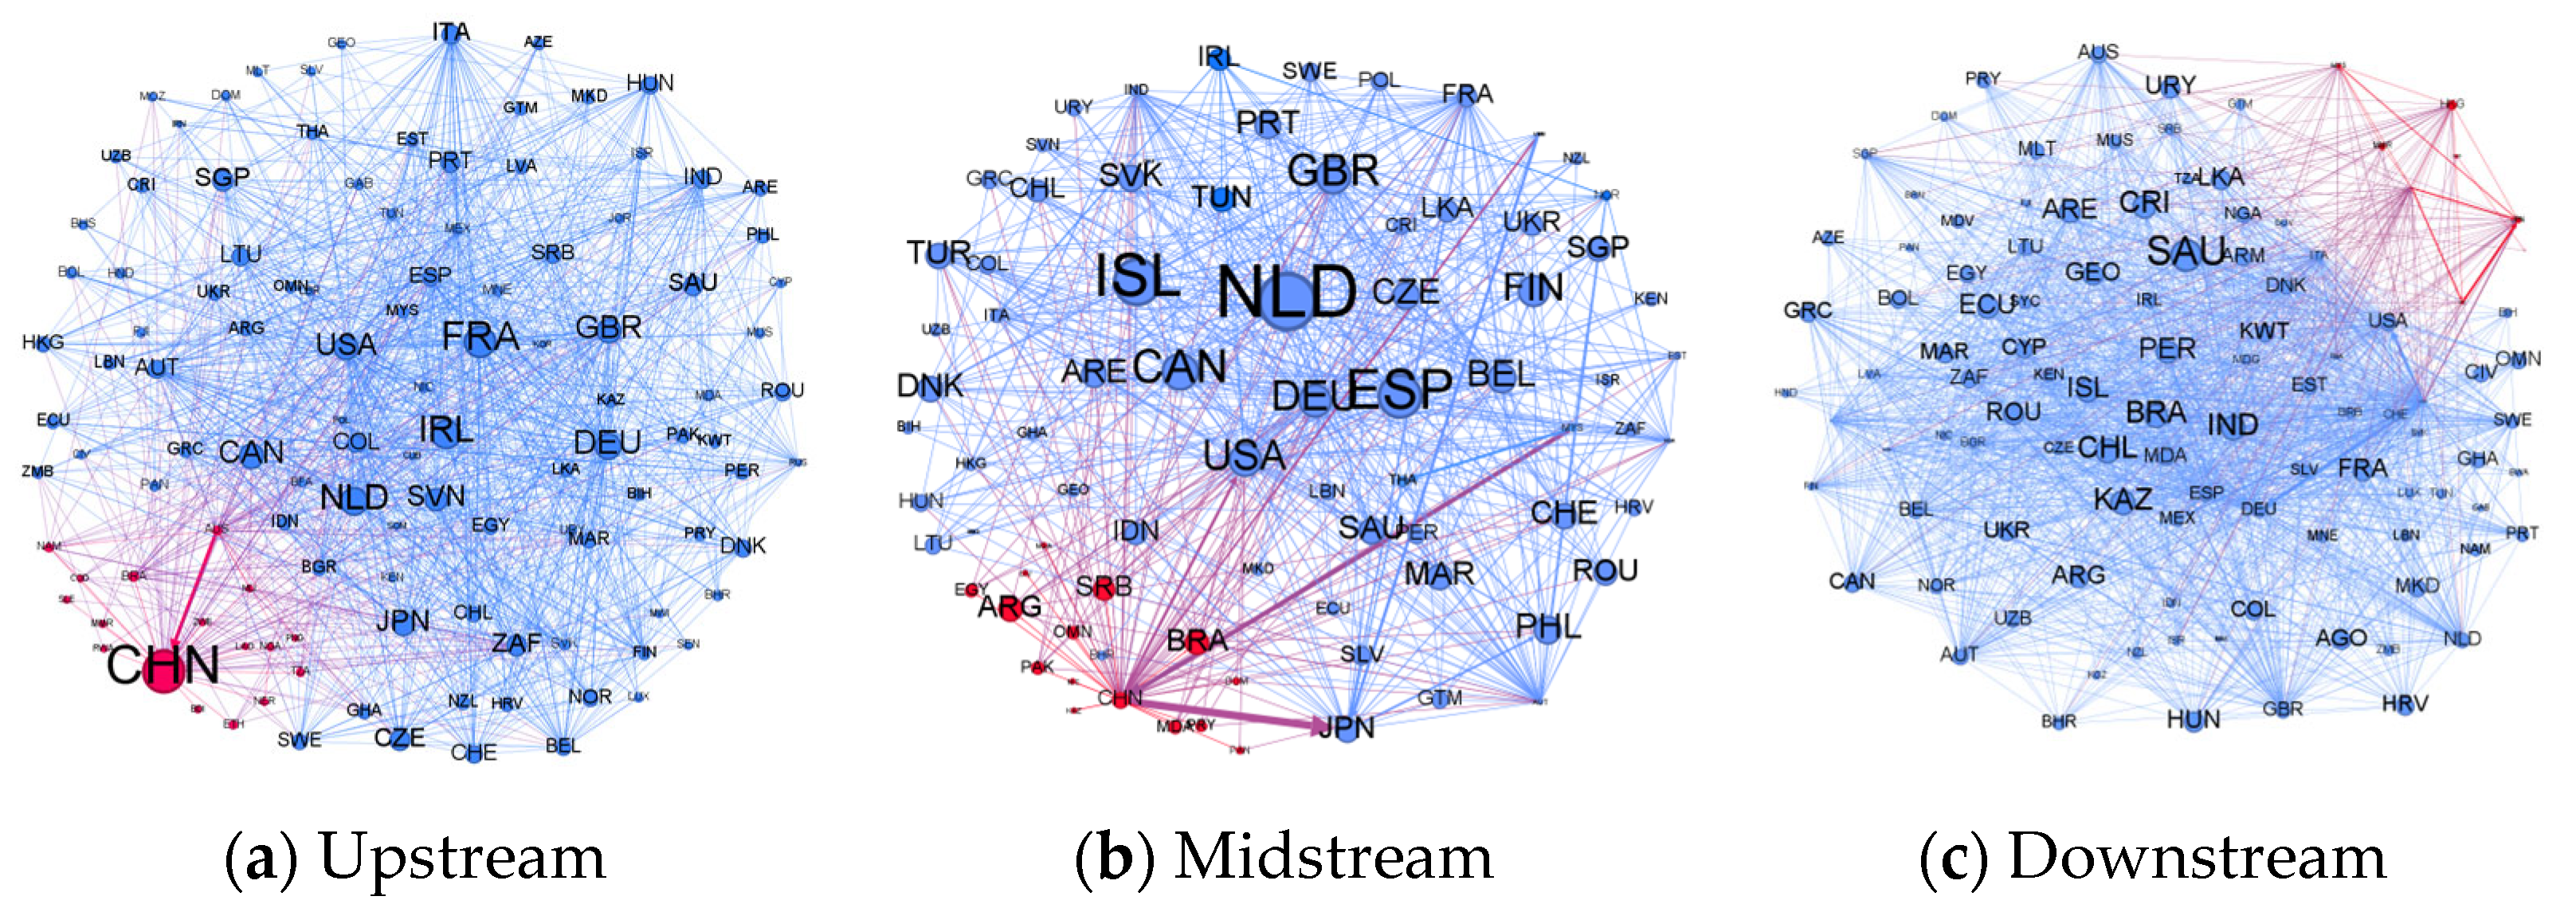
Figure 7 and Figure 8 present the upstream, midstream, and downstream rare earth industry chain networks for 2001 and 2023, respectively. The upstream industrial chain has undergone structural evolution, with the number of upstream communities transitioning from a quadripartite structure in 2001 to a dual structure in 2023, revealing strong reconstruction characteristics in trade relationships. This evolution simultaneously signifies increased concentration and regionalization in the rare earth trade industrial chain, further reflecting more intensive and complex international cooperation within the rare earth trade ecosystem.
The midstream industrial chain exhibits bipolar reconstruction, with its community structure evolving from a tripartite system in 2001 to a stable dual-core structure by 2023. An analysis of national composition reveals that Spain, the Netherlands, and Germany have consistently maintained core positions in the primary community of the midstream industrial chain, whereas the United States has secured a leading position within this primary community. China, Brazil, and Argentina have established dominant positions in the secondary community.
The downstream industrial chain tends to consolidate into a core–periphery topological structure. In 2001, the primary community included the United States, Japan, Mexico, Israel, and other countries; the secondary community included China, South Korea, Italy, and other nations; the tertiary community included France, Germany, the United Kingdom, and other states; and the quaternary community was primarily composed of Poland, Sri Lanka, and others. By 2023, the primary community included Saudi Arabia, Canada, the United States, and other countries, with Japan occupying a dominant position in the secondary community. The evolution from four communities to two more tightly interconnected communities in the downstream industrial chain highlights the characteristics of global integration, reflecting increased density in the rare earth industrial chain network [41]. Xu et al. (2024) demonstrated that the evolution of the spatial correlation structure of the rare earth trade reveals distinct phased characteristics in the trade network, revealing a developmental trajectory from a multicore-oriented pattern to a dual-core dual-circle configuration, which aligns with the research findings presented in this paper [41].

5.2.2. Network Characteristic Analysis

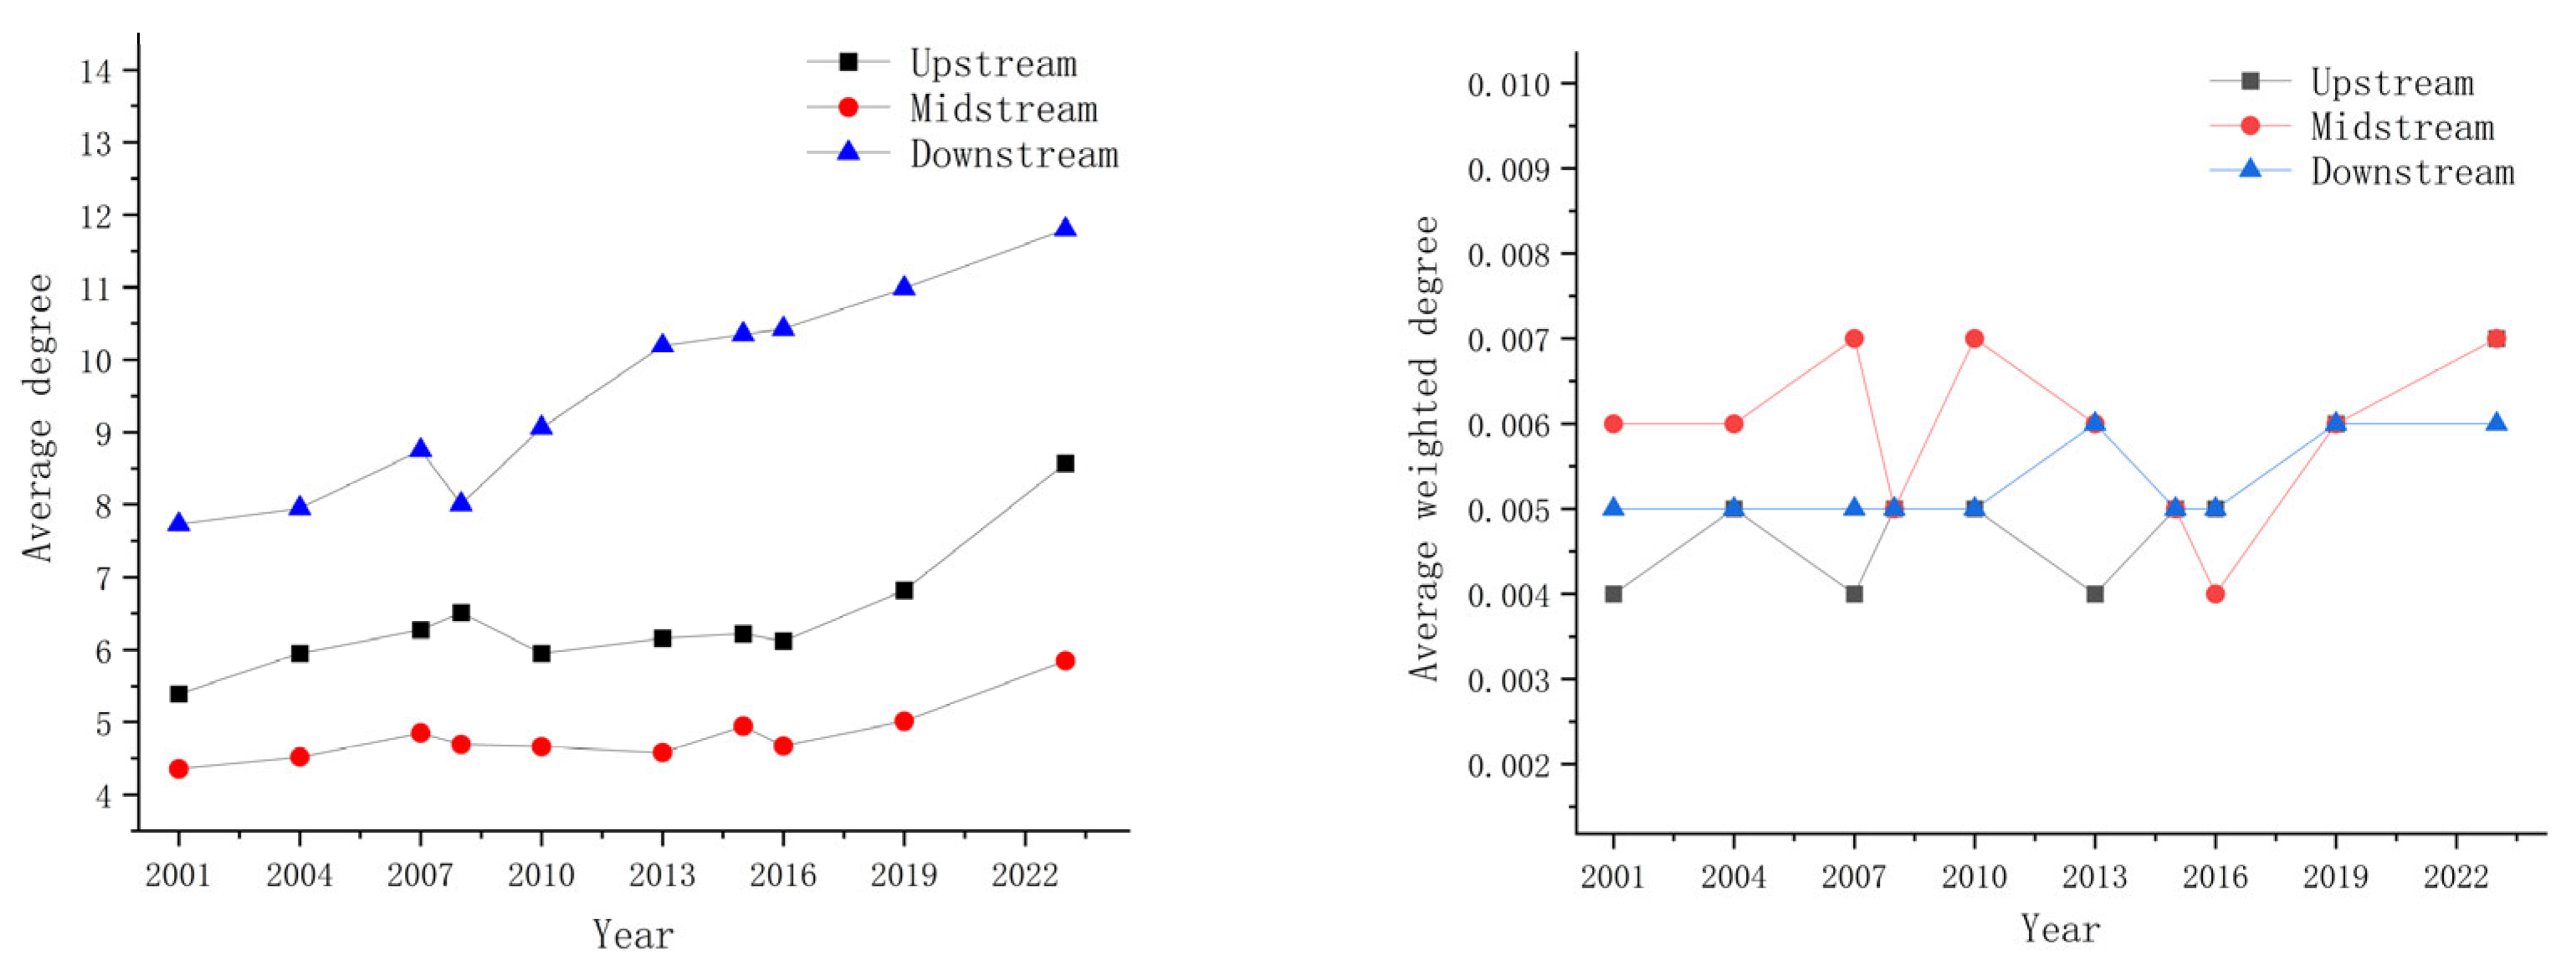
Figure 9 illustrates the trends in the average degree and average weighted degree of trade dependency across the upstream, midstream, and downstream rare earth industry chains. The average degree across the entire rare earth industrial chain has an overall upward trend, indicating that over time, an increasing number of countries are engaging in rare earth trade, with nations generally establishing more trade partnerships and developing closer cooperative relationships.
From the perspective of average weighted degree analysis of trade dependency levels, the midstream industrial chain exhibits relatively strong fluctuations but maintains large overall values with an upward trajectory. The downstream sector shows a pattern of initial stability followed by growth, whereas the upstream sector displays steady oscillations, reflecting the complex dynamic evolution of trade dependency levels within the rare earth industrial chain. Research by Zhuang Delin has indicated that from an industrial chain perspective, the degree of networking in rare earth trade has consistently remained at a relatively low level while demonstrating a clear upward trend, which corresponds with the findings of the present study [41].

5.2.3. Evolutionary Dynamics Analysis

Core countries occupy a central position in the network and typically have a greater number of trade partners. The larger the number of trade partners, the more extensive the country’s connections within the industry chain, enabling it to effectively avoid overreliance on a single country through diversified arrangements. Therefore, this paper uses the number of trade partners to reflect the breadth of the rare earth trade network and the scope of the influence of core international trade while employing trade intensity to measure the depth of the rare earth trade network.
Table 4 presents the top three countries in terms of trading partner numbers and trade intensity across the upstream, midstream, and downstream rare earth industrial chains for 2001, 2008, 2015, and 2023. In the upstream sector, the declining ranking of the United States reflects reduced partnerships and weakened dominance in primary production. China’s ascent to the top position demonstrates its expanding rare earth trade network and remarkable developmental leap. While European nations such as France and the UK initially held strong positions, only Germany remained in the top three by 2023, indicating diminished European influence. The midstream sector shows Japan’s consistent top-three presence, underscoring its technological advantages, whereas China’s 2023 top ranking establishes it as the most extensively connected trader [53]. The transient appearances of Southeast Asian countries (Thailand and Malaysia) highlight the greater environmental complexity in the midstream region than in the other segments. Downstream, the sustained prominence of the United States and China, coupled with Germany’s 2023 leadership position, reveals advanced manufacturing capabilities in end-product applications.
From the perspective of trade intensity rankings, Germany has consistently maintained its position within the top three upstream sectors, reflecting stable demand, whereas Japan and Spain exhibit more fluctuating rankings. In the midstream segment, China has remained firmly within the top three countries since 2008, whereas European nations such as France and Austria demonstrate greater volatility in their rankings. The downstream sector displays the most stable ranking pattern, with Germany, the United States, and China emerging as core players, forming a multipolar trade structure. Across the entire rare earth industrial chain, China maintains a dominant position in the rankings, underscoring its pivotal role in global rare earth trade dynamics.
China possesses abundant rare earth resources and advanced technologies, potentially enabling it to occupy a dominant position in the rare earth trade industry. In contrast, the highest rankings in downstream sectors are held primarily by developed countries such as Japan and Germany, as downstream products require more sophisticated technologies. With their higher industrialization levels and technological advancements, these developed nations can secure advantageous positions. Moreover, the United States maintains a strong influence across the entire industrial chain.
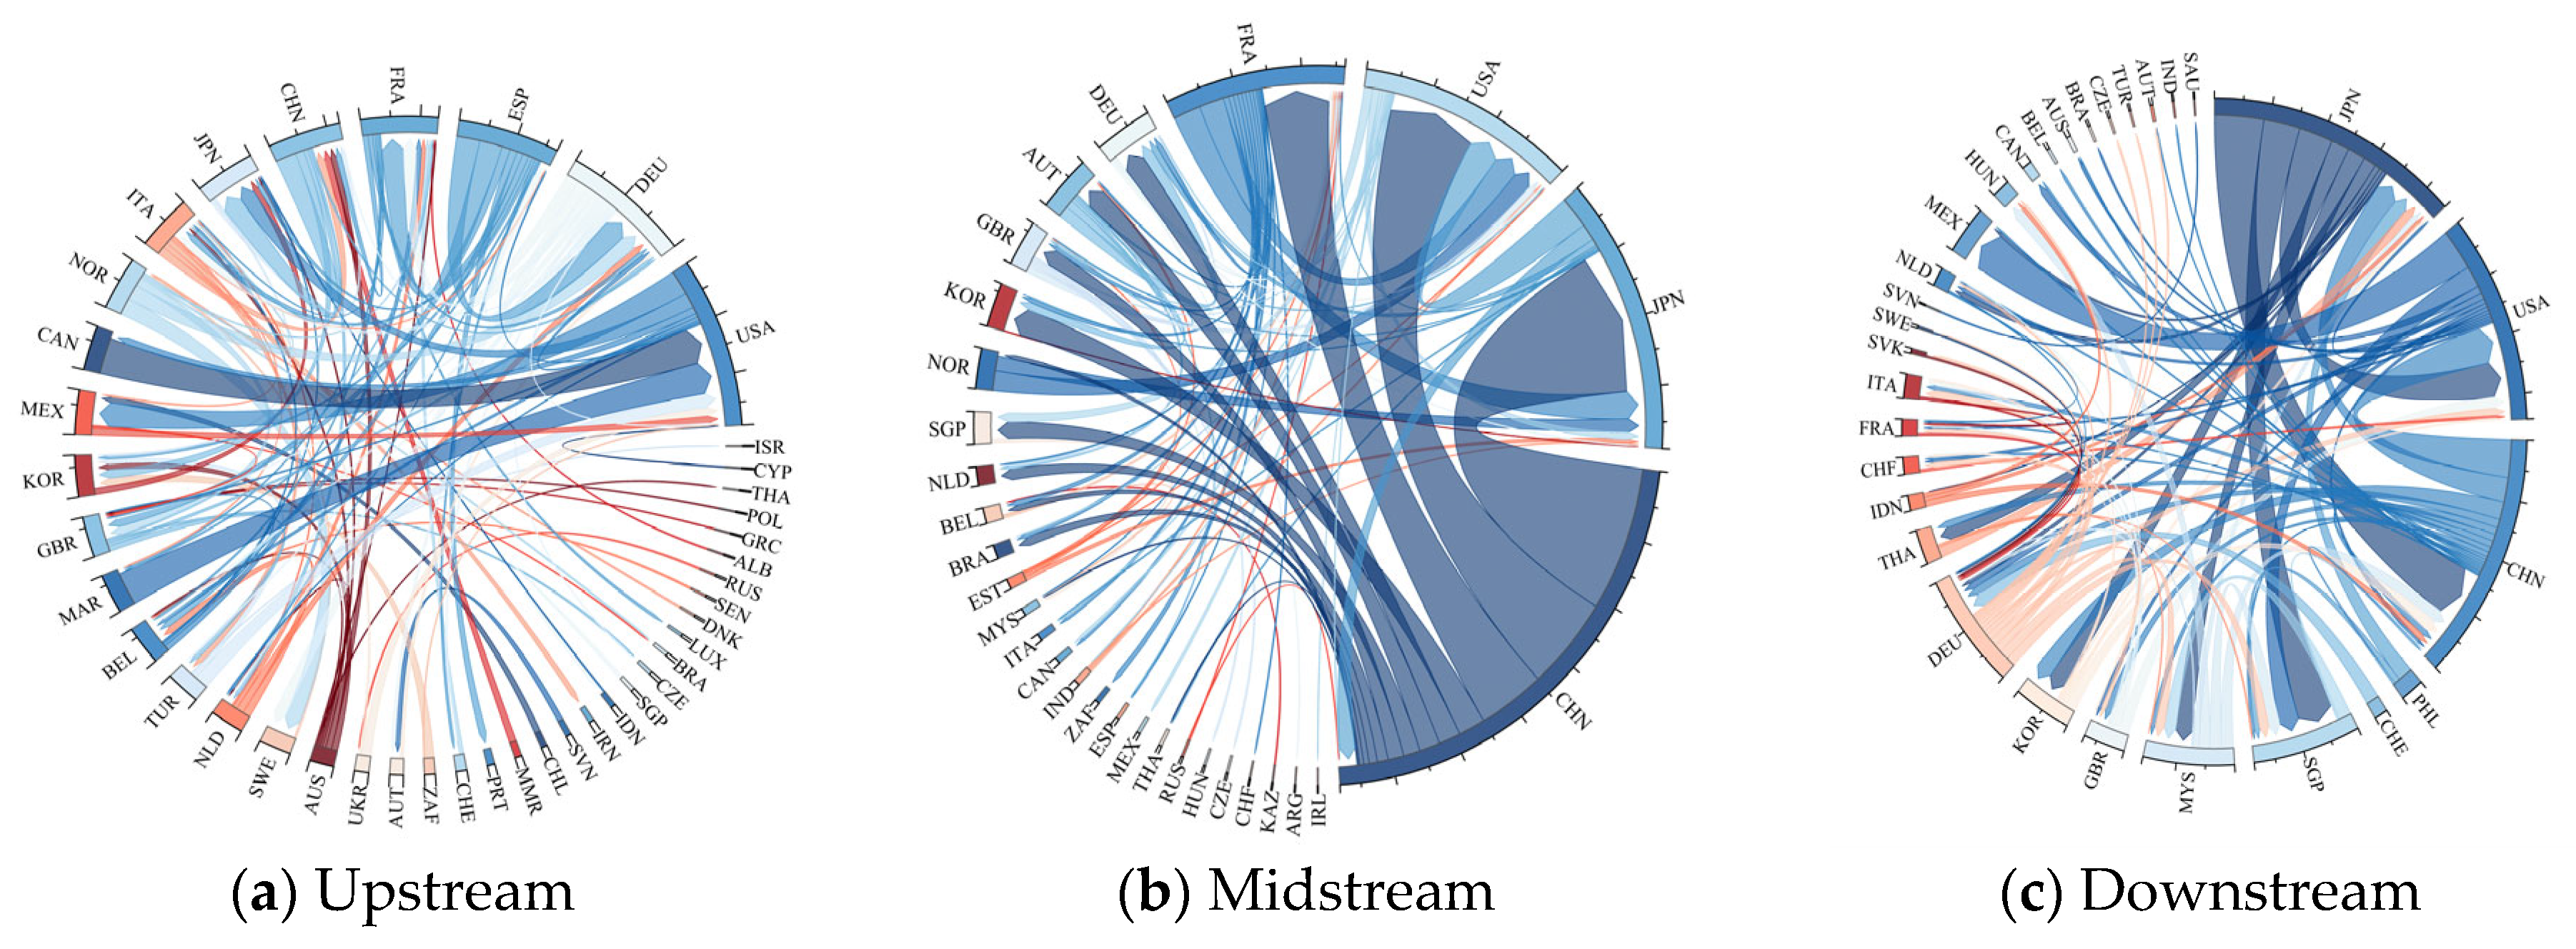
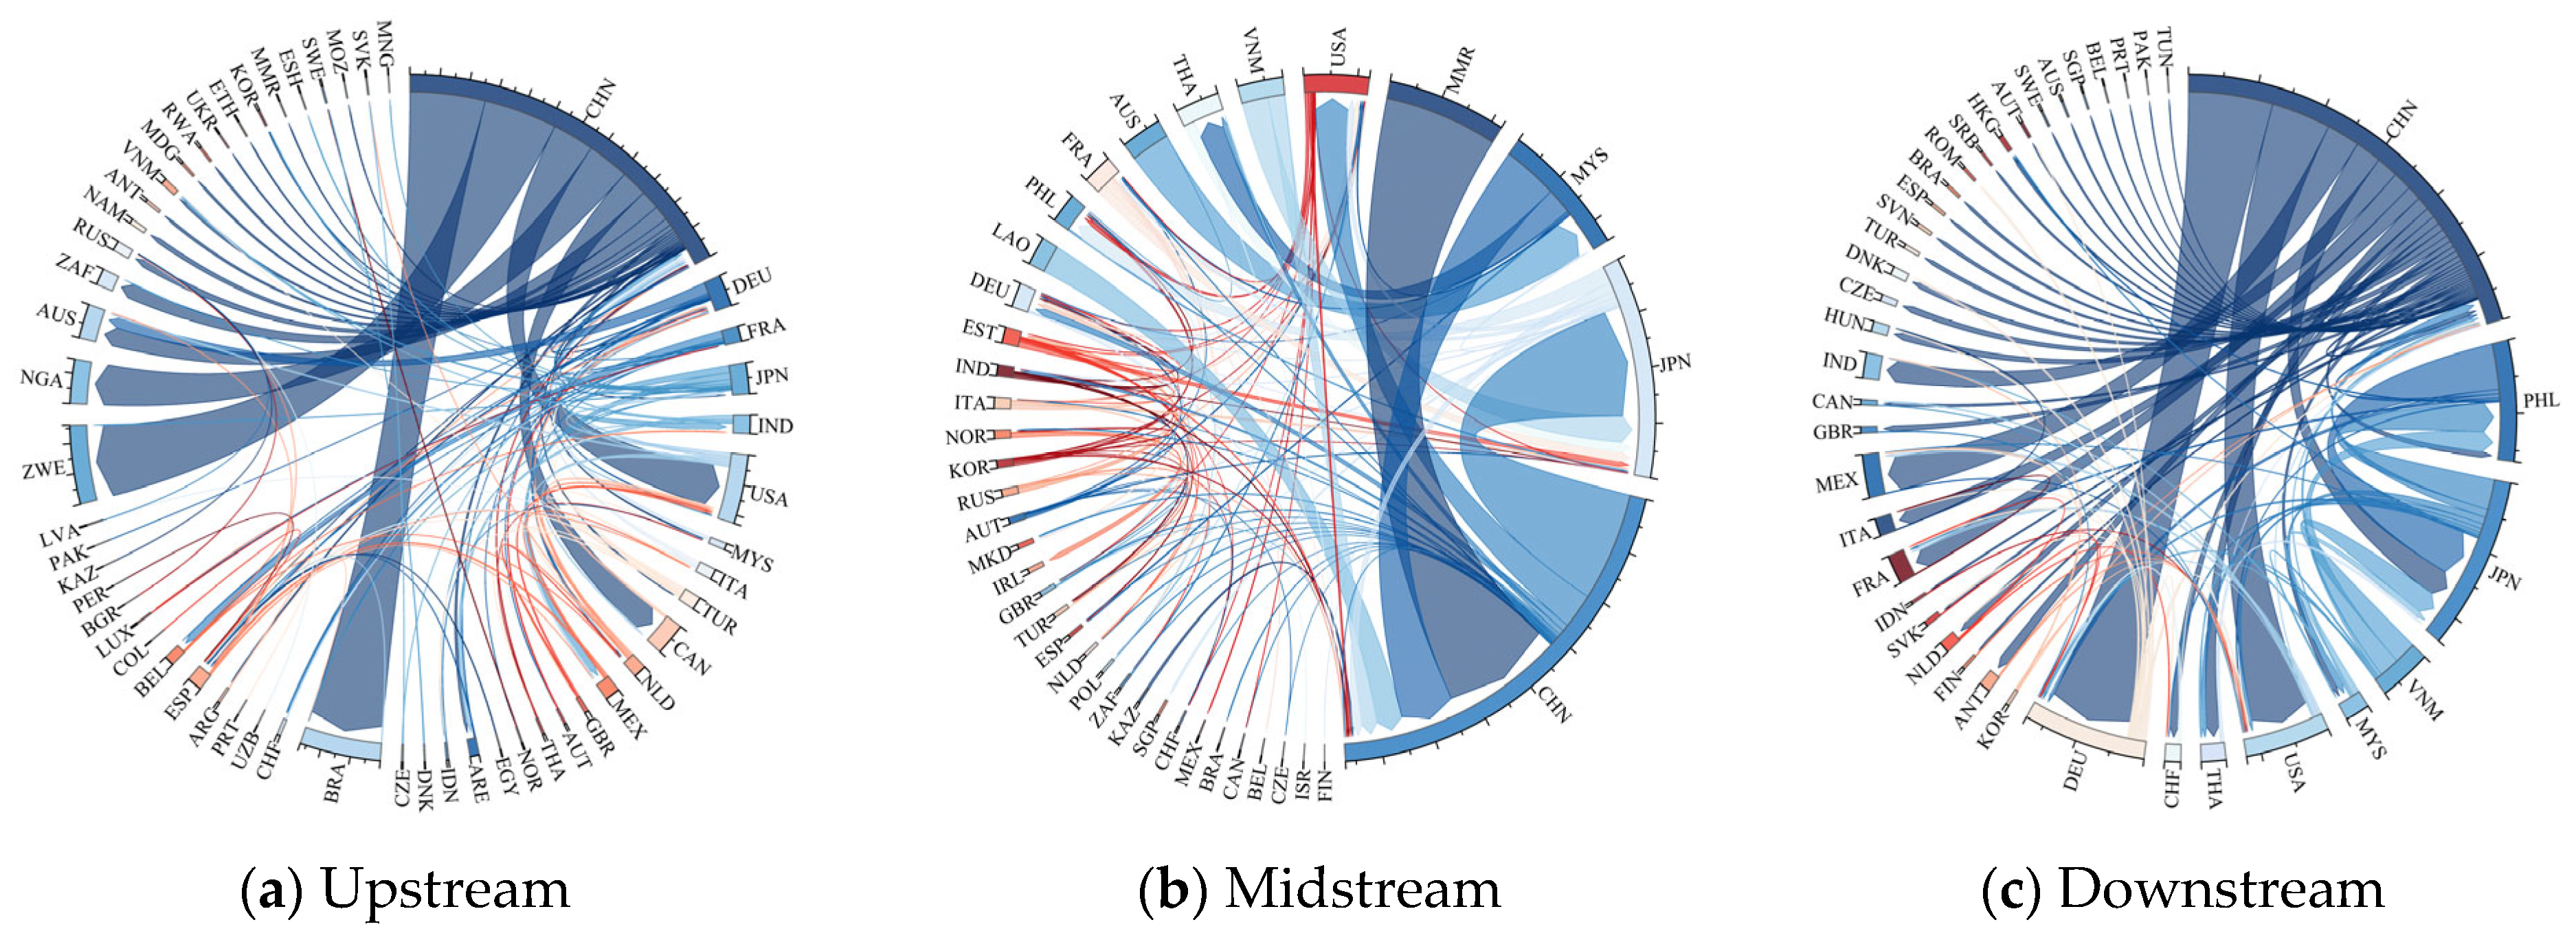
Figure 10 and Figure 11 employ chord diagrams to visualize international trade flows across the upstream, midstream, and downstream rare earth supply chains. A chord diagram is used to represent trade relationships and transaction volumes (in USD) between different countries. On the basis of the connections shown in the diagram, many countries clearly have direct or indirect trade links, reflecting complex multilateral trade relationships.
From a global perspective, China, the United States, Germany, France, and Japan occupy prominent positions across the upstream, midstream, and downstream sectors of the rare earth trade industry chain, highlighting their dominant roles in the global rare earth trade. Whether as upstream suppliers, midstream processors, or downstream consumers, these countries maintain close trade relationships with numerous other nations. The global rare earth trade has a regional distribution pattern centered on Asia (particularly China) [16], Europe, and North America. These regions are interdependent across various stages of the rare earth industry chain, forming a complex and tightly interconnected trade network.
Figure 12 and Figure 13 present the geographical distributions of rare earth trade across upstream, midstream, and downstream supply chains in 2001 and 2023, respectively. The figures reveal that the core regions of upstream and midstream activities are predominantly concentrated in North America, Europe, and East Asia, whereas downstream activities remain persistently centered in Europe, particularly Northern Europe. Over time, the spatial density of upstream, midstream, and downstream operations in Europe has increased significantly. Research by Xu, J.L., et al. (2024) reveals significant spatial disparities in global rare earth trade patterns, with upstream industrial chain trade dominated by Europe and America, whereas trade in smelting/processing products and manufactured goods is distributed across East Asia, Europe, and North America, which corresponds with the conclusions drawn in this study [39,41,54,55].

6. Empirical Analysis

6.1. The Impact of Geopolitical Relationship Networks on Rare Earth Trade

The influence of the geopolitical relationship network on the rare earth trade network is manifested in two main aspects. First, there is the direct embedding of trade dependency relationships, where cooperative relationships facilitate rare earth trade between countries while conflicting relationships hinder it. Second, there is the network centrality promotion effect, where node countries with higher weighted degrees in the geopolitical relationship network exert a significant influence on the rare earth trade. The empirical results are presented in Table 5.

6.1.1. Pure Structure Effects

The edge effect estimates across the entire industrial chain are significantly negative at the 1% level, indicating that the formation of rare earth trade networks exhibits high selectivity, with the upstream sector demonstrating the fewest spontaneously formed trade relationships, followed by the midstream sector, whereas the downstream sector shows relatively more market-driven spontaneous trade connections due to its flexible dependency on market forces.
The mutual parameter estimates for the full industrial chain are all significantly negative at the 1% level, revealing the asymmetric dependency characteristics inherent in rare earth trade networks [23]. After incorporating time-dependent variables, the mutual coefficients across all three sectors increase substantially, suggesting temporal growth in reciprocal relationships within the trade networks, which is particularly pronounced in downstream trade networks.
Gwesp parameter estimates in the industrial chain show significant positivity at the 1% level, demonstrating that indirect trade dependencies (A → B → C) significantly promote direct trade relationships (A → C) [30,56,57]. The gwdsp parameter estimates are significantly negative at the 1% level throughout the industrial chain, indicating that all three rare earth trade networks favor hierarchical structures (A → B → C) over closed-loop cycles (A → B→ C → A), as nodal countries consciously control trade pathways to mitigate industrial chain risk by avoiding excessive loop dependencies [15,23,58]. The significantly negative estimates for Gwodeg and Gwideg suggest that nodal countries diversify trade risk by establishing dependencies with multiple partners while strictly limiting outgoing dependency quantities to prevent the erosion of their influence by dependent nations.
The delrecip coefficients across the industrial chain are significantly negative at the 1% level, confirming that the unidirectional trade dependencies established in earlier periods facilitate the subsequent formation of bidirectional reciprocal trade relationships. The stability parameter estimates are significantly positive at the 1% level throughout the industrial chain, reflecting strong path dependence and relatively stable evolutionary patterns in rare earth trade network structures. Timecov parameter estimates are significantly positive at the 5% level industry-wide, indicating a growing demand for rare earth resources in upstream sectors and deepening downstream trade networks over time, whereas technological advancements in substitute materials reduce global dependence on processed products [58,59]. A study by Li et al. (2023) revealed that structural effects exert significantly heterogeneous impacts on the evolution of rare earth trade networks, which is consistent with the findings of the present research [60].

6.1.2. Actor–Relationship Attribute Effects

The economic development level (lnGDP) of nodal countries has a positive influence on the establishment of dependency relationships, whereby higher levels of economic development increase a nation’s capacity to both receive and initiate trade dependencies [30]. Both cooperative and conflict networks demonstrate sender and receiver effects through their weighted degree measures, with nations exhibiting greater cooperative intensity showing increased probabilities of both rare earth imports and exports, where the marginal effect on export probabilities exceeds that of imports, particularly with downstream trade networks displaying the highest sensitivity to cooperative sender effects. Conversely, nations with elevated conflict intensity experience reduced probabilities of both import and export transactions, with the negative impact on import probabilities being more pronounced than that on exports, revealing that the quality of a country’s geopolitical relationships disproportionately affects its rare earth import dynamics [15].

6.1.3. Network Covariate Effects

The coefficient estimates for cooperative networks (Edges.coop) are all significantly positive at the 1% level, indicating that rare earth industrial chain trade networks universally benefit from the positive influences of cooperative networks [58,61]. Cooperative events between nations, such as signing agreements or joining political alliances, create favorable conditions for rare earth trade that substantially facilitate the establishment of trade dependency relationships. Since downstream industrial chains rely on global markets for processed rare earth products, they demonstrate greater sensitivity to cooperative effects; each unit increase in cooperative network parameters elevates the probability of downstream trade dependencies by approximately 3.9-fold ( e 1.5911 1 ) compared with 3.29-fold ( e 1.4582 1 ) for midstream dependencies and 2.77-fold ( e 1.3294 1 ) for upstream dependencies. Conversely, conflict network coefficients are significantly negative at the 5% level industry-wide, confirming their detrimental impact on rare earth trade networks [59], with midstream networks being the most sensitive; each unit increase in conflict reduces the midstream trade probability by approximately 14.8% ( 1 e 0.1606 ) versus 7.8% ( 1 e 0.0816 ) downstream. Geopolitical cooperation networks and conflict networks have significantly divergent impacts on rare earth trade across different segments of the industrial chain. Zhang et al. (2024) posit that political cooperative relationships facilitate the formation of rare earth trade dependencies throughout the entire industrial chain, whereas conflict networks impede the establishment of such trade relationships, resulting in uneven effects on the upstream, midstream, and downstream sectors. These findings are consistent with the research outcomes presented in this study [31,46].
Temporal analysis shows that conflict primarily suppresses trade in the short term, with diminishing long-term effects. A shared language between trading partners effectively reduces communication costs, trade friction, and barrier resistance, thereby fostering trade relationships, whereas geographical proximity and shared borders lower trade costs and facilitate relationship formation. Although historical colonial ties have significantly positive coefficients, suggesting their foundational role in establishing rare earth trade dependencies [6,62], their influence diminishes with time-dependent effects, as modern trade norms gradually supersede these institutional legacies. Research by Jianwei, L. et al. demonstrated that geographical proximity between node countries facilitates the establishment of trade dependency relationships, whereas cultural and institutional proximity among node nations similarly contributes to the formation of such trade dependencies. These findings align consistently with the empirical results obtained in the present study [55].

6.1.4. Goodness-of-Fit Test

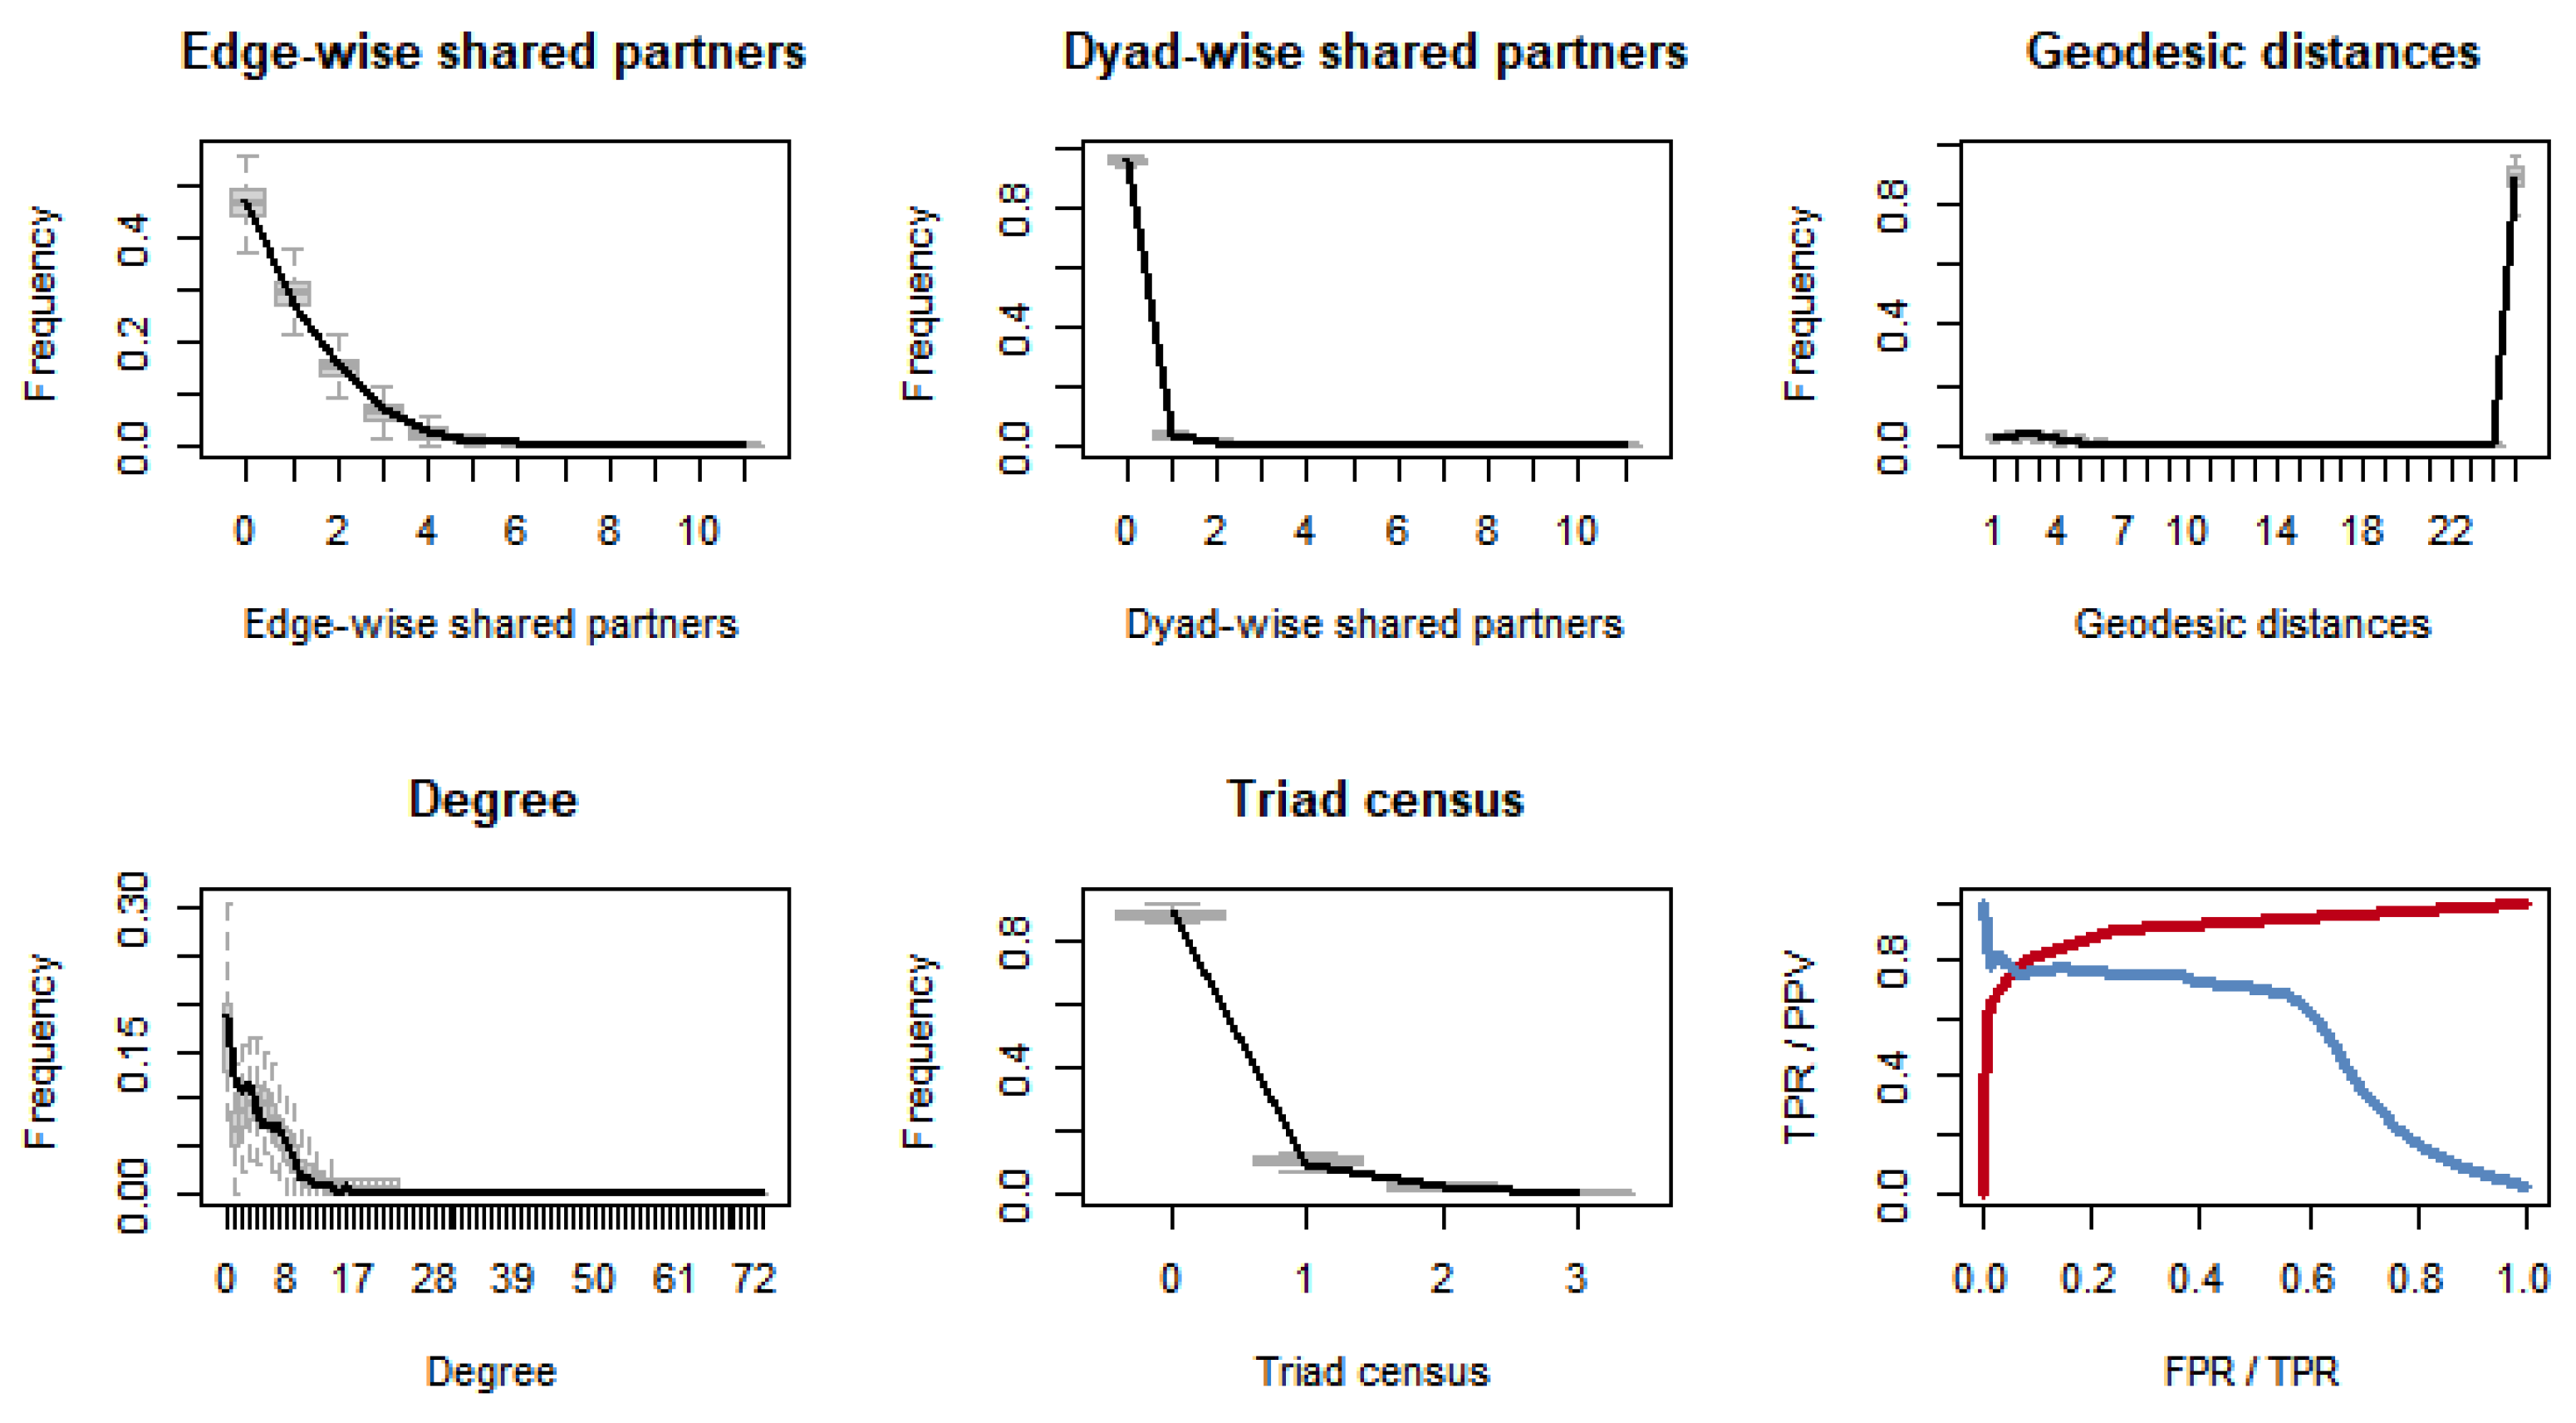
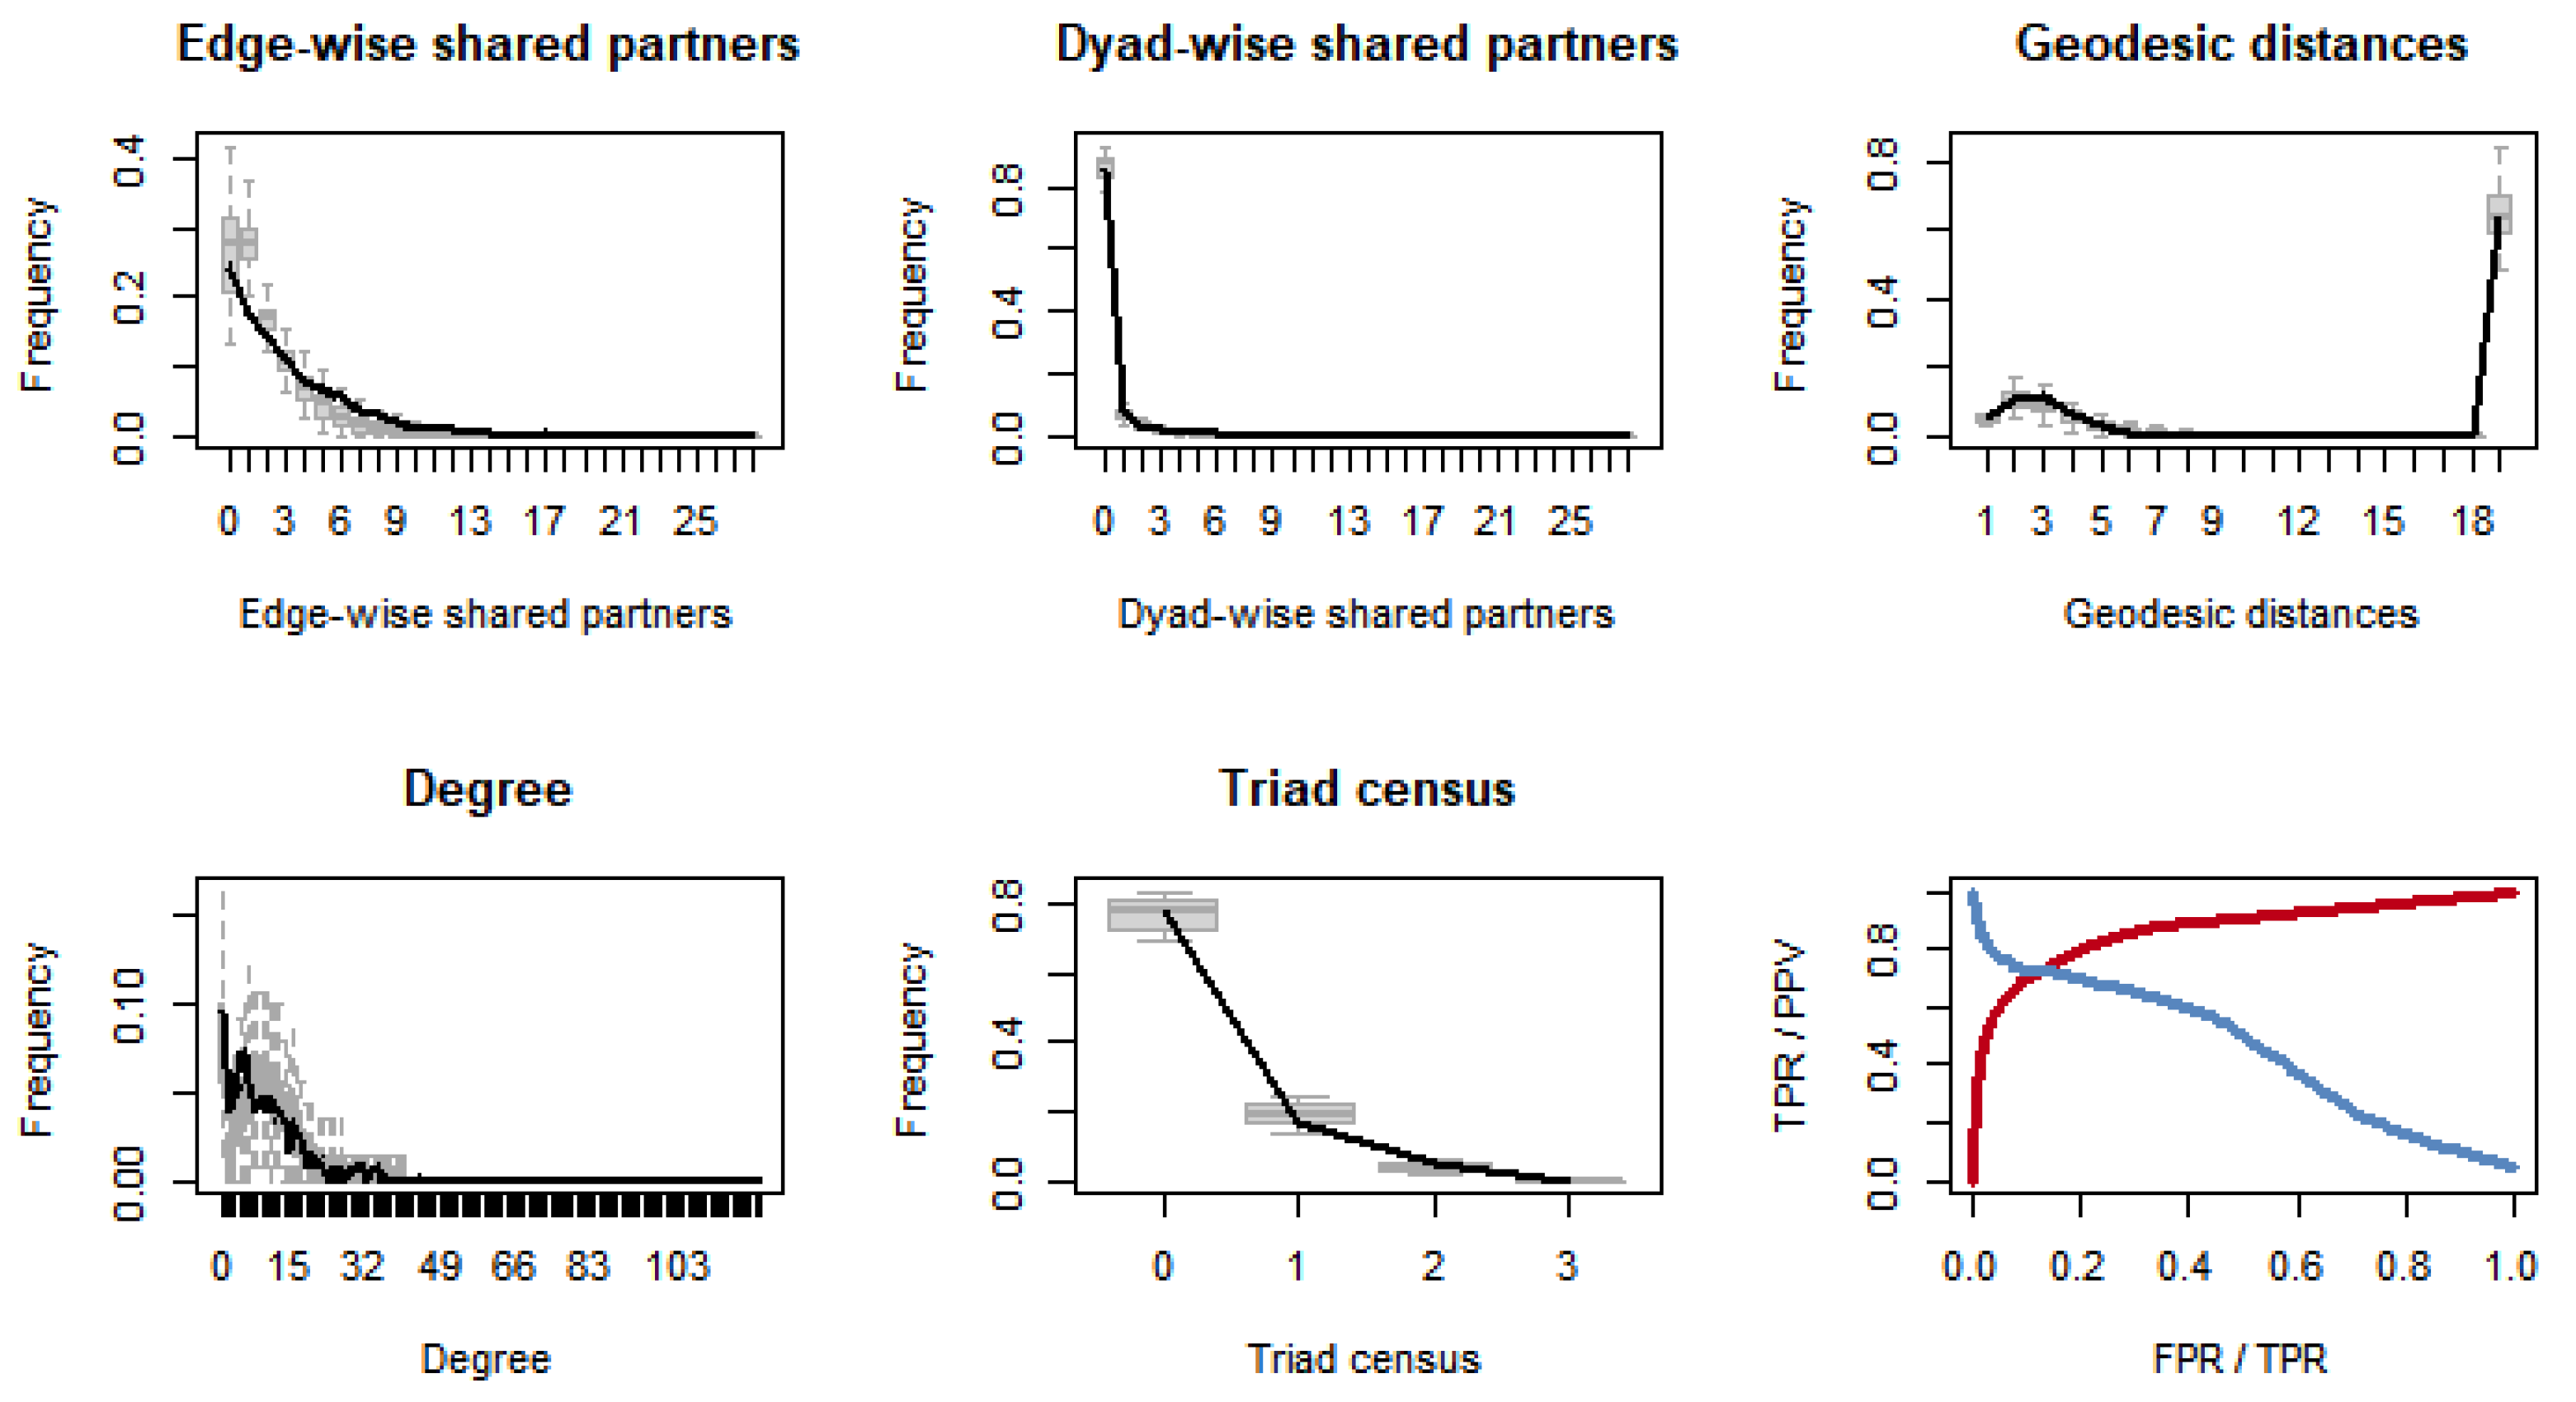
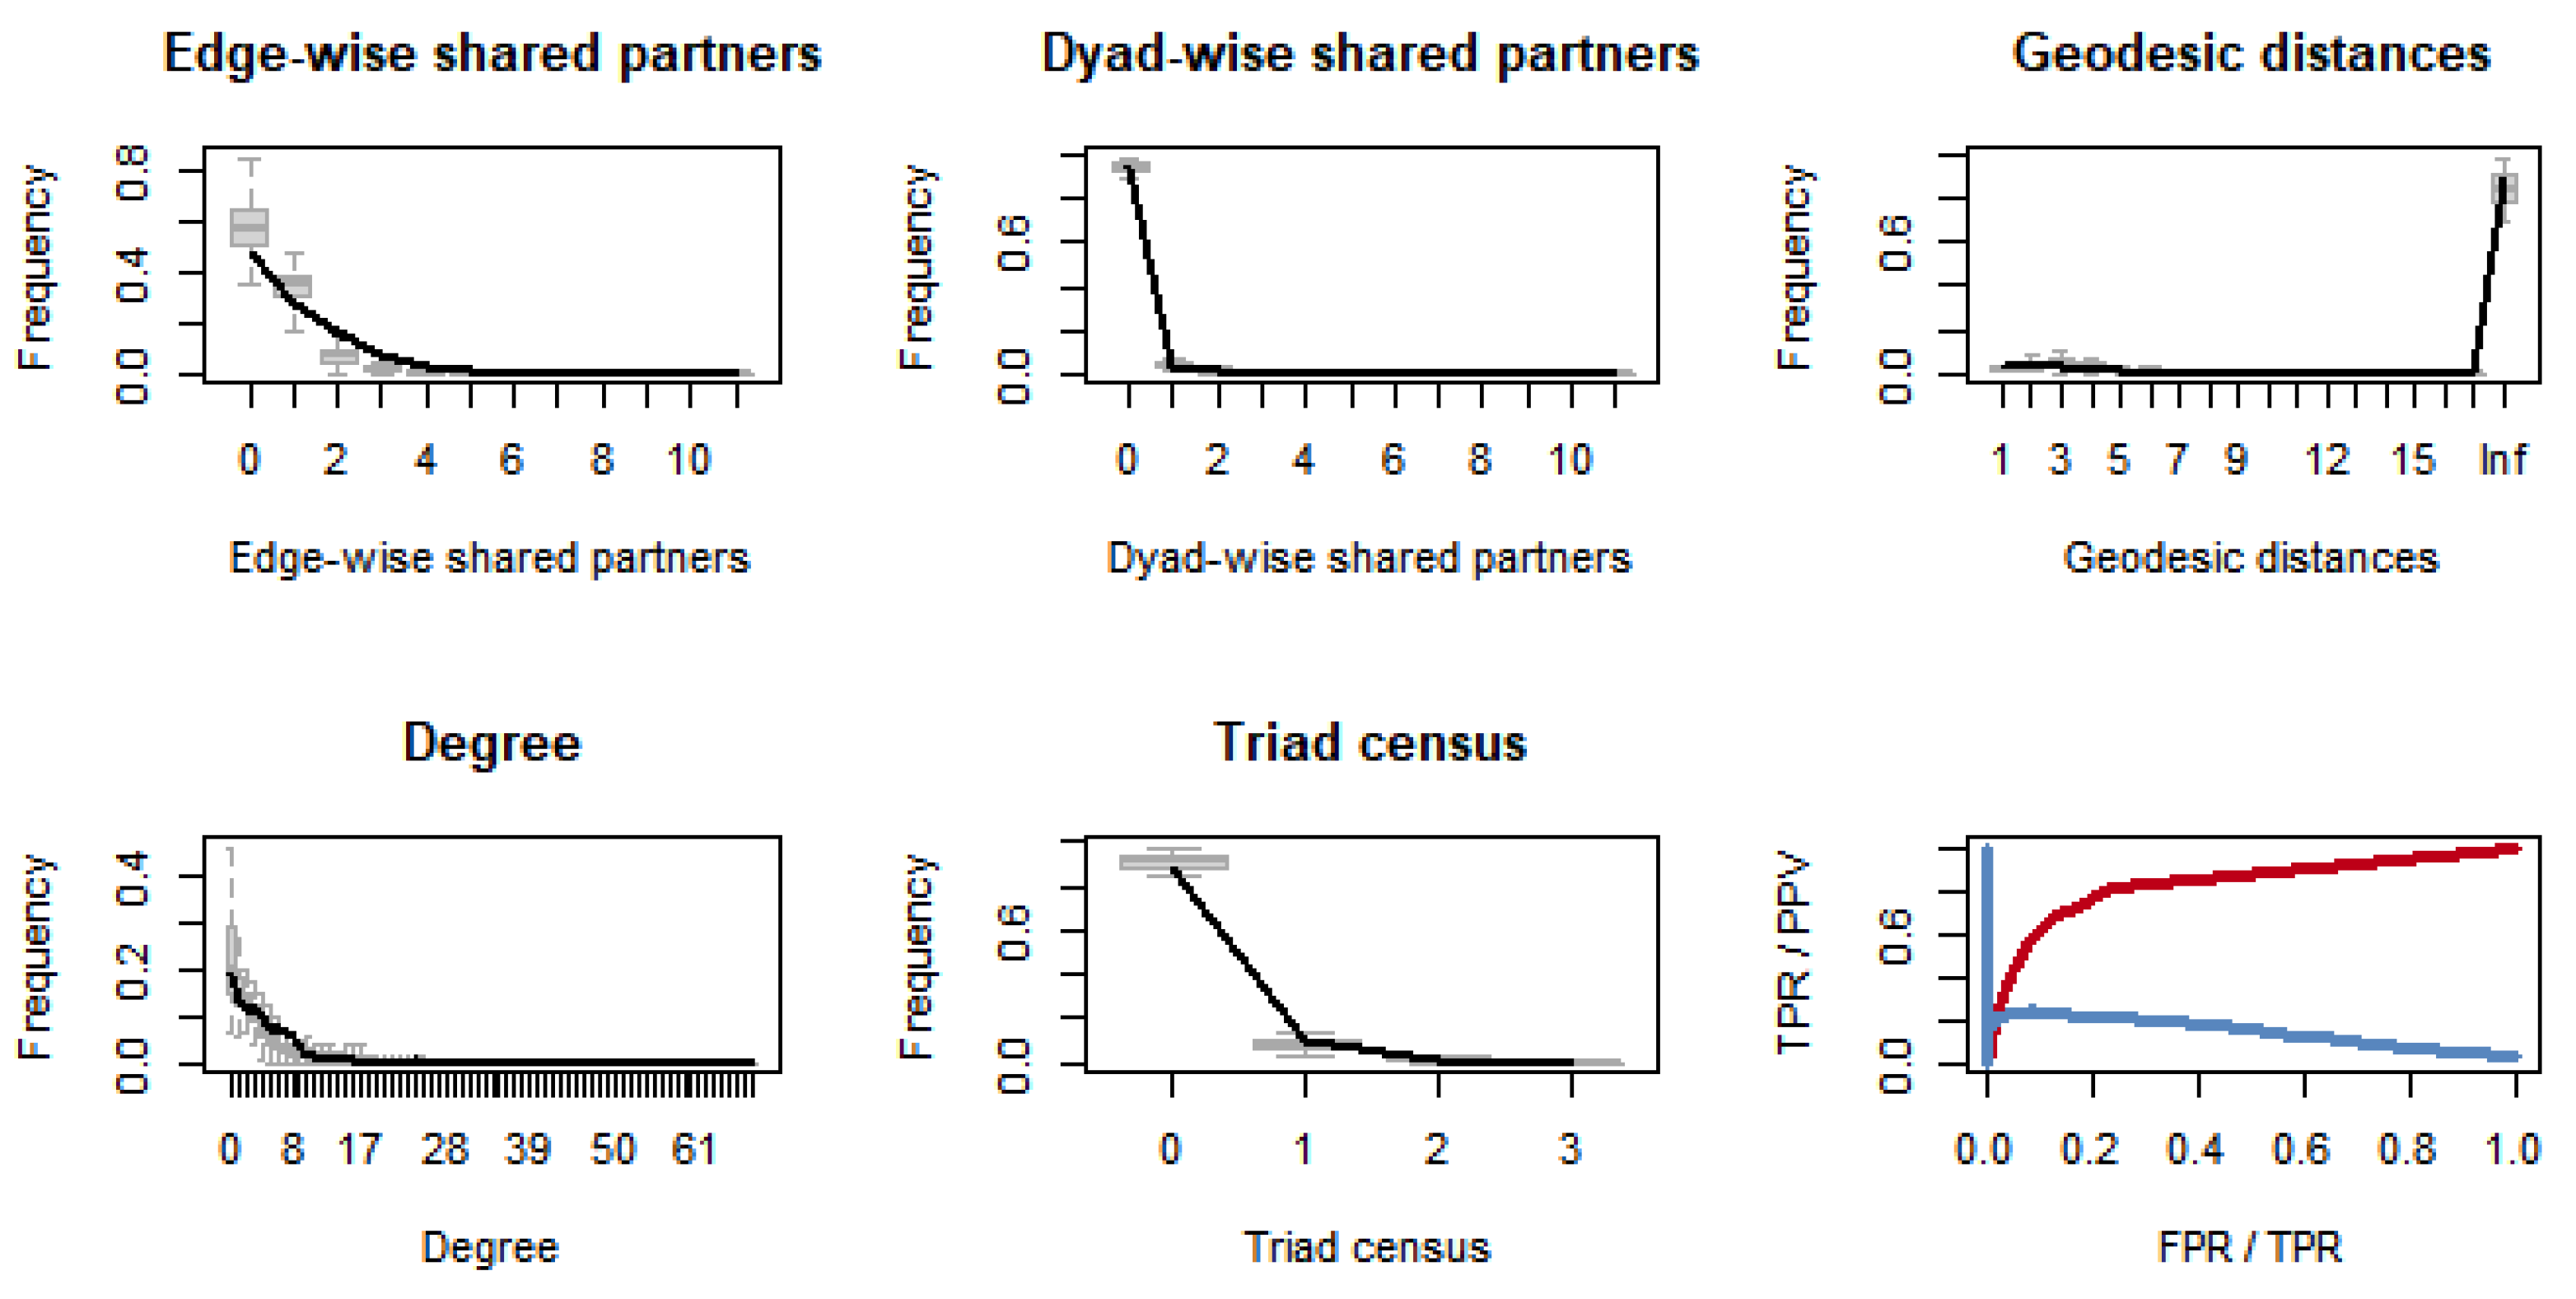
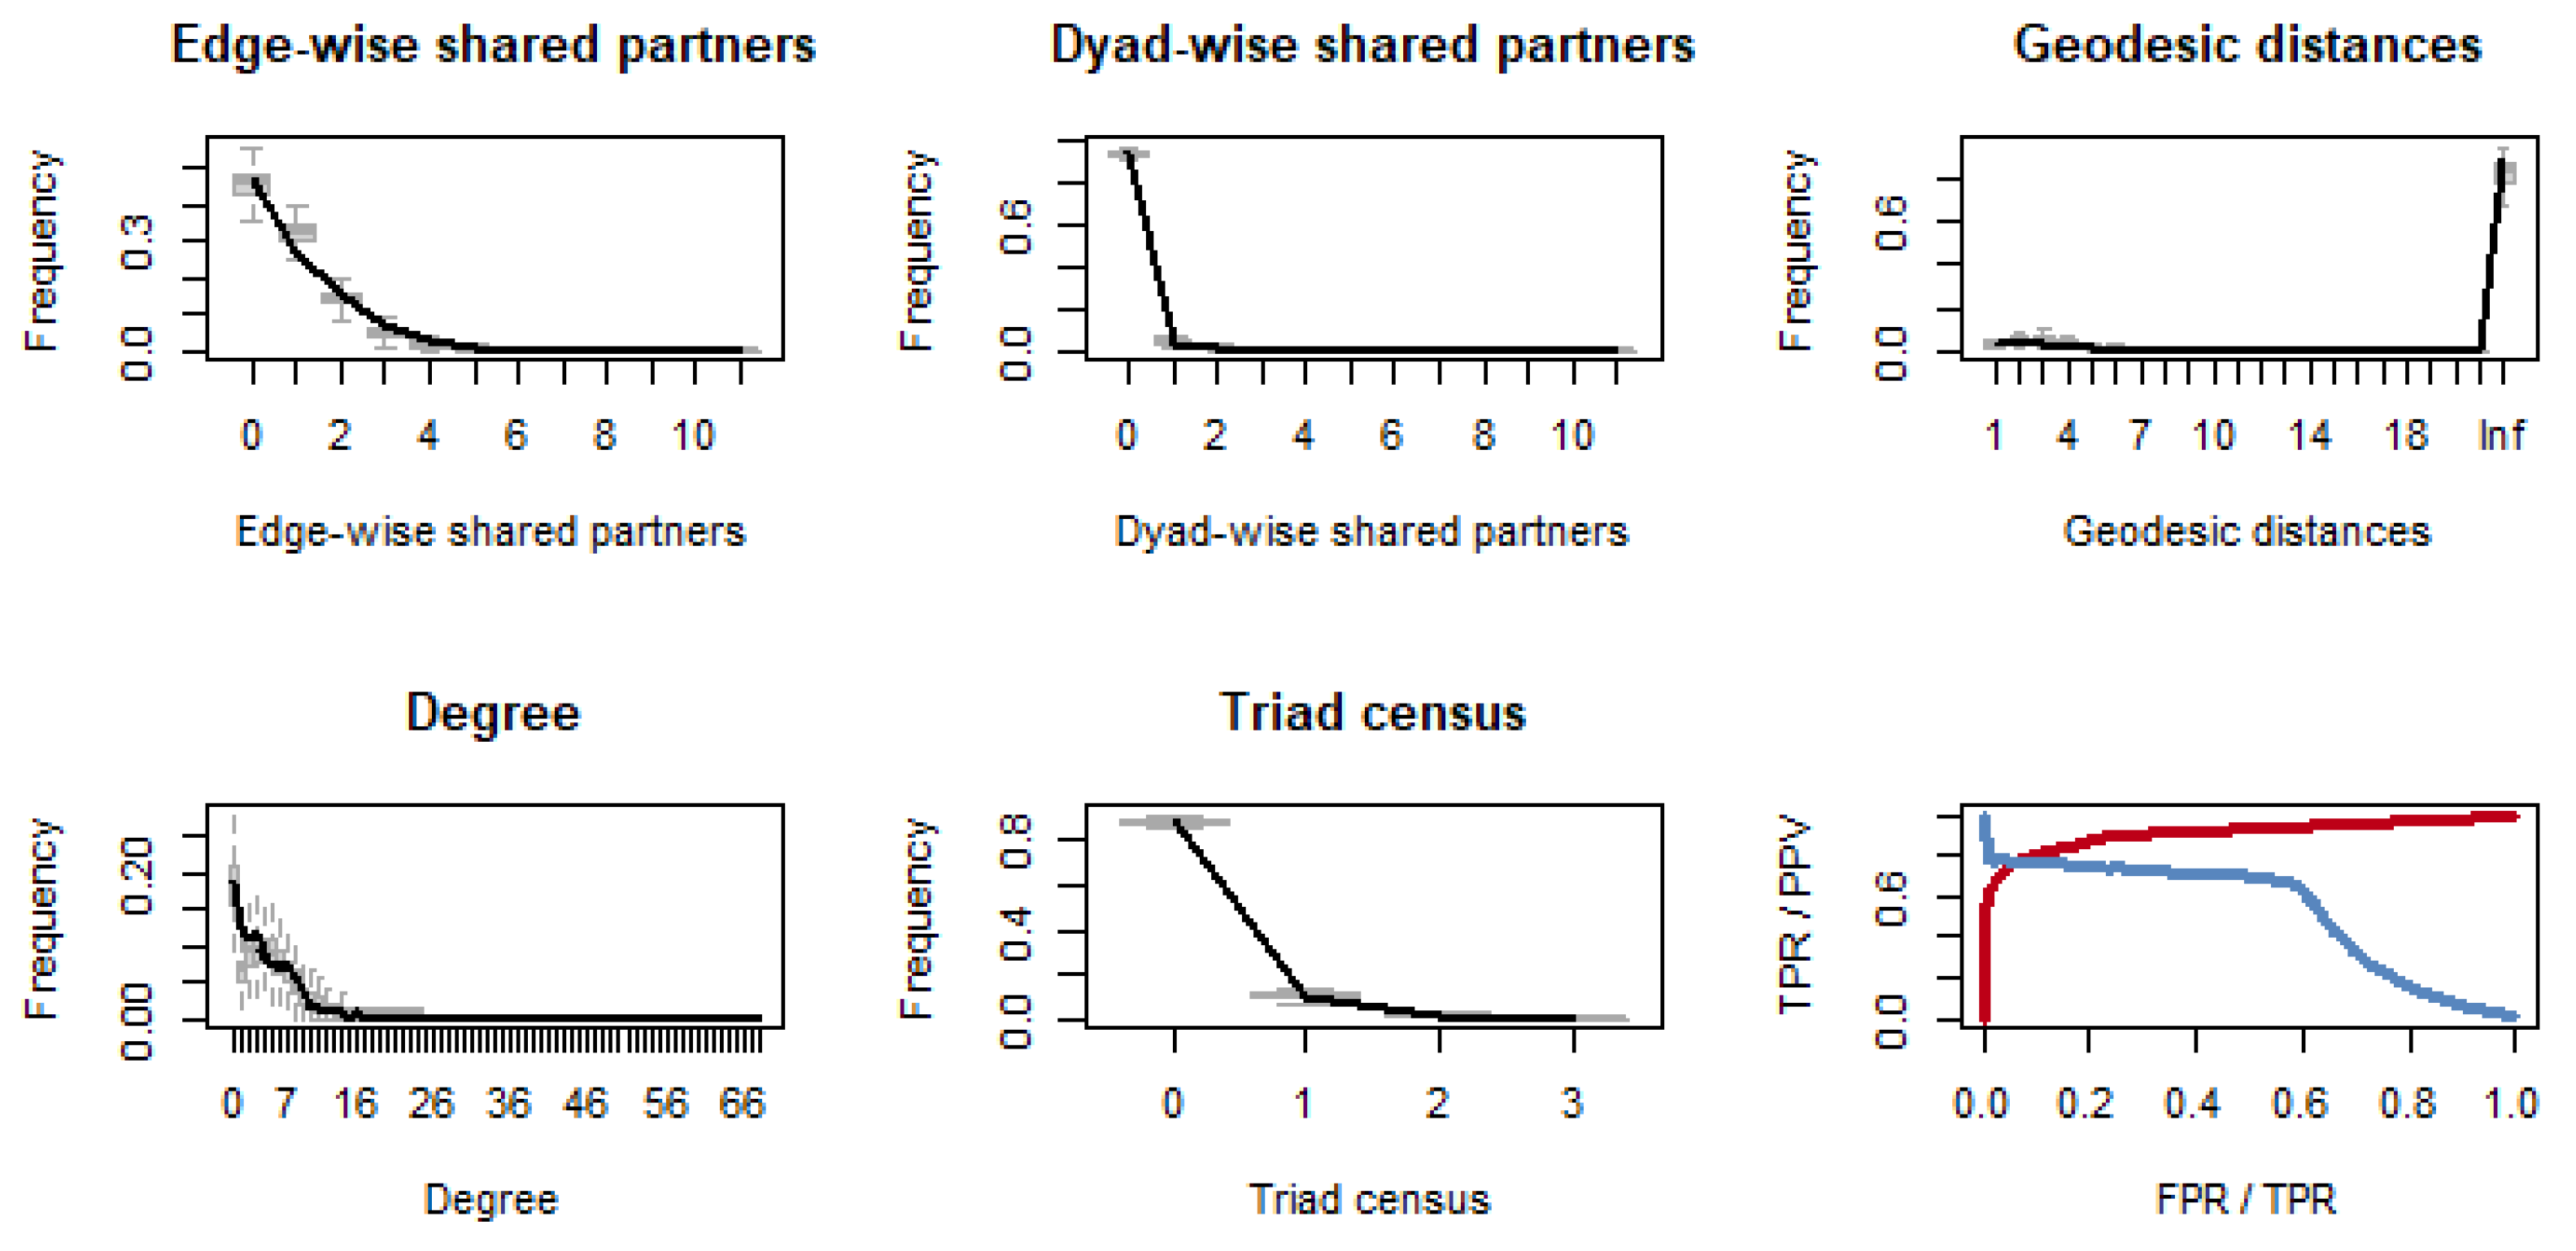
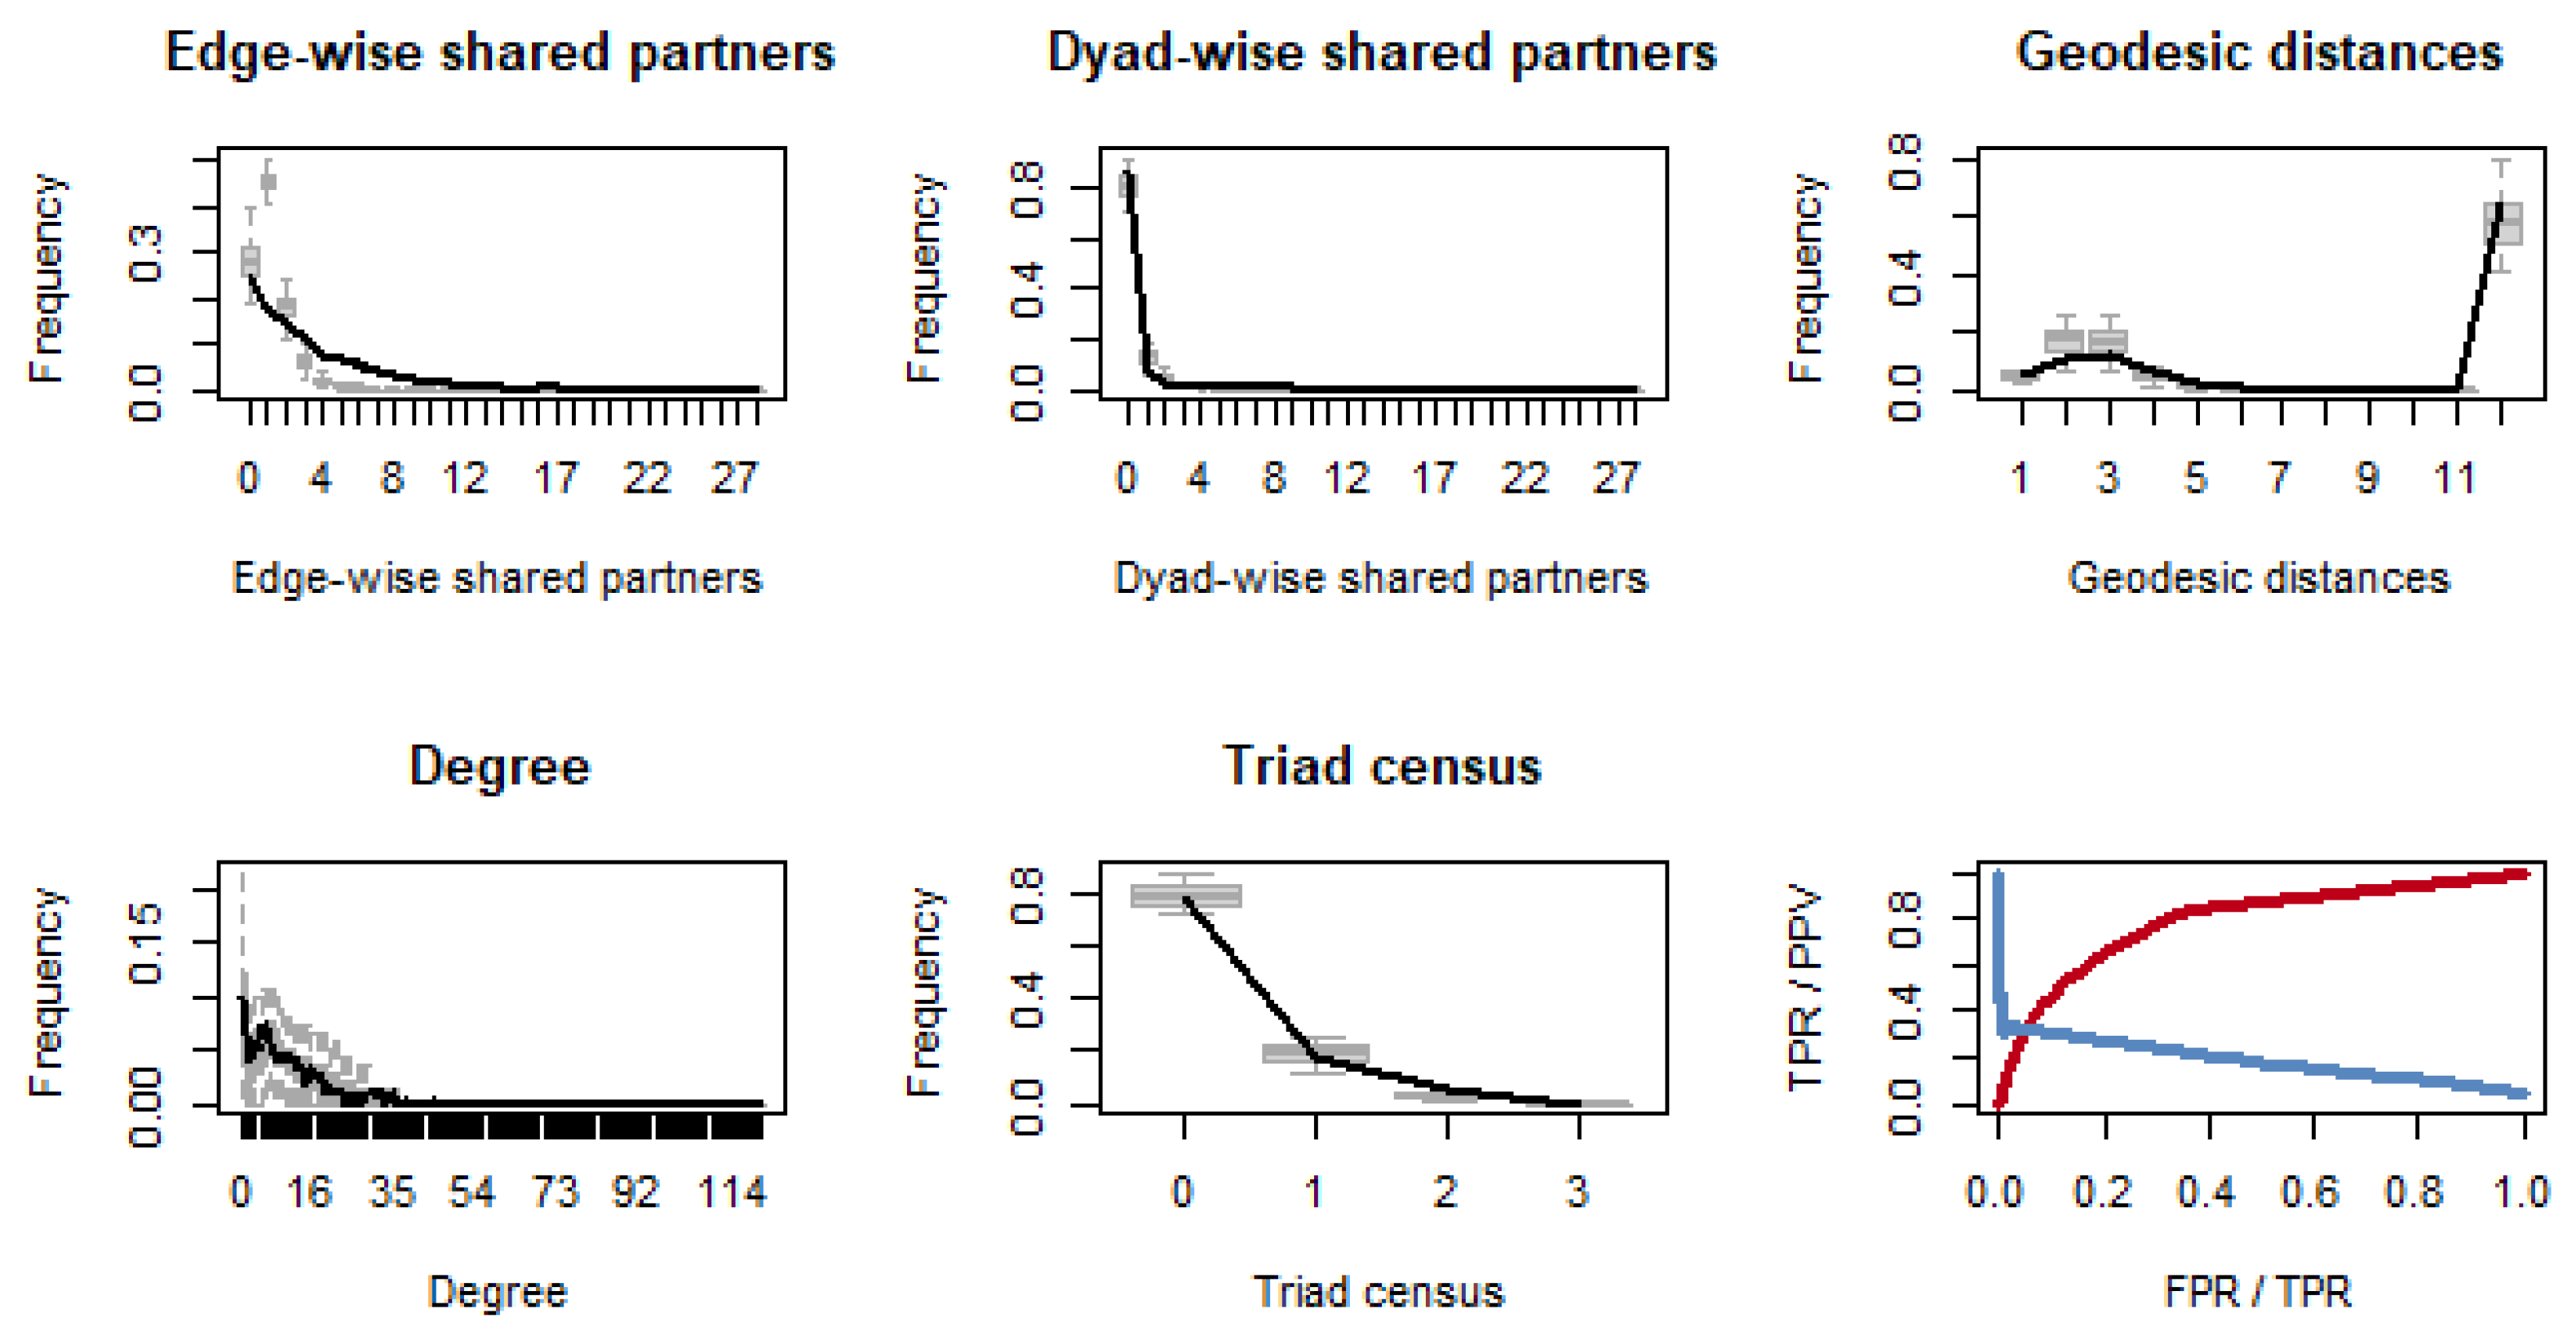
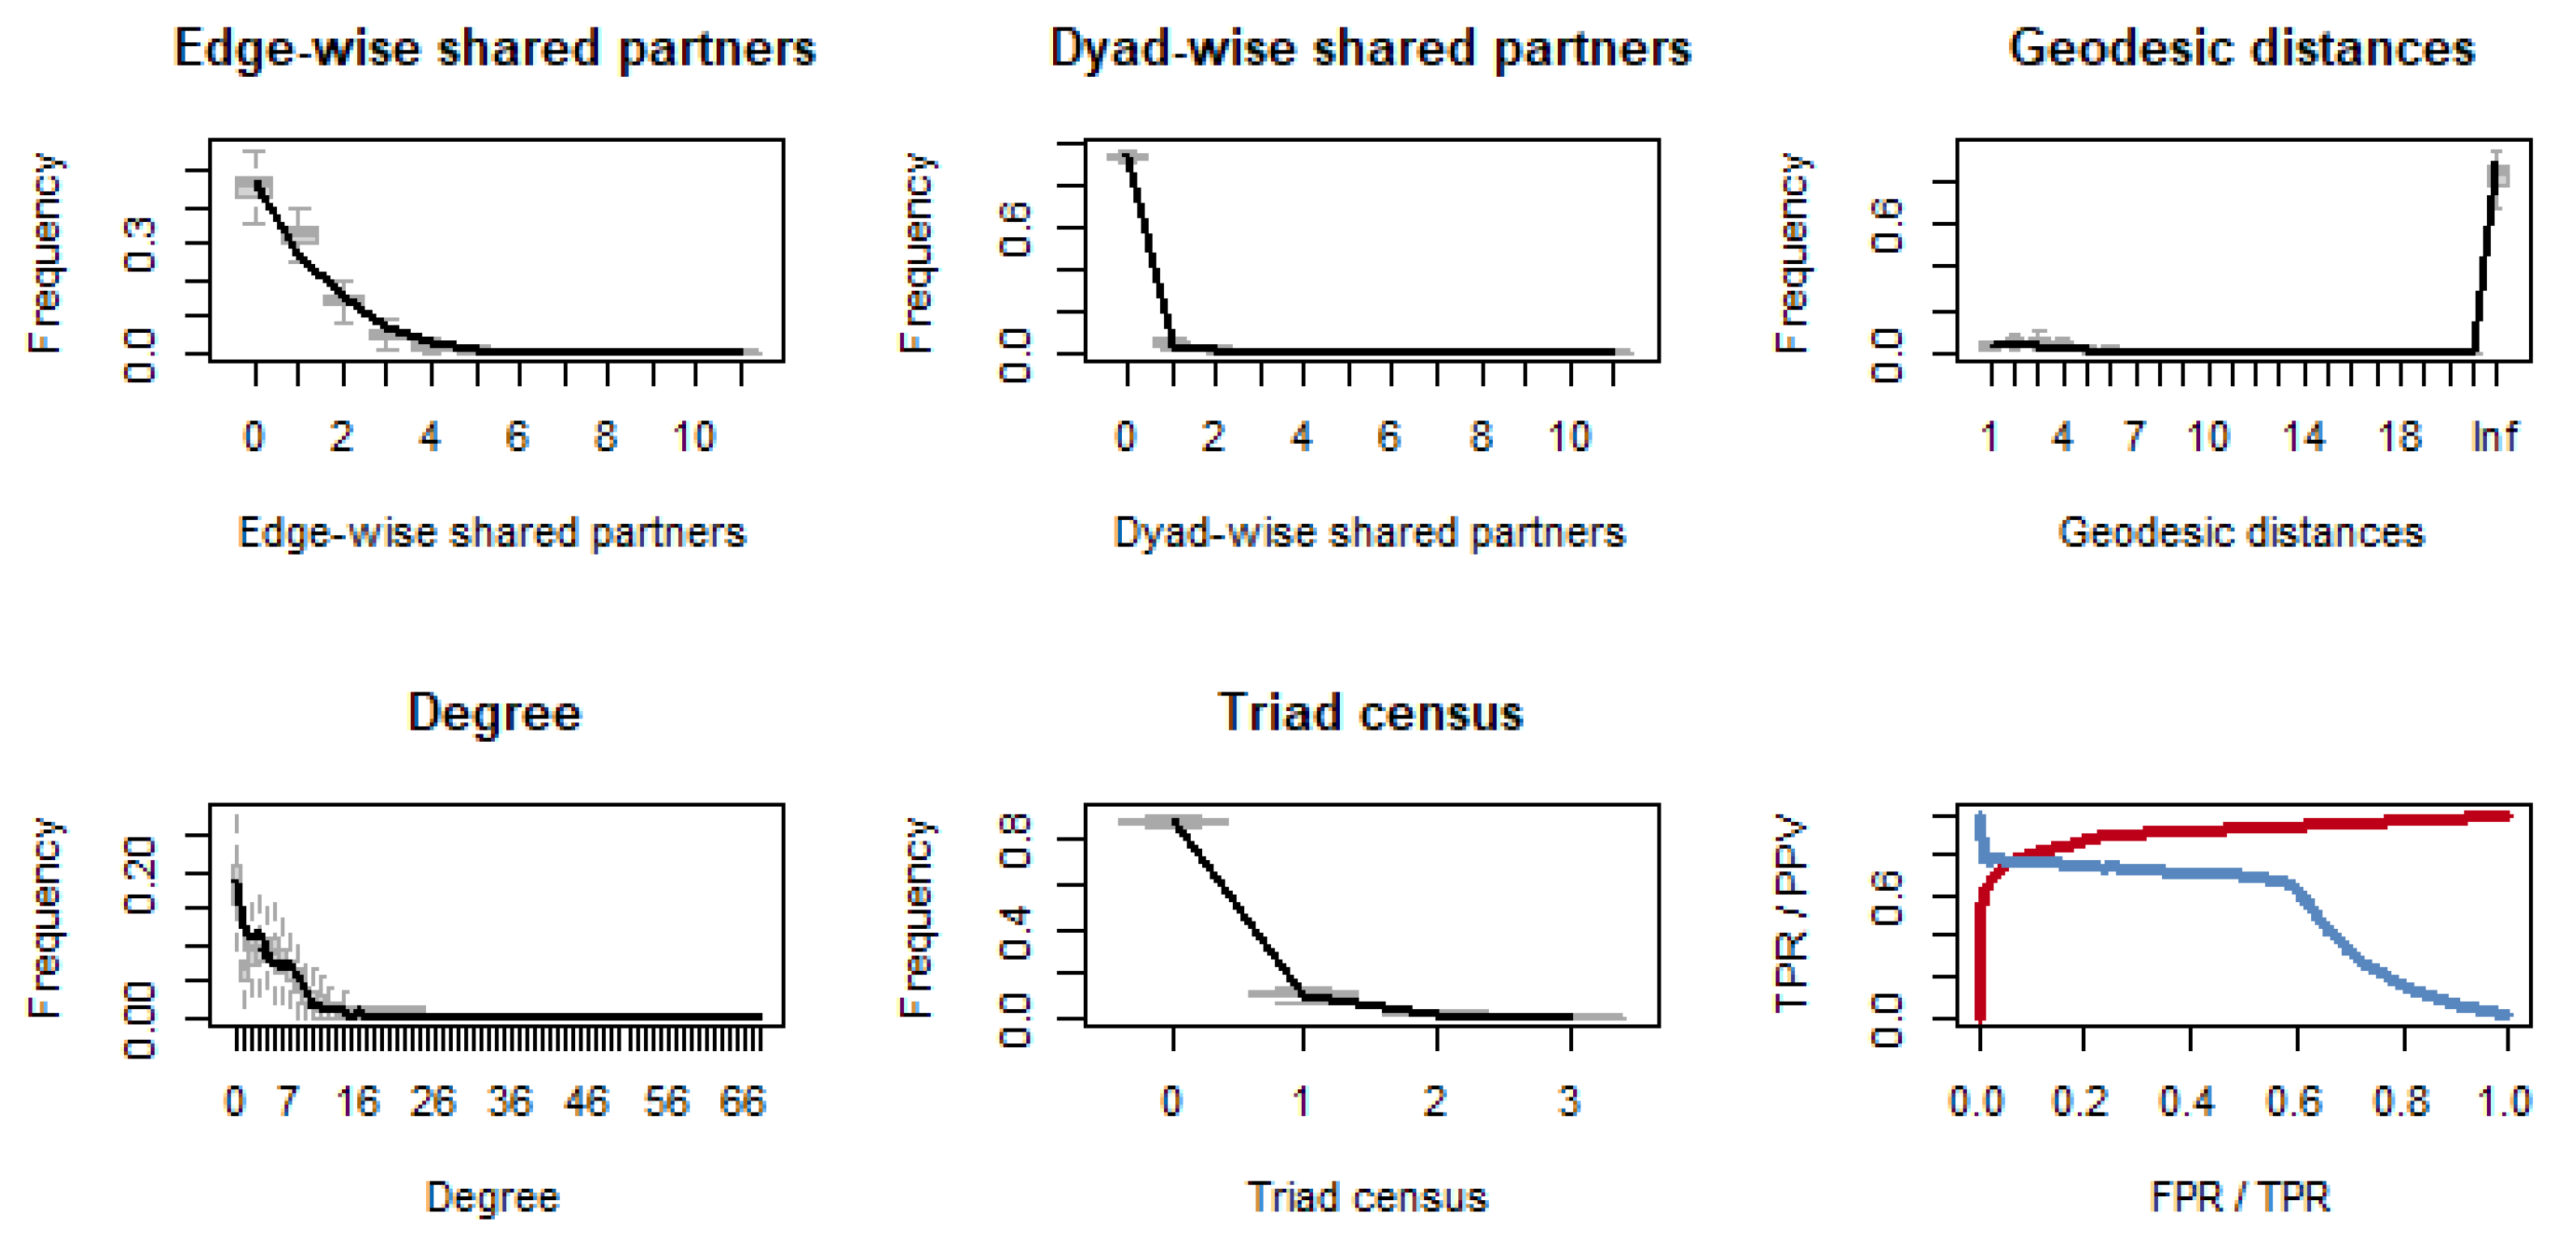
To validate model fit, a goodness-of-fit test was applied to the dynamic network data. Using parameter estimates from Models 2, 3, 5, 6, 8, and 9 (Table 5), 60 network simulations were conducted. Six metrics—edgewise shared partners, dyadwise shared partners, geodesic distances, indegree centrality, triad census, and receiver operating characteristic (ROC) curves—were employed to compare the simulated and observed networks. Boxplots of the simulated network metrics were generated, with medians closer to the observed values indicating superior fit [48]. ROC curves, which plot true-positive rates against false-positive rates, were evaluated on the basis of proximity to the top-left corner, reflecting prediction accuracy.
Comparative analysis revealed that Models 3, 6, and 9 outperformed their counterparts, as evidenced by medians aligning more closely with observed values in boxplots and ROC curves shifting toward the top-left quadrant. This confirms that models incorporating temporal dependencies exhibit superior fit, validating the efficacy of the dynamic TERGM in analyzing geopolitical network impacts on rare earth trade dependency networks. The visualization results are shown in Figure A1, Figure A2, Figure A3, Figure A4, Figure A5 and Figure A6 in Appendix A.

6.2. The Impact of the Degree Centrality of the Geopolitical Relationship Network on Rare Earth Trade

While previous analyses have examined the aggregate impact of geopolitical networks on rare earth industrial chain trade networks from an external network perspective, the centrality position of nations within geopolitical networks similarly influences trade dependency relationships. This study consequently employs a degree centrality framework to systematically evaluate how national centrality status affects rare earth industrial chain trade dependencies. The empirical results are presented in Table 6.
The parameter estimates for degree centrality in cooperative networks are all significantly positive (p < 0.001) across the upstream, midstream, and downstream trade networks, demonstrating that higher degree centrality in cooperative networks promotes the formation of trade dependency relationships [62]. Each unit increase in cooperative degree centrality elevates the probability of midstream trade relationships by approximately 3.29-fold ( e 1.4569 1 ), downstream relationships by 2.35-fold ( e 1.2099 1 ), and upstream relationships by 2.22-fold ( e 1.1698 1 ). Conversely, the conflict network centrality parameters are significantly negative, confirming that degree centrality in conflict networks substantially suppresses rare earth trade [15]. The vulnerability of the midstream sector emerges from its technologically intensive processes (e.g., rare earth separation and purification), which rely heavily on cross-border technical cooperation and intellectual property sharing; each unit increase in conflict reduces the probability of midstream trade by approximately 4.7% ( 1 e 0.0488 ), highlighting the fragility inherent in technology-dependent production stages.

6.3. The Impact of the Eigenvector Centrality of the Geopolitical Relationship Network on Rare Earth Trade

Recognizing the crucial influence of national centrality positions within geopolitical networks on the formation of rare earth trade dependency networks, this study particularly emphasizes that strategic alliances with core states in geopolitical cooperation networks often outweigh mere quantitative cooperation metrics. We therefore employ eigenvector centrality to identify cooperative hub nations and high-conflict nations within geopolitical networks, subsequently constructing a TERGM to examine the impact of geopolitical relations on rare earth industrial chain trade under the eigenvector centrality framework. The empirical results are presented in Table 7.
The parameter estimates for cooperative eigenvector centrality substantially exceed those for degree centrality, demonstrating that identifying cooperative hub nations provides significantly greater analytical value than simply quantifying nations with the most cooperative ties. These centrality effects exhibit marked variations along the industrial chain, with the most pronounced impact observed in the midstream sector [59], indicating that occupying a hub position within cooperative networks or establishing political alliances with such hub nations substantially enhances rare earth trade relationships; each unit increase in the eigenvector centrality of cooperative hub nations elevates the trade relationship probability by approximately 5.4-fold ( e 1.8514 1 ). Conversely, becoming a core nation in conflict networks or engaging in disputes with high-conflict nations significantly impedes rare earth trade, where each unit increase in the eigenvector centrality of high-conflict nations reduces the trade probability by approximately 25% ( 1 e 0.2889 ). The particular vulnerability of the midstream and downstream sectors, which involve processed rare earth magnet exports requiring multinational coordination and global market integration, becomes evident when high-conflict nations in geopolitical hotspots trigger cascading supply disruptions, revealing their potent disruptive capacity. Research by Yu G.H. et al. (2022) demonstrated that the eigenvector centrality of geopolitical cooperation networks has significantly positive effects, where maintaining cooperative relationships with major powers facilitates the formation of energy trade, confirming the validity of the conclusions drawn in this study [61].

7. Research Conclusions and Prospects

7.1. Research Conclusions

By employing an industrial chain perspective, this study constructs multilateral geopolitical cooperation–conflict networks and rare earth trade dependency networks across 140 countries (2001–2023) via social network analysis and the TERGM. The key empirical findings include the following:
(1) The topological density between global geopolitical networks and rare earth trade networks has exhibited a persistent intensification trend [26]. Within geopolitical relationship networks, cooperation and conflict coexist, with cooperative interactions predominating over adversarial interactions, whereas nations exhibiting both high cooperation and conflict intensity are concentrated primarily in North America, East Asia, and Europe. Correspondingly, rare earth trade networks display increasing densification and centralization across upstream, midstream, and downstream industrial chains, with trade activities progressively concentrating in Western Europe, North America, and East Asia, particularly manifesting strong agglomeration characteristics in upstream concentrated and downstream permanent magnet networks.
(2) The spillover effects of geopolitical networks on industrial chain trade networks exhibit gradient variations, with cooperation networks demonstrating the highest marginal effect on downstream permanent magnet trade (OR = 3.90), significantly exceeding those for midstream (OR = 3.29) and upstream (OR = 2.77) industrial chains. Conversely, conflict networks exert the strongest suppression effect on midstream trade (elasticity = −14.80%), which is 89.74% greater than the downstream impact (−7.80%), highlighting the particular vulnerability of technology-intensive midstream segments to geopolitical conflicts.
(3) The centrality metrics of geopolitical networks influence rare earth industrial chain trade networks asymmetrically. A 1-unit increase in degree centrality within cooperation networks amplifies midstream/downstream rare earth trade dependency intensity by 3.29-fold (p < 0.001), whereas a comparable increase in conflict network degree centrality suppresses midstream trade dependency intensity by 4.76%. For cooperation hub nations, each 1-unit elevation in eigenvector centrality elevates the probability of midstream trade relationships by approximately 5.37-fold. Conversely, among high-conflict nations, every 1-unit increase in eigenvector centrality reduces the midstream trade probability by approximately 25.09%.

7.2. Theoretical Contributions

While existing research has identified various factors influencing the evolution of global rare earth trade networks, these studies typically treat geopolitical relations as a unitary concept, failing to distinguish the fundamentally distinct mechanisms through which geopolitical cooperation and conflict operate. To address this critical gap, our study employs the DEGLT database to systematically disaggregate geopolitical relations into two discrete dimensions—cooperation and conflict—and rigorously examines their respective impacts on the dynamic evolution of rare earth trade networks.
Furthermore, while existing studies have examined the current state and development of global rare earth trade networks, they often adopt an aggregate perspective that overlooks critical differences across industrial chain segments. This study innovatively adopts a full-industrial-chain lens to analyze the dynamic evolution of trade networks in the upstream, midstream, and downstream rare earth sectors in detail. Employing TERGM, we incorporate network structure, behavioral relationships, and network covariates to comprehensively assess how geopolitical cooperation and conflict differentially propagate through various chain segments. We further analyze these dynamics through both degree centrality and eigenvector centrality frameworks to evaluate how nations’ positional advantages in geopolitical networks influence rare earth trade evolution, thereby broadening the analytical perspective and robustly validating our findings. Finally, we derive evidence-based policy recommendations to promote sustainable development across the global rare earth value chain.

7.3. Policy Recommendations

The following recommendations are proposed for the adjustment of rare earth trade strategies and the optimization of the trade landscape.
(1) This study reveals significant structural disparities in the global rare earth industrial chain trade network. Countries should clearly identify their hierarchical positions within the upstream, midstream, and downstream sectors of the industrial chain, leveraging comparative advantages while mitigating disadvantages. By doing so, nations can holistically enhance their hierarchical status within the rare earth trade network, thereby promoting a more balanced and sustainable evolution of the global rare earth trade.
(2) Countries should closely monitor developments in the global rare earth trade, particularly the dynamics of core nations within rare earth industrial chain trade networks, and adjust trade policies in a timely manner. The empirical findings of this study reveal that the current rare earth industrial chain trade network has a distinct core–periphery structure, with core countries largely dictating the network’s evolutionary trajectory. Consequently, real-time monitoring of global rare earth trade trends is imperative.
(3) Geopolitical cooperation and conflict involve markedly divergent mechanisms that govern the formation and evolution of rare earth industrial chain trade networks. Accordingly, nations must abandon short-term transactional approaches and instead cultivate an integrated, multidimensional framework for rare earth trade. This requires promoting the international expansion of domestic rare earth enterprises and research institutions while strengthening multilateral cooperation in offshore mineral resource development, the establishment of unified rare earth product standards, and joint technological innovation. Such efforts will enable the realization of sustainable development through dynamic equilibrium between national security considerations and trade liberalization.

7.4. Research Limitations

(1) This study matches geopolitical relations with rare earth trade data covering 140 countries. However, many nations remain excluded from the current analysis. Future research will expand the scope of study to include a more comprehensive range of countries.
(2) This study does not account for potential mediating variables in rare earth trade dynamics, such as how geopolitical factors may influence rare earth product pricing and subsequently affect trade patterns. Future research should incorporate these mediation mechanisms to better elucidate the causal pathways between geopolitical dynamics and trade outcomes.

Author Contributions

Conceptualization, F.Z. and H.W.; methodology, C.L.; software, C.L.; formal analysis, C.L.; data curation, J.J.; writing—original draft preparation, J.J.; writing—review and editing, F.Z.; supervision, H.W.; funding acquisition, F.Z. All authors have read and agreed to the published version of the manuscript.

Funding

This research was funded by the Youth Project of the National Social Science Foundation of China, Grant number 21CJL028.

Institutional Review Board Statement

Not applicable.

Informed Consent Statement

Not applicable.

Data Availability Statement

The data presented in this study are available upon request from the corresponding author.

Conflicts of Interest

The authors declare no conflicts of interest.

Appendix A

Figure A1. Goodness-of-fit test for Model 2.
Sustainability 17 04881 g0a1
Figure A2. Goodness-of-fit test for Model 3.
Sustainability 17 04881 g0a2
Figure A3. Goodness-of-fit test for Model 5.
Sustainability 17 04881 g0a3
Figure A4. Goodness-of-fit test for Model 6.
Sustainability 17 04881 g0a4
Figure A5. Goodness-of-fit test for Model 8.
Sustainability 17 04881 g0a5
Figure A6. Goodness-of-fit test for Model 9.
Sustainability 17 04881 g0a6

References

  1. Telegina, E.A.; Khalova, G.O. Geoeconomic And Geopolitical Challenges Of Energy Transution: Implications For World Economy. Mirovaya Ekon. I Mezhdunarodnye Otnos. 2022, 66, 26–34. [Google Scholar]
  2. Chen, Y.F.; Zhang, S.; Miao, J.F. The negative effects of the US–China trade war on innovation: Evidence from the Chinese ICT industry. Technovation 2023, 123, 102734. [Google Scholar] [CrossRef]
  3. Mancheri, N.A.; Sprecher, B.; Deetman, S.; Young, S.B.; Bleischwitz, R.; Dong, L.; Kleijn, R.; Tukker, A. Resilience in the tantalum supply chain. Resour. Conserv. Recycl. 2018, 129, 56–69. [Google Scholar] [CrossRef]
  4. Opolski, M.; Wilson, I. Asthma and depression: A pragmatic review of the literature and recommendations for future research. Clin. Pract. Epidemiol. Ment. Health CP EMH 2005, 1, 18. [Google Scholar] [CrossRef] [PubMed]
  5. Zepf, V. Rare Earth Elements: A New Approach to the Nexus of Supply, Demand and Use: Exemplified Along the Use of Neodymium in Permanent Magnets; Springer Science & Business Media: Berlin, Germany, 2013. [Google Scholar]
  6. Nece, M. The Impact of Colonial Ties of the Trade Relationships of African Countries; International Institute of Social Studies: The Hague, The Netherlands, 2022. [Google Scholar]
  7. Qin, K.; Luo, P.; Yao, B. Networked mining of GDELT and international relations analysis. Geo-Inf. Sci. 2019, 21, 4–24. [Google Scholar]
  8. Di Stefano, C.; Iapadre, P.L.; Salvati, I. Trade and Infrastructure in the Belt and Road Initiative: A Gravity Analysis Based on Revealed Trade Preferences. J. Risk Financ. Manag. 2021, 14, 52. [Google Scholar] [CrossRef]
  9. Gholz, E. Rare Earth Elements and National Security; Council on Foreign Relations: New York, NY, USA, 2014. [Google Scholar]
  10. Hatch, G.P. Dynamics in the Global Market for Rare Earths. Elements 2012, 8, 341–346. [Google Scholar] [CrossRef]
  11. Fan, J.H.; Omura, A.; Roca, E. Geopolitics and rare earth metals. Eur. J. Political Econ. 2023, 78, 102356. [Google Scholar] [CrossRef]
  12. Wübbeke, J. Rare earth elements in China: Policies and narratives of reinventing an industry. Resour. Policy 2013, 38, 384–394. [Google Scholar] [CrossRef]
  13. Hurst, C. China’s Rare Earth Elements Industry: What Can the West Learn? Institute for the Analysis of Global Security: Washington, DC, USA, 2010. [Google Scholar]
  14. MKJ. Rare Earth Frontiers: From Terrestrial Subsoils to Lunar Landscapes; Cornell University Press: New York, NY, USA, 2018. [Google Scholar]
  15. Hou, W.; Liu, H.; Wang, H. Structure and patterns of the international rare earths trade: A complex network analysis. Resour. Policy 2018, 55, 133–142. [Google Scholar] [CrossRef]
  16. Mancheri, N.A. An overview of Chinese rare earth export restrictions and implications. In Rare Earths Industry: Technological, Economic, and Environmental Implications; Elsevier: Amsterdam, The Netherlands, 2016; Chapter 2; pp. 21–36. [Google Scholar]
  17. Guo, Y.Q.; Li, Y.L.; Liu, Y.H.; Zhang, H.W. The impact of geopolitical relations on the evolution of cobalt trade network from the perspective of industrial chain. Resour. Policy 2023, 85, 103778. [Google Scholar] [CrossRef]
  18. Shuai, J.; Zhao, Y.; Shuai, C.; Wang, J.; Yi, T.; Cheng, J. Assessing the international co-opetitiondynamics of rare earth resources between China, USA, Japan and the EU: Anecological niche approach. Resour. Policy 2023, 82, 103446. [Google Scholar] [CrossRef]
  19. Leng, Z.; Sun, H.; Cheng, J.; Wang, H.; Yao, Z. China’s rare earth industry technologicalinnovation structure and driving factors: A social network analysis based on patents. Resour. Policy 2021, 73, 102233. [Google Scholar] [CrossRef]
  20. Golev, A.; Scott, M.; Erskine, P.D.; Ali, S.H.; Ballantyne, G.R. Rare earths supply chains: Current status, constraints and opportunities. Resour. Policy 2014, 41, 52–59. [Google Scholar] [CrossRef]
  21. Dutta, T.; Kim, K.H.; Uchimiya, M.; Kwon, E.E.; Jeon, B.H.; Deep, A.; Yun, S.T. Global demand for rare earth resources and strategies for green mining. Environ. Res. 2016, 150, 182–190. [Google Scholar] [CrossRef]
  22. Tong, X.; Lifset, R. International copper flow network: A blockmodel analysis. Ecol. Econ. 2007, 61, 345–354. [Google Scholar] [CrossRef]
  23. Ge, J.P.; Wang, X.B.; Guan, Q.; Li, W.H.; Zhu, H.; Yao, M. World rare earths trade network: Patterns, relations and role characteristics. Resour. Policy 2016, 50, 119–130. [Google Scholar] [CrossRef]
  24. Gulley, A.L.; McCullough, E.A.; Shedd, K.B. China’s domestic and foreign influence in the global cobalt supply chain. Resour. Policy 2019, 62, 317–323. [Google Scholar] [CrossRef]
  25. Alonso, E.; Sherman, A.M.; Wallington, T.J.; Everson, M.P.; Field, F.R.; Roth, R.; Kirchain, R.E. Evaluating Rare Earth Element Availability: A Case with Revolutionary Demand from Clean Technologies. Environ. Sci. Technol. 2012, 46, 3406–3414. [Google Scholar] [CrossRef]
  26. Wang, Q.Y.; Cao, S.Y.; Xiao, Y.Y. Statistical characteristics of international conflict and cooperation network. Phys. A—Stat. Mech. Its Appl. 2019, 535, 122334. [Google Scholar] [CrossRef]
  27. Bouzarovski, S. East-Central Europe’s changing energy landscapes: A place forgeography. Area 2009, 41, 452–463. [Google Scholar] [CrossRef]
  28. Daras, N.J.; Mazis, J.T. Systemic geopolitical modeling. Part 1: Prediction of geopolitical events. GeoJournal 2014, 80, 653–678. [Google Scholar] [CrossRef]
  29. Zhai, C.; Du, D.; Hou, C.; Duan, D.; Gui, Q. The evolution of geo-relation network in countriesaround the Asian water tower based on cooperation and conflict perspectives. Geogr. Res. 2021, 40, 3118–3136. [Google Scholar]
  30. De Soyres, F.; Mulabdic, A.; Murray, S. How much will the belt and roadinitiative reduce trade costs? Int. Econ. 2019, 159, 151–164. [Google Scholar] [CrossRef]
  31. Zhang, H.; Cao, H.; Guo, Y. The time-varying impact of geopolitical relations on rare earth trade networks: What is the role of China’s rare earth export restrictions? J. Technol. Forecast. Soc. Change 2024, 206, 123550. [Google Scholar] [CrossRef]
  32. Habib, K.; Wenzel, H. Exploring rare earths supply constraints for the emerging clean energy technologies and the role of recycling. J. Clean. Prod. 2014, 84, 348–359. [Google Scholar] [CrossRef]
  33. Boccaletti, S.; Latora, V.; Moreno, Y.; Chavez, M.; Hwang, D.U. Complex networks: Structure and dynamics. Phys. Rep.-Rev. Sec. Phys. Lett. 2006, 424, 175–308. [Google Scholar] [CrossRef]
  34. Gutiérrez-Moya, E.; Lozano, S.; Adenso-Díaz, B. Analysing the Structure of the Global Wheat Trade Network: An ERGM Approach. Agronomy 2020, 10, 1967. [Google Scholar] [CrossRef]
  35. Pan, S.; Chong, Z. Effects of FDI on trade among countries along the Belt and Road: A network perspective. LNT Trade Econ. 2022, 32, 84–103. [Google Scholar] [CrossRef]
  36. Cui, S.-J.; Cai, Y.; Jiang, M.-Q. Critical technology change and energy geopolitics transition. Nat. Resour. 2021, 35, 2585–2595. [Google Scholar] [CrossRef]
  37. Xu, S.; Ma, C.; Zhu, W. Study on the structure and evolution of rare earth trade network along the Belt and Road. Gold Sci. Technol. 2022, 30, 196–208. [Google Scholar]
  38. Feng, L.Y.; Xu, H.L.; Wu, G.; Zhao, Y.; Xu, J.L. Exploring the structure and influence factors of trade competitive advantage network along the Belt and Road. Phys. A—Stat. Mech. Its Appl. 2020, 559, 125057. [Google Scholar] [CrossRef]
  39. Zhao, G.M.; Li, W.X.; Geng, Y.; Bleischwitz, R. Uncovering the features of global antimony resource trade network. Resour. Policy 2023, 85, 103815. [Google Scholar] [CrossRef]
  40. Atacan, C.; Açik, A. Impact of Geopolitical Risk on International Trade: Evidence from Container Throughputs. Trans. Marit. Sci.-ToMS 2023, 12, 11. [Google Scholar] [CrossRef]
  41. Xu, J.; Li, J.; Charles, V.; Zhao, X. Evolution of the rare earth trade network: A perspective of dependency and competition. J. Geosci. Front. 2024, 15, 101653. [Google Scholar] [CrossRef]
  42. Ilankoon, I.M.S.K.; Dushyantha, N.P.; Mancheri, N.; Edirisinghe, P.; Neethling, S.; Ratnayake, N.; Rohitha, L.; Dissanayake, D.; Premasiri, H.; Abeysinghe, A.; et al. Constraints to rare earthelements supply diversification: Evidence from an industry survey. J. Clean. Prod. 2022, 331, 129932. [Google Scholar] [CrossRef]
  43. Liu, Z.G.; Wang, T.; Sonn, J.W.; Chen, W. The structure and evolution of trade relations between countries along the Belt and Road. J. Geogr. Sci. 2018, 28, 1233–1248. [Google Scholar] [CrossRef]
  44. Javorsek, M. Asymmetries in International Merchandise Trade Statistics: A Case Study of Selected Countries in Asia-Pacific; United Nations Economic and Social Commission for Asia and the Pacific: Bangkok, Thailand, 2016. [Google Scholar]
  45. Chen, W.; Zhang, H. Characterizing the Structural Evolution of Cereal Trade Networks in the Belt and Road Regions: A Network Analysis Approach. Foods 2022, 11, 1468. [Google Scholar] [CrossRef]
  46. Zheng, J.; Wang, J.F.; Shen, A.Z. Evolutionary game of international trade network based on trade policy differences. Sci. Rep. 2025, 15, 1095. [Google Scholar] [CrossRef]
  47. Zuo, X.-G.; Zhu, X.-H.; Chen, J.-Y. Trade dependence network structure of tantalum trade goods and its effect on trade prices: An industry chain perspective. Resour. Policy 2022, 79, 103065. [Google Scholar]
  48. Leifeld, P.; Cranmer, S.J.; Desmarais, B.A. Temporal Exponential Random Graph Models with btergm: Estimation and Bootstrap Confidence Intervals. J. Stat. Softw. 2018, 83, 1–36. [Google Scholar] [CrossRef]
  49. Whetsell, T.A. Democratic governance and global science: A longitudinal analysis of the international research collaboration network. PLoS ONE 2023, 18, e0287058. [Google Scholar] [CrossRef] [PubMed]
  50. Li, P.F.; Yang, D.H.; Qu, S.N.; Zhang, Y.F. Analysis on global supply risk of rare minerals: From the perspective of strategic emerging industry development. World Econ. Stud. 2015, 32, 96–104. [Google Scholar]
  51. Menkel-Meadow, C.; Schneider, A.K. International Conflict Resolution Processes; Carolina Academic Press: Durham, NC, USA, 2025. [Google Scholar]
  52. James, P. Conflict and cohesion: A review of the literature and recommendations for future research. Coop. Confl. 1987, 22, 21–33. [Google Scholar] [CrossRef]
  53. Mancheri, N.A. World trade in rare earths, Chinese export restrictions, and implications. Resour. Policy 2015, 46, 262–271. [Google Scholar] [CrossRef]
  54. Guo, Q.; Wang, Y. Rare earth trade dependence network structure and its impact on trade prices: An industry chain perspective. Resour. Policy 2024, 91, 104930. [Google Scholar] [CrossRef]
  55. Jianwei, L. The reconstruction of rare earth industry chain in the United States against the background of strategic competition among great powers and its impact. Pac. J. 2022, 12, 52–63. [Google Scholar]
  56. Ren, Y.W.; Yang, Y.; Wang, Y.; Liu, Y. Dynamics of the global semiconductor trade and its dependencies. J. Geogr. Sci. 2023, 33, 1141–1160. [Google Scholar] [CrossRef]
  57. Hoekman, B. Global Value Chains: Inter-Industry Linkages, Trade Costs and Policies. Rev. Ind. Organ. 2020, 57, 189–193. [Google Scholar] [CrossRef]
  58. Zuo, Z.; McLellan, B.C.; Li, Y.; Guo, H.; Cheng, J. Evolution and insights into the network and pattern of the rare earths trade from an industry chain perspective. Resour. Policy. 2022, 78, 102912. [Google Scholar] [CrossRef]
  59. Wu, Y.; Peng, Z.; Lai, D.; Zhao, S.; Wang, L.; Chen, W.; Wang, P. Exploring international rare earth industry landscape changes and China’s strategic responses. Bull. Chin. Acad. Sci. 2023, 38, 255–264. [Google Scholar]
  60. Li, Z.Z.; Meng, Q.; Zhang, L.L.; Lobont, O.R.; Shen, Y.J. How do rare earth prices respond to economic and geopolitical factors? Resour. Policy 2023, 85, 103853. [Google Scholar] [CrossRef]
  61. Yu, G.H.; Xiong, C.; Xiao, J.X.; He, D.Y.; Peng, G. Evolutionary analysis of the global rare earth trade networks. Appl. Math. Comput. 2022, 430, 127249. [Google Scholar] [CrossRef]
  62. Head, K.; Mayer, T.; Ries, J. The erosion of colonial trade linkages after independence. J. Int. Econ. 2010, 81, 1–14. [Google Scholar] [CrossRef]
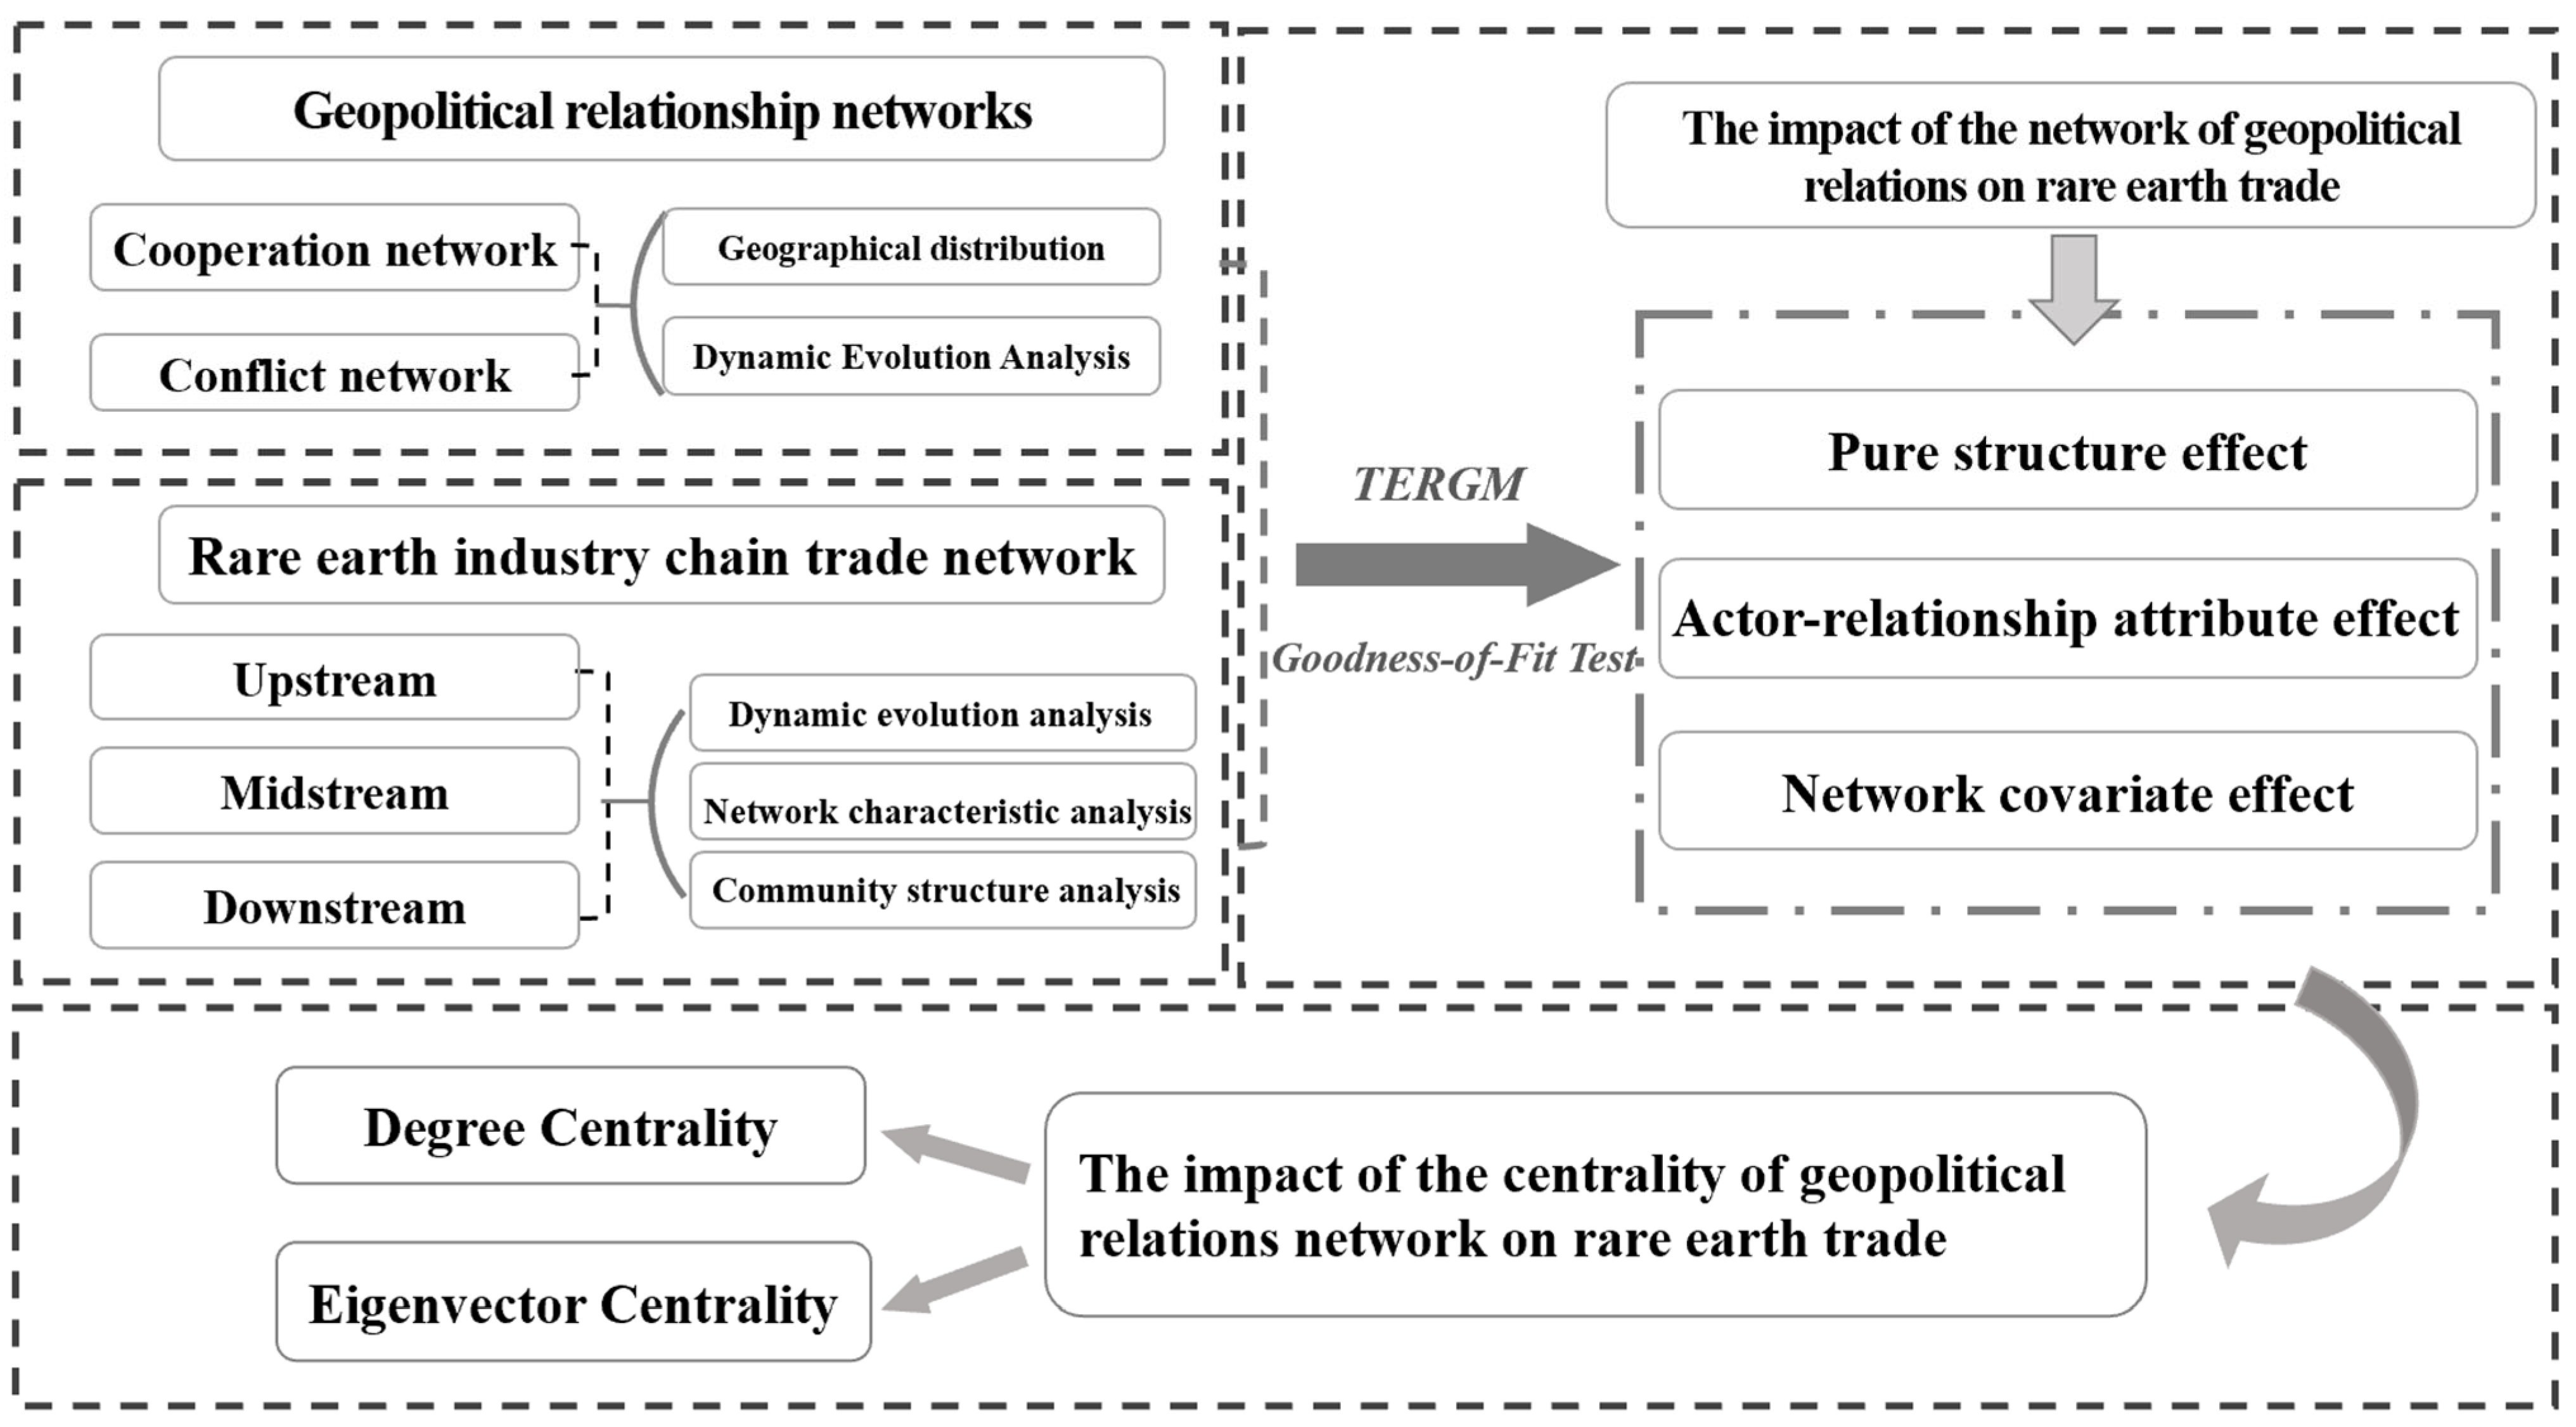
Figure 1. Conceptual framework.
Sustainability 17 04881 g001
Figure 2. Theoretical framework of the impact of geopolitical relations on the rare earth trade.
Sustainability 17 04881 g002
Figure 3. The intensity of cooperation in the network of geopolitical relations among countries.
Sustainability 17 04881 g003
Figure 4. The intensity of conflict in the network of geopolitical relations among countries.
Sustainability 17 04881 g004
Figure 5. Ranking of centrality metrics in the global cooperation network from 2001 to 2023.
Sustainability 17 04881 g005
Figure 6. Ranking of centrality metrics in the global conflict network from 2001 to 2023.
Sustainability 17 04881 g006
Figure 7. The network diagram of the rare earth trade dependency network in 2001.
Sustainability 17 04881 g007
Figure 8. The network diagram of the rare earth trade dependency network in 2023.
Sustainability 17 04881 g008
Figure 9. The evolution of the rare earth trade level from 2001 to 2023.
Sustainability 17 04881 g009
Figure 10. International flows of the global rare earth trade in 2001.
Sustainability 17 04881 g010
Figure 11. International flows of the global rare earth trade in 2023.
Sustainability 17 04881 g011
Figure 12. Evolution of the geographical distribution of the rare earth trade in 2001.
Sustainability 17 04881 g012
Figure 13. Evolution of the geographical distribution of the rare earth trade in 2023.
Sustainability 17 04881 g013
Table 1. The main rare earth product categories and their HS codes.
IndustrialCategoriesHS Code
UpstreamRare Earth OresHS253090
MidstreamRare Earth Metals and Their CompoundsHS280530
HS284690
HS284610
DownstreamRare Earth Permanent MagnetsHS850511
Table 2. Variables in a TERGM.
ClassificationVariableSymbolInterpretation
Pure Structure effectEdge countEdgesBasic directed network relationships, constant terms in the model.
Reciprocity structureMutualBilateral reciprocal trade relationships established between node countries.
Geometrically weighted
in-degree distribution
GwidegDistribution trends of trade connections received by economic entities from multiple economies.
Geometrically weighted
out-degree distribution
GwodegDistribution trends of trade connections sent by economic entities to multiple economies.
Geometrically weighted
edgewise shared partnerships
GwespThe possibility of two countries forming a new trade network group through a third country.
Geometrically weighted
dyadwise shared partnerships
GwdspThe diversity of trade relationship transmission paths between two countries.
Delayed reciprocityDelrecipWhether the formation of a unidirectional trade relationship between a pair of economies in period t − 1 will lead to a reciprocal trade relationship in period t.
StabilityStabilityThe persistence of connection relationships in the overall network structure from period t − 1 to t.
Capturing temporal trend effectsTimecovAnalyzing the temporal trends in the formation of edges.
Actor–relationship
attribute effects
Logarithmic GDP of node countriesNodecov.lnGDPThe propensity of countries with certain economic, cooperation, and conflictual characteristics to embrace trade dependency relationships.
Sender attributesNodeicov.coop
Nodeicov.conf
Receiver attributesNodeocov.coop
Nodeocov.conf
The propensity of countries with certain economic, cooperation, and conflictual characteristics to develop trade dependency relationships.
Network covariate effectsCooperation networkEdgecov.coopThe impact of cooperation networks, conflict networks, Geographical distances, common languages, and colonial relationships on the formation of a rare earth trade dependency network.
Conflict networkEdgecov.conf
Geographic distance networkEdgecov.dist
Common language networkEdgecov.lang
Colonial relationship networkEdgecov.colo
Table 3. The characteristics of the geopolitical relations network from 2001 to 2023.
Network
Indicator
YearNodesEdgesDensityAverage Path LengthNetwork DiameterClustering CoefficientAverage DegreeMutual
Cooperation
network
200120041390.1041.9350.57520.6950.89
200820244290.1091.90840.57521.9260.86
201520768650.1611.83820.60833.1640.88
202320764040.1501.86340.58430.9370.87
Conflict
network
20011809890.0312.06350.5225.4940.50
200819212810.0352.01340.5466.6720.62
201520422100.0531.97040.54310.8330.63
202319618790.0491.97140.5669.5870.62
Table 4. The top 3 countries by the number of trade partners and total trade intensity.
2001200820152023
The top three in
terms of the number of trading partners
UpstreamUSAUSAAustraliaChina
JapanFranceChinaJapan
FranceUnited KingdomSpainGerman
MidstreamJapanJapanJapanChina
USAThailandUSAJapan
FranceUSAMalaysiaUSA
DownstreamChinaUSAUSAGermany
SingaporeChinaJapanJapan
USAThailandChinaUSA
The top three in terms of trade intensityUpstreamJapanSpainJapanSpain
GermanyGermanyPolandUSA
ChinaChinaGermanyGermany
MidstreamFranceChinaChinaFrance
USAFranceGermanyChina
ChinaGermanyAustriaAustria
DownstreamGermanyChinaChinaChina
ChinaGermanyUSAGermany
United KingdomUnited KingdomAustriaUnited Kingdom
Table 5. TERGM results for the trade network of the rare earth industry.
VariableUpstreamMidstreamDownstream
Model 1Model 2Model 3Model 4Model 5Model 6Model 7Model 8Model 9
Pure structure effects
Edges−4.2024 ***
(0.0010)
−3.2978 ***
(0.0010)
−2.2292 ***
(0.0010)
−2.0786 **
(0.0010)
−2.2803 ***
(0.0010)
−1.1611 **
(0.0100)
−2.1266 ***
(0.0010)
−2.7106 ***
(0.0010)
−1.2703 ***
(0.0010)
Mutual −0.3878 ***
(0.0010)
−0.1786
(1.0000)
−0.8414 ***
(0.0010)
−0.2050
(1.0000)
−0.2164 *
(0.0500)
−0.0798
(1.0000)
Gwideg −1.9076 ***
(0.0010)
−2.4481 ***
(0.0010)
−5.8936 ***
(0.0010)
−1.6849 ***
(0.0010)
−5.4733 ***
(0.0010)
−4.6086 ***
(0.0010)
Gwodeg −2.3715 ***
(0.0010)
−2.3725
(0.0010)
−0.5672 ***
(0.0010)
−4.6601 ***
(0.0010)
−1.9248 ***
(0.0010)
−3.2345 ***
(0.0010)
Gwesp 1.0451 ***
(0.0010)
0.8008 ***
(0.0010)
0.9496 ***
(0.0010)
0.4000 ***
(0.0010)
1.1117 ***
(0.0010)
0.07768 ***
(0.0010)
Gwdsp −0.2767 ***
(0.0010)
−0.1892 ***
(0.0010)
−0.5048 ***
(0.0010)
−0.2109 ***
(0.0010)
−0.4584 ***
(0.0010)
−0.3296 ***
(0.0010)
Delrecip −0.2630 **
(0.0100)
−0.4154
(0.1000)
−0.2297 **
(0.0100)
Memory.stability 1.3742 ***
(0.0010)
1.8165 ***
(0.0010)
1.2877 ***
(0.0010)
Timecov 0.0073 **
(0.0100)
−0.0148 **
(0.0100)
0.0081 **
(0.0100)
Actor–relationship attribute effects
Nodecov.lnGDP0.0047
(1.0000)
−0.0157 ***
(0.0010)
−0.0113 *
(0.1000)
−0.0510 ***
(0.0010)
−0.0316 ***
(0.0010)
−0.0161 *
(0.0500)
−0.0307 ***
(0.0010)
−0.0222 ***
(0.0010)
−0.0240 ***
(0.0010)
Nodeicov.coop0.0003 ***
(0.0010)
0.0001
(1.000)
0.0000 **
(0.0100)
0.0001 ***
(0.0010)
0.0001 ***
(0.0010)
0.0001
(1.0000)
0.0001 ***
(0.0010)
0.0001 ***
(0.0010)
0.0000 ***
(0.0010)
Nodeicov.conf−0.0002 **
(0.0100)
−0.0000
(1.000)
−0.0002 **
(0.0100)
−0.0003 ***
(0.0010)
−0.0003 ***
(0.0010)
−0.0000
(1.0000)
−0.0002 ***
(0.0010)
−0.0001 **
(0.0100)
−0.0001
(0.1000)
Nodeocov.coop0.0000 **
(0.0100)
0.0000
(1.000)
0.0000
(1.0000)
0.0001 ***
(0.0010)
0.0000 **
(0.0100)
0.0000
(0.1000)
0.0000 **
(0.0100)
0.0001
(0.1000)
0.0000
(1.0000)
Nodeocov.conf−0.0006 ***
(0.0010)
−0.0003 ***
(0.0010)
−0.0002
(0.1000)
−0.0021 ***
(0.0010)
0.0007 ***
(0.0010)
−0.0004 **
(0.0100)
−0.0005 ***
(0.0010)
−0.0002 ***
(0.0010)
−0.0001
(0.1000)
Network covariate effects
Edgecov.coop2.0092 ***
(0.0010)
1.3294 ***
(0.0010)
1.0412 ***
(0.0010)
2.2330 ***
(0.0010)
1.4582 ***
(0.0010)
1.0472 ***
(0.0010)
2.5914 ***
(0.0010)
1.5911 ***
(0.0010)
1.1471 ***
(0.0010)
Edgecov.conf−0.0736 **
(0.0100)
−0.0022
(1.000)
−0.0232
(1.0000)
−0.2107 **
(0.0100)
−0.1606 *
(0.0500)
−0.0062
(1.0000)
−0.0507
(1.0000)
−0.0816
(1.0000)
−0.0174
(1.0000)
Edgecov.dist0.5446 ***
(0.0010)
0.5704 ***
(0.0010)
0.3374 ***
(0.0010)
0.0165
(1.0000)
0.0982
(1.0000)
0.0201
(1.0000)
0.0642
(1.0000)
0.1149
(1.0000)
0.0569
(1.0000)
Edgecov.lang−0.1656 **
(0.0100)
−0.1300 ***
(0.0010)
−0.0522
(1.0000)
0.1540 *
(0.0500)
0.1875 ***
(0.0010)
0.0404
(1.0000)
0.1902 ***
(0.0010)
0.2172 ***
(0.0010)
0.1467 **
(0.0100)
Edgecov.colo0.0342
(1.0000)
0.0216
(1.000)
−0.0091
(1.0000)
0.1724 ***
(0.0010)
0.0326
(1.0000)
−0.0073
(1.0000)
0.1039 ***
(0.0010)
0.0585 *
(0.0500)
0.0092
(1.0000)
Notes: *, **, and *** denote significance at the 10%, 5%, and 1% levels, respectively; the values in parentheses denote the standard error.
Table 6. Results of the geopolitical impact under the degree centrality framework.
VariableUpstreamMidstreamDownstream
Model 10Model 11Model 12Model 13Model 14Model 15
Pure structure effects
Edges−4.6097 ***
(0.0010)
−4.0963 ***
(0.0010)
−1.8098 ***
(0.0010)
−3.1918 ***
(0.0010)
−2.6942 ***
(0.0010)
−3.1994 ***
(0.0010)
Mutual−0.9720 ***
(0.0010)
−0.8568 ***
(0.0010)
−0.6105 ***
(0.0010)
−1.9495 ***
(0.0010)
−0.2606 ***
(0.0010)
−1.9543 ***
(0.0010)
Gwesp1.8373 ***
(0.0010)
1.5850 ***
(0.0010)
1.1194 ***
(0.0010)
1.8774 ***
(0.0010)
1.5900 ***
(0.0010)
1.8766 ***
(0.0010)
Gwdsp−0.2982 ***
(0.0010)
−0.2766 ***
(0.0010)
−0.3566 ***
(0.0010)
−0.6063 ***
(0.0010)
−0.4580 ***
(0.0010)
−0.6055 ***
(0.0010)
Delrecip0.1110 *
(0.0500)
−0.0418
(1.0000)
−0.5832 ***
(0.0010)
−0.4943 ***
(0.0010)
−0.5015 ***
(0.0010)
−0.4939 ***
(0.0010)
Stability1.3771 ***
(0.0010)
1.3745 ***
(0.0010)
2.2673 **
(0.0100)
2.0324 ***
(0.0010)
1.5327 ***
(0.0010)
1.8185 ***
(0.0010)
Actor–relationship attribute effects
Nodecov.lnGDP0.0000
(1.0000)
−0.0139 ***
(0.0010)
−0.0191 ***
(0.0500)
−0.0408 ***
(0.0010)
−0.0079.
(0.1000)
−0.0407 ***
(0.0010)
Nodecov.coop0.0000 ***
(0.0010)
−0.0000 ***
(0.0010)
0.0000 ***
(0.0010)
0.0000 ***
(0.0010)
0.0000 ***
(0.0010)
0.0000 ***
(0.0010)
Nodecov.confl−0.0005 **
(0.0100)
−0.0001 *
(0.0500)
−0.0003 ***
(0.0010)
−0.0000
(1.0000)
−0.0001 **
(0.0100)
−0.0000
(1.0000)
Network covariate effects
Edgecov.dist0.6610 ***
(0.0010)
0.5473 ***
(0.0010)
0.1545
(1.0000)
0.1109
(1.0000)
0.1186
(1.0000)
0.1094
(1.0000)
Edgecov.lang−0.1720 ***
(0.0010)
−0.1529 ***
(0.0100)
0.0161
(1.0000)
0.1034
(0.1000)
0.0569
(1.0000)
0.1058
(0.1000)
Edgecov.colo0.0711 *
(0.0500)
0.0039
(1.0000)
0.0075
(1.0000)
0.0269
(1.0000)
0.0482
(1.0000)
0.0257
(1.0000)
Edgecov.coop 1.1698 ***
(0.0010)
1.4569 ***
(0.0010)
1.2099 ***
(0.0010)
Edgecov.conf −0.0262 ***
(0.0010)
−0.0488 ***
(0.0010)
−0.0165 ***
(0.0010)
Notes: *, **, and *** denote significance at the 10%, 5%, and 1% levels, respectively; the values in parentheses denote the standard error.
Table 7. Results of the geopolitical impact under the eigenvector centrality framework.
VariableUpstreamMidstreamDownstream
Model 16Model 17Model 18Model 19Model 20Model 21
Pure structure effects
Edges−3.2030 ***
(0.0010)
−2.9509 ***
(0.0010)
−1.8167 ***
(0.0010)
−1.3736 **
(0.0500)
−2.6881 ***
(0.0010)
−2.2160 ***
(0.0010)
Mutual−0.4538 ***
(0.0010)
−0.4087 **
(0.0100)
−0.6000 *
(0.0100)
−0.5708 *
(0.0100)
−0.2702 *
(0.0100)
−0.2771 *
(0.0100)
Gwesp1.4016 ***
(0.0010)
1.2762 ***
(0.0010)
1.1233 ***
(0.0010)
0.9775 ***
(0.0010)
1.5882 ***
(0.0010)
1.4673 ***
(0.0010)
Gwdsp−0.2540 ***
(0.0010)
−0.2172 ***
(0.0010)
−0.3560 ***
(0.0010)
−0.3501 ***
(0.0010)
−0.4582 ***
(0.0010)
−0.4369 ***
(0.0010)
Delrecip−0.3892 ***
(0.0010)
−0.3510 ***
(0.0010)
−0.6104 **
(0.0500)
−0.5075 *
(0.1000)
−0.4983 ***
(0.0010)
−0.3996 ***
(0.0010)
Stability1.5685 ***
(0.0010)
1.4229 ***
(0.0010)
2.2661 ***
(0.0010)
2.0728 ***
(0.0010)
1.5352 ***
(0.0010)
1.3707 ***
(0.0010)
Actor–relationship attribute effects
Nodecov.lnGDP0.0020
(1.0000)
−0.0093 *
(0.0100)
−0.0187 *
(0.0100)
−0.0369 ***
(0.0010)
−0.0079.
(0.1000)
−0.0232 ***
(0.0010)
Nodecov.coop1.0267 ***
(0.0010)
1.7760 ***
(0.0010)
1.8288 ***
(0.0010)
1.7337 ***
(0.0010)
1.2276 ***
(0.0010)
1.3437 ***
(0.0010)
Nodecov.confl−1.4733 ***
(0.0010)
−1.3238 ***
(0.0010)
−0.7687 ***
(0.0010)
−0.6940 ***
(0.0010)
−1.3764 ***
(0.0010)
−1.3495 ***
(0.0010)
Network covariate effects
Edgecov.dist0.3725 ***
(0.0010)
0.3201 ***
(0.0010)
0.1558
(1.0000)
−0.0228
(1.0000)
0.1109
(1.0000)
0.0077
(1.0000)
Edgecov.lang−0.0642
(1.0000)
−0.0762
(1.0000)
0.0211
(1.0000)
0.0035
(1.0000)
0.0603
(1.0000)
0.1225 *
(0.0100)
Edgecov.colo0.0094
(1.0000)
−0.0302
(1.0000)
0.0045
(1.0000)
−0.0640
(1.0000)
0.0586
(1.0000)
−0.0043
(1.0000)
Edgecov.coop 1.7465 ***
(0.0010)
1.8514 ***
(0.0010)
1.8516 ***
(0.0010)
Edgecov.conf −0.0914
(0.1000)
−0.2889 ***
(0.0010)
−0.2884 ***
(0.0010)
Notes: *, **, and *** denote significance at the 10%, 5%, and 1% levels, respectively; the values in parentheses denote the standard error.
Disclaimer/Publisher’s Note: The statements, opinions and data contained in all publications are solely those of the individual author(s) and contributor(s) and not of MDPI and/or the editor(s). MDPI and/or the editor(s) disclaim responsibility for any injury to people or property resulting from any ideas, methods, instructions or products referred to in the content.