Article

Techno-Economic Analysis of Combined Onshore Ocean Thermal Energy Conversion Technology and Seawater Air Conditioning in Small Island Developing States

1
Graduate School of Energy Science, Kyoto University, Kyoto 606-8501, Japan
2
Open Innovation Institute, Kyoto University, Kyoto 606-8501, Japan
*
Author to whom correspondence should be addressed.
Sustainability 2025, 17(10), 4724; https://doi.org/10.3390/su17104724
Submission received: 20 April 2025 / Revised: 17 May 2025 / Accepted: 19 May 2025 / Published: 21 May 2025

Abstract

:
Small Island Developing States (SIDS) face energy security challenges due to reliance on imported fossil fuels and limited land for renewable energy. This study evaluates the techno-economic feasibility of integrating Ocean Thermal Energy Conversion (OTEC) and Seawater Air Conditioning (SWAC) systems as a sustainable solution. The research focuses on (1) developing a scalable onshore OTEC-SWAC system and assessing feasibility across 32 SIDS using 20 years of oceanic and atmospheric data, (2) analyzing key system parameters such as pipeline length, pump sizing, and cooling requirements and their effect on capital cost, and (3) developing a scalable cost estimation model for Levelized Cost of Energy (LCOE) predictions. The techno-economic analysis reveals that 30 of the 32 SIDS are technically feasible for OTEC power generation with a temperature gradient of 20 °C. The proposed system is economically feasible in 23 of the SIDS with a calculated average LCOE of 0.16 USD/kWh, which is 67% lower than the diesel LCOE, which is on average 0.46 USD/kWh, making it a cost-competitive alternative. The developed reduced form of the model enables scalable LCOE calculations based on pipeline length and ocean temperature differentials, aiding policymakers in decision-making. By reducing fossil fuel dependency and supporting green tourism, this study provides actionable insights for sustainable energy adoption in SIDS.

1. Introduction

Small Island Developing States (SIDS) face unique challenges in meeting the United Nations Sustainable Development Goals (SDGs), a set of 17 objectives adopted by member states to guide global action imperative to achieve decarbonization and energy access into concrete policy mandates and financial incentives in renewable energy markets. In particular, SIDS struggle with climate change (SDG 13) and energy security (SDG 7) due to their ecological fragility, geographical isolation, and limited capacity for industries to achieve economies of scale [1]. These factors increase transportation and infrastructure costs, intensifying dependence on imported fossil fuels to meet local energy demands [2]. This reliance, coupled with climate change impacts, strains their economies, ecosystems, and energy infrastructure [3]. Rising sea levels and intensified weather events threaten coastlines and tourism-driven economies, heightening the urgency for resilient, sustainable energy solutions [4].
While tourism provides the backbone of the economy, there is a significant trade-off between SDG 8 (economic growth) [5] and SDG 7 (affordable energy), as energy demand fluctuates with tourism. Transitioning to local and cleaner renewable energy is essential not only for mitigating environmental impacts but also for reducing economic vulnerability and enhancing energy self-sufficiency [2], thereby achieving the targets of SDG 7. Ocean Thermal Energy Conversion (OTEC) and Seawater Air Conditioning (SWAC) offer a promising pathway, particularly for island nations.
OTEC utilizes the natural thermal gradient between warm surface water and cold deep-ocean water to generate continuous renewable electricity [6], offering a global potential estimated at 10.2 TW [7,8]. However, widespread adoption remains limited due to technical and financial barriers, including the need for high volumes of seawater [9], significant capital investment, and perceived investment risk [10]. This study focuses on improving the economic viability of the OTEC technology and provides a geographically dependent economic viewpoint.
Standalone OTEC research has made incremental progress through demonstration facilities reaching up to 1 MW offshore barges [11] and two onshore pilot plants of 100 kW in Hawaii and Japan [12]. Most techno-economic assessments to date have focused on large offshore OTEC systems [13,14,15], while onshore designs—despite offering infrastructure simplification and operational advantages—are often constrained to small capacities (<1 MW) [16,17]. The small temperature difference between the deep-ocean water and surface ocean reduces OTEC cycle efficiency, prompting research into improving the plant’s thermal cycle [18,19] and resulting in advanced thermodynamic cycles, such as the Kalina cycle [20], Uehara cycle [21], and hybrid cycles, that utilize dual-pressure Rankine cycles [22]. Research has also explored increasing the temperature differential by integrating solar [23] and waste heat recovery [24] for improving OTEC efficiency.
Additionally, hybrid systems that utilize OTEC byproducts have gained traction. For instance, deep-ocean water (DOW) can be used for desalination [25] and SWAC [26], both of which enhance system efficiency and lower the effective cost of energy, as demonstrated in a Maldives case study [27]. SWAC—already commercially deployed in multiple regions, including Hawaii, Bora Bora, and French Polynesia [28]—offers an especially viable application of DOW for space cooling, a major energy use in tourism. While substantial research exists on standalone OTEC and SWAC systems, the techno-economic viability of combined OTEC–SWAC systems remains underexplored, with studies citing SWAC as a conceptual cost offset for OTEC without presenting detailed thermo-economic models or quantifying savings [29,30,31]. These combined systems align with broader efforts to improve hybrid OTEC configurations [30] and enhance profitability by leveraging multiple revenue streams from DOW applications [25]. Rigorous modeling of such multi-product schemes therefore remains a critical research gap.
Addressing this knowledge gap of large, scalable onshore OTEC plants with combined SWAC systems is important, as onshore OTEC systems provide the benefit of simplified infrastructure development by avoiding complex offshore platforms and mooring of their offshore counterparts. It also enables easier maintenance and increased reliability with less exposure to corrosive environments. Moreover, onshore OTEC systems are less vulnerable to extreme climates, such as hurricanes, giving increased resilience compared to offshore plants. In a sense, this technology offers the potential to unlock the use of a seemingly renewable resource (ocean water) for energy generation that directly aids in sustainable energy generation (SDG 7) and provides a climate-resilient design (SDG 13).
However, conventionally onshore plants are seen to be too expensive due to the long cold water pipe requirements [32], and the implementation of large-scale onshore systems introduces new questions, especially for SIDS:
What are the technical design requirements for implementing OTEC-SWAC systems in different SIDS locations? How do location-specific parameters affect the technical design, and what economic impact do they have? Are all SIDS technically and economically compatible with OTEC technology?
These questions have become increasingly relevant as international institutions advocate ocean-based solutions in SIDS. As custodians of vast oceanic territories within their exclusive economic zones reaching over 30 million km2 [33], SIDS are well-positioned to leverage these technologies. The SIDS Lighthouses Initiative by IRENA has actively promoted OTEC, featuring case studies from pilot systems in Martinique, Réunion, and the Maldives [34]. From COP21 to COP28, SIDS delegations have repeatedly emphasized the need to include ocean-based climate solutions—such as OTEC—as part of the global climate mitigation strategy [35] to achieve targets of SDG 13.
In response to these needs and opportunities, this study aims to evaluate the techno-economic feasibility of OTEC-SWAC systems in SIDS, addressing both their technical performance and economic viability through comprehensive feasibility analysis and cost modeling using location-specific parameters. Specifically, this research:
  • Develops a scalable onshore OTEC-SWAC system and assesses the feasibility of system integration across 32 SIDS using 20 years of region-specific data, identifying their potential for renewable energy generation and sustainable tourism.
  • Analyzes key system parameters, such as pipeline length, pump sizing, and cooling requirements, and their influence on Levelized Cost of Energy (LCOE).
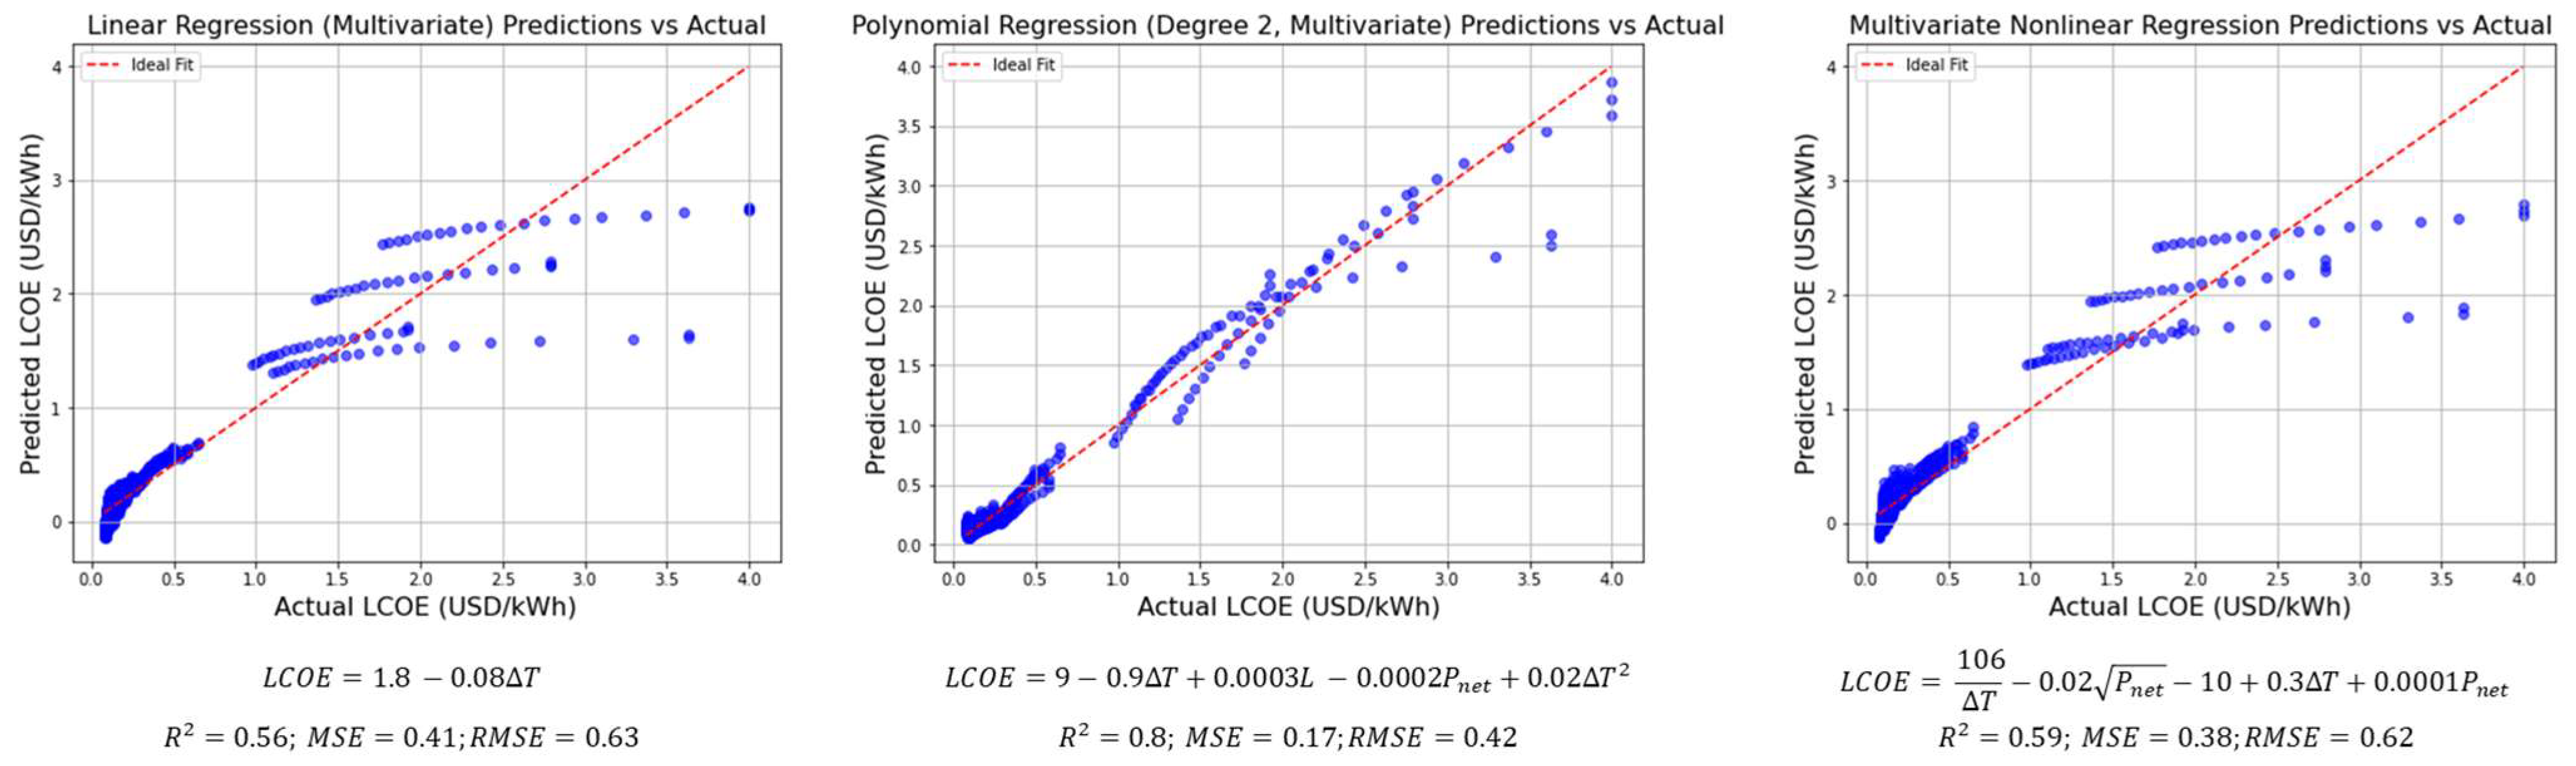
  • Develops a reduced form of the cost estimation model, enabling adaptable cost predictions based on location-specific factors.
This addresses an important knowledge gap in the literature, as scalable onshore OTEC systems are yet to be studied, and the use of onshore systems allows for easy incorporation of deep-ocean water applications, creating additional revenue, which is crucial for mitigating financial risks attached to OTEC systems. The result from this study provides actionable insights for policymakers, engineers, and developers in project design, scaling, and site selection of onshore OTEC-SWAC systems.

2. Literature Review

2.1. OTEC Technology and Technical Performance

OTEC is a renewable energy technology that harnesses the thermal gradient between surface ocean water and deep-ocean water to generate electricity. It is estimated to be viable over 100 million km2 of tropical oceans, requiring a minimum temperature differential of 20 °C to operate efficiently [16]. OTEC systems are broadly classified into three types: closed-cycle, open-cycle, and hybrid-cycle, each offering distinct operational advantages.
In a closed-cycle OTEC system, a low-boiling-point working fluid such as ammonia, propane, or Freon-type refrigerants is vaporized using the heat from surface ocean water. The generated vapor drives a turbine to convert thermal energy into mechanical energy, which is subsequently converted into electrical power. The vapor is then condensed using deep-ocean water and recirculated within the system [36]. In contrast, open-cycle OTEC utilizes seawater itself as the working fluid. Warm surface ocean water is pumped into a low-pressure evaporator where it vaporizes into steam, which then drives a turbine to generate electricity. As an added advantage, this steam is later condensed into fresh water, making open-cycle OTEC particularly attractive for island nations facing potable water shortages. The hybrid-cycle OTEC system combines aspects of both closed- and open-cycle approaches by first evaporating surface ocean water into steam, which then heats a working fluid in a secondary closed loop, improving overall energy efficiency. Recent hybrid concepts raise the effective temperature lift—and boost net efficiency by up to 50%—either by coupling solar-thermal collectors to the evaporator [23] or by optimally cascading industrial waste heat into the Rankine cycle at optimum pressure levels of 11 bar [24], while parallel studies redirect OTEC by-products into high-value applications such as aquaculture and seawater-cooled agriculture [25]. While the theoretical feasibility of OTEC has long been established, its commercial deployment remains limited due to high capital costs, technological challenges, and economic risks. These barriers have impeded widespread adoption despite significant advancements in system design and efficiency improvements.

2.2. OTEC Cost Drivers and Economic Performance

The financial viability of OTEC plants is influenced by multiple factors, including plant location, plant type (onshore or offshore), plant size, and technological innovations. A major cost consideration is the installation and maintenance of cold-water intake pipes, which must extend between 800 and 1000 m in depth with diameters reaching up to 40 m. These pipes can account for nearly 50% of the total capital cost of an onshore OTEC plant, posing a significant economic challenge for onshore facilities [37]. Offshore OTEC plants, while eliminating the need for long intake pipes, introduce additional complexities related to platform motion, hydrodynamic coupling effects, and structural stability in dynamic ocean environments. The cost of floating platforms is substantial, but recent studies suggest that fixed offshore structures could help mitigate expenses [38].
Beyond infrastructure costs, seawater temperature differential (ΔT) plays a crucial role in determining OTEC’s cost efficiency. Locations with higher ΔT values yield greater power output, with increases of 4 °C increasing the net power output 1.51 times, thereby reducing the levelized cost of electricity (LCOE), which has been estimated to range between 0.15 and 0.46 USD/kWh depending on site conditions [32,39]. Additionally, several financial models suggest that scaling up OTEC operations and improving technological learning curves could drive substantial cost reductions. In the case of Indonesia, for instance, investment projections indicate that a large-scale OTEC deployment could achieve a net present value of up to USD 23 billion for a 45 GW plant, making it a potentially profitable venture with the right financial structuring [40]. Table 1 summarizes the estimated capital costs for different OTEC plant configurations. These values illustrate the cost variations depending on plant size, system type, and technology choices, particularly in terms of heat exchangers and the inclusion of desalinated water production [32,41]. Installation and assembly expenses further contribute to overall project costs.
Table 1 reveals clear cost hierarchies among the OTEC plant configurations. The closed-cycle plant ship is the most economical as it avoids the large vacuum pumps and low-pressure turbines that raise open-cycle capital costs. Upscaling to 50 MW roughly halves specific capital costs for both cycles by diluting fixed platform, mooring, and installation expenses, bringing the LCOE of the closed-cycle 50 MW OTEC plant to 0.20–0.28 USD/kWh, approaching diesel parity in many SIDS, while 10 MW units remain suited to premium off-grid or hybrid desalination markets. Onshore plants demonstrate the highest cost intensity, dominated by intake piping; their feasibility therefore depends on monetizing DOW byproducts.
To improve the economic feasibility of OTEC, several studies have explored integrating the technology with other industries that benefit from the use of deep-ocean water, such as aquaculture, desalination, and seawater air conditioning (SWAC). This approach allows for shared infrastructure costs and diversified revenue streams, making OTEC projects more financially viable [32]. The concept of integrated ocean ecoparks has been proposed as a strategy to accelerate OTEC commercialization by creating synergies between renewable energy production and resource-efficient industries [31,42]. However, while these studies highlight the potential economic benefits, they primarily rely on qualitative assessments and lack empirical financial evaluations necessary for large-scale investment decision-making. Existing techno-economic analyses of OTEC and deep-ocean water utilization have predominantly focused on power generation and water desalination, as seen in [6,43,44], with low-temperature thermal desalination emerging as the least energy-intensive method [45]. The data-driven approaches used in [46,47] that link high-resolution climate records with coastal geography are directly transferable to onshore OTEC and SWAC technoeconomic analysis.

2.3. OTEC-SWAC Use in SIDS

Tourism-driven SIDS pay some of the world’s highest electricity tariffs, and hotel cooling alone can consume 45–55% of total power use on popular Caribbean and Pacific islands [48], as energy use in hotels and resorts averages between 25 and 284 MJ per guest per night [49]. SWAC systems that draw 5–10 °C deep-ocean water slash that demand by 70–90%, as demonstrated by the 2.4 MW installation at The Brando resort, which cut annual diesel use by 1 GWh [50]. Existing studies of SWAC have currently focused on the coefficient of performance [50] and estimating monthly flow rates through numerical models [51,52]. Pairing SWAC with an onshore OTEC plant converts the same intake pipe into a dual-revenue asset—electricity plus chilled water—raising capacity factor–weighted revenues by 25–40% in recent exergo-economic simulations [53].
In summary, OTEC can provide stable baseload renewable energy generation. However, it faces challenges to commercialization due to high capital costs from long cold-water pipes that need to access deep-ocean water and the lack of large-scale prototypes. Integration with other uses of deep-ocean water can reduce the economic risks and return period, especially for onshore plants. This paper aims to conduct a technoeconomic analysis of combined OTEC-SWAC systems to address the two chief barriers to OTEC commercialization—high capital costs and single-product risk—while delivering SDG-aligned cooling resilience to islands whose hospitality sectors are both carbon intensive and economically vital.

3. Materials and Methods

This study develops a scalable, location-specific model for an onshore OTEC-SWAC system tailored to the energy and cooling demands of tourist hotels in SIDS. The methodology comprises three components: (i) system design and thermodynamic modeling, (ii) site-specific parameterization based on atmospheric, oceanographic, and bathymetric data, and (iii) techno-economic assessment using the LCOE metric.

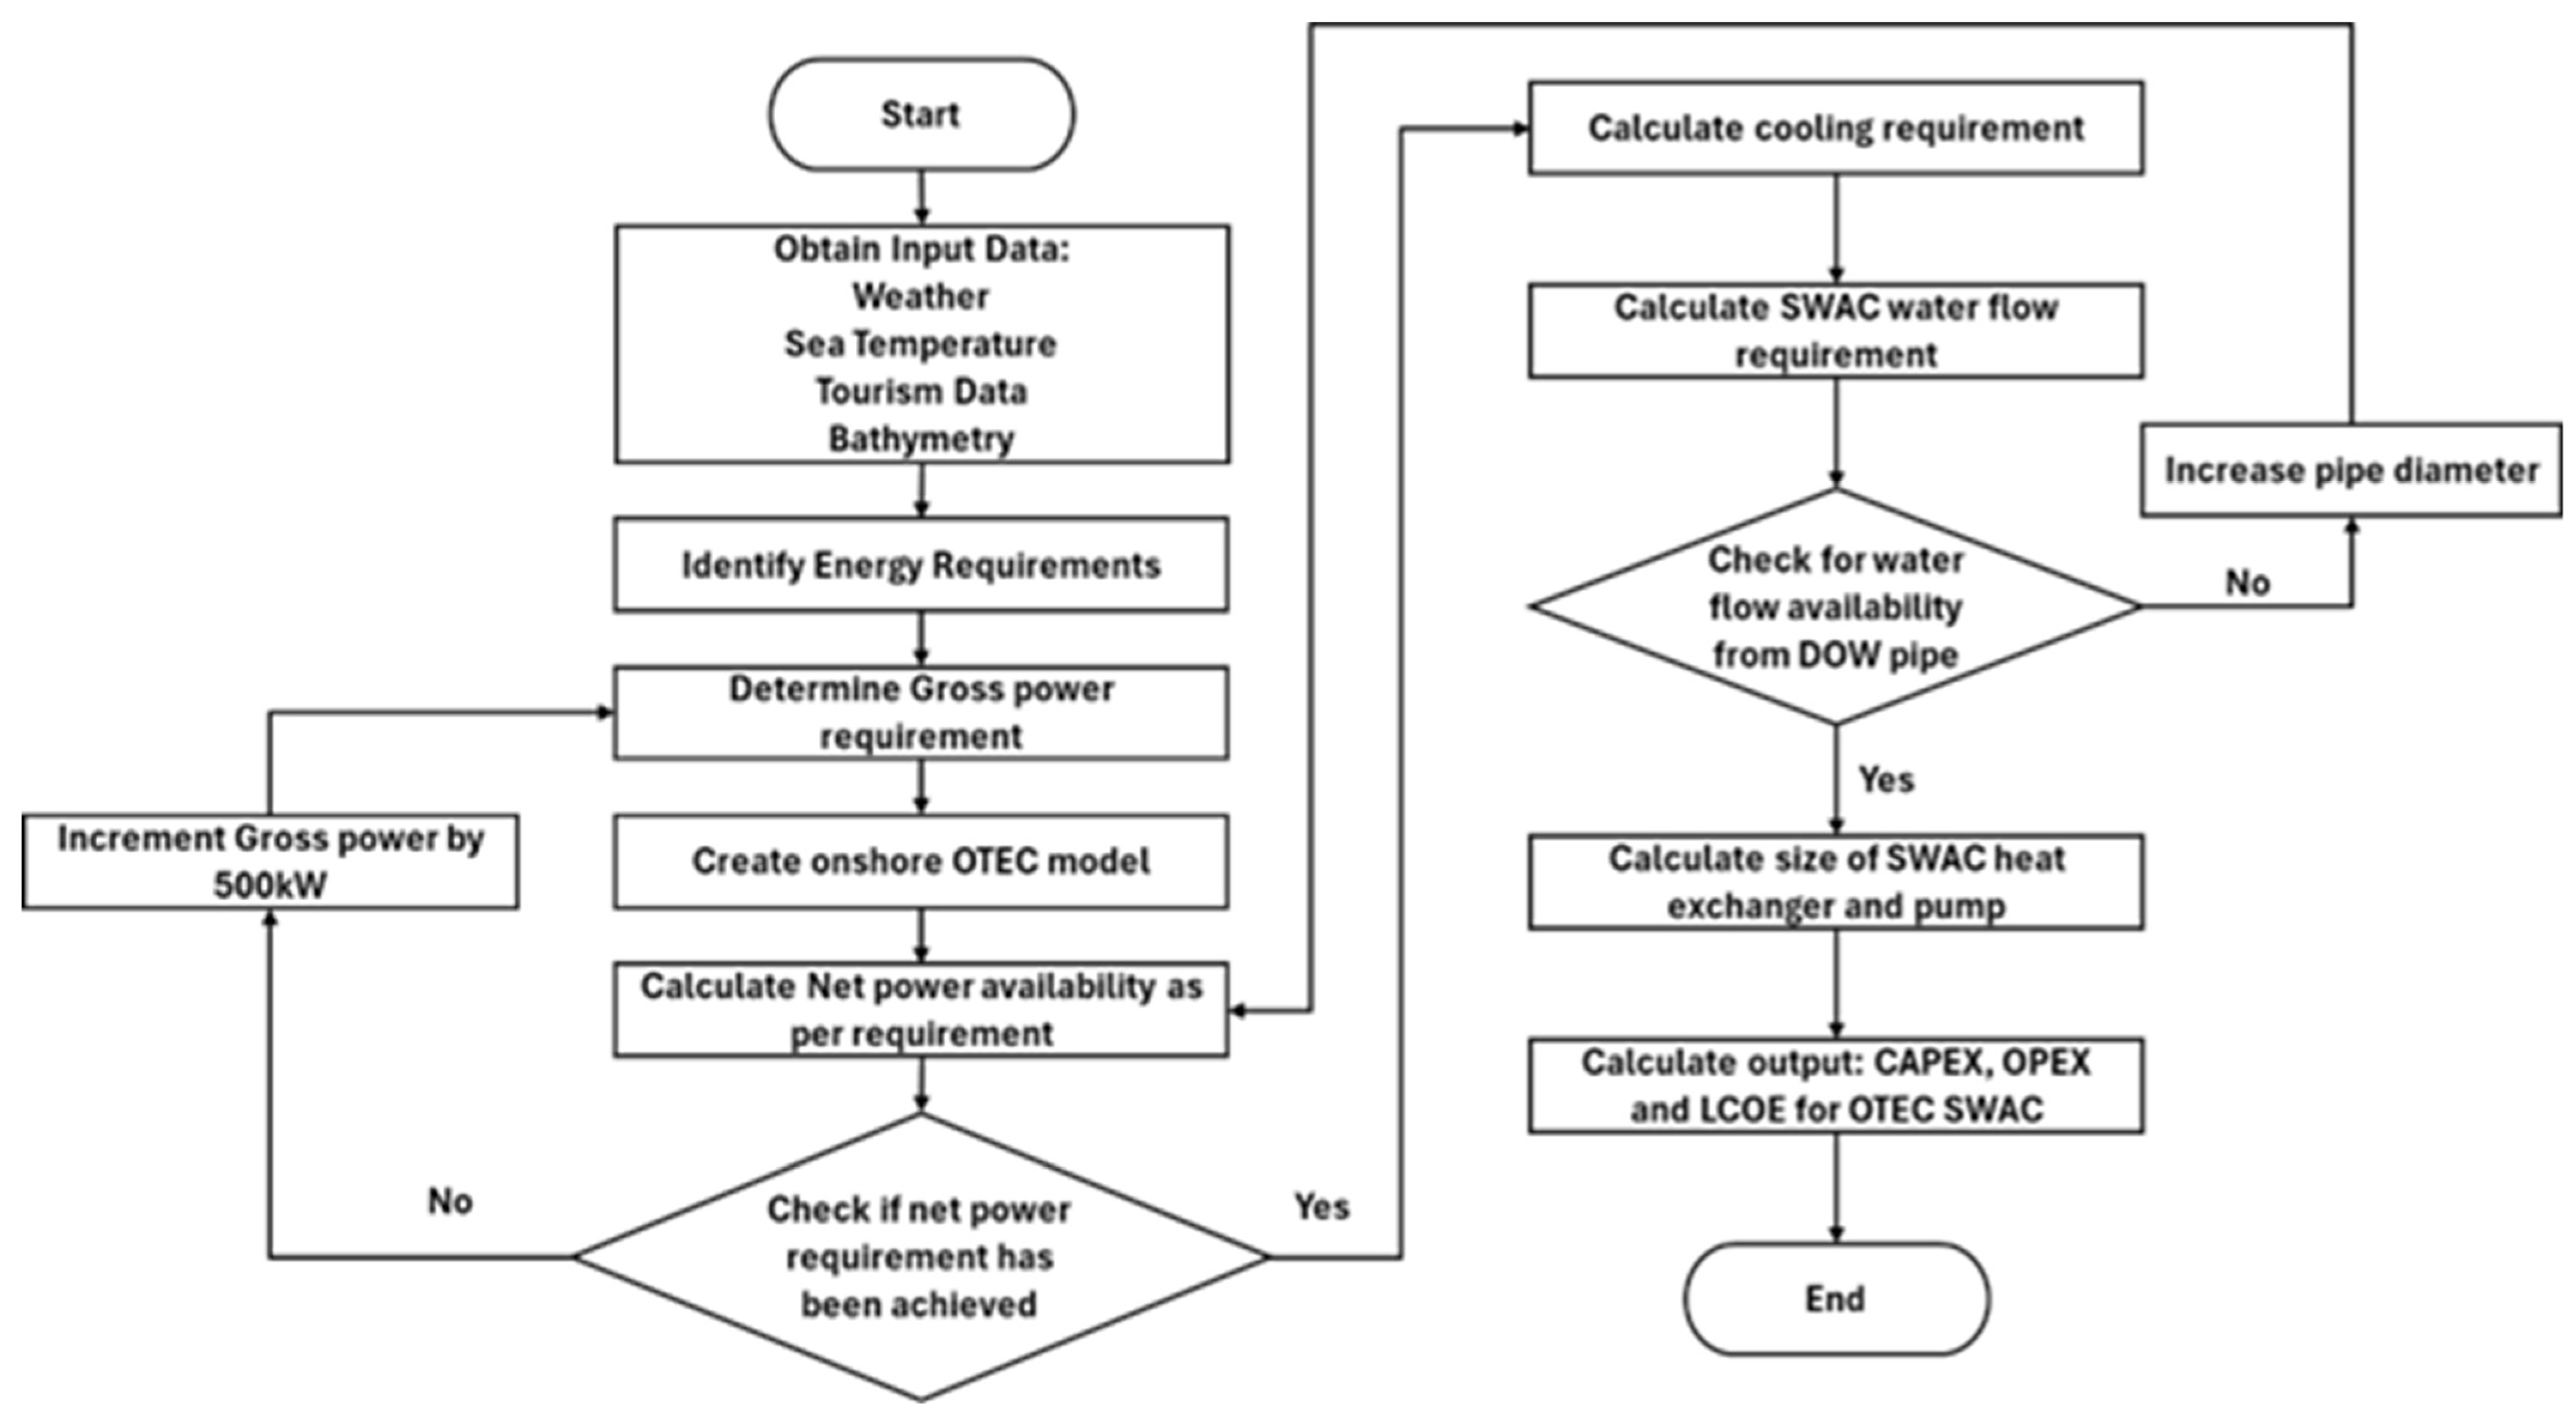
3.1. Onshore OTEC-SWAC System Design

The proposed configuration couples a closed-loop saturated ammonia Rankine cycle for electricity generation with a SWAC system that utilizes post-condenser cold deep-ocean water for space cooling and follows the conceptual design in Figure 1. The model utilizes a saturated closed organic Rankine cycle for the OTEC power generation cycle as used in [54]. The modeled cycle consists of four main parts: the working fluid pump, which pumps the working fluid, ammonia, to the evaporator, where the warm surface ocean water evaporates the ammonia; gaseous ammonia is then passed through the turbine, generating electricity, and then flows to the condenser, where the cold deep-ocean water is used to condense the ammonia; the liquefied ammonia runs through the working fluid pump again to complete the cycle. It is assumed that during each enthalpy and entropy process, complete evaporation and condensation of the working fluid is undertaken, as in the studies [54,55]. Ammonia is chosen as a working fluid due to its favorable thermodynamic efficiencies, reaching 4%, and cost-effectiveness compared to other refrigerants such as Freon [56]. The net power of the OTEC system W t , n e t , O T E C is calculated, as given in [54], written as follows:
W t , n e t , O T E C = W t , t u r b , g r o s s η t u r b , e l η t u r b , m e c h W t , p u m p , N H 3 W t , p u m p , c w W t , p u m p , w w
where W t , t u r b , g r o s s is the turbine gross power, W t , p u m p , N H 3 is the working fluid pump power, W t , p u m p , c w is the cold deep-ocean water pump, W t , p u m p , w w is the warm surface ocean water pump power, η t u r b , m e c h , and η t u r b , e l is the mechanical and electrical efficiency of the turbine. The sizes of these pumps are based on the mass flow of the cold and warm ocean water (as calculated from the equation in Table A1), which subsequently determines the volume of the intake pit.
The onshore OTEC system modeled in the study uses a direct deep-ocean water siphon system as used in OTEC pilot plants in the Natural Energy Natural Energy Laboratory in Hawaii (NELHA) and in Kumejima, Japan. The pipe is laid from 1000 m depth to an intake pit placed 5 m below the low tide sea level to maintain the pressure difference for the siphon effect. The length of the pipeline is determined using the Haversine formula and estimated with the shortest distance to the shore, assuming a 1000 m depth. The flow rate for the pit Q w e l l   c w / w w and the estimated length of the pipe are used to determine the diameter d c w / w w of the siphon pipe from the following equation adapted from the Bernoulli equation.
Q w e l l   c w / w w 2 = π 2 8 C d 2 g h d c w / w w 4 f L p i p e v 2 d c w / w w 3 2
where C d is the discharge coefficient taken at 0.6, g is gravitational acceleration, h is the effective head, f is the friction factor, L p i p e is the length of the pipe, and v the flow speed determined by v = 4 Q / π d c w / w w 2 . This step is crucial, as the cold water pipe is one of the costliest and most technically challenging components of the OTEC plant. Previous studies of the OTEC system suggest pipe diameters of 10 m for large-scale plants [57,58]. Recent innovations in materials such as bimodal HDPE (PE4710) have allowed for pipes with improved crack growth [59], improving the pressure resistance. This, combined with advances in manufacturing, allows for larger pipe diameters of 4 m and above to be used in OTEC applications [32,60]. However, for practicality, this study will assume a maximum diameter of 8 m, with additional pipes added to accommodate additional water requirements.
A heat gain analysis is conducted to estimate the temperature increase resulting from the progressive warming of the outer water surrounding the pipe as it ascends to shallower depths. The pipe is sectionalized into five parts as there is very small temperature change in the seawater below the thermocline [61], and the heat gain is calculated for a high-density polyethylene (HDPE) pipe using the equation below:
M C p T = U 0 A o T o T 1
where U 0 is the overall heat transfer coefficient between the pipe segment and seawater, A o is the outer surface area, T o is the outside temperature, T 1 is the inlet temperature at each section of the pipeline, M is the mass, and C p is the specific heat capacity of deep-ocean water.
The cold, deep-ocean water from the outlet of the OTEC condenser is then used for the SWAC system, facilitating a cascade utilization of the deep-ocean water. The cooling requirement is then estimated using cooling degree days (CDD) and the area of the building. CDD measures the extent to which the atmospheric temperature exceeds a given base temperature over a given period and is widely used in studies for cooling demand measurements [62,63]. The base temperature for cooling requirements is in line with the American Society of Heating, Refrigeration, and Air-Conditioning Engineers’ recommended indoor range of 20–25 °C [64]. The SWAC system’s heat exchanger size A S W A C and cooling water flow rate are then estimated. The equations utilized are as follows:
C o o l i n g   R e q . = 25 × C D D × A r e a s q f t × 1 C O P × 0.000293
A S W A C = C o o l i n g   R e q . T l o g U H X
where C D D = i = 1 n T d i T b i is the average cooling degree days calculated from the daily temperature T d i and the base temperature T b i taken over n number of instances over a period, and COP is the coefficient of performance taken as 13 for SWAC systems [50]. T l o g is log mean temperature and U H X is the heat transfer coefficient of the heat exchanger. In this research, the IUPAC convention is used, which means that heat and work flowing into the system are positive, while heat and work flowing out of the system are negative. The values of the technical parameters used for the OTEC system calculation are obtained from [54], and the SWAC system is given in [59]. The five equations presented in the main text constitute the governing relations for (i) net electrical output of the Rankine cycle, (ii) sizing of the seawater-intake pit, (iii) heat gain experienced by the DOW stream during pipe transit, and (iv) heat transfer across the SWAC heat exchanger. All other auxiliary expressions required by the simulation—e.g., seawater pumping power, fluid-property correlations, and iterative pipe-wall heat-flux balances—are compiled in Appendix A, Table A1. These additional equations accept DOW temperature, surface ocean water (SOW) temperature, ambient air temperature, and pipe length as inputs and supply the intermediate parameters that feed into the four primary relations. To maintain readability, they are excluded from the main text; readers seeking the full mathematical specification of the model should consult Table A1.

3.2. SIDS Specific Parametrization

To evaluate system feasibility in a real-world context, site-specific data were compiled for tourism-intensive regions in SIDS. Areas with significant touristic appeal were first identified to obtain location-dependent data. These areas were determined based on the prevalence of hotels and accommodation, as evidenced by data from prominent hotel booking platforms such as [65,66]. Upon identification of these locales, their respective geographical coordinates were utilized to obtain proximity to oceanic depths of approximately 1000 m by referencing global bathymetry charts sourced from the General Bathymetric Chart of the Oceans (GEBCO) repository [67]. The seawater temperature data are then identified based on these locations using temperature data acquired from the Copernicus Marine Data repository [68]. The atmospheric temperature for measuring the cooling needs is obtained from the National Oceanic and Atmospheric Administration [69], using the nearest weather station to the touristic location.
The number of hotels differs between SIDS due to the difference in tourist arrivals, focus of tourism, and ease of accessibility to the destination. However, to ensure analytical consistency across all SIDS, a standardized model hotel is utilized. The model is defined as 1000 rooms (40 m2 each, accommodating two guests per room) and amenities such as restaurants and fitness centers, covering 20% of the guest room area. This configuration is selected as urban city hotels feature 300–1500 rooms with amenities such as conference halls, restaurants, fitness centers, swimming pools, and retail spaces. Typically, hotels consume energy within the range of 200–400 kWh/m2/year [70], with energy usage per guest ranging between 25 and 284 MJ per night [71]. At full occupancy, with an energy usage rate of 284 MJ per guest per night, total energy consumption is estimated at 568,000 MJ (or 157,790 kWh) per night, equating to a net power demand of 6 MW over an area of 48,000 m2. While demand and hotel sizes may vary by location, this standardized model enables comparable assessments of technical and economic feasibility across regions.
The compiled list of SIDS touristic areas, hotel density, closest 1000 m depth location, average seawater temperature data over the past 20 years, and fuel prices are given in Table 2. These data will be used for the calculation of the deep-ocean water pipe length, the heat gain as the water travels through the pipe, and the technical specifications of a 6 MW onshore OTEC-SWAC plant cooling an area of 48,000 m2.

3.3. Techno-Economic Assessment

Following the site-specific technical analysis, the long-term economic viability of the OTEC-SWAC system is evaluated using the LCOE metric. This approach accounts for all capital, operational, and fuel-related expenses over the system’s lifetime and enables comparison with conventional energy sources. The LCOE is calculated using the following equation, adapted from [39]:
L C O E = C A P E X t o t a l + t O P E X t + F u e l t 1 + r t E l e c t r i c i t y   G e n e r a t e d t 1 + r t
where t is the project lifetime, and r is the discount rate. Total electricity generated throughout the lifetime is based on the capacity factor, O P E X is the operational and maintenance expense, and C A P E X t o t a l is the total capital cost of the plant. For simplicity and modularization of the design, the C A P E X of the OTEC-SWAC system has been reduced to the main components: turbine, pumps, heat exchangers, intake pit, seawater pipelines, and project engineering. Assumptions for each cost element are listed in Table 3.
Existing technoeconomic analyses of large-scale OTEC systems predominantly address offshore configurations [13,72,73,74] and provide scalable cost data for turbines, heat exchangers, and pumps. However, the costs associated with intake pit construction and seawater pipe installation were derived from pilot-scale implementations at NELHA (Hawaii), Kumejima (Japan), and a proposed plant in (India).
At NELHA, the intake system comprises a 1.0 m diameter HDPE pipeline connected to a 10.8 m × 4.3 m × 7.5 m intake pit. The pit was excavated by blasting 30 feet into coastal lava rock, housing pumps beneath a reinforced concrete slab below sea level to protect against wave action. Twin 1.4 m diameter, 152 m long concrete-lined tunnels extend under the reef, enabling trenchless pipe routing to minimize environmental disruption. Beyond the tunnels, the pipeline continues along the seabed, anchored by 180 precast concrete blocks, reaching 915 m depth. The total cost for a single 2.7 km, 1.4 m diameter pipeline was approximately JPY 3.85 billion (USD 30–35 million, circa 2015) [75].
In Kumejima, the intake system uses a wet sump pit (19 m × 24 m, 5 m below low tide level), drawing seawater from two 1.2 m diameter HDPE pipes [76]. The intake structure allows entrained marine organisms to settle, reducing pump clogging. Construction involved open-cut trenching through coral rock and sand, with rock-armored backfilling. The total intake system cost was JPY 8.4 billion (USD 67 million, 2022), including JPY 522 million for intake construction and JPY 1.1 billion for protective revetments, armor blocks, and pipe joint reinforcement [77].
In India, the planned OTEC facility in Kavaratti builds upon the intake design used for its low-temperature thermal desalination (LTTD) plant. The system employs 1000 m long, 400 mm diameter HDPE pipelines reaching 350 m depth, delivering 0.3 m3/s of seawater. Pipes are routed from shore through reef gaps, buried beneath the beach or installed using horizontal boring to protect the shoreline. Due to calm lagoon conditions, no major seawalls were required. The total cost of each 100 m3/day LTTD plant, including equipment, pipelines, and pumps—was approximately INR 1.3 crore (USD 4.1 million) [78].
In summary, the NELHA pipeline cost ~USD 32 million (≈USD 12,000/km), with pipe unit costs around USD 36.70/kg and intake pit costs near USD 5800/m3, including installation and protection. In contrast, Kumejima’s open-cut system totaled ~USD 65.2 million, with shallow water protection accounting for ~USD 15 million. This corresponds to ~USD 48.40/kg for the pipeline and ~USD 4385/m3 for the intake pit. These values serve as a benchmark for onshore OTEC pipe and pit cost estimation.
Table 2. Identified areas, coordinates, and water temperatures. D refers to the depth at which the temperature is measured.
CountryTourism High AreaNo. of HotelsDepth 1000 mTemperature (degC)Oil Price (USD/L) [79]
Source 1 [65]Source 2 [66]latlonD 0 mD 200 mD 400 mD 600 mD 800 mD 1000 m
American SamoaApia2136−13.74−171.7423.818.28.95.44.23.51.27
BahamasNassau9710325.13−77.3622.117.414.110.97.44.91.41
BelizeBelize city253517.69−87.8223.315.59.36.44.53.91.58
BermudaHamilton51032.28−64.7119.215.414.612.79.15.91.27
Cabo VerdePraia2234014.91−23.4620.510.68.77.05.64.91.26
The Cayman IslandsGeorge Town523319.30−81.4223.217.912.78.75.94.31.47
CubaHavana 23723.18−82.3922.413.99.26.44.94.41.10
CuracaoWillemstad38222412.12−69.0422.714.38.86.24.84.11.01
DominicaRoseau682715.28−61.4222.815.810.16.95.14.41.09
Dominican RepublicSanto Domingo42033418.31−69.9122.917.312.18.05.54.40.99
The Federated States of MicronesiaKol onia116.99158.1024.010.87.15.84.63.71.27
FijiNadi10871−17.89177.1622.817.710.65.84.33.41.20
French PolynesiaPapeete10582−17.51−149.5822.918.39.95.44.13.31.27
GuamTumon203013.54144.7223.816.17.75.44.43.61.27
Guinea-BissauBissau6811.86−17.3921.111.08.96.55.04.41.27
GuyanaGeorge Town46278.25−57.8523.111.97.35.74.54.21.20
HaitiPort-au-Prince97218.21−72.3822.818.312.68.35.64.91.24
JamaicaMontego bay27018418.51−77.9723.417.813.49.15.84.31.38
KiribatiSouth Tarawa 21.31172.9624.013.68.05.84.63.81.27
The MaldivesMalé561844.1773.5624.011.69.17.96.85.60.95
The Marshall IslandsMajuro1 7.14171.3723.710.07.25.84.63.81.27
MauritiusPort Louis2710−20.1357.4521.516.511.48.96.24.31.39
Papua New GuineaPort Moresby1522−9.56147.1122.815.910.26.64.93.71.27
Puerto RicoSan Juan35320718.56−66.1022.617.113.69.76.65.10.94
The SeychellesVictoria42379−5.1155.2923.210.98.47.05.95.11.59
The Solomon IslandsHoniara1210−9.21159.7824.315.87.65.34.33.61.27
St. Vincent and the GrenadinesKingstown152713.12−61.2522.914.48.76.24.94.21.27
Timor-LesteDili1711−8.51125.5623.813.57.45.64.54.31.27
Trinidad and TobagoPort of Spain263411.59−61.2123.012.68.05.94.84.10.65
TuvaluFunafuti 2−8.54179.2224.317.97.95.54.43.71.27
The U.S. Virgin IslandsSt. Thomas608318.18−64.9923.017.112.78.55.84.71.27
VanuatuPort-Vila5458−17.88168.1822.517.410.86.04.33.41.27
Table 3. Economic specifications used in calculating the LCOE.
ItemEconomic ValueReference
Turbine capex328 USD/kWgross[13]
Pumps capex1674 USD/kWpump[55]
Seawater pipes capex42.5 USD/kgpipe[75,77]
Seawater intake pit capex6128 USD/m3[75,77]
Heat exchangers capex215 USD/m2[55]
Project engineering capex3113 USD/kWgross[55]
Extra cost3% of total CAPEX[39]
OPEX3% of total CAPEX/year[39]
LCOE calculation
Project lifetime30 years[80]
Discount rate3%[80]
Capacity factor 96%[81]
Fuel consumption0.286 L/kWh[81]
Carbon emission2.8 kg/L[82]
Carbon price130 USD/ton CO2[83]
The calculated capital cost and the LCOE values are compared against the cost of electricity generation from diesel-based systems of equivalent capacity. This comparison enables quantification of the potential economic and environmental benefits of adopting OTEC-SWAC as a renewable alternative for SIDS energy and cooling needs.
The analysis is further extended by simulating the developed model at different capacities, allowing us to obtain a reduced form of the model based on three key location-dependent parameters: the seawater temperature difference, the intake pipe length, and the net power requirement, as explained in the results section.

4. Results

4.1. Technical Analysis of the OTEC-SWAC System

Table 4 summarizes the component sizes required to meet the model hotel load in each SIDS. In nine islands, the cold-water intake pipe is longer than 10 km, with the longest runs in Guyana and, to a lesser extent, Trinidad and Tobago. If these outliers are excluded, the average pipeline length is 3 km—closely matching existing onshore OTEC pilot plants at NELHA, Hawaii (2.7 km), and Kumejima, Japan (2.5 km).
The % increase in heat gain, which was conducted to identify any potential heat gain due to the long pipe lengths, shows a mean temperature increase from 1000 m depth to 5 m depth of 2% (0.07 °C). There is no temperature increase in the first section of pipe; the second to third section has average temperature increases of 0.2% (0.005 °C), 0.5% (0.01 °C), and 0.9% (0.02 °C). There is no evidence that the length of the pipeline itself significantly impacts the percentage increase in temperature, as seen in Guinea-Bissau, Guyana, and the Seychelles, where the pipeline lengths are 39, 74, and 43 km, respectively, having a 2–3% increase in temperature.
The average diameter of the deep-ocean water pipe is 2 m. This is comparable with the 1 m diameter pipe in NELHA used for a 100 kW OTEC plant and the plant in Kumejima supplied with two pipes of diameters 280 mm and 380 mm. Recent estimates show that for a 1 MW OTEC facility, the pipeline size might range from 1.1 to 1.7 m in diameter [32]. The calculated pipe lengths in these onshore plants are much lower than the offshore plants’ pipelines of 10 m for a 100 MW plant [13] and six pipes with an 8 m diameter for a 136 MW plant in Indonesia [54]. This is mainly because the siphon method allows water to flow into the intake pit through atmospheric pressure difference and does not depend on pump power, as in the offshore counterpart. Countries with longer pipe lengths have higher diameter pipes of 3 m, as seen in Bermuda, Guinea-Bissau, Guyana, Puerto Rico, the Seychelles, and Trinidad and Tobago. Bermuda requires an unusually large cold-water pipe diameter of 6 m because the surface-to-deep-ocean-water temperature gradient is only 13 °C (Table 3). This narrow gradient limits the theoretical maximum efficiency to just 3% and the realized net thermal efficiency to 0.09%. To achieve the desired power output under such a weak thermodynamic driving force, the plant must circulate much higher seawater volumes, necessitating a larger-diameter pipe, oversized evaporator and condenser surfaces, and correspondingly higher pump power.
Overall, the diameter of the surface ocean water pipe is smaller than the deep-ocean water pipe, with an average diameter of 1 m resulting from lower mass flows of surface ocean water. The average deep-ocean water pump size is 3 MW, and the average surface ocean water pump is 2 MW, with both Bermuda (40 MW and 30 MW) and Cabo Verde (5 MW and 3 MW) having larger pump sizes due to the small temperature difference in these countries. Cabo Verde has a temperature difference of 16 °C.
The average cooling degree days, which were used for measuring the cooling requirement, differ greatly between the countries due to changes in ambient temperature differences among the locations. It is directly proportional to the cooling requirement. Guinea-Bissau has the lowest cooling requirement, while the Maldives has the highest, and this ultimately affects the SWAC pump and heat exchanger size. The average cooling pump size is 290 kW. This results in a cooling power consumption of 6 W/m2, much lower than the 100–150 W/m2 in conventional cooling methods [84].

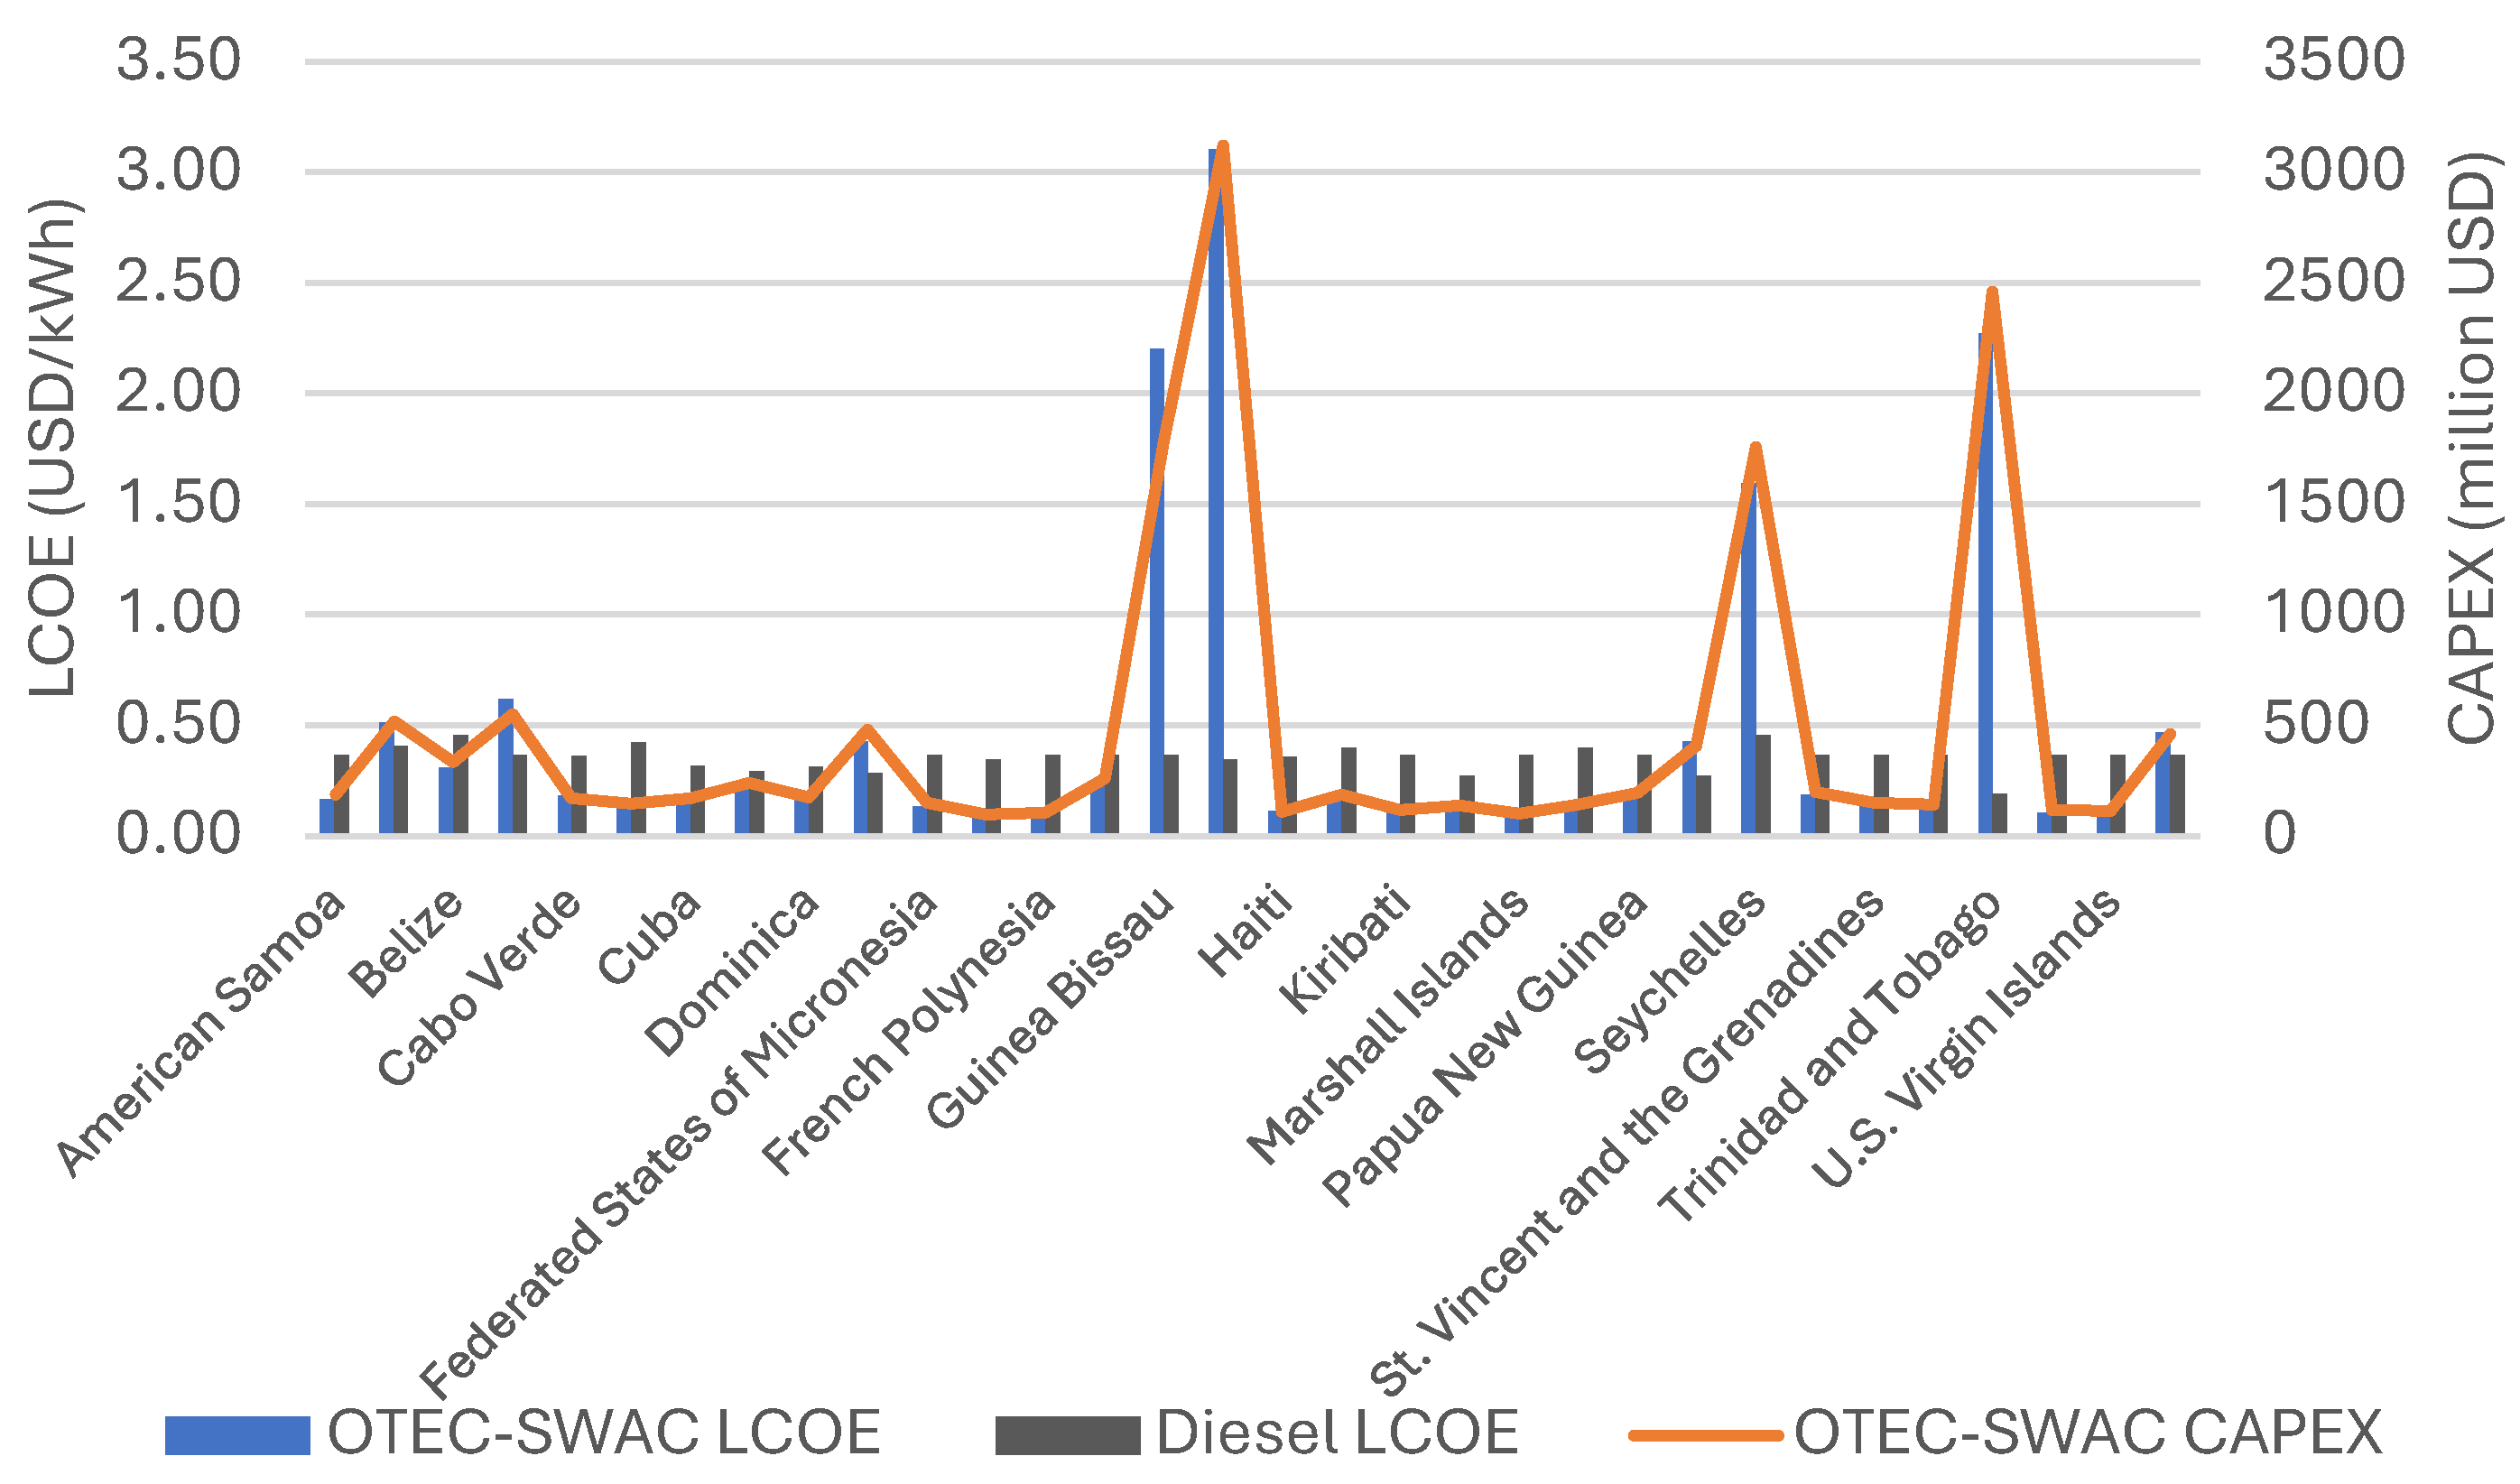
4.2. Economic Analysis of the OTEC-SWAC System

Figure 2 shows a comparative analysis of the capital cost and LCOE for OTEC-SWAC systems across various SIDS, benchmarked against the prevailing diesel-based LCOE. Capital intensity scales almost entirely with the length of the deep-ocean intake: Guinea-Bissau (39 km), Guyana (74 km), the Seychelles (43 km), and Trinidad and Tobago (60 km) record the highest values, all exceeding 210,000 USD/kW. For the remaining sites with intake pipelines averaging 3 km, the average cost is 28,000 USD/kW.
In most of the SIDS assessed, the OTEC-SWAC LCOE is lower than or competitive with the diesel LCOE, highlighting the economic potential of the technology in regions with high energy costs due to fuel import dependency. Excluding countries with a pipe length greater than 10 km, the average LCOE is at 0.09 USD/kWh. The calculated LCOEs in this analysis show significant cost advantages, notably in countries such as the Cayman Islands and Fiji, having 27–29 cents lower than the diesel counterpart. Only nine countries have diesel LCOE at low levels due to a combination of long pipe length and low temperature gradient between surface ocean water and deep-ocean water, leading to higher technical requirements of pipes, pumps, and heat exchangers. In Trinidad and Tobago in addition to having a longer pipe length, the diesel LCOE is very low, as the price of diesel is only 0.65 USD/L, which is 47% lower than the rest of the analyzed countries.
From the results, the strongest techno-economic feasibility is found in Fiji and French Polynesia, having an LCOE of 0.09 USD/kWh, followed by the Marshall Islands, Tuvalu, Kiribati, and the Maldives, having LCOEs below 0.12 USD/kWh, which is roughly one-third of their prevailing diesel tariffs (0.34–0.36 USD/kWh). These countries also require relatively modest capital costs of 94–135 million USD. These advantages reflect steep near-shore bathymetry of 1000 m depth, high temperature difference, and expensive imported diesel, allowing OTEC-SWAC to capture energy-cost savings. Comparatively, Guyana, Trinidad and Tobago, Guinea-Bissau, and the Seychelles lie at the opposite extreme, with LCOE ranging from 1.59 to 3.10 USD/kWh, while their diesel generation LCOE is at 0.19–0.46 USD/kWh.
Table 5 depicts how OTEC-SWAC economics tracks the gap between local electricity tariffs. SIDS with very high retail prices—the Solomon Islands (0.72 USD/kWh), the Marshall Islands (0.41 USD/kWh), Kiribati (0.41 USD/kWh), and the Maldives (0.39 USD/kWh)—generate the largest spreads (≥0.27 USD/kWh), translating into high ROI and payback periods of 6–9 years. In SIDS with tariffs between 0.09 and 0.18 USD/kWh OTEC cost band—Jamaica, Mauritius, Cabo Verde, and Papua New Guinea—the ROIs fall to ≈5%, and paybacks lengthen beyond two decades.
Overall, feasibility improves where (i) diesel prices exceed ~0.30 USD kW/h, (ii) intake pipe lengths are short, and (iii) cooling loads are high enough to monetize the SWAC stream. CAPEX below ~200 million USD and an OTEC–diesel price gap of ≥0.15 USD kW/h emerge as pragmatic screening thresholds. These results highlight the influence of site-specific conditions in the OTEC-SWAC systems. While the technology presents a sustainable and potentially cost-effective alternative to diesel, careful consideration of capital investment and location-specific factors remains essential for deployment.

4.3. Simplification of the Model

The model’s results reveal that for the given capacity, the LCOE increases with an increase in pipe length and decreases with an increase in the temperature difference between surface ocean water and deep-ocean water. The increase in LCOE is more noticeable and with a greater margin when compared with changes to the pipeline length. Based on this, the model was then extended by calculating the LCOE of different plant sizes for the same locations. These findings are depicted in Figure 3 and show the relationship of LCOE and net power capacity of the plant.
From the above paragraphs, the following can be concluded:
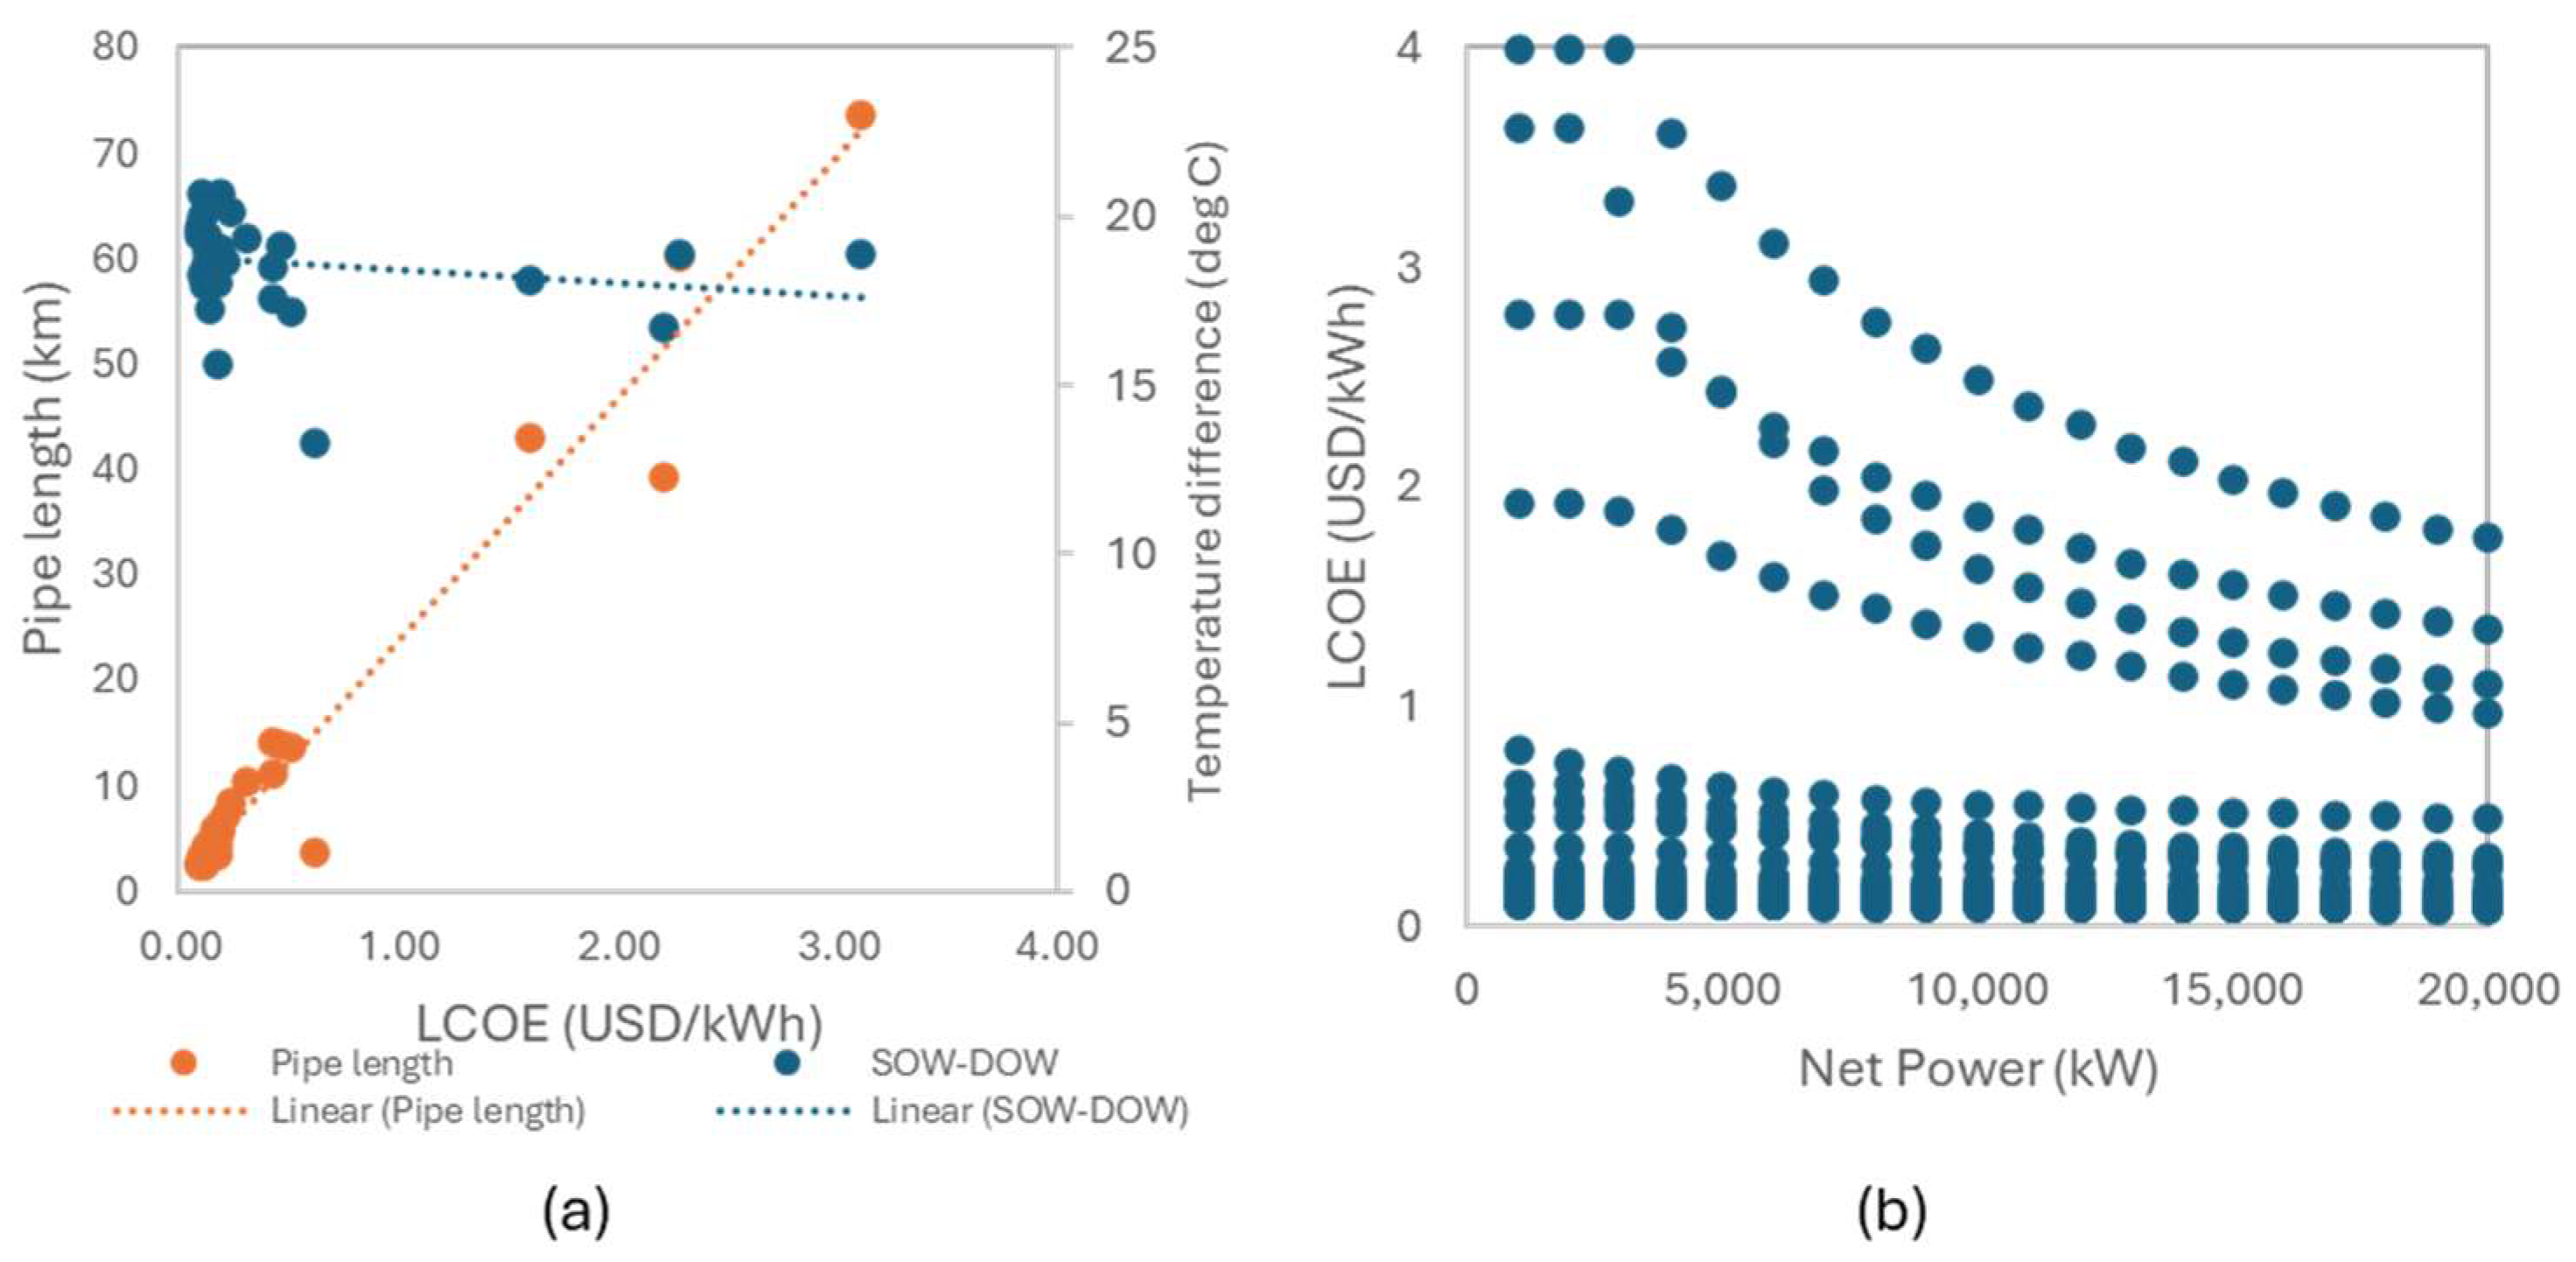
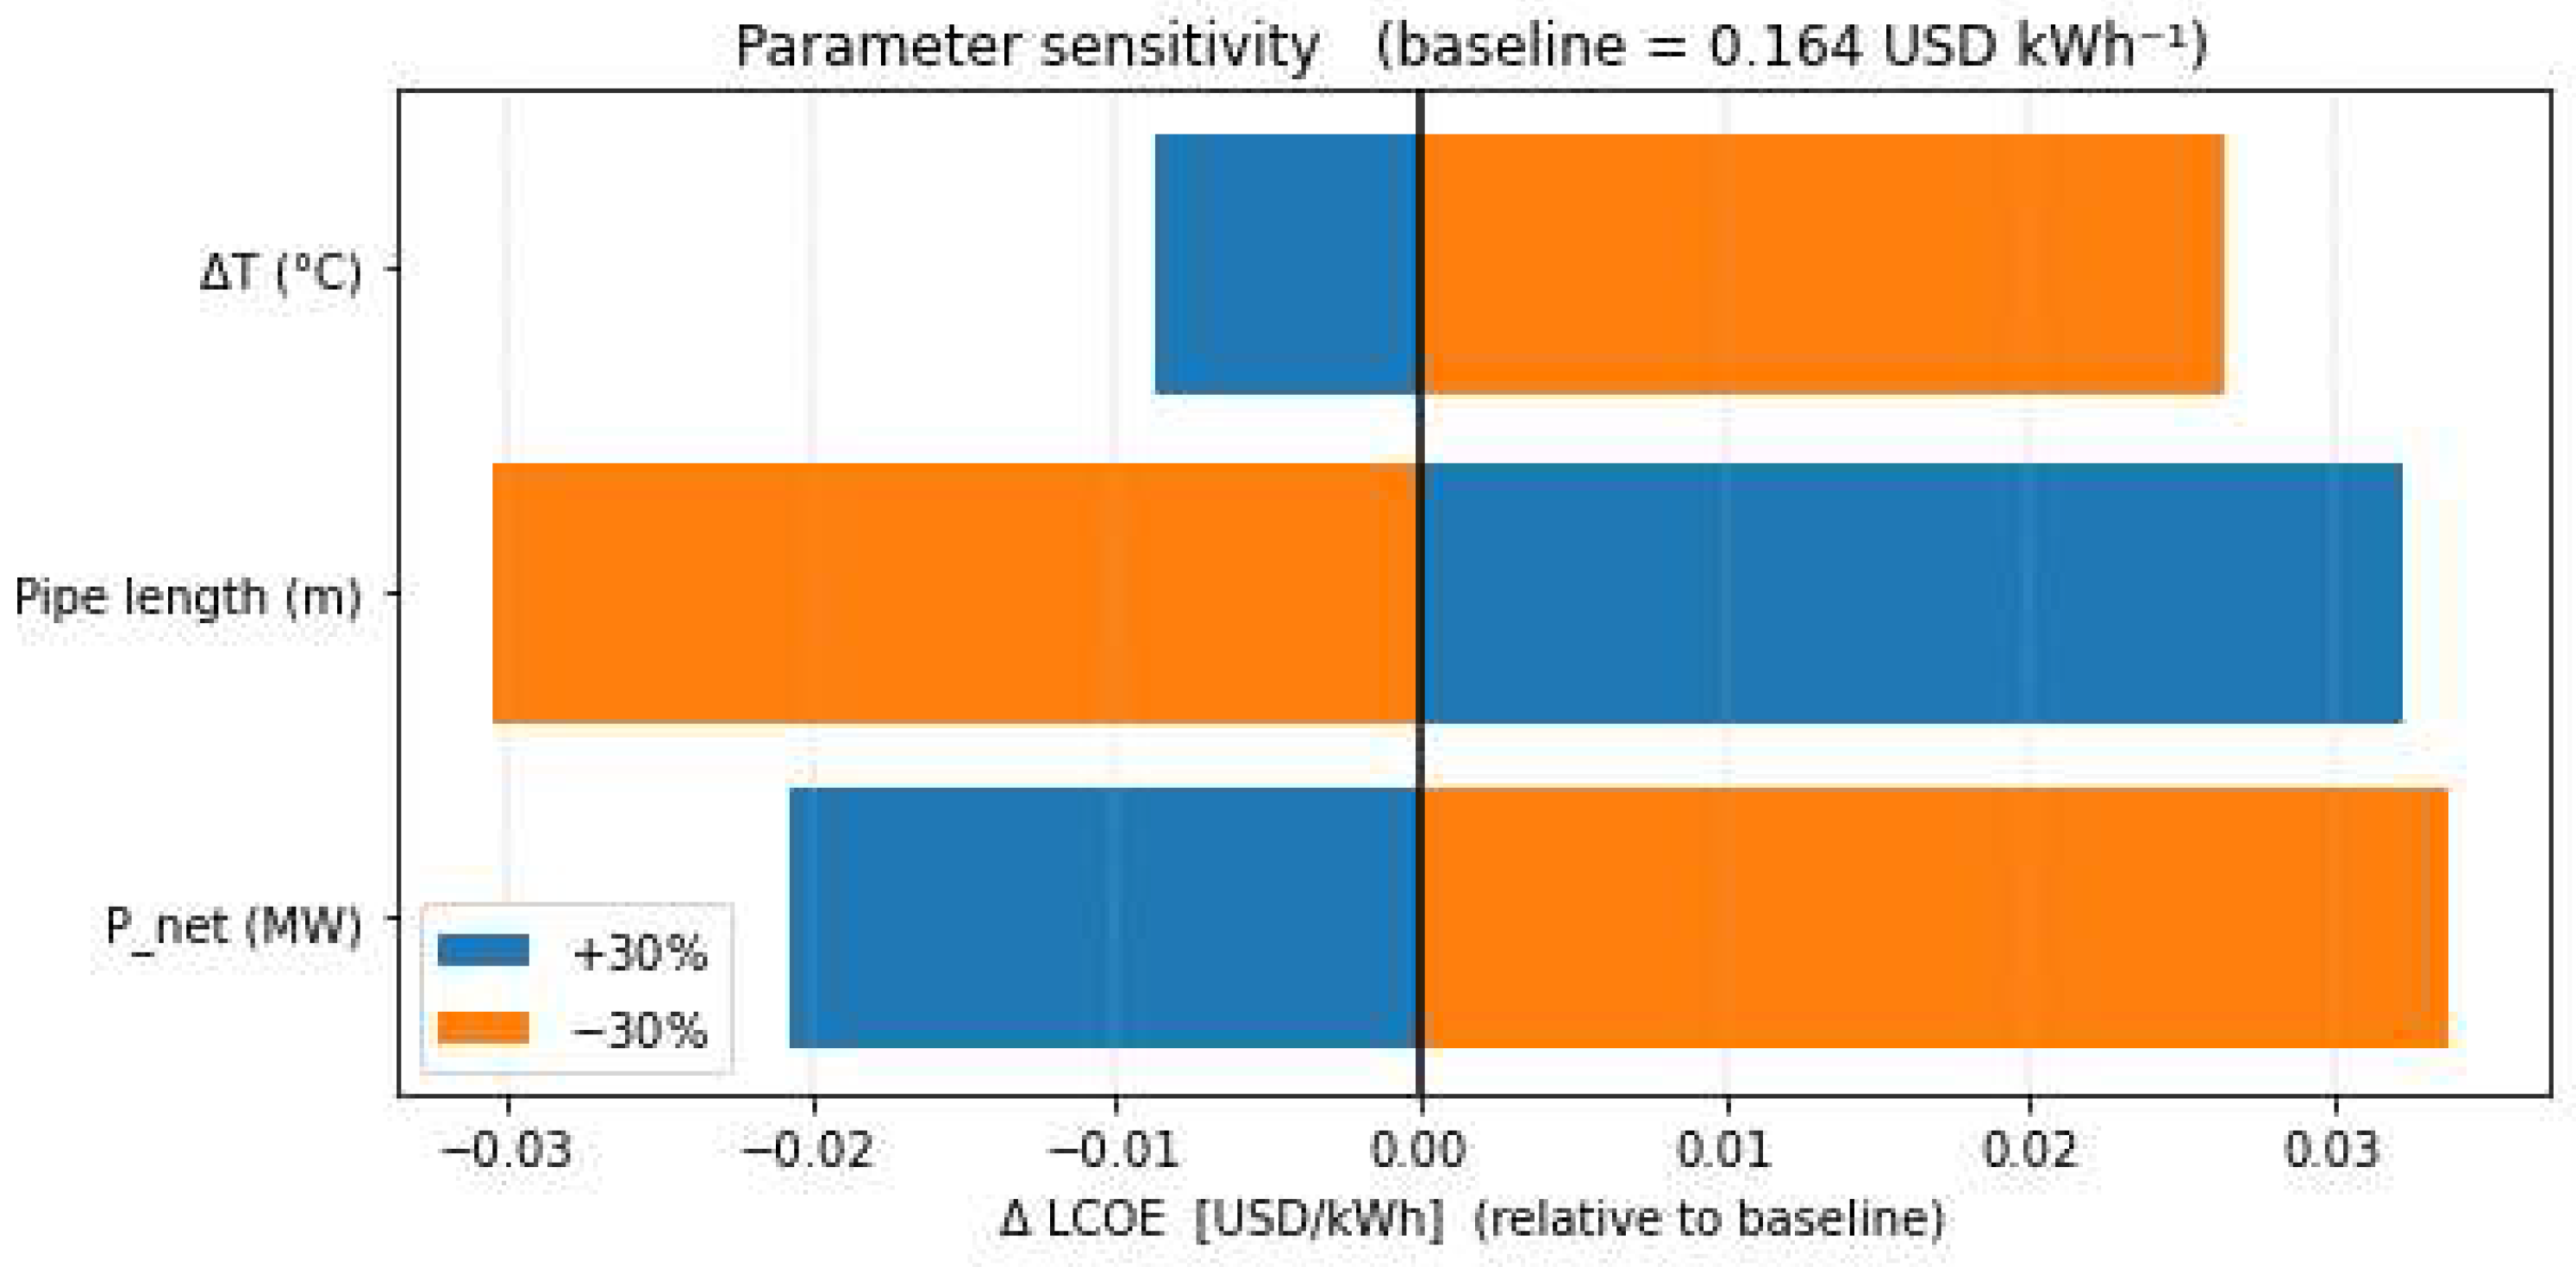
  • The pipe length is the main factor for the geographically dependent cost variation.
  • The temperature difference affects cost, albeit with a lower impact, and the relationship is inverse, i.e., a higher temperature difference lowers the LCOE.
  • Net power and LCOE have a negative exponential relationship.
Thus, the findings of this study can be reduced into the general form by separating the capital cost into the separate functions of these three parameters as given in Equation (7).
c a p e x t o t a l = c a p e x d e p + c a p e x i n t a k e + c a p e x i n d
Notably, the dependent cost, which is composed of the heat exchanger, turbine, and pumps based on the temperature difference T , and P n e t (MW). The independent cost component that stands for the engineering costs, construction costs, and additional project costs, which is a function of P n e t . The seawater intake cost component depends on the length of the pipeline L and size of the plant P n e t . To determine these functions, the full techno-economic dataset (32 SIDS × 18 design variants, giving 576 data points) was first log-transformed, and three-parameter power law models were fitted by the nonlinear least squares method using the Levenberg–Marqaurdt algorithm [86]. The stepwise fitting strategy, choice of link functions, and goodness-of-fit diagnostics follow the procedures recommended for exponentiated power-exponential regressions in [87,88]. The functions and their fitted parameters are shown below in Table 6.
The fitted exponents reflect the expected physics behind the cost drivers. The steep negative exponent ∆T (−2.54) indicates that even small increases in the surface-to-deep-ocean temperature differential can sharply reduce LCOE by lifting thermodynamic efficiency. Conversely, the positive exponent on pipe length L (1.20) captures the linear escalation of material and installation costs as the intake is extended offshore. These sensitivities match the relationship in Figure 3a.
For plant size P n e t , the location-dependent and location-independent blocks exhibit exponents of 0.74 and 0.67, respectively, values that closely match the six-tenths rule and confirm the presence of pronounced economies of scale in major equipment and civil works. When these relations are embedded in the levelized-cost model, a ±30% perturbation (Figure 4) around the baseline site ( T   = 20 °C, L = 3 km, P n e t = 6 MW) reveals that pipe length is by far the dominant geographical lever, shifting the LCOE by about ±0.033 USD/kWh, while a 30% increase in plant capacity reduces the LCOE by roughly 0.021 USD/kWh and a comparable rise in ΔT lowers it by 0.044 USD/kWh. These results confirm that proximity to deep water governs cost competitiveness, whereas hotter sites and larger unit sizes provide effective, but secondary, mitigation. The increase in pipe length can be effectively managed and balanced by scaling up the plant capacity, ensuring that the economic benefits of higher net power offset the associated pipe length costs.

5. Discussion

This research has found that, based on 20-year historical ocean and atmospheric temperature data, the technical and economic feasibility of the OTEC-SWAC system is highly reliant on location-specific conditions. While OTEC-SWAC presents a renewable energy solution aligned with SDG 7 (Affordable and Clean Energy) and SDG 13 (Climate Action) and a cost-effective alternative to diesel, careful consideration of capital investment and location-specific factors remains essential for deployment.
The results indicate that 30 of the 32 SIDS analyzed in this study are naturally suited for OTEC power generation. Although most SIDS are occupied in the tropical belt [67] and considered to having the necessary temperature gradient for OTEC technology [42], the analysis reveals that Bermuda and Cabo Verde, located at the fringes of the extratropical zone, have a temperature difference of less than 17 °C. This is lower than the minimum practical temperature difference of 20 °C needed for closed-cycle OTEC systems [9]. This result easily identifies that countries above latitude 11 in the Atlantic Ocean are not viable for OTEC power generation. To broaden their power mix, Cabo Verde can capitalize on its abundant solar resources [89], while Guinea-Bissau should prioritize wind, biomass, and small hydro, which studies identify as its most promising resources [90]. The SIDS analyzed in this study can be categorized into three sections based on the feasibility of OTEC, along with recommended policy actions shown in Table 7.
The numerical model used in this study estimates the technical and economic feasibility of a 6 MW onshore OTEC-SWAC system. It uses a fully saturated organic Rankine cycle model, assuming complete phase change of the working fluid. Previous studies use a smaller pressure ratio in the turbine, requiring larger mass flows of seawater to enable the phase change [13]. This results in larger component sizes. However, in this model, lower mass flow ratios like in studies [73,74] have been used, resulting in economically sized seawater pumps. Although the numerical model has been adapted from an offshore OTEC plant study, the calculation of the pump sizes has been modeled for the size of the intake pit rather than from the 1000 m depth. In this regard, the use of the siphon flow method has proven advantageous, reducing the parasitic burden of the water pumps, which is estimated at 20–30% of the gross power output [16,91]. In this model, the pump power for the deep-ocean water pump is on average 19% of the gross power. By minimizing the reliance on pumps, operational costs can be reduced with increased durability [92].
The cost estimation for the intake system is a critical component of this study, as the installation of the deep-ocean water pipeline represents one of the primary cost drivers for onshore OTEC systems. To access cold water from depths of up to 1000 m, pipeline construction can account for approximately 9.3% to 26% of the total capital cost for a 1 MW plant [32,93], posing a significant barrier to widespread deployment. Pipeline installation costs vary considerably depending on the construction method and site-specific environmental constraints. For instance, at NELHA, the use of horizontal directional drilling (HDD) increased installation costs, which can be 12.5% higher compared to conventional open-cut excavation [94]. However, HDD is less environmentally invasive and well suited for protecting sensitive coral reef ecosystems compared to the open-cut method used in Kumejima, Japan, where additional conservation measures further raised construction costs. In contrast, favorable site conditions in Kavaratti, India, such as calm lagoon waters, eliminated the need for a seawall, thereby reducing installation expenses. Given these wide variations, this study adopted cost estimates from established pilot plants to maintain realism and site-specific relevance in the economic modeling of the intake system.
Siting the plant at locations with easy access to deep-ocean water is crucial, as seen from the results where longer pipes lead to higher capital costs. SIDS requiring longer pipes result in plant costs of 210,000 USD/kW (Figure 2). Excluding SIDS with long pipe lengths (>10 km), the average cost of the onshore OTEC-SWAC plant modeled in this study is approximately 28,000 USD/kW. These results are comparable with the estimates for onshore plants in the literature at 31,471 USD/kW for a 1.4 MW plant [32] and the costs of the two pilot plants in NELHA (67,000 USD/kW [93]) and in Kumejima (50,000 USD/kW [95]), both in 2023 USD values. Previous simulations and techno-economic analyses of onshore OTEC plants have been limited to smaller capacities (<1 MW) [16,17], while larger capacity plants are mainly modeled as offshore plants [13,14,15]. Hence, there are few sources for comparison of LCOE of an onshore plant. Recent estimates show that over a 30-year project duration, the LCOE of a 1 MW onshore plant is expected to be 0.19 USD/kWh [32]. The commercialization target for OTEC plants is to have an LCOE lower than 0.25 USD/kWh [32]. The results from this simulation show that the OTEC-SWAC system can achieve an average LCOE of 0.16 USD/kWh in compatible countries. This effect is achieved through the dual use of the deep-ocean water, which significantly enhances the benefits as there is added production in the multi-use approach [30,96]. The achieved LCOE is also comparable with offshore OTEC plant LCOEs, which vary from 0.03 to 0.22 USD/kWh based on different plant sizes ranging from 10 to 100 MW [12,97].
Moreover, the scalable model of onshore OTEC-SWAC developed in this analysis has additional benefits to generating renewable energy and providing a path to sustainable tourism in SIDS. The onshore OTEC plant opens avenues for multiple uses of the deep-ocean water, which enables the creation of economic activities such as aquaculture, agriculture, and thalassotherapy [98,99], helping to foster sustainable cities and communities in accordance with SDG11. The cascade use of deep-ocean water is seen in the case of Kumejima, where multiple industries, such as cosmetic production and prawn, spinach, and sea grape farming, leverage the cold, nutrient-rich deep-ocean water to enhance productivity [96].
The previous complex calculations of exergy, enthalpy, pump power, and heat exchanger sizes that are needed for estimating the net power output for LCOE calculations of OTEC-SWAC have now been reduced to the main geographical components of pipe length and temperature difference using the reduced form of the model. Although the study focuses on SIDS, the equation is adaptable to other regions. It emphasizes the importance of the temperature difference, as OTEC systems become economically unviable when the temperature difference is lower than 17 °C. Location is also key, as onshore plants far from 1000 m depth require longer pipelines, increasing costs. This infeasibility is reflected in the equation, with significantly higher LCOE values indicating unfavorable conditions. Hence, the equation acts as a diagnostic tool, helping determine whether OTEC deployment in a specific region is practical based on local thermal gradients and costs.
This study has shown that location-specific parameters such as the deep and surface ocean water temperature and bathymetry around the SIDS are the key factors for the technical design requirements for onshore OTEC plants. The most crucial factor is the bathymetry, as observed, which determines the length of the cold deep-ocean water pipe. Longer pipes and lower temperature gradients both negatively affect the economic feasibility of the plant, with countries having lower surface ocean temperatures and longer pipelines having high LCOE. The scalable model of the onshore OTEC-SWAC was developed, and the reduced form of the model will enable easy estimation of OTEC systems for designers and policymakers. Despite the promising results of this study, high upfront costs and limited infrastructure remain key barriers, as evidenced by the existing literature that identifies capital intensity and resource constraints as prominent challenges [30] for transitioning to sustainable energy generation methods.

6. Conclusions

This study evaluated the techno-economic feasibility of combining ocean thermal energy conversion (OTEC) and seawater air conditioning (SWAC) systems in different Small Island Developing States (SIDS). Specifically, this study aligns with the achievement of several SDG targets, including that of SDG 7 (sustainable energy generation), SDG 8 (economic growth), and SDG 13 (climate action), contributing to existing academic deliberations on sustainable energy transition [90]. It estimated the viability of OTEC to transition to renewable energy generation for increased sustainability in the tourism sector. The research is grounded in three major contributions:
  • Feasibility assessment of OTEC-SWAC systems across 34 SIDS: The study conducted a comprehensive feasibility analysis of OTEC-SWAC integration across 32 SIDS, utilizing 20 years of geographically specific ocean and atmospheric data. The results show that 29 of the 32 analyzed SIDS meet thermal and geographic suitability criteria, confirming the viability of OTEC-SWAC systems for stable power generation and cooling in tourism-driven economies. The findings highlight significant regional variations, with longer pipeline distances and lower thermal gradients impacting system efficiency and costs in some locations.
  • Analysis of key system parameters and their impact on Levelized Cost of Energy (LCOE): Techno-economic analysis reveals pipeline length as the main cost driver, with longer pipes leading to higher LCOE in countries like Guyana and Trinidad and Tobago. Most SIDS, however, achieve a competitive LCOE averaging 0.19 USD/kWh, presenting a cost-effective alternative to conventional diesel systems.
  • Development of a scalable cost estimation model for onshore OTEC-SWAC deployment: Large-capacity onshore OTEC plants, in addition to power generation, provide economic benefits through deep-ocean water industries. The scalable model and the reduced form developed will enable policymakers, engineers, and stakeholders to quickly assess the economic viability of OTEC-SWAC projects at different locations.
Overall, the study demonstrates that onshore OTEC-SWAC is a viable and scalable solution that is economically competitive for reducing fossil fuel dependence in SIDS and offering environmental benefits. These findings support informed decision-making and promote investment in sustainable energy infrastructure across island economies.

Author Contributions

Conceptualization, A.S.; methodology, A.S.; software, A.S.; validation, A.S.; formal analysis, A.S.; investigation, A.S.; resources, A.S.; data curation, A.S.; writing—original draft preparation, A.S.; writing—review and editing, A.S., K.N.I., T.O., S.B. and H.O.; visualization, A.S.; supervision, K.N.I., T.O. and H.O. All authors have read and agreed to the published version of the manuscript.

Funding

This research received no specific external funding. The first author was supported by the Japan Ministry of Education, Culture, Sports, Science and Technology for conducting research in Japan.

Institutional Review Board Statement

Not applicable.

Informed Consent Statement

Not applicable.

Data Availability Statement

The original contributions presented in this study are included in the article. Further inquiries can be directed at the corresponding author.

Conflicts of Interest

The authors declare no conflicts of interest.

Abbreviations

The following abbreviations are used in this manuscript:
CDDCooling degree days
LCOELevelized cost of energy
OTECOcean thermal energy conversion technology
SDGSustainable development goals
SIDSSmall island developing states
SWACSeawater air conditioning

Appendix A

Table A1. List of equations used for calculation of the OTEC-SWAC system.
ParameterFormula
Calculation of pipe length
Haversine formula (m) D i s t a n c e = R cos 1 sin l a t 1   sin l a t 2 + cos l a t 1 cos l a t 2   cos l o n 1 l o n 2
R is the radius of the earth taken as 6371 m.
Length of pipe (m) l e n g t h p i p e , c w = D i s t a n c e 2 + 1000 2
Assuming the shortest distance given by a right-angle triangle and a depth of 1000 m.
Calculation of pipe heat gain
Dynamic viscosity of seawater μ = ρ v
Nusselt number N u = 0.023 R e 0.8 P r 0.4
Heat transfer coefficient h = k p N u D
Thermal resistance for pipe R = 1 h π D
Overall heat transfer coefficient U o = 1 A 0 A . 1 h i + A o ln r o r i 2 π k p L s + 1 h o
Calculation of OTEC technical system
Evaporator saturation temperature (°C) T s a t e v a p = T w w i n T w w p p t e m p
Condensor saturation temperature (°C) T s a t c o n d = T c w i n + T c w + p p t e m p
where   T w w i n   is   the   temperature   of   the   surface   ocean   water ,   T c w i n is the temperature of the deep-ocean water, and p p t e m p is the pinch point temperature assumed as 1.25.
Saturation pressure (bar) P s a t e v a p / c o n d = 0.00002196 T s a t e v a p / c o n d 3 + 0.00193103 T s a t e v a p / c o n d 2 + 0.1695763 T s a t e v a p / c o n d + 4.257339601
Enthalpy of liquid phase (kJ/kg) h 1 e v a p / c o n d = 0.0235 P s a t e v a p / c o n d 4 + 0.9083 P s a t e v a p / c o n d 3 12.93 P s a t e v a p / c o n d 2 + 97.316 P s a t e v a p / c o n d 39.559
Enthalpy of vapor phase (kJ/kg) h 2 e v a p / c o n d = 28.276 l n P s a t e v a p / c o n d + 1418.1
Isentropic quality of turbine outlet h _ t u r b o u t = h _ t u r b o u t , i s h 2 e v a p   η t u r b , e l + h 2 e v a p
where   η t u r b , e l is the electric efficiency of the turbine.
Mass flow of ammonia (kg/s) m N H 3 = W t ,   t u r b , g r o s s h _ t u r b o u t h 2 e v a p  
where   W t ,   t u r b , g r o s s is the gross power of the plant.
Ammonia pump power (kW) W t , p u m p , N H 3 = m N H 3 ( h 2 h 1 )
Evaporator heat in (kW) Q e v a p = m N H 3 h 2 e v a p h 2  
Mass flow of warm ocean water (kg/s) m w w = Q e v a p C p , w a t e r T w w
where   C p , w a t e r is the specific heat capacity of the water taken at 4 kJ/kgK.
Evaporator area (m2) A e v a p = Q e v a p U e v a p T l o g , e v a p  
Condensation heat (kW) Q c o n d = m N H 3 h 1 c o n d h _ t u r b o u t
Mass flow of cold ocean water (kg/s) m c w = Q c o n d C p , w a t e r T c w
Condesor area (m2) A c o n d = Q c o n d U c o n d T l o g , c o n d  
Intake pit flow rate (m3/s) Q w e l l   c w / w w = 2 m c w / w w ρ w a t e r
Area of intake pit (m2) A w e l l = Q w e l l d e p t h w e l l
where d e p t h w e l l is taken as 5 m
Diameter of siphon pipe (m) Q w e l l   c w / w w 2 = π 2 8 C d 2 g h d c w / w w 4 f L v 2 d c w / w w 3 2
where the equation is solved using an iteration method and d c w / w w is the diameter of the pipe.
Weight of pipe (kg) m p i p e s , c w / w w = π 4 ( d p i p e s , c w / w w + 2 t ) 2 d p i p e s , c w / w w 2 l e n g t h p i p e , c w / w w ρ p i p e
Dynamic viscosity (PaS) μ c w / w w = 3.443 10 7 T c w / w w i n 2 4.711 10 5 T c w / w w i n + 1.767 10 3
Reynolds number R e c w / w w = u p i p e s   ρ c w / w w   d p i p e s , c w / w w μ c w / w w
where   ρ c w is the density of deep-ocean water at 1027 kg/m3   and   ρ w w is the density of surface ocean water at 1024 kg/m3.
Darcy friction factor f c w / w w = 0.25 log 10 r o u g h n e s s p i p e 3.7 d p i p e s , c w / w w + 5.74 R e c w / w w 0.9 2
Pressure drop (kPa) P c w / w w = f c w ρ c w / w w l e n g t h p i p e , c w / w w d p i p e s , c w / w w u p i p e s 2 2 + K L , c o n d ρ c w / w w u H X 2   1 1000
Pump power (kW) W t , p u m p ,   c w / w w = m c w / w w   P c w / w w ρ c w / w w   η p u m p ,   h y d η p u m p ,   e l
Thermal efficiency η n e t , t h e r m = W t , n e t , O T E C Q e v a p
Calculation of SWAC technical system
Mass of water required (kg) m S W A C = c r e q C p , w a t e r T S W A C
Velocity of water flow (m/s) v S W A C = 4 m S W A C ρ c w π d p i p e , S W A C 2
Head loss h l o s s = f s w a c l s w a c d p i p e , S W A C   v S W A C 2 2 9.81
where f s w a c is the friction factor, l s w a c is, the length of pipe and d p i p e , S W A C is the diameter of pipe.
SWAC pump size (kW) W t , p u m p , S W A C = ρ c w h l o s s v S W A C π d p i p e , S W A C 2 4 η p u m p ,   h y d η p u m p ,   e l
SWAC heat exchanger area (m2) A s w a c , H X = 1000 c r e q T l o g , s w a c H c o e f f
where   H c o e f f = 7166.4 is the heat transfer coefficient of a titanium heat exchanger in W/°Cm2.
Figure A1. Results of all regressions carried out for the reduction of the model to the generalized equation. R2 is R-square, MSE is the mean squared error and RMSE is the root mean squared error.
Sustainability 17 04724 g0a1

References

  1. Ghina, F. Sustainable development in small island developing states: The case of the Maldvies. Environ. Dev. Sustain. 2003, 5, 139–165. [Google Scholar] [CrossRef]
  2. Cadarso, M.; Gómez, N.; López, L.A.; Tobarra, M.-Á. Calculating tourism’s carbon footprint: Measuring the impact of investments. J. Clean. Prod. 2016, 111, 529–537. [Google Scholar] [CrossRef]
  3. McGillivray, M.; Naudé, W.; Santos-Paulino, A. Small island states development challenges: Introduction. J. Int. Dev. 2008, 20, 481–485. [Google Scholar] [CrossRef]
  4. Schubert, L.; Foley, W.; Savage, A.; Muriuki, G. Small Island Developing States, Climate Change, and Food and Nutrition Security. Adv. Sci. Lett. 2017, 23, 3389–3392. [Google Scholar] [CrossRef]
  5. Roudi, S.; Arasli, H.; Akadiri, S.S. New insights into an old issue—Examining the influence of tourism on economic growth: Evidence from selected small island developing states. Curr. Issues Tour. 2019, 22, 1280–1300. [Google Scholar] [CrossRef]
  6. Faizal, M.; Ahmed, M.R. Experimental studies on a closed cycle demonstration OTEC plant working on small temperature difference. Renew. Energy 2013, 51, 234–240. [Google Scholar] [CrossRef]
  7. Nihous, G. A Preliminary Investigation of the Effect of Ocean Thermal Energy Conversion (OTEC) Effluent Discharge Options on Global OTEC Resources. J. Mar. Sci. Eng. 2018, 6, 25. [Google Scholar] [CrossRef]
  8. Jia, Y.; Nihous, G.C.; Rajagopalan, K. An Evaluation of the Large-Scale Implementation of Ocean Thermal Energy Conversion (OTEC) Using an Ocean General Circulation Model with Low-Complexity Atmospheric Feedback Effects. J. Mar. Sci. Eng. 2018, 6, 12. [Google Scholar] [CrossRef]
  9. Hurtt, J.; Pellen, A.; Nagurny, N.J. OTEC Power Efficiency Challenges. In Proceedings of the Annual Offshore Technology Conference, Houston, TX, USA, 3–6 May 2010; Volume 1, pp. 732–743. [Google Scholar] [CrossRef]
  10. Cooper, D.; Meyer, L.; Varley, R. OTEC Commercialization Challenges. In Proceedings of the Annual Offshore Technology Conference, Houston, TX, USA, 4–7 May 2009; p. OTC-20170-MS. [Google Scholar] [CrossRef]
  11. Lu, B.; Liu, Y.; Zhai, X.; Zhang, L.; Chen, Y. Design and Experimental Study of 50 kW Ocean Thermal Energy Conversion Test Platform Based on Organic Rankine Cycle. J. Mar. Sci. Eng. 2024, 12, 463. [Google Scholar] [CrossRef]
  12. OES. White Paper on OTEC. 2021. Available online: https://www.ocean-energy-systems.org/publications/oes-position-papers/document/white-paper-on-otec/ (accessed on 31 January 2025).
  13. Martel, L.; Smith, P.; Rizea, S.; Van Ryzin, J.; Morgan, C.; Noland, G.; Pavlosky, R.; Thomas, M.; Halkyard, J. Ocean Thermal Energy Conversion Life Cycle Cost Assessment; Final Technical Report. 30 May 2012. Available online: https://www.osti.gov/servlets/purl/1045340/ (accessed on 20 June 2023).
  14. Richards, D.; George, J.F.; Seward, J.S. Design of 40-MW Grazing and Moored OTEC Pilot/Demonstration Plants. J. Energy 2012, 5, 224–230. [Google Scholar] [CrossRef]
  15. Srinivasan, N. A New Improved Ocean Thermal Energy Conversion System with Suitable Floating Vessel Design. In Proceedings of the International Conference on Offshore Mechanics and Arctic Engineering—OMAE, Honolulu, HI, USA, 31 May–5 June 2009; Volume 4, Part B. pp. 1119–1129. [Google Scholar] [CrossRef]
  16. Vega, L.A. Ocean Thermal Energy Conversion Primer. Mar. Technol. Soc. J. 2003, 36, 25–35. [Google Scholar] [CrossRef]
  17. George, J.F.; Richards, D.; Perini, L.L. Baseline Design of an OTEC Pilot Plantship. Volume A. Detailed Report. [Performance Analysis of OTEC Power Plant]. May 1979. Available online: https://www.osti.gov/servlets/purl/5672829/ (accessed on 20 June 2023).
  18. Etemadi, A.; Emdadi, A.; AsefAfshar, O.; Emami, Y. Electricity Generation by the Ocean Thermal Energy. Energy Procedia 2011, 12, 936–943. [Google Scholar] [CrossRef]
  19. Rahbar, K.; Mahmoud, S.; Al-Dadah, R.K.; Moazami, N.; Mirhadizadeh, S.A. Review of organic Rankine cycle for small-scale applications. Energy Convers. Manag. 2017, 134, 135–155. [Google Scholar] [CrossRef]
  20. Zhang, X.; He, M.; Zhang, Y. A review of research on the Kalina cycle. Renew. Sustain. Energy Rev. 2012, 16, 5309–5318. [Google Scholar] [CrossRef]
  21. Uehara, H.; Ikegami, Y. Optimization of a Closed-Cycle OTEC System. J. Sol. Energy Eng. 1990, 112, 247–256. [Google Scholar] [CrossRef]
  22. Guzović, Z.; Rašković, P.; Blatarić, Z. The comparision of a basic and a dual-pressure ORC (Organic Rankine Cycle): Geothermal Power Plant Velika Ciglena case study. Energy 2014, 76, 175–186. [Google Scholar] [CrossRef]
  23. Yamada, N.; Hoshi, A.; Ikegami, Y. Thermal efficiency enhancement of ocean thermal energy conversion (OTEC) using solar thermal energy. In Collection of Technical Papers—4th International Energy Conversion Engineering Conference, San Diego, CA, USA, 26–29 June 2006; AIAA: Reston, VA, USA, 2006; Volume 2, pp. 936–944. [Google Scholar] [CrossRef]
  24. Nemati, A.; Nami, H.; Ranjbar, F.; Yari, M. A comparative thermodynamic analysis of ORC and Kalina cycles for waste heat recovery: A case study for CGAM cogeneration system. Case Stud. Therm. Eng. 2017, 9, 1–13. [Google Scholar] [CrossRef]
  25. Kim, H.-J.; Lee, H.-S.; Lim, S.-T.; Petterson, M. The Suitability of the Pacific Islands for Harnessing Ocean Thermal Energy and the Feasibility of OTEC Plants for Onshore or Offshore Processing. Geosciences 2021, 11, 407. [Google Scholar] [CrossRef]
  26. Arias-Gaviria, J. Adoption of sea water air conditioning (SWAC) in the Caribbean: Individual vs regional effects. J. Clean. Prod. 2019, 227, 280–291. [Google Scholar] [CrossRef]
  27. Hunt, J.D.; Weber, N.d.A.B.; Zakeri, B.; Diaby, A.T.; Byrne, P.; Filho, W.L.; Schneider, P.S. Deep seawater cooling and desalination: Combining seawater air conditioning and desalination. Sustain. Cities Soc. 2021, 74, 103257. [Google Scholar] [CrossRef]
  28. War, J.C. Seawater Air Conditioning (SWAC) a renewable energy alternative. In Proceedings of the OCEANS’11—MTS/IEEE Kona, Waikoloa, HI, USA, 19–22 September 2011. Program Book. [Google Scholar] [CrossRef]
  29. Brecha, R.J.; Schoenenberger, K.; Ashtine, M.; Koon, R.K. Ocean Thermal Energy Conversion—Flexible Enabling Technology for Variable Renewable Energy Integration in the Caribbean. Energies 2021, 14, 2192. [Google Scholar] [CrossRef]
  30. Aresti, L.; Christodoulides, P.; Michailides, C.; Onoufriou, T. Reviewing the energy, environment, and economy prospects of Ocean Thermal Energy Conversion (OTEC) systems. Sustain. Energy Technol. Assess. 2023, 60, 103459. [Google Scholar] [CrossRef]
  31. Herrera, J.; Sierra, S.; Ibeas, A. Ocean Thermal Energy Conversion and Other Uses of Deep Sea Water: A Review. J. Mar. Sci. Eng. 2021, 9, 356. [Google Scholar] [CrossRef]
  32. Vega, L.; Martin, B. OES|Ocean Thermal Energy Conversion (OTEC) Economics: Updates and Strategies. 2024. Available online: https://www.ocean-energy-systems.org/publications/oes-technical-reports/document/ocean-thermal-energy-conversion-otec-economics-updates-and-strategies/ (accessed on 1 February 2025).
  33. Chan, N. “Large Ocean States”: Sovereignty, Small Islands, and Marine Protected Areas in Global Oceans Governance. Glob. Gov. A Rev. Multilater. Int. Organ. 2018, 24, 537–555. [Google Scholar] [CrossRef]
  34. Linus, M.; Jarett, G.; Fliss, J. Ocean Energy Technologies Patents Deployment Status and Outlook. 2014. Available online: https://www.irena.org/Publications/2014/Aug/Ocean-Energy-Technologies-Patents-Deployment-Status-and-Outlook (accessed on 15 April 2025).
  35. UNFCCC. COP 28: What Was Achieved and What Happens Next? Available online: https://unfccc.int/cop28/5-key-takeaways (accessed on 15 April 2025).
  36. Trimble, L.C.; Naef, F.E. Ocean Thermal Energy Conversion. In Proceedings of the Annual Offshore Technology Conference, Houston, TX, USA, 4–7 May 1975; pp. 155–162. [Google Scholar] [CrossRef]
  37. Zhang, W.; Li, Y.; Wu, X.; Guo, S. Review of the applied mechanical problems in ocean thermal energy conversion. Renew. Sustain. Energy Rev. 2018, 93, 231–244. [Google Scholar] [CrossRef]
  38. Abu Husain, M.K.; Zaki, N.I.M.; Azman, N.U.; Sarip, S.; Jaafar, A.B.; Mukhlas, N.; Shah, M.S.A.; Umar, S.; Ng, C.T.; Yahaya, N.; et al. Feasibility Study of A Fixed Offshore OTEC Plant for Cost-Effective Power Generation In Malaysia. Malays. J. Civ. Eng. 2024, 36, 9–18. [Google Scholar] [CrossRef]
  39. Langer, J.; Blok, K. The global techno-economic potential of floating, closed-cycle ocean thermal energy conversion. J. Ocean Eng. Mar. Energy 2023, 10, 85–103. [Google Scholar] [CrossRef]
  40. Langer, J.; Quist, J.; Blok, K. Upscaling scenarios for ocean thermal energy conversion with technological learning in Indonesia and their global relevance. Renew. Sustain. Energy Rev. 2022, 158, 112086. [Google Scholar] [CrossRef]
  41. Olim, S.T.; Nickoloff, A.; Moffat, L.J.; Weaver, A.J.; Eby, M. Mitigating anthropogenic climate change with aqueous green energy. Sci. Rep. 2025, 15, 1700. [Google Scholar] [CrossRef]
  42. Osorio, A.F.; Arias-Gaviria, J.; Devis-Morales, A.; Acevedo, D.; Velasquez, H.I.; Arango-Aramburo, S. Beyond electricity: The potential of ocean thermal energy and ocean technology ecoparks in small tropical islands. Energy Policy 2016, 98, 713–724. [Google Scholar] [CrossRef]
  43. Ma, Q.; Zheng, Y.; Lu, H.; Li, J.; Wang, S.; Wang, C.; Wu, Z.; Shen, Y.; Liu, X. A Novel Ocean Thermal Energy Driven System for Sustainable Power and Fresh Water Supply. Membranes 2022, 12, 160. [Google Scholar] [CrossRef]
  44. Jin, Z.; Wang, H. Modelling and experiments on ocean thermal energy for desalination. Int. J. Sustain. Energy 2015, 34, 103–112. [Google Scholar] [CrossRef]
  45. Mutair, S.; Ikegami, Y. Design optimization of shore-based low temperature thermal desalination system utilizing the ocean thermal energy. J. Sol. Energy Eng. 2014, 136, 041005. [Google Scholar] [CrossRef]
  46. Pastor, J.; Liu, Y. Wave Climate Resource Analysis Based on a Revised Gamma Spectrum for Wave Energy Conversion Technology. Sustainability 2016, 8, 1321. [Google Scholar] [CrossRef]
  47. Guiberteau, K.L.; Liu, Y.; Lee, J.; Kozman, T.A. Investigation of Developing Wave Energy Technology In the Gulf of Mexico. Distrib. Gener. Altern. Energy J. 2012, 27, 36–52. [Google Scholar] [CrossRef]
  48. Sustainable Cooling: A Deep Dive into Seawater Air-Conditioning (SWAC) Solutions for the Caribbean. Available online: https://blogs.worldbank.org/en/latinamerica/sustainable-cooling--a-deep-dive-into-seawater-air-conditioning-?utm_source=chatgpt.com (accessed on 13 May 2025).
  49. Towards a Green Economy: Pathways to Sustainable Development and Poverty Eradication: Sustainable Development Knowledge Platform. Available online: https://sustainabledevelopment.un.org/index.php?page=view&type=400&nr=126&menu=35 (accessed on 2 May 2024).
  50. Sanjivy, K.; Marc, O.; Davies, N.; Lucas, F. Energy performance assessment of Sea Water Air Conditioning (SWAC) as a solution toward net zero carbon emissions: A case study in French Polynesia. Energy Rep. 2023, 9, 437–446. [Google Scholar] [CrossRef]
  51. Sanjivy, K.; Marc, O.; Lucas, F. Sea Water Air Conditioning (SWAC): A Resilient and Sustainable Cooling Solution for hot and humid climates-Energy Per-formance and Numerical Modeling. October 2023. Available online: https://hal.science/hal-04301115 (accessed on 19 January 2024).
  52. Fan, C.; Chen, Y. Design Optimization of Ocean Thermal Energy Conversion (OTEC) Considering the Off-Design Condition. J. Therm. Sci. 2023, 32, 2126–2143. [Google Scholar] [CrossRef]
  53. Xiao, C.; Hu, Z.; Chen, Y.; Zhang, C. Thermodynamic, economic, exergoeconomic analysis of an integrated ocean thermal energy conversion system. Renew. Energy 2024, 225, 120194. [Google Scholar] [CrossRef]
  54. Langer, J.; Ferreira, C.I.; Quist, J. Is bigger always better? Designing economically feasible ocean thermal energy conversion systems using spatiotemporal resource data. Appl. Energy 2022, 309, 118414. [Google Scholar] [CrossRef]
  55. Upshaw, C. Thermodynamic and Economic Feasibility Analysis of a 20 MW Ocean Thermal Energy Conversion (OTEC) Power Plant. 2012. Available online: https://repositories.lib.utexas.edu/items/5c400cb5-55fd-4517-ac94-c291c7c710c7 (accessed on 30 April 2024).
  56. Samsuri, N.; Sazali, N.; Jamaludin, A.S.; Razali, M.N.M. Techno-economic efficiencies and environmental criteria of Ocean Thermal Energy Conversion closed Rankine cycle using different working fluids. IOP Conf. Ser. Mater. Sci. Eng. 2021, 1062, 012042. [Google Scholar] [CrossRef]
  57. Oko, C.O.C.; Obeneme, W.B. Thermo-economic analysis of an ocean thermal power plant for a Nigerian coastal region. Int. J. Ambient. Energy 2018, 39, 562–572. [Google Scholar] [CrossRef]
  58. Adiputra, R.; Utsunomiya, T.; Koto, J.; Yasunaga, T.; Ikegami, Y. Preliminary design of a 100 MW-net ocean thermal energy conversion (OTEC) power plant study case: Mentawai island, Indonesia. J. Mar. Sci. Technol. 2020, 25, 48–68. [Google Scholar] [CrossRef]
  59. Patterson, S.E.; Spalding, M.A. Molecular Design of High Density Polyethylene for Pipes. In Pipelines 2012: Innovations in Design, Construction, Operations, and Maintenance—Doing More with Less—Proceedings of the Pipelines 2012 Conference; ASCE: Reston, VA, USA, 2012; pp. 964–973. [Google Scholar] [CrossRef]
  60. Keesmaat, K. Installation Limits of Large Diameter Cold Water Pipes in Deep Water for Land-Based OTEC Plants. Master’s Thesis, TU Delft, Delft, The Netherlands, 5 August 2015. Available online: https://repository.tudelft.nl/file/File_378943bf-4dca-4cd2-9ce8-571df916eaaf?preview=1 (accessed on 12 April 2025).
  61. Energy, Resources, and Technology Division, Department of Business, Economic Development & Tourism, State of Hawaii. Sea Water District Cooling Feasibility Analysis; Hawaii.gov: Honolulu, HI, USA, 2002.
  62. Santamouris, M. Cooling the buildings—Past, present and future. Energy Build. 2016, 128, 617–638. [Google Scholar] [CrossRef]
  63. Sivak, M. Potential energy demand for cooling in the 50 largest metropolitan areas of the world: Implications for developing countries. Energy Policy 2009, 37, 1382–1384. [Google Scholar] [CrossRef]
  64. ASHRAE Store. ASHRAE 55-2017. Available online: https://store.accuristech.com/ashrae/standards/ashrae-55-2017?product_id=1994974 (accessed on 26 April 2024).
  65. Booking.com|Official Site. The Best Hotels, Flights, Car Rentals & Accommodations. Available online: https://www.booking.com/index.en-gb.html?label=gen173nr-1DCAEoggI46AdIM1gEaHWIAQGYAQm4ARfIAQzYAQPoAQGIAgGoAgO4As-2tLgGwAIB0gIkMDNlOTU0NWYtNDI4Yi00YjRlLTgyZGQtYjg4MzVjNzhkZWQx2AIE4AIB&sid=99618c5d612900ed31600db56e741787&keep_landing=1&sb_price_type=total& (accessed on 14 October 2024).
  66. Trip.com Official Site. Travel Deals and Promotions. Available online: https://us.trip.com/?locale=en-us (accessed on 14 October 2024).
  67. GEBCO. Gridded Bathymetry Data. Available online: https://www.gebco.net/data_and_products/gridded_bathymetry_data/ (accessed on 28 April 2024).
  68. Copernicus Marine Service. Global Ocean Physics Analysis and Forecast. Available online: https://data.marine.copernicus.eu/product/GLOBAL_ANALYSISFORECAST_PHY_001_024/description (accessed on 28 April 2024).
  69. National Centers for Environmental Information (NCEI). Past Weather. Available online: https://www.ncei.noaa.gov/access/past-weather/22.16799201091221,-94.84984515217047,16.93260562480587,-84.65998763121615 (accessed on 26 April 2024).
  70. World Tourism Organization. UNWTO Briefing Note—Tourism and COVID-19, Issue 2. Tourism in SIDS—The Challenge of Sustaining Livelihoods in Times of COVID-19; UNWTO: Madrid, Spain, 2020. [Google Scholar] [CrossRef]
  71. Renewable Energy Opportunities for Island Tourism. Available online: https://www.irena.org/publications/2014/Aug/Renewable-Energy-Opportunities-for-Island-Tourism (accessed on 2 May 2024).
  72. Lockheed Martin Final Report on Ocean Thermal Energy Conversion—Google Search. Available online: https://www.google.com/search?q=lockheed+martin+final+report+on+ocean+thermal+energy+conversion&rlz=1C1JCYX_jaJP1082JP1082&oq=lockheed+martin+final+report+on+ocean+thermal+ener&gs_lcrp=EgZjaHJvbWUqCQgBECEYChigATIGCAAQRRg5MgkIARAhGAoYoAEyCQgCECEYChigATIJCAMQIRgKGKAB0gEJMTE1NjhqMGo3qAIAsAIA&sourceid=chrome&ie=UTF-8 (accessed on 30 April 2024).
  73. Giostri, A.; Romei, A.; Binotti, M. Off-design performance of closed OTEC cycles for power generation. Renew. Energy 2021, 170, 1353–1366. [Google Scholar] [CrossRef]
  74. Bernardoni, C.; Binotti, M.; Giostri, A. Techno-economic analysis of closed OTEC cycles for power generation. Renew. Energy 2019, 132, 1018–1033. [Google Scholar] [CrossRef]
  75. Green Decentralization Reform Promotion Project. Kumejima Deep Sea Water Composite Use Basic Survey Report. Kumejima Town, Okinawa Prefecture. Available online: http://www.gosea.info/en/infomation/dswusefs/ (accessed on 15 February 2024).
  76. Martin, B.; Okamura, S.; Nakamura, Y.; Yasunaga, T.; Ikegami, Y. Status of the “Kumejima Model” for advanced deep seawater utilization. In Proceedings of the Techno-Ocean 2016: Return to the Oceans, Kobe, Japan, 6–8 October 2016; pp. 211–216. [Google Scholar] [CrossRef]
  77. Report on the Feasibility Study of Using Deep Seawater to Revitalize Remote Islands. Cabinet Office Okinawa General Bureau, Economy, Trade and Industry Department: Naha, Japan. Available online: http://www.gosea.info/en/infomation/dswusefs/ (accessed on 15 October 2024).
  78. Ministry of Earth Sciences|Technology|Lakshadweep. Explainer/Low Temperature Thermal Desalination (LTTD) Technology. Available online: https://www.manoramayearbook.in/current-affairs/india/2022/07/23/low-temperature-thermal-desalination-lttd-technology.html (accessed on 3 April 2025).
  79. GlobalPetrolPrices.com. Diesel Prices Around the World, 22-Apr-2024. Available online: https://www.globalpetrolprices.com/diesel_prices/ (accessed on 30 April 2024).
  80. Keiner, D.; Salcedo-Puerto, O.; Immonen, E.; van Sark, W.G.; Nizam, Y.; Shadiya, F.; Duval, J.; Delahaye, T.; Gulagi, A.; Breyer, C. Powering an island energy system by offshore floating technologies towards 100% renewables: A case for the Maldives. Appl. Energy 2022, 308, 118360. [Google Scholar] [CrossRef]
  81. Salameh, T.; Ghenai, C.; Merabet, A.; Alkasrawi, M. Techno-economical optimization of an integrated stand-alone hybrid solar PV tracking and diesel generator power system in Khorfakkan, United Arab Emirates. Energy 2020, 190, 116475. [Google Scholar] [CrossRef]
  82. Why Does Burning 1 Litre of Fuel Create over 2kg of Carbon Dioxide? Available online: https://www.driverknowledgetests.com/resources/why-does-burning-1-litre-of-fuel-create-over-2kg-of-carbon-dioxide/ (accessed on 18 July 2024).
  83. World Bank. State and Trends of Carbon Pricing 2024. In State and Trends 2024; World Bank: Washington, DC, USA, 2024. [Google Scholar] [CrossRef]
  84. Elantary, A.R. Energy Consumption Patterns in Residential Buildings: A Comparative Study of Air Conditioning Systems. Yanbu J. Eng. Sci. 2025, 22, 2–12. [Google Scholar] [CrossRef]
  85. Electric Prices by Country|Doing Business. World Bank Group Archives: Washington, DC, USA, 2023. Available online: https://databank.worldbank.org/embed/Electric-Prices-by-Country/id/7b12e700 (accessed on 14 May 2025).
  86. Islam, M.A.; Chowdhury, R.I. Generalized Linear Models. In Analysis of Repeated Measures Data; Springer: Singapore, 2017. [Google Scholar] [CrossRef]
  87. Dou, Y.; Liu, Y.; Whittington, W.; Miller, J. Experimental Calibration of ISV Damage Model Constants for Pure Copper for High-Speed Impact Simulation. In Proceedings of the ASME 2016 International Mechanical Engineering Congress and Exposition, Phoenix, AZ, USA, 11–17 November 2016. [Google Scholar] [CrossRef]
  88. Prataviera, F.; Batista, A.M.; Ortega, E.M.M.; Cordeiro, G.M.; Silva, B.M. The Logit Exponentiated Power Exponential Regression with Applications. Ann. Data Sci. 2023, 10, 713–735. [Google Scholar] [CrossRef]
  89. Surroop, D.; Raghoo, P. Renewable energy to improve energy situation in African island states. Renew. Sustain. Energy Rev. 2018, 88, 176–183. [Google Scholar] [CrossRef]
  90. Boccaletti, C.; Fabbri, G.; Marco, L.J.; Santini, E. An overview on renewable energy technologies for developing countries: The case of Guinea Bissau. Renew. Energy Power Qual. J. 2008, 6, 343–348. [Google Scholar] [CrossRef]
  91. Anderson, J.H. Ocean thermal power—The coming energy revolution. Sol. Wind. Technol. 1985, 2, 25–40. [Google Scholar] [CrossRef]
  92. Water Intake System Agricultural Industry Operation Platform. Available online: https://agri.nais.net.cn/patentdetails/26A84DC6-61D0-4A4F-A37A-13D4192F2829.html (accessed on 13 April 2025).
  93. Vega, L.A. Economics of ocean thermal energy conversion (OTEC): An update. In Proceedings of the Offshore Technology Conference, Houston, TX, USA, 3–6 May 2010; Available online: https://onepetro.org/OTCONF/proceedings-abstract/10OTC/All-10OTC/36399 (accessed on 30 April 2024).
  94. Atalah, A.; Kariuki, J. Cost Comparison between Horizontal Directional Drilling and Open-Cut Construction Methods in Nairobi, Kenya. In Proceedings of the International Conference on Pipelines and Trenchless Technology 2009, ICPTT 2009: Advances and Expe-riences with Pipelines and Trenchless Technology for Water, Sewer, Gas, and Oil Applications, Shanghai, China, 18–21 October 2009; Volume 361, pp. 1369–1378. [Google Scholar] [CrossRef]
  95. Ocean Thermal Energy Conversion: Technology Brief. 2014. Available online: https://www.irena.org/Publications/2014/Jun/Ocean-Thermal-Energy-Conversion (accessed on 31 January 2025).
  96. Martin, B.; Okamura, S.; Yasunaga, T.; Ikegami, Y.; Ota, N. OTEC and Advanced Deep Ocean Water Use for Kumejima: An Introduction. In Proceedings of the Oceans Conference Record (IEEE), Chennai, India, 20 February 2022. [Google Scholar] [CrossRef]
  97. Langer, J.; Quist, J.; Blok, K. Recent progress in the economics of ocean thermal energy conversion: Critical review and research agenda. Renew. Sustain. Energy Rev. 2020, 130, 109960. [Google Scholar] [CrossRef]
  98. Gomes, C.S.F.; Fernandes, J.V.; Fernandes, F.V.; Silva, J.B.P. Salt Mineral Water and Thalassotherapy. In Minerals latu sensu and Human Health: Benefits, Toxicity and Pathologies; Springer: Cham, Switzerland, 2021; pp. 631–656. [Google Scholar] [CrossRef]
  99. Liu, C.C. Ocean thermal energy conversion and open ocean mariculture: The prospect of Mainland-Taiwan collaborative research and development. Sustain. Environ. Res. 2018, 28, 267–273. [Google Scholar] [CrossRef]
Figure 1. Conceptual diagram of modeling structure.
Sustainability 17 04724 g001
Figure 2. Capital cost CAPEX and LCOE of OTEC-SWAC system at SIDS locations.
Sustainability 17 04724 g002
Figure 3. Representative figure of the relationship between (a) LCOE, pipe length, and temperature difference and (b) LCOE and change in net power.
Sustainability 17 04724 g003
Figure 4. Impact of a ±30% swing on each driver on LCOE.
Sustainability 17 04724 g004
Table 1. Estimated capital cost of OTEC plants. Data obtained from [32,41]. Note: Costs per kW vary based on specific technology choices, particularly the heat exchangers, and whether desalinated water production is included in the calculation. These costs do not include installation and assembly, which add a significant amount to the overall project cost.
Plant TypeSizeCapital Cost (Millions USD)Cost per kW (USD)
Closed-Cycle OTEC10 MW286.321,606–27,012
Closed-Cycle OTEC50 MW886.911,223–16,578
Open-Cycle OTEC10 MW378.433,962–35,697
Open-Cycle OTEC50 MW1308.622,722–24,459
Onshore Open-Cycle OTEC1.36 MW42.831,471
Table 4. Technical analysis for the model OTEC-SWAC-powered hotel. DOW is the deep-ocean water, SOW is the surface ocean water, dia stands for diameter, Evap is the evaporator, and Cond is the condenser of the OTEC plant.
CountryDOW Pipe Length (km)DOW Pipe Dia (m)SOW Pipe Dia (m)DOW Pipe Temp Inc. (%)DOW Pump (MW)SOW Pump (MW)Evap Area (m2)Cond Area (m2)Gross OTEC Power (MW)Net Therm. EffAvg CDD/dayCooling Req (kWh/day)SWAC Pump (kW)SWAC Heat EX (m2)
American Samoa6212%2112,98315,402102.16%7.854,67452157
Bahamas14313%3222,81127,350131.23%5.135,49114352
Belize10212%2114,93917,781111.88%7.049,15237956
Bermuda4631%4030307,982374,032850.09%2.416,5821534
Cabo Verde3211%5335,00142,173160.79%3.222,2733532
The Cayman Islands4212%2216,26019,377111.77%6.545,53530156
Cuba5211%2218,84622,529121.49%4.229,4408137
Curacao7212%2216,80720,049111.68%7.854,67452165
Dominica5211%2217,15720,480111.62%6.142,29924153
Dominican Republic14213%2217,18820,519111.62%8.458,53163975
The Federated States of Micronesia5211%2113,01715,445102.16%7.955,33554060
Fiji2211%2114,79617,604111.91%5.135,65214436
French Polynesia3212%2114,46117,193111.98%6.746,58032247
Guam8212%2113,25215,734102.10%7.754,09750558
Guinea-Bissau39312%3225,21430,277131.10%0.215300.0112
Guyana74312%2216,48619,654111.73%4.733,01611540
Haiti2211%2218,98122,695121.48%3.222,2733532
Jamaica5212%2216,14319,233111.79%7.351,28043064
Kiribati3211%2113,15715,616102.12%4.632,05310535
The Maldives4211%2217,25520,601111.61%8.861,488741111
The Marshall Islands3211%2113,39015,904102.07%4.330,3418933
Mauritius3211%3222,45526,911131.27%4.229,6008337
Papua New Guinea6212%2216,13119,219111.79%6.042,25324146
Puerto Rico11312%3220,93625,072121.34%3.826,4795941
The Seychelles43312%2218,74922,410121.51%7.552,24445581
The Solomon Islands7212%2112,56614,889102.27%6.545,53530149
St. Vincent and the Grenadines4211%2216,74619,974111.69%7.351,28043062
Timor-Leste4211%2114,81217,624111.91%6.847,83634959
Trinidad and Tobago60313%2216,45919,621111.74%6.746,59032255
Tuvalu3212%2112,60114,933102.26%8.458,61164263
The U.S. Virgin Islands3211%2218,32821,892121.57%7.149,86839568
Vanuatu14213%2215,36318,302111.80%4.733,01611534
Table 5. Return on investment (ROI) was computed exclusively for SIDS with available tariff data whose OTEC–SWAC LCOE is lower than the prevailing electricity tariff, thereby excluding economically non-viable cases.
CountryOTEC LCOE (USD/kWh)Electricity Tariff USD/kWh [85]Gross Revenue (USD/year)ROISimple Payback Period
Cabo Verde0.180.263$13,270,3495%20
Dominica0.170.368$18,568,3978%13
The Federated States of Micronesia0.130.414$20,889,44611%9
Fiji0.090.218$10,999,7579%12
Haiti0.110.211$10,646,5547%14
Jamaica0.170.264$13,320,8064%24
Kiribati0.120.413$20,838,98915%7
The Maldives0.120.394$19,880,29412%9
The Marshall Islands0.100.406$20,485,78618%6
Mauritius0.140.205$10,343,8085%22
Papua New Guinea0.180.289$14,582,2465%22
The Solomon Islands0.180.716$36,127,64215%7
St. Vincent and the Grenadines0.130.346$17,458,3309%11
Timor-Leste0.130.234$11,807,0785%19
Table 6. Results of curve fitting and regression analysis on the cost components.
ComponentFitted FormR SquareStandard Errorp-Value
Location-dependent components c a p e x d e p (million USD) c a p e x d e p = 7631 T 2.54 P n e t 0.74 93%16%Intercept 1.1 10 91
T 1.1 10 70
P n e t 0
Seawater intake system c a p e x i n t a k e (million USD) c a p e x i n t a k e = 2.73 10 3 L 1.20 P n e t 0.30 99%9.3%Intercept0
p i p e l e n g t h 0
P n e t 1.1 10 259
Location-independent components c a p e x i n d (million USD) c a p e x i n d = 14 P n e t 0.67 70%34%Intercept 1.3 10 274
P n e t 1 10 158
OPEX3% of C A P E X t o t a l per year, where C A P E X t o t a l = c a p e x d e p + c a p e x i n t a k e + c a p e x i n d
LCOE function (USD/kWh) L C O E = ( 7631 T 2.54 P n e t 0.74 + 2.73 10 3 L 1.20 P n e t 0.30 + 14 P n e t 0.67 ) + t O P E X t 1 + r t P n e t C F 8760 t 1 + r t
r is the discount rate, CF is the capacity factor, and t is the total project lifetime in years. This representative function was selected after numerous regression analyses, as given in Figure A1 in Appendix A. These functional regressions were carried out to determine the best fit for the data via measured R-squared values and mean squared error after the analysis data were cleaned by removing the outliers of countries with a temperature difference lower than 18 °C and pipe lengths longer than 20 km.
Table 7. Categorization of SIDS and recommended policy pathways.
GroupSIDS Main Explanatory FactorRecommended Actions
Techno economically feasibleAmerican Samoa
Belize
Cabo Verde
The Cayman Islands
Cuba
Curacao
Dominica
The Federated States of Micronesia
Fiji
French Polynesia
Guam
Haiti
Jamaica
Kiribati
The Maldives
The Marshall Islands
Mauritius
Papua New Guinea
The Solomon Islands
St. Vincent and Grenadins
Timor Leste
Tuvalu
The US Virgin Islands
Steep near-shore bathymetry results in short intake pipes (≤10 km), keeping capital cost below ≈200 M USD. Diesel tariffs > 0.30 USD/kWh yield large LCOE savings (≥0.15 USD/kWh). High ambient cooling loads monetize the SWAC stream, driving additional revenue.
In Cabo Verde, the T is 16 °C; however, the short pipe length of 3 km gives an OTEC LCOE of 0.18 USD/kWh, much lower than the diesel LCOE (0.36 USD/kWh).
Technical: adopt modular 6–10 MW onshore units; use bundled HDPE pipes and aluminum plate-fin heat exchangers for lower CAPEX.
Financial: leverage concessional climate finance and blended debt at <3% to keep LCOE < 0.15 USD/kWh. Structure power-purchase agreements that bundle electricity and chilled-water services.
Institutional: fast-track marine zoning and environmental permits; create “OTEC eco-park” special-purpose zones that collocate desalination, aquaculture, and tourism cooling to diversify revenue.
Technically feasible but economically constrainedDominican Republic
Guyana
The Seychelles
Trinidad and Tobago
Vanuatu
Adequate temperature difference is available T > 18 °C, pipe lengths > 10 km, and capital cost > 250 million USD. This, combined with diesel LCOE ≤ 0.30 USD/kWh, narrows the economic margin, as diesel LCOE is less than OTEC LCOE. Trinidad and Tobago is additionally penalized by very low diesel costs (0.65 USD/l).Technical: deploy higher-efficiency hybrid cycles or floating offshore plants to reduce pipe length; pilot solar-boosted hybrid OTEC to raise net efficiency where T is weak.
Financial: introduce green-bond frameworks, viability gap grants, or carbon offset revenues; reform fuel-subsidy structures so tariffs reflect import parity pricing.
Institutional: Establish regional OTEC development funds (e.g., CARICOM green window); engage multilateral insurers to de-risk first-of-a-kind assets.
Unsuitable under current conditionsBahamas
Bermuda
Guinea-Bissau
Puerto Rico
Extremely low T and long intake pipes (>40 km) drive capital costs above 1 billion USD, giving high OTEC LCOE higher than the diesel LCOE by 1 USD/kWh. Technical: shift focus to offshore OTEC platforms or hybrid floating desalination to shorten pipe length; invest in R&D on flexible HDPE risers and deep-water moorings.
Financial: pursue grant-funded resource assessments and small-scale demonstrators rather than utility projects; explore blue-carbon credits to improve project economics.
Institutional: prioritise alternative renewables (PV + storage, wind) in near-term energy plans; maintain a strategic watch on OTEC cost-learning curves for future re-entry.
Disclaimer/Publisher’s Note: The statements, opinions and data contained in all publications are solely those of the individual author(s) and contributor(s) and not of MDPI and/or the editor(s). MDPI and/or the editor(s) disclaim responsibility for any injury to people or property resulting from any ideas, methods, instructions or products referred to in the content.

