Article

Ripple Effect or Spatial Interaction? A Spatial Analysis of Green Finance and Carbon Emissions in the Yellow River Basin

School of Economics and Management, Xinjiang University, Urumqi 830049, China
*
Author to whom correspondence should be addressed.
Sustainability 2025, 17(10), 4713; https://doi.org/10.3390/su17104713
Submission received: 19 April 2025 / Revised: 16 May 2025 / Accepted: 19 May 2025 / Published: 20 May 2025
(This article belongs to the Topic Sustainable and Green Finance)

Abstract

:
Grounded in the theory of new economic geography, this research develops a comprehensive theoretical framework to examine the spatial interaction mechanisms between the Green Finance Index and carbon emissions. Employing a range of econometric techniques—including three-dimensional kernel density estimation, spatial quantile regression, bivariate spatial autocorrelation analysis, and the spatial linkage equation model—the dynamic evolution, spatial pattern shifts, and mutual influences of green finance and carbon emissions in the middle and lower reaches of the Yellow River from 2003 to 2022 are systematically assessed. The findings indicate that (1) both carbon emissions and the Green Finance Index have experienced a trajectory of continuous growth, phased decline, and structural optimization, accompanied by a gradual shift in the regional center of gravity from coastal economic zones towards resource-intensive and traditional industry-concentrated areas; (2) significant spatial clustering is evident for both green finance and carbon emissions, demonstrating a strong spatial correlation and regional synergy effects; (3) a persistent negative spatial correlation exists between green finance and carbon emissions; and (4) green finance exerts a stable negative spatial spillover effect on carbon emissions, suggesting that the influence of green finance extends beyond localities to adjacent regions through spatial externalities, manifesting pronounced spatial transmission and linkage characteristics. By unveiling the bidirectional spatial association between green finance and carbon emissions, this study highlights the pivotal role of green finance in driving regional low-carbon transitions. The results provide theoretical insights for optimizing green finance policies within the Yellow River Basin and offer valuable international references for similar regional low-carbon development initiatives.

1. Introduction

At the 2020 United Nations General Assembly, China formally introduced its “dual-carbon” goal, underscoring its commitment to global climate governance. This objective aims not only to advance global sustainable development, but also to contribute Chinese expertise and strength toward achieving a community of shared human destiny. According to data from 2023, China has succeeded in reducing carbon dioxide emissions by 1.7% compared to the previous year, indicating initial progress in emission reduction. However, the decoupling of carbon emissions from economic growth remains sluggish, with tensions between the two increasing, posing an urgent challenge.
As a result, balancing carbon emission reduction with stable economic growth has become a critical policy issue. To address this, the role of green finance has become increasingly vital, particularly in the energy-intensive Yellow River Basin. To achieve national carbon reduction targets, the 20th Party Congress emphasized the need to regulate energy consumption—especially the intensity and total usage of fossil fuels—based on actual circumstances. This approach aims to gradually control both total carbon emissions and emission intensity. Achieving this will require a fundamental shift away from the “high growth—high energy consumption—high emissions” development model. In this context, the introduction and enhancement of green policies are essential. Green finance, as an emerging financial tool, plays a crucial role in facilitating the low-carbon economic transition. By optimizing the capital supply structure, green finance can effectively support the growth of environmentally sustainable industries, guide the transformation of high-emission sectors toward low-carbon alternatives, and thus provide substantial backing for the realization of carbon emission reduction goals.
In recent years, as green transformation gradually integrates with traditional finance, green finance has increasingly contributed to promoting the low-carbon economic transition. From a theoretical standpoint, green finance restrains the expansion of highly polluting industries while encouraging the growth of low-carbon sectors by adjusting capital flows and optimizing capital allocation. This shift in resource distribution not only accelerates the development of environmental protection industries, but also facilitates the green transformation of traditional polluting enterprises, thus providing significant support for achieving carbon emissions reduction targets.
Green finance, through mechanisms such as green investment and green credit, not only reduces carbon emissions, but also drives the structural transformation of industries toward greener alternatives by optimizing funding allocation. This helps to achieve broader environmental protection goals. Despite its considerable potential in advancing carbon neutrality, the practical application of green finance still faces numerous challenges. These include regional imbalances in the development of green finance markets, inefficiencies in the allocation of capital to low-carbon projects, and the need for improvements in policy and regulatory frameworks. These obstacles hinder green finance from fully realizing its potential in practice.
As a critical enabler of the “dual-carbon” strategy, green finance must enhance resource efficiency, strengthen climate resilience, and support the implementation of environmental protection initiatives through the strategic allocation of financial instruments and services. However, overcoming the aforementioned challenges to ensure that green finance can effectively contribute to carbon emissions reduction goals remains a pressing issue. To explore the role of green finance at the regional level, this paper empirically analyzes its impact on carbon emissions reduction in the Yellow River Basin. By examining regional differences and spatial autocorrelation, this study reveals the effects of green finance across various regions and the interaction between green finance and carbon emissions. This analysis not only provides valuable insights for other regions, but also offers practical guidance for the development and implementation of green finance policies.

Literature Review

A growing body of literature has examined the spatial and temporal dynamics of carbon emissions and green finance, which has emerged as a key topic in environmental and economic research. Existing studies can be broadly divided into two main strands. The first focuses on the spatial heterogeneity and driving forces of carbon emissions and carbon intensity in high-carbon industries. At the national level, most provinces—except Beijing and Shanghai—have experienced varying degrees of increase in carbon emissions from high-carbon manufacturing sectors. Emission hotspots are primarily located in regions such as the Bohai Bay and the North China Plain [1]. At the regional scale, research has shown that carbon emissions efficiency in the high-carbon manufacturing sectors of the Yangtze River Economic Belt follows a spatial gradient, decreasing from downstream to upstream areas, with a general trend toward reducing spatial disparities over time [2]. Regarding carbon intensity, significant regional differences have been observed, largely influenced by local policies, industrial structures, and patterns of energy consumption [3]. Some studies have specifically examined the spatial and temporal evolution of carbon intensity and its interaction with regional economic structures. For example, evidence from the Yellow River Basin suggests that county-level carbon intensity is shaped by both policy and industrial factors, with disparities in the middle and lower reaches mainly attributed to differences in development levels and energy structures [4,5]. In resource-based areas such as Ningxia, the expansion of the secondary sector and increased energy use are identified as primary drivers of rising emissions. Additionally, differences in industrial composition play a leading role in shaping the variation in carbon intensity across resource-dependent cities [6]. In more developed provinces like Guangdong, carbon emissions from the transport sector continue to rise, with little evidence of decoupling from economic growth, indicating that emission reduction remains insufficiently aligned with economic development [7].
Secondly, the link between green finance and carbon emissions has drawn growing academic interest. The existing literature in this area can be broadly divided into two categories: studies based on national-level data and those focused on regional contexts. At the national scale, the level of coordination between green finance development and carbon emissions exhibits a distinct spatial pattern, characterized by stronger performance in the eastern and southern regions and weaker performance in the western and northern regions of China [8]. At the regional level, research highlights the pivotal role of green finance in advancing the circular economy and facilitating green innovation [9]. For instance, the establishment of green finance reform pilot zones has been shown to significantly reduce energy intensity and enhance the development of green technologies [10]. Moreover, studies point out that the institutionalization of green finance standards globally is shaped by both path dependence and technology-driven processes [11]. Within China, regional differences in green finance models are also evident, reflecting varying policy frameworks and developmental priorities [12]. Despite the need for further improvements in the overall maturity of the green finance system, its contribution to promoting technological innovation and driving low-carbon regional transitions has become increasingly apparent [13,14].
On the other hand, while research on the relationship between green finance and carbon emissions has expanded, much of the existing work still focuses on the broader financial system’s influence on emissions, with limited attention to the distinct mechanisms by which green finance operates. The literature in this area can be broadly grouped into two thematic strands. The first strand examines how financial development affects carbon emissions. A substantial number of studies suggest that financial development generally contributes to increased carbon emissions. However, the effects vary significantly depending on the structure of the financial system and the depth of financial development, often following nonlinear patterns such as inverted U-shaped or U-shaped relationships [14,15,16]. For instance, equity-based financial systems are generally more effective than bank-dominated systems in directing capital toward low-carbon sectors [17]. Similarly, greater financial market liberalization has been found to strengthen green investment orientation and environmentally friendly capital allocation [18]. In addition to direct effects, the financial system may also indirectly reduce emissions by facilitating technological innovation and optimizing industrial structures.
The second strand addresses the direct impact of green finance on carbon emissions. Although fewer studies have specifically focused on this aspect, two main perspectives can be identified. One group of studies argues that green finance—through instruments such as green credit, green investment, and environmental performance-linked mechanisms—can alleviate firms’ financing constraints, restructure industrial systems, and improve corporate responsiveness to environmental regulation, thereby contributing to carbon reduction [17,19,20,21,22,23]. Among these tools, green credit is reported to have the most pronounced mitigation effect, while green bonds and green investment serve as important complements by mobilizing capital and diversifying risk [24,25].
The second perspective emphasizes the heterogeneity in green finance’s effects on carbon emissions. While green finance generally promotes emission reductions, its policy effects tend to be localized, with limited spatial spillover to surrounding regions. Moreover, in some contexts, green finance may inadvertently lead to higher emissions due to weak guidance mechanisms or misallocated resources [26,27,28,29,30].
Although considerable progress has been made in understanding the relationship between the development of green finance and carbon emissions, several critical gaps remain in the current literature. First, empirical studies examining the spatial linkages between green finance and carbon emissions are limited, and a unified analytical framework or conclusive findings are still lacking. Second, the role of urban agglomerations—under the implementation of coordinated regional development strategies, major regional initiatives, and functional zoning policies—has received insufficient attention. Specifically, the spatial interactions between cities, particularly adjacent ones, suggest a potential bidirectional relationship between green finance development and carbon emissions. However, few studies have explicitly investigated the mutual influences and spatial dependencies between cities in this context. This study seeks to address these gaps with three main contributions. First, it adopts a regional perspective by constructing a panel dataset of 49 cities located in the middle and lower reaches of the Yellow River Basin, providing a focused empirical context for analyzing the green finance–emissions nexus. Second, by employing a spatial panel covariance model, this study overcomes limitations associated with conventional linear models, such as potential endogeneity and omitted spatial effects, thus improving estimation robustness. Third, the model incorporates both spatial autocorrelation and spillover effects, capturing not only intra-urban interactions, but also inter-urban dynamics across city clusters. In doing so, this analysis reveals the spatially embedded nature of green finance and carbon emissions, offering a more nuanced understanding of their interdependence in the context of urban regional systems.

2. Materials and Methods
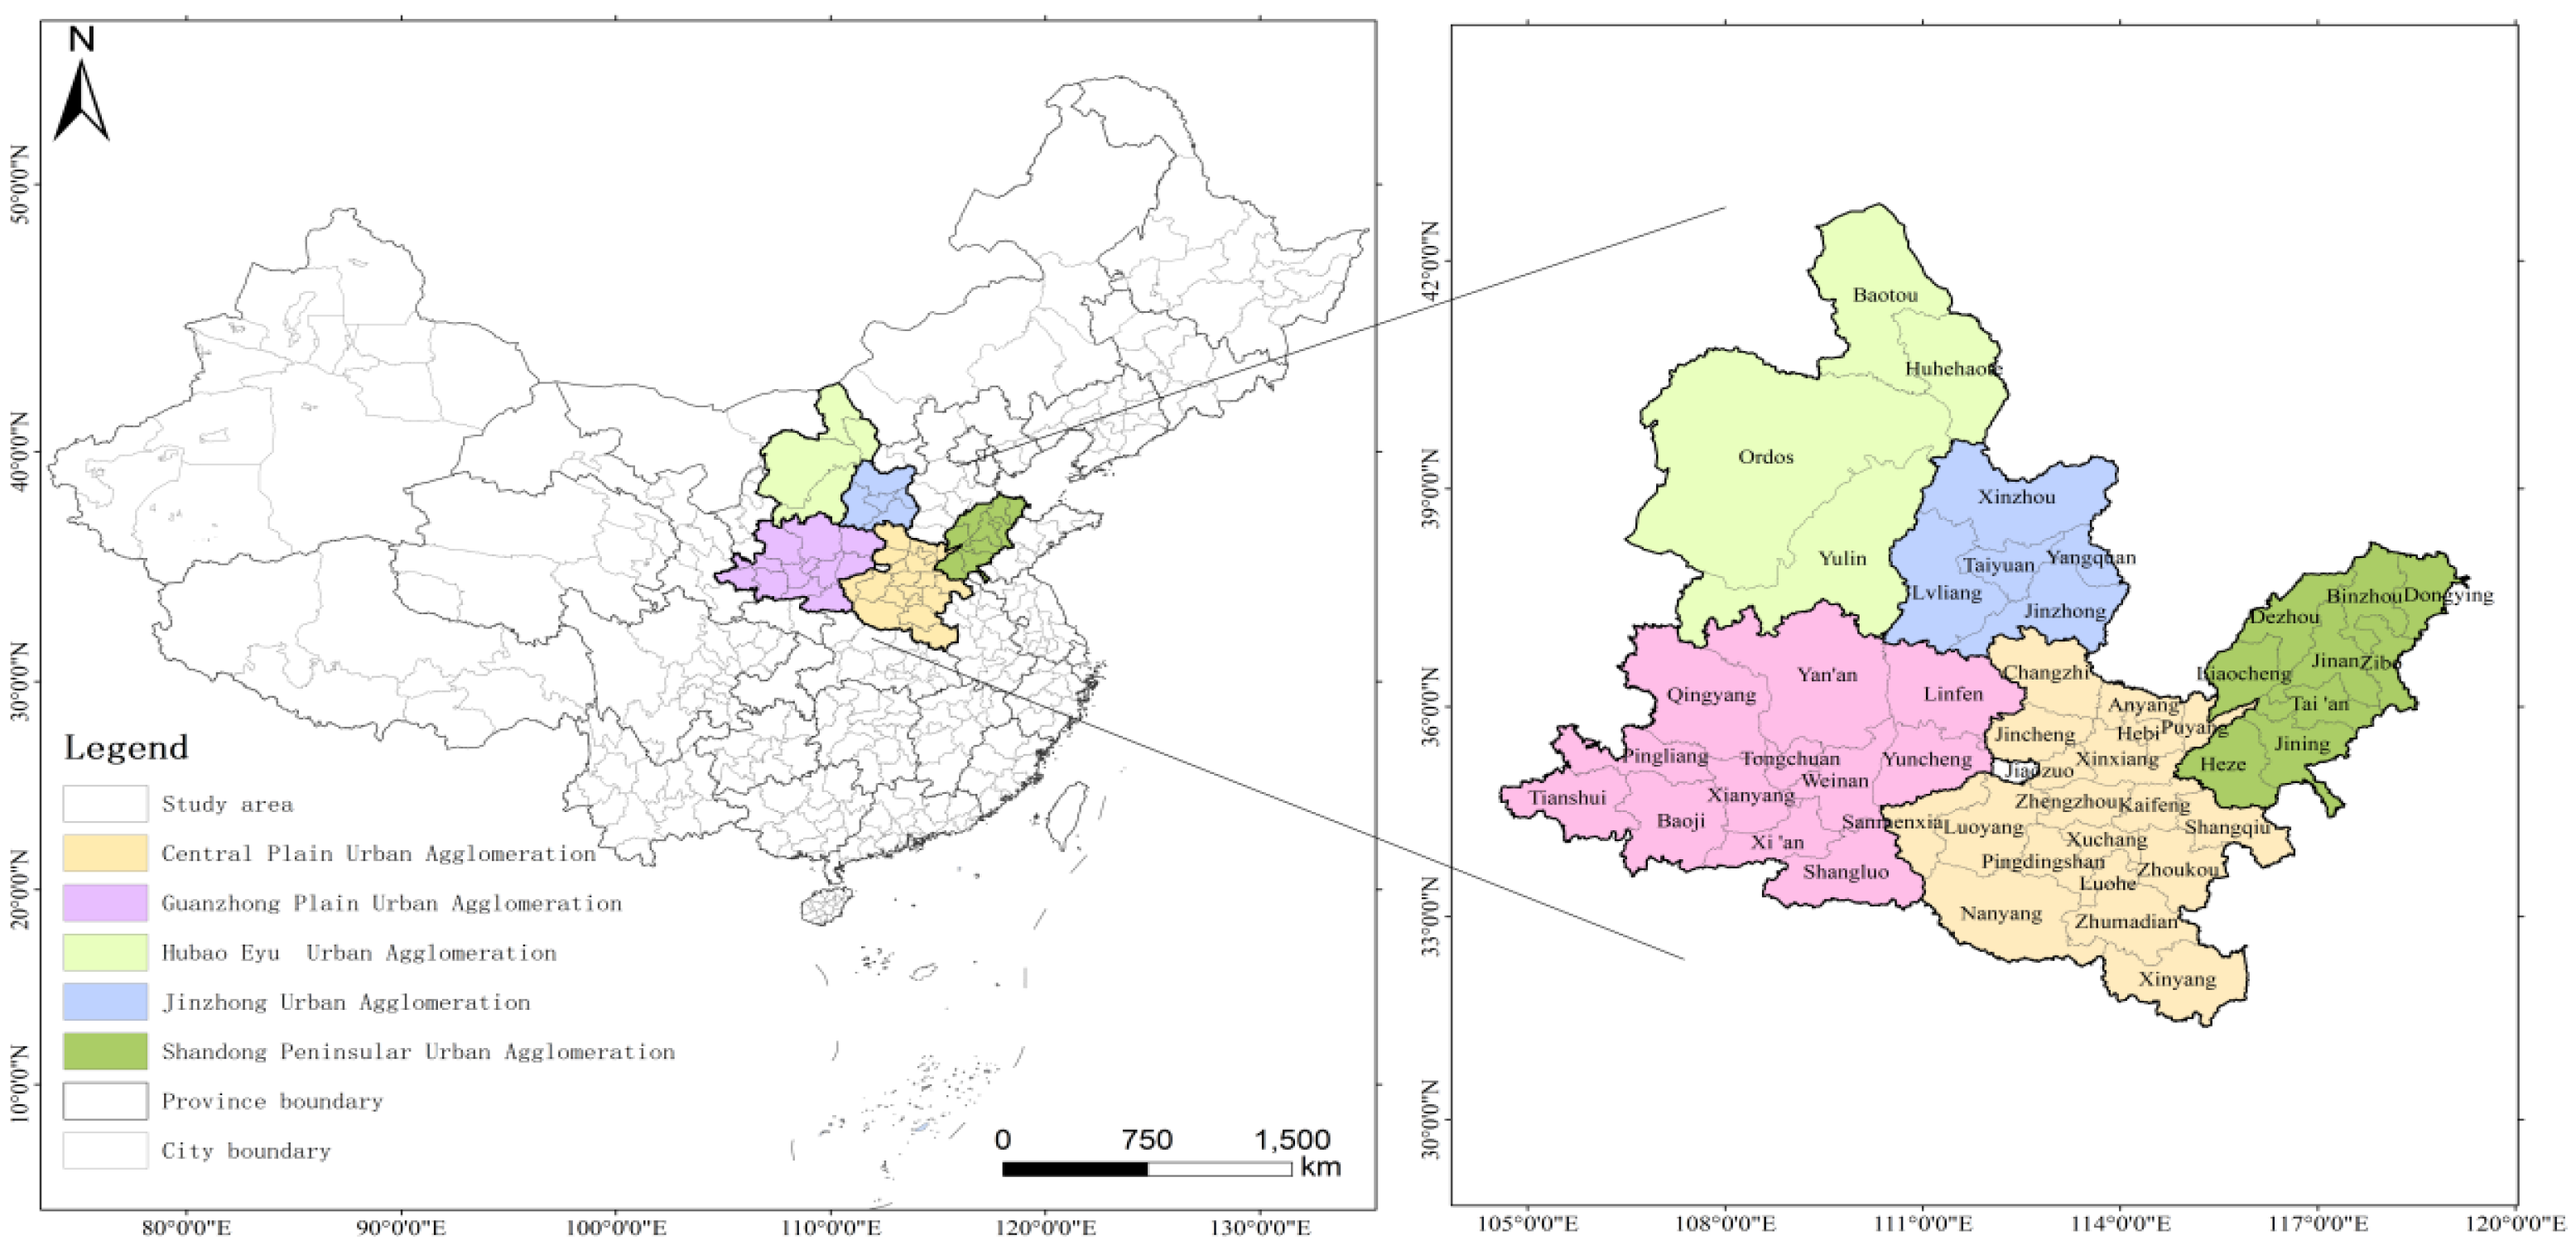
2.1. Study Area

As a critical ecological barrier, major agricultural and pastoral production base, and core energy supply hub, the Yellow River Basin plays a pivotal role in China’s east–west and north–south regional integration strategies. Strategically positioned at the junction of the Asia–Europe Continental Bridge, the basin profoundly influences both regional sustainable development and national ecological security. Particularly in its middle and lower reaches, characterized by a dense concentration of cities, abundant resource endowments, and a high level of industrial activity, the region faces significant environmental pressures. This has made it a national priority for pollution control initiatives and the transition towards greener development. In recent years, the rapid expansion of industrial cities within the basin has led to the establishment of a heavy industrial base dominated by coal, steel, and petrochemical industries. However, the reliance on a resource-intensive growth model has severely exacerbated ecological degradation, soil erosion, and air pollution. In response to these escalating challenges, the Central Committee of the Communist Party of China and the State Council issued the Outline of the Plan for Ecological Protection and High-Quality Development of the Yellow River Basin in 2021. The plan advocates for the construction of a spatial framework characterized by “one axis, two zones, and five poles” to harmonize ecological preservation with economic advancement, underscoring the national commitment to facilitating a green transformation of the Yellow River Basin.
Building upon the integration of natural geographic features and administrative boundaries, this study selected 49 prefecture-level cities across 6 provinces (or autonomous regions) in the middle and lower reaches of the Yellow River, namely, Gansu, Shaanxi, Shanxi, Inner Mongolia, Henan, and Shandong (Figure 1). The study area spans approximately 722,000 square kilometers and had a population of about 280 million in 2022, representing nearly one-fifth of China’s total population. The regional GDP reached CNY 19.8 trillion, accounting for approximately 15.7% of the national economy, and encompasses five major urban agglomerations: Hubao, Jinzhong, Guanzhong Plain, Central Plains, and Shandong Peninsula. Energy resources are heavily concentrated in this region, with coal development prevalent in the middle reaches and oil resources dominating the lower reaches. Nine major national coal production bases are located within the study area, supporting a prominent energy-intensive heavy chemical industry. Nevertheless, reliance on a resource-dependent development model has significantly intensified the region’s ecological fragility. According to the 2024 National Environmental Quality Ranking, 13 out of the 20 cities with the poorest ecological conditions are situated within the middle and lower Yellow River Basin, highlighting severe ecological stress and the urgent necessity for green transformation.
Against the backdrop of the national “dual-carbon” targets, investigating the spatial regulatory effects of green finance on carbon emissions holds substantial theoretical importance and policy relevance. Such exploration is critical for promoting synergistic regional environmental governance and advancing the high-quality development strategy of the Yellow River Basin.
The study area delineated in this research is aligned with the core urban clusters of the Yellow River Basin, as defined by a series of national and provincial-level spatial planning documents. Key references include the Approval of the State Council on the Development Plan of the Central Plains Urban Agglomeration (2016), the Approval of the State Council on the Development Plan of the Hubao, Eyu, and Elm Urban Agglomeration (2018), the Approval of the State Council on the Development Plan of the Guanzhong Plain Urban Agglomeration (2018), and the Territorial Spatial Planning of the Yellow River Basin in Henan Province (2021–2035) and Shandong Province (2021–2035). These planning initiatives provide strategic guidance on the development directions and spatial configurations of the relevant urban agglomerations, offering a robust policy basis for the definition of the study area and ensuring alignment with national and regional development objectives. To enhance the scientific validity and policy relevance of the regional delineation, the study integrates natural geographic continuity with administrative operability, considering the distribution of resources and the urbanization patterns within the middle and lower reaches of the Yellow River Basin. Ultimately, 49 prefecture-level cities across 6 provinces (Gansu, Shaanxi, Shanxi, Inner Mongolia, Henan, and Shandong) were selected, covering five major core urban agglomerations (Table 1).
The selected region exhibits high representativeness, encompassing diverse resource endowments and significant disparities in development levels, thereby providing an effective lens through which to examine the dynamic interplay between green finance and carbon emissions. Geographically, the study area spans the middle and lower reaches of the main Yellow River channel, including typical landforms such as the Loess Plateau, the North China Plain, and the Ruxi Hills. This ensures both topographical continuity and ecological similarity among the sample cities. Natural boundary definitions refer to the geographic demarcation proposed by [31], facilitating ecological comparability and aiding in the identification of spatial constraints on carbon emissions. To maintain data operability and policy consistency, the study area was strictly confined to administratively recognized prefecture-level cities. These cities not only constitute core units within the national Yellow River Basin governance strategy, but also play pivotal roles in ecological protection initiatives and the transformation of high-carbon industries. Economically, the selected cities are distributed across key functional zones, including coal energy bases, agricultural production areas, and manufacturing hubs, reflecting the heterogeneity of industrial structures and governance challenges across the basin during the green transition. Through the dual framework of ecological continuity and policy-functional alignment, the defined study area achieves high representativeness, comparability, and analytical robustness, thereby providing a solid foundation for investigating the spatial linkages between green finance and carbon emissions.

2.2. Variable Selection

This study selects carbon emissions (CO2) and the Green Finance Index as the core explanatory variables. Carbon emissions, a key indicator of environmental pressure and ecological impact, directly reflect the level of regional green development. The Green Finance Index, by contrast, captures the performance of the financial system in supporting green transformation, encompassing dimensions such as capital allocation, green investment, and policy facilitation. The relationship between these two variables forms the primary analytical framework of this research. Drawing upon methodologies from [32,33,34], a series of control variables are incorporated to account for potential confounding factors across economic, governmental, and societal dimensions. Specifically, the control variables include the following: advanced industrial structure (AIS), financial development level (FIN), government intervention level (GIL), and population density (PD). Advanced Industrial Structure (AIS) is measured by the proportion of the combined value added from secondary and tertiary industries to gross domestic product (GDP). The optimization of industrial structures not only promotes the economic green transformation, but also stimulates demand for green financial products by fostering the growth of service and high-tech sectors.
Financial Development Level (FIN) is represented by the ratio of the total balance of loans and deposits of financial institutions to regional GDP at the end of each year. A more developed financial system can effectively channel capital towards low-carbon industries and green technologies, thus contributing to carbon emissions reduction. Government Intervention Level (GIL) is proxied by the ratio of fiscal expenditure to GDP, indicating the government’s role in resource allocation and policy orientation. Higher levels of government intervention are typically associated with stronger support for green investments and more robust environmental governance efforts, thereby accelerating low-carbon transitions. Population Density (PD) is calculated as the ratio of the resident population to the land area. Although areas with higher population density tend to face greater pressures in terms of energy consumption and carbon emissions, they also present greater potential for green infrastructure development and broader applications of green financial products.
Given that the primary focus of this study is not on the detailed impact mechanisms of individual control variables, and in consideration of space constraints, here the regression results pertaining to the control variables will not be presented individually so as to maintain central focus on the main research objectives.

2.3. Methodology

2.3.1. Bivariate Spatial Autocorrelation

To identify the spatial coupling characteristics between green finance and carbon emissions, this study applies a bivariate spatial autocorrelation analysis (bivariate Moran’s I). This method systematically examines the spatial association between two geographically adjacent variables, measuring the correlation between the value of one variable (e.g., Green Finance Index) in a given region and the value of another variable (e.g., carbon emissions) in neighboring regions. Unlike the traditional univariate Moran’s I, which only explores the spatial distribution patterns of a single variable, the bivariate Moran’s I enables the detection of spatial interaction patterns between different variables. It reveals whether the two variables tend to exhibit spatial clustering (homogeneous distribution) or spatial dispersion (heterogeneous distribution) across regions. This analytical approach provides empirical support for uncovering spatial interdependencies and offers a foundational basis for subsequent spatial mechanism modeling and targeted policy interventions.
The bivariate global Moran’s I statistic, which quantifies the overall spatial association between two distinct variables across all regions, is computed as follows:
I = i = 1 n j = 1 n w i j x i x ¯ y j y ¯ S 2 i = 1 n j = 1 n w i j
where n denotes the number of prefecture-level cities (49) selected from the Yellow River Basin urban agglomeration; xi and yi represent the values of the Green Finance Index and carbon emissions, respectively; wij refers to the spatial weight matrix based on geographical distance; S2 denotes the variance of the variable; and I represents the bivariate spatial autocorrelation coefficient. The value of I ranges between [−1,1], where a positive value indicates a positive spatial correlation between green finance and carbon emissions, a negative value ([−1,0)) indicates a negative spatial correlation, and a value of zero suggests no spatial correlation between the two variables.
The bivariate local Moran’s I statistic, which measures the degree of spatial association between two variables at the local (individual region) level, is formulated as follows:
I i = z i x j = 1 n w i j z j y
where xi and yj represent the standardized (variance-normalized) values of the Green Finance Index for city I and the carbon emissions for city j, respectively; wij denotes the spatial weight matrix based on geographic distance; and IiI_iIi is the coefficient of bivariate local spatial autocorrelation. The value of Ii characterizes four types of local spatial associations, analogous to those identified in univariate local Moran’s I analysis, indicating different patterns of clustering and spatial heterogeneity.

2.3.2. Kernel Density Estimation, KDE

To enhance the visualization capability of the spatial model and improve the identification of trend patterns, this study employs a three-dimensional kernel density estimation (3D KDE) method to characterize the joint distribution of the Green Finance Index and carbon emissions across different stages of development. Unlike traditional parametric approaches, kernel density estimation does not require prior assumptions regarding the underlying data distribution, thereby allowing for a flexible and intuitive visualization of variable clustering within different value intervals and their dynamic evolution over time [35]. By associating kernel functions with sample points through nonparametric fitting, the KDE approach effectively reveals spatial correlations and local trends between variables. Building on this, the 3D kernel density estimation is applied to systematically investigate the temporal evolution and spatial heterogeneity of green finance and carbon emissions among cities located in the middle and lower reaches of the Yellow River Basin. The specific model is formulated as follows:
f ( x , y ) = 1 n h x h y i = 1 n K x x h x , y y i h y
In this formula, x and y represent the Green Finance Index and the carbon emission level, respectively, while n denotes the number of samples. Hx and hy are the bandwidth parameters that control the smoothing degrees for the green finance and carbon emission variables. K(·) denotes the bivariate kernel function, typically specified as a Gaussian kernel in this study. Here, xi and yi refer to the Green Finance Index and carbon emission level of city in a given year, while x and y represent the corresponding national annual means, which serve as reference points for identifying relative high-value and low-value agglomerations. This method enables the intuitive visualization of the nonlinear relationship between the two variables and facilitates the detection of their dynamic temporal evolution. It provides a foundational basis for assessing the presence of structural shifts, as well as the strong or weak coupling states between green finance and carbon emissions. Combined with subsequent spatial econometric analysis and regression modeling, the three-dimensional kernel density maps serve as an initial framework for identifying the spatial spillover effects and heterogeneity across the study area.

2.3.3. Spatial Simultaneous Equation Models

Traditional panel covariance models often neglect potential spatial spillover effects when establishing causal relationships among variables. Although classical spatial econometric models—such as the Spatial Lag Model (SLM), Spatial Error Model (SEM), and Spatial Durbin Model (SDM)—incorporate spatial dependency structures to a certain extent, they remain limited in their capacity to capture possible bidirectional causality between explanatory variables. In contrast, the spatial linkage model employed in this study not only addresses these deficiencies and enhances the accuracy of causal inference, but also systematically characterizes the spatial interaction mechanisms between the core variables (cv1 and cv2). Specifically, it differentiates between local and neighboring effects, with particular emphasis on capturing the spatial influence exerted by the core variable in adjacent regions (cv2) on the local core variable (cv1).
Based on this framework, the regression equation formulated in this study is as follows:
L N C O 2 i t = α 0 + α 1 j = 1 n w i j L N C O 2 j t + α 2 j = 1 n w i j L N G F j t + α 3 L N G F i t + α L N Z i t + u i 1 + v i 1 + ε i t L N G F i t = β 0 + β 1 j = 1 n w i j L N G F j t + β 2 j = 1 n w i j L N C O 2 j t + β 3 M A C O 2 i t + β L N X i t + u i 2 + v t 2 + η i t
where α0 and β0 are constants; i represents the sample city; CO2it and CO2jt denote the carbon emissions of cities i and j in year t, respectively; GFit and GFjt represent the levels of green finance in cities i and j in year t, respectively; Xit and Zit denote the vectors of the control variables; and ε i t and η i t refer to unobservable factors. In this specification, α1 is the estimated coefficient capturing the spatial spillover effect of carbon emissions from neighboring cities, reflecting both the magnitude and direction of this influence; β1 is the estimated coefficient measuring the spatial spillover effect of green finance from neighboring cities, similarly indicating its strength and direction; α2 and β2 capture the spatial interaction effects between green finance and carbon emissions across cities, where α2 measures the impact of neighboring cities’ green finances on a city’s carbon emissions, and β2 captures the influence of neighboring cities’ carbon emissions on a city’s green finance development; and α3 and β3 represent the endogenous relationship between carbon emissions and green finance within the same city. Additionally, u i 1 and u i 2 account for the regional (spatial) fixed effects, while v t 1 and v t 2 capture the time-fixed effects.
W represents the spatial weight matrix. Given the complexity of spatial spillover effects, a geographic distance-based spatial weight matrix (Wij) is constructed. The geographic distance (dij) between neighboring cities is calculated using the latitude and longitude coordinates of each city. To account for the spatial correlation, the inverse of the square of the distance is employed, providing a dimensionless measure that reflects the intensity of the spatial interaction between cities.
W i j = 1 d i j 2 0 i j i = j

2.4. Green Finance Indicator Evaluation System

The Green Finance Index evaluation system is developed by employing seven key dimensions, building on the existing literature [36,37] to establish an indicator system for measuring the level of green finance development. The weights of the indicators are determined using the entropy value method, as referenced in [38,39,40,41]. The system incorporates several sub-components, including green credit, green investment, green insurance, green bonds, green support, green funds, and green equity, to construct an index reflecting the annual development level of green finance.
Specifically, the sub-components are as follows: Green credit represents the financial support provided by institutions to environmental protection projects. This is measured by the ratio of loans allocated to such projects relative to the total loans issued by financial institutions. Green investment gauges the relative weight of investments in environmental pollution control within the regional economy. Green insurance reflects the penetration of environmental pollution liability insurance, quantified by the ratio of insurance revenue from environmental pollution liability to total premium revenue in the insurance market. Green bonds measure the share of green bonds in the overall bond market, represented by the ratio of green bond issuance to total bond issuance. Green funds are evaluated based on their market capitalization as a proportion of the total market capitalization of all funds, indicating the market position of green funds.
This study introduces an additional green equity indicator, defined as the proportion of carbon emission rights trading, energy use rights trading, and sewage rights trading within the total equity market. This new indicator is significant, as it reflects the degree to which environmental externalities are internalized in the equity market. A higher proportion of green equity suggests a stronger capacity of the market to employ economic mechanisms to promote corporate environmental responsibility and the transition to a low-carbon economy.
The green equity indicator also highlights the active promotion of green market trading by governments, particularly in the middle and lower reaches of the Yellow River. It serves as an indicator of the maturity of government-led green financial markets and market participation. Therefore, this indicator not only assesses the development of green financial products in the equity market, but also measures the degree of integration between the green financial system and the traditional financial market, reflecting the practical impact of this integration.
Prior to the data analysis, the authors carried out necessary data pre-processing. Missing data were addressed using multiple interpolation techniques, minimizing the impact of incomplete data on the subsequent analyses. To standardize the indicators, all variables were normalized. Outliers were identified and removed to prevent the interference of extreme values with the results. Finally, the entropy method was employed to calculate the weights of each indicator. The comprehensive evaluation system is outlined below.
To minimize subjective bias, the entropy method was employed to determine the indicator weights in an objective manner. The process involved the following steps:
① Initially, the data were standardized using the extreme deviation normalization method to mitigate the impact of varying scales.
X i j = X j t X min X max X min
where xij represents the standardized value of the i-th sample for the j-th indicator (i = 1, 2, 3, …, m; j = 1, 2, 3, …, n); xj(t) denotes the original data for the j-th indicator in the t-th year; and xmin and xmax are the minimum and maximum values of the j-th indicator, respectively. To eliminate the influence of zero and negative values in the formula, 0.0001 is added to the data, yielding x′ij.
② Calculate the weight of the indicator, Sij:
S i j = X i j i = 1 m X i j
③ Calculate the entropy value of the indicator hj, where 0 ≤ hj < 1. To eliminate the impact of negative values resulting from the logarithmic calculation, a negative sign is added in front of the formula:
h j = 1 I n m i = 1 m S i j I n S i j
④ Calculate the coefficient of variation aj:
a j = 1 h j
⑤ Determine the indicator weight wj:
W j = a j j = 1 n a j
⑥ Based on the determined indicator weights and the standardized data, the linear weighting method is applied to measure the comprehensive development index of green finance.
U i = j = 1 n W j X i j
j = 1 n W j = 1
where Ui represents the comprehensive development level of the system in year i; wj denotes the weight; and xij is the standardized value of the j-th indicator for the i-th sample (year i).

Data Source

This study defines the sample period as 2003–2022, primarily based on the milestones in green finance policy development and the availability of data. The implementation of Environmental Impact Assessment (EIA) law in 2003 marked a significant step in the further standardization of China’s environmental management system. Although this law did not directly establish the institutional framework for green finance, it indirectly promoted the development of financial instruments, such as green credit and green investment, by strengthening the project EIA process. Given the law’s early guiding influence on the demand for green finance and the subsequent introduction of related policies, choosing 2003 as the starting point for the sample period is both representative and reasonable.
The sample period is set to conclude in 2022, considering that core data sources such as the China Energy Statistics Yearbook and the China Urban Statistics Yearbook have yet to be released for 2023. This ensures the reproducibility of the data and maintains consistency in statistical definitions.
This study utilizes the EDGAR v8.0 database developed by the European Commission’s Joint Research Centre (JRC) and the International Energy Agency (IEA). The database offers long-term coverage, detailed classification, and reliable data, with a spatial resolution of 0.1° × 0.1°, suitable for long-term dynamic analysis at the city scale. However, due to the complex shapes of city boundaries and the diversity of functional zoning in the lower Yellow River basin, errors may arise during the spatial projection of grid-based carbon emission data, which could affect the accuracy of spatial matching. To minimize these errors, we first aligned the projection systems of both the grid data and city boundaries using the WGS 1984 coordinate system, ensuring consistency in spatial overlap. Next, the “Clip” tool was used to extract grid cells within the city boundaries, retaining only those that intersected with the target city. For grid cells crossing the borders, we applied an area-weighted overlay method, allocating carbon emissions proportionally based on the overlap ratio between the grid and city boundaries. This approach minimizes errors caused by boundary ambiguity. The final city-level carbon emission data are the weighted sums of the relevant grid cells for each year.
Given the limited resolution of the EDGAR grid, this study primarily focuses on the spatial distribution trends and relative changes in carbon emissions, which are highly interpretable at the macro scale.
The regional economic and social development indicators are sourced from authoritative publications such as the China Urban Statistical Yearbook, China Regional Economic Statistical Yearbook, China Energy Statistical Yearbook, and the China Financial Yearbook, supplemented by the EPS and WIND databases. These sources are used to construct a city-level panel dataset. Given the variation in indicator definitions, statistical standards, and update frequencies across different data sources, the data were standardized and unified during the collation stage. However, minor residual differences between sources may still impact the estimation results. For missing data in individual years, if the missing period does not exceed two consecutive years, linear interpolation is applied to fill the gaps. For the systematic absence of key variables, the multiple imputation method proposed by Rubin (1987) [42] is employed with five iterations, and the estimation results are merged according to Rubin’s rule to minimize errors arising from missing or inconsistent data.

3. Results

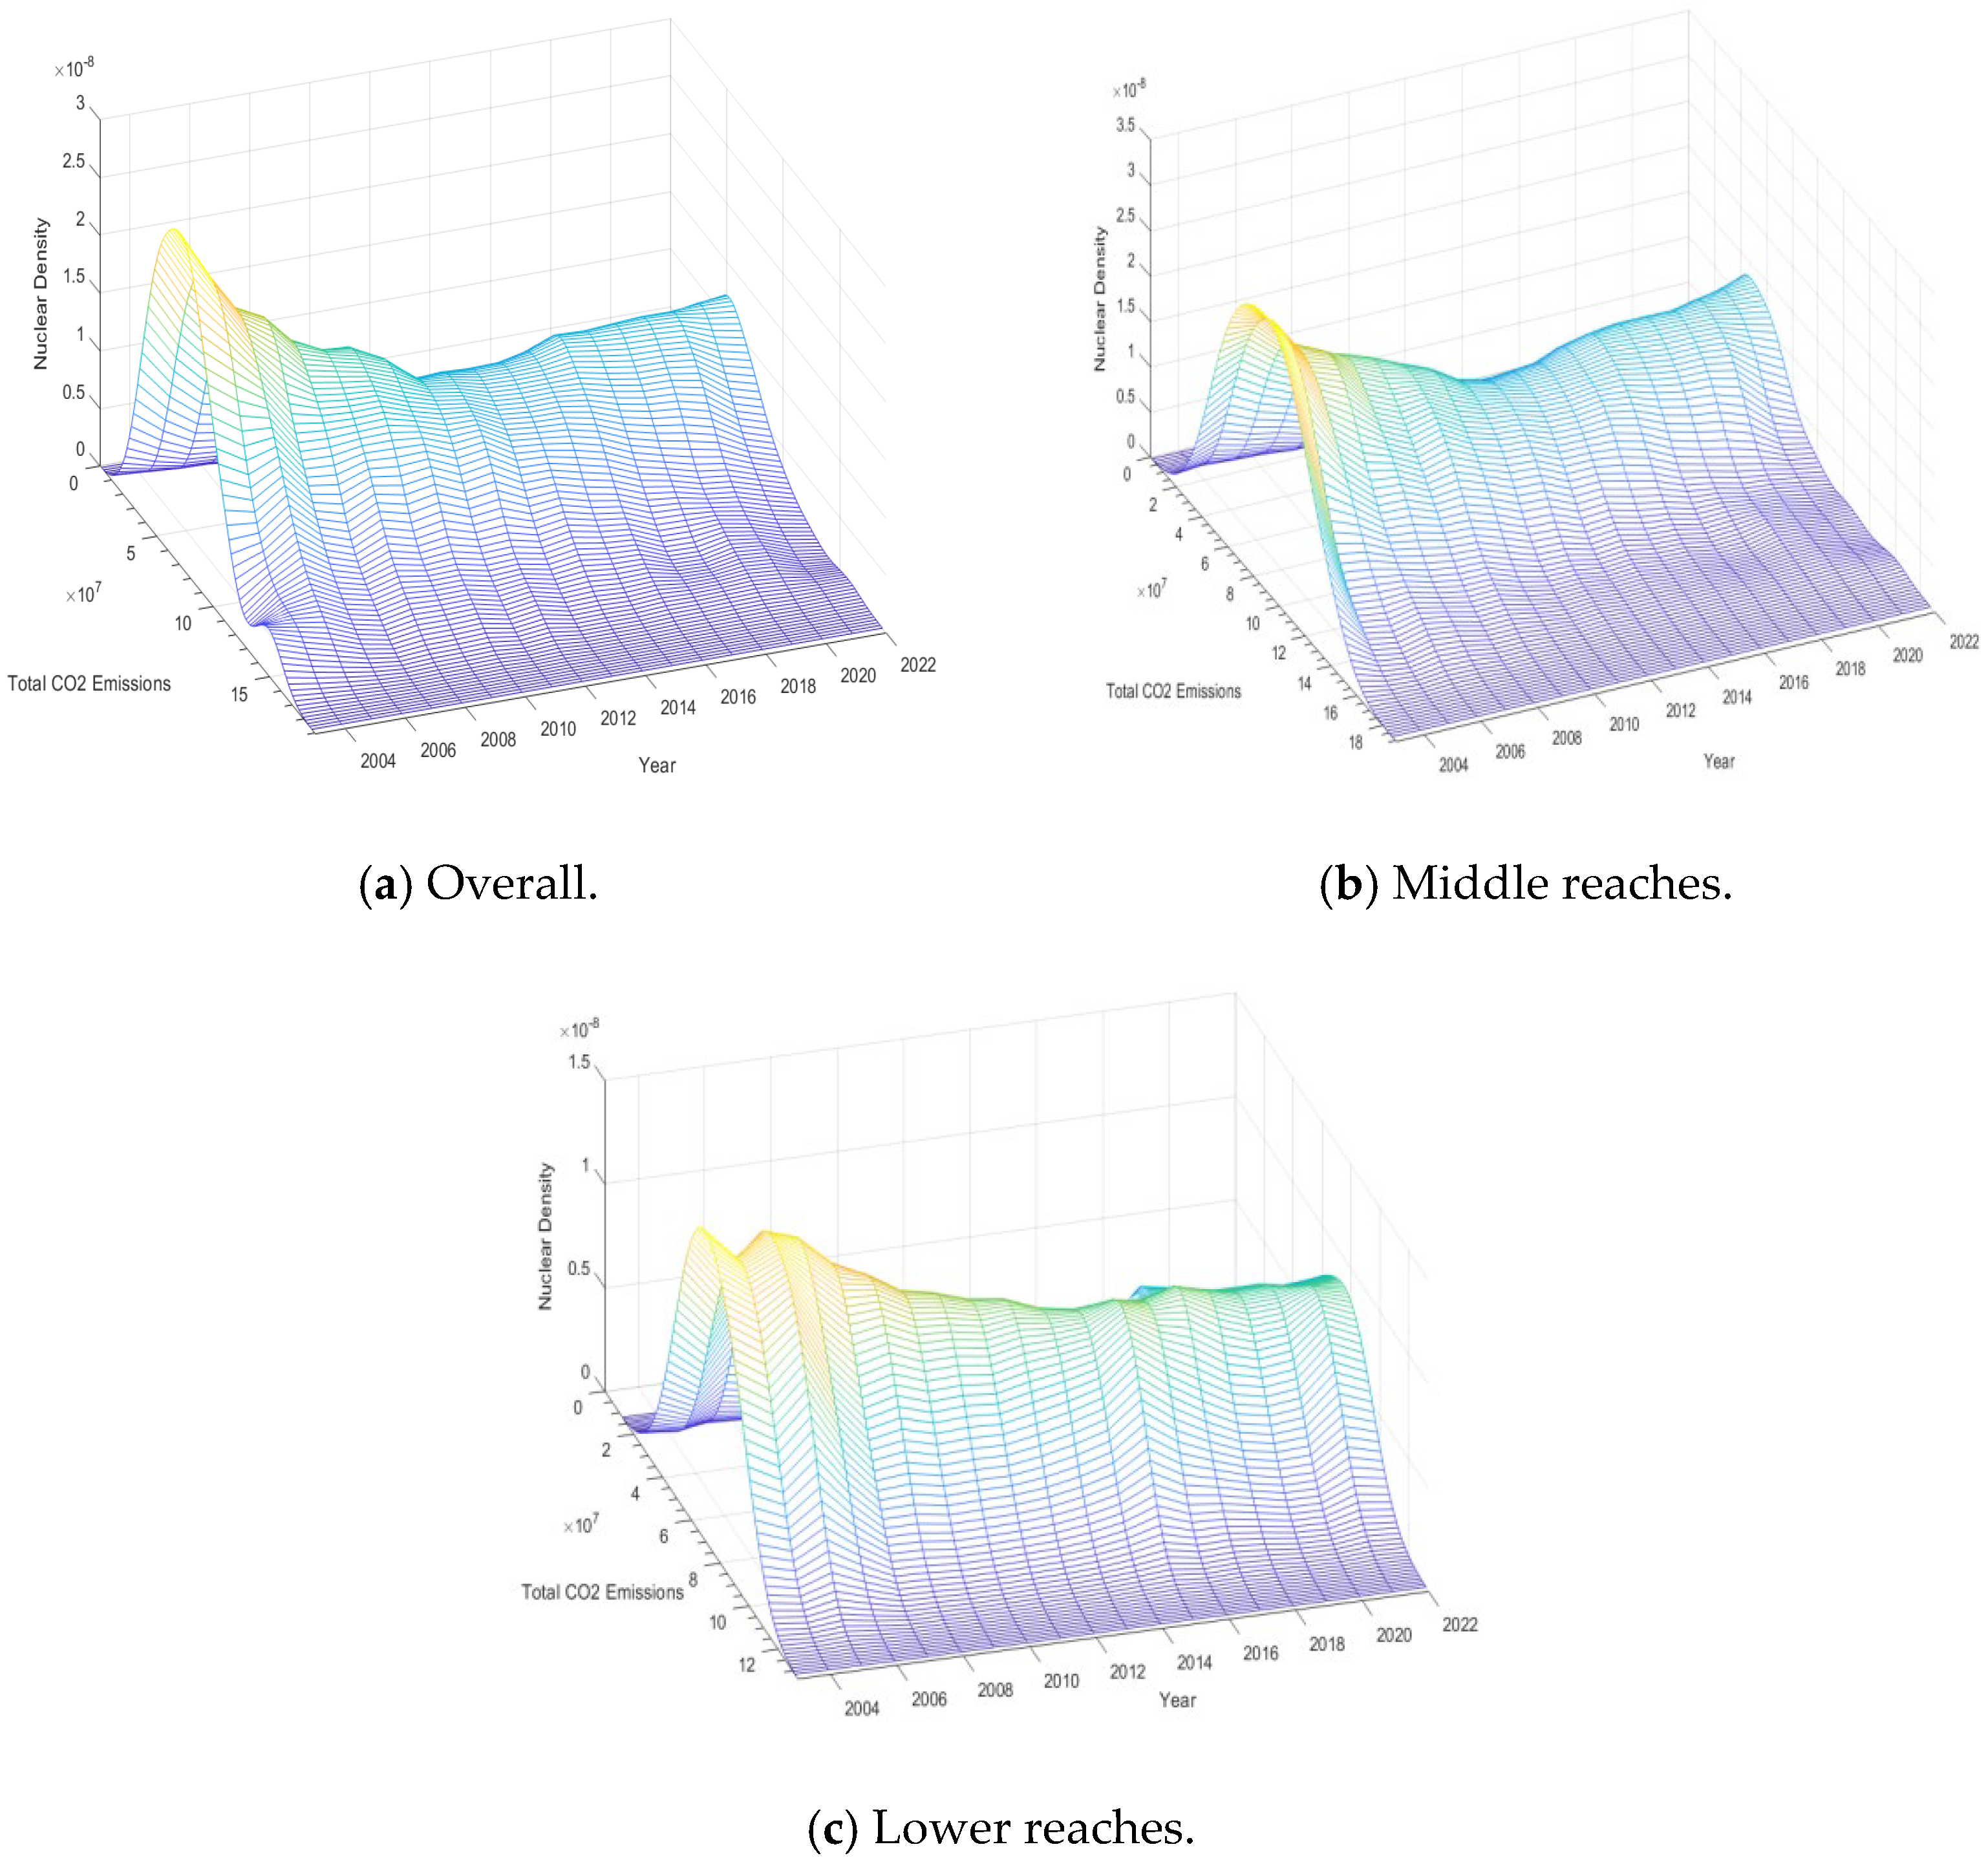
3.1. Carbon Emissions and Green Finance Index Analysis

Analysis of Current Carbon Emissions

(1) Contour Map Display
To visualize the spatial heterogeneity and evolution of carbon emissions across 49 cities in the urban cluster of the Middle and Lower reaches of the Yellow River, this study employs Origin 2021 to generate Iso-contour Mapping (ICM) of carbon emissions, as shown in Figure 2. The ICM is based on EDGAR v8.0 raster data, which has been converted to “million tons per 0.1° grid cell” to illustrate the relative distribution of carbon emission intensity in the spatial dimension. Compared to traditional bar or line charts, contour maps offer a continuous and intuitive representation of spatial distribution, enhancing the comparability of carbon emission levels across cities and over different years.
This visualization effectively integrates geographic and carbon emission data, establishing a robust framework for both spatial and temporal analysis. It helps uncover the dynamic patterns of urban carbon emissions and provides empirical evidence to support the formulation of region-specific emission reduction policies. In particular, the study of regional carbon governance increasingly emphasizes spatial correlation and emission spillover effects. As an intuitive tool, the contour map offers a valuable foundation for identifying spatial patterns and facilitating informed decision-making.
Figure 2 illustrates the temporal and spatial evolution of carbon emission intensity across five major urban clusters in the Yellow River Basin—Guanzhong Plain, Hohhot–Baotou–Ordos–Yulin (HBY), Jinzhong, Shandong Peninsula, and Central Plains—during 2003–2022. This figure highlights the regional heterogeneity and dynamic patterns of carbon emissions.
The Guanzhong Plain urban cluster (Figure 2a) exhibits clear spatial heterogeneity and stage-specific growth. High-emission areas are concentrated in Weinan (WN) and Tongchuan (TC), where carbon emission intensity has consistently exceeded 50 million tons since 2010, reflecting the industrial structure dominated by coal and heavy industries. With the implementation of policies such as the ‘Medium- and Long-Term Energy Development Plan’ and the ‘Pollution Prevention and Control Action Plan’, some cities have entered the process of industrial transformation, leading to a deceleration in emission growth. In contrast, cities such as Shangluo (SL) and Baoji (BJ) have maintained relatively low emission levels, indicating an economy driven by agriculture with a weak industrial foundation. From 2010 onward, cities like Yan’an (YA), Tongchuan (TC), and Weinan (WN) experienced rapid increases in carbon emissions. However, by the 13th and 14th five-year plans, low-carbon policies started to take effect, slowing emission growth in certain cities.
The Hohhot–Baotou–Ordos–Yulin urban cluster (Figure 2b) showcases the carbon emission characteristics of resource-dependent regions. Ordos (ES) has consistently been a high-emission area, with total emissions exceeding 180 million tons in 2020, mainly due to the concentration of high-carbon industries. Hohhot (HT) and Baotou (BT) have seen a slowdown in emission growth, benefitting from energy-saving and industrial upgrading policies. Yulin (YL) has remained relatively low in carbon emissions, but its emission growth potential warrants attention as energy strategies are implemented. From 2005 to 2015, carbon emissions grew rapidly. After 2015, the emission growth rate slowed, reflecting the initial effects of policies focused on the green mining and dual control of energy consumption.
The Jinzhong urban cluster (Figure 2c) also exhibits a heavy reliance on resource-based industries for its emission patterns. Taiyuan (TY) and Linfen (LF) remain the primary high-emission centers, with carbon emissions continuing to rise since 2015, primarily driven by coal and steel industries. Cities like Jinzhong (JZ), Xinzhou (XZ), and Yangquan (YQ) have lower emission levels, with fluctuations driven by agricultural economies and light industries. After 2015, the slowdown in emission growth in some cities can be attributed to the adoption of clean energy and structural adjustment policies.
The Shandong Peninsula urban cluster (Figure 2d) presents a spatial pattern of “central concentration, coastal control”. Jinan (JN) and its surrounding areas have seen rapid increases in emission intensity since 2010, surpassing 100 million tons after 2015, largely driven by the dominance of secondary industries and intensive energy consumption in transportation. In contrast, coastal cities such as Dongying (DZ), Yantai (YT), and Weihai (WH) have experienced a more gradual increase in carbon emissions, benefiting from clean energy transitions and the “Blue Economic Zone” policy. Between 2005 and 2015, emissions grew rapidly, but from 2016 onwards, the effect of policies began to show, leading to a deceleration in emissions.
The Central Plains urban cluster (Figure 2e) exhibits a “core cities with high emissions, surrounding cities with stable emissions” pattern. Cities such as Anyang (AY), Handan (HD), and Zhengzhou (ZZ) saw significant growth in carbon emissions after 2015, driven by the expansion of coal-dependent heavy industries. In contrast, cities like Luoyang (LY), Kaifeng (KF), and Pingdingshan (PDS) have shown slower emission growth, reflecting the effectiveness of low-carbon transitions. The time trend indicates that, from 2005 to 2015, carbon emissions rose rapidly, but from 2015 onwards, the implementation of green development and energy consumption control policies helped curb emissions in some cities.
In summary, the carbon emission trends across the five urban clusters exhibit distinct temporal and spatial patterns. Resource-dependent regions, such as Hohhot–Baotou–Ordos–Yulin and Jinzhong, saw the fastest growth in emissions from 2005 to 2015, driven by the expansion of coal, metallurgy, and chemical industries. In contrast, the Shandong Peninsula and Central Plains urban clusters slowed emission growth in the latter part of the 13th five-year plan through industrial upgrading and clean energy transitions. Spatially, the Guanzhong Plain and Central Plains’ urban clusters display a pronounced “core-periphery” emission gradient, while resource-based clusters show “clustered” high-emission areas. Coastal regions like the Shandong Peninsula show “coastal-inland” emission differences with significant low-carbon transformation effects.
In terms of temporal evolution, most urban clusters experienced accelerated carbon emission growth during the 12th and 13th five-year plans, but since the 14th five-year plan, the effects of green transition policies have become more apparent. Inter-regionally, early signs of industrial relocation and collaborative emission reduction have emerged, such as the green industry specialization between the Guanzhong Plain and Central Plains and the energy cooperation between Shandong and Jinzhong. This suggests the need for enhanced regional cooperation and the formulation of differentiated, coordinated carbon reduction policies to improve the overall low-carbon transition.
(2) 3D Carbon Emissions and Density Map
Figure 3 shows the 3D kernel density estimates of carbon emissions in the middle and lower Yellow River region from 2003 to 2022, based on ArcGIS Desktop version 10.8. The results reflect the overall trend and spatial differences in emissions over time. Two distinct phases are observed: a rapid increase from 2005 to 2015, followed by a clear slowdown. This change reflects the shift from growth driven by industrial expansion to moderation under policy control.
In the entire region (Figure 3a), carbon emissions rose sharply between 2005 and 2015. High-density areas expanded and emissions became more concentrated. This growth was mainly driven by the expansion of energy-intensive industries. After 2015, emission growth slowed. Policies such as the revised Environmental Protection Law and clean energy regulations helped reduce the speed of increase and weakened the spatial clustering of emissions.
The middle reaches (Figure 3b) followed a similar pattern. From 2005 to 2015, emission density increased quickly, especially in coal-dependent cities with a strong industrial base. After 2015, local governments tightened energy controls and pushed for cleaner industrial structures. Provinces like Henan, Shanxi, Shaanxi, and Inner Mongolia began phasing out outdated capacity and promoting clean energy. These efforts helped stabilize emissions and reduced spatial differences.
In the lower reaches (Figure 3c), total emissions were lower than in the middle reaches, but still rose during 2005–2015. This reflected both industrial growth and rising energy demand. After 2015, emission growth slowed noticeably. Differences between cities in this region also narrowed. For example, Shandong Province launched a series of low-carbon initiatives. These helped improve the energy mix and reduce high-emission industries, limiting further increases in emissions.
Overall, the Yellow River region shows clear differences over time and across space. From 2005 to 2015, emissions grew rapidly due to economic and industrial expansion. After 2015, stronger policies helped slow this trend. Spatially, emissions were more concentrated in the middle reaches. The lower reaches responded more quickly to regulation and showed clearer signs of structural adjustment. These results suggest that both economic forces and policy actions shape the carbon emission pattern and that regional strategies matter in the shift to low-carbon development.
To examine the spatial characteristics of carbon emissions in the Yellow River Basin, this study uses GeoDa in conjunction with ArcGIS to create spatial quantile maps for carbon emissions from 2003 to 2022 (see Figure 4). Overall, carbon emissions in the region have followed a dynamic pattern, initially experiencing concentrated growth, then a phase of decline, and finally a transition toward structural optimization. These shifts reflect significant changes in spatial distribution.
In 2003 (Figure 4a), carbon emissions exhibited clear spatial disparities and clustering. Areas with low emissions were mainly located in the western part of the Central Plains Urban Cluster, the southern part of the Jinzhong Urban Cluster, and the northern part of the Guanzhong Plain Urban Cluster. These regions, dominated by agriculture and resource-based industries, had low levels of industrialization, resulting in relatively moderate carbon emissions. In contrast, high-emission areas were concentrated in the Shandong Peninsula Urban Cluster, driven by heavy industry and energy-intensive sectors, with emissions significantly higher than the regional average.
By 2011 (Figure 4b), with continued regional economic growth, carbon emissions in several cities in the eastern part of the Central Plains Urban Cluster showed noticeable increases. This change was driven by higher energy demand and industrial expansion. At the same time, new high-emission areas emerged in the Shandong Peninsula Urban Cluster and some inland industrial cities, reflecting the growing carbon lock-in effect. While some areas began to implement industrial upgrades, the transition to a green, low-carbon economy remained in its early stages.
In 2022 (Figure 4c), the “dual carbon” policy led to a reduction in carbon intensity in the southern part of the Central Plains Urban Cluster and the southern part of the Jinzhong Urban Cluster, signaling the early success of energy structure adjustments and the development of emerging industries. However, high emissions persisted in the northern part of the Jinzhong Urban Cluster and certain areas of the Shandong Peninsula Urban Cluster, indicating that energy and industrial restructuring challenges remain in these regions.
From 2003 to 2022, the center of carbon emissions gradually shifted from the Shandong Peninsula Urban Cluster to the resource-intensive regions of the Central Plains Urban Cluster. This shift highlights the significant influence of resource endowments and industrial structures on carbon intensity. The trend suggests that future low-carbon transitions should focus more on regional disparities and structural challenges, with tailored strategies to address local issues and achieve sustainable development.

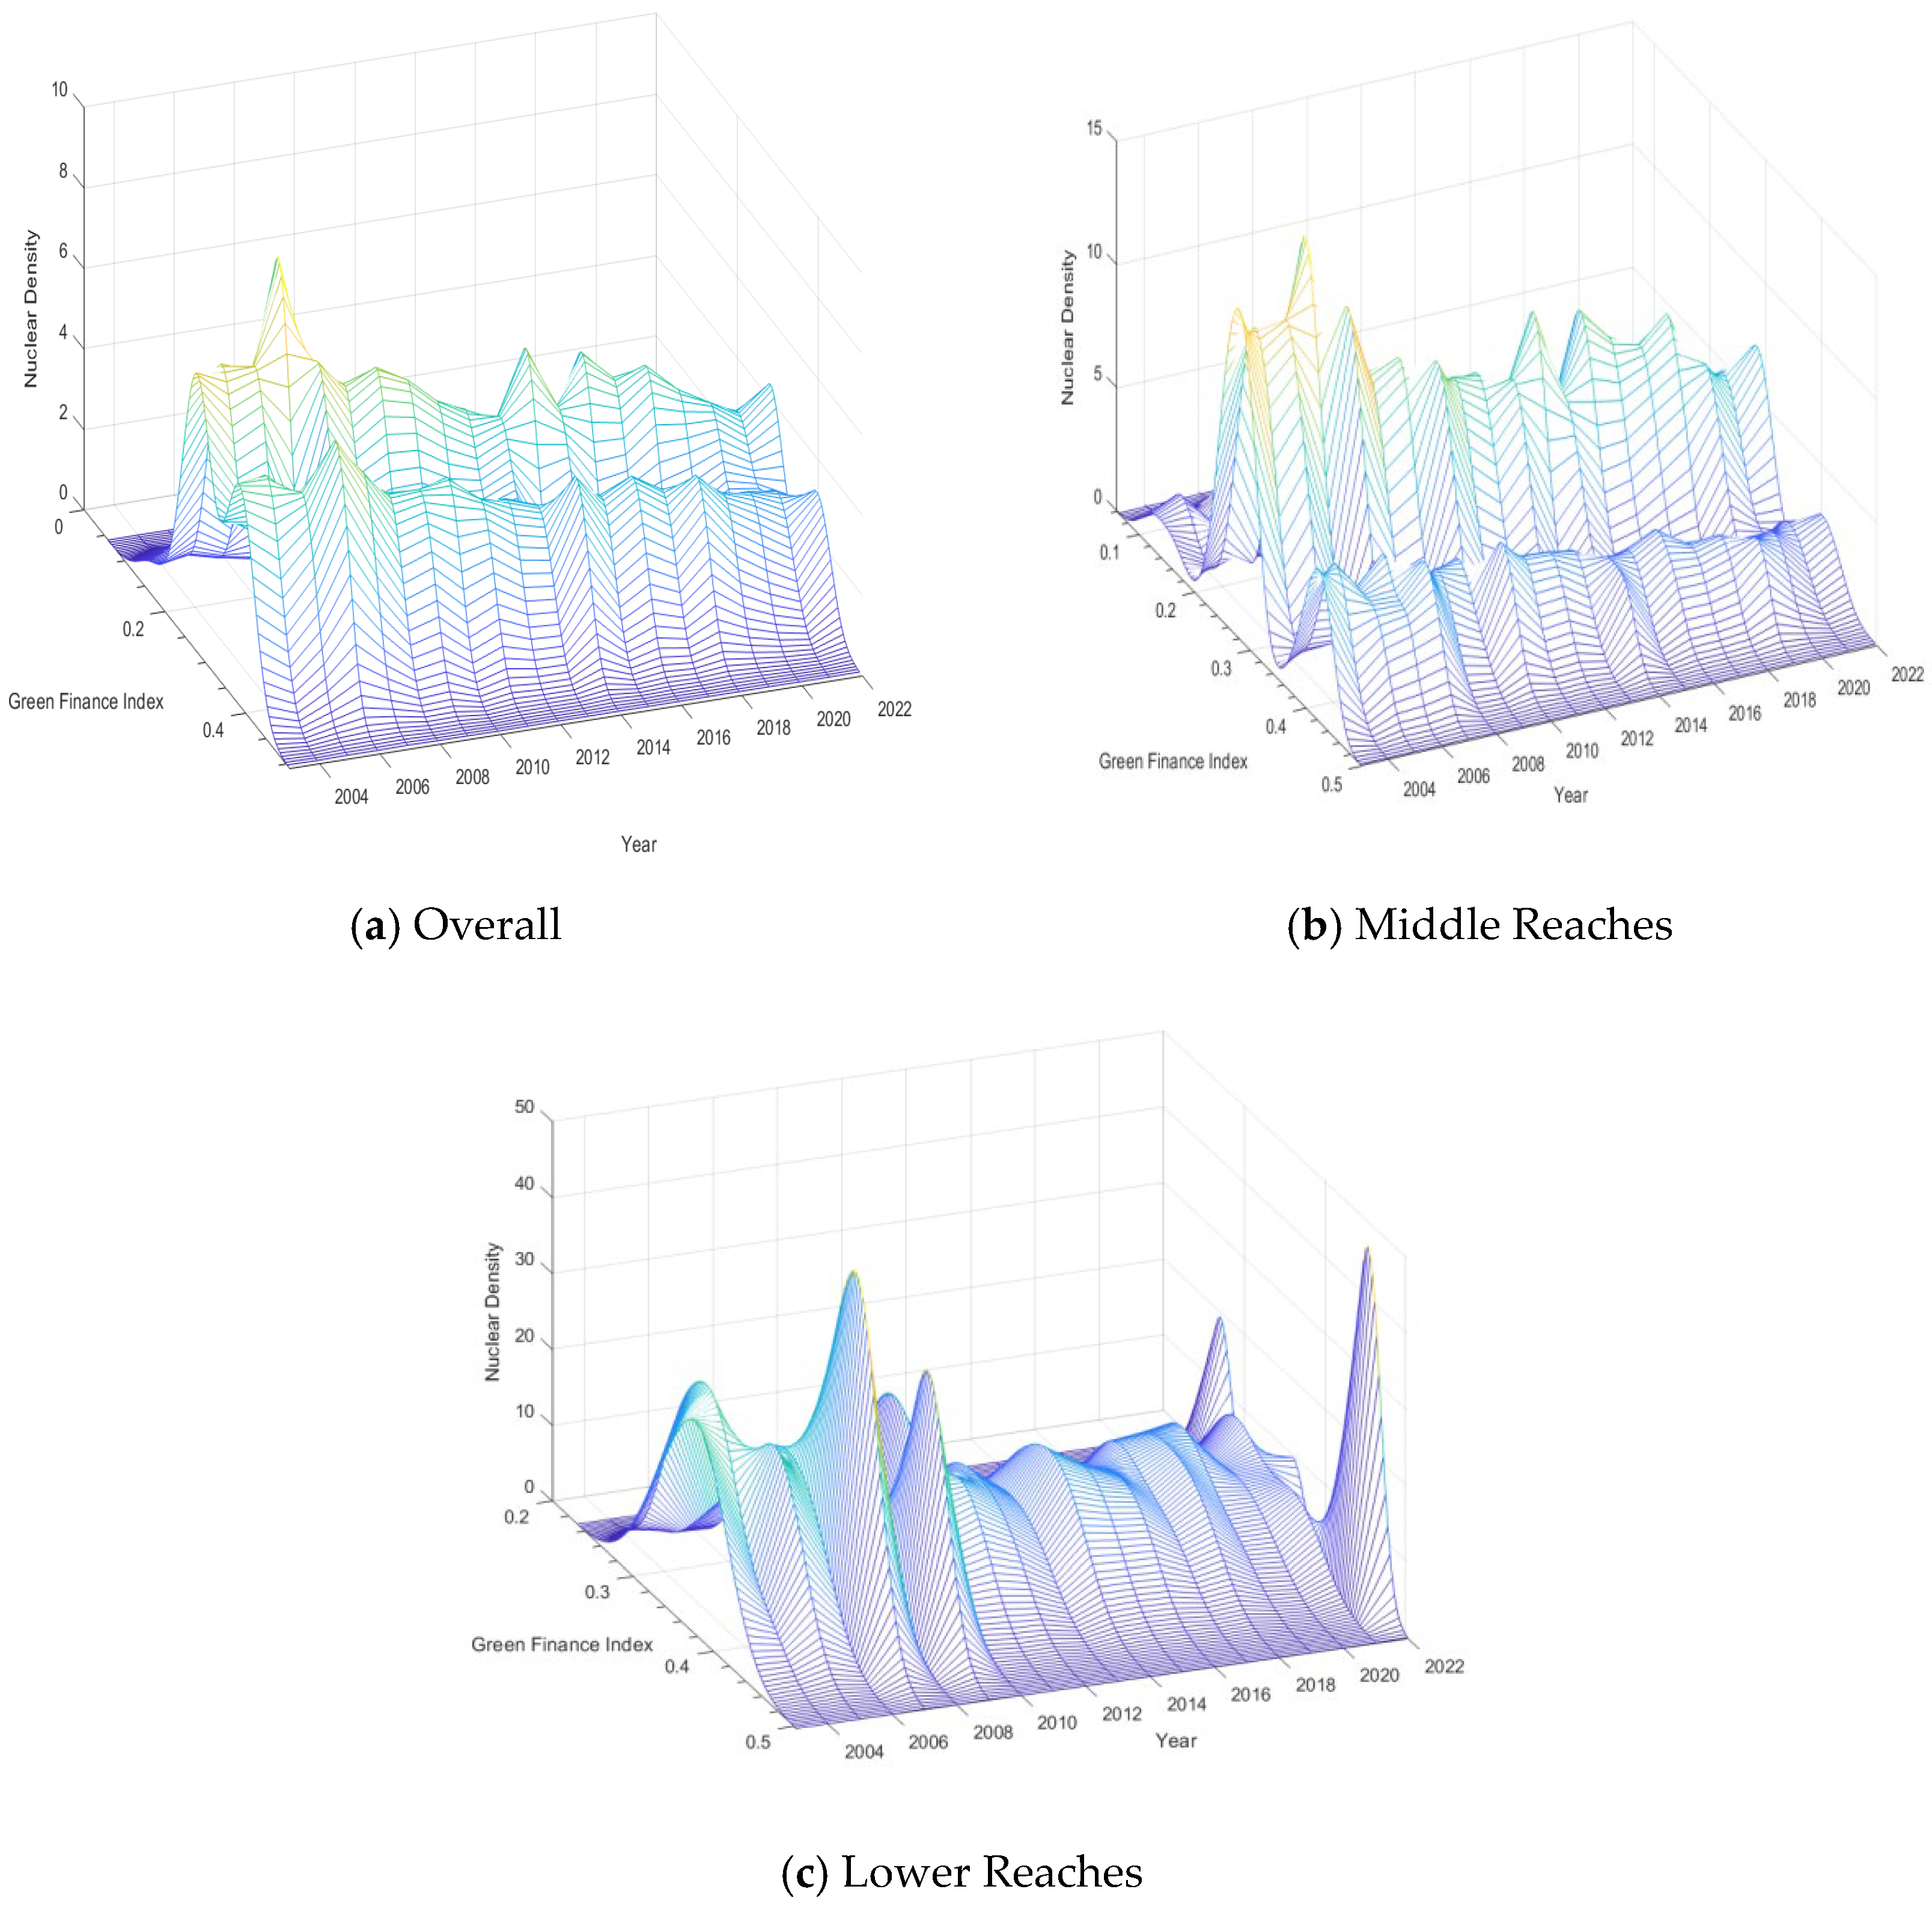
3.2. Analysis of the Current Status of the Green Finance Index

Figure 5 presents the 3D kernel density estimation results for the Green Finance Index (GFI) in the middle and lower Yellow River Basin from 2003 to 2022, created using Matlab and ArcGIS. This figure illustrates the temporal evolution and spatial distribution changes in regional green finance development. Overall, the development trajectory of green finance closely aligns with regional policy evolution, following a dynamic process of “initial response—mid-phase expansion—later stabilization.”
Figure 5a displays the kernel density distribution of the Green Finance Index across the entire Yellow River Basin. In the initial phase (2002–2006), the Green Finance Index remained relatively low, concentrated in the range of 0.20–0.35, with a peak density of 5.5 around 2003. This indicates that the early development of green finance relied heavily on localized pilot projects, with limited regional integration. During the mid-phase (2007–2015), the index distribution shifted towards higher values (0.35–0.45), and the kernel density curve flattened, reflecting the gradual establishment of green credit and ecological compensation mechanisms, as well as an increase in regional collaboration. In the later phase (2016–2021), although national policies such as the Guidelines for Green Finance Development were introduced, the overall rightward shift of the index was limited, with the primary density area remaining concentrated between 0.25 and 0.40. The decline in peak density suggests that high-quality green finance development faces institutional inertia and implementation bottlenecks.
Figure 5b shows the kernel density evolution of the Green Finance Index in the middle reaches of the Yellow River. In the initial phase (2002–2006), the index was concentrated between 0.20 and 0.32, with a peak density exceeding 10. This reflects the early emergence of green finance, although highly structured, indicating a resource-dependent industrial structure and insufficient internalization of environmental externalities. During the mid-phase (2007–2014), the distribution expanded to 0.30–0.40, and the main peak density decreased to below 5, signaling the initial diversification of green finance resource allocation. In the later phase (2015–2021), the index distribution stabilized, with the main concentration remaining between 0.25 and 0.35. The flattening of the density curve suggests that, despite the ongoing improvement in top-level policy design, the internal momentum of the green finance system remains weak, with institutional reliance and insufficient collaboration becoming significant bottlenecks.
Figure 5c reflects the relationship between carbon emission intensity and the Green Finance Index in the lower Yellow River region. In the initial phase (2002–2006), carbon emissions were concentrated in the lower range of the Green Finance Index (0.20–0.30), with a sharp peak in density, indicating a highly concentrated carbon emission structure due to the absence of effective green finance mechanisms. During the mid-phase (2007–2014), the density curve flattened, and the peak decreased, suggesting that the initial effects of green finance policies began to emerge, although their regulatory capacity remained limited. In the later phase (2015–2021), high-density areas gradually shifted towards higher index ranges, and the peak in the low index range significantly weakened. This indicates a shift in the role of green finance in guiding carbon emissions, moving from peripheral diffusion to systematic regulation. Overall, the spatial structure of carbon emissions has transitioned from concentration to dispersion, with green finance increasingly enhancing its role in guiding low-carbon transitions, and the coordination between financial intervention and industrial regulation beginning to take shape.
In summary, the dynamic relationship between green finance development and carbon emission behavior in the middle and lower Yellow River Basin shows that, while the green finance system has gradually been established and has played a role in some regions, significant challenges remain in guiding high-quality low-carbon transitions. These challenges arise from path dependence in traditional industrial structures, insufficient coordination in green governance, and delays in financial product innovation. This process underscores the need for strengthened cross-regional cooperation, innovation, and the development of more robust institutional frameworks and policy coordination to overcome current development bottlenecks.
Figure 6 presents the spatial distribution of the Green Finance Index (GFI) across the middle and lower Yellow River Basin from 2003 to 2022 based on spatial quantile techniques. This figure reveals the temporal evolution and spatial differentiation of green finance development across the region. The map uses different colors to represent varying levels of the Green Finance Index, with green indicating lower levels and red indicating higher levels.
Figure 6a illustrates the spatial distribution of the Green Finance Index in 2003. A clear spatial heterogeneity is evident. The Guanzhong Plain and Shandong Peninsula urban clusters, particularly in areas with relatively lower carbon emissions, exhibit higher green finance indices. Conversely, the southern Central Plains and parts of the Hohhot–Baotou–Ordos–Yulin urban cluster remain at lower index levels, indicating that the green finance system was underdeveloped and that there were significant disparities in policy responses and financial resource allocation at the time. During this period, green finance development was largely constrained by regional differences in economic foundations, industrial structures, and policy guidance, and, overall, the system remained in an early exploratory stage.
Figure 6b shows the changes in the spatial pattern of green finance by 2011. While the imbalances persisted, a degree of spatial polarization became apparent. The Shandong Peninsula and Guanzhong Plain urban clusters formed high-value green finance aggregation areas, reflecting early progress in green credit promotion, institutional development, and policy guidance. However, the central regions of the Central Plains and parts of the Hohhot–Baotou–Ordos–Yulin urban cluster remained in lower-value ranges, reflecting the slower pace of green finance development in resource-based areas. In general, the Green Finance Index distribution shifted toward higher ranges, with an increase in the number of cities in the mid-to-high-value segments. The spatial distribution of green finance resources evolved from localized concentrations to a more widespread, band-like extension. Although regional disparities still existed, the green finance system’s spatial coverage expanded significantly, with low-carbon investments beginning to reach secondary and non-core cities.
Figure 6c depicts the spatial pattern of the Green Finance Index in 2022. The overall level of the index has significantly improved compared to 2011, yet spatial differentiation has intensified. High-value areas are now concentrated in the Guanzhong Plain and Shandong Peninsula urban clusters, while the central region of the Central Plains remains concentrated in mid-to-low-value areas, highlighting the growing disparity in green finance development across regions. Despite continuous policy support and the strengthening of market mechanisms, regional differences in the responsiveness of green finance systems and the efficiency of resource allocation remain evident. The rapid growth of high-value areas can be attributed to local government policy innovations, increased green project density, and diversified financial channels. In contrast, low-value regions are constrained by rigid industrial structures, insufficient environmental governance, and weak financial support mechanisms. The spatial quantile results indicate that, while the green finance system in the middle and lower Yellow River Basin has established a solid foundation, further progress is needed in regional coordination, resource allocation optimization, and institutional innovation to achieve more balanced development.
In conclusion, from 2003 to 2022, the Green Finance Index in the middle and lower Yellow River Basin has undergone a progression from initial dispersion to mid-phase expansion and later-stage polarization. While the overall development of green finance has improved, regional imbalances persist. Moving forward, it will be essential to strengthen institutional frameworks, optimize financial resource allocation, and enhance the green transformation capacity of local financial systems to promote the coordinated and sustainable development of green finance across regions.

3.3. Bivariate Spatial Autocorrelation Analysis

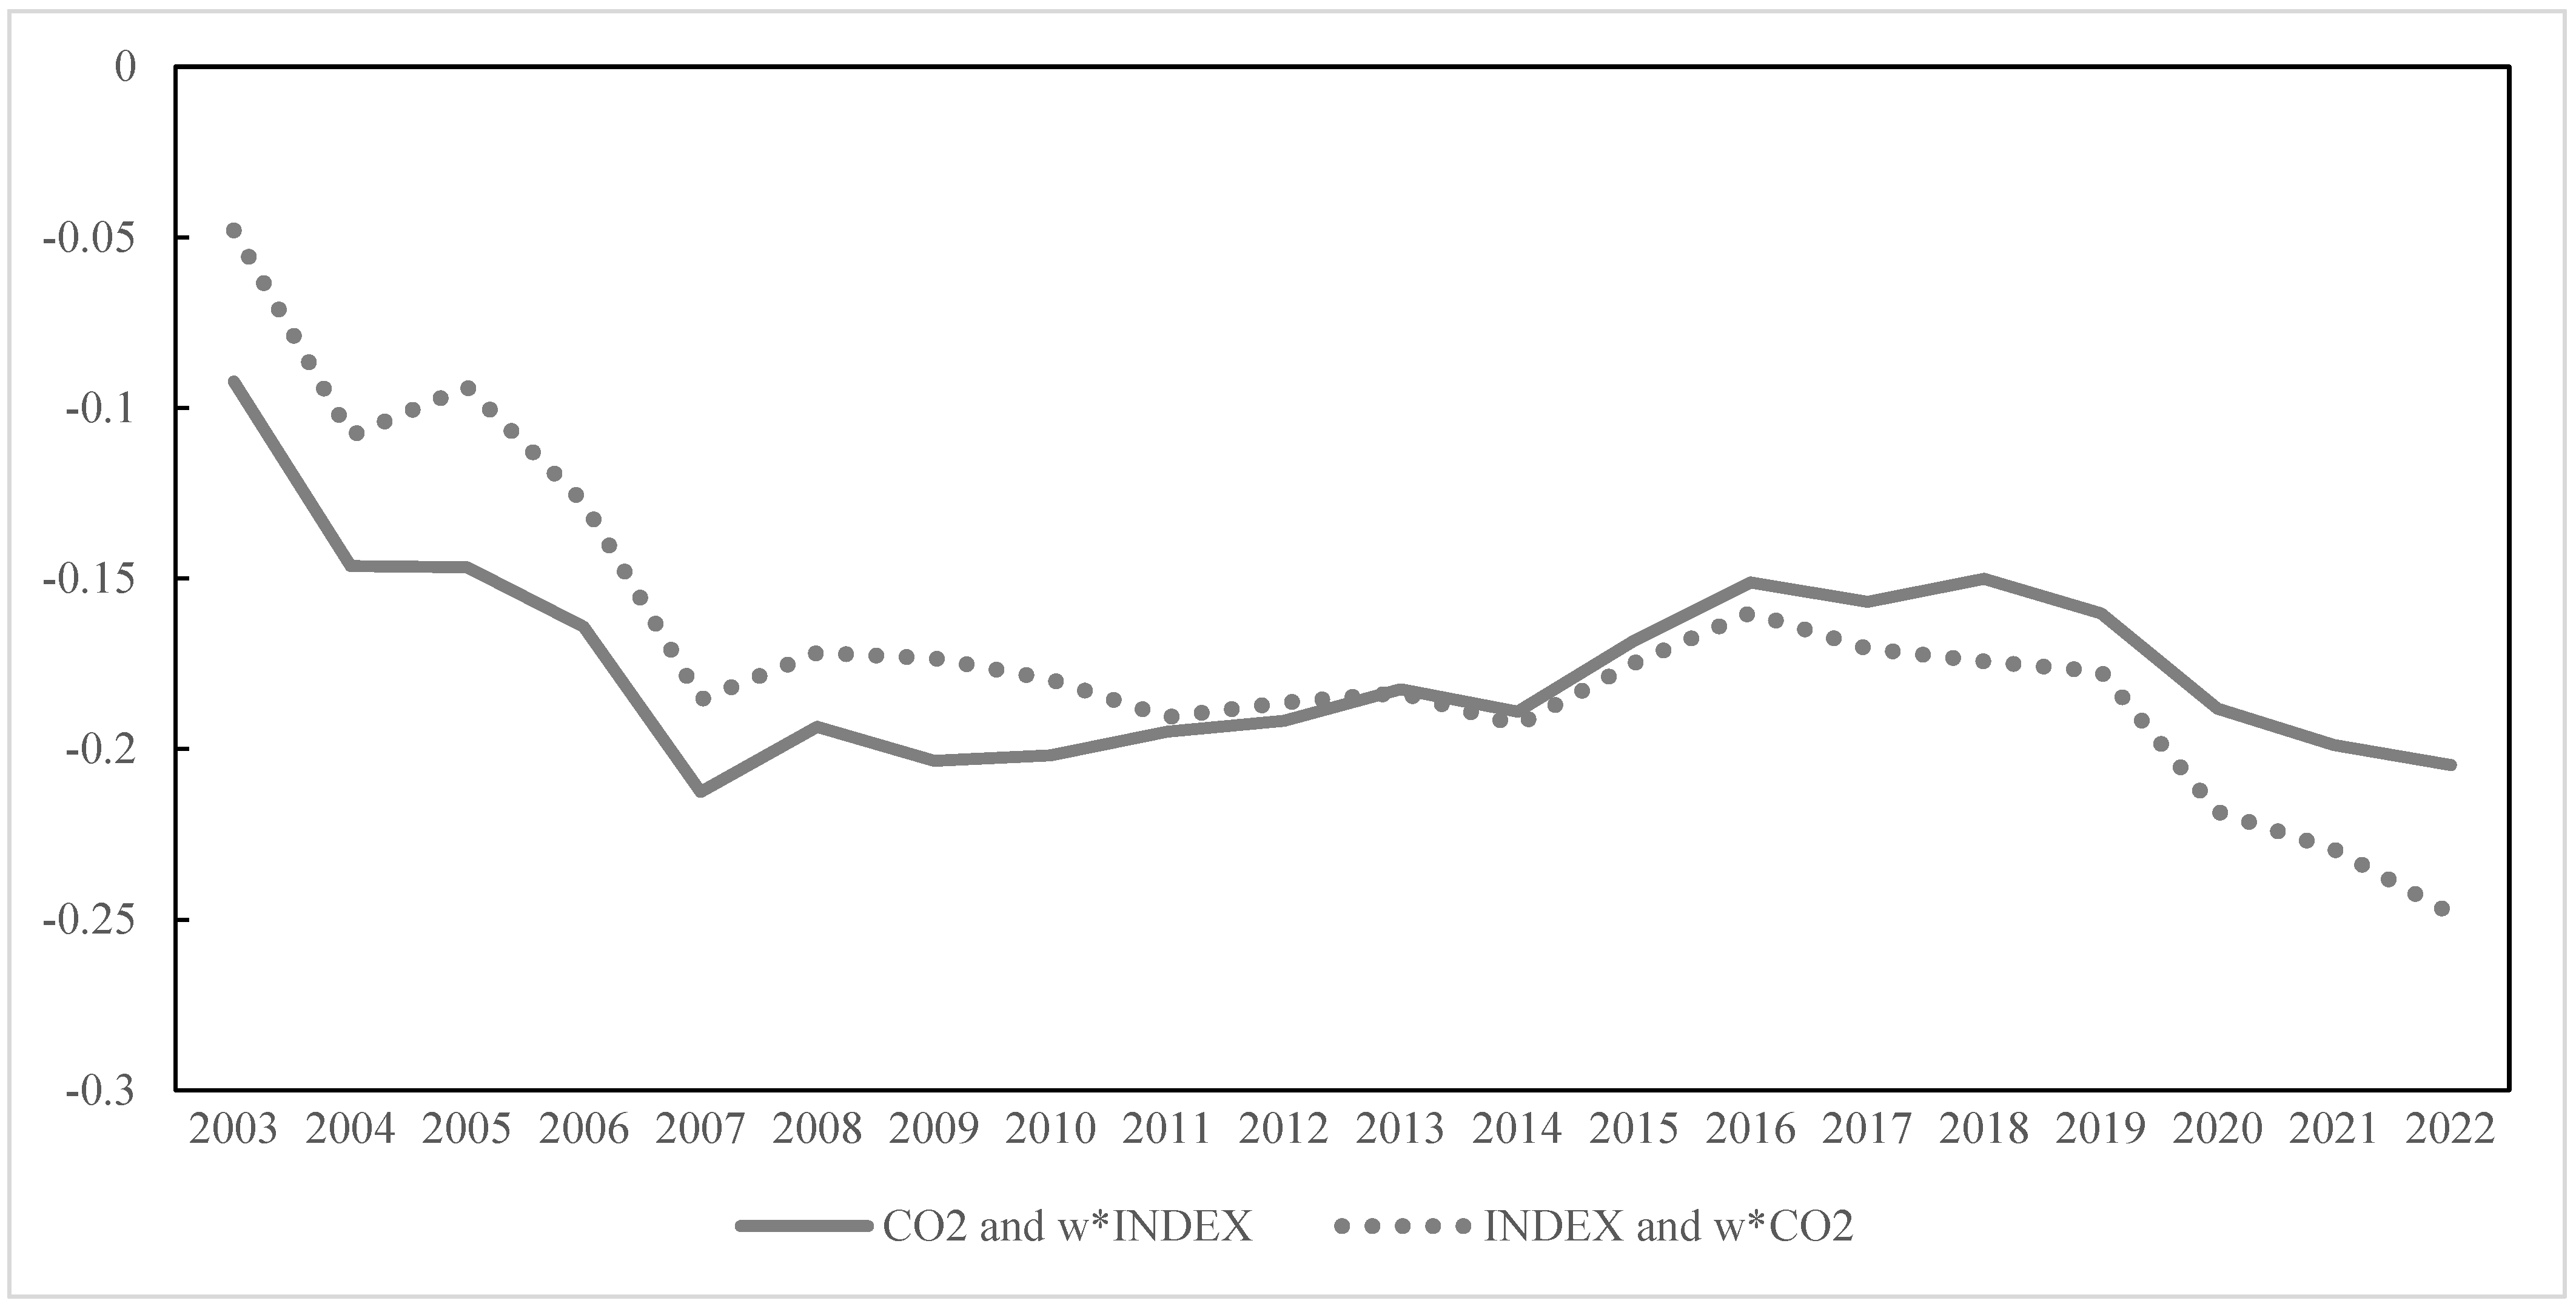
3.3.1. Global Bivariate Spatial Autocorrelation Analysis

While the univariate spatial autocorrelation analysis captures the global and local clustering characteristics of either carbon emissions or green finance independently, it does not account for the spatial interdependence between the two. To further examine whether a spatial interaction exists between carbon emissions and green finance, this study applies a bivariate spatial autocorrelation approach. The global bivariate Moran’s I statistic, calculated using GeoDa, is used to evaluate the degree of spatial association between the two variables. The results show that, across the study period, the global bivariate spatial autocorrelation coefficient was statistically significant at the 5% level in 2003 and at the 1% level in all subsequent years. This indicates a consistent and significant spatial association between carbon emissions and green finance across the entire sample period. Moreover, the results of the local bivariate spatial autocorrelation further confirm the presence of spatial interaction at the subregional level. These findings provide robust empirical support for investigating the mechanisms through which green finance influences the spatial dynamics of carbon emissions.
Figure 7 illustrates the evolving spatial lag relationships between carbon emissions and the Green Finance Index in neighboring regions from 2003 to 2022, specifically the correlation between the CO2 and wINDEX and between the INDEX and wCO2. Over time, both spatial associations have shown a declining trend, indicating a growing spatial spillover effect of green finance on regional carbon reduction. Between 2003 and 2007, the spatial correlation between the two variables declined markedly. This period coincided with the early stages of green finance development, during which capital began to shift toward low-carbon sectors, suggesting the initial emergence of spatial spillovers. From 2008 to 2014, the trend stabilized. The global financial crisis, coupled with the underdeveloped state of China’s green finance system, contributed to the temporary stagnation in spatial interactions.
Since 2015, following the introduction of national-level green finance frameworks and the progressive improvements in policy instruments, the efficiency of green finance resource allocation has steadily increased. As a result, the negative spatial correlation between CO2 and wINDEX has deepened significantly. This pattern reflects not only the local effectiveness of green finance in reducing emissions, but also its capacity to influence adjacent regions through spatial transmission mechanisms. The overall trend underscores the growing importance of green finance as a regional tool for low-carbon transformation, reinforcing its role in shaping cross-boundary environmental outcomes.

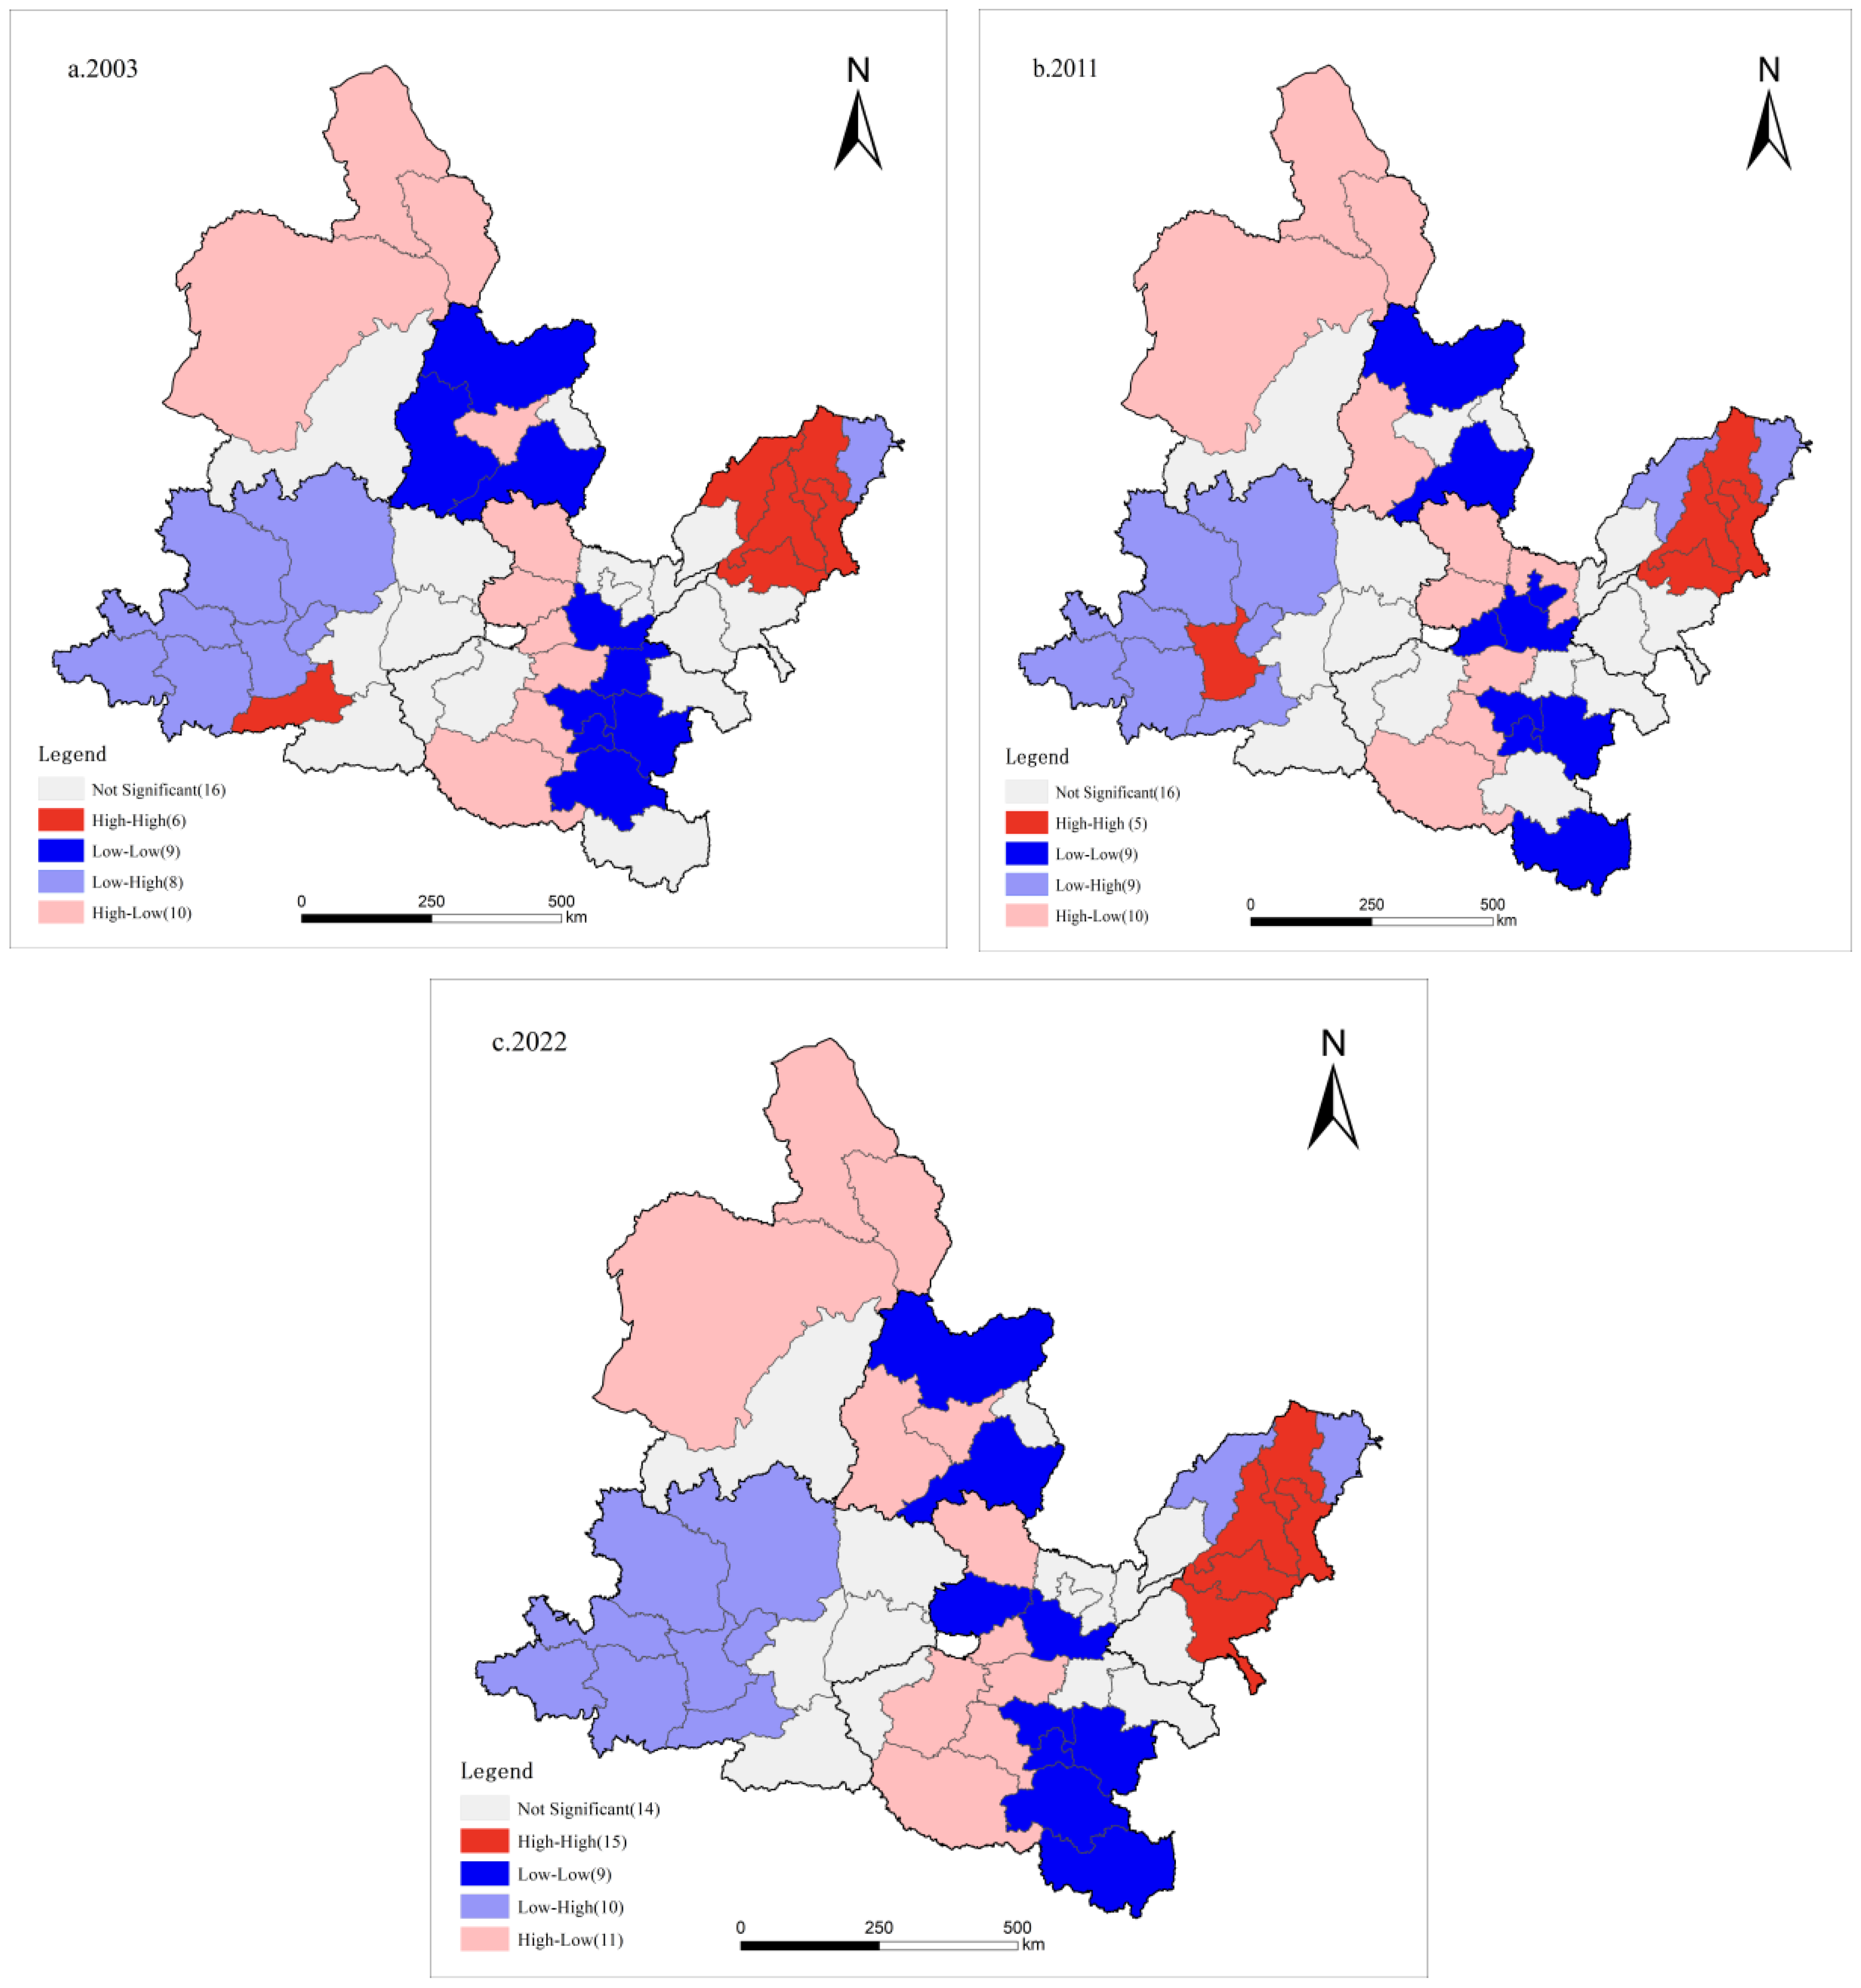
3.3.2. Bivariate Local Spatial Autocorrelation Analysis

The bivariate LISA clustering map, created using ArcGIS Desktop version 10.8, effectively illustrates the spatial association characteristics and local clustering patterns of green finance and carbon emissions at the regional level. In contrast to the global Moran’s I, the bivariate LISA method captures local spatial dependence, overcoming the limitations of global statistical methods in revealing spatial heterogeneity. This technique not only identifies areas with high-high and low-low spatial associations between green finance and carbon emissions, but also highlights local clustering and anomalous dispersion, providing empirical support for understanding the spatial spillover mechanisms between the two. Further analysis of local spatial features is essential for designing regionally differentiated green finance policies, optimizing resource allocation, and improving the spatial precision and effectiveness of carbon reduction interventions. Such insights enhance the adaptability of green finance policies, facilitating synergistic effects in regional low-carbon transitions.
Figure 8 illustrates the bivariate LISA clustering results between the Green Finance Index and carbon emissions in the middle and lower Yellow River Basin for the years 2003, 2011, and 2022, offering insights into their evolving spatial interaction patterns. In 2003 (Figure 8a), a distinct spatial mismatch is observed. Low–low clusters were primarily located in central Shanxi and the southern Central Plains, indicating underdeveloped green finance systems coupled with high carbon emission levels—regions where green finance had yet to support industrial decarbonization. Low–high clusters appeared in parts of the Guanzhong Plain and eastern Shandong Peninsula, suggesting that financial constraints persisted despite high carbon intensity, exacerbating regional mitigation pressure. High–low clusters were sparse, observed mainly in the Hohhot–Baotou–Ordos–Yulin (HBOY) and southeastern Central Plains areas, where the suppressive effect of green finance on emissions remained weak and spatial spillovers limited.
By 2011 (Figure 8b), the spatial association had evolved, with greater local heterogeneity. High–High clusters became concentrated in the Shandong Peninsula urban region, reflecting a persistent coexistence of strong green finance presence and high carbon emissions—suggesting that financial tools had not yet effectively redirected industrial activities toward low-carbon pathways. Low–High clusters remained prevalent in the Guanzhong Plain, highlighting the structural dilemma of insufficient financial input amid ongoing emissions pressure. In contrast, the emergence of High–Low clusters in parts of the Central Plains and HBOY region suggested modest improvements in resource allocation efficiency, with early signs of mitigation coordination. The number of Low–Low clusters declined and became spatially dispersed, indicating some institutional progress in traditionally high-emission zones, although still constrained by structural and economic limitations.
In 2022 (Figure 8c), the spatial coupling between green finance and carbon emissions became more pronounced, with intensified local clustering and widening regional disparities. High–high clusters expanded further into the Shandong Peninsula periphery, suggesting that while green finance input had increased, its allocative effectiveness remained insufficient to produce notable emission reductions. Low–high clusters continued to persist in the Guanzhong Plain, underscoring the ongoing limitation of financial support in facilitating low-carbon transitions. Meanwhile, the expansion of high–low clusters pointed to growing mitigation spillovers as green finance began to exert more discernible influence in certain subregions. Low–low clusters were mainly observed in the southeastern Central Plains, where structural constraints and resource endowments continued to limit green finance deployment and carbon reduction progress.
Taken together, the evolution of bivariate spatial associations from 2003 to 2022 reveals a gradual transition from spatial divergence to localized convergence between green finance and carbon emissions. These shifting patterns underscore both the potential and limitations of green finance as a regional decarbonization driver. The findings provide a spatially grounded basis for developing differentiated green finance strategies, emphasizing the importance of tailored interventions and adaptive policy mechanisms to enhance spatial precision in low-carbon governance.

3.3.3. Empirical Test

Given the observed spatial consistency between the distribution patterns and clustering characteristics of green finance and carbon emissions, it is necessary to further assess whether a substantive spatial interaction exists between the two or whether the correlation merely reflects a ripple-like diffusion effect. To this end, this study employs a Generalized Spatial Three-Stage Least Squares (GS3SLS) simultaneous equations model for empirical analysis. This method offers distinct advantages in identifying spatial interaction mechanisms. First, by incorporating spatially lagged explanatory variables through a spatial weight matrix as instrumental variables, the GS3SLS approach effectively addresses potential endogeneity bias. Second, its extended specification allows for estimations under zero-order regression conditions, providing a robust framework for detecting endogenous effects and implementing appropriate control measures.
Drawing on the methodological insights of references [43,44,45], the spatial lag order is set to two, based on the following rationale: existing studies typically adopt first- or second-order lags, and the GS3SLS framework supports lag structures up to the fourth order. A first-order lag may be insufficient to capture the complex spatial interactions inherent in the data, while higher-order lags may lead to overfitting. Preliminary diagnostics of the Yellow River middle and lower basin sample suggest that spatial effects are most pronounced within a two-lag structure. Accordingly, this specification not only improves estimation efficiency, but also balances model stability and explanatory power, offering a more accurate representation of the spatiotemporal dynamics linking green finance and carbon emissions.
Table 2 reports the empirical results of the spatial interaction between the Green Finance Index (lngf) and carbon emissions (lnco2) based on and second-, third-, and fourth-order GS3SLS models. Across all lag specifications, green finance consistently exhibits a statistically significant negative effect on carbon emissions (p < 0.01), indicating a robust and sustained decarbonization effect at the regional level. In addition, the spatially lagged variables—w1y_lngf and w1y_lnco2—are both positive and significant, revealing the presence of spatial spillover dynamics. These results suggest that green finance activities and emission patterns in neighboring regions exert a measurable influence on local carbon outcomes.
Model performance indicators further support the relative superiority of the fourth-order specification. While maintaining strong explanatory power, this model achieves lower values for the Goodness of Fit (−3.4524), Akaike Information Criterion (AIC = 0.2239), and Schwarz Criterion (SC = 0.2296), demonstrating a more optimal trade-off between model complexity and estimation efficiency.
Taken together, the findings confirm the existence of stable and significant spatial interdependencies between green finance and carbon emissions. Green finance not only contributes directly to local emission reductions, but also facilitates coordinated mitigation across regions through spatial spillover mechanisms. This extended influence reflects a shift from localized environmental effects to broader regional transmission, highlighting green finance as a critical institutional lever for supporting integrated multi-scalar approaches to low-carbon transition and environmental governance.

3.3.4. Robustness Test

To further assess the robustness of the empirical results, this study conducts two sets of robustness checks, addressing both temporal variation and model specification. First, regression analyses are performed using different time periods to evaluate the consistency of the results across various stages of development (see Table 3). Second, the spatial simultaneous equations model is re-specified with varying lag orders to examine the sensitivity of the findings to different model configurations (see Table 2). The results of these dual robustness tests demonstrate that the negative effect of green finance on carbon emissions remains significant across all specifications and that the spatial spillover mechanism shows substantial structural stability. These findings provide strong support for the robustness of the previous empirical results.
As shown in Table 4, the spatial interaction between the Green Finance Index (lngf) and carbon emissions (lnco2) remains statistically robust across both the early (2003–2012) and later (2013–2022) periods. During the earlier phase, green finance exerted a significant mitigating effect on local carbon emissions, accompanied by a notable spatial spillover, suggesting that, even in its formative stage, green finance had begun to foster regionally coordinated emission reduction. Carbon emissions during this period also displayed a discernible spatial diffusion pattern, reflecting less integrated governance structures and limited policy coordination.
In contrast, during the later phase, while green finance continued to influence emissions, the magnitude of its effect diminished, and the spatial diffusion of carbon emissions became statistically insignificant. This shift may reflect the maturation of the green finance policy framework and the strengthening of regional collaborative governance, which reduced reliance on spatial externalities and enhanced localized regulatory effectiveness.
Model diagnostics further support these findings: both the goodness-of-fit and information criteria (AIC, SC) indicate improved model performance in the later period. Taken together, the results reveal a temporally evolving spatial mechanism in which the role of green finance in shaping emission outcomes is not static, but adapts to changes in policy design, institutional capacity, and inter-regional coordination. These dynamics underscore the importance of viewing green finance as an adaptive instrument whose effectiveness in supporting long-term carbon mitigation depends on broader systemic and spatial governance contexts.

3.3.5. Spatial Heterogeneity

To further validate out core conclusions, this study introduces a regional dimension by subdividing the Yellow River middle and lower basin cities into five distinct urban clusters: the Central Plains, Guanzhong Plain, Hohhot–Baotou–Ordos–Yulin (HBOY), Jinzhong, and Shandong Peninsula urban groups, following the classification conventions used in existing research. This subdivision allows for a spatial heterogeneity analysis, aiming to explore the regional variations in the relationship between green finance and carbon emissions across different urban clusters. By conducting these tests, this study seeks to identify the differential impacts of green finance policies and carbon reduction outcomes in various regions, highlighting the influence of regional development stages, resource endowments, and industrial structures. These insights provide a solid empirical foundation for regional collaborative governance and the formulation of differentiated policy interventions.
Table 5 presents the results of the GS3SLS spatial simultaneous equations model, which uses a geographic distance-based spatial weight matrix to examine the regional variations in the spatial interaction between the Green Finance Index (lngf) and carbon emissions (lnco2) across different urban agglomerations.
In the Central Plains Urban Agglomeration, the Green Finance Index significantly negatively affects carbon emissions (−2.2191, p < 0.01), with its spatial lag (w1y_lngf) significantly positive (3.9032, p < 0.05), indicating that green finance not only directly reduces carbon emissions but also exhibits a substantial positive spatial spillover effect. A 1 unit increase in green finance in neighboring regions leads to a reduction in carbon emissions by approximately 3.90 units in the local area, demonstrating the strong transmission of green policies in this region.
In the Guanzhong Plain Urban Agglomeration, the coefficient of w1y_lngf reaches 12.0963 (p < 0.01), the highest spillover effect among the five urban agglomerations. This indicates that the externalities of green finance are highly concentrated in this area, where the development of green finance in neighboring regions significantly drives the local low-carbon transformation. Similarly, the Jinzhong Urban Agglomeration exhibits a significant spatial spillover effect of green finance (2.9119, p < 0.05), with a moderate coefficient, suggesting a smooth diffusion path for green finance in the region, with a foundation for inter-regional transmission but limited strength.
In contrast, the Hohhot–Baotou–Ordos–Yulin (HBOY) and Shandong Peninsula urban agglomerations show weaker, or even negative, spatial spillover effects. The coefficient for HBOY is −1.6381 (p < 0.1), while for Shandong Peninsula it is −18.2630 (p < 0.1), although the model’s overall significance is relatively low. These findings suggest the potential presence of nonlinear mechanisms or reverse effects in these regions, possibly due to resource dependency or structural barriers.
Furthermore, the carbon emissions’ spatial lags also exhibit significant heterogeneity across regions. For example, in the Central Plains and HBOY urban agglomerations, the spatial lag coefficients for carbon emissions are positive (1.8222 and 1.1470, p < 0.05/p < 0.01), whereas in the Jinzhong Urban Agglomeration, the coefficient is negative (−2.1870, p < 0.01). This variation reflects differences in the roles played by industrial structure, environmental capacity, and policy tools across regions. Overall, the positive spatial spillover effects of green finance vary significantly across the urban agglomerations, with the spillover intensity ranking as follows: Guanzhong Plain Urban Agglomeration (12.10) > Central Plains Urban Agglomeration (3.90) > Jinzhong Urban Agglomeration (2.91). These results underscore the regional interconnectedness of green finance policies, while the negative spillover effects in the Shandong Peninsula and HBOY urban agglomerations suggest the need to address the potential structural constraints and failures in the transmission mechanisms.

4. Discussion

Future research should focus on deepening the investigation in the following areas:
(1)
Construction of the spatial weight matrix: Current studies primarily rely on the inverse square of the geographic distance between cities to construct a spatial weight matrix, reflecting spatial correlations. However, this approach overly depends on geographic distance and overlooks the influence of economic linkages, policy synergies, and other factors on the interactions between green finance and carbon emissions. Future research should integrate economic- and policy-related factors to develop a more comprehensive spatial weight matrix, enabling a more accurate depiction of the spatial dynamics between green finance and carbon emissions.
(2)
Dynamics of the green finance evaluation system: The existing green finance evaluation system does not fully account for the dynamic development of the green finance market, especially in emerging areas such as fintech and blockchain applications. Future studies should examine how to incorporate these emerging financial instruments and business models into the evaluation framework. Building a flexible and dynamic system will allow for the timely reflection of changes in green finance and provide more accurate assessments of its development.
(3)
Micro-level empirical analysis: Current research primarily emphasizes macro-level analyses and lacks in-depth empirical studies at the micro-level. Future research should focus on how factors such as industrial structure, policies, and market mechanisms influence the development of green finance across different regions and levels. Multi-dimensional data comparisons and case studies can improve the assumptions underlying green finance development, offering a more nuanced understanding of its dynamics.
(4)
Cross-regional comparison and synergy analysis: Existing research tends to focus on intra-regional development characteristics, neglecting cross-regional comparisons and synergies. Future research should prioritize investigating the differences in green finance development between urban agglomerations, exploring how regional synergies can be leveraged to complement each other’s strengths. Such collaboration could drive balanced and sustainable green finance development in the middle and lower reaches of the Yellow River. Cross-regional comparisons and cooperation can optimize resource allocation and foster innovation in policies and financial instruments.
(5)
Intrinsic mechanisms of the spatial relationship between green finance and carbon emissions: Although this study finds a significant negative spatial autocorrelation between green finance and carbon emissions, the theoretical mechanisms behind this relationship have not been fully explored. Future research should investigate the underlying mechanisms of spatial autocorrelation, focusing on how policies, industrial structures, and market mechanisms influence the interaction between the two variables. This deeper understanding would provide more systematic and comprehensive theoretical support for the formulation of green finance policies.
(6)
Heterogeneity analysis within urban agglomerations: Existing studies treat urban agglomerations as homogeneous regions, overlooking the differences between cities within the clusters. Future research should explore the variations between cities in terms of industrial structure, economic development levels, and green finance infrastructure, and analyze how these differences affect the spatial relationship between green finance and carbon emissions. Such in-depth analysis will improve the accuracy of the findings, better reflecting the region’s actual situation and enhancing the precision and effectiveness of policy formulation.

5. Conclusions

Grounded in the theoretical framework of New Economic Geography, this study establishes a comprehensive analytical model to examine the spatial interactions between green finance and carbon emissions. By integrating three-dimensional kernel density estimation, spatial quantile regression, bivariate spatial autocorrelation tests, and a spatial simultaneous equations model, this study systematically identifies the temporal evolution, spatial patterns, and the interrelationship between green financial development and carbon emissions across urban agglomerations in the middle and lower Yellow River Basin.
The principal findings are as follows:
(1) Between 2003 and 2022, both carbon emissions and the Green Finance Index displayed a dynamic trajectory characterized by sustained growth, followed by a phase of gradual decline, and eventually structural optimization. Spatially, the center of carbon emissions shifted from coastal economic zones to inland regions with higher concentrations of resource-based and traditional industries, reflecting the deep connection between regional development stages, factor endowments, and industrial structures.
(2) Both green finance and carbon emissions exhibited significant spatial clustering, indicating strong geographic interdependencies and a regional coordination effect. The formation of high–high and low–low spatial clusters underscores the mutual reinforcement between green finance activities and emissions performance across neighboring regions.
(3) A stable and negative spatial spillover effect was observed between green finance and carbon emissions, signifying that green financial development not only has a direct impact on reducing emissions in local areas, but also facilitates cross-regional emission reductions through externalities. This spatial transmission illustrates the broader role of green finance, extending beyond local interventions to regional governance mechanisms.
In conclusion, these findings emphasize the growing spatial coherence between green finance mechanisms and low-carbon transitions, while revealing considerable heterogeneity in the spillover effects across regions. This underscores the necessity for region-specific green finance policies that are attuned to local industrial structures and institutional capabilities. Optimizing the spatial allocation of green financial resources is essential for advancing multi-scalar governance strategies and facilitating regionally coordinated decarbonization.

Policy Implications

In light of the spatial heterogeneity observed across the five major urban agglomerations in the middle and lower Yellow River Basin, as well as the distinct spatial interactions between green finance and carbon emissions, this study proposes the following region-specific policy recommendations to enhance the coordination between financial resource allocation and regional decarbonization pathways:
(1)
Central Plains Urban Agglomeration:
Given the complexity of its resource endowment and industrial structure, the Central Plains region should prioritize the expansion of green credit and transition finance, especially in the context of high-carbon industrial restructuring. A dedicated green transformation fund should be established to support decarbonization efforts in sectors such as coal and metallurgy. Local governments and financial institutions are encouraged to collaborate in developing innovative financial instruments to address structural financing constraints. Furthermore, green finance should be closely integrated with regional industrial upgrading, with policy emphasis placed on supporting low-carbon technological innovation. The standardization of green financial products and transparency in cross-regional asset flows should be strengthened to mitigate risks of greenwashing and improve capital efficiency.
(2)
Guanzhong Plain Urban Agglomeration:
The Guanzhong region demonstrates strong spatial spillover effects of green finance, suggesting its growing influence on adjacent areas. Establishing a regional coordination platform is critical to facilitating cross-city investment in green projects and promoting low-carbon technology diffusion. Public finance instruments, such as green municipal bonds and structured debt products, should be leveraged to finance green infrastructure. Targeted support should be directed toward clean energy deployment and green technology applications, particularly in high-emission industries. A regional green finance development fund may be introduced to channel resources more effectively toward decarbonization efforts.
(3)
Hohhot–Baotou–Ordos–Yulin (HBOY) Urban Agglomeration:
In the HBOY region, weak green finance spillovers and structural barriers highlight the need for foundational capacity building. Efforts should be directed toward strengthening green financial infrastructure, with a focus on innovation in standard settings and financial products. Tailored policies are needed to support the decarbonization of resource-dependent industries and to facilitate a shift toward cleaner energy mixes. Green financing mechanisms should prioritize clean energy, energy efficiency improvements, and the deployment of carbon capture, utilization, and storage (CCUS) technologies. Establishing a low-carbon development fund, accompanied by regulatory refinement, would provide institutional support for green finance expansion.
(4)
Shandong Peninsula Urban Agglomeration:
With rising demand for both green finance and emissions reduction, the Shandong Peninsula should accelerate the innovation of financial instruments and the structural transformation of high-emission industries. Green supply chain finance should be prioritized to promote enterprise-level emissions accountability. A technology transition fund may support firms in developing and applying low-carbon technologies. Cross-agglomeration collaboration should be reinforced to ensure the effective circulation of green capital and clean technologies. Financial innovations, such as PPP-based green infrastructure projects and municipal bonds, can serve as viable channels for funding clean transport and renewable energy systems. Enhancing the liquidity of the green finance market is crucial for promoting efficient interregional capital allocation.
(5)
Jinzhong Urban Agglomeration:
As a typical resource-based region, Jinzhong exhibits relatively low green finance penetration and requires targeted interventions. Emphasis should be placed on designing green financial products tailored to the needs of high-emission sectors. Policies should support the development of green credit and transition finance instruments that enable coal, steel, and related industries to undertake structural upgrades. Local authorities can establish dedicated green funds and offer concessional financing to promote technological innovation and emissions reduction. Policy priorities should focus on improving the transparency of green finance instruments, developing regional green asset trading platforms, and ensuring the effective allocation of capital.
(6)
Cross-regional coordination mechanisms:
To address the transboundary nature of carbon emissions, an integrated cross-regional green finance governance framework is essential. Urban agglomeration-based cooperation platforms—such as those linking the Central Plains and Guanzhong Plain or the Shandong Peninsula and southwestern Shandong—should be institutionalized to support interregional green investment and technology diffusion. In regions where carbon spillovers are significant (e.g., Central Plains and Guanzhong), a unified emissions control framework should be established to harmonize regulatory standards and project implementation. A dedicated cross-regional green finance fund could be used to support low-carbon infrastructure and renewable energy projects that span multiple jurisdictions, thereby improving financial coordination and capital mobility at the regional scale.

Author Contributions

Conceptualization, J.R.; Methodology, J.R.; Software, J.R.; Validation, J.R. and L.G.; Formal analysis, J.R.; Resources, J.R. and L.G.; Data curation, J.R.; Writing—original draft, J.R.; Writing—review & editing, J.R.; Visualization, L.G.; Supervision, G.Y. All authors have read and agreed to the published version of the manuscript.

Funding

This research was funded by Special Project for Strategic Research on Science and Technology Innovation in Autonomous Regions: “Research on Technological Innovation Pathways for Developing New Quality Productive Forces with Xinjiang Characteristics” (2024B04002-3); “Double First-Class” Initiative of Xinjiang University, “Theory and Practice of the Socialist Market Economy” (XIDX2024YIPK09). The APC was funded by Department of Science and Technology of Xinjiang Uygur Autonomous Region and Xinjiang University.

Institutional Review Board Statement

Not applicable.

Informed Consent Statement

Not applicable.

Data Availability Statement

The original contributions presented in this study are included in the article. Further inquiries can be directed to the corresponding author.

Conflicts of Interest

The authors declare no conflict of interest.

References

  1. Wang, X.; Zhang, L.; Qin, Y.; Zhang, J. Spatiotemporal Evolution and Driving Factors of Carbon Emissions from High-Carbon Manufacturing Industries in China. Resour. Sci. 2020, 42, 323–333. [Google Scholar]
  2. Huang, D.; Shen, X.; Zhu, Y. Spatiotemporal Evolution and Influencing Factors of Manufacturing Carbon Emission Efficiency in the Yangtze River Economic Belt. Resour. Environ. Yangtze Basin 2023, 32, 1113–1126. [Google Scholar]
  3. Mo, H.B.; Wang, S.J. Spatiotemporal pattern evolution and spatial effect mechanisms of county-level carbon emissions in the Yellow River Basin. Geogr. Sci. 2021, 41, 1324–1335. [Google Scholar] [CrossRef]
  4. Wang, Y.; Shi, W. Dynamic evolution, difference decomposition, and influencing factors of urban carbon emission intensity in the Yellow River Basin. Stat. Decis. 2025, 41, 98–103. [Google Scholar] [CrossRef]
  5. Jiang, W.Z.; Xu, J.H.; Zhao, T. Research on the spatiotemporal pattern and heterogeneity of carbon emissions in the Yangtze River Basin based on nighttime light data. Resour. Environ. Yangtze Basin 2024, 33, 2004–2017. [Google Scholar]
  6. Chen, X.; Zhou, J.B.; Liao, Y.T.; Wang, S.J. Coupling coordination evolution of carbon emissions and urban high-quality development level in the Yangtze River Delta and analysis of influencing factors. World Reg. Stud. 2024, 33, 103–115. [Google Scholar]
  7. Bi, H.; Zhang, S.; Lu, F. Analysis of Decoupling Effects and Influence Factors in Transportation: Evidence from Guangdong Province, China. ISPRS Int. J. Geo-Inf. 2024, 13, 404. [Google Scholar] [CrossRef]
  8. Xu, S.; Liu, T.; Liu, Y. Spatial Spillover Effects of Green Finance on CO2 Emissions: Evidence from the Yangtze River Economic Belt. Resour. Environ. Yangtze Basin 2024, 33, 1313–1324. (In Chinese) [Google Scholar]
  9. Liu, H.J.; Zhang, Y.C. The path of green finance development in China in the past decade: A retrospective, effectiveness evaluation, and future prospects. China Soft Sci. 2023, 16–27. [Google Scholar]
  10. Xu, X.; Zou, S. Research on the coordinated development of circular economy and green finance in Hubei Province. Resour. Environ. Yangtze Basin 2023, 32, 2504–2518. [Google Scholar]
  11. Huang, X.L.; Wu, X.X.; Yuan, Y.; Wang, X.Y. Energy-saving effects and mechanisms of green finance reform. China Popul. Resour. Environ. 2023, 33, 27–36. [Google Scholar]
  12. Zhang, B.; Gong, D.W.; Yu, X. Research on the evolution path and institutional logic of green finance standards. Stat. Inf. Forum 2023, 38, 64–79. [Google Scholar]
  13. Xue, B.W.; Feng, Z.X. Evaluation of regional green finance development in China. J. Xi’an Jiaotong Univ. Soc. Sci. Ed. 2024, 44, 44–61. [Google Scholar] [CrossRef]
  14. Huang, X.W.; Zong, S.W.; Lin, Y.K. Regional differences and innovation effects of green finance development. Stat. Decis. 2022, 38, 139–142. [Google Scholar] [CrossRef]
  15. Zhang, Y.J. The impact of financial development on carbon emissions: An empirical analysis in China. Energy Policy 2011, 39, 2197–2203. [Google Scholar] [CrossRef]
  16. Yan, C.; Li, T.; Lan, W. Financial development, innovation, and carbon dioxide emissions. J. Financ. Res. 2016, 1, 14–30. [Google Scholar]
  17. Li, Q. The carbon reduction effect of green finance reform and its impact mechanism. Mod. Econ. Res. 2025, 62–72, 87. [Google Scholar] [CrossRef]
  18. De Haas, R.; Popov, A.A. Finance and carbon emissions. SSRN Electron. J. 2019. [Google Scholar] [CrossRef]
  19. Zhao, J.; Liu, C.; Li, C. The impact of financial development on carbon emissions: “Promotion effect” or “suppression effect”? —A mediating effect model based on heterogeneity of technological progress. J. Xinjiang Univ. Philos. Humanit. Soc. Sci. Ed. 2020, 48, 1–10. [Google Scholar] [CrossRef]
  20. Kang, C.; Shi, G.; Guo, X. Pathways to carbon emission reduction through green finance: Insights from green technological progress and ecological industrial restructuring. Tax. Econ. 2025, 87–99. [Google Scholar]
  21. Zhou, D.; Chen, G.; He, D. Can green financial pilot policy reduce firms’ carbon emissions? Evidence from Chinese manufacturing firms. Econ. Change Restruct. 2025, 58, 16. [Google Scholar] [CrossRef]
  22. Du, M.; Zhang, J.; Hou, X. Decarbonization like China: How does green finance reform and innovation enhance carbon emission efficiency? J. Environ. Manag. 2025, 376, 124331. [Google Scholar] [CrossRef] [PubMed]
  23. He, Z. Green finance, carbon emission regulation, and corporate green total factor productivity. Stat. Decis. 2024, 40, 155–159. [Google Scholar] [CrossRef]
  24. Ji, X.; Wang, S. The impact of green finance on agricultural carbon emission intensity: Effect and mechanism test. Stat. Decis. 2025, 41, 138–143. [Google Scholar] [CrossRef]
  25. Wang, S.; Zhang, Y. The impact of green finance from the dual perspective of carbon emissions and carbon removal: Based on a revised carbon neutrality model. South. Financ. 2025, 1–16. [Google Scholar]
  26. Zhang, C.; Wang, C.; He, H.; Xu, M.; Balezentis, T.; Agnusdei, L. The impact of green finance on energy transition and carbon emission targets: Exploring the double threshold and spatial spillover effects among the regions. Struct. Change Econ. Dyn. 2025, 73, 1–10. [Google Scholar] [CrossRef]
  27. Xu, S.; Liu, S.; Zhang, Y. The impact of regional green finance on green consumption and its transmission mechanism: A spatial spillover perspective. J. Beijing Inst. Technol. Soc. Sci. Ed. 2025, 27, 175–192. [Google Scholar] [CrossRef]
  28. Zhang, Y.; Zou, G. Spatial spillover effects of green finance policies on carbon emissions. J. Wuhan Univ. Philos. Soc. Sci. Ed. 2024, 77, 60–72. [Google Scholar] [CrossRef]
  29. Cui, Y.; Li, X.; Liu, Y.; Zhang, T. Coupling coordination characteristics and influencing factors of green finance development and green low-carbon transformation: A case study of Hunan Province. Prog. Geogr. 2025, 44, 144–156. [Google Scholar]
  30. Huang, Y.; Tong, X. Threshold Effect of Green Finance on Carbon Emissions—From the Perspective of the Marine Economic Zone. Sci. Technol. Ind. 2024, 24, 112–121. [Google Scholar]
  31. Xiao, X.; Hu, M. Research on the Carbon Reduction Effect of Green Finance: Also on the Promotion and Suppression Effects of Carbon Emissions. Reg. Financ. Res. 2023, 74–83. [Google Scholar]
  32. Zhang, K.; Zhang, Y. Evolution of Regional Economic Disparities in the Yellow River Basin at Different Spatial Scales. Econ. Geogr. 2020, 40, 1–11. [Google Scholar] [CrossRef]
  33. Han, F.; Xie, R. Does the agglomeration of producer services reduce carbon emissions?—A spatial econometric analysis of panel data from cities at the prefecture level and above in China. Quant. Econ. Tech. Econ. Res. 2017, 34, 40–58. [Google Scholar] [CrossRef]
  34. Zhang, Y.; Zheng, H.Y.; Ge, L.M. The impact of sustainable development policies in resource-based cities on carbon emissions. Financ. Econ. Res. 2022, 48, 49–63. [Google Scholar] [CrossRef]
  35. Wang, S.J.; Su, Y.X.; Zhao, Y.B. Regional differences, spatial spillover effects, and influencing factors of energy consumption and carbon emissions in Chinese cities. Geogr. Res. 2018, 73, 414–428. [Google Scholar]
  36. Huang, Y.; Huang, Y.; Chen, Y.; Yang, S. Spatial Evolution of Traditional Waterside Settlements South of the Yangtze River and the Distribution of Settlement Heritage: Evidence from the Nanxi River Basin. Npj Herit. Sci. 2025, 13, 62. [Google Scholar] [CrossRef]
  37. Ozili, P.K. Green finance research around the world: A review of literature. Int. J. Green Econ. 2022, 16, 56–75. [Google Scholar] [CrossRef]
  38. Akomea-Frimpong, I.; Adeabah, D.; Ofosu, D.; Tenakwah, E.J. A review of studies on green finance of banks, research gaps and future directions. J. Sustain. Financ. Invest. 2022, 12, 1241–1264. [Google Scholar] [CrossRef]
  39. Liu, H.; He, C. The mechanism and test of green finance promoting high-quality urban economic development: Empirical evidence from 272 prefecture-level cities in China. Invest. Res. 2021, 40, 37–52. [Google Scholar]
  40. Xie, F.; Zhou, M. A study on the impact of green finance on the green development of the digital economy. Chongqing Soc. Sci. 2023, 35–50. [Google Scholar] [CrossRef]
  41. Mao, X.; Wang, R. Green finance and new quality productive forces: Promotion or inhibition?—From the perspective of technological innovation and environmental concern. J. Shanghai Univ. Financ. Econ. 2024, 26, 30–45. [Google Scholar] [CrossRef]
  42. Rubin, D.B. The Calculation of Posterior Distributions by Data Augmentation: Comment: A Noniterative Sampling/Importance Resampling Alternative to the Data Augmentation Algorithm for Creating a Few Imputations When Fractions of Missing Information Are Modest: The SIR Algorithm. J. Am. Stat. Assoc. 1987, 82, 543–546. [Google Scholar]
  43. Zhang, S.; Ren, C. The impact of green finance on high-quality agricultural development: An empirical test based on threshold and mediation effect models. Front. Eng. Manag. Technol. 2024, 1–12. Available online: http://kns.cnki.net/kcms/detail/34.1013.N.20241128.0949.008.html (accessed on 24 March 2025).
  44. Lee, L.F. Best spatial two-stage least squares estimators for a spatial autoregressive model with autoregressive disturbances. Econom. Rev. 2003, 22, 307–335. [Google Scholar] [CrossRef]
  45. Kelejian, H.H.; Prucha, I.R. Estimation of simultaneous systems of spatially interrelated cross sectional equations. J. Econ. 2004, 118, 27–50. [Google Scholar] [CrossRef]
Figure 1. Geographic scope of the urban agglomeration in the middle and lower reaches of the Yellow River. Resource: The author compiled this based on the China Statistical Yearbook and local statistical yearbooks.
Sustainability 17 04713 g001
Figure 2. Iso-contour map of carbon emissions in 49 cities within the Urban Agglomeration of the middle and lower reaches of the Yellow River, 2003–2022; (a) Guanzhong Plain urban agglomeration (XA: Xi’an; BJ: Baoji; TC: Tongchuan; WN: Weinan; XY: Xianyang; YA: Yan’an; SL: Shangluo; TS: Tianshui; Pl: Pingliang; QY: Qingyang; YC: Yuncheng; LF: Linfen); (b) Hohhot–Baotou–Ordos–Yulin urban agglomeration (HT: Hohhot; BT: Baotou; OS: Ordos; YL: Yulin); (c) Jinzhong urban agglomeration (TY: Taiyuan; JZ: Jinzhong; XZ: Xinzhou; YQ: Yangquan; LL: Lvliang); (d) Shandong Peninsula urban agglomeration (HZ: Heze; LC: Liaocheng; JN: Jining; TA: Taian; JN: Jinan; DZ: Dezhou; BZ: Binzhou; ZB: Zibo; DY: Dongying); (e): Central Plains urban agglomeration (ZZ: Zhengzhou; KF: Kaifeng; LY: Luoyang; NY: Nanyang; AY: Anyang; SQ: Shangqiu; XX: Xinxiang; PDS: Pingdingshan; XC: Xuchang; JZ: Jiaozuo; XY: Xinyang; HB: Hebi; PY: Puyang; LH: Luohe; SMX: Sanmenxia; ZK: Zhoukou; ZMD: Zhumadian; CZ: Changzhi; JC: Jincheng). Note: The color gradient represents carbon emissions levels, with the scale indicating total emissions (in million tons), ranging from blue (low) to red (high).
Sustainability 17 04713 g002
Figure 3. Three-dimensional kernel density estimation of carbon emissions in the middle and lower reaches of the Yellow River Basin (2003–2022); (a) kernel density plot of overall carbon emissions; (b) kernel density plot of midstream carbon emissions; (c) kernel density plot of downstream carbon emissions. The color gradient represents the density values, where warmer colors (e.g., yellow) indicate higher nuclear density, and cooler colors (e.g., blue and green) indicate lower density.
Sustainability 17 04713 g003
Figure 4. Spatial quantile distribution of carbon emissions in the middle and lower reaches of the Yellow River Basin, 2003–2022; (a) spatial quantile map of carbon emissions in 2003; (b) spatial quantile map of carbon emissions in 2011; (c) spatial quantile map of carbon emissions in 2022.
Sustainability 17 04713 g004
Figure 5. Three-dimensional kernel density estimation of the Green Finance Index for the middle and lower reaches of the Yellow River from 2003 to 2022; (a) kernel density plot of the overall Green Finance Index; (b) kernel density plot of the midstream Green Finance Index; (c) kernel density plot of the downstream Green Finance Index. The color gradient represents the density values, where warmer colors (e.g., yellow) indicate higher nuclear density, and cooler colors (e.g., blue and green) indicate lower density.
Sustainability 17 04713 g005
Figure 6. Spatial quantile distribution of the Green Finance Index in urban agglomerations of the middle and lower Yellow River region, 2003–2022; (a) spatial quantile map of the Green Finance Index in 2003; (b) spatial quantile map of the Green Finance Index in 2011; (c) spatial quantile map of the Green Finance Index in 2022.
Sustainability 17 04713 g006
Figure 7. Temporal trend of the bivariate global Moran’s I between the Green Finance Index and carbon emissions in the middle and lower reaches of the Yellow River Basin (2003–2022). w × INDEX, w × CO2, × denotes the interaction term between variables.
Sustainability 17 04713 g007
Figure 8. Bivariate LISA cluster map of the Green Finance Index and carbon emissions in the middle and lower reaches of the Yellow River Basin (2003–2022); (a) bivariate LISA cluster map of the Green Finance Index and carbon emissions in 2003; (b) bivariate LISA cluster map of the Green Finance Index and carbon emissions in 2011; (c) bivariate LISA cluster map of the Green Finance Index and carbon emissions in 2022.
Sustainability 17 04713 g008
Table 1. Statistical profile of prefecture-level cities within the middle and lower reaches of the Yellow River Urban Agglomeration.
Name of Urban AgglomerationCities
Central Plains Urban AgglomerationZhengzhou, Kaifeng, Luoyang, Nanyang, Anyang, Shangqiu, Xinxiang, Pingdingshan, Xuchang, Jiaozuo, Xinyang, Hebi, Puyang, Luohe, Sanmenxia, Zhoukou, Zhumadian, Changzhi, Jincheng
Jinzhong Urban AgglomerationTaiyuan, Jinzhong, Xinzhou, Yangquan, Lvliang
Guanzhong Plain Urban AgglomerationXi’an, Baoji, Tongchuan, Weinan, Xianyang, Yan’an, Shangluo, Tianshui, Pingliang, Qingyang, Yuncheng, Linfen
Hohhot–Baotou–Ordos–Yulin Urban AgglomerationHohhot, Baotou, Ordos, Yulin
Shandong Peninsula Urban AgglomerationHeze, Liaocheng, Jining, Taian, Jinan, Dezhou, Binzhou, Zibo, Dongying
Resource: The author compiled this based on the China Statistical Yearbook and local statistical yearbooks.
Table 2. Evaluation system of indicators for the Green Finance Index.
Primary IndicatorSecondary
Indicator
Indicator
Definition
DirectionWeight
Green CreditProportion of Environmental Project LoansTotal Environmental Project Loans in the Province/Total Loans in the Province+0.0931
Green InvestmentProportion of Investment in Environmental Pollution Control to GDPInvestment in Environmental Pollution Control/GDP+0.1217
Green InsuranceDegree of Environmental Pollution Liability Insurance PromotionRevenue from Environmental Pollution Liability Insurance/Total Premium Revenue+0.0946
Green BondsDegree of Green Bond DevelopmentTotal Issuance of Green Bonds/Total Bond Issuance+0.1563
Green SupportProportion of Environmental Protection Expenditure in the Fiscal BudgetEnvironmental Protection Expenditure/General Fiscal Budget Expenditure+0.1068
Green FundsProportion of Green FundsTotal Market Capitalization of Green Funds/Total Market Capitalization of All Funds+0.1380
Green EquityDepth of Green Equity DevelopmentCarbon Trading, Energy Use Rights Trading, and Pollution Rights Trading/Total Equity Market Trading Volume+0.1251
Source: Compiled and calculated by the author using manual data collection. “+” indicates a positive correlation between the indicator and the overall evaluation result, i.e., a higher value of the indicator contributes positively to green finance development.
Table 3. Regression results of the second-, third-, and fourth-order GS3SLS spatial simultaneous equation models with a geographic distance-based spatial weight matrix.
Second OrderThird OrderFourth Order
lngf−3.8738 ***−4.0655 ***−3.1794 ***
−0.7468−0.7476−0.7045
w1y_lngf6.1037 **6.2842 **5.6679 ***
−2.4124−2.5085−1.9637
w1y_lnco20.9590 **0.9777 **0.8813 **
−0.4598−0.4686−0.3787
lnhc−0.0013−0.0011−0.0043
−0.0058−0.0055−0.0077
lntech−0.0007−0.0007−0.0023
−0.0037−0.0035−0.0047
lnco2−0.2350 ***−0.2268 ***−0.2323 ***
−0.0347−0.0306−0.0339
w1y_lnco20.2336 *0.2262 *0.2049 *
−0.1264−0.1222−0.1226
w1y_lngf1.4425 **1.4265 **1.3314 **
−0.6265−0.6202−0.5949
N980980980
Goodness of Fit−4.8666−5.3179−3.4524
LLF−475.901−512.217−340.747
AIC0.27780.29550.2239
SC0.28480.3030.2296
Standard errors in parentheses “* p < 0.1, ** p < 0.05, *** p < 0.01”.
Table 4. Regression results of the GS3SLS spatial simultaneous equation model with a geographic distance-based spatial weight matrix by sub-period.
2003–2012 Years2013–2022 Years
lngf−2.5618 ***−0.8497 *
−0.6758−0.4487
w1y_lngf3.8818 *1.6189 *
−2.3446−0.948
w1y_lnco21.6123 ***0.5756
−0.4851−0.3826
lnhc−0.0021−0.0043
−0.01−0.0293
lntech−0.0011−0.0084
−0.0073−0.0108
lnco2−0.3331 ***−0.3529 **
−0.0674−0.1489
w1y_lnco20.5176 **0.1655
−0.216−0.3122
w1y_lngf1.37570.7949
−0.9197−0.7236
N490490
Goodness of Fit−2.9006−0.5796
LLF−58.172287.3027
AIC0.20080.0382
SC0.20960.0398
Standard errors in parentheses “* p < 0.1, ** p < 0.05, *** p < 0.01”.
Table 5. Regression results of the GS3SLS spatial simultaneous equation model with a geographic distance-based spatial weight matrix across different urban agglomerations.
Central Plains Urban AgglomerationGuanzhong Plain Urban AgglomerationHohhot–Baotou–Ordos–Yulin Urban AgglomerationJinzhong Urban AgglomerationShandong Peninsula Urban Agglomeration
lngf−2.2191 ***2.0523−0.56240.8585−0.4007
−0.4783−1.6987−0.532−0.7602−2.598
w1y_lngf3.9032 **12.0963 ***−1.6381 *2.9119 **−18.2630 *
−1.8414−3.498−0.9052−1.2558−10.4968
w1y_lnco21.8222 **−1.9512 ***1.1470 ***−2.1870 ***0.3495
−0.7227−0.6643−0.3885−0.2616−0.4559
lnhc−0.0149−0.01090.09180.0166−0.0069
−0.0274−0.015−0.0572−0.0319−0.025
lntech−0.00010.01520.1373 **−0.0058−0.0124
−0.01−0.0106−0.0677−0.0159−0.0103
lnco2−0.30120.1731 ***0.08380.15330.0274
−0.207−0.0547−0.127−0.1108−0.0451
w1y_lnco20.6914 **0.3245 *−0.12980.32−0.0328
−0.3452−0.1796−0.4488−0.3517−0.0869
w1y_lngf1.1963−2.0464 **−2.4217 ***−1.4130 **−0.2215
−0.7781−0.9411−0.7471−0.6326−1.5051
N38024080100180
Goodness of Fit−5.2458−0.44810.15620.7005−3.7712
LLF−10.15521.124737.415498.2621−47.7535
AIC0.15010.86250.20130.58840.636
SC0.1580.92740.23360.67020.695
Standard errors in parentheses “* p < 0.1, ** p < 0.05, *** p < 0.01”.
Disclaimer/Publisher’s Note: The statements, opinions and data contained in all publications are solely those of the individual author(s) and contributor(s) and not of MDPI and/or the editor(s). MDPI and/or the editor(s) disclaim responsibility for any injury to people or property resulting from any ideas, methods, instructions or products referred to in the content.

