1. Introduction
Groundwater is a widespread and fragile natural resource globally, and once contaminated, it is difficult to restore to its original state [
1,
2,
3]. In recent years, with increasing population and resource consumption, groundwater resources have faced growing pressures, with anthropogenic substances present in many aquifers [
4,
5], which may pose significant risks to the chemical integrity of groundwater [
6,
7,
8]. Additionally, recurrent extreme climate events and escalating human activities have led to significant changes in groundwater chemical composition and water quality [
9,
10]. Therefore, revealing the hydrochemical characteristics of groundwater and its water quality evolution mechanisms is crucial for the sustainable development and utilization of water resources and the protection of ecological environments. Moreover, ecological conditions can influence organisms’ biochemical responses [
11,
12].
China is one of the countries with relatively scarce water resources globally [
13,
14,
15]. As an important source of drinking water and agricultural irrigation [
16], the chemical properties and quality of groundwater directly relate to the sustainable utilization of water resources. Many scientists have systematically studied the groundwater chemistry and water quality in China’s river basins. They have investigated the spatial heterogeneity of groundwater chemistry at the basin scale in the Yellow River Basin [
17], analyzed chemical weathering processes there [
18], discussed the seasonal variations in water chemistry and their controlling factors [
19], and assessed the quality of geothermal water [
20]. Studies have also assessed the water quality of the Yangtze River and its spatial variations [
21] and investigated the extent of natural and anthropogenic phenomena related to the river’s elemental chemistry [
22]. Systematic investigations into the hydrogeochemistry of the Pearl River have also been conducted [
23,
24,
25].
As an important ecological barrier in the upper reaches of the Yangtze River [
26,
27], the Wusheng section of the Jialing River Basin is located in the northeastern margin of the Sichuan Basin, belonging to a karst–clastic rock mixed hydrogeological unit [
28,
29]. Its unique geological structures and frequent human activities render its hydrochemical evolution mechanisms complex and sensitive. Although previous studies have revealed the hydrochemical characteristics of some tributaries in the Yangtze River Basin [
30,
31], systematic research on groundwater–surface water interactions and water quality driving factors in tectonically active areas remains insufficient, particularly considering the lack of research on hydrochemical differentiation patterns under the combined influence of lithology, tectonics, and human activities.
This study focuses on the groundwater in the Wusheng section of the Jialing River Basin, emphatically analyzing its hydrochemical characteristics and influencing factors, carrying out groundwater quality assessment, and identifying key indicators affecting water quality. The research results will enrich the research on hydrochemical evolution, the water environment, and water pollution of groundwater in the Wusheng section of the Jialing River Basin so as to provide a reference for the development of groundwater resources, the prevention and remediation of groundwater pollution, and the protection of the groundwater environment in this area.
2. Study Area
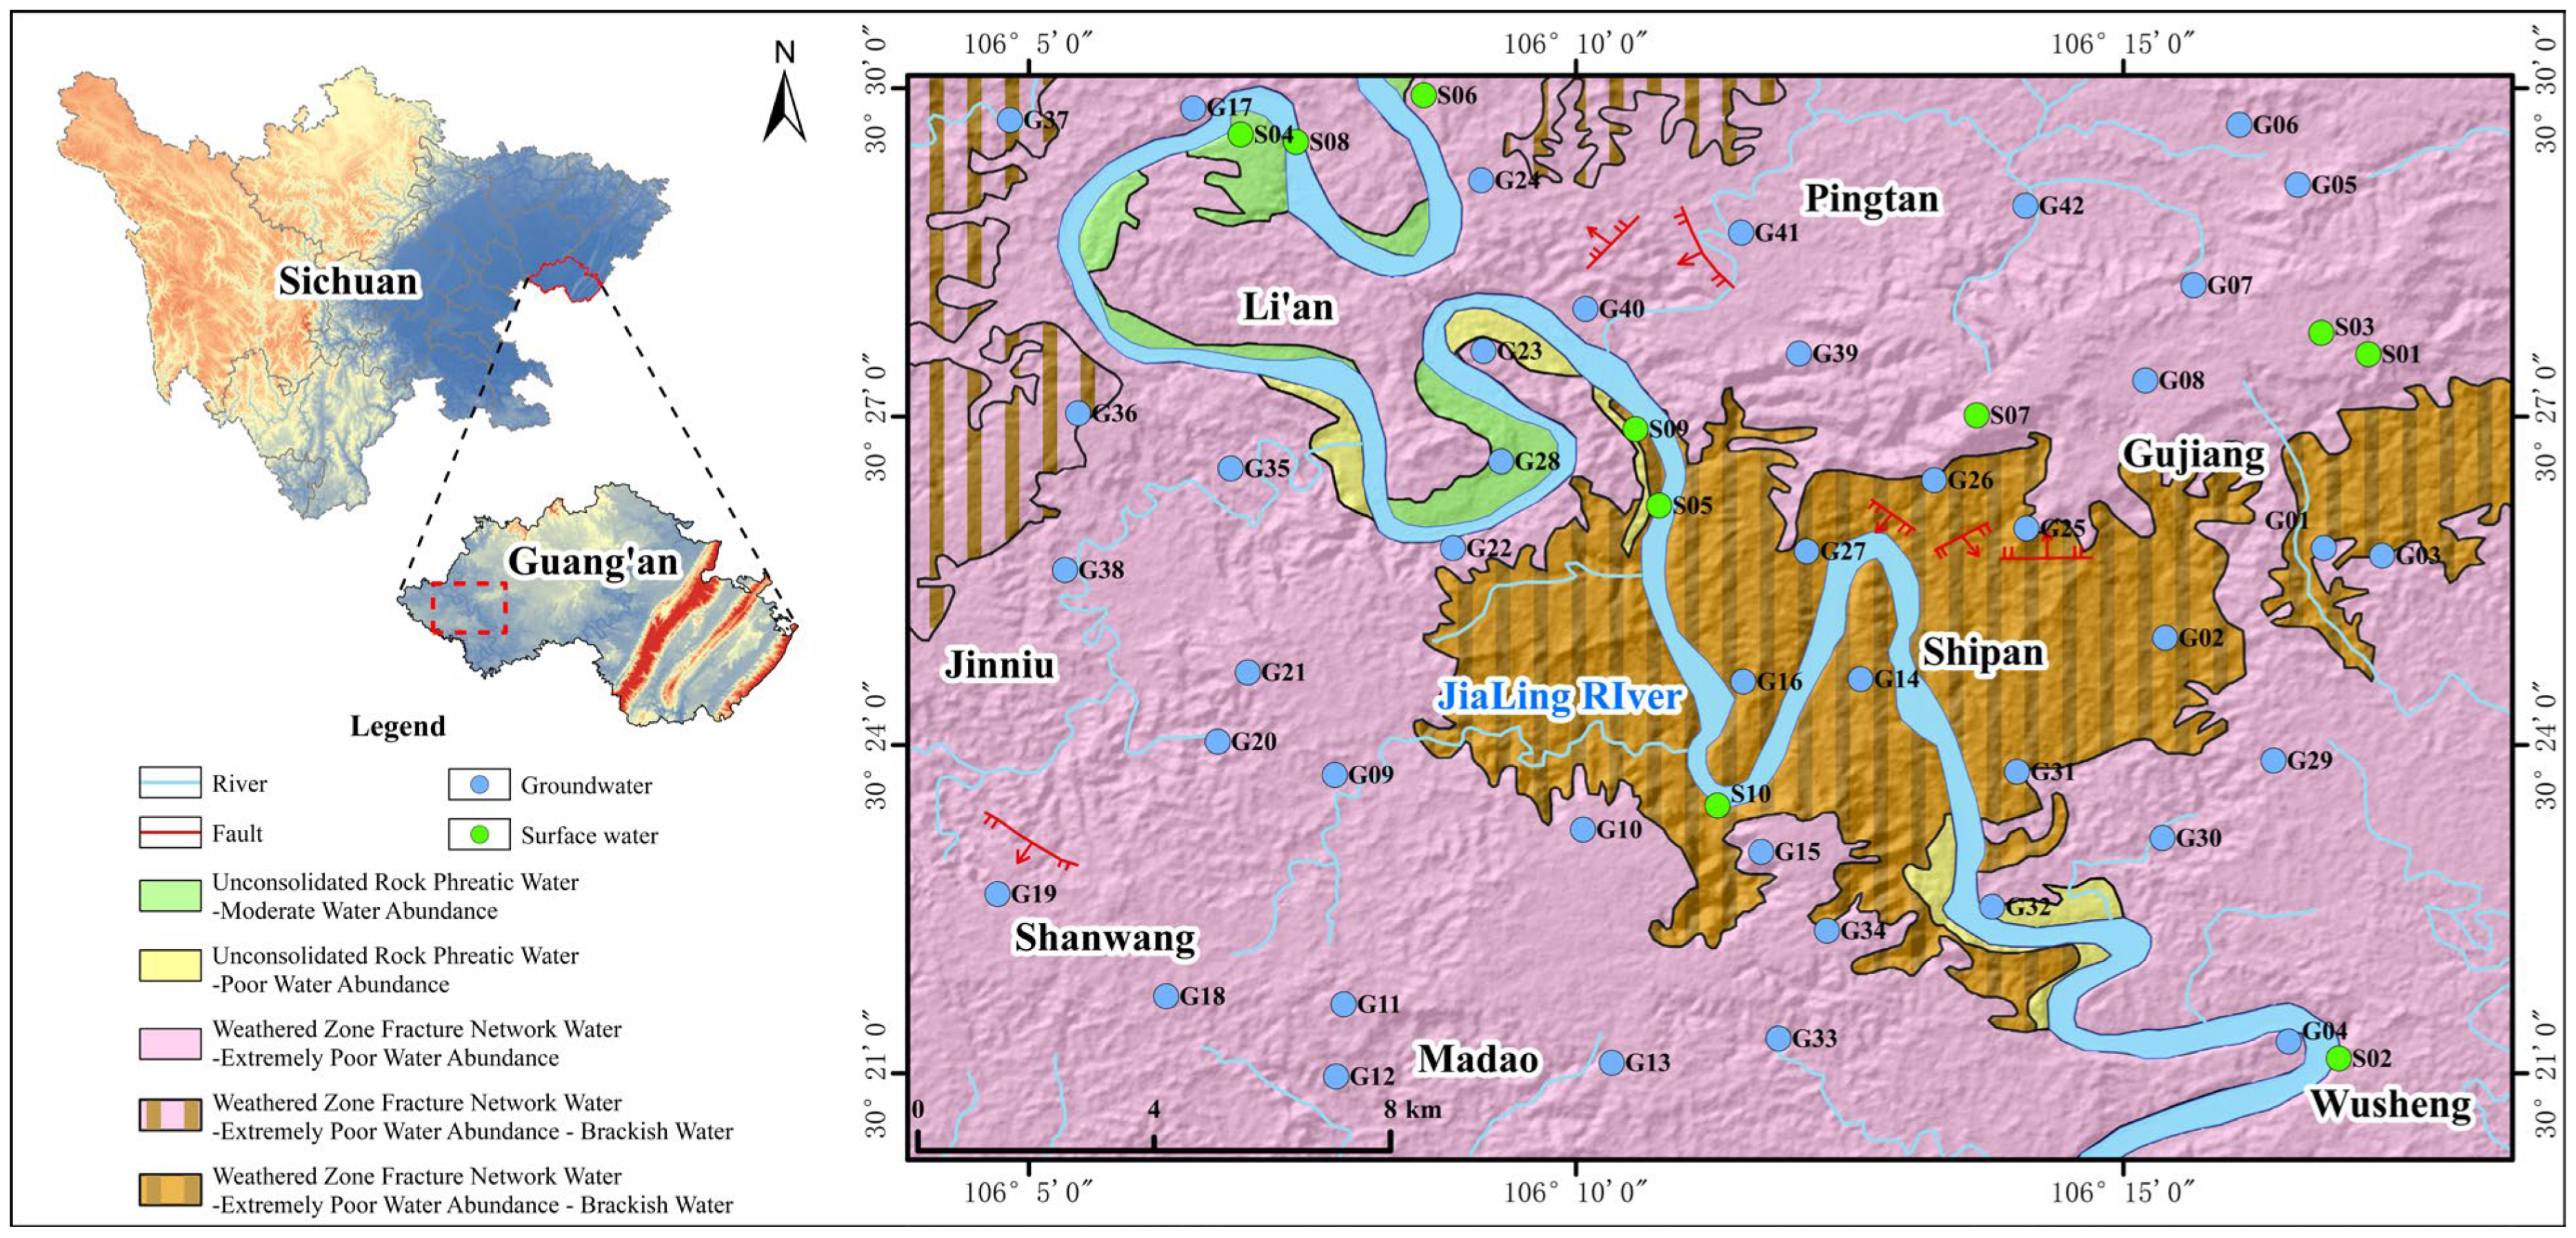
Wusheng County is located in eastern Sichuan Province, southwest of Guang’an City, at the junction of Sichuan Province and Chongqing Municipality. Its geographical coordinates range from 30°10′46″ N to 30°32′36″ N in latitude and 105°56′39″ E to 106°26′50″ E in longitude. The Jialing River flows through the county from north to south. It belongs to the subtropical monsoon humid climate zone in the eastern Sichuan Basin, with distinct seasonal characteristics throughout the year. Wusheng County has abundant rainfall, with a multi-year average annual precipitation of 1034.00 mm, but the distribution is uneven, concentrated mainly during the summer.
The county is rich in water resources, with one river, four streams, and seventy-four small creeks. The Jialing River, flowing from north to south through the central part of the county, forms a natural barrier that divides Wusheng into eastern and western parts. The river’s stretch within the county is 102 km long, with an average width of 549 m and a water surface area of approximately 56 km2. According to multi-year statistics, the annual average runoff of the Jialing River is about 27.8 billion m3.
The study area is located in the central Sichuan fold belt. The exposed strata are mainly from the Middle Jurassic Shaximiao Formation (J2S), with lithology primarily consisting of mudstone, sandy mudstone, and feldspar–quartz sandstone, containing gypsum, soluble salts, and calcareous components. The sandy mudstone layers in the study area are relatively thick. The diagenesis process is not well-developed, and the lithology is generally soft, making it highly susceptible to weathering. The fine-grained sediment produced by weathering can be easily carried by runoff, leading to an increase in water turbidity. Moreover, the gypsum (CaSO4·2H2O) and soluble salts it is rich in are prone to hydrolysis under the action of precipitation and surface runoff, which affects the chemical stability of the water quality.
3. Materials and Methods
3.1. Sample Collection and Testing
A total of 52 water samples were collected in the Wusheng section of the Jialing River Basin, including 42 groundwater samples (springs, wells) and 10 surface water samples (streams and reservoirs). Sampling locations are shown in
Figure 1. A multi-parameter tester was used to measure and record on-site parameters susceptible to environmental changes, such as odor, temperature, pH, chromaticity, and turbidity. Sampling strictly followed the requirements of the Specification for Hydrogeological Survey (DZ/T 0282-2015) [
32]: the flow rate, temperature, pH, and elevation of spring outcrops were measured in situ. Temperature and pH were measured using a portable water quality analyzer (HACH-SL1000, Thermo Fisher Scientific, Waltham, MA, USA); flow rate was measured via the volumetric method; and spring outcrop elevations were recorded using a handheld GPS. For water samples testing metal cations and trace elements, concentrated hydrochloric acid was added to acidify the samples to pH < 2; samples for anions (F
−, Cl
−, SO
42−, etc.) were not acidified. The hydrochemical test data for the study area’s primary groundwater are shown in
Table 1.
After sampling, samples were sent to an indoor laboratory for analysis. Anions such as F−, Cl−, and NO3− were measured using an ion chromatograph (ICS-1100, Thermo Fisher Scientific, Waltham, MA, USA) with a precision of 10−6. Major cations (K+, Na+, Ca2+, Mg2+) and trace element concentrations were determined by inductively coupled plasma optical emission spectrometry (ICP-OES, ICAP6300, Thermo Fisher Scientific, Waltham, MA, USA) with a precision of 10−6. CO32− and HCO3− were measured via titration with a 10 mL micro-burette.
3.2. Research Methods
The Entropy-Weighted Water Quality Index (EWQI) is an environmental quality indicator that synthesizes test results from multiple water quality parameters to generate a dimensionless value representing regional water quality. This approach effectively mitigates the biases arising from subjective weighting methods inherent in traditional Water Quality Indices (WQIs) [
33,
34,
35]. For the EWQI calculation, entropy weighting is employed to minimize the influence of subjective factors and enhance the objective accuracy of the index.
The calculation method of EWQI involves the following steps:
Step 1: Establish the initial water quality numerical matrix. Water quality data from sampling and monitoring are merged and presented in a matrix format, as shown in Equation (1). Assuming there are m water samples and n evaluation variables, the initial matrix of water quality values is denoted as X. In this matrix, X, ij represents the measured value of the j-th evaluation index for the i-th water sample.
Step 2: Normalize the water quality data. This is needed because the initial water quality indices under each evaluation indicator differ significantly in measurement units and scales, and normalization is performed to further reduce subjective influences, as shown in Equations (2) and (3). In the equations, (
xij)max and (
xij)min represent the maximum and minimum values of the
j-th evaluation variable in the initial water quality numerical matrix, respectively. After normalization, the initial water quality numerical matrix,
X, is transformed into the normalized water quality numerical matrix,
Y.
Step 3: Determine the weight of each evaluation factor. In this study, the entropy weighting method is used to determine the weights of each evaluation factor, as shown in Equations (4)–(6). For the water quality evaluation of
m samples with
n (n = 1 − i) evaluation variables, the weight of the
j-th evaluation variable is denoted as
wj. Here,
Pij represents the ratio of the standardized value of the
j-th indicator for the
i-th sample to the sum of all values in the
j-th column of the standardized matrix;
ej is the information entropy of the
j-th indicator; and
wj is the weight of the
j-th indicator in this study.
Step 4: Calculate the water quality ratio based on the evaluation criteria for each assessment factor, as shown in Equations (7) and (8). Here,
Cij represents the measured concentration value of the
i-th parameter for the
j-th evaluation factor, and
Sj corresponds to the groundwater quality assessment standard for the
j-th evaluation factor.
Step 5: Calculate and classify the water quality indices. After obtaining the weight
wj of the
j-th indicator and the water quality ratio
qij in the study, the Water Quality Index (WQI) can be calculated as shown in Equation (9).
Based on the calculated Entropy-Weighted Water Quality Index (EWQI), groundwater can be classified into five categories (
Table 2).
4. Results and Discussion
4.1. Chemical Characteristics of the Groundwater
4.1.1. Hydrochemical Composition Characteristics
The results of the chemical components in each water sample are shown in
Table 1. Weak alkalinity generally refers to a pH between 7 and 9. The pH of the water samples in this study ranges from 7.05 to 8.36, generally showing a weakly alkaline nature. Alkaline water quality may affect the taste of water, causing a bitter and astringent taste and influencing the suitability for drinking water. TDS values show little variation, ranging from 237.7 to 291.8 mg/L in carbonate rock formations, 132.9–288.6 mg/L in carbonate rock with sandstone formations, and 163.9–593.5 mg/L in sandstone formations—with overall fresh water with values less than 1.0 g/L. In carbonate rock formations dominated by limestone and carbonate rock with sandstone formations, groundwater anion–cation concentration relationships are similar, dominated by HCO
3−, SO
42−, Ca
2+, and Mg
2+. For sandstone formed in groundwater, the anions are mainly HCO
3− and SO
42−, but cation content relationships vary, including dominance by Ca
2+/Mg
2+, Ca
2+/Na
+, Na
+/Mg
2+, and Na
+/Ca
2+.
Coefficients of variation for ions in carbonate rock and carbonate–sandstone formations are relatively small, indicating stable ion contents with minimal variation. In sandstone formations, however, ion coefficients of variation are generally larger—Na+ and Cl− exhibit coefficients of 1.67 and 1.25, with contents ranging from 3.08 to 134 mg/L and 1.23–35.80 mg/L, respectively. Water points with significantly higher Na+ and Cl− contents are mostly located in the Cretaceous Mogou Formation regarding sandstone formation. This is preliminarily attributed to the unique desert sediments and flat paleotectonic landforms of this formation, which result in slow groundwater runoff; concurrent cation exchange and adsorption processes are the main factors driving pronounced variations in Na+ and Cl−.
4.1.2. Chemical Types of Groundwater
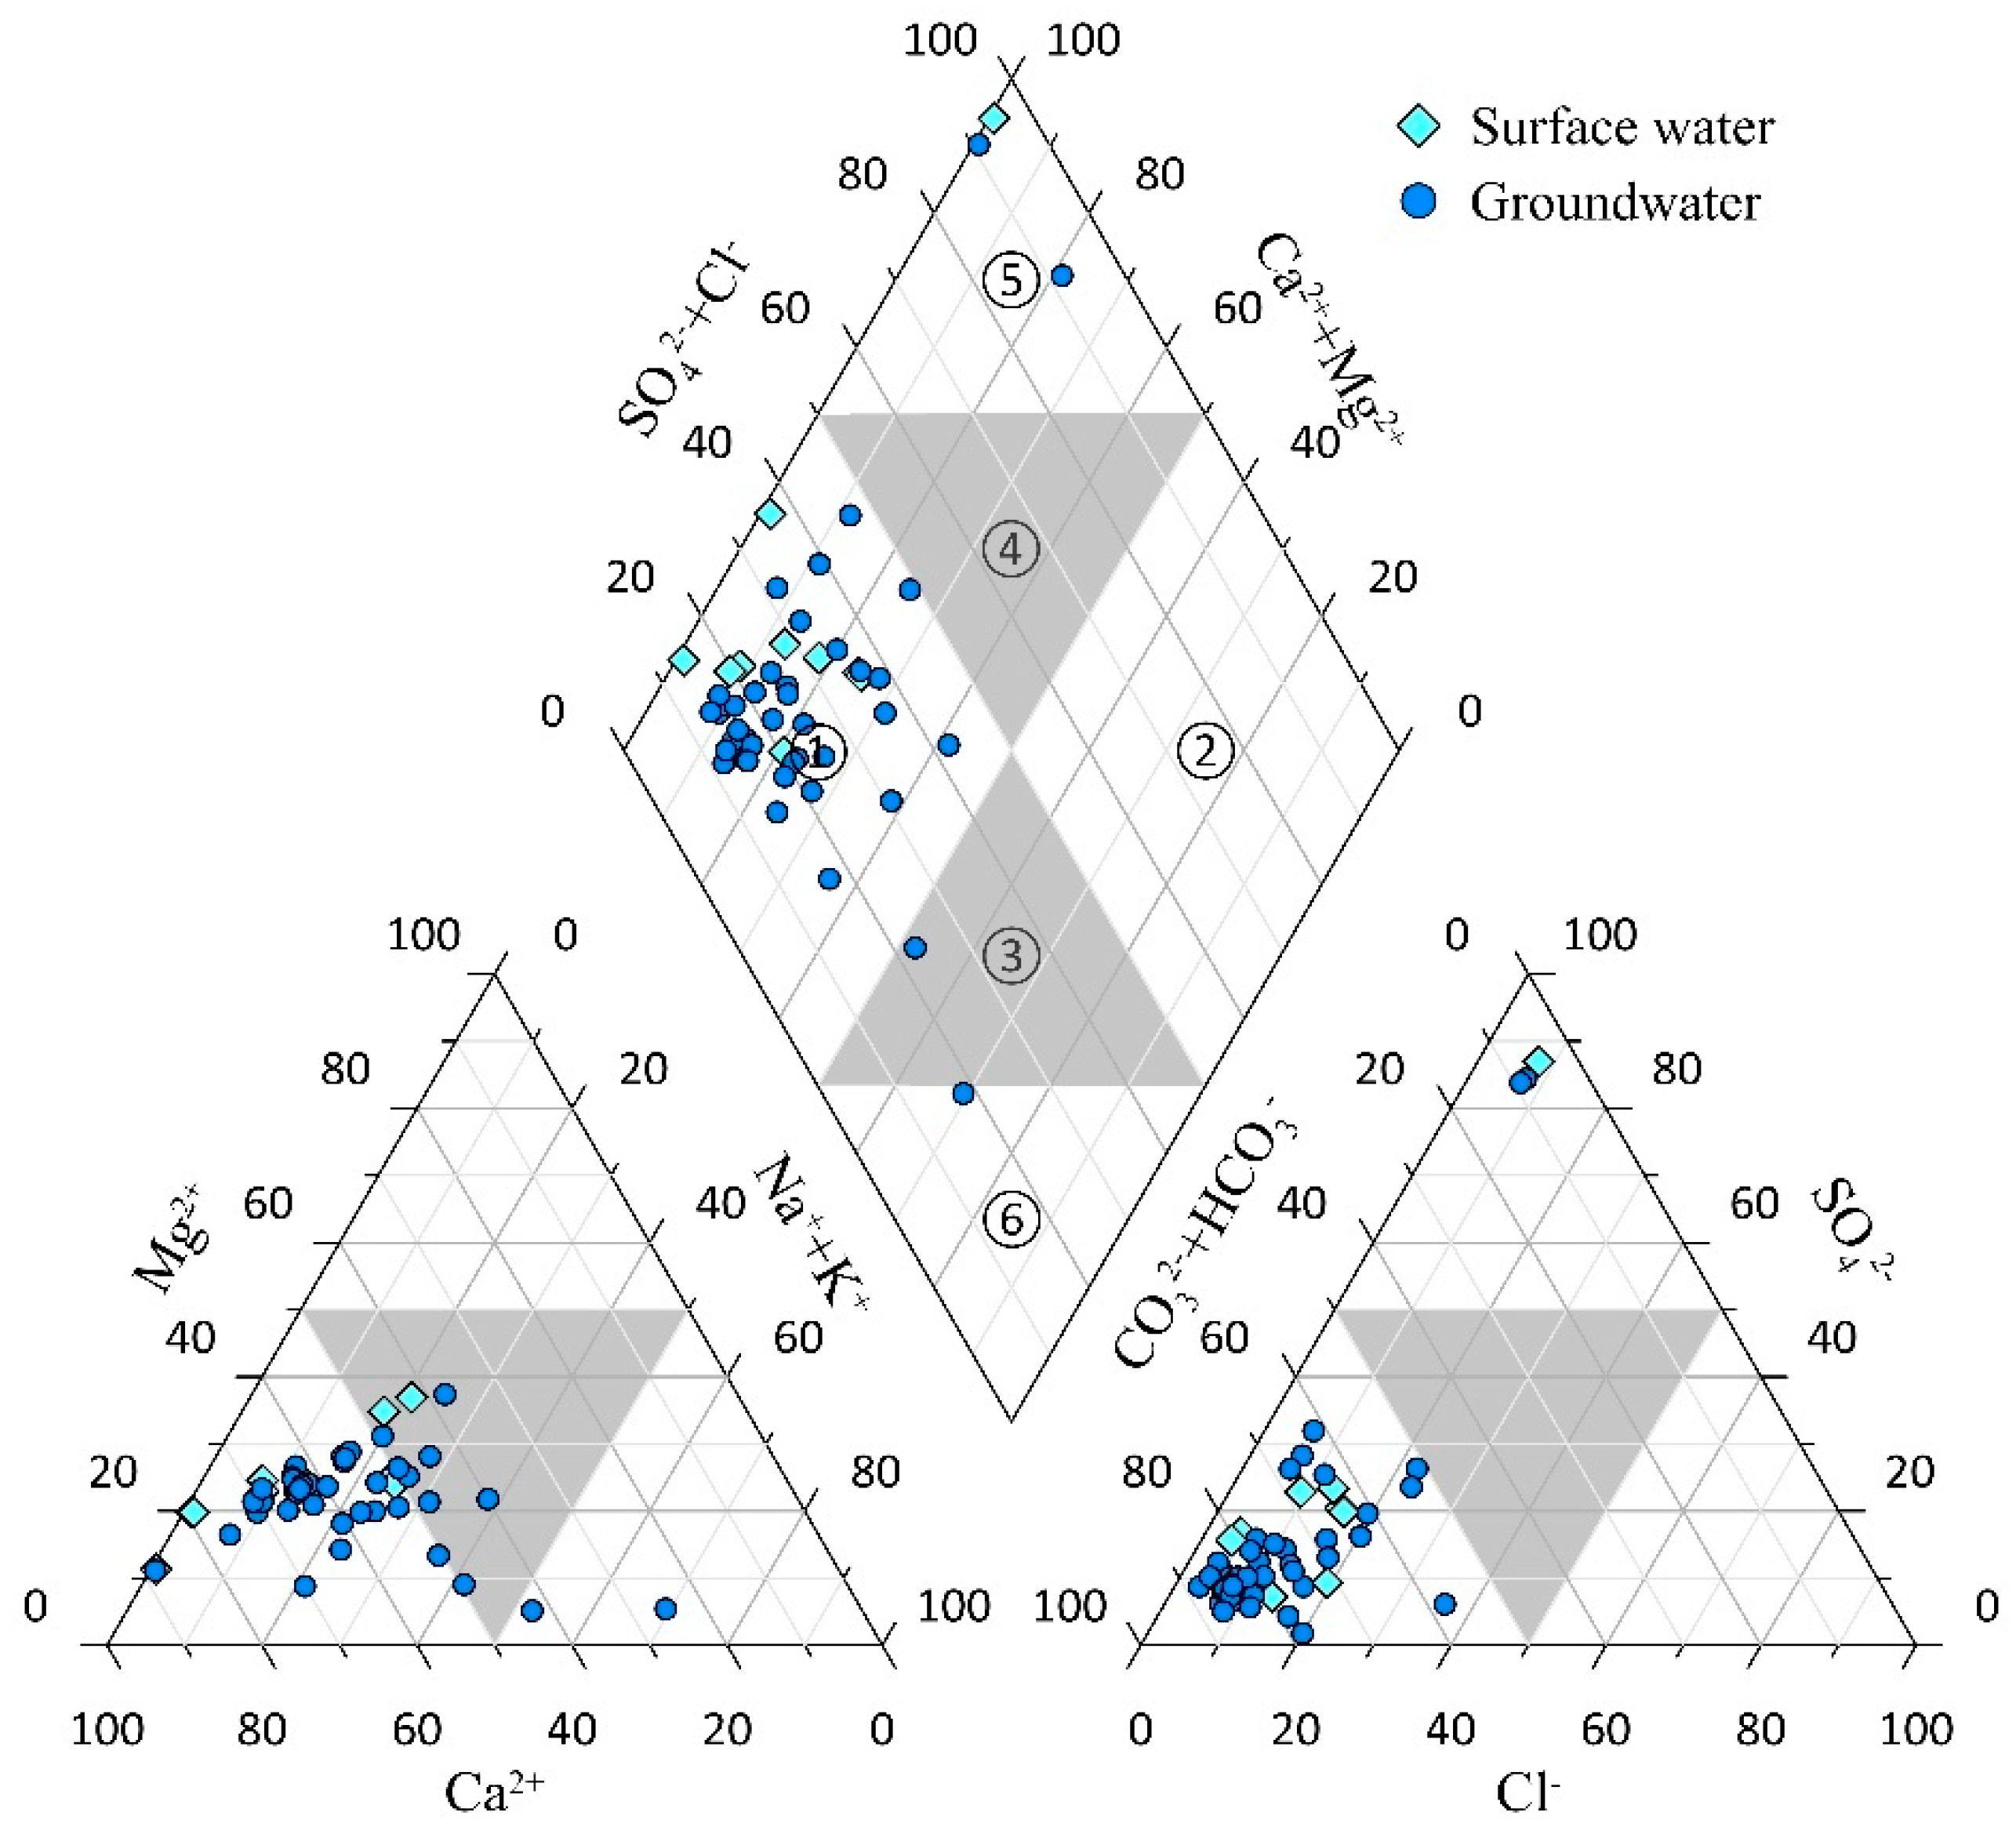
By plotting the Piper trilinear diagram for this study area [
36,
37], the hydrochemical types of water samples can be analyzed and understood. Before plotting, the milliequivalent percentages of anions and cations for each water sample were calculated, and the results were applied in the software Grapher 15 to generate the Piper trilinear diagram for water samples in the study area, as shown in
Figure 2.
The Piper trilinear diagram reveals significant differences between surface water and groundwater in the study area. In surface water, the main cations are both Ca2+ and Na+, with HCO3− as the primary anion, resulting in a hydrochemical type of HCO3−-Ca·Na. In groundwater samples, most are dominated by Ca2+ and Mg2+ as the primary cations, though there are also water samples where Na+ and Mg2+ are the dominant cations. Anions in groundwater are all dominated by HCO3−, although some samples exhibit higher SO42− contents. The hydrochemical types of groundwater include the following: HCO3−-Ca·Mg type, HCO3−-Na·Mg type, HCO3−·SO42−-Ca·Mg type, and HCO3−·SO42−-Na·Mg type.
4.2. Genetic Analysis of Hydrochemical Types
4.2.1. Controlling Factors of Groundwater Chemistry
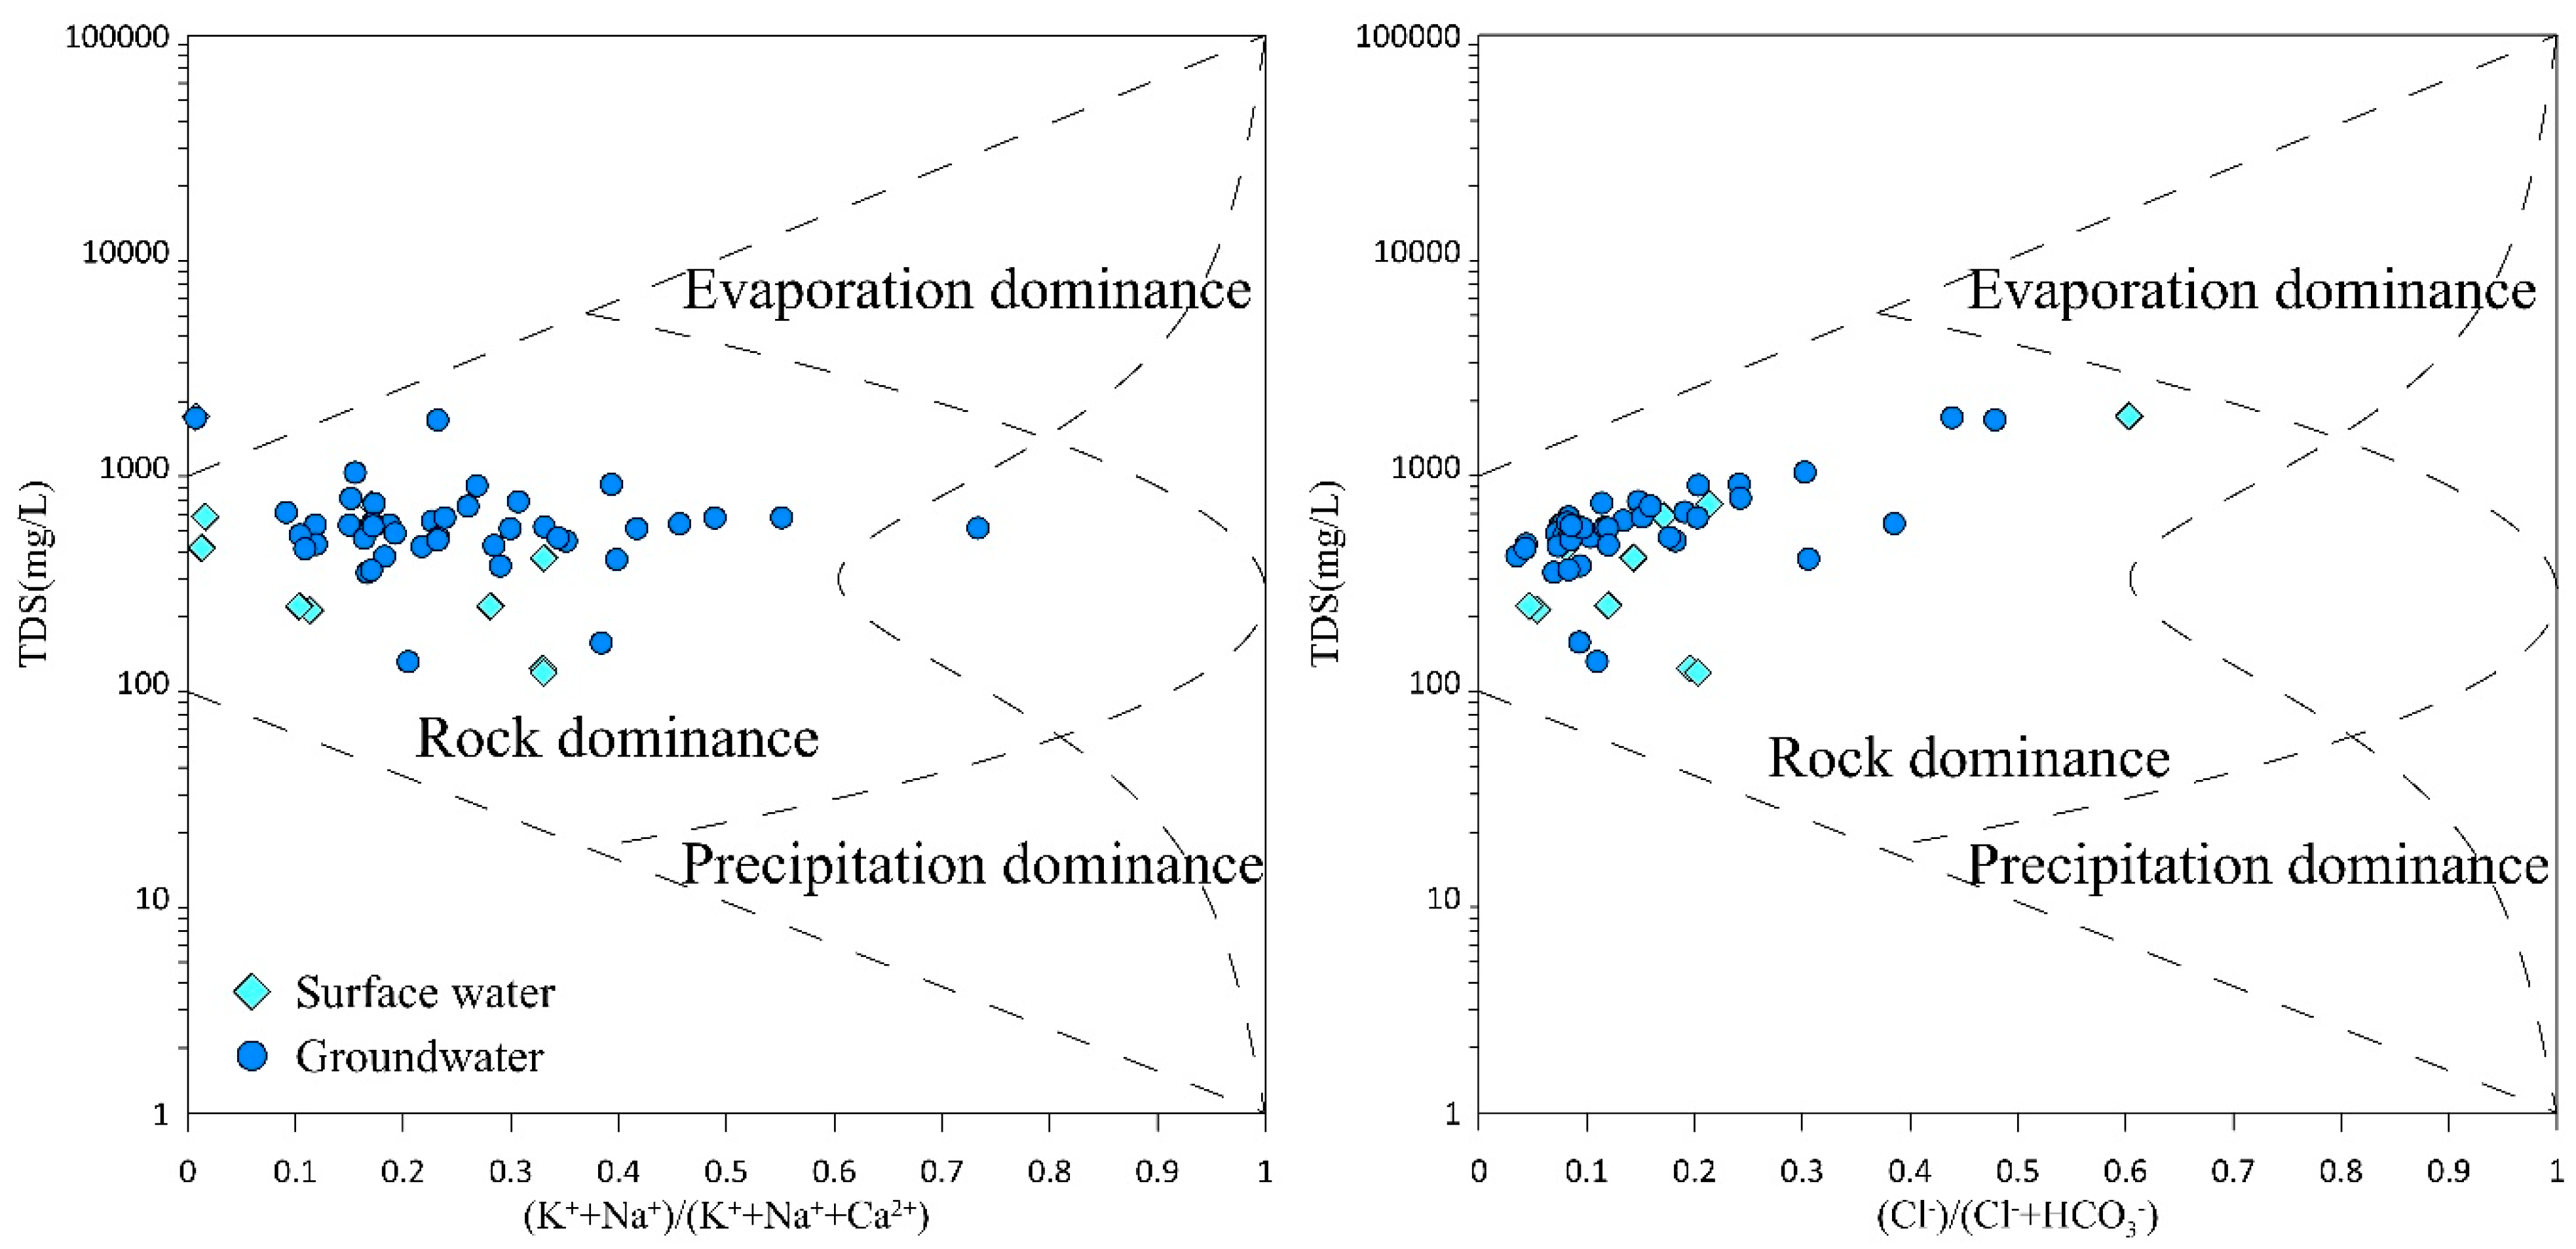
The Gibbs diagram uses the ratio of the total dissolved solids (TDSs) content compared to the anion–cation content in water samples to reflect the evolution mechanism of ionic components in water [
33,
38]. The formation processes of water samples are divided into three categories: rock weathering control, evaporation–concentration control, and atmospheric precipitation control. When constructing the diagram, the anion ratio Cl
−/(Cl
− + HCO
3−) or the cation ratio Na
+/(Na
+ + Ca
2+) of the water samples is used as the abscissa of the Gibbs diagram, and the logarithm of the total dissolved solids (TDSs) content of the water samples is used as the ordinate. The data of the water samples taken from the study area are plotted in the Gibbs diagram, as shown in
Figure 3. According to the Gibbs diagram, the points of surface water and groundwater all fall within the Gibbs model, indicating that the water formation process is less affected by human-induced factors.
In the diagram, the milliequivalent ratio of Na+/(Na+ + Ca2+) in surface water ranges from 0.33 to 0.38; the milliequivalent ratio of Cl−/(Cl− + HC have checked and revised all. O3−) ranges from 0.24 to 0.27, and the TDS content is relatively low. The points are mainly located in the lower-middle and lower-left parts of the Gibbs model, indicating that the formation process of surface water samples is mainly controlled by rock weathering. The distribution range of the milliequivalent ratio of Na+/(Na+ + Ca2+) in groundwater is relatively wide, with a minimum value of only 0.02 and a maximum value of up to 0.98; the milliequivalent ratio of Cl−/(Cl− + HCO3−) ranges from 0.08 to 0.27, and the TDS content ranges from 63.15 to 465.41, showing a large difference. All the groundwater points fall within the rock-weathering control area, which means that the formation process of groundwater is mainly controlled by rock weathering.
4.2.2. Major Ion Ratio Relationships
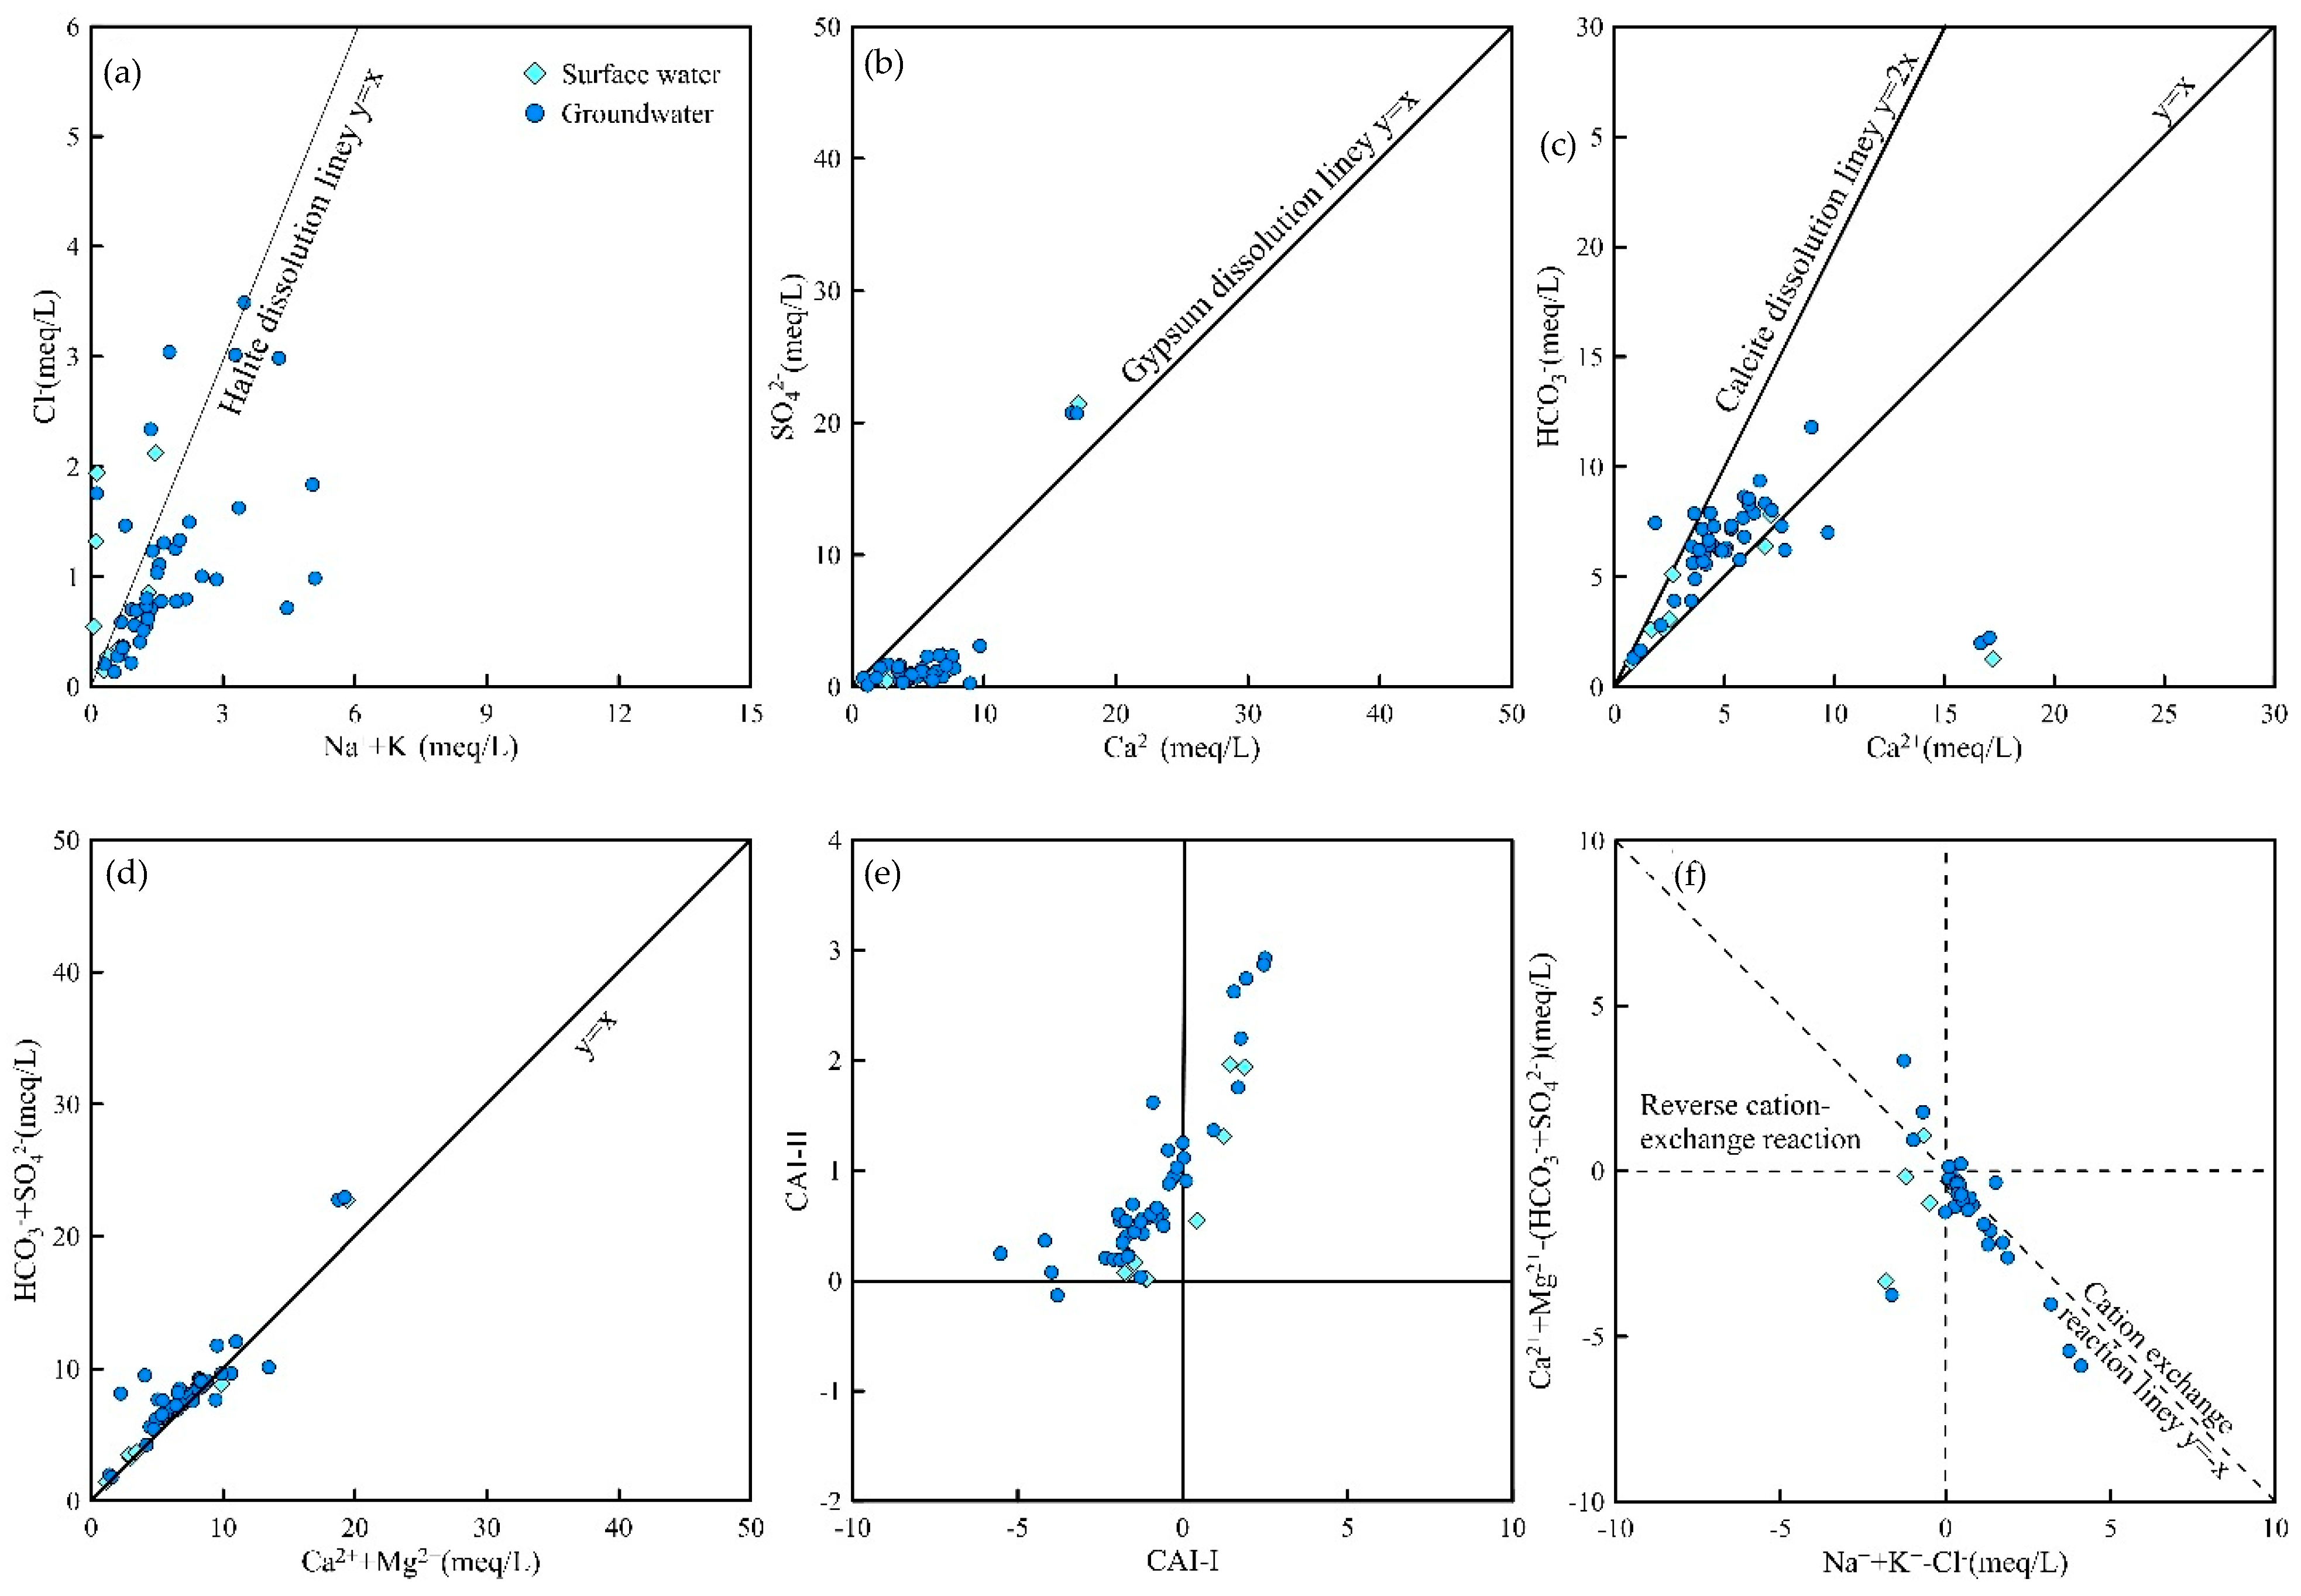
1. Relationship between Na+ and Cl− Ion Ratios
The ratio of γNa
+ to γCl
− (γNa
+/γCl
−) reflects the degree of cation exchange in water and is also known as the groundwater genesis coefficient. It is mainly used to determine whether groundwater formation is influenced by halite leaching, carbonate, or silicate leaching. When γNa
+ equals γCl
− (γNa
+/γCl
− = 1), the water sample is primarily affected by halite leaching during formation. When γNa
+ is much greater than γCl
− (γNa
+/γCl
− > 1), the water sample is influenced by carbonate or silicate leaching. According to the γNa
+/γCl
− ratios in
Figure 4a, all water samples exhibit values far greater than one, indicating that carbonate or silicate mineral leaching dominates their formation process.
2. Relationship between Ca2+ and SO42− Ion Ratios
The Ca
2+/SO
42− ratio is used to determine the degree of gypsum dissolution in water. A ratio of one indicates that all SO
42− originates from gypsum dissolution. As shown in
Figure 4b, some water sample points lie above the gypsum dissolution line, suggesting that SO
42− in these samples has additional sources beyond gypsum.
3. Relationship between Ca2+ and HCO3− Ion Ratios
A Ca
2+/HCO
3− ratio of one in groundwater indicates that all Ca
2+ originates from the weathering and dissolution of carbonate and evaporite rocks. In
Figure 4c, some water sample points fall to the right of the carbonate mineral dissolution line, indicating that carbonate rock dissolution is not the sole source of Ca
2+, and sulfate rock dissolution may also be involved.
Relationship between γ(Ca2+ + Mg2+) and γ(SO42− + HCO3−) Ratios
To further clarify whether water samples are formed by carbonate or silicate mineral leaching, the ratio of γ(Ca2+ + Mg2+) to γ(SO42− + HCO3−) is calculated. This ratio helps determine whether carbonate or silicate mineral leaching dominates groundwater formation as follows:
A ratio of 1 indicates the coexistence of carbonate and silicate mineral leaching.
A ratio > 1 indicates carbonate mineral leaching dominance.
A ratio < 1 indicates silicate mineral leaching dominance.
As shown in
Figure 4d, most water sample points lie on the diagonal line with a ratio of one, indicating that both carbonate and silicate mineral leaching processes coexist.
Groundwater Chlor-Alkali Index (CAI)
The groundwater chlor-alkali index (CAI) is used to quantify the intensity of ion exchange during groundwater chemical evolution. It is negative if Ca
2+ or Mg
2+ in groundwater exchanges with Na
+ in aquifer minerals and positive if Na
+ in groundwater exchanges with Ca
2+ or Mg
2+ in aquifer minerals.
Cation exchange and adsorption processes reduce groundwater hardness and result in low salinity. γ(K
+ + Na
+ − Cl
−) represents the change in the Na
+ content after the dissolution of minerals other than halite, while γ[(Ca
2+ + Mg
2+) − (HCO
3− + SO
42−)] represents the change in the Ca
2+ and Mg
2+ content from the dissolution of minerals other than gypsum, dolomite, and calcite (
Figure 4e).
If a cation exchange occurs, water sample points will mainly concentrate along the line where γ(K
+ + Na
+ − Cl
−)/γ[(Ca
2+ + Mg
2+) − (HCO
3− + SO
42−)] = −1. As shown in
Figure 4f, this confirms the presence of cation exchange in the water samples. The water points from the adit gushing water are located below the cation exchange line, indicating that Ca
2+ and Mg
2+ in the water are primarily derived from the dissolution of gypsum, dolomite, and calcite, with gypsum and calcite being the main dissolved minerals.
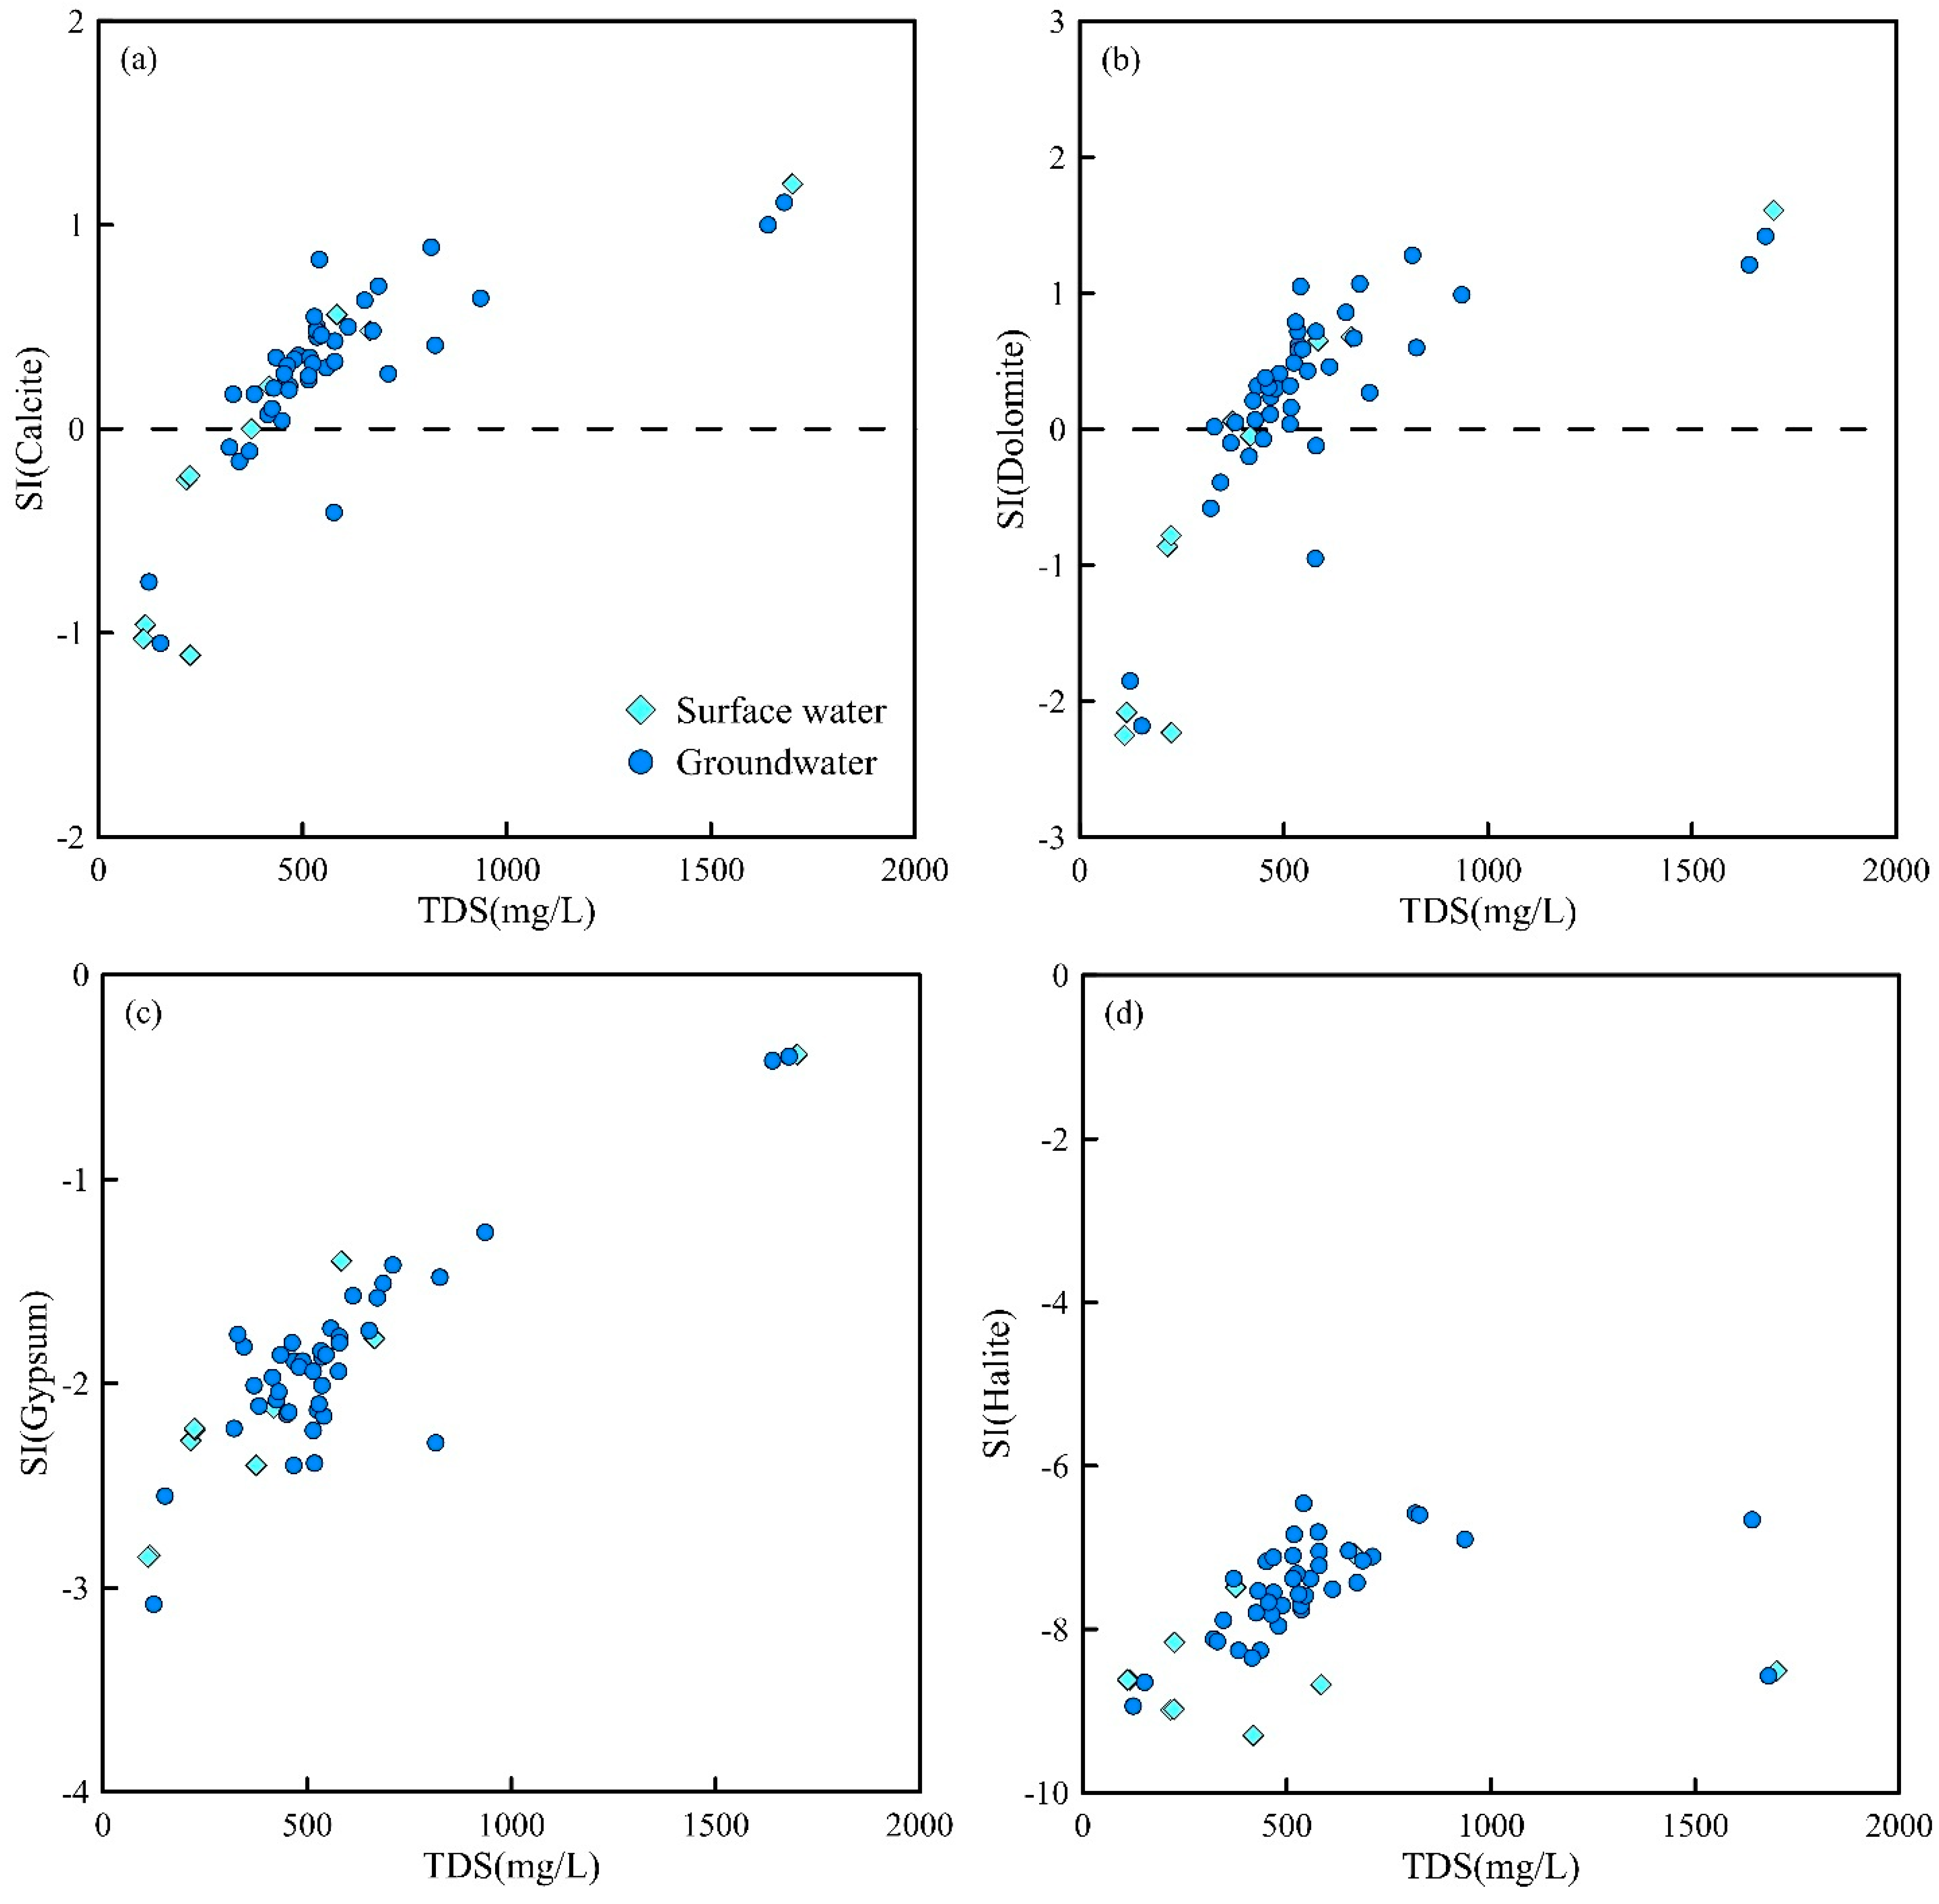
4.2.3. Mineral Saturation Index
The Phreeqc version 3.3.9 was used to calculate the saturation indices (SIs) of major minerals in the groundwater of the study area to determine the dissolution states of minerals such as halite, gypsum, calcite, and dolomite [
39]. As shown in
Figure 5, halite and gypsum in all water samples from the study area were in a dissolved state, indicating that the dissolution of halite and gypsum is an important source of Na
+, Cl
−, Ca
2+, and SO
42− during the mineralization process of water samples in the study area. The results of the saturation indices of dolomite and calcite minerals show that there are differences in the dissolution equilibrium states among different water samples. Dolomite and calcite in most groundwater samples are in a saturated state, suggesting that these two minerals control the chemical composition of the water samples.
The relationships of groundwater recharge, runoff, and discharge affect the saturation states of calcite and dolomite. When water sample points are located in the recharge area and the runoff time is relatively short, calcite and dolomite in the groundwater points are mostly in an unsaturated state. For example, in some surface water and a small amount of groundwater located in the upper reaches of the river basin, both calcite and dolomite are in a dissolved state.
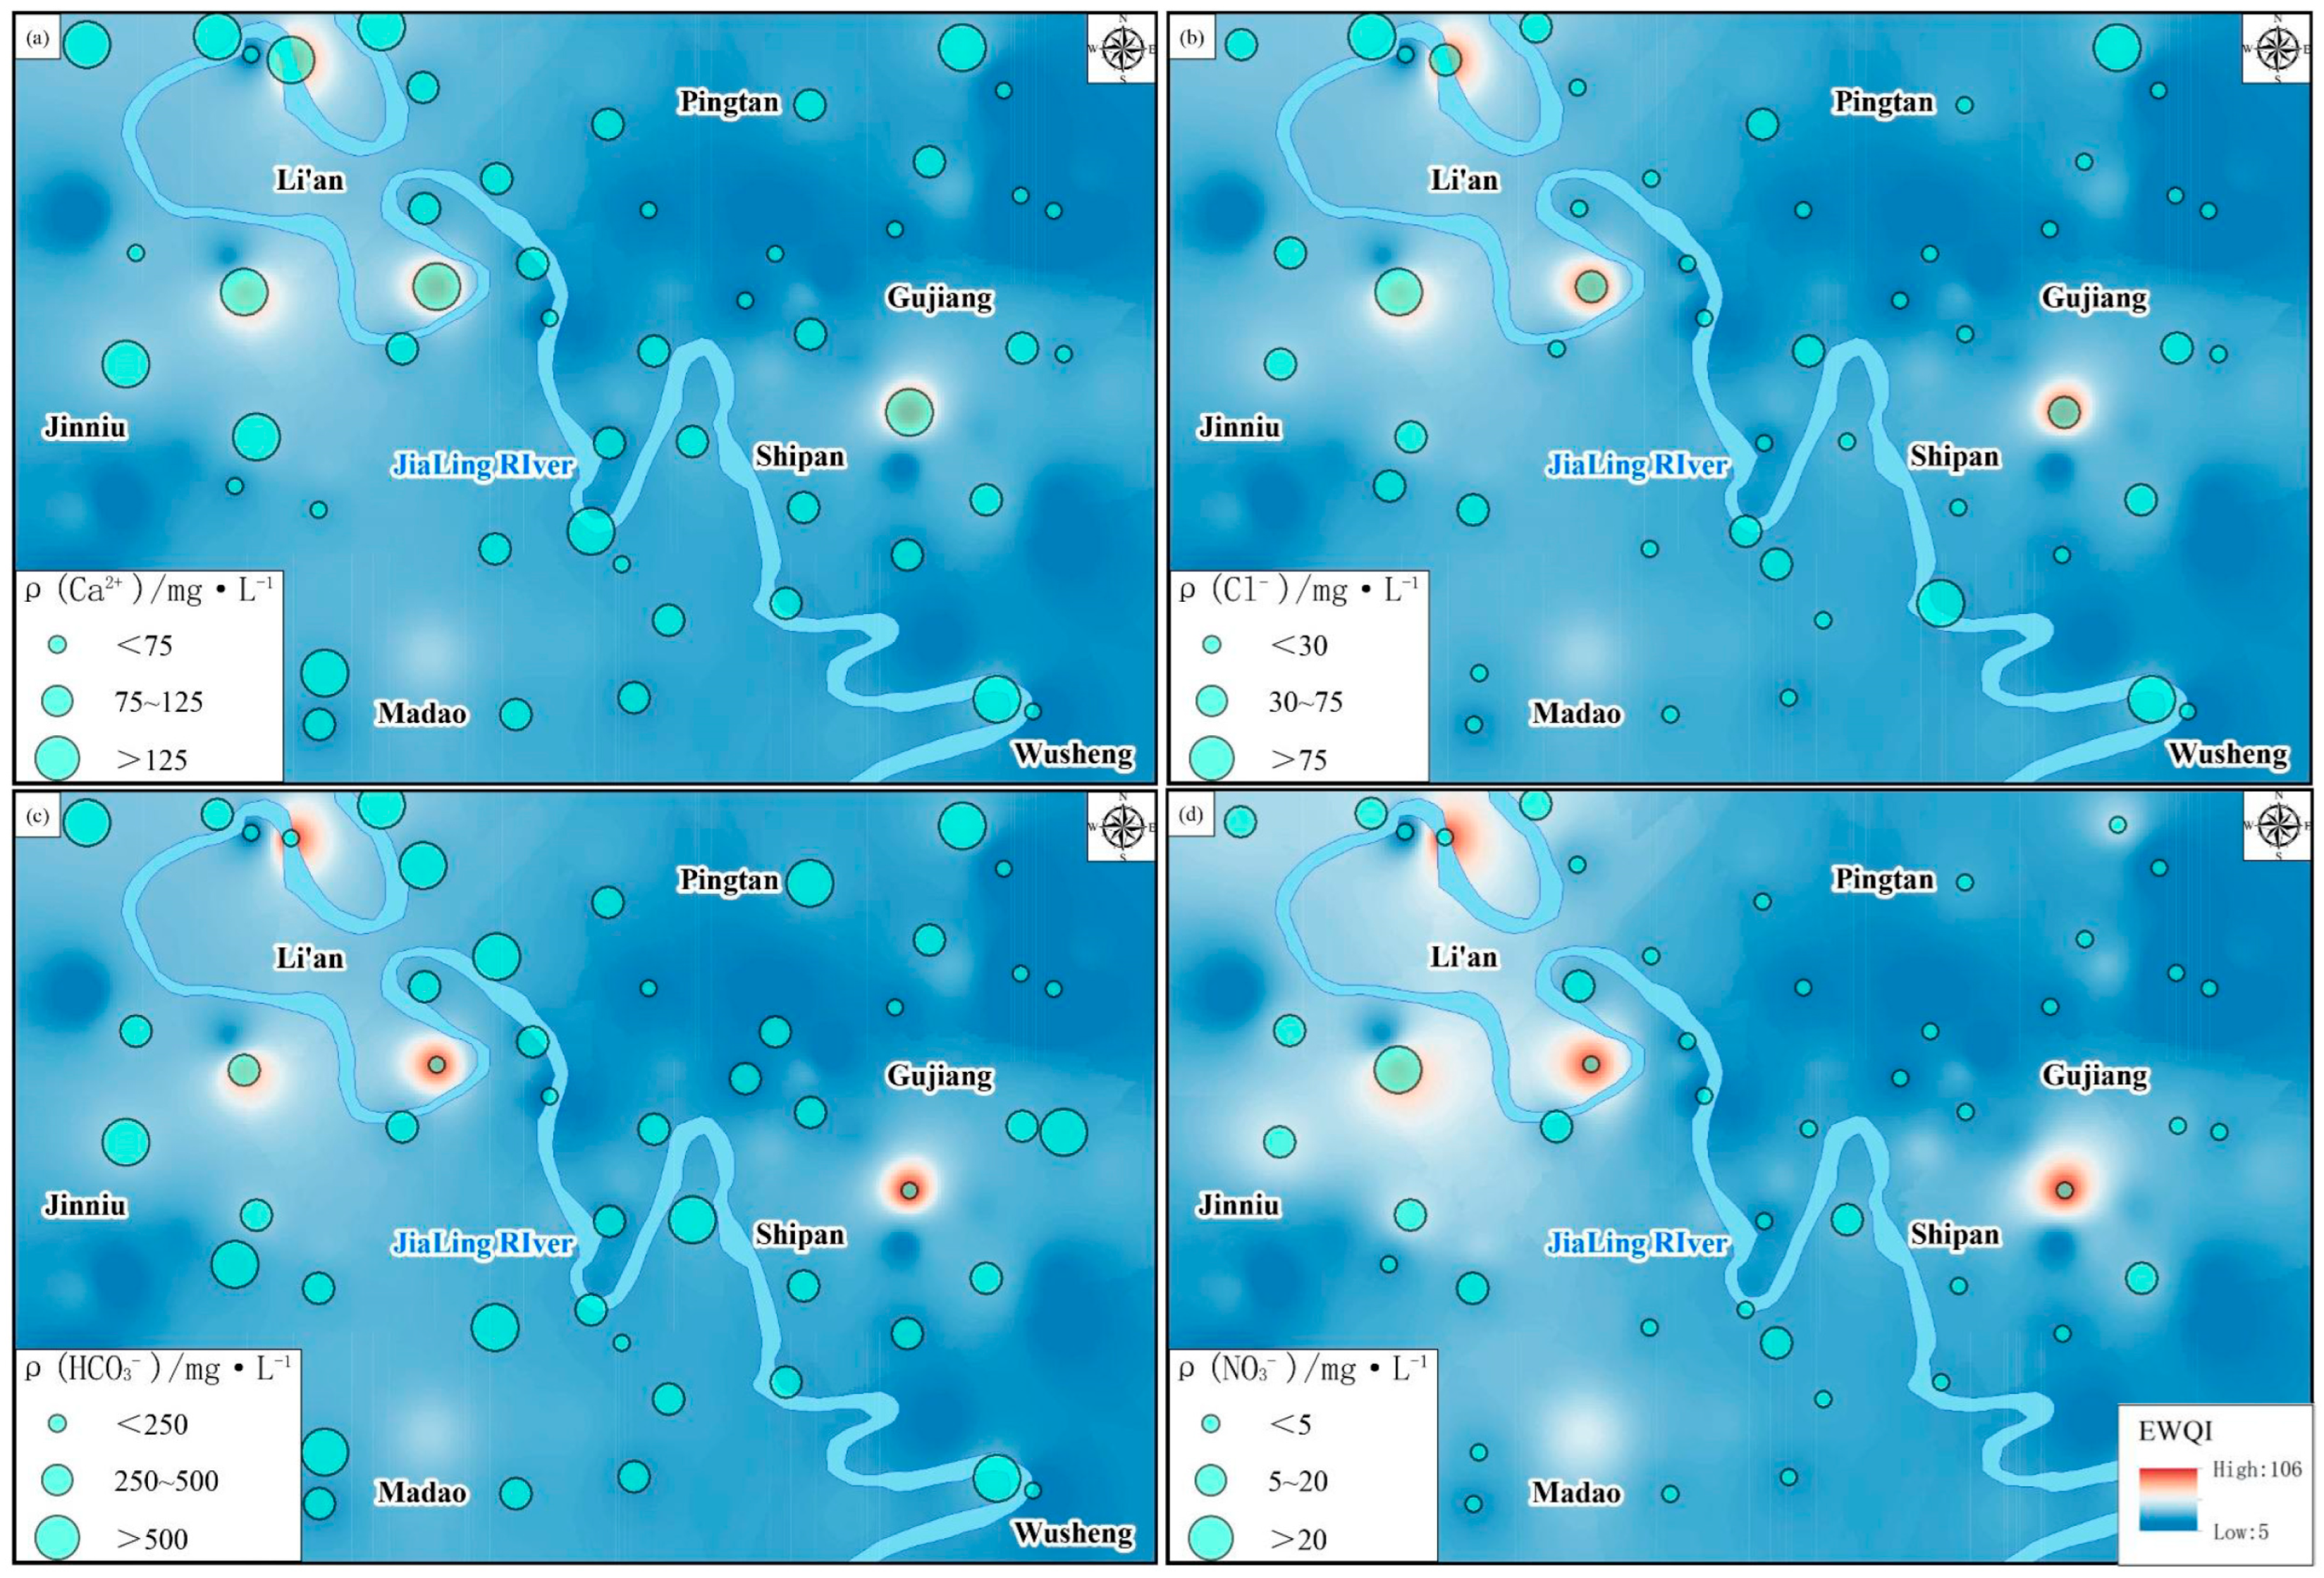
4.3. Groundwater Quality Assessment
In this study, based on 52 collected water samples, 11 indicators, including pH, TDS, TH, Na
+, K
+, Ca
2+, Mg
2+, Cl
−, SO
42−, HCO
3−, and NO
3−, were selected for the water quality assessment. The Entropy-Weighted Water Quality Index (EWQI) values were calculated, and the spatial distribution of EWQI for the groundwater dataset was generated using Classical Bayesian Kriging (
Figure 6). The EWQI values of groundwater in the study area ranged from 6.07 to 104.02, with an average value of 37.46. Among them, water samples with “Excellent” water quality accounted for 80.77%; those with “Good” quality accounted for 15.38%, and those with “Moderate” quality accounted for 3.85%. A total of 96.15% of the samples met the “Excellent or Good” standards and could be directly used for drinking.
Figure 6 shows that higher EWQI values are mainly distributed in the western upstream region, while lower values are found in the southeast region. The overall trend indicates that EWQI values increase closer to the banks of the Jialing River. Sampling points with higher EWQI values include SY43 and SY45. In these areas, the aquifers have weaker water abundance and hydraulic conductivity, leading to slower groundwater circulation and replacement, as well as stronger evaporation. Combined with field investigations, these points are located in crop planting areas, potentially influenced by both the original geological environment and human activities.
Among them, TH, Ca2+, Mg2+, SO42−, and Cl− showed high correlations with EWQI, while NO3− exhibited a moderate correlation. The results of the correlation analysis indicate that the groundwater quality in the study area is primarily influenced by the original geological background, with human activities—mainly agricultural activities—potentially exacerbating this influence. The EWQI values of groundwater are mainly controlled by the concentrations of Ca2+, Mg2+, SO42−, Cl−, and NO3−.
To analyze the impact of hydrochemical indicators on EWQI, Pearson correlation analysis was conducted between the 11 indicators and EWQI, with the results shown in
Figure 7. Among them, pH and K
+ exhibited weak correlations with other indicators, with correlation coefficients not exceeding 0.50, indicating that these indicators have relatively independent influencing factors and can reflect groundwater environmental quality from different perspectives. Most correlation coefficients between TDS, TH, Ca
2+, Mg
2+, Cl
−, SO
42−, and HCO
3− were above 0.50, suggesting high correlations and information overlap between these indicators. Na
+, K
+, Ca
2+, and Mg
2+ showed moderate correlations, indicating a high possibility of common origin among these four indicators. Cl
− and SO
42− are associated with the dissolution of rock salt and the natural dissolution of sulfide minerals, respectively, while Ca
2+ and Mg
2+ are primarily driven by water–rock interactions and groundwater movement. The significant correlations among TDS, TH, Ca
2+, Mg
2+, and HCO
3− indicate geological weathering and the hydrogeochemical evolution of groundwater with high ion concentrations.
In conclusion, Ca2+ is the primary contributing indicator affecting groundwater quality in the study area, followed by Cl−. The influence of the intensity of different indicators on groundwater quality in the area decreases in the following order: Ca2+ > Cl− > Mg2+ > SO42− > HCO3− > NO3−. These indicators can serve as key reference indicators for water quality monitoring and evaluation in the study area.
While primary geological factors (lithology, tectonics) dominate, agricultural activities introduce subtle impacts: the NO
3− in southeastern samples (e.g., W-22, 8.9 mg/L) correlates with the intensive use of paddy fields, consistent with the “nitrate lag effect” in low-permeability aquifers [
40]. This is mild compared to the Haihe Basin (NO
3− up to 50 mg/L [
41]), attributed to the Wusheng section’s thick clay aquitards that restrict solute transport. The study’s EWQI framework advances previous regional research by quantifying the threshold between geogenic and anthropogenic influences: sites with EWQI > 50 (4.85% of samples) cluster near fertilizer storage areas, indicating incipient contamination—an early warning rarely captured by traditional chemical classifications.
5. Conclusions
(1) The water bodies in the Wusheng section of the Jialing River Basin are generally weakly alkaline and have a low mineralization degree. There are differences in the contents of hydrochemical components between groundwater and surface water. In surface water, the main cations are Ca2+ and Mg2+, and the main anions are SO42− and HCO3−, mainly forming HCO3−-Ca-type water. In groundwater, the main cations are also Ca2+ and Mg2+, and the main anion is HCO3−.
(2) The ions in both groundwater and surface water are controlled by rock weathering. During the groundwater runoff process, the dissolution of halite and gypsum, the precipitation of calcite, the dissolution or precipitation of dolomite and feldspar, and cation exchange reactions mainly occur.
(3) The groundwater located under the influence of the tectonic zone receives lateral recharge from different strata along the fracture channels. At the same time, during the long-distance runoff process, it continuously reacts with the surrounding rocks, making the hydrochemical components of the groundwater different from the normal values, such as the points distributed in the anticline area within the study area.
(4) Based on the collected water samples, 11 indicators were selected for the EWQI (Entropy Weighted Water Quality Index) calculation. The EWQI values of groundwater in the study area range from 6.07 to 104.02, with an average of 37.46. The results show that the overall groundwater quality in the Wusheng section of the Jialing River Basin is relatively good, with 96.15% reaching excellent or good levels and being suitable for direct drinking.
(5) Higher EWQI values are mainly distributed in the western upstream area of the study area, while lower values are found in the southeastern part, generally showing a trend of increasing EWQI values near the banks of the Jialing River. Correlation analysis revealed that the influence intensity of different indicators on groundwater quality in the area decreased in the following order: Ca2+ > Cl− > Mg2+ > SO42− > HCO3− > NO3−. Groundwater quality is primarily influenced by the primary geological background, while human activities dominated by agricultural practices may also deteriorate the groundwater quality.
Author Contributions
Conceptualization, Y.D.; methodology, P.H.; validation, Y.D. and L.W.; formal analysis, Y.D.; investigation, L.H.; resources, Y.D.; data curation, P.H.; writing—original draft preparation, Y.D.; writing—review and editing, P.H.; visualization, L.W.; supervision, M.H.; project administration, L.W.; funding acquisition, L.W. All authors have read and agreed to the published version of the manuscript.
Funding
This research was funded by Hydrogeological and Water Resources Investigation and Monitoring in the Upper Reaches of the Yangtze River grant number DD20221757.
Institutional Review Board Statement
Not applicable.
Informed Consent Statement
Not applicable.
Data Availability Statement
The datasets presented in this article are not readily available because the data are part of an ongoing study. Requests to access the datasets should be directed to
296962873@qq.com.
Acknowledgments
The authors have reviewed and edited the output and take full responsibility for the content of this publication.
Conflicts of Interest
The authors declare no conflicts of interest.
References
- Gaikwad, S.K.; Gaikwad, S.P.; Wagh, V.M.; Meshram, D.C.; Kadam, A.K.; Muley, A.A.; Sahu, U.L. Appraisal of groundwater from lithological diversity of the western coastal part, Maharashtra, India: An integrated hydrogeochemical, geospatial and statistical approaches. Mar. Pollut. Bull. 2022, 178, 113595. [Google Scholar] [CrossRef] [PubMed]
- Ganguly, S. Groundwater—from freshwater source to green energy: An overview from concern to solution. Int. J. Energy Water Resour. 2022, 6, 555–567. [Google Scholar] [CrossRef]
- Parveen, S.; Praveen, B.; Akram, V. A Systematic Review on Groundwater Management: Opportunities and Challenges. In Environmental Processes and Management; Shukla, P., Singh, P., Singh, R.M., Eds.; Water Science and Technology Library; Springer: Cham, Switzerland, 2023; Volume 120. [Google Scholar] [CrossRef]
- Fida, M.; Li, P.; Wang, Y.; Alam, S.M.K.; Nsabimana, A. Water Contamination and Human Health Risks in Pakistan: A Review. Expo. Health 2023, 15, 619–639. [Google Scholar] [CrossRef]
- Wang, M.; Su, C.; Wang, X.; Jiang, J.; Ren, F.; Liu, H. Spatial pattern, hydrogeochemical controlling processes and non-carcinogenic risks of fluoride-enriched groundwater in the North Henan Plain, Northern China. Appl. Geochem. 2024, 163, 105934. [Google Scholar] [CrossRef]
- Gugulothu, S.; Subbarao, N.; Das, R.; Dhakate, R. Geochemical evaluation of groundwater and suitability of groundwater quality for irrigation purpose in an agricultural region of South India. Appl. Water Sci. 2022, 12, 142. [Google Scholar] [CrossRef]
- Jiang, W.; Meng, L.; Liu, F.; Sheng, Y.; Chen, S.; Yang, J.; Mao, H.; Zhang, J.; Zhang, Z.; Ning, H. Distribution, source investigation, and risk assessment of topsoil heavy metals in areas with intensive anthropogenic activities using the positive matrix factorization (PMF) model coupled with self-organizing map (SOM). Environ. Geochem. Health 2023, 45, 6353–6370. [Google Scholar] [CrossRef]
- Alam, S.M.K.; Li, P.; Fida, M. Groundwater Nitrate Pollution Due to Excessive Use of N-Fertilizers in Rural Areas of Bangladesh: Pollution Status, Health Risk, Source Contribution, and Future Impacts. Expo. Health 2024, 16, 159–182. [Google Scholar] [CrossRef]
- Mukhopadhyay, A.; Duttagupta, S.; Mukherjee, A. Emerging organic contaminants in global community drinking water sources and supply: A review of occurrence, processes and remediation. J. Environ. Chem. Eng. 2021, 10, 107560. [Google Scholar] [CrossRef]
- Zhao, M.; Jiang, Y.; Jia, Y.; Lian, X.; Feng, F.; Shang, C.; Zang, Y.; Xi, B. Anthropogenic perturbation enhances the release of geogenic Mn to groundwater: Evidence from hydrogeochemical characteristics. Sci. Total Environ. 2023, 891, 164450. [Google Scholar] [CrossRef]
- Coşkun, O.; Aydın, D.; Duman, F. Comparison of some blood parameters of rainbow trout (Oncorhynchus mykiss) living in running and still water. Iran. J. Fish. Sci. 2016, 15, 497–507. Available online: http://jifro.ir/article-1-2143-en.html (accessed on 1 April 2025).
- Aydin, D.; Coskun, O.F. Comparison of edta-enhanced phytoextraction strategies with Nasturtium officinale (Watercress) on an artificially arsenic contaminated water. Pak. J. Bot. 2013, 45, 1423–1429. [Google Scholar]
- Zhao, Y.; Wang, L.; Jiang, Q.; Wang, Z. Spatiotemporal nonlinear characteristics and threshold effects of China’s water resources. J. Environ. Manag. 2025, 373, 123633. [Google Scholar] [CrossRef] [PubMed]
- Zhu, X.; Liu, J.; Qi, W.; Gao, X.; Zhao, X.; Zhu, B. Future changes and distribution of water resources in China under global warming levels of 1.5–4.5 °C. J. Hydrol. Reg. Stud. 2024, 53, 101781. [Google Scholar] [CrossRef]
- Hong, C.; Shen, D. Is industrial structure determined on water endowment in China? An empirical study of 31 provinces between 2011 and 2021. J. Clean. Prod. 2024, 479, 144075. [Google Scholar] [CrossRef]
- Wang, C.; Liu, J.; Zhang, L.; Wang, Y.; Feng, M.; Zhang, P.; Jin, Y.; Pang, M.; Malik, A. Global supply chain drivers of scarce water caused by grain production in China. Environ. Impact Assess. Rev. 2025, 111, 107737. [Google Scholar] [CrossRef]
- Liu, X.; Xiang, W.; Song, J.; Si, B. Spatial variations in groundwater hydrochemistry, sources, and controls across catchments on Chinese Loess Plateau. J. Hydrol. Reg. Stud. 2024, 53, 101791. [Google Scholar] [CrossRef]
- Fan, B.-L.; Zhao, Z.-Q.; Tao, F.-X.; Liu, B.-J.; Tao, Z.-H.; Gao, S.; Zhang, L.-H. Characteristics of carbonate, evaporite and silicate weathering in Huanghe River basin: A comparison among the upstream, midstream and downstream. J. Asian Earth Sci. 2014, 96, 17–26. [Google Scholar] [CrossRef]
- Zhang, Q.; Jin, Z.; Zhang, F.; Xiao, J. Seasonal variation in river water chemistry of the middle reaches of the Yellow River and its controlling factors. J. Geochem. Explor. 2015, 156, 101–113. [Google Scholar] [CrossRef]
- Dong, F.; Yin, H.; Yang, Z.; Zhou, W.; Cheng, W.; Liu, Y. Delineating the controlling mechanisms of geothermal waters quality and suitability zoning in the Lower Yellow River Basin, China. Environ. Technol. Innov. 2025, 38, 104126. [Google Scholar] [CrossRef]
- Wu, Z.; Wang, F.; Wang, X.; Li, K.; Zhang, L. Water quality assessment using phytoplankton functional groups in the middle-lower Changjiang River, China. Limnologica 2023, 99, 126056. [Google Scholar] [CrossRef]
- Li, S.; Lu, X.X.; He, M.; Zhou, Y.; Bei, R.; Li, L.; Ziegler, A.D. Major element chemistry in the upper Yangtze River: A case study of the Longchuanjiang River. Geomorphology 2011, 129, 29–42. [Google Scholar] [CrossRef]
- Xu, Z.; Liu, C.-Q. Chemical weathering in the upper reaches of Xijiang River draining the Yunnan–Guizhou Plateau, Southwest China. Chem. Geol. 2007, 239, 83–95. [Google Scholar] [CrossRef]
- Zhang, S.-R.; Lu, X.X.; Higgitt, D.L.; Chen, C.-T.A.; Sun, H.-G.; Han, J.-T. Water chemistry of the Zhujiang (Pearl River): Natural processes and anthropogenic influences. J. Geophys. Res. 2007, 112, F01011. [Google Scholar] [CrossRef]
- Zeng, J.; Han, G. Tracing zinc sources with Zn isotope of fluvial suspended particulate matter in Zhujiang River, southwest China. Ecol. Indic. 2020, 118, 106723. [Google Scholar] [CrossRef]
- Huang, M.; Xu, F.; Xia, J.; Yang, X.; Zhang, F.; Liu, S.; Zhang, T. Evaluation of the current status and risks of aquatic ecology in the Jialing River Basin based on the characteristics and succession trends of phytoplankton communities. Ecol. Indic. 2025, 170, 113121. [Google Scholar] [CrossRef]
- Wang, Y.-B.; Junaid, M.; Deng, J.-Y.; Tang, Q.-P.; Luo, L.; Xie, Z.-Y.; Pei, D.-S. Effects of land-use patterns on seasonal water quality at multiple spatial scales in the Jialing River, Chongqing, China. CATENA 2024, 234, 107646. [Google Scholar] [CrossRef]
- Tan, X.; He, R.; Yang, W.; Luo, B.; Shi, J.; Zhang, L.; Li, M.; Tang, Y.; Xiao, D.; Qiao, Z. Origin and distribution model of thin dolomite reservoirs in the lower sub-member of Mao 2 Member of Middle Permian Maokou Formation in Wusheng-Tongnan area, Sichuan Basin, SW China. Pet. Explor. Dev. 2025, 52, 125–142. [Google Scholar] [CrossRef]
- Jiang, Y.; Zhou, Y.; Chen, Z.; Gu, Y.; Fu, Y.; Yi, J.; Zhang, J.; Jiang, Z. Sedimentary pattern and exploration significance of Permian reefs and shoals around the Wusheng-Shizhu intra-platform depression, eastern Sichuan Basin, China. J. Nat. Gas Geosci. 2020, 5, 57–67. [Google Scholar] [CrossRef]
- Qin, T.; Yang, P.; Groves, C.; Chen, F.; Xie, G.; Zhan, Z. Natural and anthropogenic factors affecting geochemistry of the Jialing and Yangtze Rivers in urban Chongqing, SW China. Appl. Geochem. 2018, 98, 448–458. [Google Scholar] [CrossRef]
- Yuan, X.; Lu, Z.; Shu, L.; Qian, Y.; Tan, S.; Zhou, Y.; Li, Y.; Quan, Q. A spatiotemporal analysis of water quality characteristics in the first-level tributaries in Nanchong Section of Jialing River. Desalination Water Treat. 2022, 254, 238–250. [Google Scholar] [CrossRef]
- DZ/T 0282-2015; Hydrogeological Survey Specification (1:50000). Ministry of Land and Resources of the People’s Republic of China: Beijing, China, 2015.
- Ding, X.-H.; Luo, B.; Zhou, H.-T.; Chen, Y.-H. Generalized solutions for advection–dispersion transport equations subject to time- and space-dependent internal and boundary sources. Comput. Geotech. 2025, 178, 106944. [Google Scholar] [CrossRef]
- Thanh, N.N.; Chotpantarat, S.; Ngu, N.H.; Thunyawatcharakul, P.; Kaewdum, N. Integrating machine learning models with cross-validation and bootstrapping for evaluating groundwater quality in Kanchanaburi province, Thailand. Environ. Res. 2024, 252 Pt 2, 118952. [Google Scholar] [CrossRef]
- Vesković, J.; Deršek-Timotić, I.; Lučić, M.; Miletić, A.; Đolić, M.; Ražić, S.; Onjia, A. Entropy-weighted water quality index, hydrogeochemistry, and Monte Carlo simulation of source-specific health risks of groundwater in the Morava River plain (Serbia). Mar. Pollut. Bull. 2024, 201, 116277. [Google Scholar] [CrossRef] [PubMed]
- Srinivasa Rao, N. MHPT.BAS: A computer program for modified Hill–Piper diagram for classification of ground water. Comput. Geosci. 1998, 24, 991–1008. [Google Scholar] [CrossRef]
- Ravindiran, G.; Janardhan, G.; Rajamanickam, S.; Sivarethinamohan, S.; Murali, V.; Hayder, G. Study on hydrogeochemical assessment, groundwater quality index for drinking, seawater mixing index and human health risk assessment of nitrate and fluoride. Groundw. Sustain. Dev. 2024, 25, 101161. [Google Scholar] [CrossRef]
- Marandi, A.; Shand, P. Groundwater chemistry and the Gibbs Diagram. Appl. Geochem. 2018, 97, 209–212. [Google Scholar] [CrossRef]
- Boluda-Botella, N.; Valdes-Abellan, J.; Pedraza, R. Applying reactive models to column experiments to assess the hydrogeochemistry of seawater intrusion: Optimising ACUAINTRUSION and selecting cation exchange coefficients with PHREEQC. J. Hydrol. 2014, 510, 59–69. [Google Scholar] [CrossRef]
- Anderson, K.A.; Garza-Rubalcava, U.; Widdowson, M.A.; Suchomel, E.J.; Cápiro, N.L.; Pennell, K.D. Sorption-Desorption Processes Contributing to the Natural Attenuation of cis-1,2-Dichloroethene in Porous Media. J. Hazard. Mater. 2025, 494, 138500. [Google Scholar] [CrossRef]
- Zhao, Z.; Qin, W.; Bai, Z.; Ma, L. Agricultural nitrogen and phosphorus emissions to water and their mitigation options in the Haihe Basin, China. Agric. Water Manag. 2019, 212, 262–272. [Google Scholar] [CrossRef]
| Disclaimer/Publisher’s Note: The statements, opinions and data contained in all publications are solely those of the individual author(s) and contributor(s) and not of MDPI and/or the editor(s). MDPI and/or the editor(s) disclaim responsibility for any injury to people or property resulting from any ideas, methods, instructions or products referred to in the content. |
© 2025 by the authors. Licensee MDPI, Basel, Switzerland. This article is an open access article distributed under the terms and conditions of the Creative Commons Attribution (CC BY) license (https://creativecommons.org/licenses/by/4.0/).


