Article

Comparative Performance of a Field-Based Assessment of Human Thermal Comfort Indices in Urban Green Space

1
College of Forestry, Inner Mongolia Agricultural University, Hohhot 010010, China
2
Research Institute of Forestry, Chinese Academy of Forestry, Beijing 100091, China
3
College of Forestry and Landscape Architecture, Xinjiang Agricultural University, Urumqi 830052, China
4
Department of Biology, Chemistry and Geography, Nipissing University, North Bay, ON P1B 8L7, Canada
*
Author to whom correspondence should be addressed.
Sustainability 2025, 17(10), 4671; https://doi.org/10.3390/su17104671
Submission received: 3 April 2025 / Revised: 8 May 2025 / Accepted: 9 May 2025 / Published: 20 May 2025

Abstract

:
Urban green spaces, closely tied to local climates, significantly affect human comfort levels, yet existing assessment methods vary in applicability across different contexts and regions. Here, we determined the applicability of two commonly used indices to evaluate human comfort in urban green space types in Hohhot City in China, which is in an arid and semi-arid area. We established sites in four different urban green space types (S1–S4) and a control area (CK) through field-based assessment, and collected meteorological data over 10 days in each season from 2020 to 2021. Specifically, air temperature, relative humidity, and average wind speed were observed from 7:00 to 19:00. Air temperature was highest in summer and lowest in winter. Throughout the day, air temperature first increased and then decreased, with the maximum temperature occurring later in winter than in other seasons. Relative humidity showed an opposite diurnal trend to temperature, and there were no significant differences between urban green space types and CK. The average wind speed of CK was significantly higher than that of the urban green space types. HCILu classifies thermal comfort levels across urban green space types and seasons into four distinct categories as uncomfortable, comfortable to less comfortable, less comfortable, and extremely uncomfortable. HCICMA further stratifies thermal conditions at urban green space types by season into cool and refreshing, most comfortable, most comfortable to slightly cool, cold, and uncomfortable. The HCILu ranged from 2.3 to 25.1, and tended to first decrease and then increase on a daily basis. Conversely, HCICMA fluctuated throughout the day and ranged from 18.6 to 78.0. According to HCILu, the urban green space types were comfortable for 45% of the observation time, and were comfortable for a greater proportion of time compared to if the comfort was calculated using HCICMA. HCICMA was strongly correlated with air temperature and average wind speed. According to receiver operating characteristic (ROC) curve analysis, the area under the curve (AUC) for HCICMA was 0.59–0.91, and was higher than that of HCILu in each season, indicating greater suitability for the study site.

1. Introduction

Human thermal comfort or discomfort conditions may be assessed through a large number of theoretical and empirical indices requiring a larger or smaller number of input parameters such as air temperature, relative humidity, wind speed, etc. [1,2,3]. Urban green spaces are integral components of urban areas, significantly contributing to urban sustainability and human comfort. Recent studies have highlighted the importance of green infrastructure in enhancing the quality of life for urban residents. For instance, Wang et al. [4] emphasized that urban green spaces improved environmental comfort, while Breuste et al. [5] underscored their role in promoting urban sustainability and public well-being. The physical characteristics of trees and vegetation in urban green spaces influence the microclimate by regulating air temperature and humidity [6]. Human comfort, defined as the state of mind expressing satisfaction with the thermal environment [7], is a critical metric for evaluating the quality of urban microclimate. Simplified models have been developed to assess human comfort using meteorological variables. Recent research focused on human comfort within urban green spaces, including parks, forests, sports areas, and natural grasslands, due to their vital role in urban development and public health [8]. Additionally, there is growing interest in understanding how urban green infrastructure impacts thermal perception and microclimate [9,10]. Factors such as air temperature, wind speed, and relative humidity significantly influence human comfort perceptions and the utilization of outdoor spaces, with varying impacts across climatic regions [11].
Human comfort is a vital index for evaluating living conditions and tourism resources, as well as guiding daily life. Wind speed, temperature, and relative humidity influence people’s sensory experiences, physical well-being, and mental health [12]. Numerous studies have investigated outdoor human comfort, typically conducting field experiments over short periods to examine the effects of plant community configurations on human comfort. However, these experiments often capture data limited to specific days, which may not accurately reflect thermal conditions across an entire year [11]. Furthermore, tolerance to outdoor thermal environments varies across climatic regions, with individuals from different climates experiencing varying comfort levels under identical environmental conditions [13]. To enhance human comfort and improve microclimate conditions, researchers have emphasized combining onsite monitoring [14] with numerical simulations [7]. Studies have explored the impact of trees on wind speed [15] and the cooling effects of urban green spaces [16], urban green spaces [17], and urban vegetation [18]. These findings highlight that urban green areas improve microclimate and mitigate the urban heat island (UHI) effect by lowering ambient temperatures.
Numerous studies have established a correlation between urban green spaces and the efficacy of plant-generated shade in creating a more comfortable microclimate [19,20,21]. A review of previous research on human comfort reveals that relatively few studies have focused on human comfort indices in China. Several indices have been developed in China based on diverse parameters [22]. These indices may generally be categorized into being based on empirical and mechanistic models, often intersecting with other disciplines. Common indices consider factors such as wind chill, temperature, and humidity. Current research in China predominantly examined variations in human comfort across different localities and regions, often integrating studies on air particles, negative ions, and other meteorological data to evaluate human and ecological health comprehensively. Recent studies have introduced a climate comfort index that exhibits broad applicability, alongside a revised formulation of an existing original index [23,24]. Urban green spaces play a crucial role in mitigating the urban heat island effect and enhancing human thermal comfort in cities. Despite the known benefits of urban parks in cooling their surroundings through evapotranspiration and shading, there remains a limited understanding of how temperature, relative humidity, and wind speed within these green spaces interact to influence human comfort. Despite the availability of various methods for calculating human comfort, their applicability to different regions remains uncertain, making the choice of suitable indices a persistent topic of debate.
This study aims to address these gaps by focusing on Chilechuan Park in Hohhot City, a semi-arid region in northern China characterized by extreme temperature fluctuations and limited vegetation, making urban heat mitigation particularly challenging. Utilizing a comprehensive dataset of meteorological variables collected across different seasons, the study evaluates human comfort levels using two distinct indices: the index proposed by Dinghuang Lu (1980s), widely adopted in domestic studies, and the more recently introduced index by the China Meteorological Administration (2020) [25]. By integrating these two indices, the study seeks to identify their differences in capturing human comfort variations and determine which index is more suitable for the region’s specific climatic conditions.

2. Materials and Methods

2.1. Study Area

Hohhot City is situated at the confluence of an arid and semi-arid region in China, characterized by a mid-temperate continental climate that encompasses four distinct seasons. Chilechuan Park is an extensive urban green space located in the Saihan District of Hohhot City, China. The research site, established in 2012, spans 38.6 hectares, with green spaces occupying 25.6 hectares, representing 66% of the total area, and serves as an urban green space integrating leisure, landscape, and recreation. It is predominantly bordered by residential neighborhoods and office complexes, with an absence of pollution sources such as industrial facilities. The mean age of trees within the park’s green space is approximately 13 years. The high diversity of plant species and vigorous plant growth provide an optimal foundation for conducting the experiment of human comfort index.

2.2. Sample Region

Within the park site, four distinct urban green space types (S1–S4) were identified, complemented by a non-vegetated control site (CK) adjacent to the road. The control site was characterized by impermeable asphalt pavement, with no tree cover or shading features. There are corresponding differences in surface cover, air flow, and shadow patterns within different types of green spaces, aiming to isolate the influence of vegetation on comfort indicators, although there are inherent differences between the control area and the green space area. A 20 m × 20 m quadrat was established at each site to investigate environmental conditions. The quadrats were strategically selected to represent typical green space types within the park, while minimizing spatial autocorrelation between sampling locations. Detailed site characteristics are summarized in Table 1.

2.3. Experimental Data

From 2020 to 2021, the region predominantly experienced sunny weather with few significant disturbances across all four seasons. The experimental weather conditions were selected based on local meteorological data provided by the China National Environmental Monitoring Centre. Meteorological data were collected for ten representative days in each season. To monitor air temperature, relative humidity, and average wind speed, a Kestrel 4500 handheld weather station, manufactured by NK Company in the United States, was employed. The device offers a temperature resolution of 0.1 °C and a measurement range of −29 °C to 70 °C, a humidity resolution of 0.1% with a range of 0% to 100%, and a wind speed resolution of 0.1 m/s with a range of 0.4 m/s to 40.0 m/s. Data were collected hourly from 07:00 to 19:00, with a permissible deviation of ±15 min from the scheduled time, at an elevation of approximately 1.5 m above ground level. For each measurement interval, four readings were recorded from four distinct directional orientations. The mean value derived from these measurements was utilized as the data point for analytical purposes. Calibration procedures were performed on the instrument prior to each observation.

2.4. Evaluation of Human Comfort and Data Analysis

The HCILu human comfort formula, created in the 1980s, is an empirical model for assessing thermal comfort in China, considering environmental factors like air temperature, relative humidity, and wind speed. It provides insights into human perception of their thermal environments.
H C I L u = 0.6 T 24 + 0.07 R H 70 + 0.5 V 2
where HCILu represents the human comfort index, T is the air temperature (°C), which directly affects the body’s sense of heat. RH stands for relative humidity (%), defined as the ratio of water vapor content in the air to the maximum water vapor content the air can hold. V denotes the wind speed (m/s), referring to the speed of air movement over a unit of time. The index allows for the identification of four distinct comfort levels (Table 2).
In 2020, the China Meteorological Administration promulgated the standard QX/T570-2020 [25], titled “Climate Resources Evaluation of Climate Livable Cities”, which established the human comfort index (hereafter referred to as HCICMA) through the application of specific formulas (China Meteorological Administration, 2020):
H C I C M A = 1.8 T + 32 0.55 ( 1 R H 100 ) ( 1.8 T 26 ) 3.2 W
HCICMA human comfort formula is an empirical model that evaluates environmental indicators related to climate and their impact on human settlement comfort. In this formula, HCLCMA represents the human comfort index, rounded to the nearest whole number. T denotes air temperature (°C), RH stands for relative humidity (%), and W represents wind speed (m/s). According to the HCICMA comfort index, comfort levels are categorized into 10 distinct grades, as detailed in Table 3.
The data analysis and figure generation were conducted utilizing Origin 2021. To compare meteorological factors across various sites, ANOVA and Duncan’s Multiple Range Test were employed using SPSS 26. Pearson’s correlation analysis was applied to assess the relationships between each human comfort index and the meteorological factors. Furthermore, the performance of each index was evaluated through receiver operating characteristic (ROC) curve analysis.

2.5. Model Validation

The receiver operating characteristic (ROC) curve and the area under the curve (AUC) are important indicators for quantitatively evaluating the prediction accuracy of binary machine learning models [26]. In this study, the ROC curve and AUC values were used to assess the predictive ability of HCILu and HCICMA for the human comfort formula. The ROC curve is constructed by setting different threshold values to calculate a series of sensitivities and specificities, and plotting the true positive rate (sensitivity) on the vertical axis and the false positive rate (1.0—specificity) on the horizontal axis [27]. The AUC value can comprehensively measure the performance of the classifier, with a range of 0 to 1. The closer the AUC value is to 1, the higher the fitting accuracy of the predictive model is.

3. Results

3.1. Variations in Meteorological Factors Among Urban Green Space Types

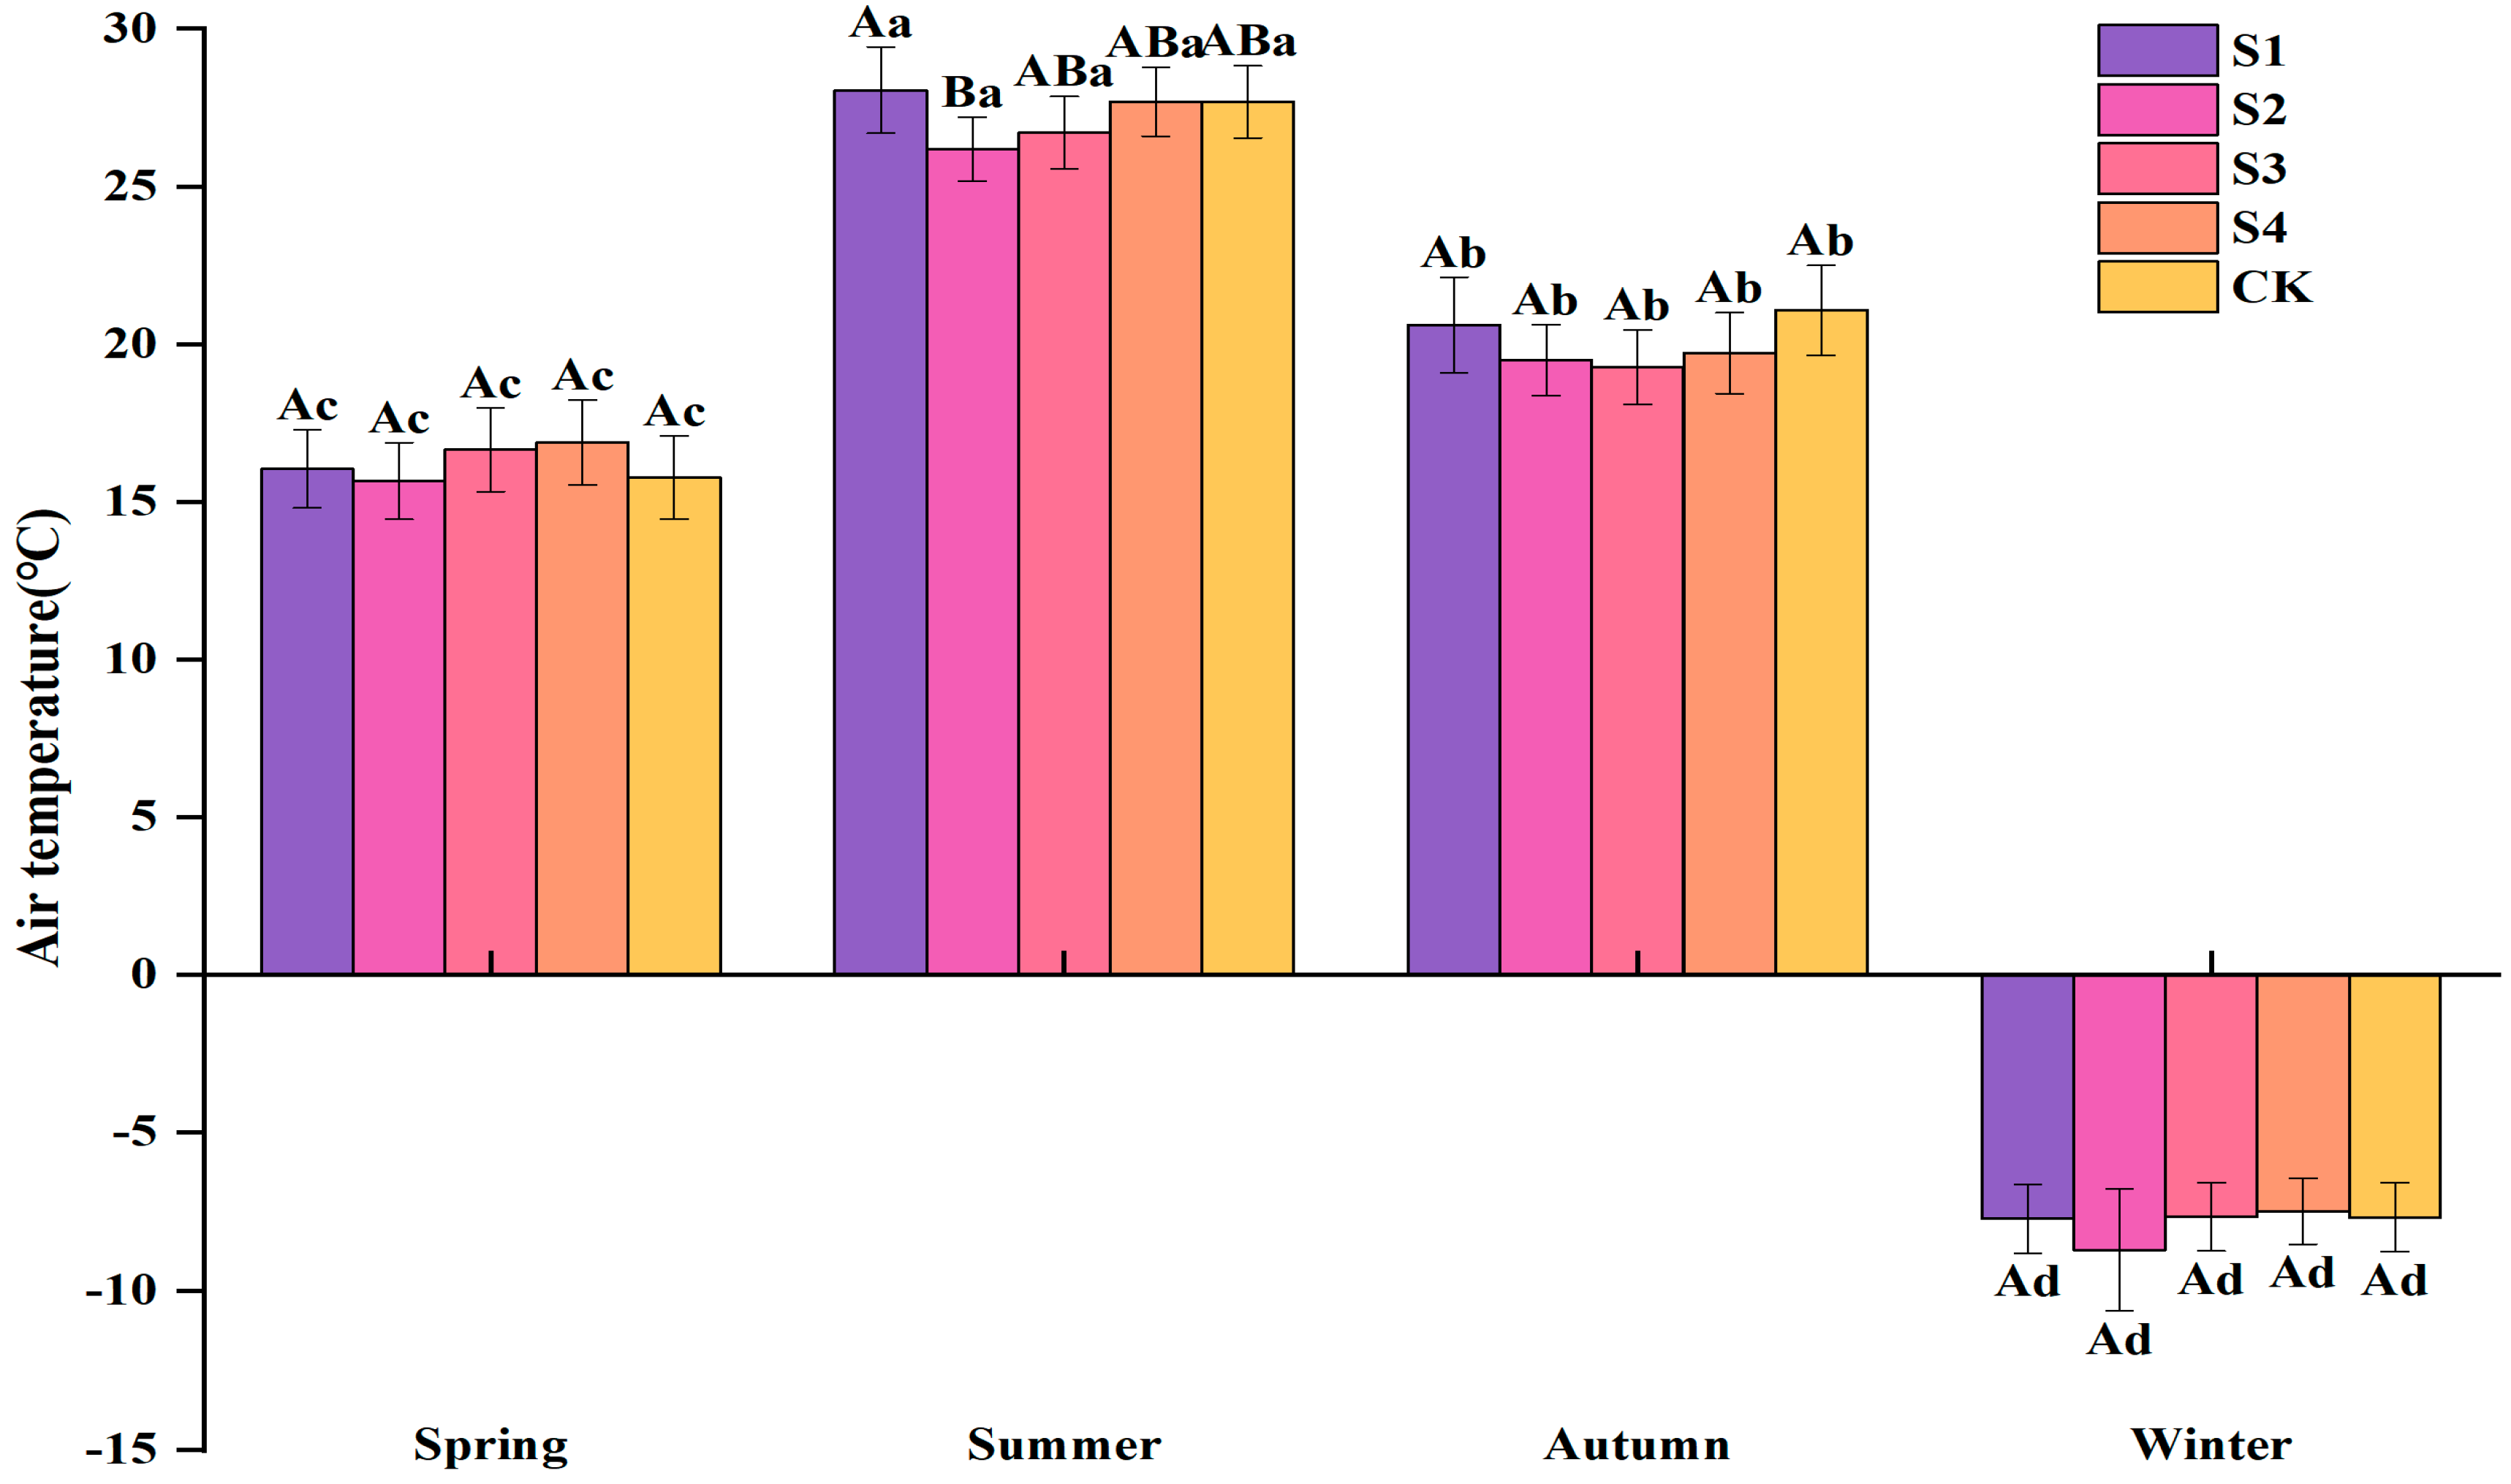
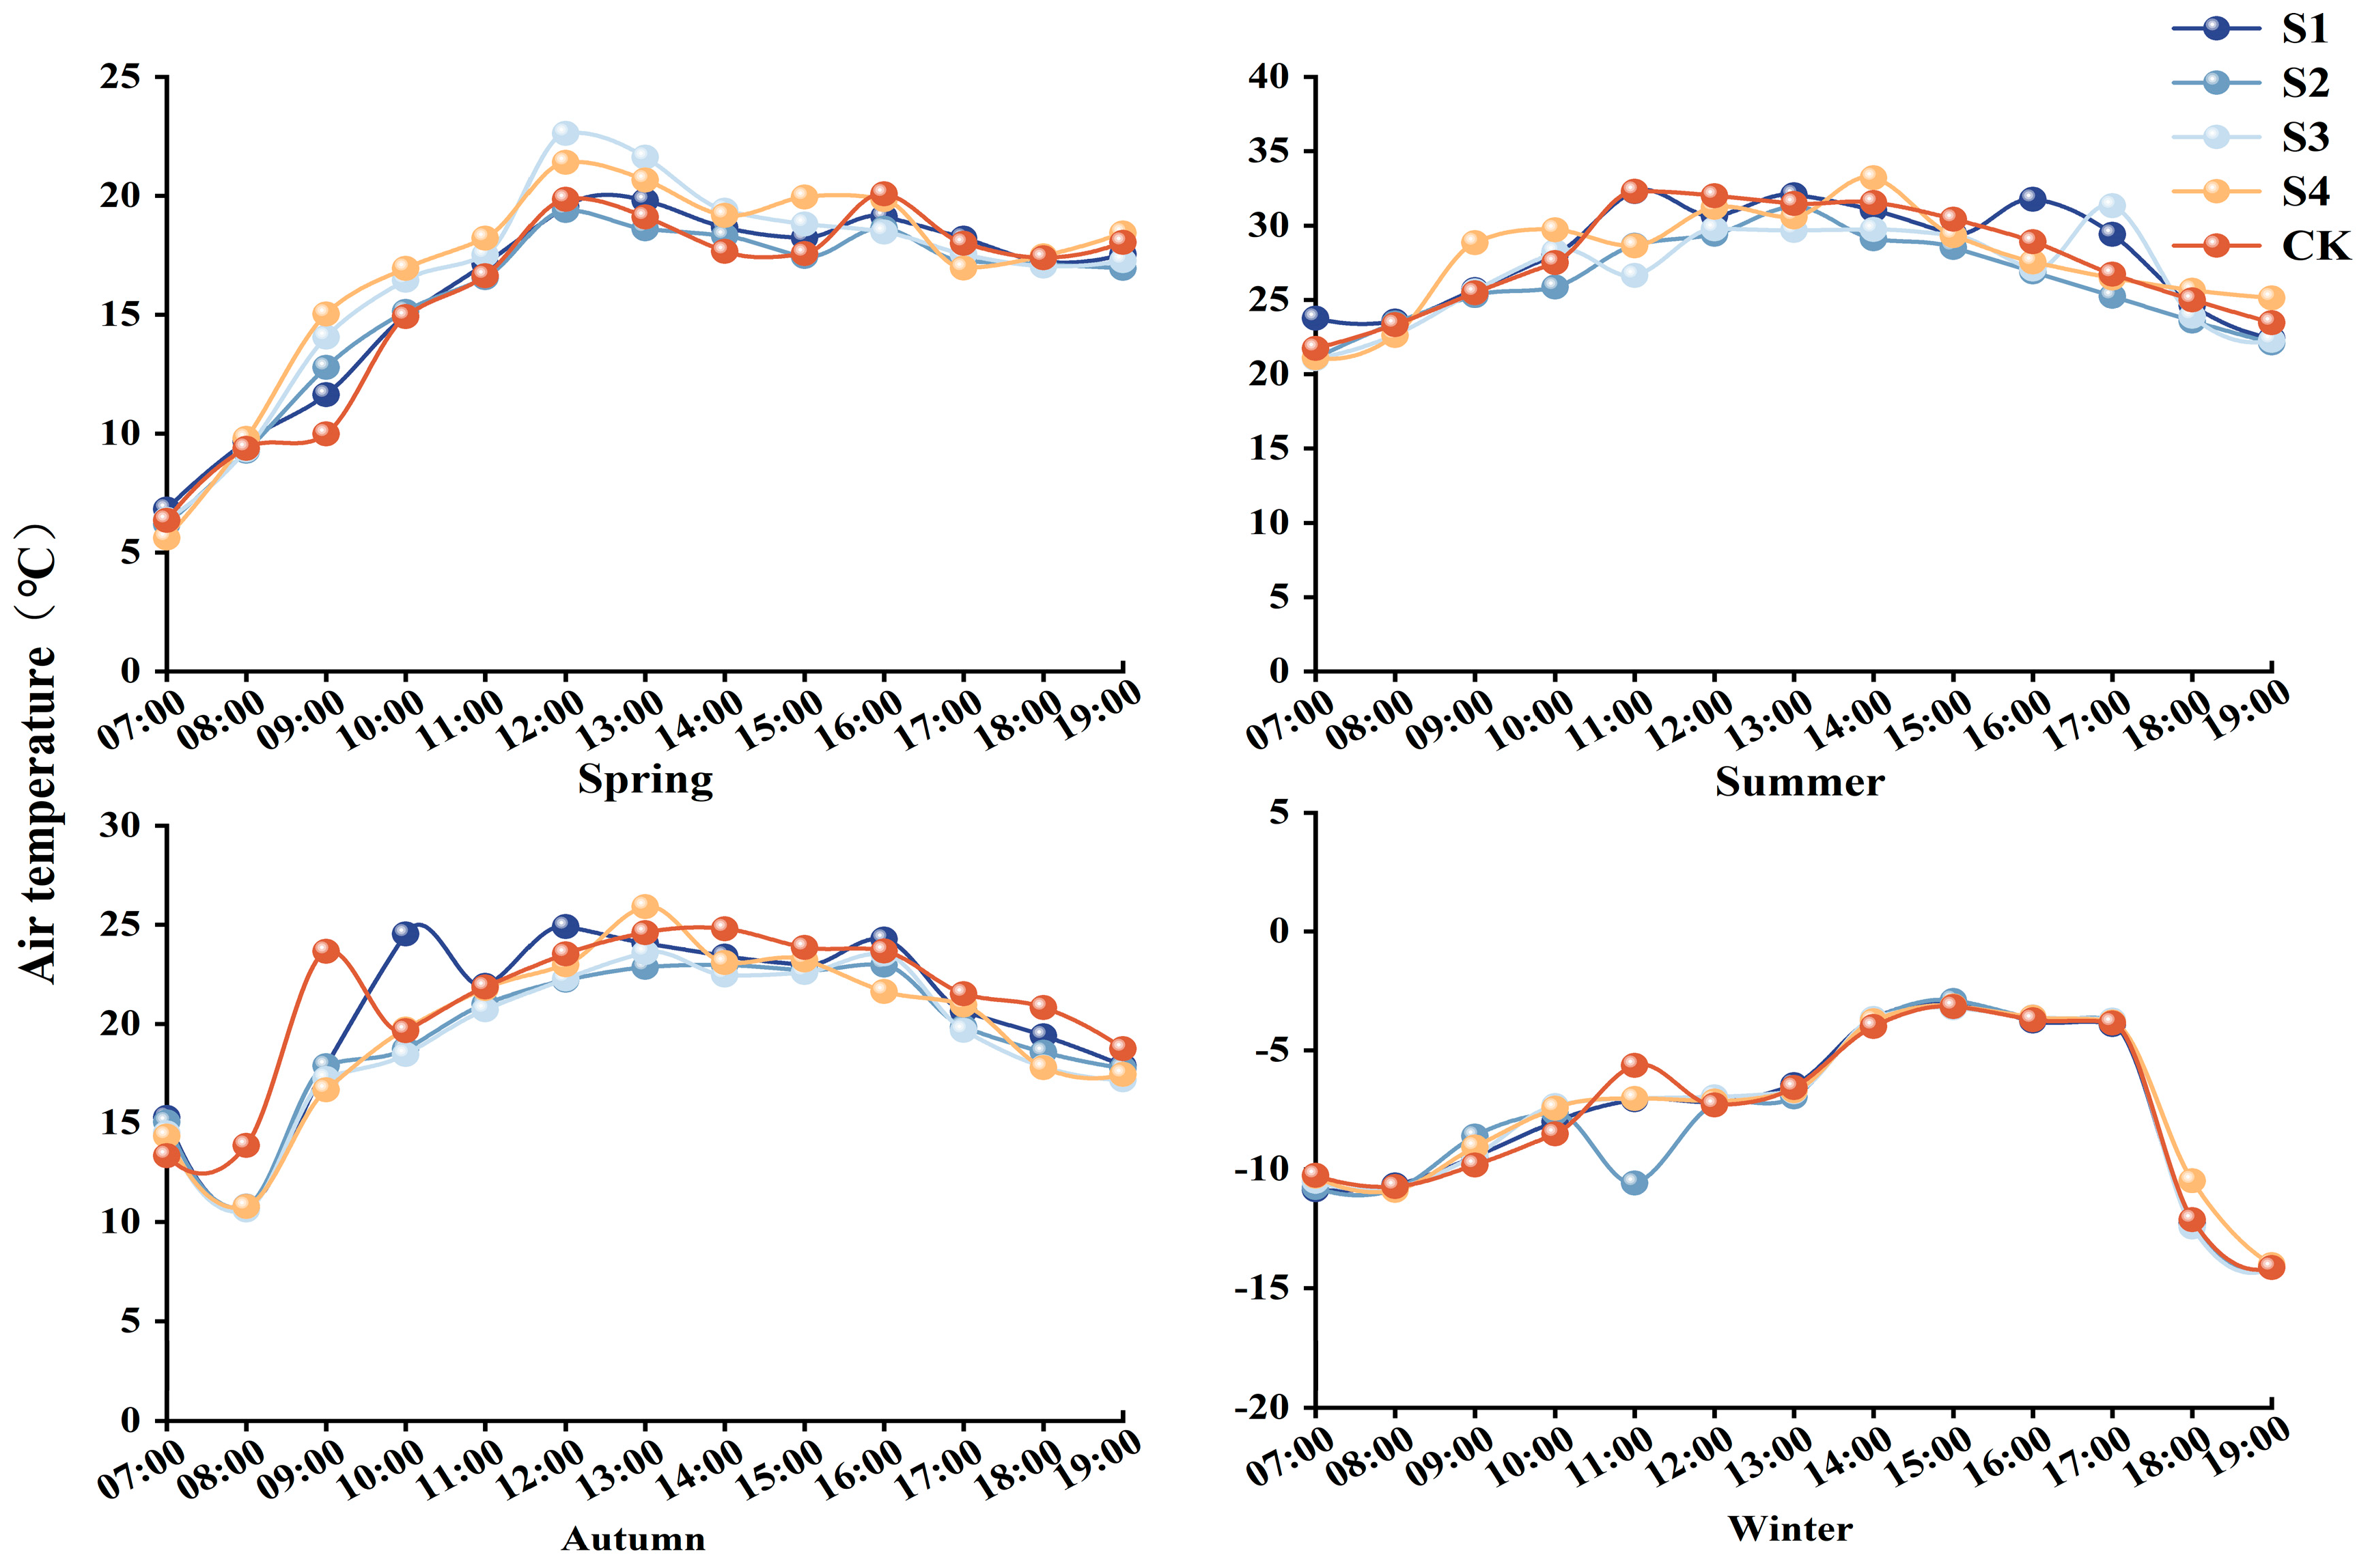
3.1.1. Variations in Air Temperature Among Urban Green Space Types

The air temperature did not vary substantially across different urban green space types at Chilechuan Park for each season (Figure 1). Statistically, there were no significant temperature differences among the sites during spring. Site S4 exhibited the highest average temperature, reaching 16.9 °C, whereas S2 and CK recorded lower temperatures. In summer, S1 had an average air temperature of 28.1 °C, while site S2 had the lowest temperature at 26.2 °C. There were no statistically significant differences observed among S3, S4, and CK. Additionally, no significant variations in air temperature were detected among the sites during the autumn and winter. In autumn, the air temperature at CK was recorded at 27.1 °C, which was higher than that of the urban green space types, with S3 exhibiting the lowest temperature. During winter, the temperatures across the sites ranged from −8.7 to −7.4 °C, with S2 experiencing the lowest temperature and S4 experiencing the highest. The average seasonal air temperature in different urban green space types adhered to the following sequence: summer > autumn > spring > winter. As demonstrated by the reviewed studies, urban trees can regulate air temperature and influence the sensation of comfort, which is shaped by ambient temperature conditions [28,29].
The air temperature at each urban green space type exhibited a similar diurnal pattern, initially rising from early morning to noon and subsequently declining; however, the peak and trough temperatures were observed at slightly different times among sites (Figure 2). In spring, the minimum temperatures were recorded at 07:00, ranging between 5.6 and 6.8 °C, whereas the maximum temperatures were observed around 12:00, varying from 19.3 to 22.6 °C. At 16:00, the temperature at site CK registered 20.1 °C, exceeding that of the urban green space types at this particular time. Conversely, at all other times, the urban green space types demonstrated elevated temperatures compared to the CK. Site S2 consistently registered the lowest temperatures among the four urban green space types. During the summer, the minimum air temperatures were observed at both 07:00 and 19:00, ranging between 21.1 and 25.1 °C, while the peak air temperatures were observed between 11:00 and 14:00. Specifically, the air temperatures at site S4 reached 33.2 °C at 14:00 before gradually declining. At site S3, a secondary peak in air temperatures was noted between 16:00 and 17:00, with air temperatures fluctuating between 27.1 and 31.3 °C. In the autumn, the lowest air temperatures were recorded at 08:00, and the highest temperatures were observed between 12:00 and 14:00, with temperature variations ranging between 11.4 and 15.1 °C. Notably, the temperatures at the CK site were consistently higher than those at the urban green space types during most of the times. During the winter, the maximum temperatures were recorded from 14:00 to 17:00, reaching a peak at 15:00 with a range of −3.2 to −2.9 °C. The minimum temperatures were observed at 19:00, falling below −14 °C. Hourly temperatures were quite close to each other among five sites. Daily variations exist in the timing of the maximum temperature throughout the monitoring period, under which the atmospheric temperature predominantly occurs between 12:00 and 14:00, a pattern that is slightly altered during winter, wherein the peak temperature is reluctantly postponed. Green areas can generate cooling effects and improve the air temperature, especially at the daytime of hot summer days [19].

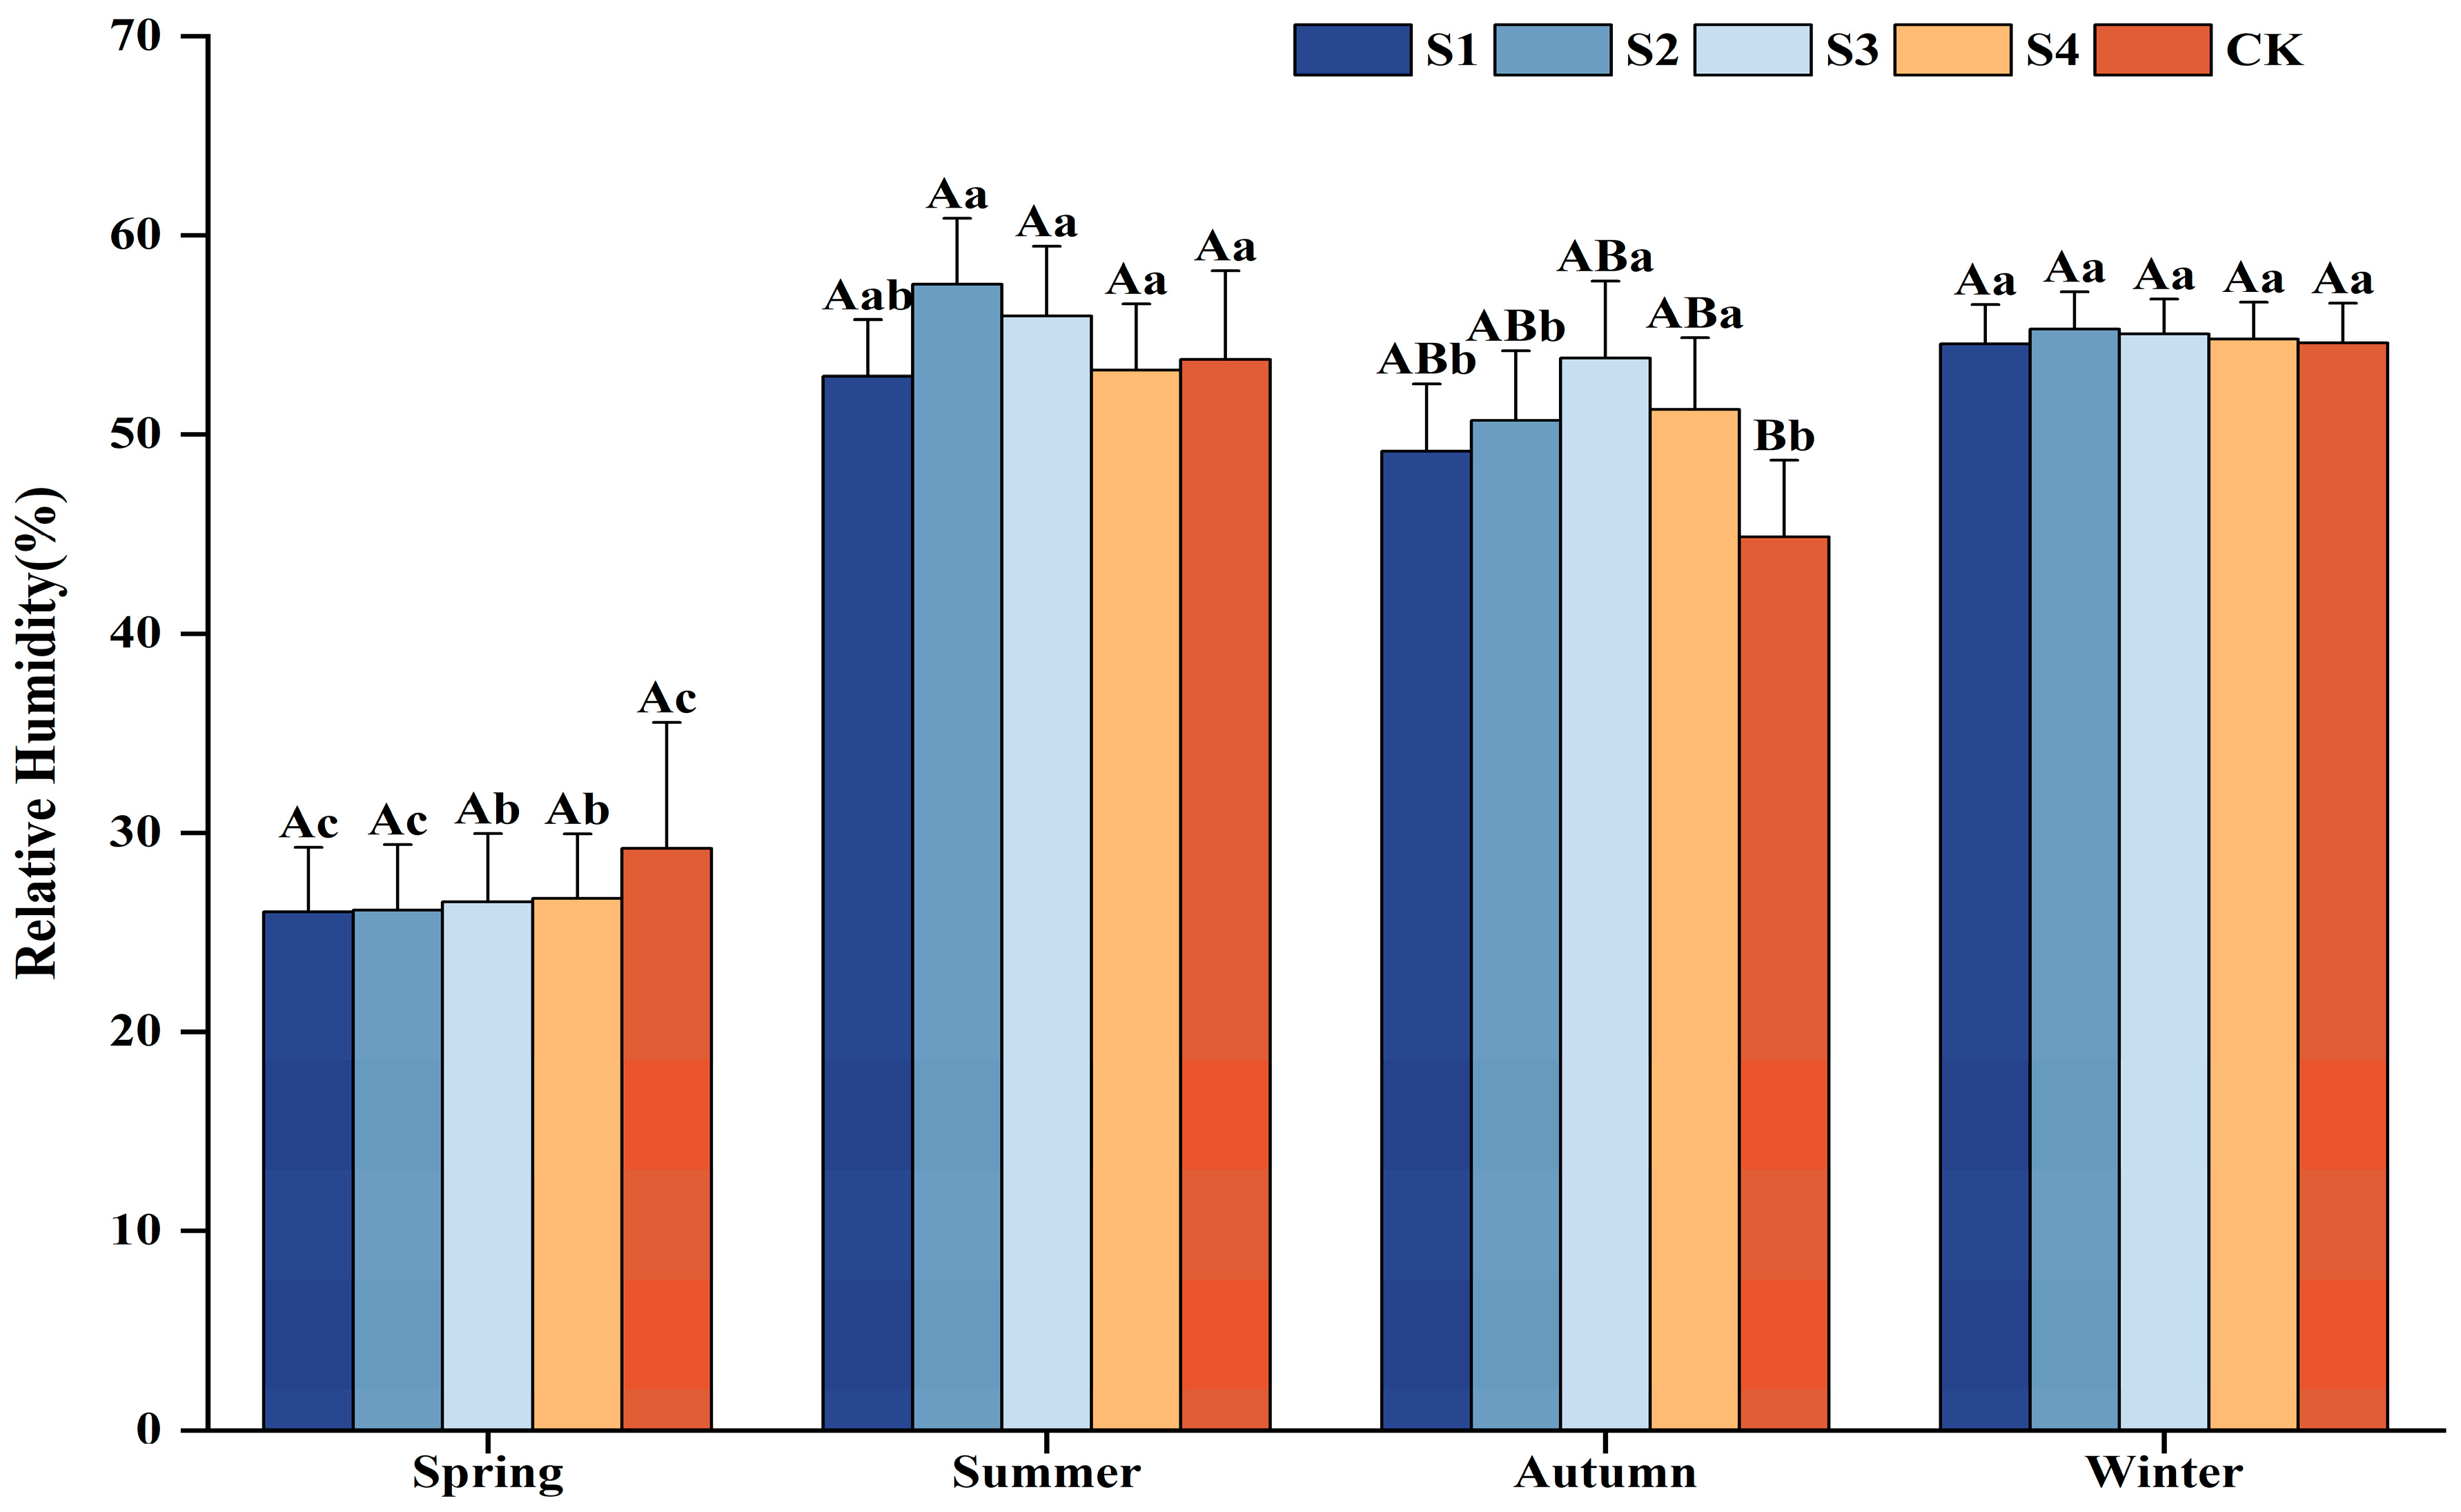
3.1.2. Variations in Relative Humidity Among Urban Green Space Types

A comparison of relative humidity across various seasons at the same observation site was performed. During the spring season, relative humidity was significantly lower compared to the other three seasons. No significant differences were observed among the summer, autumn, and winter seasons for sites S3 and S4. Furthermore, no significant variations in relative humidity were observed for S1, S2, and CK throughout both the summer and winter seasons. At S1, the relative humidity did not exhibit a significant difference between summer and autumn. In contrast, at S2 and CK, the relative humidity in autumn was lower than that in both summer and winter. There were no statistically significant variations in relative humidity among the various sites within the same season (Figure 3). During the spring, the relative humidity at CK reached 29.2%, marking an increase of 9.4% to 12.3% compared to the levels recorded at four urban green space types. During both summer and winter, S2 consistently registered the highest relative humidity, with readings of 57.6% and 55.3%, respectively. In autumn, S3 observed the highest relative humidity, reaching 53.8%, whereas the relative humidity at CK was recorded at 44.8%, which was lower than that observed at the urban green space types. However, this discrepancy was not found to be statistically significant. The former studies showed that relative humidity stands as one of the most well-established parameters and has been widely utilized in numerous studies to evaluate its impact on thermal comfort [30,31].
The diurnal pattern of relative humidity across all sites displayed a U-shaped pattern throughout the spring, summer, and autumn (Figure 4). In spring, the relative humidity reached its peak at 7:00, ranging between 44.7% and 45.8%; the lowest levels were recorded between 1:00 and 2:00, when the relative humidity plummeted to a range of 16.7% to 17.8%. Between 17:00 and 19:00, the relative humidity at the CK site was slightly lower compared to the urban green space types, and the S4 consistently recorded lower relative humidity than both the other urban green space types and CK. In summer, the lowest relative humidity levels were typically recorded between 12:00 and 14:00. At 7:00, the relative humidity peaked at all sites, except for S2, which experienced its highest levels at 19:00. Throughout the day, S2 and S3 consistently showed elevated relative humidity levels compared to the other urban green space types. In autumn, the peak relative humidity was recorded at 8:00, ranging between 65.8% and 70.8%. The minimum relative humidity was observed between 13:00 and 15:00. At most hours, the humidity levels at the CK were observed to be lower in comparison to those recorded at the urban green space types. In winter, the relative humidity demonstrated a gradual decline trend throughout the day. It reached its maximum at 07:00, followed by a rapid decline until 08:00. Subsequently, it increased a little bit until approximately 11:00, after which it decreased again, reaching its minimum level at 15:00, before increasing once more. The higher humidity levels were observed more frequently at site S2. Overall, the daily trend of relative humidity during winter is relatively comparable among sites. Johansson [32] demonstrated that the acceptable range of relative humidity is generally between 30 and 70%, with a value of 50% being regarded as the optimal.

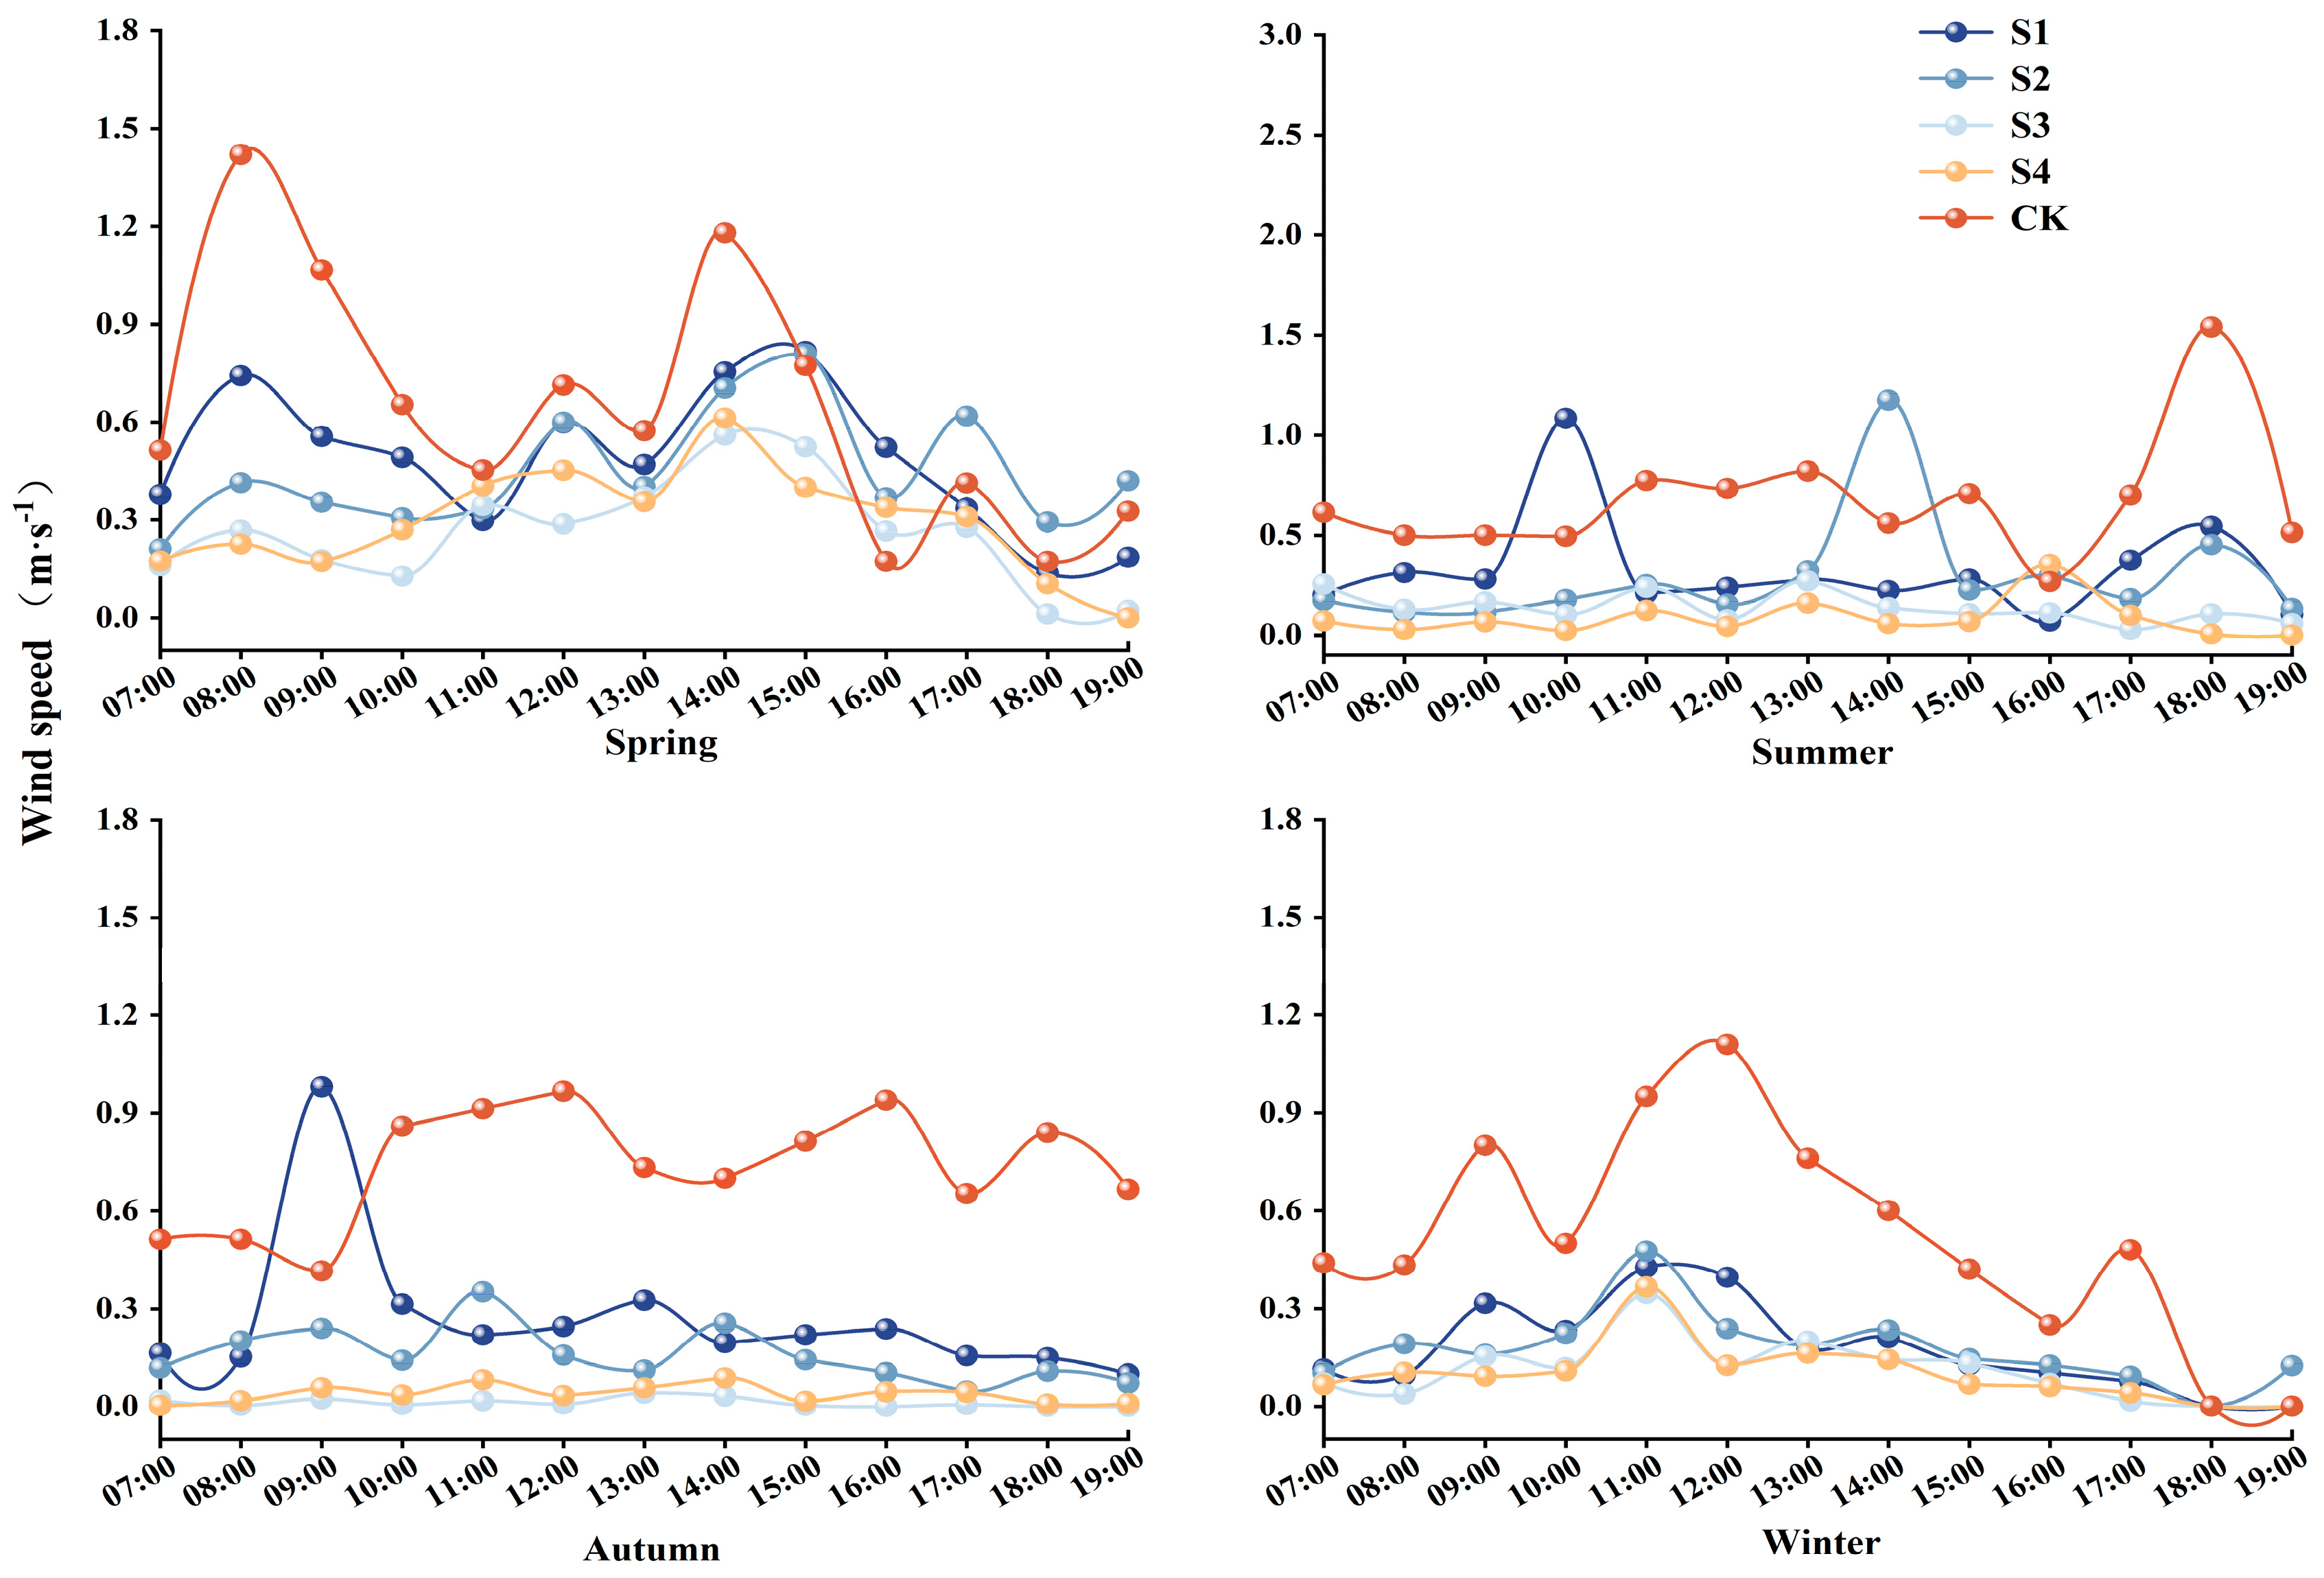
3.1.3. Variations in Wind Speed Among Urban Green Space Types

As shown in Figure 5, the mean wind speed at the CK exhibited significant seasonal variations, ranging between 0.52 and 1.02 m/s. In spring and summer, S1 and S2 demonstrated notably higher mean wind speeds compared to S3 and S4. During autumn, S1 maintained a significantly elevated wind speed relative to other forest sites, while no significant difference was observed between S4 and S5. Winter saw minimal variation in wind speed among different structural green spaces. Wind speeds within 4 urban green space types fluctuated between 0.01 and 0.48 m/s. Monitoring revealed that mean wind speeds within these spaces were consistently lower than at the CK, suggesting a regulatory role of forest sites in mitigating wind speeds around park greenery. Additionally, spring exhibited the highest mean wind speed among all seasons (ranging from 0.26 to 0.48 m/s), consistent with regional climatic characteristics marked by strong spring winds. Seasonal variations in wind speed within individual structural configurations were as follows: S1 showed a significant increase during spring compared to other seasons, while no substantial differences were observed across other seasons. For S2, spring wind speeds were significantly higher than those in autumn and winter; however, no notable difference was detected between spring and summer. Similarly, S3 and S4 exhibited significantly higher wind speeds in spring compared to other seasons, with only a minor variation between summer and autumn. Waton [33] and Ghasemi [34] similarly identified wind as an important factor influencing thermal satisfaction.
The diurnal pattern in average wind speed differed across sites or seasons (Figure 6). The daily variation in wind speed in different urban green space types and CK across various seasons exhibits a fluctuating pattern. During spring, the wind speed within different urban green space types ranges from 0.00 to 0.82 m/s, while that at CK ranges between 0.17 and 1.72 m/s. Notably, the peak and trough values for these urban green space types occur at 14:00–15:00 and 18:00, respectively. Across other seasons, wind speeds consistently remain higher at CK compared to different urban green space types. Specifically, in summer, wind speed within urban green space types fluctuates from 0.00 to 1.17 m/s, while CK experiences a wider range of 0.27 to 1.54 m/s. Similarly, during autumn, urban green space types record wind speeds between 0.00 and 0.35 m/s, in contrast to the 0.42–0.97 m/s observed at CK. Winter shows a comparable trend, with wind speeds in urban green space types ranging from 0.00 to 0.47 m/s, versus the broader range of 0.00–1.11 m/s at CK. This analysis underscores that the maximum wind speed at CK is consistently higher than those measured within the different urban green space types. It can generally be stated that the most appropriate method for assessing or predicting the wind comfort conditions of people in urban green spaces is to utilize wind speed thresholds. Penwarden [35] reports that wind velocities of approximately 5 m/s represent the initial threshold at which conditions become uncomfortable, with discomfort intensifying significantly at 15 m/s. While wind velocities of 1–2 m/s are perceived as comfortable during summer, protective measures against such conditions become necessary in winter [36].

3.2. Comparison of Two Different Human Comfort Indices

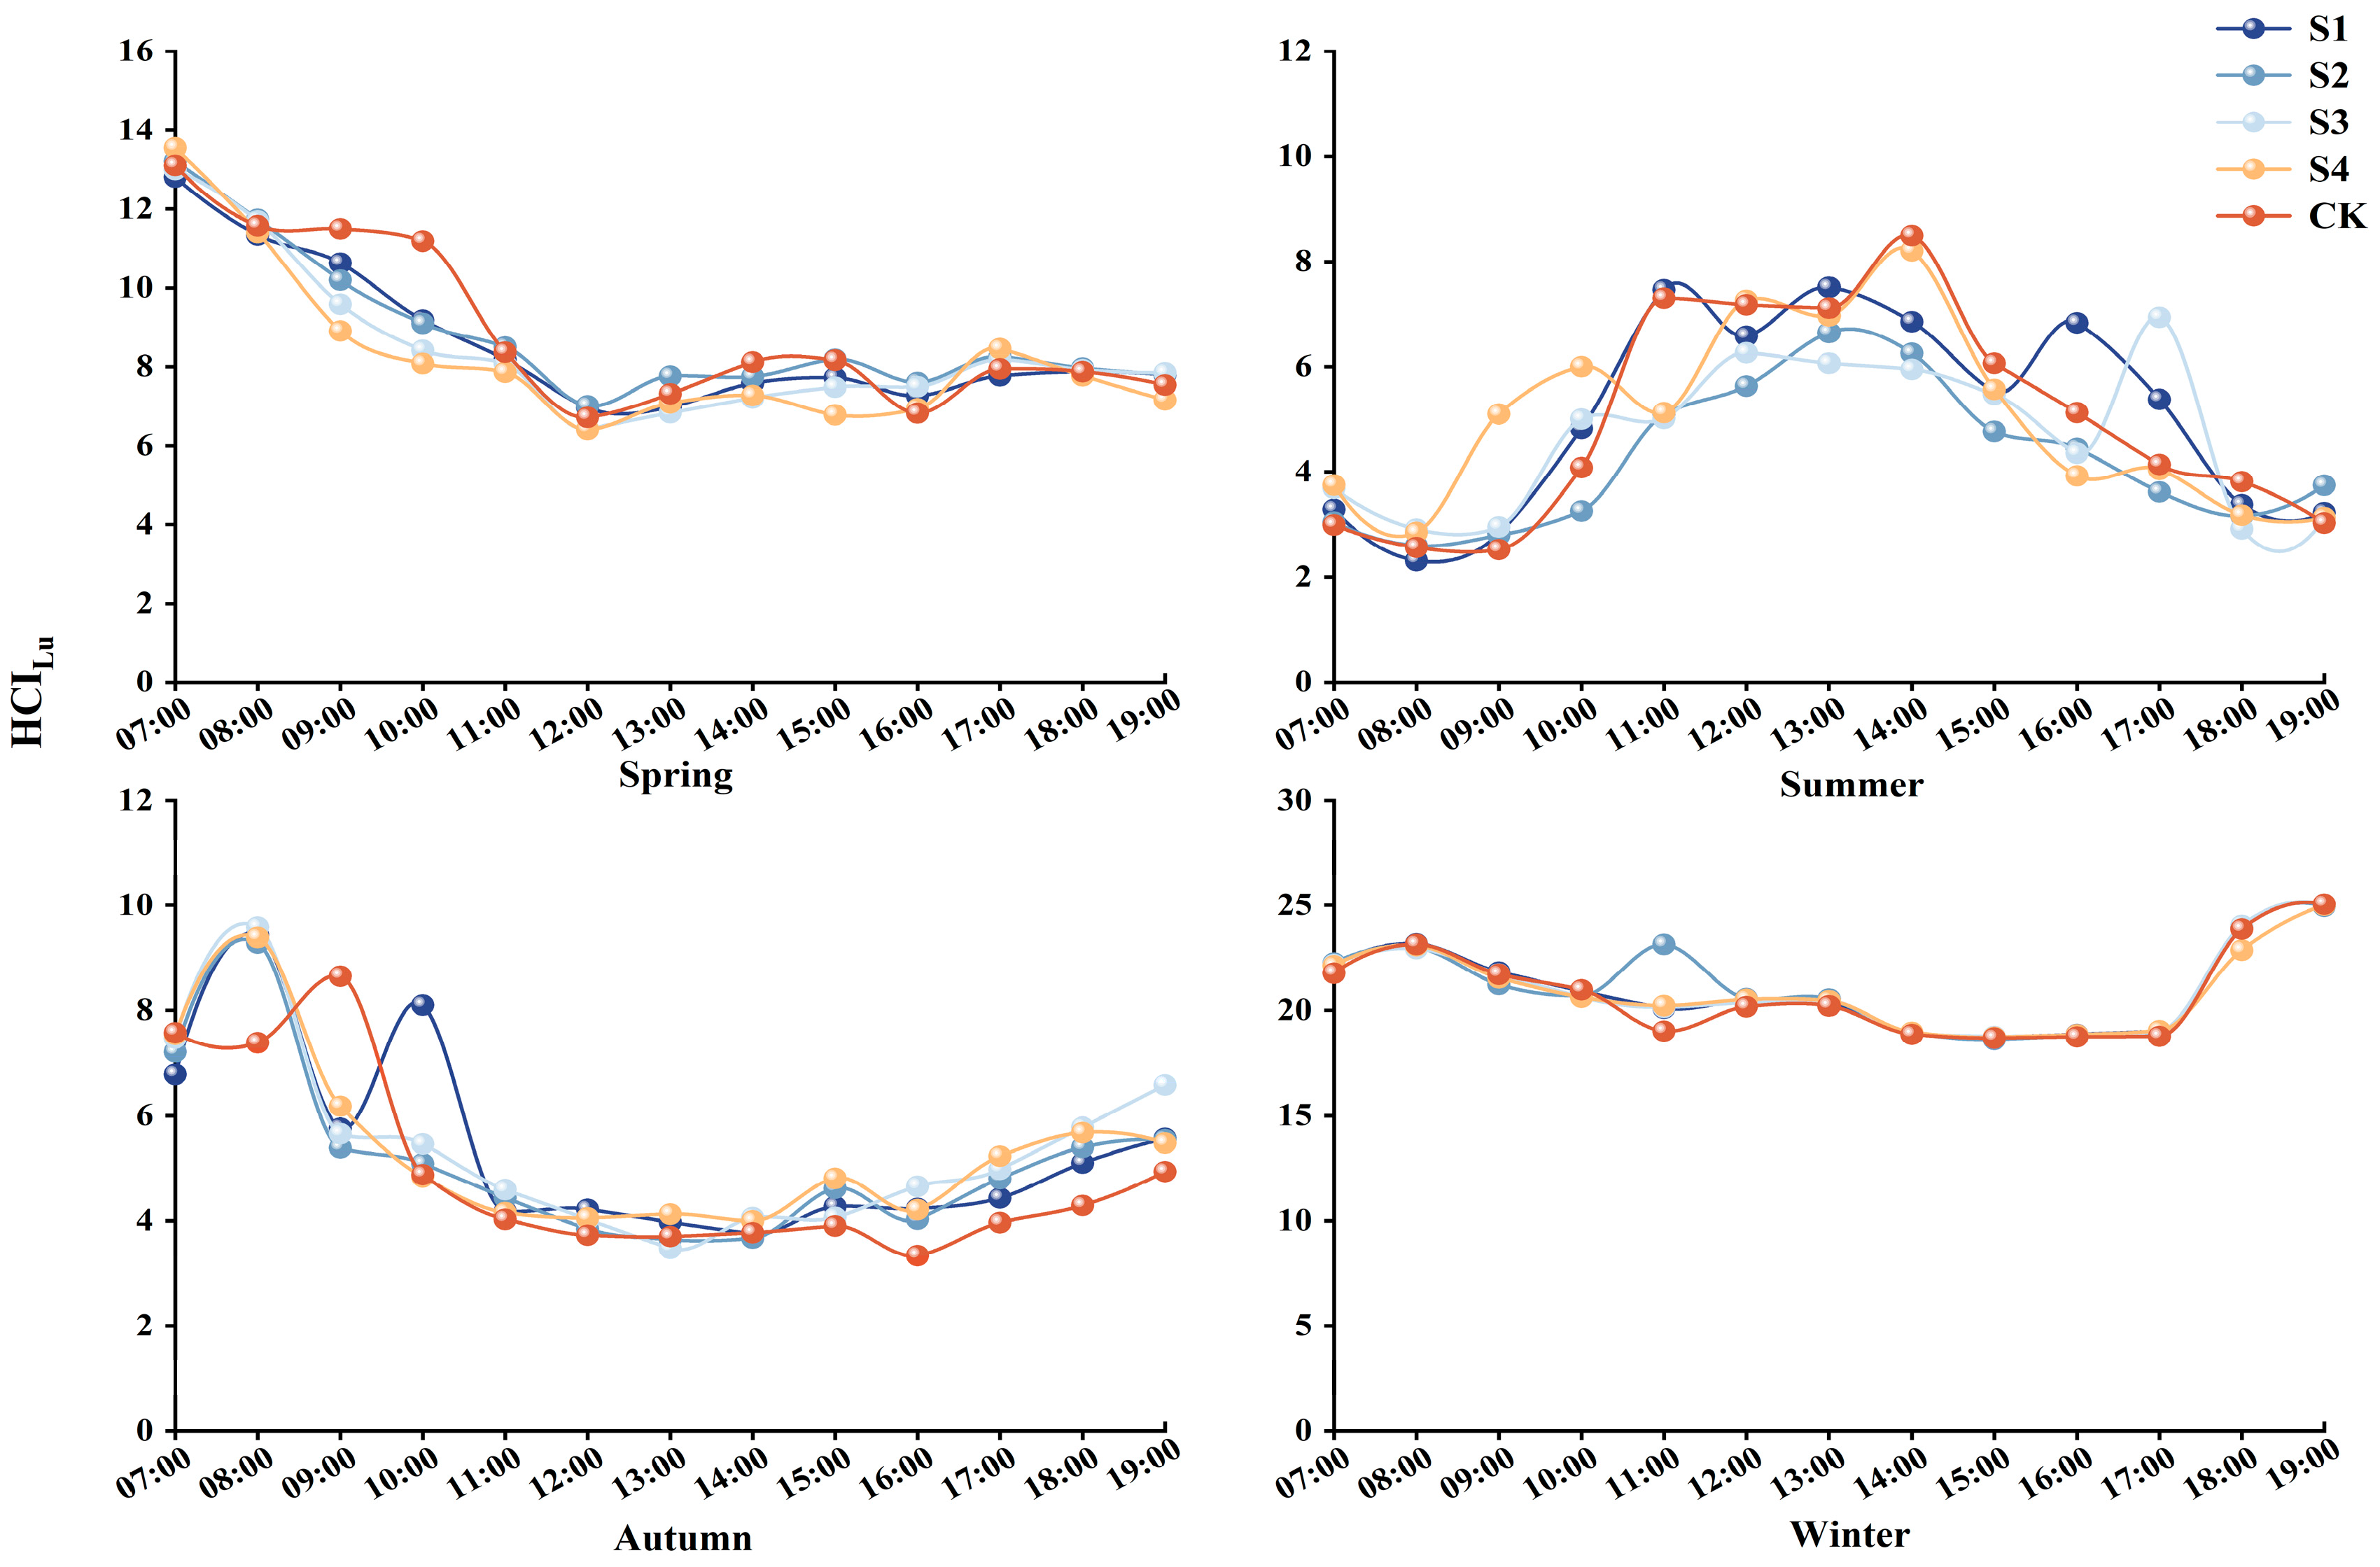
3.2.1. Seasonal and Daily Variation in HCILU

As shown in Table 4, no statistically significant differences were observed among different structural urban green spaces and the CK within the same season (p > 0.05). The human comfort index of urban green spaces and the CK reached its maximum value in winter, followed by spring, with significantly lower values recorded in autumn and summer. Within the same season, no significant differences in human comfort were observed among different monitoring points. Specifically, the human comfort index at various monitoring points was significantly higher in winter compared to other seasons, followed closely by spring. No statistically significant differences were observed between summer and autumn. Based on HCILu assessments, all sites were categorized as “uncomfortable” in spring, “more comfortable” in autumn, and “extremely uncomfortable” in winter. During summer, site S2 was classified as “comfortable”, whereas the other urban green space types were deemed “more comfortable”. This is slightly different from the research results of human comfort in Beijing Purple Bamboo Park by Duan et al. [37]. In this paper, the human comfort in the park during summer is calculated to be relatively good through the HCILu, while Beijing Purple Bamboo Park performs exceptionally well in spring.
Figure 7 delineates diurnal variability patterns of the human comfort index across seasonal conditions, demonstrating distinct temporal trends in bioclimatic perception. During the spring season, HCILu exhibited a declining trend throughout the day. The peak HCILu values were recorded at 07:00, ranging from 12.8 to 13.5. The minimum values were observed around 12:00, fluctuating between 6.4 and 7.0. Notably, HCILu levels were generally highest at S2. In the summer, HCILu demonstrated an approximately inverted U-shaped pattern over the course of the day. The lowest HCILu values in urban green space types were observed at 08:00, whereas in CK, the minimum occurred at 09:00. The maximum HCILu values were recorded between 12:00 and 14:00, followed by a subsequent decline. The human comfort index in autumn generally exhibits a decreasing trend, with the highest values observed at 8:00 in urban green spaces and at 9:00 in CK. The lowest indices occur between 13:00 and 14:00. In winter, the trend of the human comfort index adopts a roughly U-shaped pattern, reaching its minimum at 15:00 and maximum at 19:00 across all green spaces and CK. Comparatively, urban green spaces consistently demonstrate higher human comfort indices than CK throughout most of the day, indicating that urban green spaces provide a more favorable environment for human comfort compared to control areas.
Table 5 quantifies seasonal variations in human comfort indices, with temporally resolved data illustrating bioclimatic thresholds and transitional dynamics across discrete meteorological phases. During spring, the human comfort levels at both observation points and the control site were predominantly uncomfortable or extremely uncomfortable for most of the day. Between 7:00 and 9:00, all locations consistently experienced extreme discomfort. Outside this period, uncomfortable conditions persisted at relatively high levels. In summer, human comfort across different urban green space types and the CK was primarily comfortable or less comfortable. Comfortable conditions were observed from 7:00 to 10:00 and again from 15:00 to 19:00 at the urban green space types and CK, with less comfortable levels dominating during other periods. Notably, uncomfortable conditions persisted at specific points (S1, S4) and the CK even during these transitional phases. In autumn, human comfort was generally comfortable or less comfortable across most of the day at different urban green space types and the CK. From 7:00 to 8:00, urban green space types were predominantly uncomfortable or extremely uncomfortable. Between 9:00 and 10:00, conditions were mainly less comfortable. However, from 11:00 to 19:00, human comfort at the urban green space types and CK remained consistently less comfortable or comfortable. During the winter observation period, human comfort across all urban green space types and the CK was uniformly extremely uncomfortable. Residents are advised to avoid outdoor activities during periods of uncomfortable or extremely uncomfortable conditions in summer and autumn.

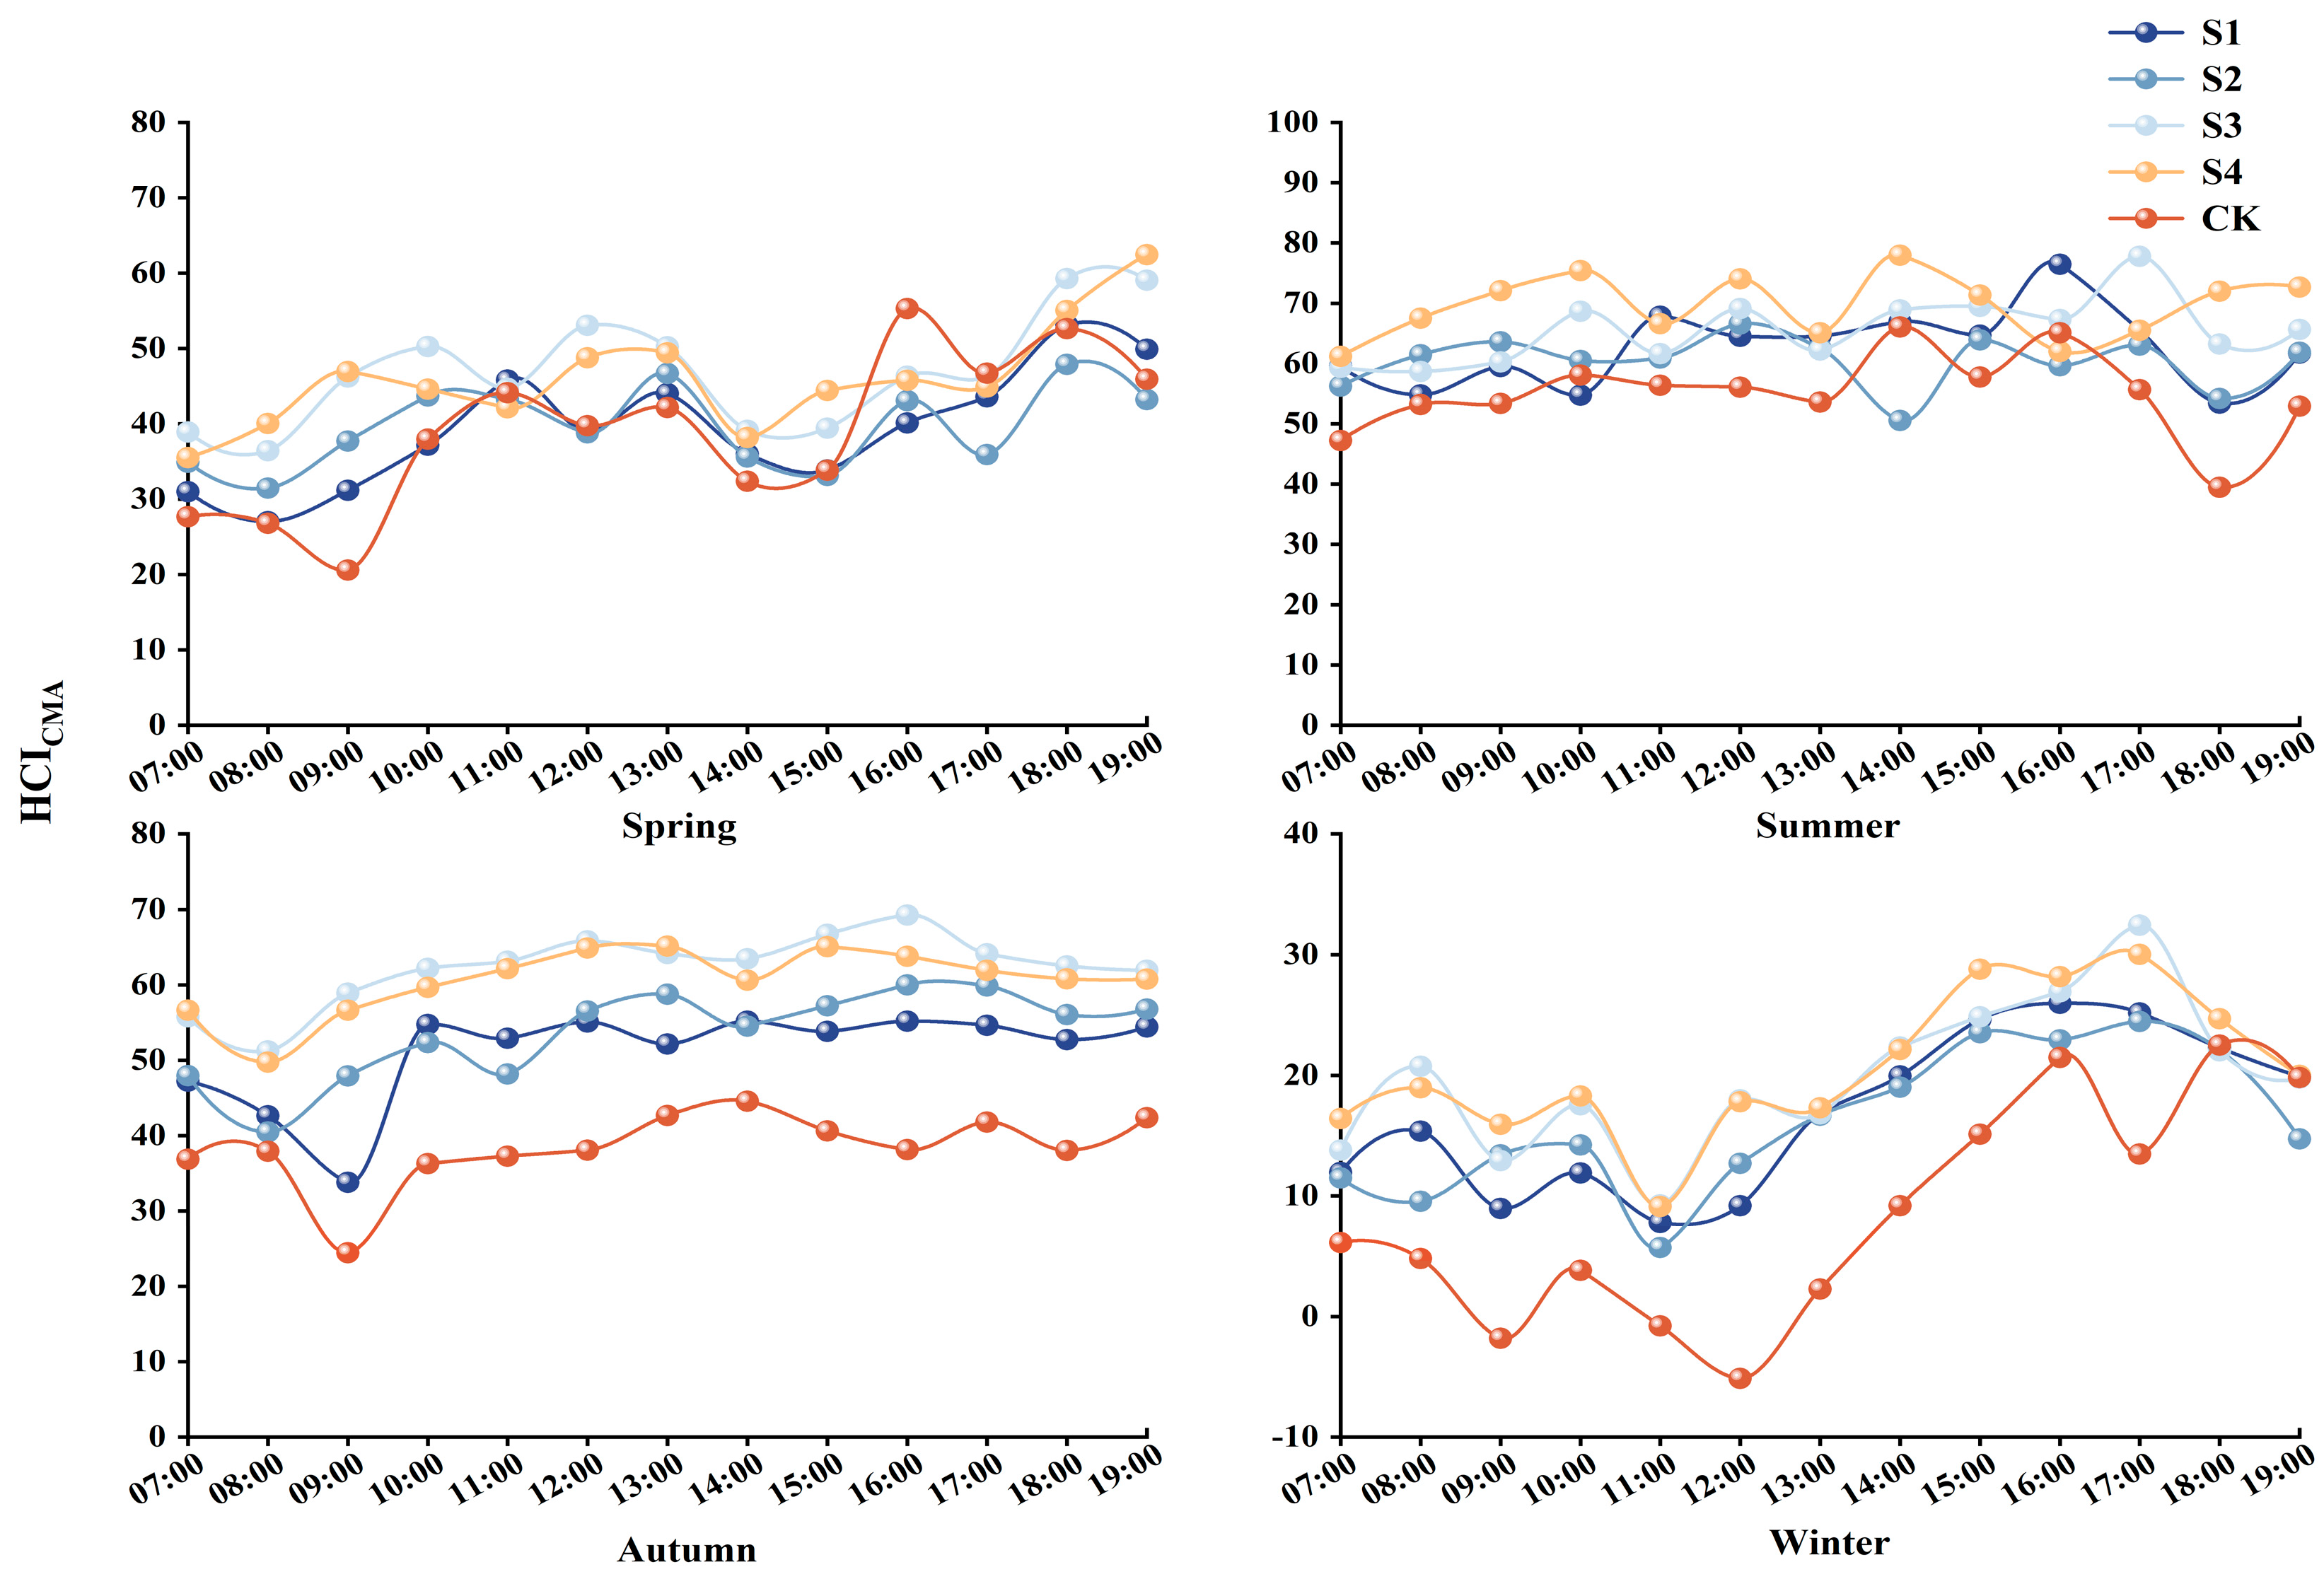
3.2.2. Seasonal and Daily Variation in HCICMA

A statistically significant difference in HCICMA was observed between urban green space types and CK within the same season (Table 6), with site S3 and S4 exhibiting elevated HCICMA levels. The peak HCICMA values were recorded during the summer, whereas the lowest values were noted in winter. HCICMA was higher in autumn compared to spring, whereas no significant difference was observed in the HCICMA of CK between these two seasons. The comfort level, as determined by HCICMA, was consistent between urban green space types and CK during spring and winter. However, in summer and autumn, the comfort level was higher in urban green space types compared to CK. Quan et al. [38] reported similar findings, with human comfort indices for different green space types in the Olympic Forest Park remaining within the most comfortable range during summer, as determined by the HCICMA formula.
As shown in Figure 8, during the spring season, HCICMA exhibited diurnal fluctuations, generally displaying an upward trajectory. The values were relatively low between 07:00 and 09:00, followed by an increase until 13:00. Subsequently, a decline was observed from 14:00 to 15:00, with values ranging from 33.1 to 44.2, after which there was a resurgence until 18:00 to 19:00. Notably, S4 recorded the highest HCICMA value at 19:00, reaching 62.5. Both S3 and S4 demonstrated the highest HCICMA values during this period. In contrast, during the summer, elevated HCICMA values were observed between 14:00 and 16:00, although no distinct pattern emerged regarding the timing of the lowest values. S4 consistently exhibited the highest HCICMA values in the summer as well. During the autumn season, the minimum HCICMA values for urban green space types were observed between 08:00 and 09:00, while the maximum values were recorded between 15:00 and 16:00. In contrast, the lowest and highest HCICMA values for CK were noted at later times compared to the urban green space types. Among the urban green space types, S3 consistently exhibited higher HCICMA values than both the other urban green space types and CK. In the winter season, HCICMA values demonstrated fluctuations throughout the day, generally displaying an upward trend. The minimum value was recorded at 11:00, and the maximum value was observed between 16:00 and 17:00. For CK, the highest and lowest values appeared 1–2 h later than those for the urban green space types. Notably, S3 and S4 consistently showed higher HCICMA values, whereas CK generally exhibited lower values.
As shown in Table 7, during the winter season, the comfort level across all urban green space types and the control site (CK) ranged from “cool, most people are uncomfortable” to “cold, uncomfortable”. Conversely, in the spring, the comfort level at the control site and all urban green space types, with the exception of site S2, achieved a rating of “cool and refreshing, a few people are uncomfortable” or better for at least a portion of the observation period. Notably, site S3 maintained a comfort level of “Slightly cool, comfortable for most people” or better for 38% of the observation period. During the summer, the urban green space types were more frequently classified as “most comfortable” or “Slightly cool, comfortable for most people” compared to CK, suggesting a higher level of comfort in the urban green space types. In the autumn, the occurrence of ”Slightly cool, comfortable for most people” categories was 0% for CK, whereas it ranged from 69% to 100% for the urban green space types. The performance of two human comfort formulas exhibited variability across differing seasonal conditions and monitoring periods. Additionally, individual differences played a crucial role in thermal comfort perception, as personal thermal perception criteria varied significantly among individuals. Notably, the research findings revealed that human comfort perception at the CK under the two formulas was comparable to, if not better than, that observed in various types of urban green space.

3.3. Factor Analysis of Two Human Comfort Formulas

As shown in Table 8, the correlations between the two human comfort indices (HCILU and HCICMA) and the monitored environmental indicators in different seasons are presented. For HCILU, there is a strong positive correlation with air temperature across all seasons at the p < 0.01 level. Relative humidity also shows a highly significant correlation (p < 0.01) with HCILU, except in winter. In contrast, wind speed is negatively correlated with HCILU, indicating that its influence is relatively weak compared to temperature and humidity.
For HCICMA, air temperature and wind speed are strongly correlated across all seasons at the p < 0.01 level. Relative humidity displays seasonal variability in its correlation with HCICMA: it shows a highly significant positive correlation in autumn and winter (p < 0.01), while in spring and summer, relative humidity is positively and negatively correlated, respectively. These findings suggest that air temperature and wind speed exert a dominant influence on HCICMA, whereas the relationship with relative humidity varies depending on the season.
Overall, both human comfort indices are strongly influenced by air temperature, which shows consistent significance across all seasons. Additionally, both indices exhibit seasonal dependence on relative humidity and wind speed, though their correlations differ in magnitude and direction between the two indices. These results underscore the importance of considering both environmental conditions and individual variability in assessing thermal comfort effectively.

3.4. A Comparative Analysis of Two Methods for Assessing Human Comfort

The area under the receiver operating characteristic (ROC) curve (AUC) represents the overall performance of a diagnostic test (Table 9). A higher AUC, closer to 1.0, indicates greater diagnostic accuracy, while an AUC near 0.5 signifies poor discrimination. When the AUC equals 0.5, the test has no diagnostic value. Typically, the predictive accuracy of AUC is categorized into three levels: values between 0.5 and 0.7 indicate low accuracy; values from 0.7 to 0.9 suggest moderate accuracy; and AUC values above 0.9 denote high accuracy.
In this study, the prediction performance of two human comfort formulas was evaluated based on their AUC values across different seasons, enabling a selective assessment of the formulas and mitigating over-fitting risks. As evidenced in Table 9, the HCICMA formula demonstrates an AUC of 0.908 in autumn, exceeding the threshold of 0.9 for high accuracy. During winter, its AUC is 0.745 (>0.7), indicating moderate accuracy. In summer, although the predictive value of HCICMA exceeded 0.6 (AUC = 0.667), its accuracy was relatively low, approaching 0.7, yet it still holds some reference value. For spring, HCICMA’s AUC is 0.593 (<0.6), reflecting limited accuracy. Conversely, the AUC of HCILU ranges between 0.478 and 0.592 (AUC < 0.6) across all seasons, signifying relatively low accuracy in estimating human comfort index. Overall, the formula from the China Meteorological Administration (HCICMA) exhibits superior predictive performance for human comfort indices compared to HCILU across varying seasons.
The ROC curve offers advantages in classifier evaluation, particularly under class-imbalanced conditions [39]. By computing the true positive rate and false positive rate, it remains insensitive to class proportion shifts, making it a robust tool for assessing classifier performance [40]. This characteristic not only enhances the practical application of ROC analysis but also deepens our understanding of performance evaluation metrics. Leveraging this feature in future studies can lead to more effective model optimization and validation, driving technological advancements across diverse domains [41].

4. Discussion

The existing literature falls short in thoroughly addressing the selection of appropriate human comfort indices. In this study, Hohhot, a city situated in the northwest of China, was chosen to assess the outdoor human comfort indices for pedestrians across various seasons. The climate conditions in the urban green space types exhibited similarity to those in CK, displaying comparable daily patterns. Our result indicated that air temperature peaked in summer (28.1 °C), while winter exhibited extreme cold (−8.7 °C). Relative humidity exhibited a persistent U-shaped diurnal pattern with spring minima, while forest canopies (S1–S4) attenuated wind speeds by 32–54% compared to CK, demonstrating biome-specific aerodynamic resistance linked to canopy structural complexity. Mixed deciduous-evergreen forests (S3, S4) provided superior microclimate regulation, with lower temperatures and higher humidity than sparse forests (S1) or CK. Similar to Perini et al. [42] and He et al. [43], dense vegetation reduced daytime temperatures by 1.5–2.0 °C. Unlike studies in humid climates [10,44], vegetation did not significantly elevate relative humidity, likely due to low baseline moisture in arid regions [45]. Urban green spaces reduced wind speeds by 0.3–0.5 m/s compared to CK, corroborating Coccolo et al. [15], who emphasized windbreak effects of dense canopies. The site characterized by a dense mixed forest of deciduous broad-leaved and evergreen needle trees exhibited lower air temperature, higher relative humidity, and reduced average wind speed. The findings reveal that mixed forests (S3/S4) show a 15–20% improvement in comfort relative to the control group (CK). Nonetheless, as the study relies on observational data, it is possible that unmeasured confounding factors may have influenced the results. As such, the conclusions should be viewed with caution, emphasizing that the observed differences suggest an association rather than confirming a direct causal relationship. This interpretation aligns with the work of Lopez-Cabeza et al. [46], who demonstrated that canopy density contributes to improved shading and reduced turbulence, further supporting the notion that this forest type promotes a comfortable and pleasant environment [42,43]. Urban planners should prioritize mixed-tree configurations for year-round comfort in arid cities [47,48].
Additionally, the results of our study concluded that summer and autumn were the most comfortable seasons, followed by spring and then winter. In autumn, winter, and spring, the diurnal variation in index HCILu followed a similar trend to that of relative humidity, and in summer, it followed a similar trend to that of air temperature. Discrepancies were observed in the timing of the maximum and minimum values, which could potentially be attributed to the variations in plant communities [49,50]. Conversely, there was little diurnal variation in another index, HCICMA, and HCICMA did not follow a similar trend to any of the meteorological factors measured. Therefore, HCILu is more conducive to public cognition and experience [51]. HCICMA demonstrated stronger correlations with temperature and wind speed and higher diagnostic accuracy via ROC-AUC analyses (AUC = 0.908 in autumn), outperforming HCILu, which lacked granularity in comfort classification. The formula used to calculate HCICMA does not need absolute values and is simpler than that used to calculate HCILu. Moreover, HCICMA is more intuitive at low temperatures. Since the winter temperature in this study was generally below 0 °C, part of the human comfort index calculated by this formula was negative at all times, and this part was not graded in the evaluation grade. HCILu’s oversimplification arises from its reliance on linear temperature–humidity relationships, neglecting wind-driven convective heat loss—a dominant factor in arid winters [52]. HCICMA’s non-linear formulation better captures interactions between meteorological variables, particularly at low temperatures [53]. HCICMA is recommended for policy frameworks due to its higher sensitivity to regional climatic stressors, aligning with Liu et al.’s [24] call for localized index adaptation.
Despite the multitude of studies undertaken on the human comfort index, there has been a scarcity of comparative analyses and assessments regarding the applicability of diverse human comfort formulas under uniform environmental conditions [54,55]. The climatic characteristics of the study area where the urban green spaces are situated limit the specificity of the human comfort level classification based on HCLLU. However, due to its simple grade division, it can clearly and explicitly convey comfort information to the public, making it easy for all kinds of people to understand. In the correlation analysis, the human comfort indices calculated by both methods were highly correlated with two meteorological factors in spring and summer. According to the correlation coefficients, the HCICMA method in spring and the HCILU method in summer had a stronger correlation with the climate factors. In autumn and winter, the human comfort index calculated by the HCICMA method was highly significantly correlated with three climate factors observed in this study. The human comfort index calculated by the HCILU method in autumn was highly significantly correlated with air temperature and relative humidity, while in winter, it was only highly significantly correlated with air temperature. In the realm of investigating variations in human comfort, a preponderance of studies have focused on localized area analysis, with no comparative research conducted on local applicability [56,57,58]. Although environmental data are generally more accessible and easier to analyze due to their independence from human factors, they are indeed valuable in assessing human comfort, as all physical parameters contribute to some degree in influencing comfort perception [59,60]. Nevertheless, it should be noted that, at times, solely relying on physical parameters may be insufficient to fully elucidate human responses.
Otherwise, there has been an absence of a thorough exploration regarding the significance of various meteorological factors in human comfort across different regions, as well as a dearth of an accurate and appropriate human comfort index formula to assess and choose the formula that aligns with regional climate characteristics [61,62]. Currently, human comfort research in China frequently employs empirical indices to gauge human comfort, taking into account a limited number of meteorological elements in the environment while neglecting the radiation factor, which holds a substantial influence on outdoor conditions [63,64]. For the moment, it fails to encapsulate the comprehensive impact of meteorological elements on the human body.
This research tried to advance the quantification of urban thermal comfort by integrating regional climate characteristics. However, the following key limitations of the study are acknowledged: First, the daytime monitoring protocol (07:00–19:00) precludes analysis of nocturnal microclimate feedback—a pivotal regulator of urban heat island decay rates [18]. Second, the absence of solar radiation measurements limits mechanistic interpretation of vegetation-mediated energy budgets, a parameter universally recognized as contributing 42–58% of daytime comfort variance [14]. Third, while HCICMA showed superior diagnostic performance, its thresholds lack empirical validation against behavioral data, a prerequisite for contextualizing index outputs to human perception thresholds [13]. HCILu’s method categorizes comfort into fewer, broader levels and fails to differentiate between cold and hot conditions. In this study on human comfort in urban green space in Hohhot, differences in comfort levels as measured by the HCILu index were minimal between different types of urban green space and CK. The assessment outcomes derived from empirical indices exhibit specific spatial and temporal constraints.
However, because it is concise, comfort information can be clearly transmitted to the public and is easy to understand. The ROC curve analysis of the two human comfort indices showed that HCICMA is more suitable than HCILu in this study area. Given the subjective nature of human comfort, we propose employing validated psychometric tools alongside geospatial activity pattern analysis and semi-structured interviews to systematically characterize the comfort needs of urban residents across demographic groups.
To further enhance the comprehensiveness and accuracy of future research, it is essential to consider additional meteorological factors such as solar radiation and light duration [59,65]. Among these, the wind chill index plays a significant role in evaluating human comfort in cold environments, particularly during winter in regions where extreme temperature fluctuations are common [66]. As demonstrated by studies like those of [52], the wind chill index can be effectively determined using empirical models to quantify the combined effects of temperature and wind speed on human comfort thermal perception. Several European and North American countries have already adopted this approach to warn citizens about potential meteorological hazards [67]. In some research regions where winter conditions often exacerbate the impact of cold winds, integrating the wind chill index into comprehensive thermal comfort models like HCICMA is particularly important. By incorporating this parameter, models can provide more accurate assessments of human thermal discomfort and adaptation strategies in these environments.
Furthermore, through such comprehensive consideration, the research will not only enhance our understanding of urban micro-climates but also contribute to optimizing urban thermal environments for improved quality of life. Based on the existing empirical index, a more appropriate formula for assessing human thermal comfort levels in a specific region can be formulated, or the local comfort level grade intervals can be modified to align with subjective comfort perceptions and establish objective mechanistic models.

5. Conclusions

This study monitored the meteorological factors such as air temperature, relative humidity, and wind speed in different urban green space types. Seasonal variation patterns of meteorological factors were consistent in urban green spaces and CK, but the occurrence time of extreme values was slightly different. The air temperature was the highest in summer, followed by autumn, and the lowest in winter. The daily variation trend was in an inverted “U” shape, and the time of occurrence of the highest temperature in winter was later than that in other seasons. The relative humidity in urban green spaces and CK in spring was significantly lower than that in other seasons. The daily variation curves in spring, summer, and autumn were roughly “U”-shaped, while in winter they were “W”-shaped, which was opposite to the trend of air temperature variation. There was no significant difference in relative humidity between urban green spaces and CK in the same season. The average wind speed between different urban green space types and CK was significantly different. The average wind speed of CK in different seasons was significantly higher than that of urban green space types. The average wind speed in urban green space types was higher in spring than in other seasons.
The seasonal evaluations of the human comfort index derived from the HCILU and HCICMA methods were similar. The diurnal variation trends of the two evaluation methods were different. Except for summer, the diurnal variation pattern of the HCILU was basically a decline followed by a rise. The diurnal variation trend of HCICMA was roughly fluctuating and rising in spring and summer. The correlation between HCICMA and meteorological factors was more significant than HCILU. The consistently higher AUC value of HCICMA compared to HCILU across different seasons demonstrates its superiority in predicting the human comfort index of urban green spaces within the study area.

Author Contributions

Conceptualization: H.B. and Y.S.; methodology, Y.S.; software, Y.S.; validation, H.B., L.G. and K.N.; formal analysis, H.B.; investigation, X.Y.; resources, K.N.; data curation, H.B. and Y.S.; writing—original draft preparation, H.B. and Y.S.; writing—review and editing, H.Y.; visualization, X.Y.; supervision, H.B.; project administration, H.B.; funding acquisition, H.B. All authors have read and agreed to the published version of the manuscript.

Funding

This research was funded by The Youth Teacher Research Capacity Enhancement Fund Project of the Basic Research Business Expenses of Universities under the Direct Administration of the Inner Mongolia Autonomous Region, grant number BR220132, project title: Research on the Mechanism of Leaf Water Potential Affecting Dust Retention of Urban Garden Trees in Typical Northern Cities.

Institutional Review Board Statement

Not applicable.

Informed Consent Statement

Not applicable.

Data Availability Statement

The data in this study are available from the corresponding author upon request.

Acknowledgments

The field-based experiment was established and maintained with the help of all team members. Many thanks to all of them. Thank you to the reviewers for helpful comments and suggestions, which improved this article.

Conflicts of Interest

The authors declare no conflicts of interest.

References

  1. Givoni, B.; Noguchi, M.; Saaroni, H.; Pochter, O.; Yaacov, Y.; Feller, N.; Becker, S. Outdoor comfort research issues. Energy Build. 2003, 35, 77–86. [Google Scholar] [CrossRef]
  2. Nikolopoulou, M.; Lykoudis, S. Use of outdoor spaces and microclimate in a Mediterranean urban area. Build. Environ. 2007, 42, 3691–3707. [Google Scholar] [CrossRef]
  3. Yan, Y.C.; Yue, S.P.; Liu, X.H.; Wang, D.D.; Chen, H. Advances in assessment of bioclimatic comfort conditions at home and abroad. Adv. Earth Sci. 2013, 28, 1119–1125. [Google Scholar]
  4. Wang, Y.; Bakker, F.; De Groot, R.; Wörtche, H. Effect of ecosystem services provided by urban green infrastructure on indoor environment: A literature review. Build. Environ. 2014, 77, 88–100. [Google Scholar] [CrossRef]
  5. Breuste, J.; Artmann, M.; Li, J.; Xie, M. Special issue on green infrastructure for urban sustainability. J. Urban Plan. Dev. 2015, 141, A2015001. [Google Scholar] [CrossRef]
  6. Flohr, T.; Heris, M.; Derycke, E. An ENVI-met Simulation Data Pipeline for Evaluating Urban Tree Patterns Impact on Urban Micro-climate. J. Digit. Landsc. Archit. 2022, 2022, 538–548. [Google Scholar]
  7. Coccolo, S.; Kämpf, J.; Scartezzini, J.; Pearlmutter, D. Outdoor human comfort and thermal stress: A comprehensive review on models and standards. Urban Clim. 2016, 18, 33–57. [Google Scholar] [CrossRef]
  8. Javadi, R.; Nasrollahi, N. Urban green space and health: The role of thermal comfort on the health benefits from the urban green space; a review study. Build. Environ. 2021, 202, 108039. [Google Scholar] [CrossRef]
  9. Wang, Y.; Bakker, F.; de Groot, R.; Wörtche, H.; Leemans, R. Effects of urban green infrastructure (UGI) on local outdoor microclimate during the growing season. Environ. Monit. Assess. 2015, 187, 732. [Google Scholar] [CrossRef]
  10. Quadros, B.M.; Mizgier, M.G.O. Urban green infrastructures to improve pedestrian thermal comfort: A systematic review. Urban For. Urban Green. 2023, 88, 128091. [Google Scholar] [CrossRef]
  11. Lin, T.; Matzarakis, A.; Hwang, R. Shading effect on long-term outdoor thermal comfort. Build. Environ. 2010, 45, 213–221. [Google Scholar] [CrossRef]
  12. Yu, G.; Schwartz, Z.; Walsh, J.E. A weather-resolving index for assessing the impact of climate change on tourism related climate resources. Clim. Change 2009, 95, 551–573. [Google Scholar] [CrossRef]
  13. Yau, Y.H.; Toh, H.S.; Chew, B.T.; Nik Ghazali, N.N. A review of human thermal comfort model in predicting human–environment interaction in non-uniform environmental conditions. J. Therm. Anal. Calorim. 2022, 147, 14739–14763. [Google Scholar] [CrossRef] [PubMed]
  14. Park, M.; Hagishima, A.; Tanimoto, J.; Narita, K. Effect of urban vegetation on outdoor thermal environment: Field measurement at a scale model site. Build. Environ. 2012, 56, 38–46. [Google Scholar] [CrossRef]
  15. Coccolo, S.; Mauree, D.; Naboni, E.; Kaempf, J.; Scartezzini, J.L. On the impact of the wind speed on the outdoor human comfort: A sensitivity analysis. Energy Procedia 2017, 122, 481–486. [Google Scholar] [CrossRef]
  16. Cohen, P.; Potchter, O.; Matzarakis, A. Daily and seasonal climatic conditions of green urban open spaces in the Mediterranean climate and their impact on human comfort. Build. Environ. 2012, 51, 285–295. [Google Scholar] [CrossRef]
  17. Lin, J.; Kroll, C.N.; Nowak, D.J.; Greenfield, E.J. A review of urban forest modeling: Implications for management and future research. Urban For. Urban Green. 2019, 43, 126366. [Google Scholar] [CrossRef]
  18. Al-Saadi, L.M.; Jaber, S.H.; Al-Jiboori, M.H. Variation of urban vegetation cover and its impact on minimum and maximum heat islands. Urban Clim. 2020, 34, 100707. [Google Scholar] [CrossRef]
  19. Sodoudi, S.; Zhang, H.; Chi, X.; Müller, F.; Li, H. The influence of spatial configuration of green areas on microclimate and thermal comfort. Urban For. Urban Green. 2018, 34, 85–96. [Google Scholar] [CrossRef]
  20. Sun, F.; Zhang, J.; Takeda, S.; Cui, J.; Yang, R. Vertical Plant Configuration: Its Impact on Microclimate and Thermal Comfort in Urban Small Green Spaces. Land 2024, 13, 1715. [Google Scholar] [CrossRef]
  21. Xu, H.; Zheng, G.; Lin, X.; Jin, Y. Study on the Microclimatic Effects of Plant-Enclosure Conditions and Water–Green Space Ratio on Urban Waterfront Spaces in Summer. Sustainability 2024, 16, 2957. [Google Scholar] [CrossRef]
  22. Lu, D.H.; Wu, Z.W.; Zhang, Q.Q.; Li, L.; Yu, G.H.; Gong, H.N. Benefits of Zhang Jia Jie national forest park. J. Cent.-South For. Coll. 1985, 2, 160–170. [Google Scholar]
  23. Yao, X.; Zhang, M.; Zhang, Y.; Xiao, H.; Wang, J. Research on evaluation of climate comfort in northwest China under climate change. Sustainability 2021, 13, 10111. [Google Scholar] [CrossRef]
  24. Liu, Q.; Lin, L.; Deng, H.; Zheng, Y.; Hu, Z. The index of clothing for assessing tourism climate comfort: Development and application. Front. Environ. Sci. 2023, 10, 992503. [Google Scholar] [CrossRef]
  25. QX/T570-2020; Climate Resource Assessment-Climate Livable Cities. China Meteorological Administration: Beijing, China, 2020.
  26. Satir, O.; Berberoglu, S.; Donmez, C. Mapping regional forest fire probability using artificial neural network model in a Mediterranean forest ecosystem. Geomat. Nat. Hazards Risk 2016, 7, 1645–1658. [Google Scholar] [CrossRef]
  27. Greiner, M.; Pfeiffer, D.; Smith, R.D. Principles and practical application of the receiver-operating characteristic analysis for diagnostic tests. Prev. Vet. Med. 2000, 45, 23–41. [Google Scholar] [CrossRef]
  28. Ali, S.B.; Patnaik, S. Thermal comfort in urban open spaces: Objective assessment and subjective perception study in tropical city of Bhopal, India. Urban Clim. 2018, 24, 954–967. [Google Scholar] [CrossRef]
  29. de Abreu-Harbich, L.V.; Labaki, L.C.; Matzarakis, A. Effect of tree planting design and tree species on human thermal comfort in the tropics. Landsc. Urban Plan 2015, 138, 99–109. [Google Scholar] [CrossRef]
  30. Nicol, F. Adaptive thermal comfort standards in the hot–humid tropics. Energy Build. 2004, 36, 628–637. [Google Scholar] [CrossRef]
  31. Lai, D.; Liu, Y.; Liao, M.; Yu, B. Effects of different tree layouts on outdoor thermal comfort of green space in summer Shanghai. Urban Clim. 2023, 47, 101398. [Google Scholar] [CrossRef]
  32. Johansson, E.; Emmanuel, R. The influence of urban design on outdoor thermal comfort in the hot, humid city of Colombo, Sri Lanka. Int. J. Biometeorol. 2006, 51, 119–133. [Google Scholar] [CrossRef] [PubMed]
  33. Walton, D.; Dravitzki, V.; Donn, M. The relative influence of wind, sunlight and temperature on user comfort in urban outdoor spaces. Build. Environ. 2007, 42, 3166–3175. [Google Scholar] [CrossRef]
  34. Ghasemi, Z.; Esfahani, M.A.; Bisadi, M. Promotion of urban environment by consideration of human thermal & wind comfort: A literature review. Procedia-Soc. Behav. Sci. 2015, 201, 397–408. [Google Scholar]
  35. Penwarden, A.D. Acceptable wind speeds in towns. Build. Sci. 1973, 8, 259–267. [Google Scholar] [CrossRef]
  36. Andrade, H.; Alcoforado, M.; Oliveira, S. Perception of temperature and wind by users of public outdoor spaces: Relationships with weather parameters and personal characteristics. Int. J. Biometeorol. 2011, 55, 665–680. [Google Scholar] [CrossRef]
  37. Minjie, D.; Yuerong, W.; Jing, L. Comprehensive evaluation of ecological health functions of green space in Beijing Purple Bamboo Park. Chin. J. Ecol. 2017, 36, 1973–1983. [Google Scholar]
  38. Quan, M.; Wu, J.; Nan, H.; Gong, M. Study on the Effect of Physical and Mental Health on Different Forest Environments in Summer. Adv. Psychol. 2020, 10, 886–896. [Google Scholar] [CrossRef]
  39. Movahedi, F.; Padman, R.; Antaki, J.F. Limitations of receiver operating characteristic curve on imbalanced data: Assist device mortality risk scores. J. Thorac. Cardiovasc. Surg. 2023, 165, 1433–1442. [Google Scholar] [CrossRef]
  40. Majnik, M.; Bosnić, Z. ROC analysis of classifiers in machine learning: A survey. Intell. Data Anal. 2013, 17, 531–558. [Google Scholar] [CrossRef]
  41. Fawcett, T. An introduction to ROC analysis. Pattern Recognit. Lett. 2006, 27, 861–874. [Google Scholar] [CrossRef]
  42. Perini, K.; Magliocco, A. Effects of vegetation, urban density, building height, and atmospheric conditions on local temperatures and thermal comfort. Urban For. Urban Green. 2014, 13, 495–506. [Google Scholar] [CrossRef]
  43. He, S.; Zhang, C.; Meng, F.; Bourque, C.P.; Huang, Z.; Li, X.; Han, Y.; Feng, S.; Miao, L.; Liu, C. Vegetation-cover control of between-site soil temperature evolution in a sandy desertland. Sci. Total Environ. 2024, 908, 168372. [Google Scholar] [CrossRef] [PubMed]
  44. Jiang, J.; Irga, P.; Coe, R.; Gibbons, P. Effects of indoor plants on CO2 concentration, indoor air temperature and relative humidity in office buildings. PLoS ONE 2024, 19, e305956. [Google Scholar] [CrossRef] [PubMed]
  45. Mohamed, N.E.; Mustafa, A.A.; Bedawy, I.M.; Ahmed, A.S.; Abdelsamie, E.A.; Mohamed, E.S.; Rebouh, N.Y.; Shokr, M.S. Utilizing Infrared Thermometry to Assess the Crop Water Stress Index of Wheat Genotypes in Arid Regions under Varying Irrigation Regimes. Agronomy 2024, 14, 1814. [Google Scholar] [CrossRef]
  46. Lopez-Cabeza, V.P.; Loor-Vera, M.J.; Diz-Mellado, E.; Rivera-Gomez, C.; Galan-Marin, C. Decoding outdoor thermal comfort: The role of location in urban canyon microclimate. Sustain. Energy Technol. Assess. 2024, 72, 104095. [Google Scholar] [CrossRef]
  47. Zhang, L.; Zhan, Q.; Lan, Y. Effects of the tree distribution and species on outdoor environment conditions in a hot summer and cold winter zone: A case study in Wuhan residential quarters. Build. Environ. 2018, 130, 27–39. [Google Scholar] [CrossRef]
  48. Zhang, S.; Yuan, W.; Yu, Y.; Zhang, Y.; Wang, W.; Wang, L.; Yang, Y.; Wang, H. Shrubs plays an important role in configuration of shelterbelt in windy and sandy areas. Front. Ecol. Evol. 2024, 12, 1347714. [Google Scholar] [CrossRef]
  49. Butenschoen, O.; Scheu, S.; Eisenhauer, N. Interactive effects of warming, soil humidity and plant diversity on litter decomposition and microbial activity. Soil Biol. Biochem. 2011, 43, 1902–1907. [Google Scholar] [CrossRef]
  50. Zhang, Z.; Lv, Y.; Pan, H. Cooling and humidifying effect of plant communities in subtropical urban parks. Urban For. Urban Green. 2013, 12, 323–329. [Google Scholar] [CrossRef]
  51. Pan, J.B.; Dong, L. Evaluation of air negative ions concentration in urban green space:A case study in Beijing Olympic Forest Park. Chin. J. Ecol. 2010, 29, 1881–1886. [Google Scholar]
  52. Ganot, Y.; Dragila, M.I.; Weisbrod, N. Impact of thermal convection on air circulation in a mammalian burrow under arid conditions. J. Arid Environ. 2012, 84, 51–62. [Google Scholar] [CrossRef]
  53. Lydia, M.; Kumar, S.S.; Selvakumar, A.I.; Kumar, G.E.P. Linear and non-linear autoregressive models for short-term wind speed forecasting. Energy Convers. Manag. 2016, 112, 115–124. [Google Scholar] [CrossRef]
  54. Song, Y.; Mao, F.; Liu, Q. Human comfort in indoor environment: A review on assessment criteria, data collection and data analysis methods. IEEE Access 2019, 7, 119774–119786. [Google Scholar] [CrossRef]
  55. Su, X.; Yuan, Y.; Wang, Z.; Liu, W.; Lan, L.; Lian, Z. Human thermal comfort in non-uniform thermal environments: A review. Energy Built Environ. 2024, 5, 853–862. [Google Scholar] [CrossRef]
  56. Nakamura, M.; Yoda, T.; Crawshaw, L.I.; Yasuhara, S.; Saito, Y.; Kasuga, M.; Nagashima, K.; Kanosue, K. Regional differences in temperature sensation and thermal comfort in humans. J. Appl. Physiol. 2008, 105, 1897–1906. [Google Scholar] [CrossRef]
  57. Lucena, R.L.; de Freitas Santos, T.H.; Ferreira, A.M.; Steinke, E.T. Heat and human comfort in a town in Brazil’s semi-arid region. Int. J. Clim. Chang. Impacts Responses 2016, 8, 15. [Google Scholar] [CrossRef]
  58. Li, J.; Zhou, K.; Zhang, D.; Pubu, D.; Zhang, W.; Shi, J. Spatial and temporal variation characteristics of comfort index of human body in Xizang Plateau. Arid Land Geogr. 2024, 47, 980–992. [Google Scholar]
  59. Pantavou, K.; Lykoudis, S.; Nikolopoulou, M.; Tsiros, I.X. Correction to: Thermal sensation and climate: A comparison of UTCI and PET thresholds in different climates. Int. J. Biometeorol. 2020, 64, 301. [Google Scholar] [CrossRef]
  60. Aghamolaei, R.; Azizi, M.M.; Aminzadeh, B.; O Donnell, J. A comprehensive review of outdoor thermal comfort in urban areas: Effective parameters and approaches. Energy Environ. 2023, 34, 2204–2227. [Google Scholar] [CrossRef]
  61. Shooshtarian, S.; Lam, C.K.C.; Kenawy, I. Outdoor thermal comfort assessment: A review on thermal comfort research in Australia. Build. Environ. 2020, 177, 106917. [Google Scholar] [CrossRef]
  62. Yang, Z.; Zhang, W.; Qin, M.; Liu, H. Comparative study of indoor thermal environment and human thermal comfort in residential buildings among cities, towns, and rural areas in arid regions of China. Energy Build. 2022, 273, 112373. [Google Scholar] [CrossRef]
  63. Lei, Y.N.; Zhang, X.; Zhao, X.M. Spatial-temporal distribution characteristics of comfort index of human body in Shaanxi Province from 1971 to 2018. Arid Land Geogr. 2020, 43, 1417–1425. [Google Scholar]
  64. Zheng, Q.Z.; He, J.; Li, S.Z.; Deng, C.Z.; Wu, Z.P.; Huang, X.L.; Wu, X. Analysis on the differences and influencing factors of human comfort between urban and rural areas in Chongqing. Ecol. Environ. Sci. 2023, 32, 1089–1097. [Google Scholar]
  65. Chen, L.; Yan, F.; Fan, S.; Wu, Y.; Yang, J.; Yang, H.; Huang, C. The effects of short-term light exposure on subjective affect and comfort are dependent on the lighting time of day. Sci. Rep. 2021, 11, 2604. [Google Scholar] [CrossRef]
  66. Xu, M.; Hong, B.; Mi, J.; Yan, S. Outdoor thermal comfort in an urban park during winter in cold regions of China. Sustain. Cities Soc. 2018, 43, 208–220. [Google Scholar] [CrossRef]
  67. Feng, S.H.; Gong, D.Y.; Zhang, Z.Y.; He, X.Z.; Guo, D.; Lei, Y.N. Wind-Chill Temperature Changes in Winter over China during the Last 50 Years. Acta Geogr. Sin. 2009, 64, 1071–1082. [Google Scholar]
Figure 1. Seasonal variations in air temperature among different urban green space types. Note: Capital letters indicate significant differences among sites in the same season (p < 0.05); lowercase letters indicate significant differences among seasons at the same site (p < 0.05). “S1” stands for “Deciduous broad-leaved sparse forest”, “S2” stands for “Deciduous broad-leaved dense forest”, “S3” stands for “Deciduous broad-leaved and evergreen needle dense mixed forest”, and “S4” stands for “Deciduous broad-leaved and evergreen needle sparse mixed forest”.
Sustainability 17 04671 g001
Figure 2. Diurnal variation in air temperature in different urban green space types.
Sustainability 17 04671 g002
Figure 3. Seasonal variation in relative humidity in different urban green space types. Note: Capital letters indicate significant differences among sites in the same season (p < 0.05); lowercase letters indicate significant differences among seasons at the same site (p < 0.05).
Sustainability 17 04671 g003
Figure 4. Daily variation in relative humidity in different urban green space types.
Sustainability 17 04671 g004
Figure 5. Seasonal variation in wind speed in different urban green space types. Note: Capital letters indicate significant differences among sites in the same season (p < 0.05); lowercase letters indicate significant differences among seasons at the same site (p < 0.05).
Sustainability 17 04671 g005
Figure 6. Diurnal variation in wind speed in different urban green space types.
Sustainability 17 04671 g006
Figure 7. Daily variation in human comfort index calculated using Lu’s method (HCILu) for different urban green space types.
Sustainability 17 04671 g007
Figure 8. Daily variation in the human comfort index calculated using HCICMA for different urban green space types.
Sustainability 17 04671 g008
Table 1. Overview of monitoring site characteristics.
Types of Urban Green SpaceDominant Plant SpeciesMean Height (m)Mean DBH (cm)
Deciduous broad-leaved sparse forest (S1)Fraxinus chinensis5.2 ± 0.3717.5 ± 0.65
Prunus cerasifera ‘Atropurpurea’2.7 ± 0.3310.3 ± 0.62
Sophora japonica Linn.6.1 ± 0.2813.6 ± 0.55
Catalpa ovata6.2 ± 0.2215.4 ± 0.54
Sophora japonica Linn.6.7 ± 0.3818.8 ± 0.46
Deciduous broad-leaved dense forest (S2)Fraxinus chinensis5.2 ± 0.3717.5 ± 0.65
Euonymus maackii2.4 ± 0.314.5 ± 0.21
Prunus cerasifera ‘Atropurpurea’2.7 ± 0.337.3 ± 0.22
Sophora japonica Linn.6.1 ± 0.2810.5 ± 0.14
Ulmus pumila5.9 ± 0.3817.7 ± 0.21
Salix matsudana8.9 ± 0.3116.3 ± 0.22
Malus spectabilis2.9 ± 0.358.5 ± 0.14
Deciduous broad-leaved and evergreen needle dense mixed forest (S3)Fraxinus chinensis5.2 ± 0.3717.5 ± 0.65
Styphnolobium japonicum Linn.6.1 ± 0.2810.5 ± 0.14
Catalpa ovata6.2 ± 0.2215.4 ± 0.54
Ulmus pumila5.9 ± 0.3817.7 ± 0.21
Populus alba var. pyramidalis15.9 ± 0.3124.5 ± 0.19
Firmiana simplex (Linnaeus)8.9 ± 0.3131.5 ± 0.24
Salix matsudana2.4 ± 0.3216.5 ± 0.23
Prunus padus4.6 ± 0.2821.5 ± 0.17
Betula platyphylla10.9 ± 0.3322.5 ± 0.17
Juniperus chinensis9.1 ± 0.4125.5 ± 0.25
Picea asperata Mast.11.9 ± 0.2429.6 ± 0.23
Pinus11.4 ± 0.2628.7 ± 0.27
Deciduous broad-leaved and evergreen needle sparse mixed forest (S4)Fraxinus chinensis5.2 ± 0.3717.5 ± 0.65
Prunus cerasifera ‘Atropurpurea’2.7 ± 0.337.3 ± 0.22
Sophora japonica Linn.6.1 ± 0.2810.5 ± 0.14
Malus spectabilis2.9 ± 0.3516.3 ± 0.22
Firmiana simplex (Linnaeus)2.4 ± 0.3216.5 ± 0.23
Prunus padus L.4.6 ± 0.2821.5 ± 0.17
Betula platyphylla Sukaczev10.9 ± 0.3322.5 ± 0.23
Juniperus formosana Hayata9.1 ± 0.4125.5 ± 0.25
Picea asperata Mast.11.9 ± 0.2429.6 ± 0.23
Pinus11.4 ± 0.2628.7 ± 0.27
Control sites (CK)Road edge--
Table 2. Levels of human comfort determined by the human comfort index of HCILu.
LevelsRange of HCILuDescription of Thermal Human Comfort
IHCILu ≤ 4.55Comfortable
II4.56 ≤ HCILu ≤ 6.95Less comfortable
III6.96 ≤ HCILu ≤ 9.00Uncomfortable
IVHCILu > 9.00Extremely uncomfortable
Table 3. Human comfort levels according to the index rating based on the method of HCICMA.
LevelsRange of HCICMADescription of Thermal Human Comfort
IHCICMA ≤ 25Cold, uncomfortable
II26 ≤ HCICMA ≤ 38Cool, most people are uncomfortable
III39 ≤ HCICMA ≤ 50Cool and refreshing, a few people are uncomfortable
IV51 ≤ HCICMA ≤ 58Slightly cool, comfortable for most people
V59 ≤ HCICMA ≤ 70Most comfortable
VI71 ≤ HCICMA ≤ 75Warm, comfortable for most people
VII76 ≤ HCICMA ≤ 79Muggy, a few people are uncomfortable
VII80 ≤ HCICMA ≤ 85Hot, most people are uncomfortable
VIII86 ≤ HCICMA ≤ 89Scorching, uncomfortable
IXHCICMA ≥ 90Oppressively hot, extremely uncomfortable
Table 4. Seasonal variation in the human comfort index calculated using Lu’s method (HCILu) in urban green space types.
SiteSpringSummerAutumnWinter
HCILuLevelHCILuLevelHCILuLevelHCILuLevel
S18.62 ± 0.61 AbIII5.08 ± 0.76 AcII5.37 ± 0.64 AcII21.04 ± 0.63 AaIV
S28.85 ± 0.61 AbIII4.23 ± 0.51 AcI5.15 ± 0.52 AcII21.58 ± 1.15 AaIV
S38.47 ± 0.61 AbIII4.66 ± 0.54 AcII5.41 ± 0.54 AcII21.00 ± 0.62 AaIV
S48.28 ± 0.66 AbIII5.01 ± 0.61 AcII5.36 ± 0.53 AcII20.92 ± 0.60 AaIV
CK8.94 ± 0.76 AbIII4.95 ± 0.68 AcII5.09 ± 0.73 AcII20.85 ± 0.66 AaIV
Note: Capital letters indicate significant differences among sites in the same season (p < 0.05); lowercase letters indicate significant differences among seasons at the same site (p < 0.05).
Table 5. Daily variation in comfort level according to HCILu in different urban green space types.
SpringSummerAutumnWinter
S1S2S3S4CKS1S2S3S4CKS1S2S3S4CKS1S2S3S4CK
7:00IVIVIVIVIVIIIIIIIIIIIIIIIIIIIIVIVIVIVIV
8:00IVIVIVIVIVIIIIIIVIVIVIVIIIIVIVIVIVIV
9:00IVIVIVIIIIVIIIIIIIIIIIIIIIIIIVIVIVIVIV
10:00IVIVIIIIIIIVIIIIIIIIIIIIIIIIIIIIVIVIVIVIV
11:00IIIIIIIIIIIIIIIIIIIIIIIIIIIIIIIIIIVIVIVIVIV
12:00IIIIIIIIIIIIIIIIIIIIIIIIIIIIIIVIVIVIVIV
13:00IIIIIIIIIIIIIIIIIIIIIIIIIIIIIIIIIVIVIVIVIV
14:00IIIIIIIIIIIIIIIIIIIIIIIIIIIIIIIIIVIVIVIVIV
15:00IIIIIIIIIIIIIIIIIIIIIIIIIIIIIIIIVIVIVIVIV
16:00IIIIIIIIIIIIIIIIIIIIIIIIIIIVIVIVIVIV
17:00IIIIIIIIIIIIIIIIIIIIIIIIIIIIIIIVIVIVIVIV
18:00IIIIIIIIIIIIIIIIIIIIIIIIIIIIIIVIVIVIVIV
19:00IIIIIIIIIIIIIIIIIIIIIIIIIIIIIIIVIVIVIVIV
Table 6. Seasonal variation in HCICMA at different urban green space types.
SiteSpringSummerAutumnWinter
HCICMALevelHCICMALevelHCICMALevelHCICMALevel
S139.35 ± 3.07 BcIII62.63 ± 3.53 BCaV51.12 ± 2.62 BbIV16.91 ± 2.29 BCdI
S239.63 ± 2.54 BcIII60.38 ± 3.19 CaV53.83 ± 2.32 BbIV16.20 ± 2.17 CdI
S346.86 ± 2.75 AcIII65.56 ± 2.45 ABaV62.25 ±1.62 AbV19.80 ± 2.20 ABdI
S446.01 ± 2.61 AcIII69.49 ± 2.31 ABaV60.61 ±1.82 AbV20.59 ± 2.21 AdI
CK38.91 ± 4.26 BbIII54.98 ± 4.11 BaIV37.62 ±3.68 CbII8.53 ± 3.27 DcI
Note: Capital letters indicate significant differences among sites in the same season (p < 0.05); lowercase letters indicate significant differences among seasons at the same site (p < 0.05).
Table 7. Daily variation in comfort level according to HCICMA in urban green space types.
SpringSummerAutumnWinter
S1S2S3S4CKS1S2S3S4CKS1S2S3S4CKS1S2S3S4CK
7:00IIIIIIIIIIIVIVVVIIIIIIIIIIVIVIIIIIII
8:00IIIIIIIIIIIIVVVVIVIIIIIIIVIIIIIIIIII
9:00IIIIIIIIIIIVVVVIIVIIIIIVIVIIIIII
10:00IIIIIIVIIIIIIVVVVIIIVIVIVVVIIIIIII
11:00IIIIIIIIIIIIIIIVVVVIVIVIIIVVIIIIIII
12:00IIIIIIIVIIIIIIVVVVIIVIVIVVVIIIIIIII
13:00IIIIIIIVIIIIIIVVVVIVIVVVVIIIIIIII
14:00IIIIIIIIIIIIIVIIIVVIVIVIVVVIIIIIIII
15:00IIIIIIIIIIIIIVVVVIIVIVIVVVIIIIIIIII
16:00IIIIIIIIIIIIIVVIIVVVVIVVVVIIIIIIIIIII
17:00IIIIIIIIIIIIIIVVVIIVIVIVVVVIIIIIIIIIII
18:00IVIIIVIIIIVIVIVVVIIIIIVIVVVIIIIIIII
19:00IIIIIIVVIIIVVVVIIVIVIVVVIIIIIIII
Table 8. Correlations between human comfort indices and meteorological factors.
SeasonHCILuHCICMA
Air TemperatureRelative
Humidity
Wind SpeedAir TemperatureRelative
Humidity
Wind Speed
Spring−0.85 **0.325 **−0.0440.487 **0.004−0.810 **
Summer0.826 **−0.565 **−0.0090.469 **−0.111−0.568 **
Autumn−0.520 **0.457 **−0.0090.468 **−0.279 **−0.491 **
Winter−0.986 **−0.036−0.0930.316 **−0.532 **−0.755 **
Note: ** p < 0.01.
Table 9. Performance of different human comfort indices.
SeasonHCILuHCICMA
AUCp95% Confidence
Interval
AUCp95% Confidence
Interval
Spring0.4780.5810.394–0.5610.5930.0200.503–0.684
Summer0.4800.6140.395–0.5650.6670.0000.577–0.758
Autumn0.5920.0220.511–0.6730.9080.0000.867–0.950
Winter0.5190.6340.438–0.6000.7450.0000.672–0.818
Disclaimer/Publisher’s Note: The statements, opinions and data contained in all publications are solely those of the individual author(s) and contributor(s) and not of MDPI and/or the editor(s). MDPI and/or the editor(s) disclaim responsibility for any injury to people or property resulting from any ideas, methods, instructions or products referred to in the content.

