
Modeling the Ningbo Container Freight Index Through Deep Learning: Toward Sustainable Shipping and Regional Economic Resilience

Abstract
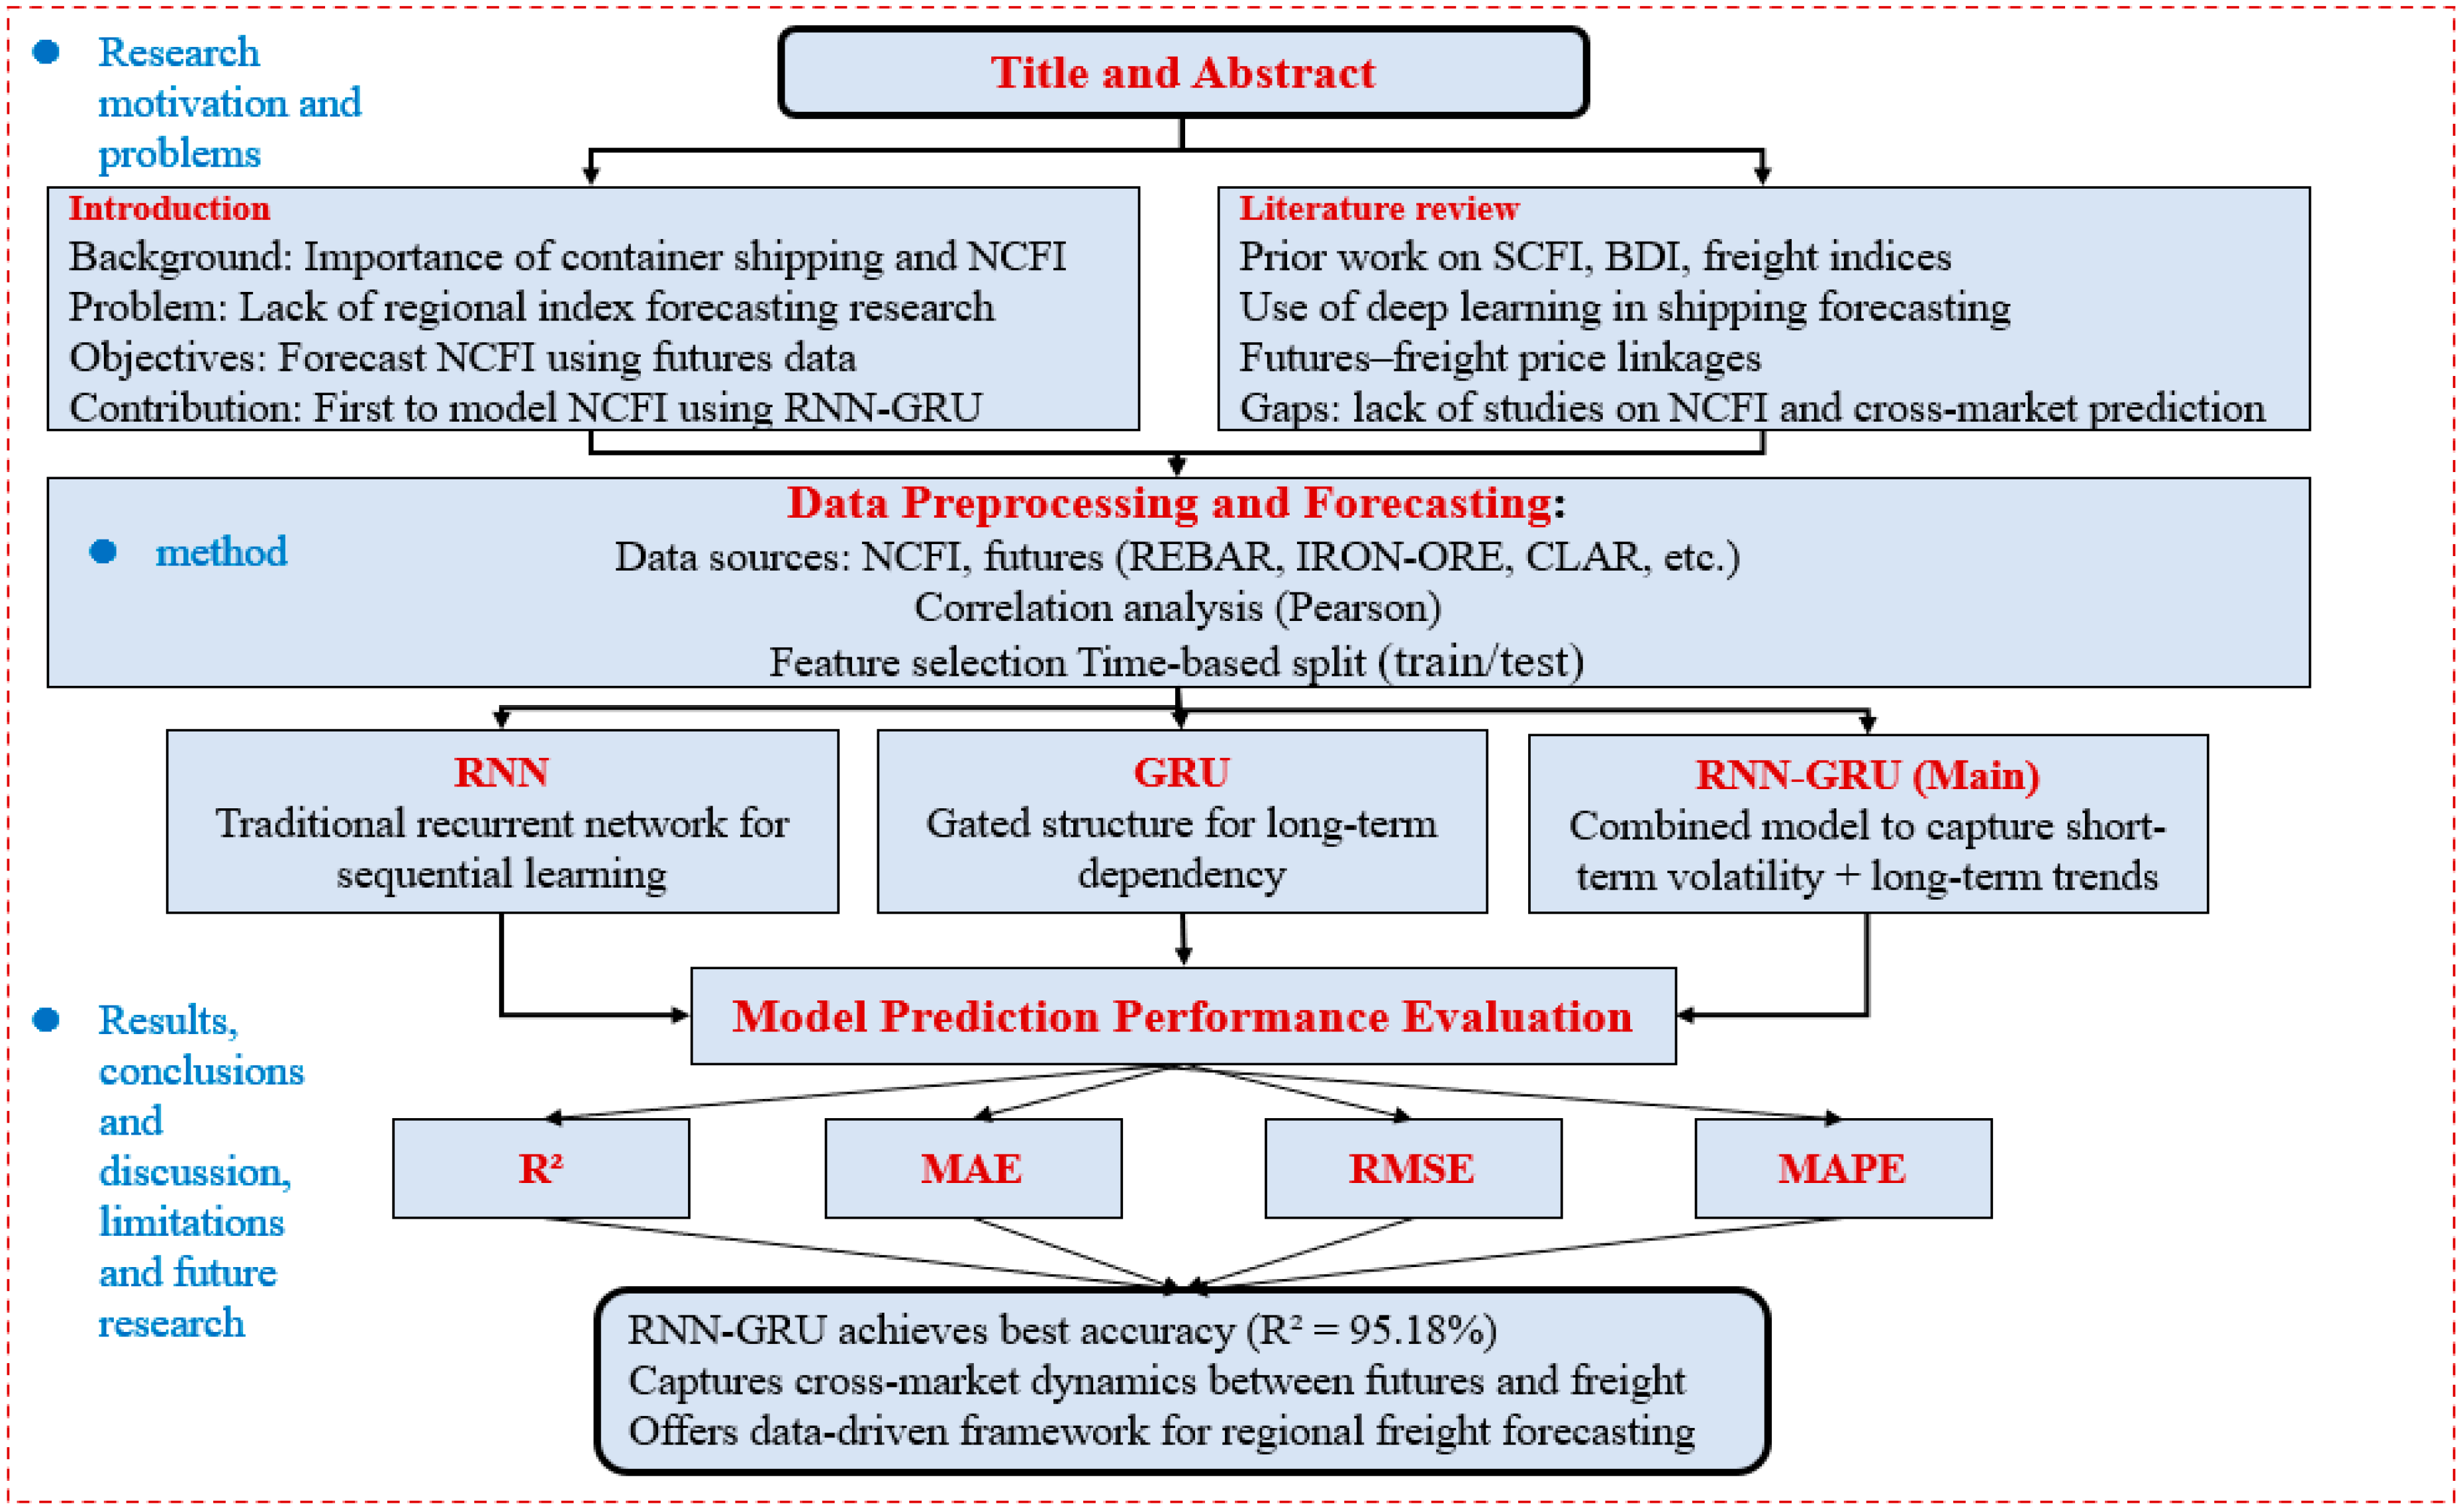
1. Introduction
- Which futures products or indicators effectively predict NCFI volatility trends?
- Which deep learning model best captures the dynamic, nonlinear, multivariate nature of NCFI forecasting?
2. Literature Review
2.1. The Application and Impact of the NCFI in Regional and Global Container Transport Markets
2.2. Linkage Between China’s Futures Market and the NCFI
Cross-Market Coupling: Structural Linkages Between Futures Prices and Shipping Freight Rates
2.3. Comparative Overview of Forecasting Models
3. Research Methods
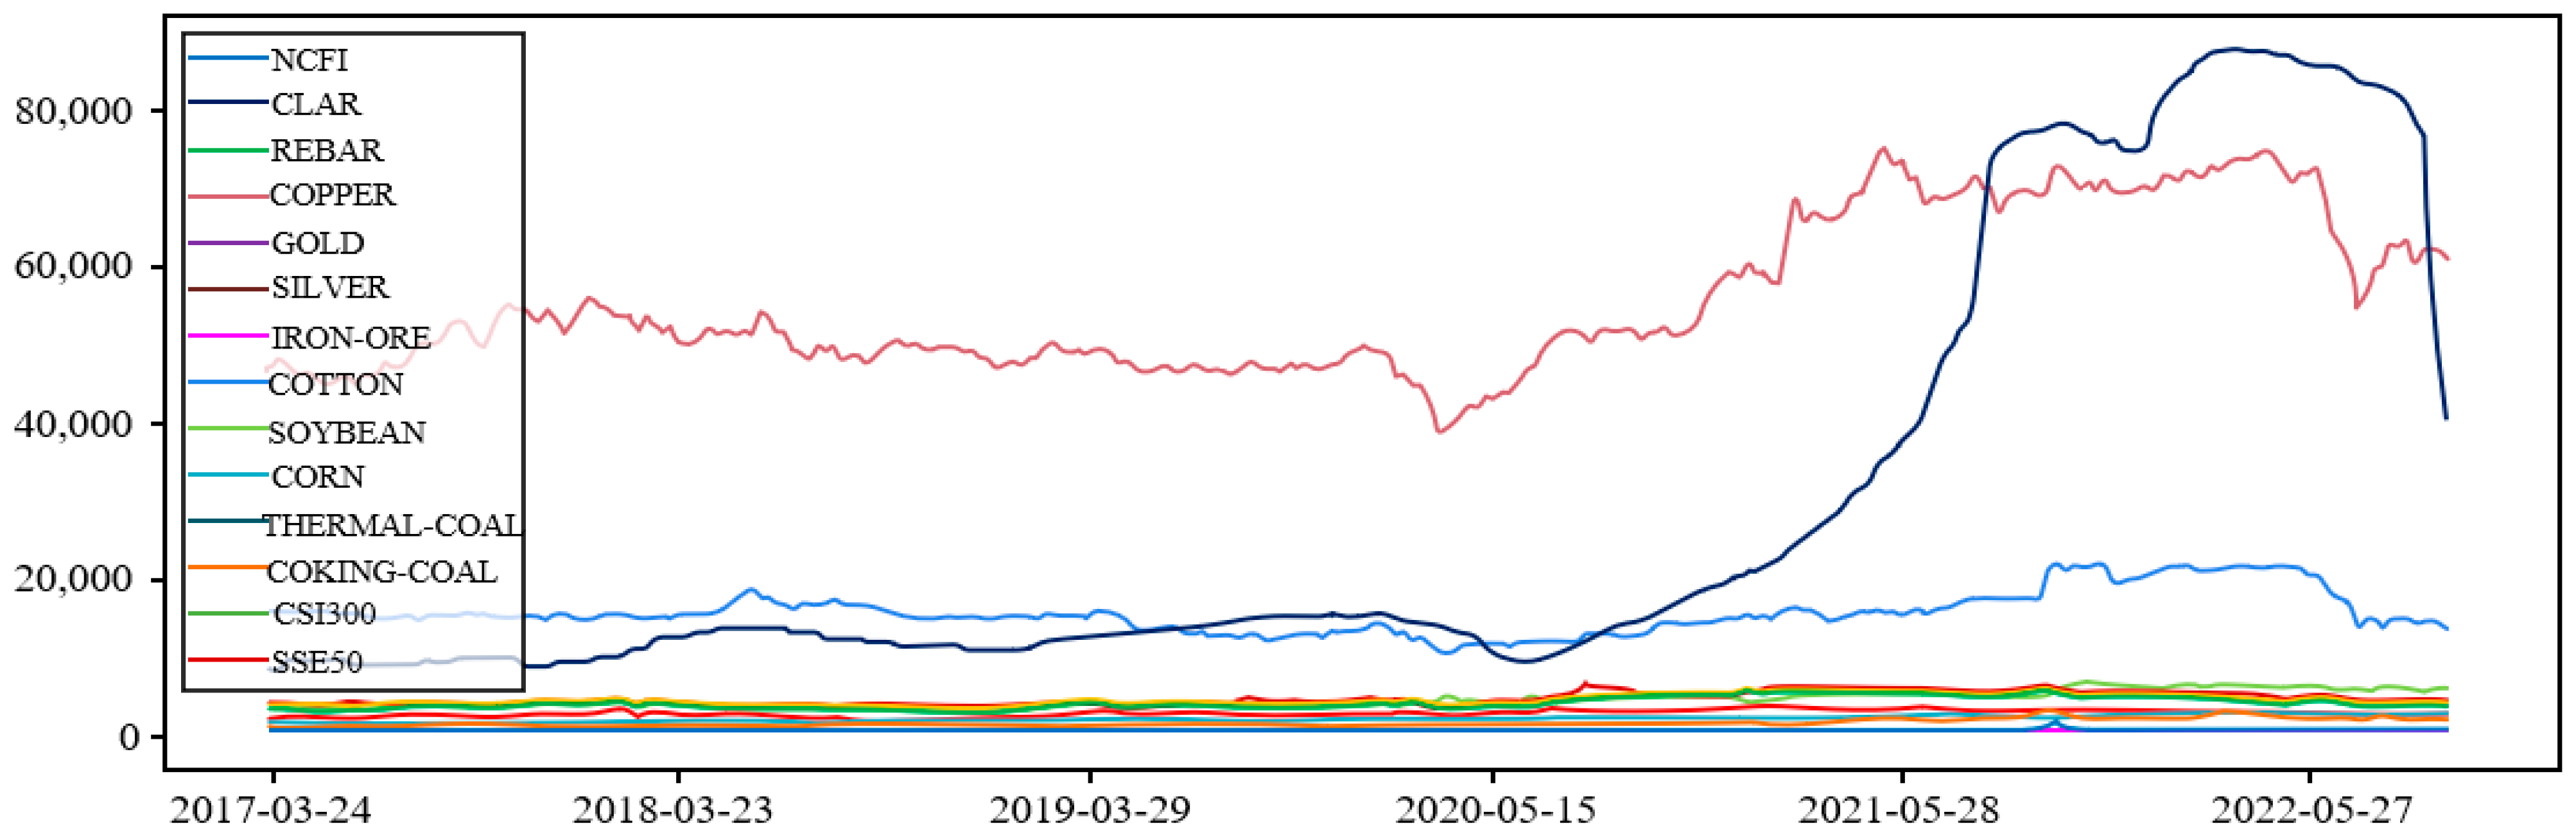
3.1. Data Overview
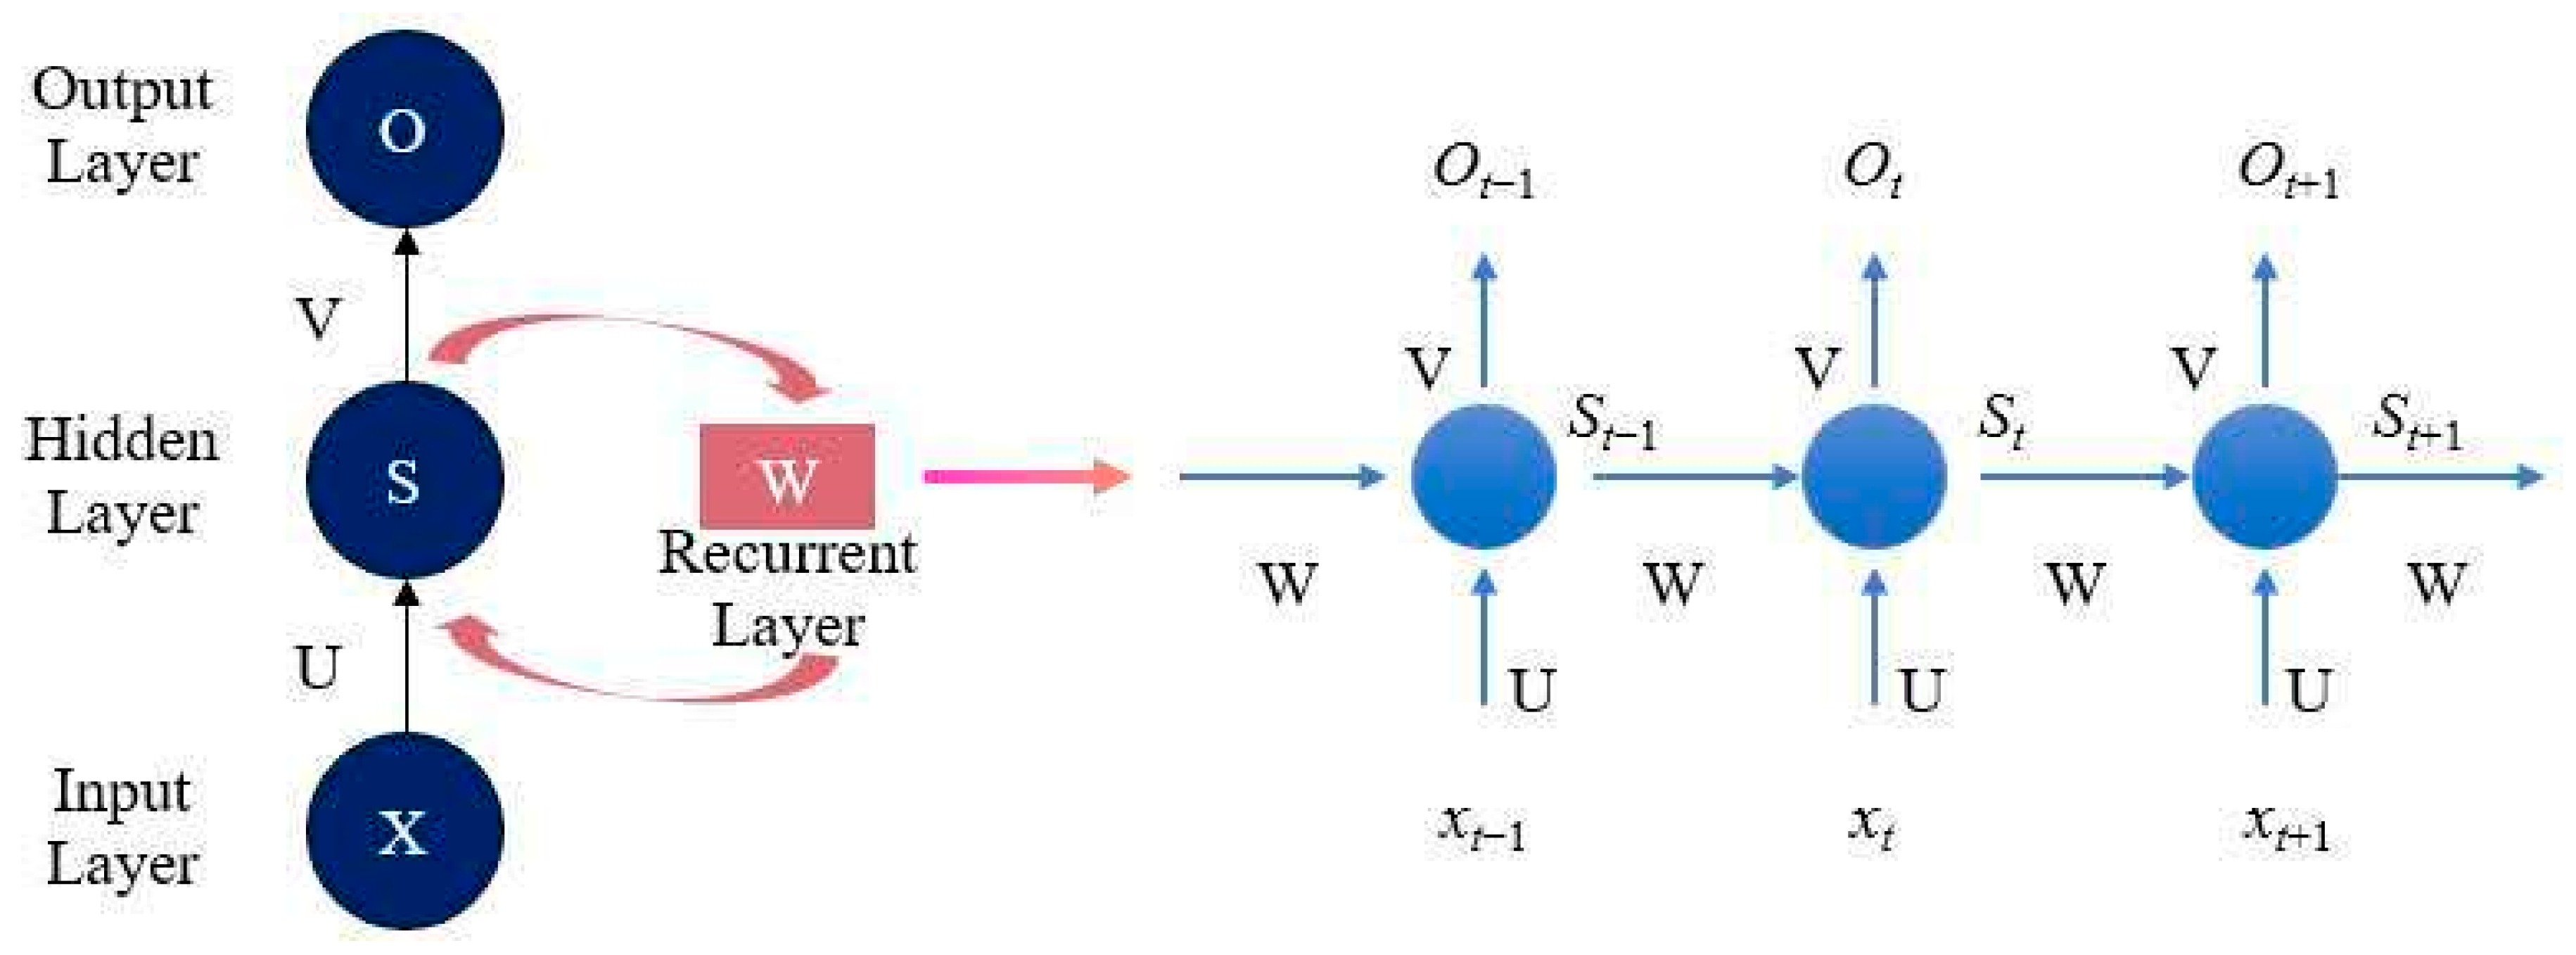
3.2. Model Construction and Architecture Design
3.2.1. RNN Model
3.2.2. GRU Model
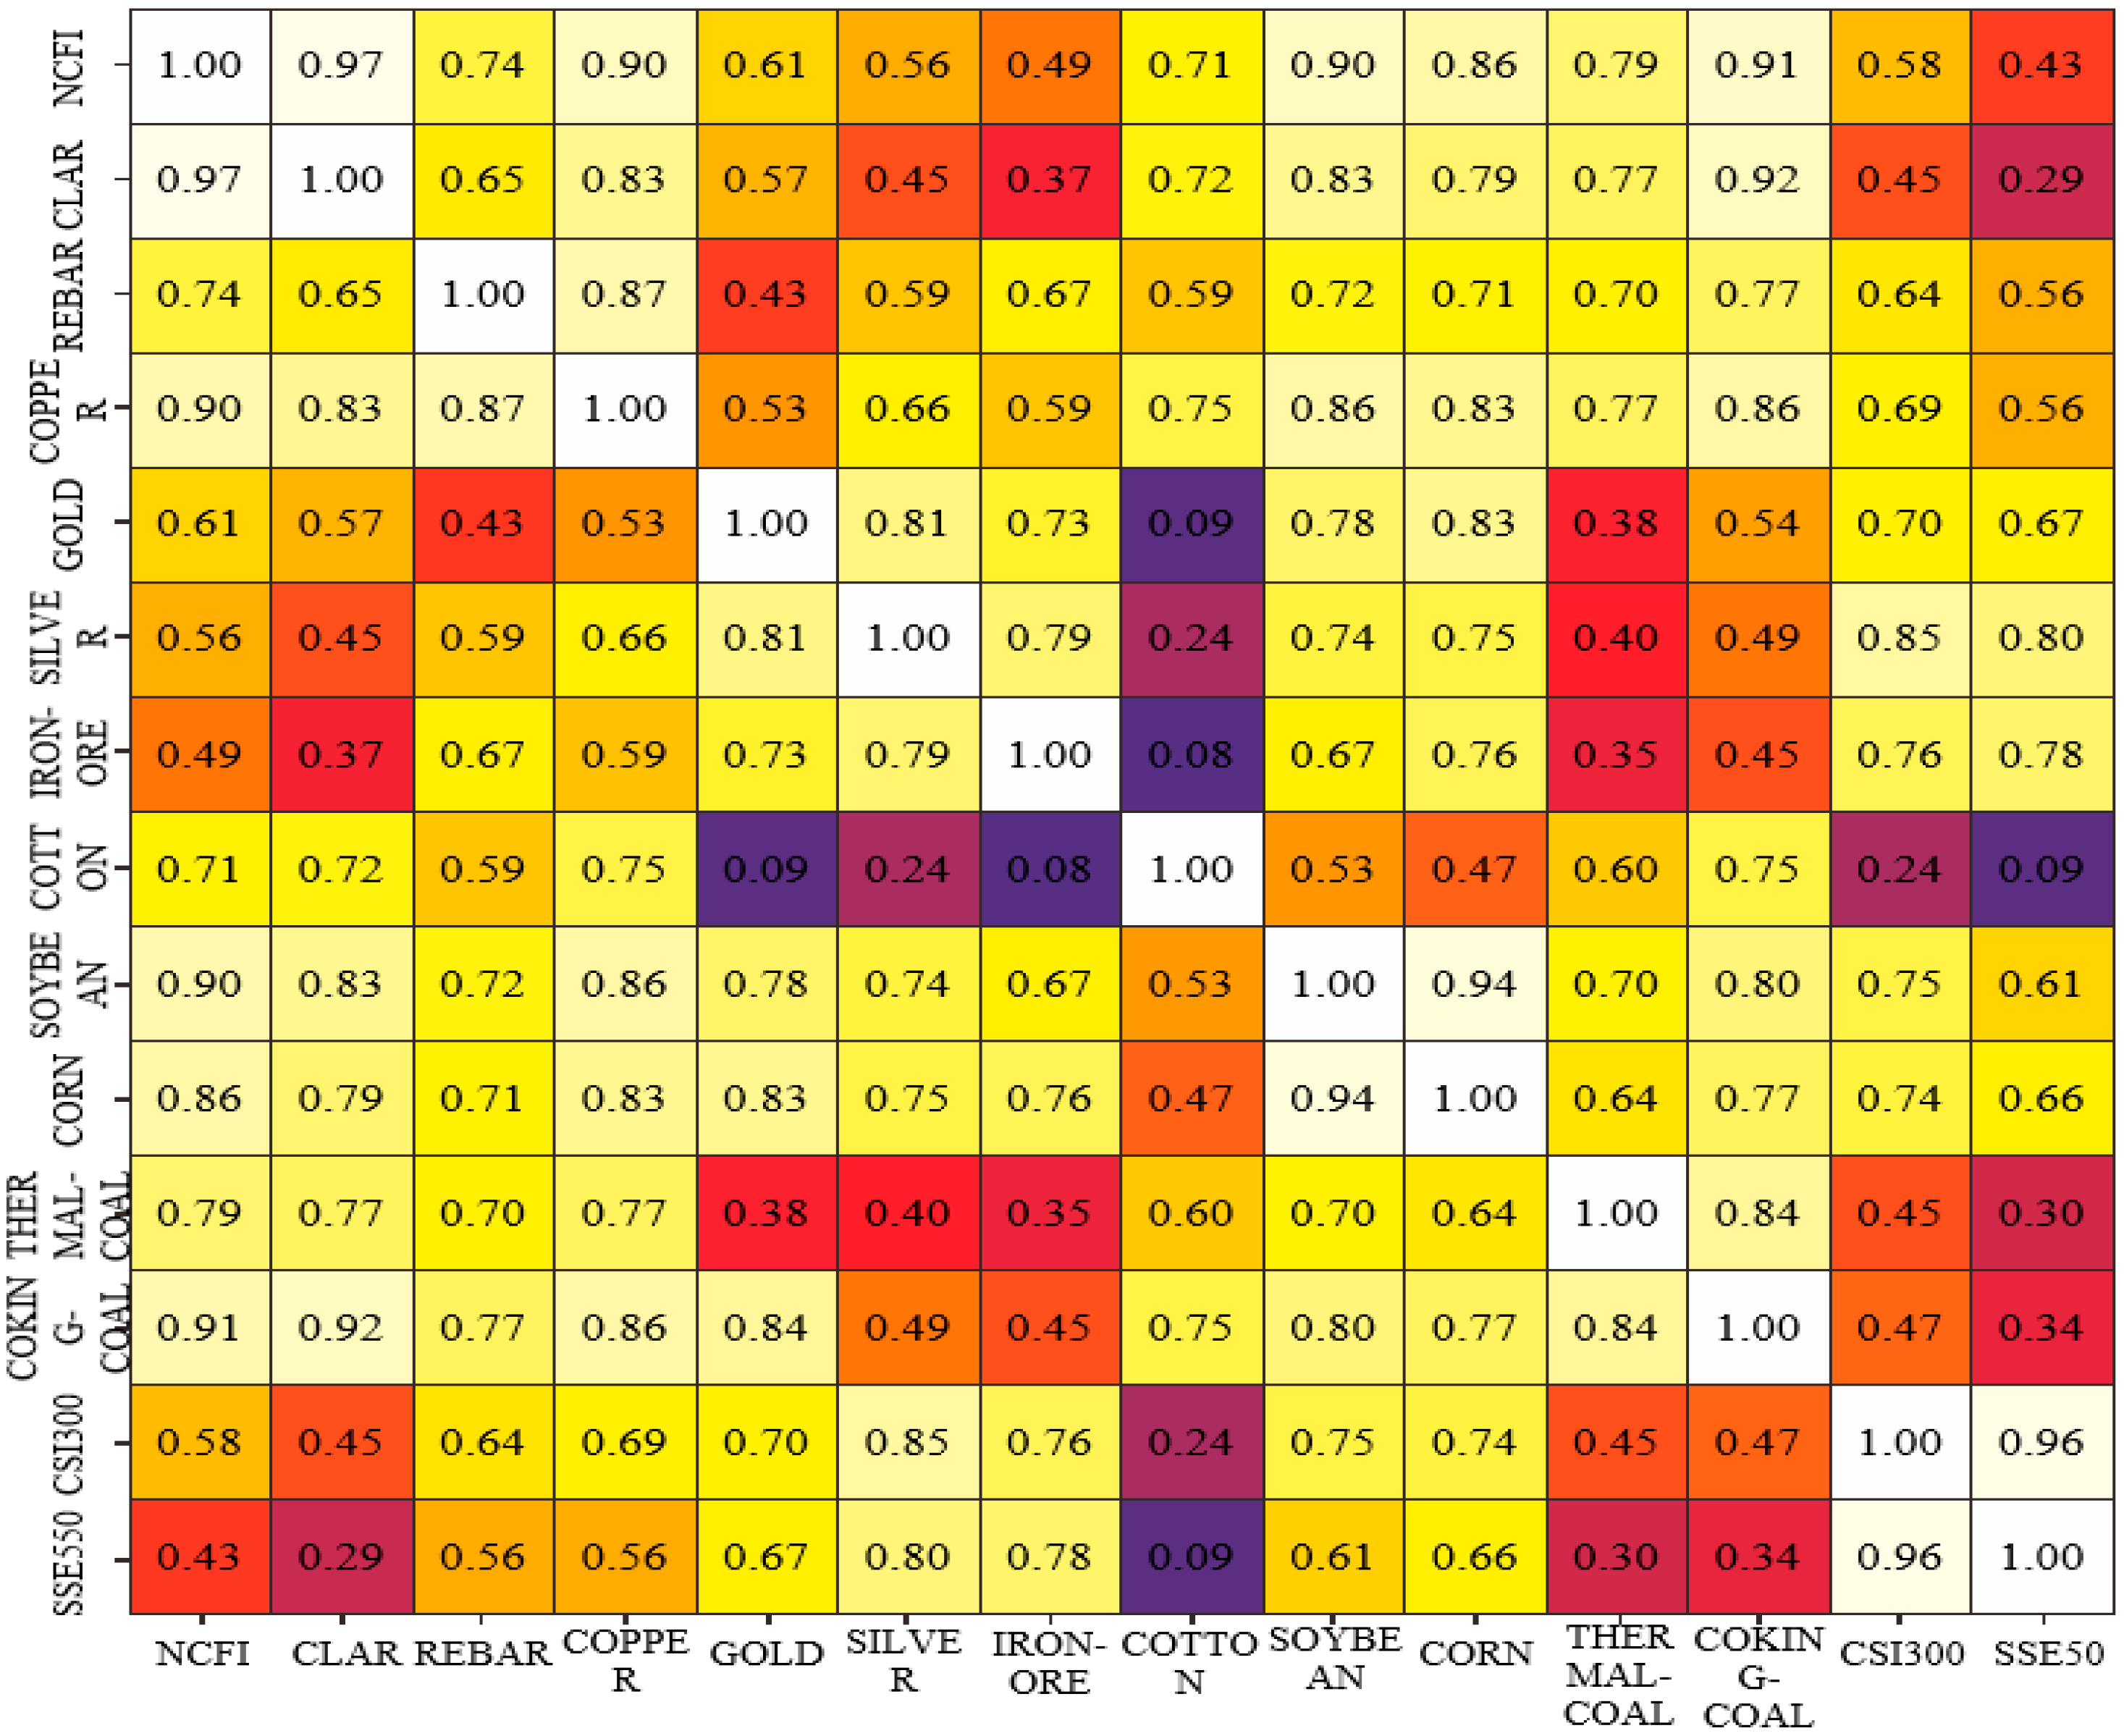
3.2.3. Criteria Importance Through Intercriteria Correlation (CITIC)
- (1)
- Data standardization:
- (2)
- Calculate the standard deviation of each criterion:
- (3)
- Calculate the correlation coefficient:
- (4)
- Calculate the total information of each criterion:
- (5)
- Calculate the weight of the -th criterion:
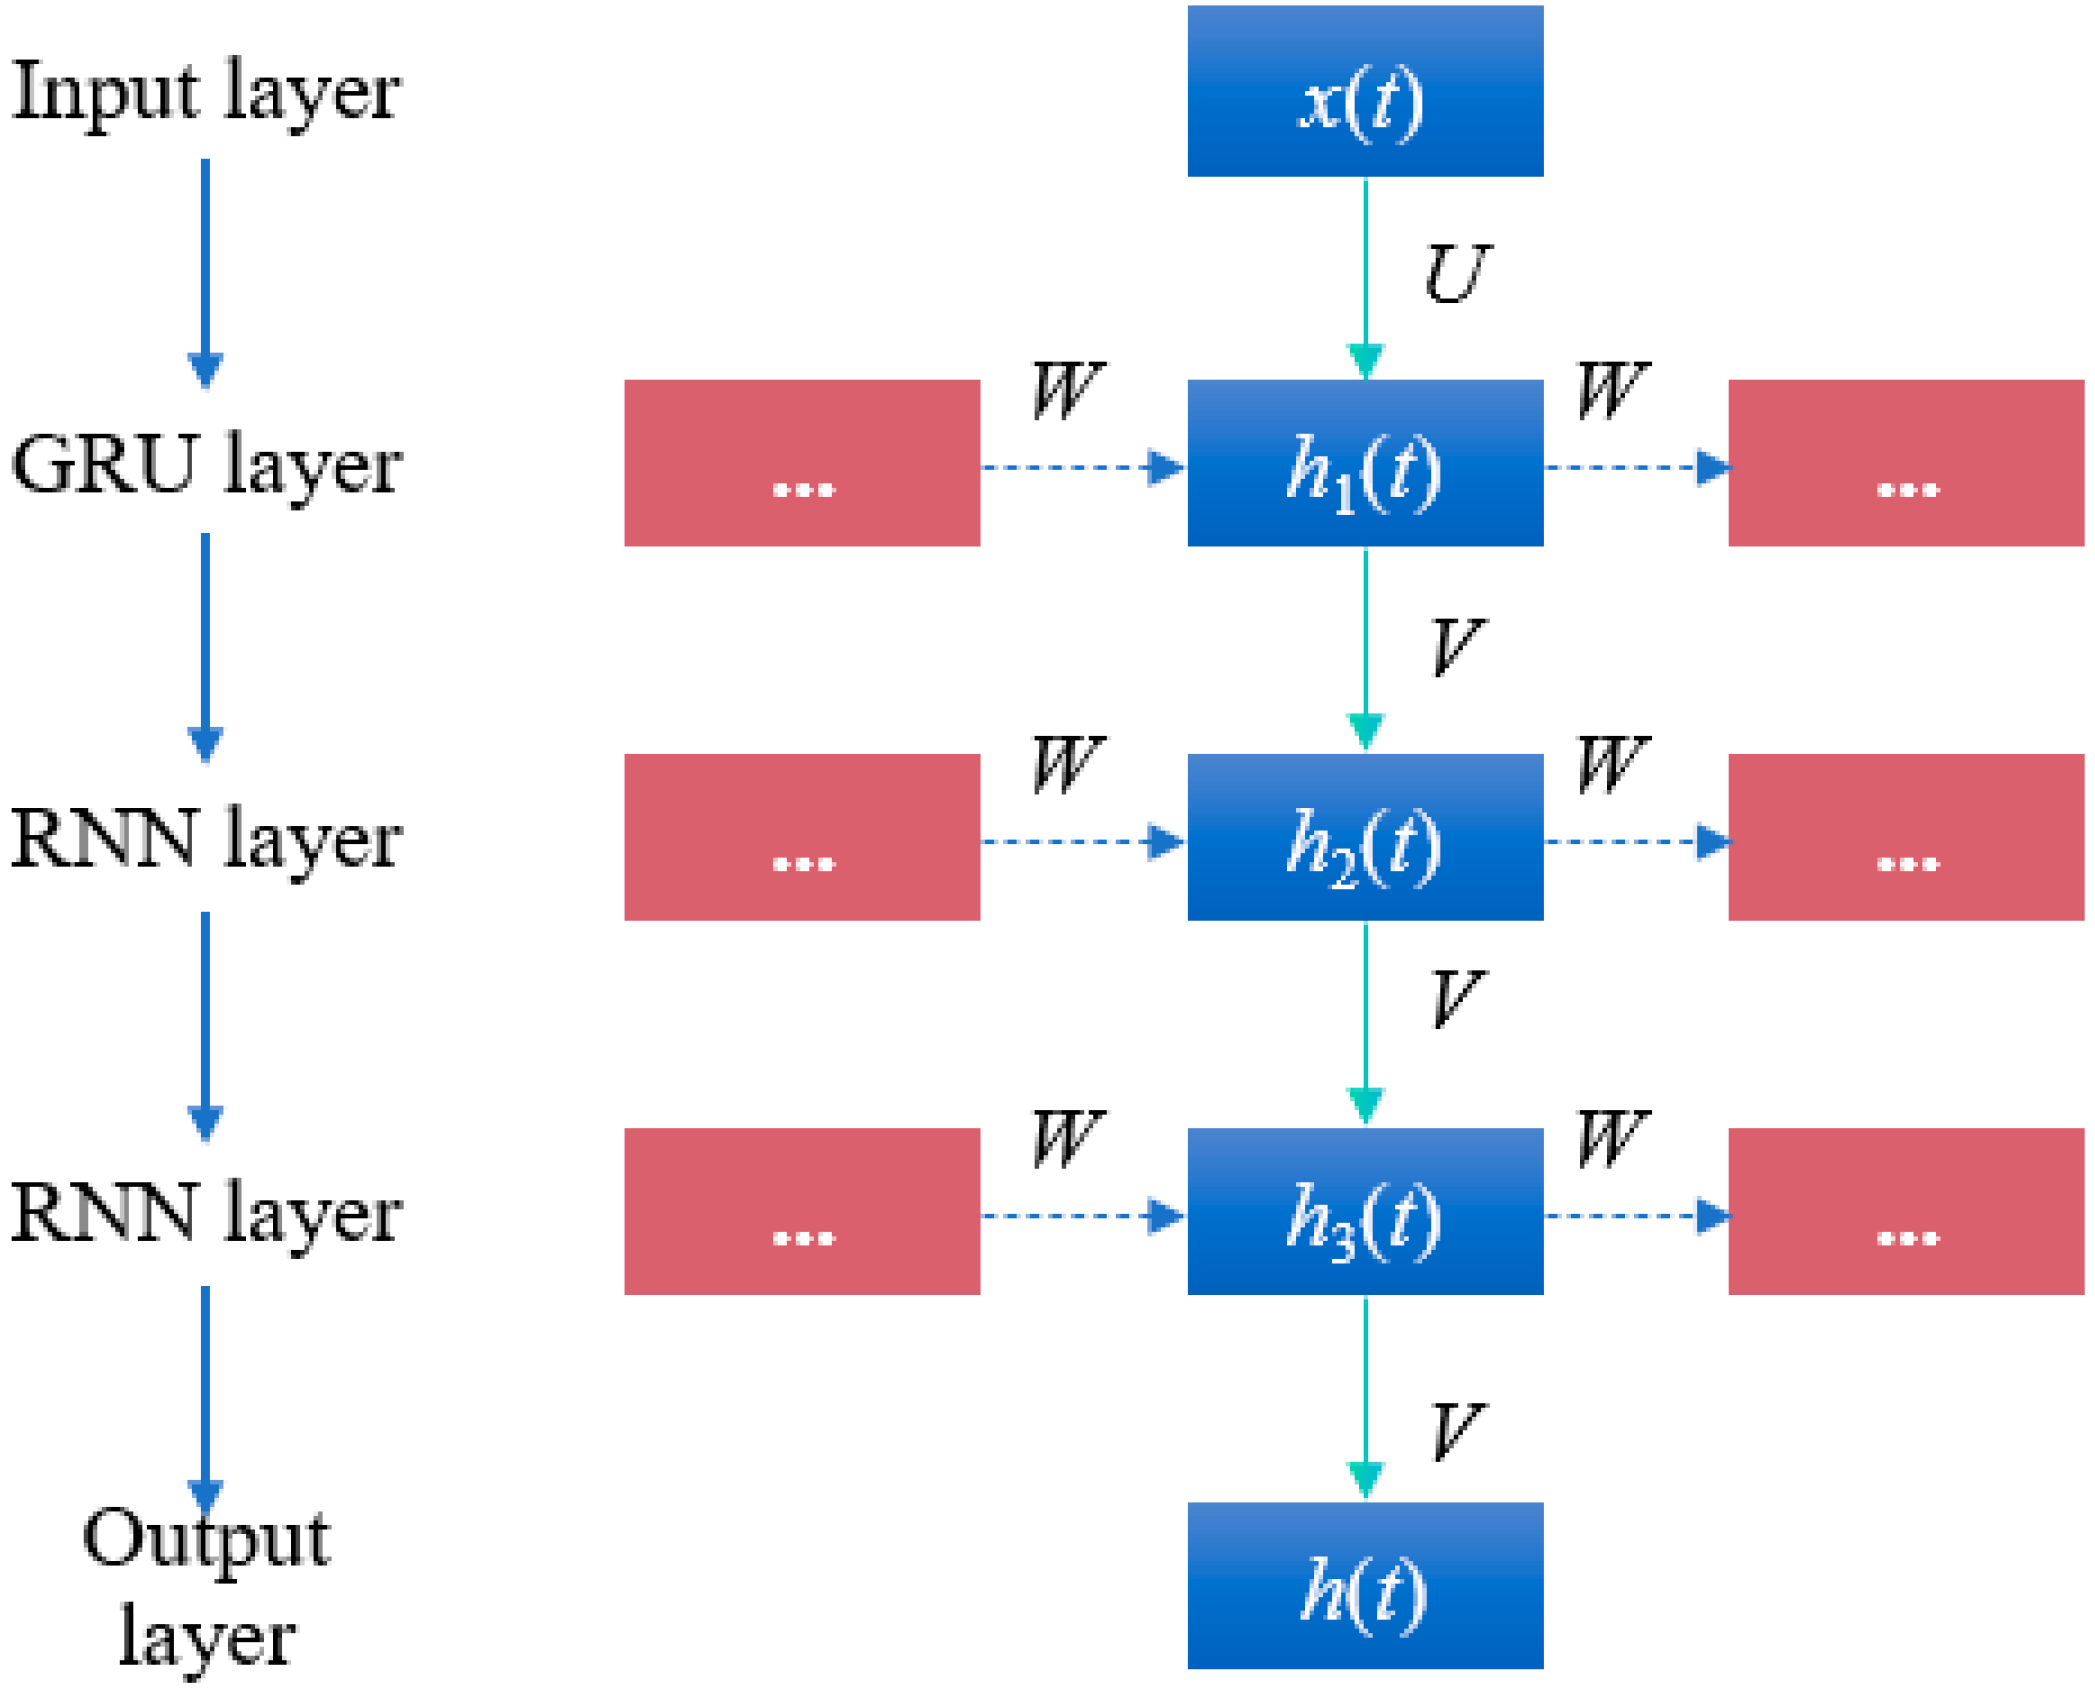
3.2.4. Construction of the RNN–GRU Hybrid Prediction Model
3.2.5. Model Evaluation Metrics
3.2.6. Implementation Details
4. Model Results and Comparative Analysis
4.1. Data Processing
4.2. Data Processing Overview
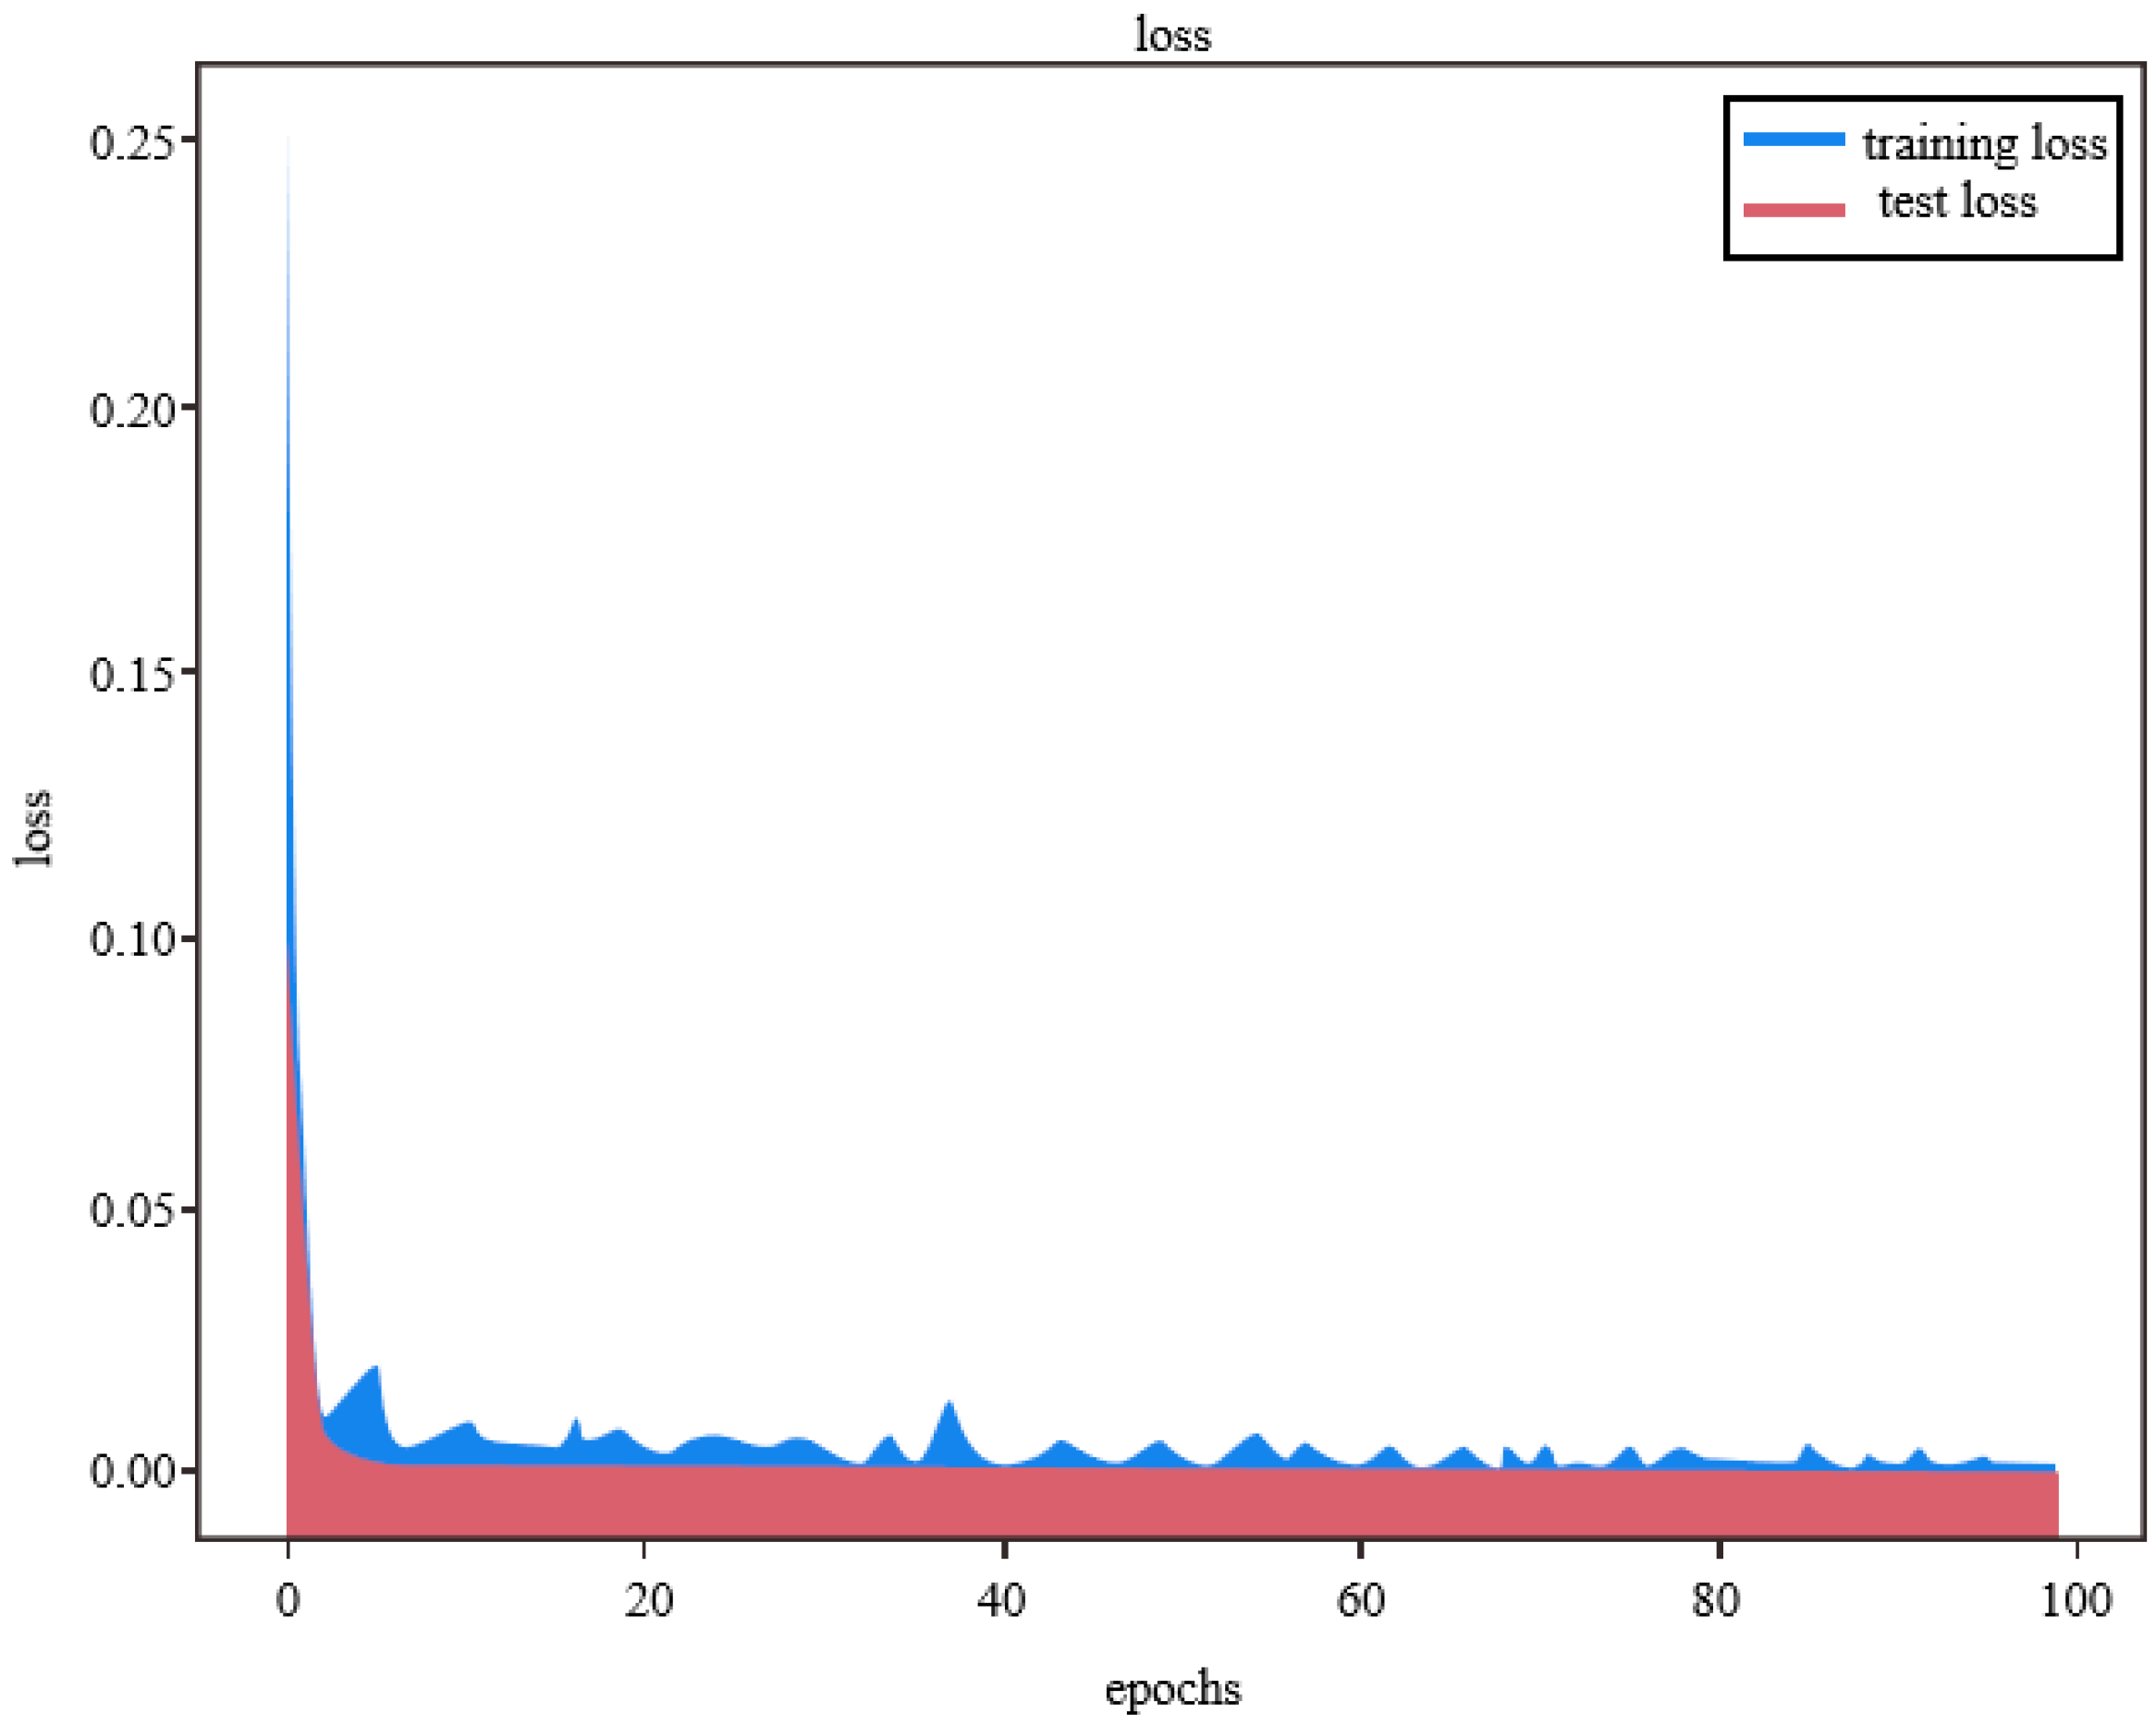
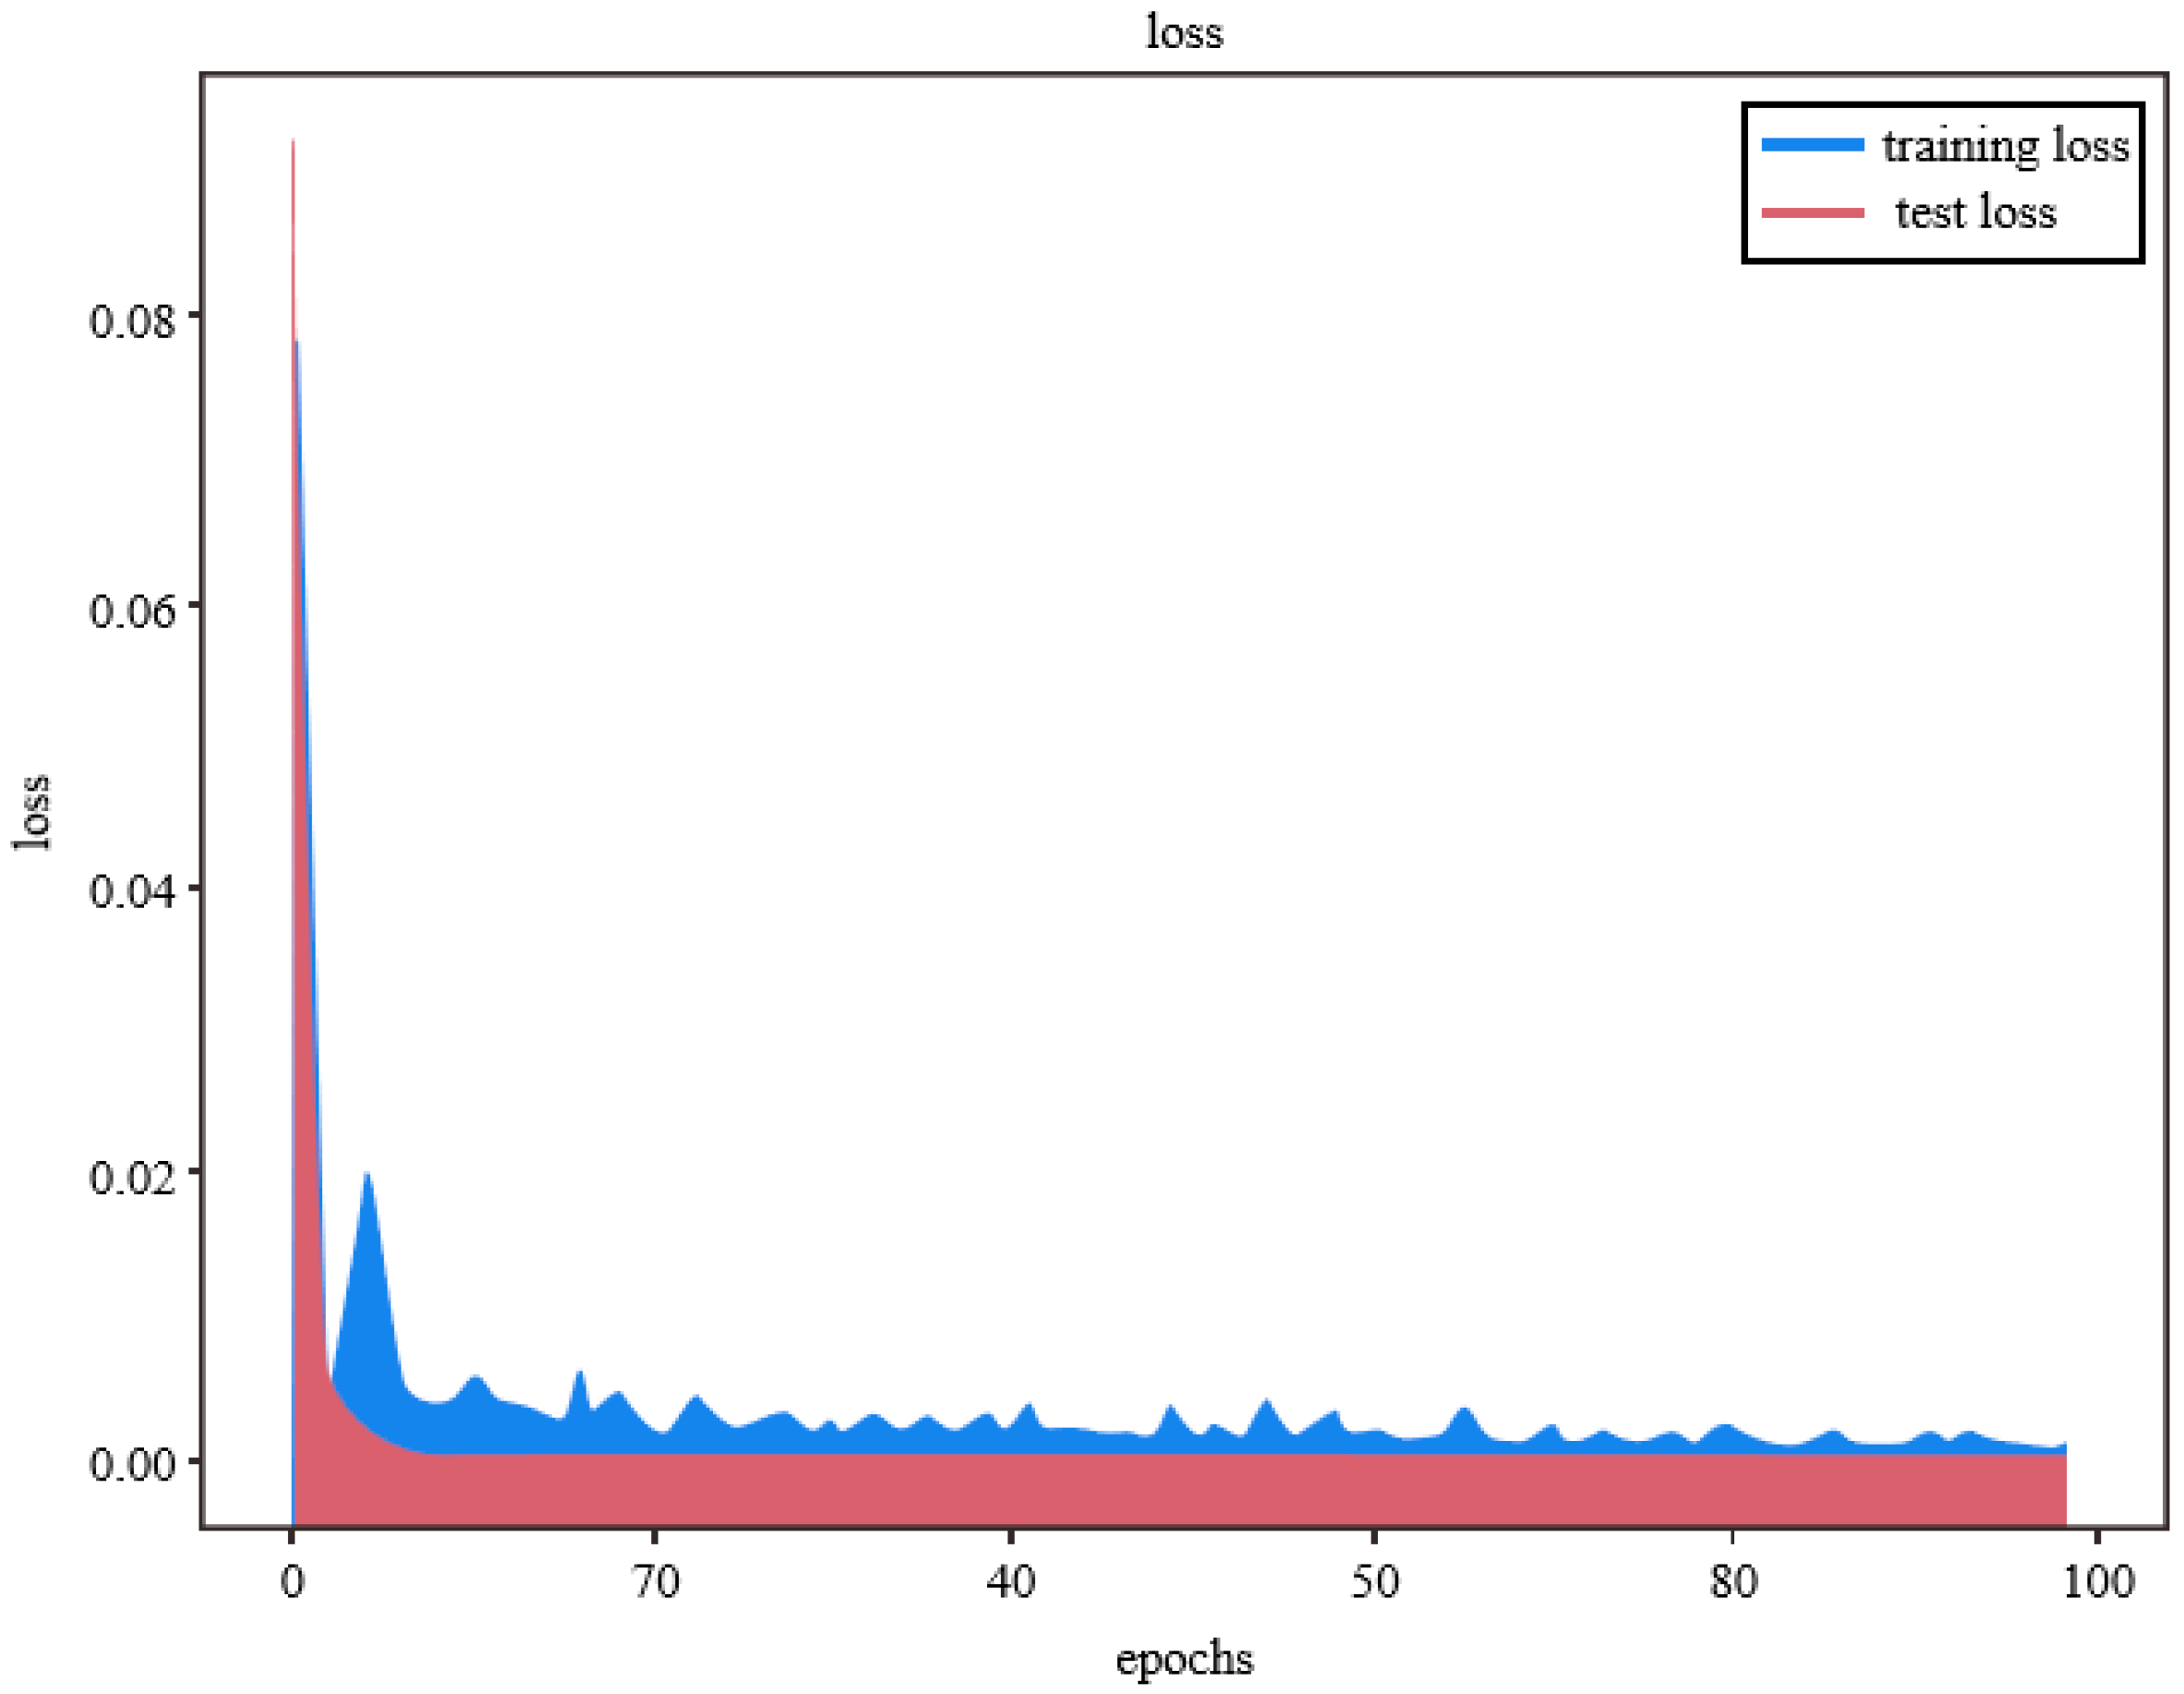
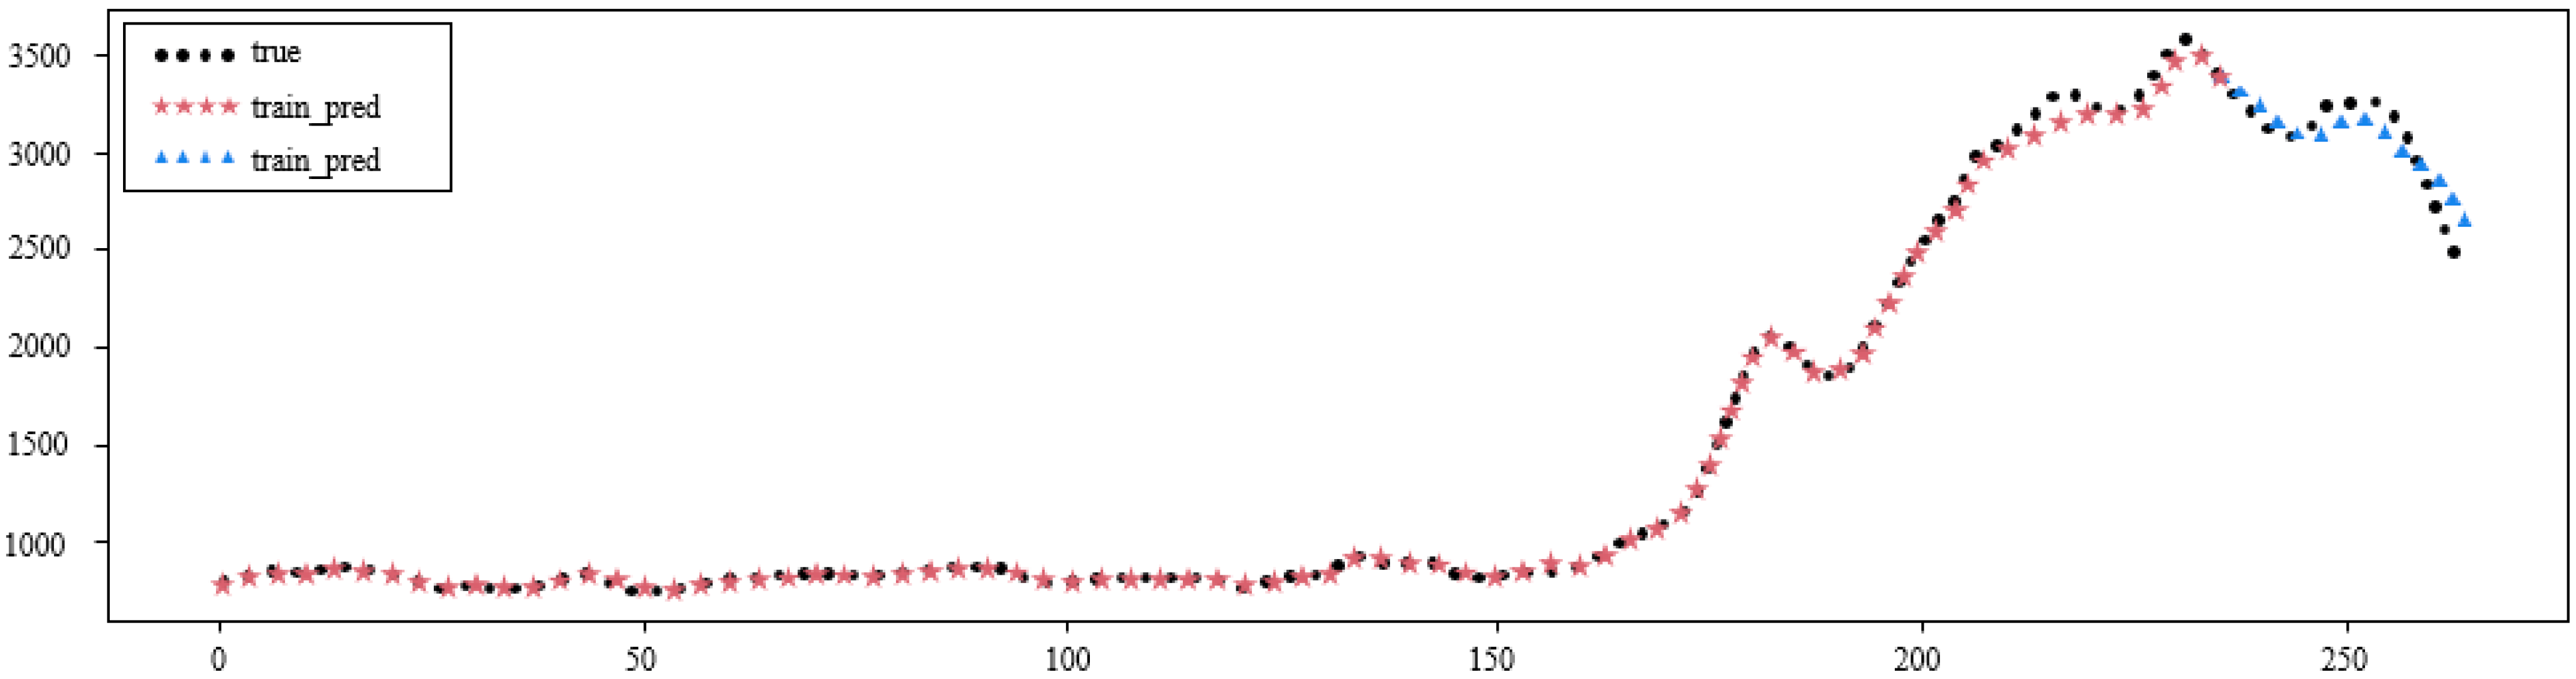
4.3. Model Evaluation
5. Discussion and Conclusions
5.1. Theoretical Contributions
5.2. Managerial Contributions
5.3. Limitations and Future Directions
Author Contributions
Funding
Institutional Review Board Statement
Informed Consent Statement
Data Availability Statement
Conflicts of Interest
References
- UNCTAD. United Nations Conference on Trade and Development. Review of Maritime Transport; UNCTAD: Geneva, Switzerland, 2021. [Google Scholar]
- Li, Z.; Li, H.; Zhang, Q.; Qi, X. Data-driven research on the impact of COVID-19 on the global container shipping network. Ocean Coast. Manag. 2024, 248, 106969. [Google Scholar] [CrossRef]
- Liu, R.; Li, H.; Ong, M.C.; Zou, J.; Lu, L. Prediction of global structural responses for an ultra-large container ship under long-crested irregular waves using generalized modes and artificial neural networks. Ocean Eng. 2025, 318, 120152. [Google Scholar] [CrossRef]
- Schramm, H.J.; Munim, Z.H. Container freight rate forecasting with improved accuracy by integrating soft facts from practitioners. Res. Transp. Bus. Manag. 2021, 41, 100662. [Google Scholar] [CrossRef]
- Chen, G.; Rytter, N.G.; Jiang, L.; Nielsen, P.; Jensen, L. Pre-announcements of price increase intentions in liner shipping spot markets. Transp. Res. Part A Policy Pract. 2017, 95, 109–125. [Google Scholar] [CrossRef]
- Guerrero, D.; Letrouit, L.; Pais-Montes, C. The container transport system during COVID-19: An analysis through the prism of complex networks. Transp. Policy 2022, 115, 113–125. [Google Scholar] [CrossRef]
- Munim, Z.H. State-space TBATS model for container freight rate forecasting with improved accuracy. Marit. Transp. Res. 2022, 3, 100057. [Google Scholar] [CrossRef]
- Liu, B.; Jiang, G.Y.; Li, H.; Chen, J.D.; Wu, L.; Chen, Y.J. Scheme design and empirical research on an index system for road freight in Ningbo region. Procedia-Soc. Behav. Sci. 2014, 138, 223–232. [Google Scholar] [CrossRef]
- Sui, C.; Wang, S.; Zheng, W. Sentiment as a shipping market predictor: Testing market-specific language models. Transp. Res. Part E Logist. Transp. Rev. 2024, 189, 103651. [Google Scholar] [CrossRef]
- Shih, Y.C.; Lin, M.S.; Lirn, T.C.; Juang, J.G. A new-type deep learning model based on Shapley regulation for containerized freight index prediction. J. Mar. Sci. Technol. 2024, 32, 8. [Google Scholar] [CrossRef]
- Liu, J.J.; Wang, Z.; Yao, D.Q.; Yue, X. Transaction cost analysis of supply chain logistics services: Firm-based versus port-focal. J. Oper. Res. Soc. 2016, 67, 176–186. [Google Scholar] [CrossRef]
- Zhao, N.X.; Xiao, R.N.; Yang, L.; Wang, X.Z.; Ding, D.C. Algorithms comparison and Empirical Analysis of Ningbo Road Container Transport Freight Index. In ICIDC 2023: Proceedings of the 2nd International Conference on Information Economy, Data Modeling and Cloud Computing, ICIDC 2023, Nanchang, China, 2–4 June 2023; European Alliance for Innovation: Bratislava, Slovakia, 2023; p. 407. [Google Scholar]
- Martinez-Moya, J.; Feo-Valero, M. Do shippers’ characteristics influence port choice criteria? Capturing heterogeneity by using latent class models. Transp. Policy 2022, 116, 96–105. [Google Scholar] [CrossRef]
- Yang, J.; Li, Z.; Wang, T. Price discovery in Chinese agricultural futures markets: A comprehensive look. J. Futures Mark. 2021, 41, 536–555. [Google Scholar] [CrossRef]
- Mohanty, S.K.; Mishra, S. Regulatory reform and market efficiency: The case of Indian agricultural commodity futures markets. Res. Int. Bus. Financ. 2020, 52, 101145. [Google Scholar] [CrossRef]
- Jiang, B.; Li, J.; Gong, C. Maritime shipping and export trade on “Maritime Silk Road”. Asian J. Shipp. Logist. 2018, 34, 83–90. [Google Scholar] [CrossRef]
- Cheng, J.; Hong, W.; Cheng, J. Optimal Green Input Level for a Capital-Constrained Supply Chain Considering Disruption Risk. Sustainability 2023, 15, 12095. [Google Scholar] [CrossRef]
- Monge, M.; Lazcano, A.; Gil-Alana, L.A. China’s container freight prices on the global behavior of inflation rate after COVID-19. J. Infrastruct. Policy Dev. 2024, 8, 7407. [Google Scholar] [CrossRef]
- Bildirici, M.E.; Kayıkçı, F.; Onat, I.Ş. Baltic Dry Index as a major economic policy indicator: The relationship with economic growth. Procedia-Soc. Behav. Sci. 2015, 210, 416–424. [Google Scholar] [CrossRef]
- Saeed, N.; Nguyen, S.; Cullinane, K.; Gekara, V.; Chhetri, P. Forecasting container freight rates using the Prophet forecasting method. Transp. Policy 2023, 133, 86–107. [Google Scholar] [CrossRef]
- Bandyopadhyay, A.; Rajib, P. The asymmetric relationship between Baltic Dry Index and commodity spot prices: Evidence from nonparametric causality-in-quantiles test. Miner. Econ. 2023, 36, 217–237. [Google Scholar] [CrossRef]
- Bildirici, M.; Şahin Onat, I.; Ersin, Ö.Ö. Forecasting BDI Sea Freight Shipment Cost, VIX Investor Sentiment and MSCI Global Stock Market Indicator Indices: LSTAR-GARCH and LSTAR-APGARCH Models. Mathematics 2023, 11, 1242. [Google Scholar] [CrossRef]
- Açık, A. Volatility spillover from global container freight indices to port throughputs in Turkey. Uluslararası Ekonomi ve Yenilik Dergisi 2019, 5, 101–113. [Google Scholar] [CrossRef]
- Yu, B.; Shin, S.H.; Ro, Y.J. Asymmetric price adjustments in the Shanghai Containerized Freight Index: Evidence from a nonlinear autoregressive distributed lag model. Int. J. Shipp. Transp. Logist. 2023, 17, 60–79. [Google Scholar] [CrossRef]
- Chen, L.; Li, J.; Pei, R.; Su, Z.; Liu, Z. Shanghai Containerised Freight Index Forecasting Based on Deep Learning Methods: Evidence from Chinese Futures Markets. East Asian Econ. Rev. 2024, 28, 359–388. [Google Scholar] [CrossRef]
- Koyuncu, K.; Tavacıoğlu, L. Forecasting Shanghai containerized freight index by using time series models. Mar. Sci. Technol. Bull. 2021, 10, 426–434. [Google Scholar] [CrossRef]
- Del Rosal, I.; Moura, T.G.Z. The effect of shipping connectivity on seaborne containerised export flows. Transp. Policy 2022, 118, 143–151. [Google Scholar] [CrossRef]
- Rødseth, K.L. Productivity growth in urban freight transport: An index number approach. Transp. Policy 2017, 56, 86–95. [Google Scholar] [CrossRef]
- Hirata, E.; Matsuda, T. Forecasting Shanghai Container Freight Index: A Deep-Learning-Based Model Experiment. J. Mar. Sci. Eng. 2022, 10, 593. [Google Scholar] [CrossRef]
- Aldhyani, T.H.; Alzahrani, A. Framework for predicting and modeling stock market prices based on deep learning algorithms. Electronics 2022, 11, 3149. [Google Scholar] [CrossRef]
- Zhang, X.; Chen, M.Y.; Wang, M.G.; Ge, Y.E.; Stanley, H.E. A novel hybrid approach to Baltic Dry Index forecasting based on a combined dynamic fluctuation network and artificial intelligence method. Appl. Math. Comput. 2019, 361, 499–516. [Google Scholar] [CrossRef]
- Hu, Z.; Fan, A.; Mao, W.; Shu, Y.; Wang, Y.; Xia, M.; Yi, Q.; Li, B. Ship energy consumption prediction: Multi-model fusion methods and multi-dimensional performance evaluation. Ocean Eng. 2025, 322, 120538. [Google Scholar] [CrossRef]
- Tang, Z.; Wang, L. Shipping decarbonization and public emergencies: How does COVID-19 impact container shipping carbon emissions? J. Transp. Geogr. 2025, 123, 104124. [Google Scholar] [CrossRef]
- Borggreve, R.; Wilmsmeier, G. Container alliance strategies, market concentration and equality: A dynamic time warping clustering approach. J. Transp. Geogr. 2025, 126, 104249. [Google Scholar] [CrossRef]
- Lin, Y.; Wang, X.; Xiao, R.; Zhao, N.; Ding, D. The influencing factors analysis on road container transport freight index in Ningbo based on Spearman and VAR model. In Proceedings of the 2023 2nd International Conference on Applied Statistics, Computational Mathematics and Software Engineering (ASCMSE 2023), Kaifeng, China, 26–28 May 2023. [Google Scholar]
- Ke, L.; Oh, Y.S. The Relationship between Port and City Growth: The Case of Ningbo. J. Int. Trade Commer. 2023, 19, 165–177. [Google Scholar] [CrossRef]
- Feng, J. The Research on Site Selection of Dry Port Cluster of Ningbo Port. Master’s Thesis, World Maritime University, Shanghai, China, 2011. [Google Scholar]
- Sun, F.; Wang, X.; Jin, L.; Shi, Y. Improvement of Rail-sea Multimodal Transport with Dry Port Construction: Case Study of Ningbo-Zhoushan Port. Sci. J. Bus. Manag. 2017, 5, 78. [Google Scholar] [CrossRef]
- Zeng, S.; Fang, Z.; He, Y.; Huang, L. An integrated entropy-COPRAS framework for Ningbo-Zhoushan port logistics development from the perspective of dual circulation. Systems 2022, 10, 131. [Google Scholar] [CrossRef]
- Jing, Z.; Jia-Wei, X. Study of Ningbo Zhoushan port logistics competitiveness based on factor analysis and cluster analysis. In Proceedings of the 2010 Third International Conference on Information and Computing, Wuxi, China, 4–6 June 2010; IEEE: Piscataway, NJ, USA, 2010; Volume 3, pp. 123–126. [Google Scholar]
- Deng, P.; Song, L.; Xiao, R.; Huang, C. Evaluation of logistics and port connectivity in the Yangtze River Economic Belt of China. Transp. Policy 2022, 126, 249–267. [Google Scholar] [CrossRef]
- Ahmed, A.D.; Huo, R. Volatility transmissions across international oil market, commodity futures and stock markets: Empirical evidence from China. Energy Econ. 2021, 93, 104741. [Google Scholar] [CrossRef]
- Bohl, M.T.; Pütz, A.; Sulewski, C. Speculation and the informational efficiency of commodity futures markets. J. Commod. Mark. 2021, 23, 100159. [Google Scholar] [CrossRef]
- Bosch, D.; Pradkhan, E. The impact of speculation on precious metals futures markets. Resour. Policy 2015, 44, 118–134. [Google Scholar] [CrossRef]
- Cartwright, P.A.; Riabko, N. Measuring the effect of oil prices on wheat futures prices. Res. Int. Bus. Financ. 2015, 33, 355–369. [Google Scholar] [CrossRef]
- Gong, Y.; Li, K.X.; Chen, S.L.; Shi, W. Contagion risk between the shipping freight and stock markets: Evidence from the recent US-China trade war. Transp. Res. Part E Logist. Transp. Rev. 2020, 136, 101900. [Google Scholar] [CrossRef]
- Mo, D.; Gupta, R.; Li, B.; Singh, T. The macroeconomic determinants of commodity futures volatility: Evidence from Chinese and Indian markets. Econ. Model. 2018, 70, 543–560. [Google Scholar] [CrossRef]
- Kavussanos, M.G.; Visvikis, I.D.; Dimitrakopoulos, D.N. Freight Markets and Products. In Handbook of Multi-Commodity Markets and Products: Structuring, Trading and Risk Management; John Wiley & Sons: Hoboken, NJ, USA, 2014; pp. 355–398. [Google Scholar]
- Chang, C.W.; Hsueh, M.H.; Wang, C.N.; Huang, C.C. Exploring the Factors Influencing the Impact of the COVID-19 Pandemic on Global Shipping: A Case Study of the Baltic Dry Index. Sustainability 2023, 15, 11367. [Google Scholar] [CrossRef]
- Feng, H.; Grifoll, M.; Zheng, P. From a feeder port to a hub port: The evolution pathways, dynamics and perspectives of Ningbo-Zhoushan port (China). Transp. Policy 2019, 76, 21–35. [Google Scholar] [CrossRef]
- Chen, Y.; Feng, A.; Chen, S.; Mi, J.J. Forecasting the containerized freight index with AIS data: A novel information combination method based on gray incidence analysis. J. Forecast. 2024, 43, 802–815. [Google Scholar] [CrossRef]
- Chen, Y.; Liu, B.; Wang, T. Analysing and forecasting China containerized freight index with a hybrid decomposition–ensemble method based on EMD, grey wave and ARMA. Grey Syst. Theory Appl. 2021, 11, 358–371. [Google Scholar] [CrossRef]
- Han, Z.; Zhu, X.; Su, Z. Forecasting Maritime and Financial Market Trends: Leveraging CNN-LSTM Models for Sustainable Shipping and China’s Financial Market Integration. Sustainability 2024, 16, 9853. [Google Scholar] [CrossRef]
- Chen, J.; Zhang, Y.; Wu, J.; Cheng, W.; Zhu, Q. SOC estimation for lithium-ion battery using the LSTM-RNN with extended input and constrained output. Energy 2023, 262, 125375. [Google Scholar] [CrossRef]
- Shewalkar, A. Performance evaluation of deep neural networks applied to speech recognition: RNN, LSTM and GRU. J. Artif. Intell. Soft Comput. Res. 2019, 9, 235–245. [Google Scholar] [CrossRef]
- Guo, Z.; Yang, C.; Wang, D.; Liu, H. A novel deep learning model integrating CNN and GRU to predict particulate matter concentrations. Process Saf. Environ. Prot. 2023, 173, 604–613. [Google Scholar] [CrossRef]
- Hochreiter, S.; Schmidhuber, J. Long short-term memory. Neural Comput. 1997, 9, 1735–1780. [Google Scholar] [CrossRef] [PubMed]
- Huang, Y.; Wan, X.; Zhang, L.; Lu, X. A novel deep reinforcement learning framework with BiLSTM-Attention networks for algorithmic trading. Expert Syst. Appl. 2024, 240, 122581. [Google Scholar] [CrossRef]
- Jeong, M.H.; Lee, T.Y.; Jeon, S.B.; Youm, M. Highway speed prediction using gated recurrent unit neural networks. Appl. Sci. 2021, 11, 3059. [Google Scholar] [CrossRef]
- Munim, Z.H.; Schramm, H.J. Forecasting container freight rates for major trade routes: A comparison of artificial neural networks and conventional models. Marit. Econ. Logist. 2021, 23, 310–327. [Google Scholar] [CrossRef]
- Gong, X.; Liu, Y.; Wang, X. Dynamic volatility spillovers across oil and natural gas futures markets based on a time-varying spillover method. Int. Rev. Financ. Anal. 2021, 76, 101790. [Google Scholar] [CrossRef]


| Model Type | Key Features | Strengths | Limitations |
|---|---|---|---|
| ARIMA/VAR/VECM | Linear statistical models | Effective for stationary data; interpretable | Poor at capturing nonlinear and non-stationary patterns |
| ANN | Basic feedforward structure | Learns simple nonlinear relationships | Lacks sequence memory; limited temporal modeling |
| LSTM | Memory-based deep learning | Captures long-term dependencies; handles nonlinear data | Complex architecture; higher training cost |
| GRU | Gated mechanism; simplified LSTM | Fewer parameters; fast training; good for volatile data | May overlook short-term anomalies |
| RNN | Lightweight recurrent structure | Sensitive to short-term patterns | Suffers from vanishing gradients; weak long-term memory |
| RNN–GRU (Proposed Model) | Hybrid made of RNN and GRU layers | Balances short- and long-term dependencies; robust and adaptive | Requires hyperparameter tuning; lower interpretability |
| Variables | Symbol | Unit | Mean | Std. Dev. | Min | Max |
|---|---|---|---|---|---|---|
| Ningbo Container Freight Index | NCFI | Index | 1331.33 | 857.06 | 632.36 | 3787.91 |
| Clarksons Avg. Containership Earnings | CLAR | USD/day | 22,323.34 | 25,558.10 | 6726.856 | 87,777.97 |
| Rebar Futures | REBAR | CNY/Ton | 4009.61 | 641.76 | 2920.00 | 5765.00 |
| Copper cathode futures | COPPER | CNY/Ton | 55,330.48 | 9653.86 | 38,380.00 | 74,840.00 |
| Gold futures | GOLD | CNY/g | 337.90 | 52.41 | 263.80 | 450.46 |
| Silver futures | SILVER | CNY/kg | 4330.09 | 713.00 | 3078.00 | 7752.00 |
| Iron Ore Futures | IRON-ORE | CNY/Ton | 649.21 | 200.47 | 423.00 | 1243.50 |
| Cotton futures | COTTON | CNY/Ton | 15,363.00 | 2713.02 | 10,735.00 | 21,910.00 |
| Soybean No. 1 Futures | SOYBEAN | CNY/Ton | 4574.07 | 1087.49 | 3139.00 | 7473.00 |
| Corn Futures | CORN | CNY/Ton | 2190.31 | 437.59 | 1718.00 | 3027.00 |
| Thermal Coal Futures | THERMAL-COAL | CNY/Ton | 662.69 | 152.42 | 494.80 | 1747.70 |
| Coking coal futures | COKING-COAL | CNY/Ton | 1575.72 | 543.31 | 943.00 | 3551.00 |
| CSI 300 Futures Index | CSI300 | CNY | 4134.23 | 614.50 | 3003.60 | 5344.40 |
| SSE 50 Futures Index | SSE50 | CNY | 2923.43 | 362.00 | 2292.60 | 4003.60 |
| Model | MSE | MAE | RMSE | R2 (Training) | R2 (Test) | MAPE (%) |
|---|---|---|---|---|---|---|
| GRU | 8,525,712.0512 | 2885.9519 | 2919.8822 | 0.9817 | 0.8636 | 14.6820 |
| RNN | 9,233,648.5176 | 2986.8185 | 3003.5315 | 0.9894 | 0.9145 | 12.2078 |
| RNN–GRU | 8,996,423.9799 | 2998.8031 | 2998.9124 | 0.9963 | 0.9518 | 7.0704 |
Disclaimer/Publisher’s Note: The statements, opinions and data contained in all publications are solely those of the individual author(s) and contributor(s) and not of MDPI and/or the editor(s). MDPI and/or the editor(s) disclaim responsibility for any injury to people or property resulting from any ideas, methods, instructions or products referred to in the content. |
© 2025 by the authors. Licensee MDPI, Basel, Switzerland. This article is an open access article distributed under the terms and conditions of the Creative Commons Attribution (CC BY) license (https://creativecommons.org/licenses/by/4.0/).
Share and Cite
Wu, H.; Gong, C. Modeling the Ningbo Container Freight Index Through Deep Learning: Toward Sustainable Shipping and Regional Economic Resilience. Sustainability 2025, 17, 4655. https://doi.org/10.3390/su17104655
Wu H, Gong C. Modeling the Ningbo Container Freight Index Through Deep Learning: Toward Sustainable Shipping and Regional Economic Resilience. Sustainability. 2025; 17(10):4655. https://doi.org/10.3390/su17104655
Chicago/Turabian StyleWu, Haochuan, and Chi Gong. 2025. "Modeling the Ningbo Container Freight Index Through Deep Learning: Toward Sustainable Shipping and Regional Economic Resilience" Sustainability 17, no. 10: 4655. https://doi.org/10.3390/su17104655
APA StyleWu, H., & Gong, C. (2025). Modeling the Ningbo Container Freight Index Through Deep Learning: Toward Sustainable Shipping and Regional Economic Resilience. Sustainability, 17(10), 4655. https://doi.org/10.3390/su17104655