

Multi-Scale Sponge Capacity Trading and SLSQP for Stormwater Management Optimization

 , ,
, ,
Abstract

1. Introduction
2. Materials and Methods
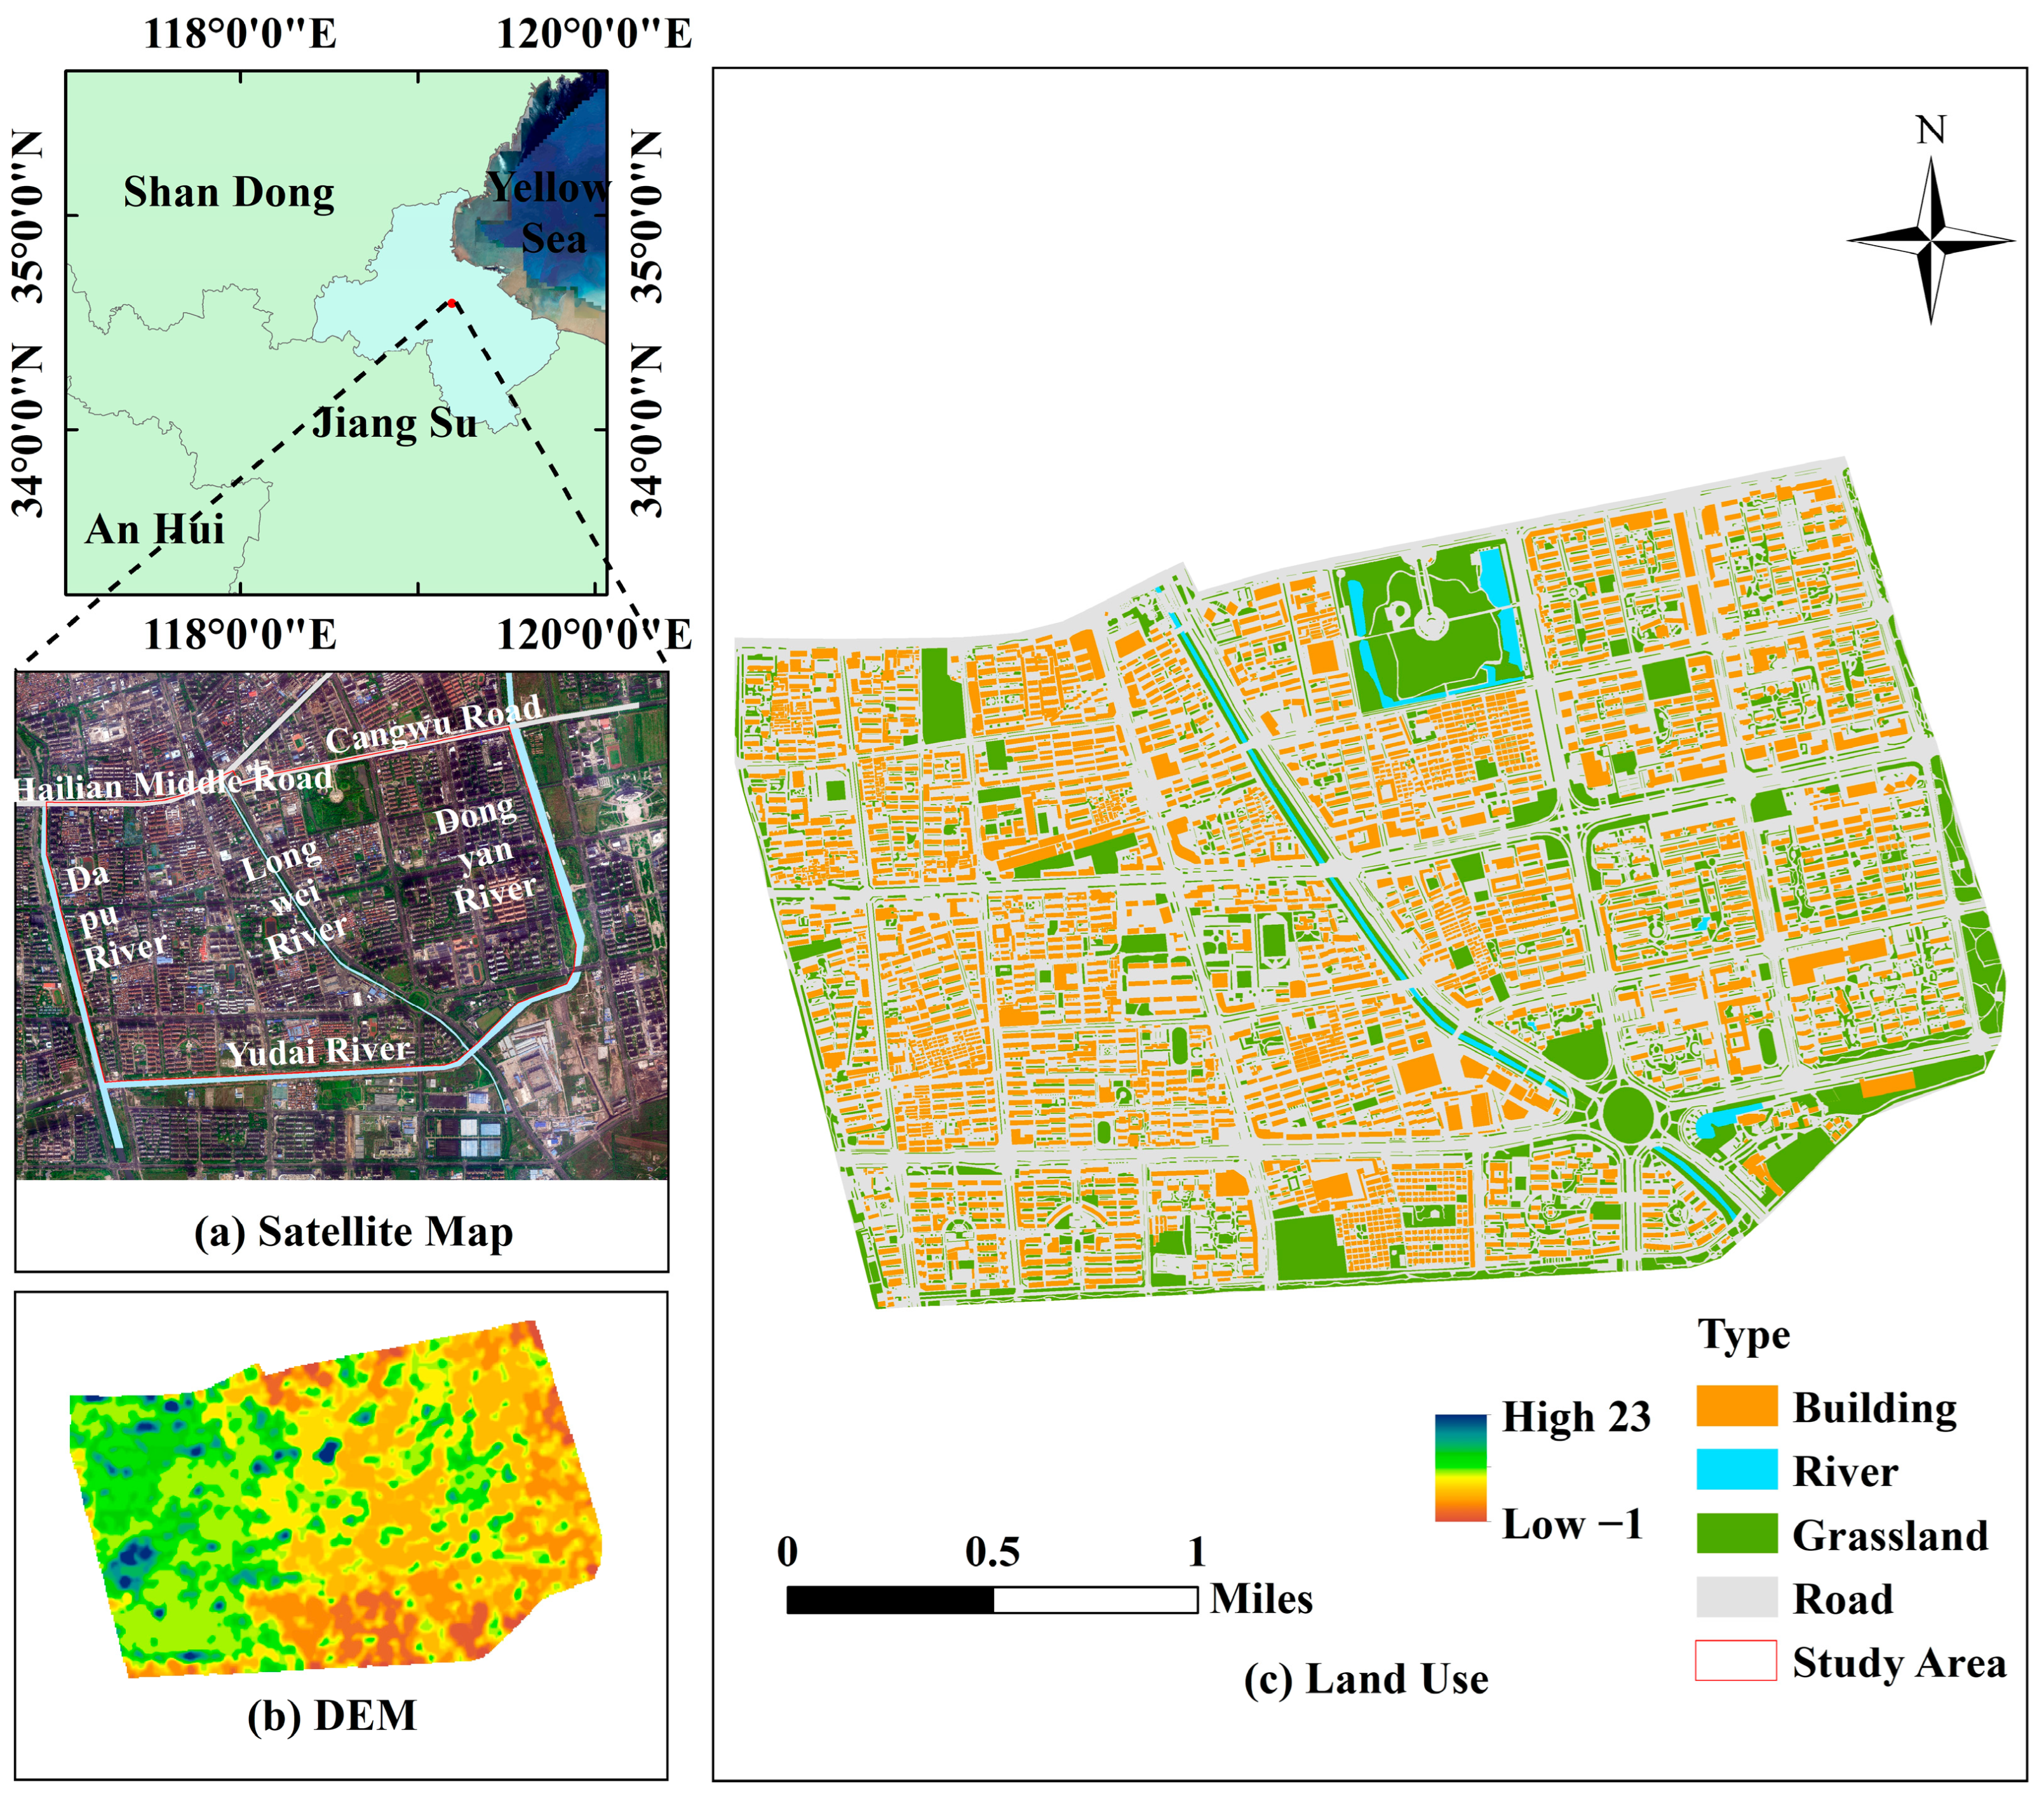
2.1. Study Area
2.1.1. Area Overview
2.1.2. Design Rainfall
2.2. Research Methods
2.2.1. SWMM and Sub-Catchment Division
2.2.2. SWMM Parameter Calibration and Validation
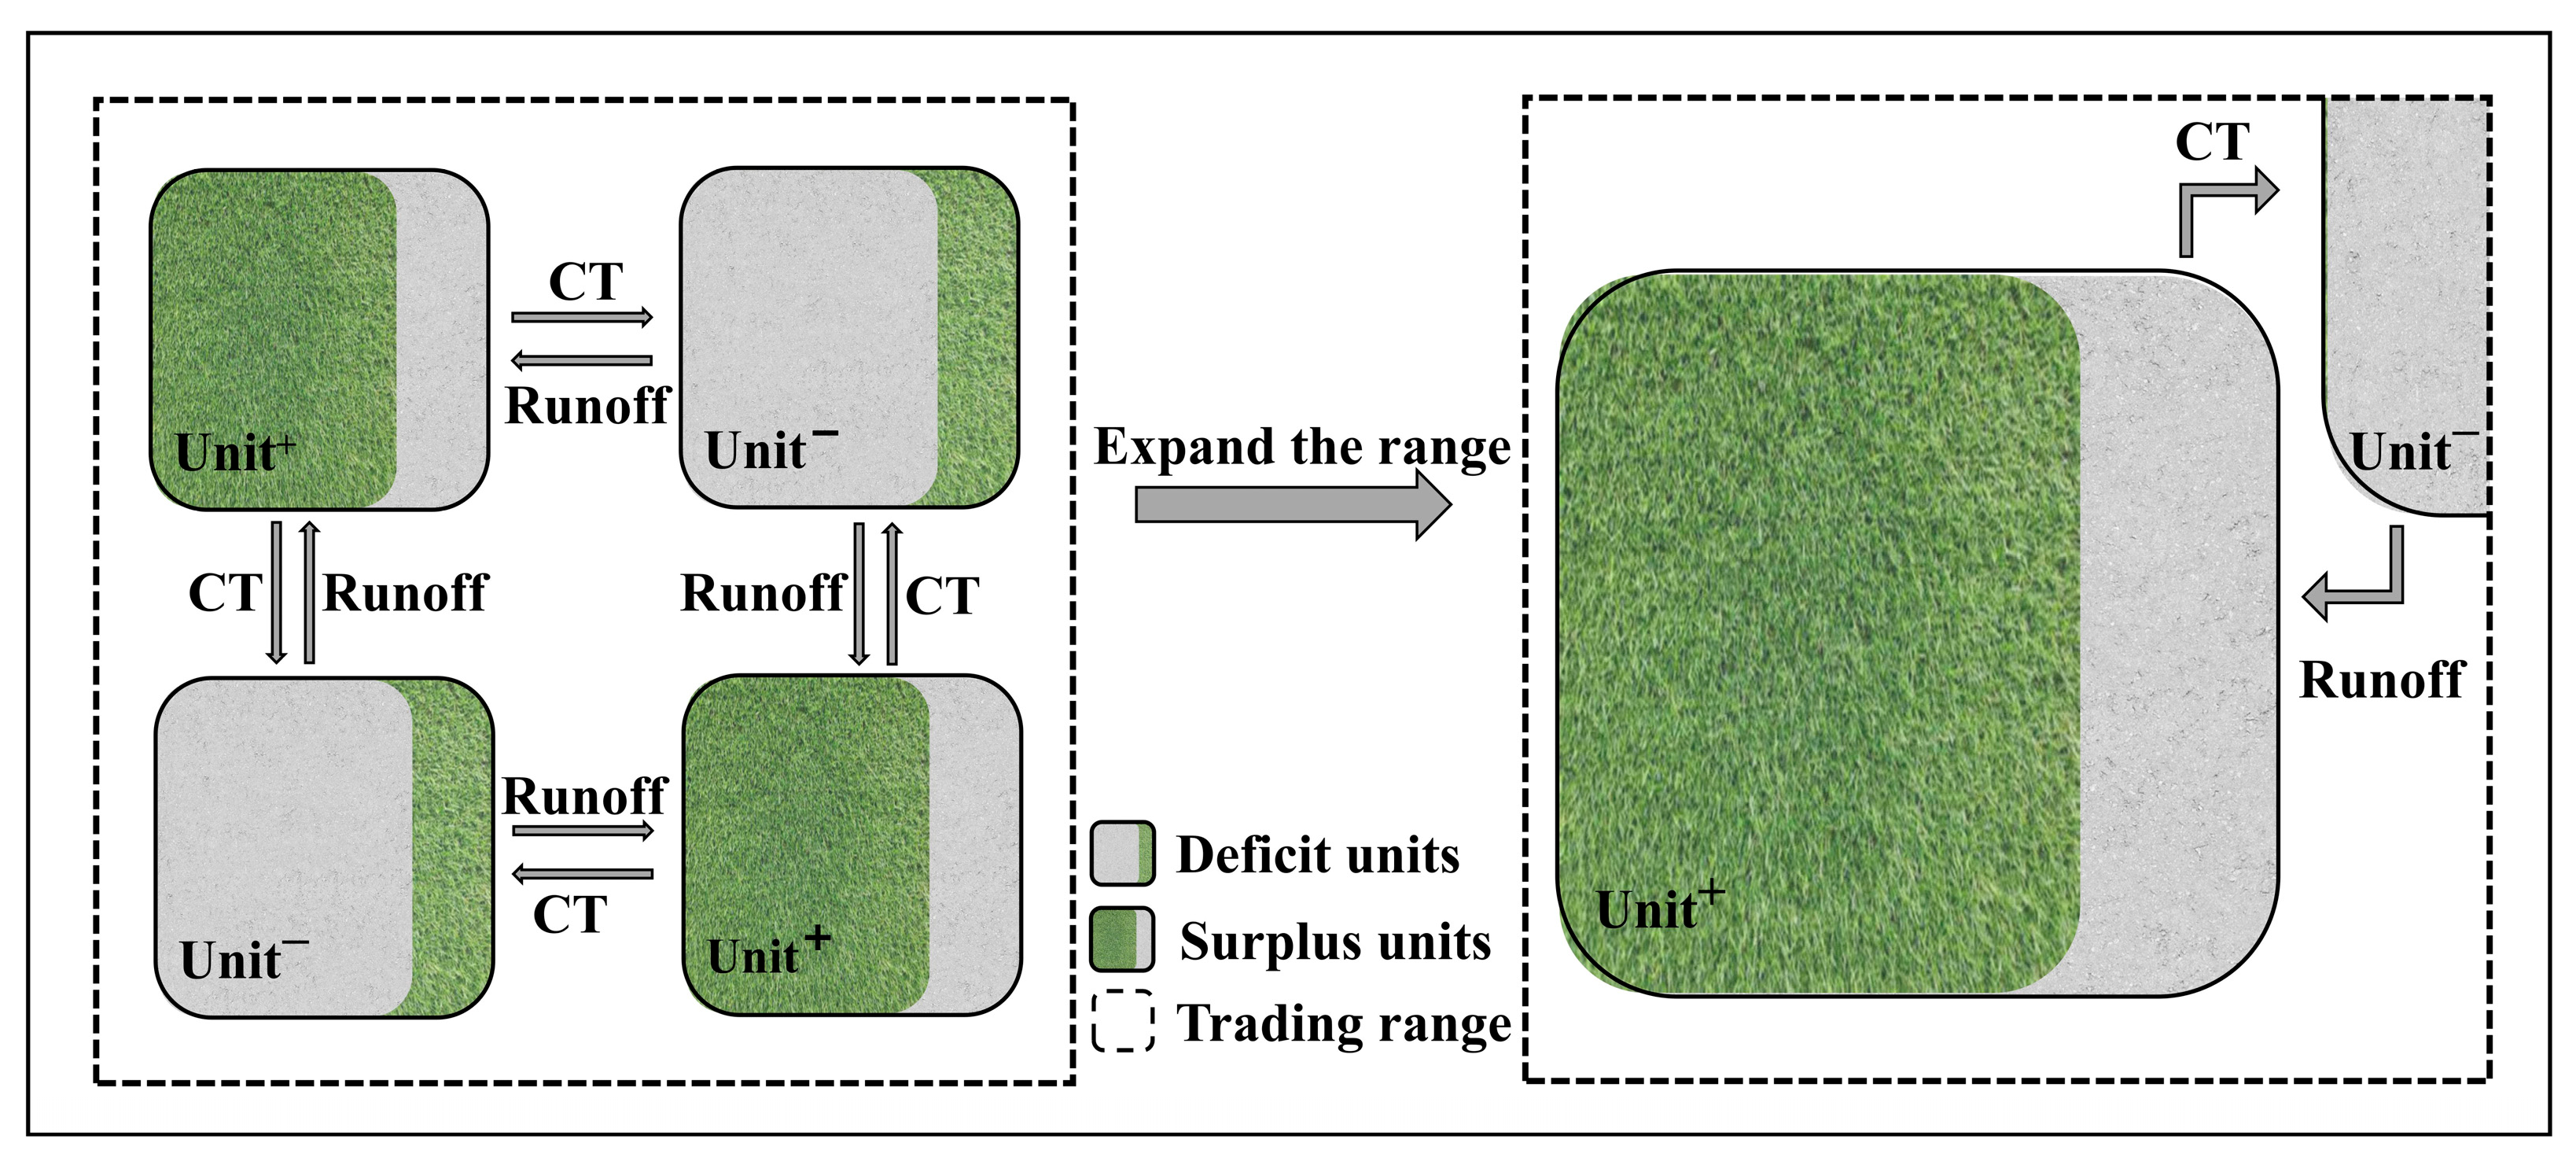
2.2.3. Concept of Capacity Trading
2.2.4. Capacity Trading Calculation Formula
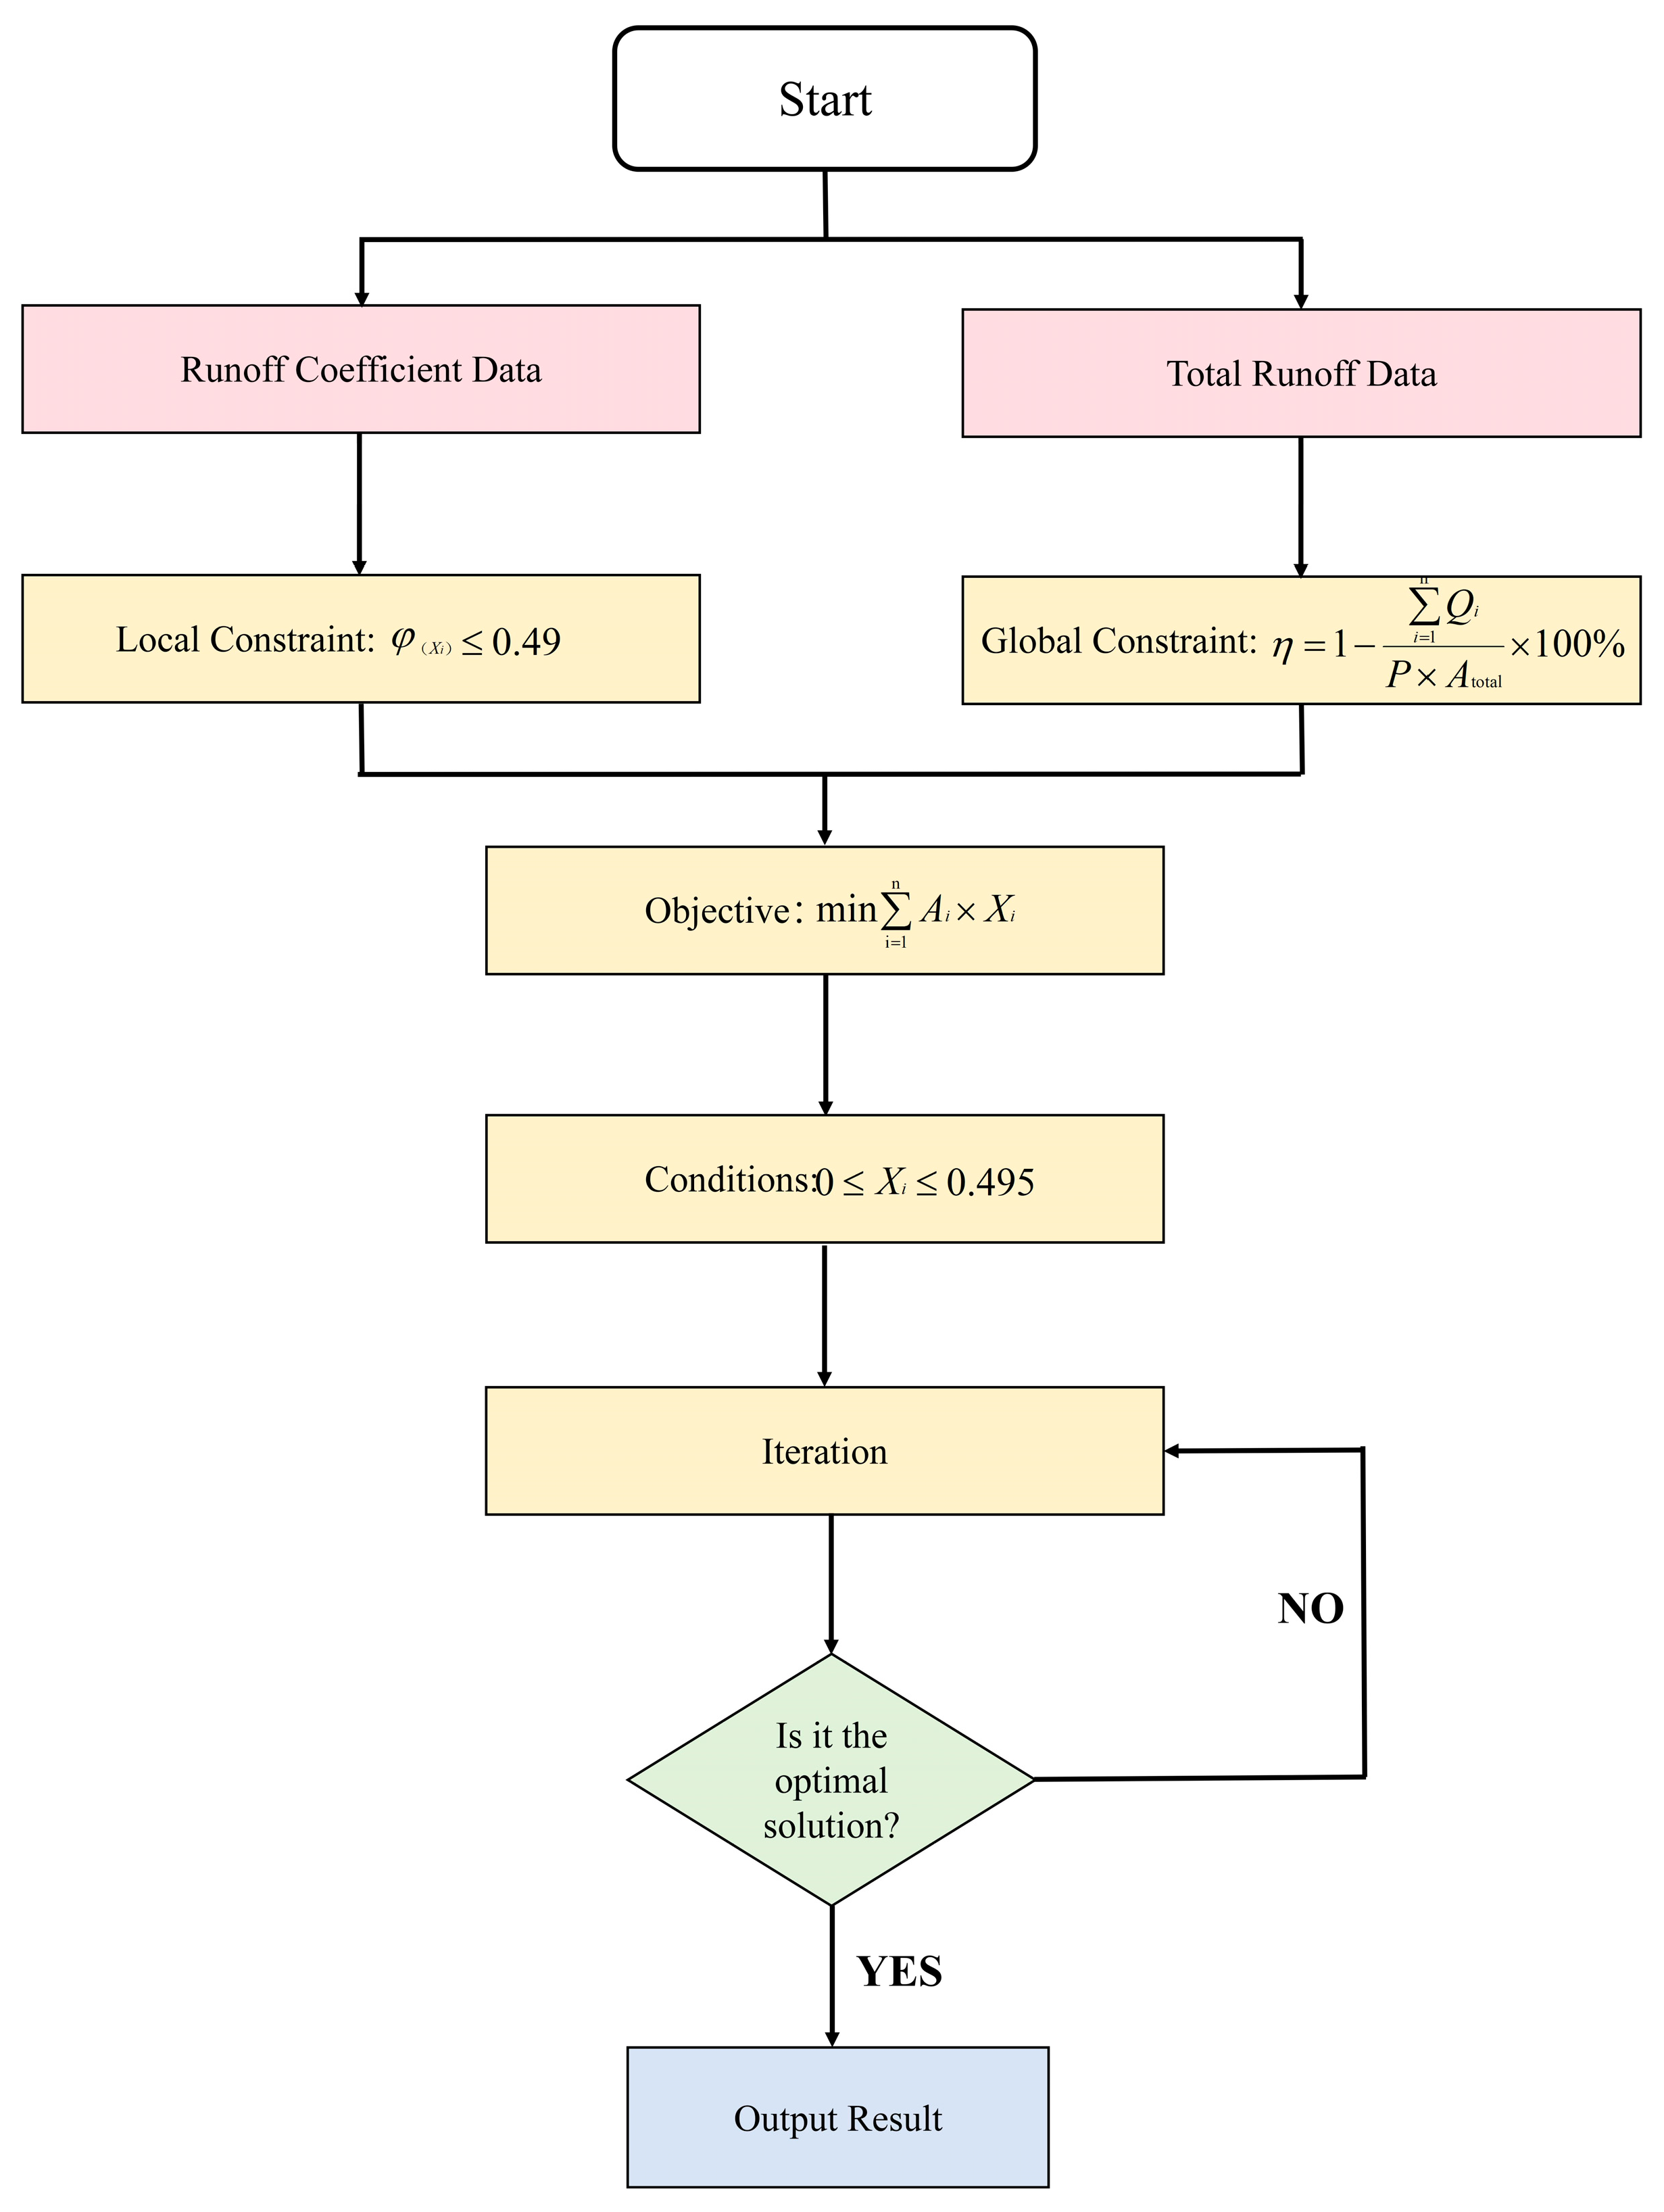
2.2.5. SLSQP Optimization Model
2.2.6. Marginal Benefit
3. Results
3.1. SWMM Simulation Run
3.1.1. Runoff Characteristics at Different Trading Scales
3.1.2. Runoff Coefficient Trend
3.2. Capacity Trading Optimization Effect
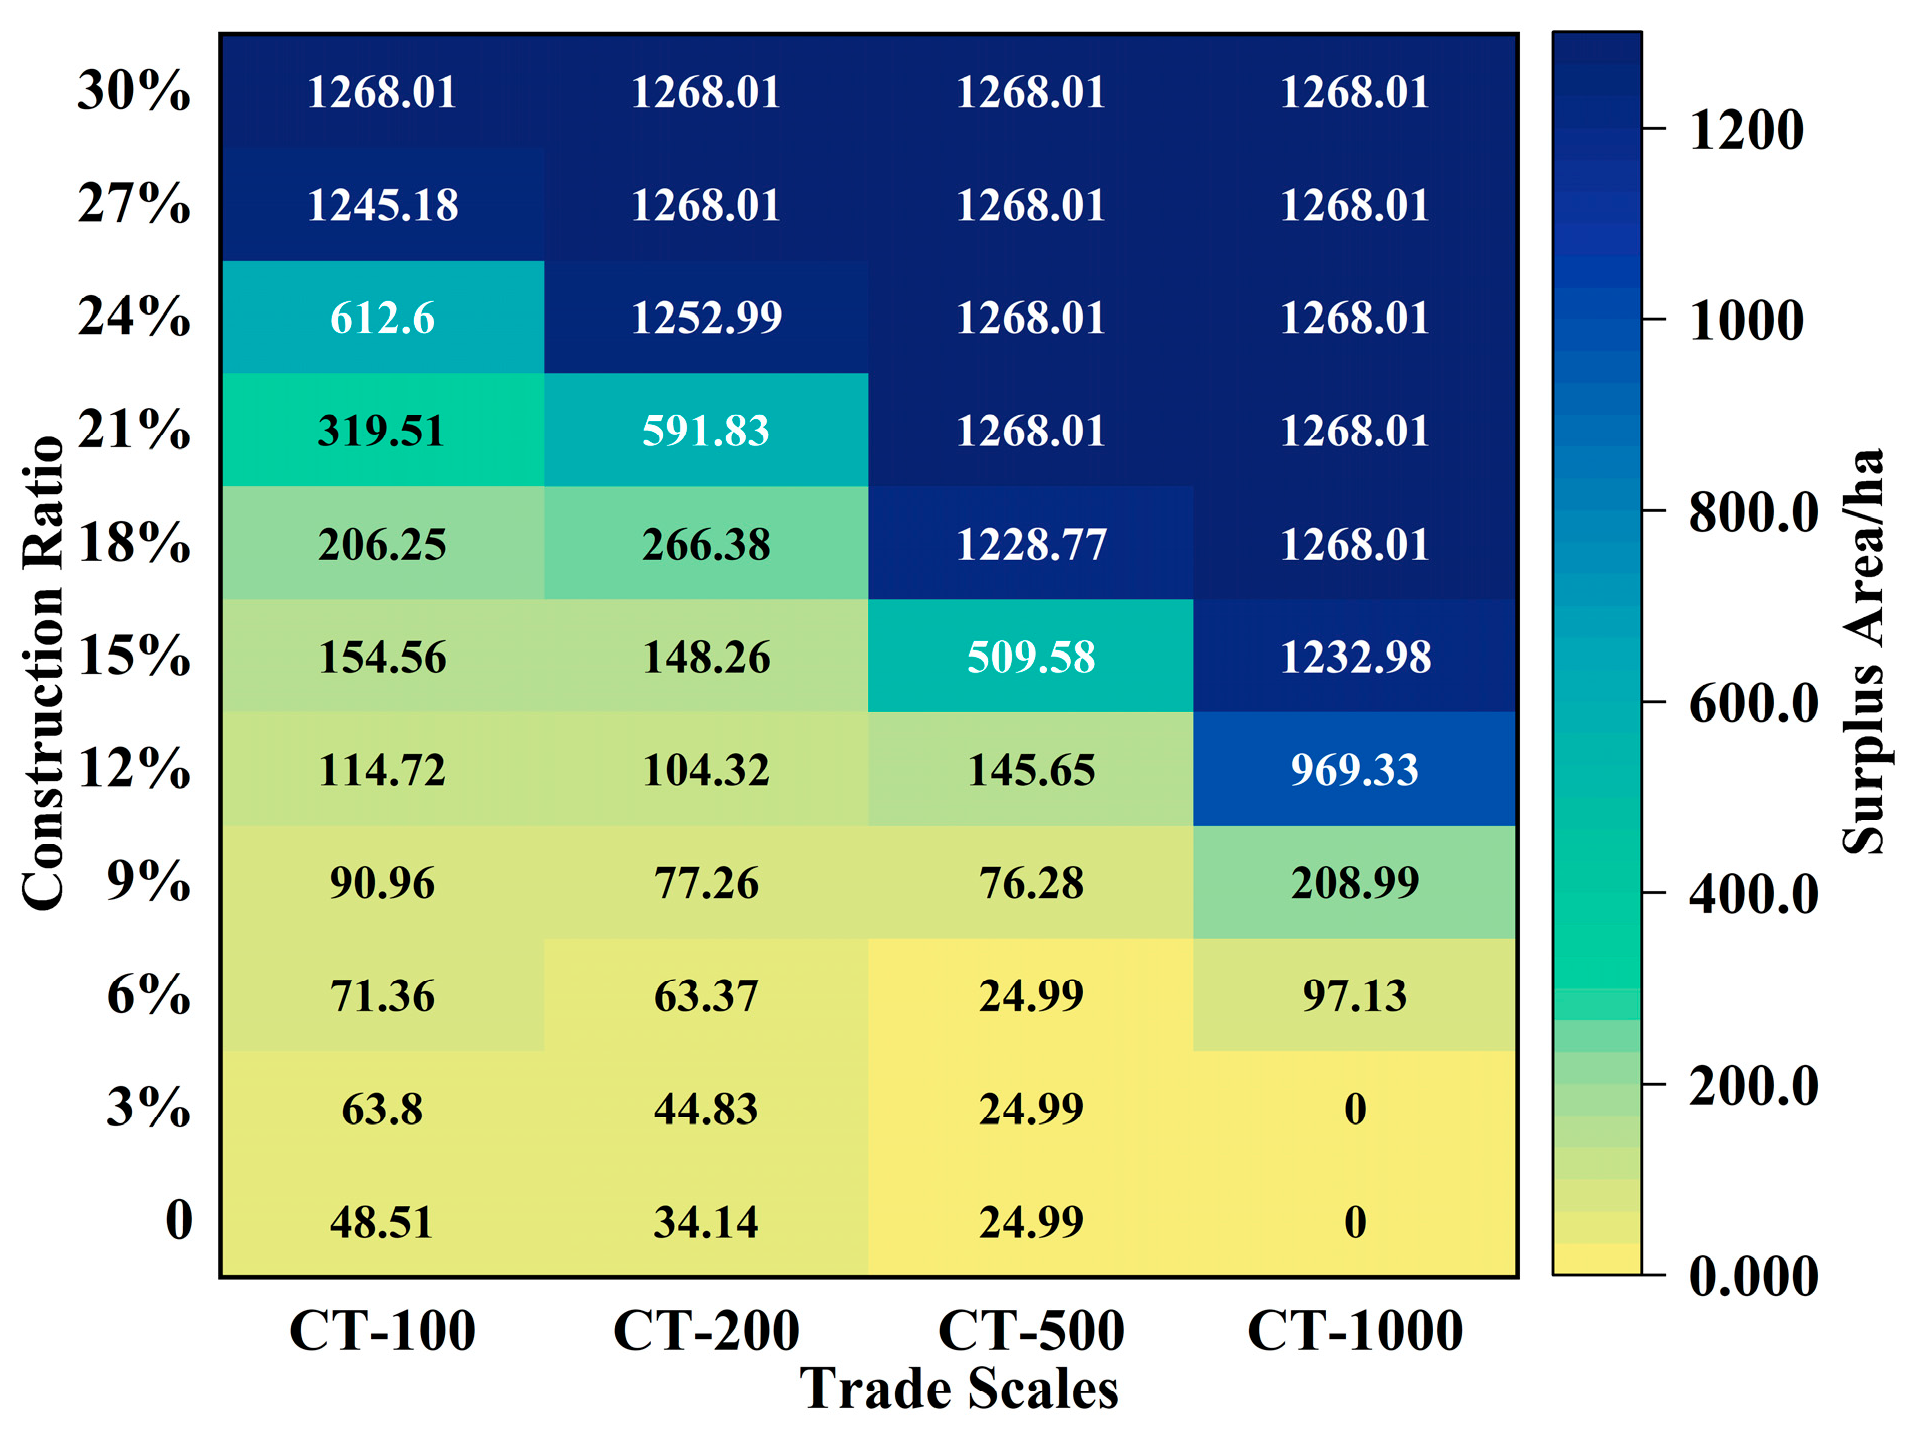
3.2.1. Surplus Area Changes with Trading Scale
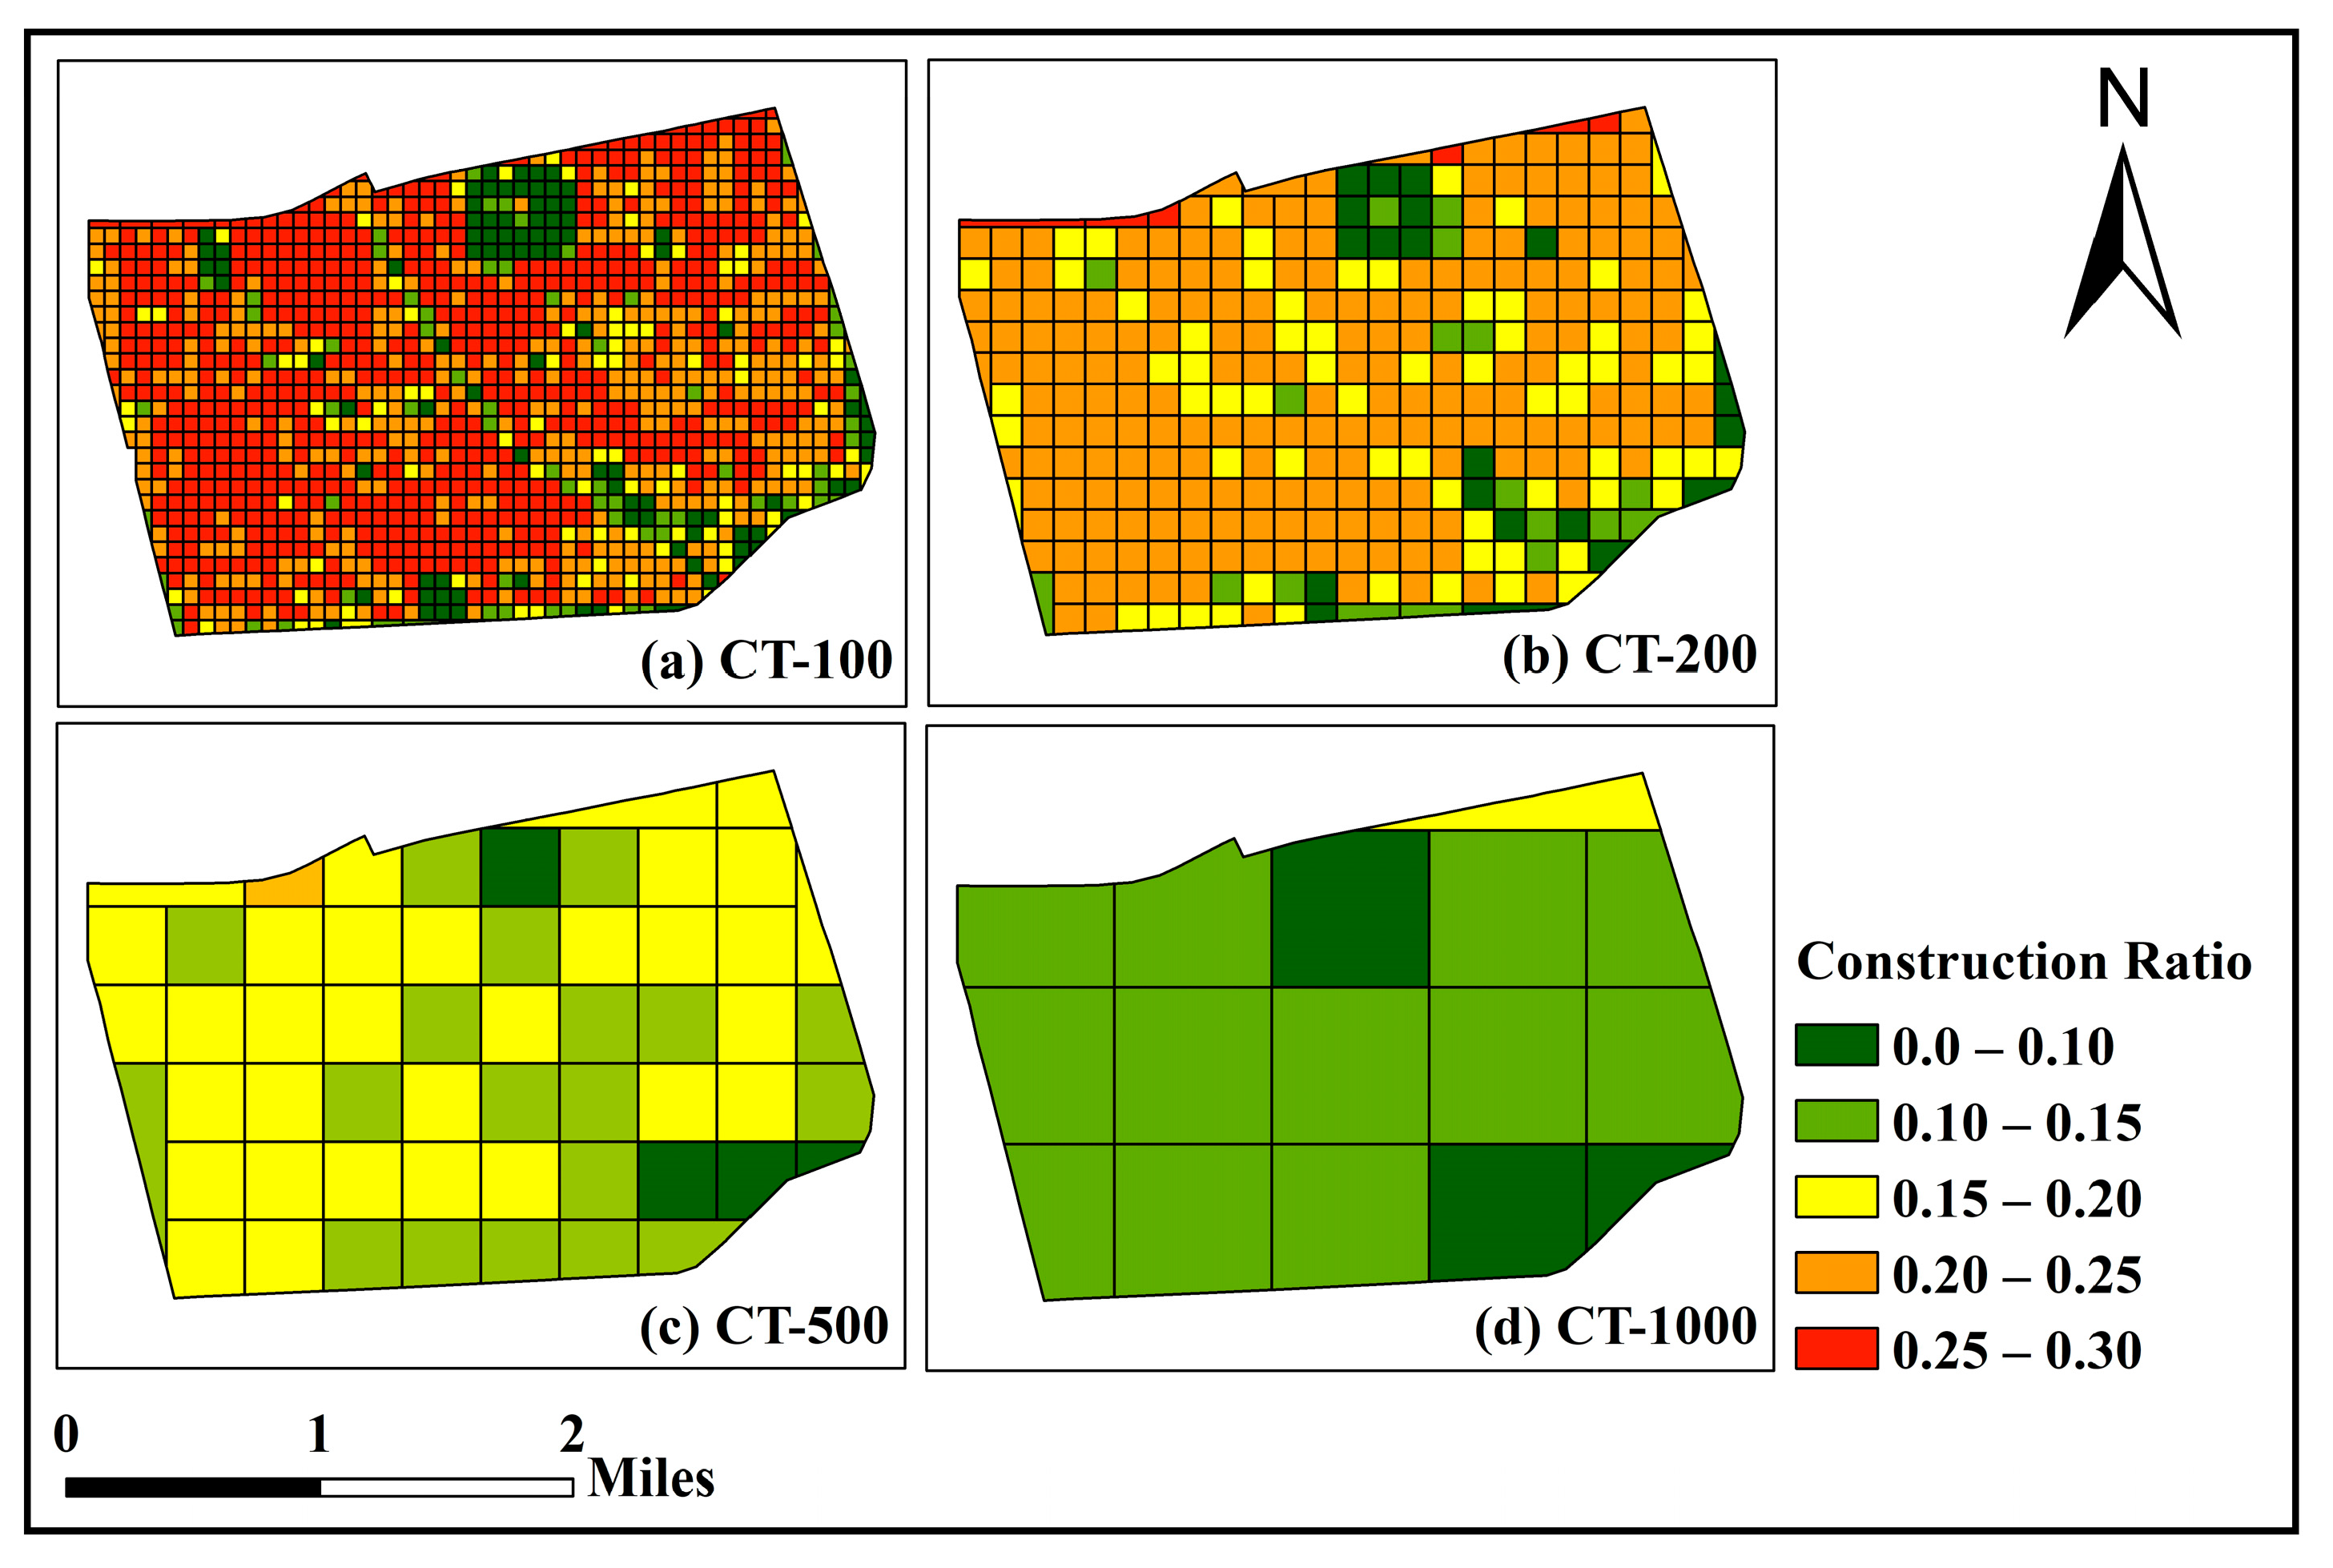
3.2.2. Construction Proportion Distribution Under Local Constraints for Different Trading Scales
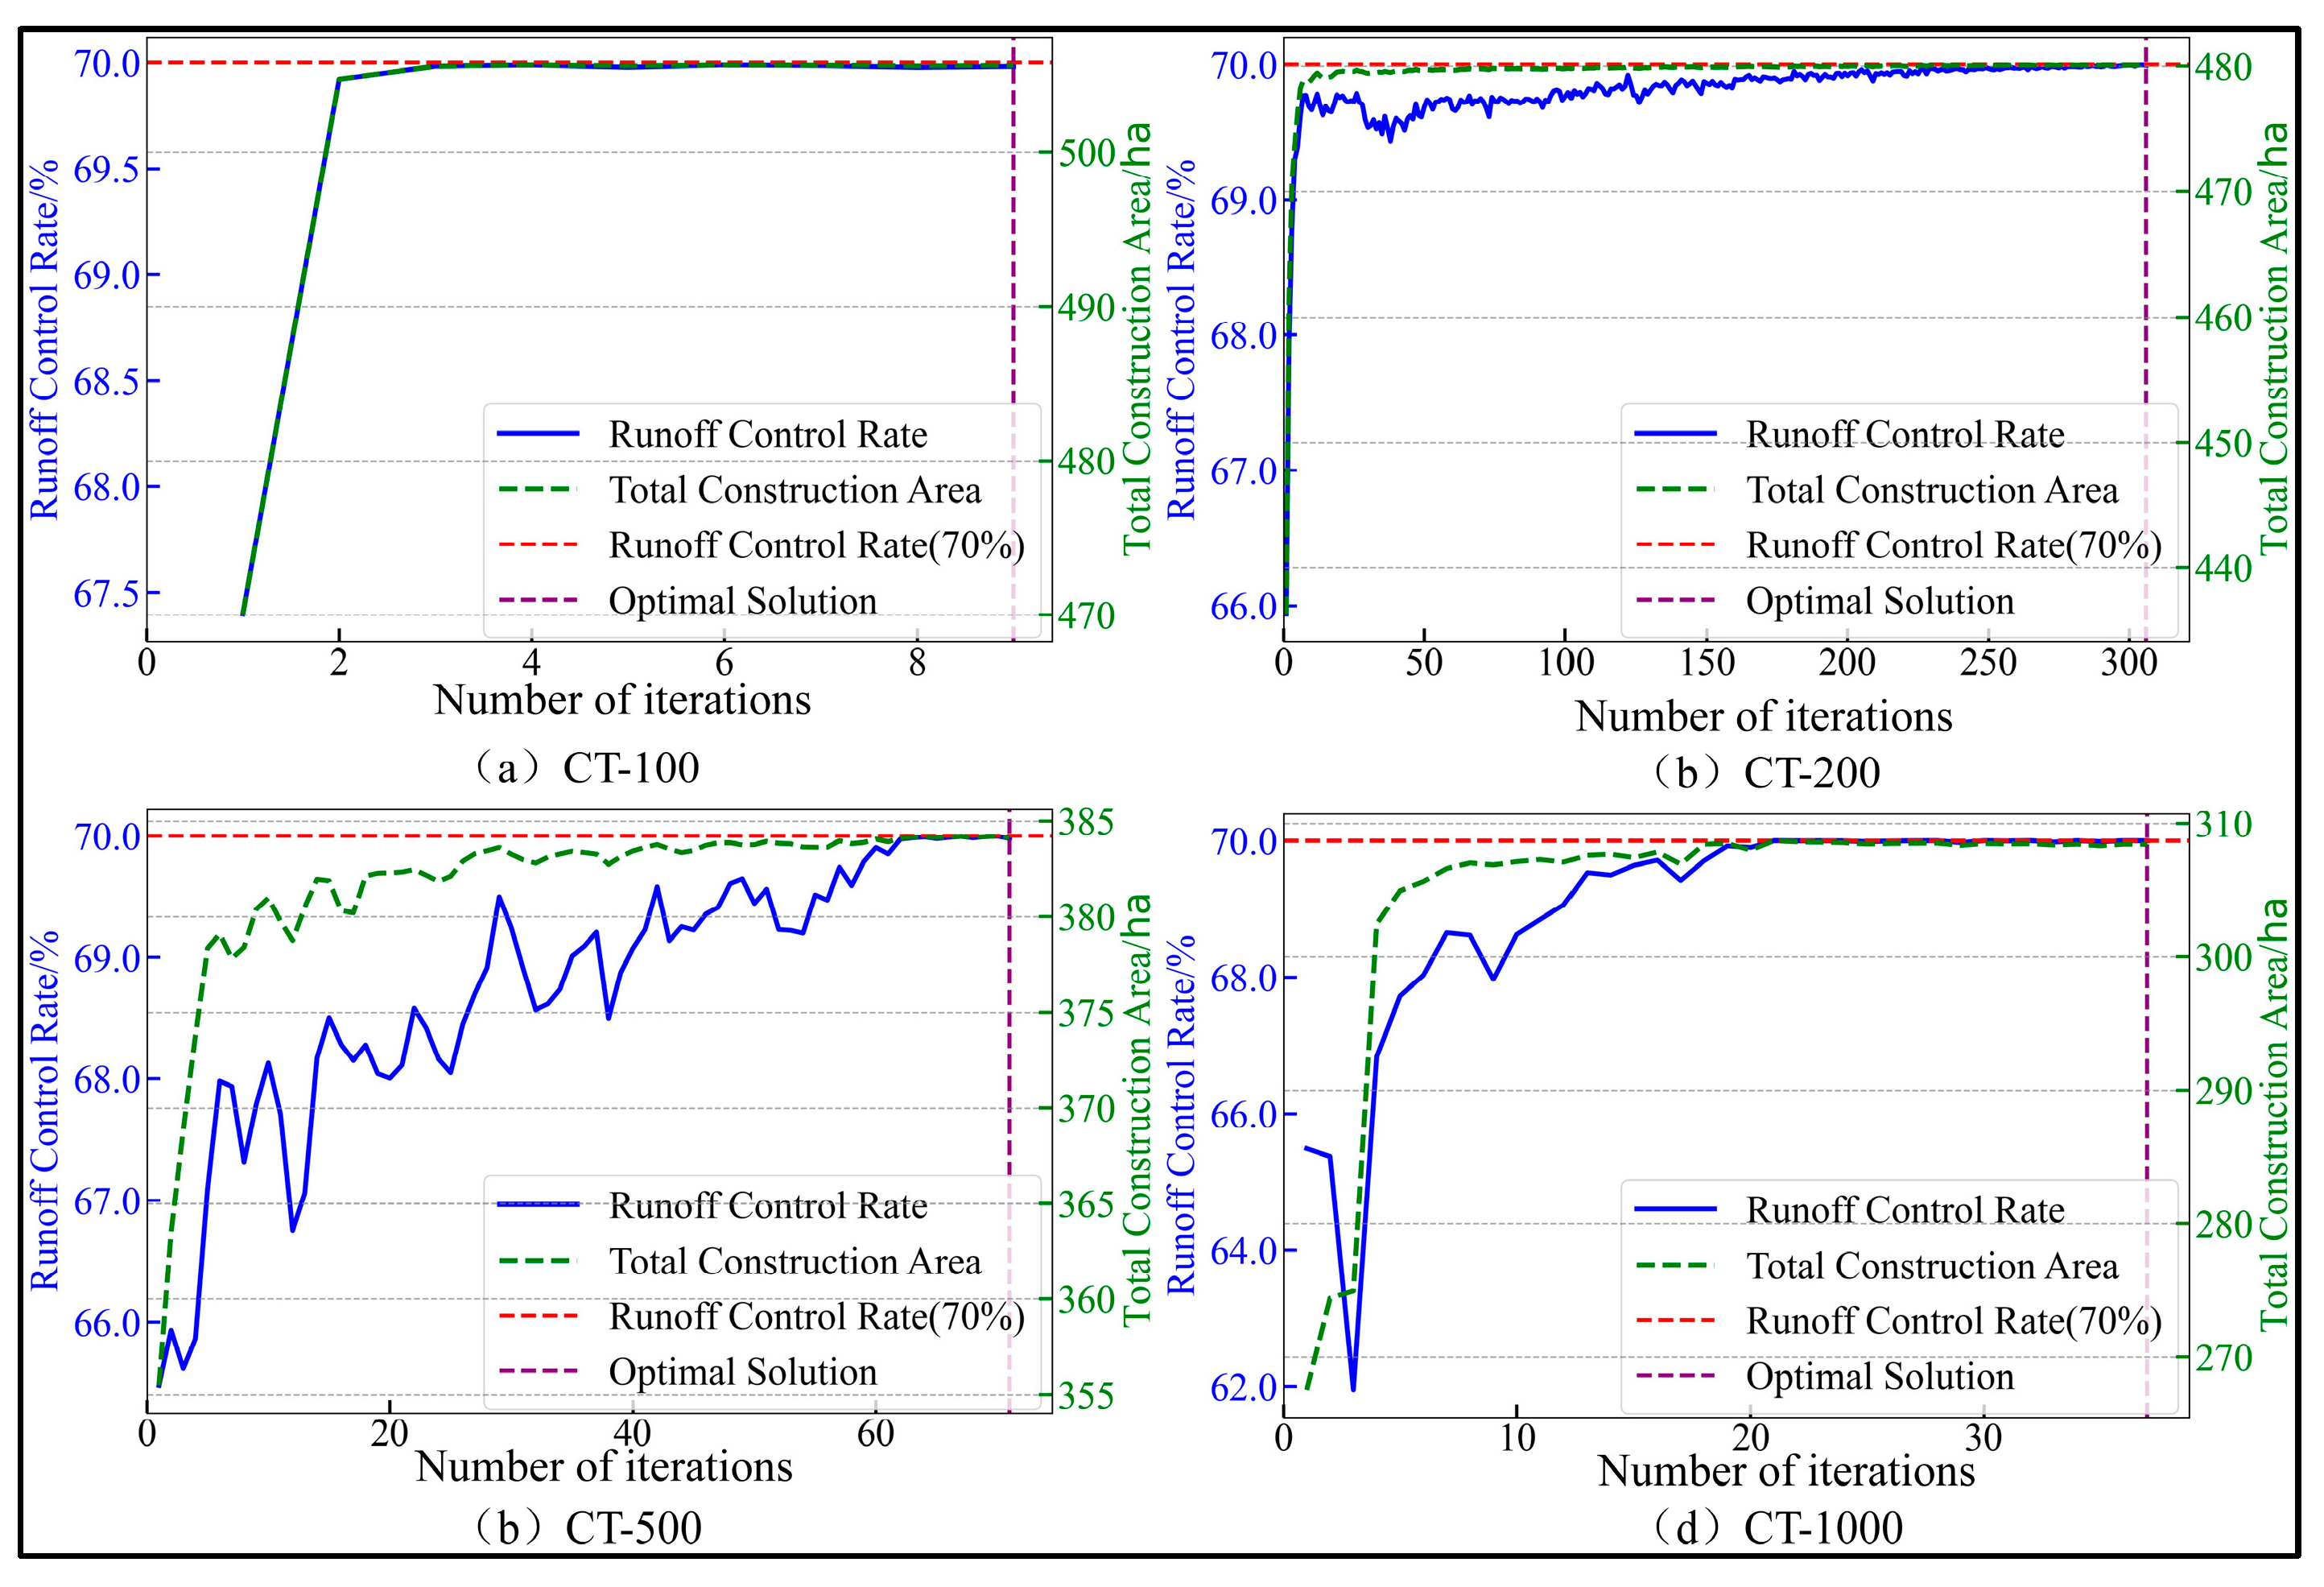
3.2.3. Construction Demand Under Global Constraints for Different Trading Scales
4. Discussion
4.1. Surplus Area Changes in Typical Regions
4.2. Limitations and Future Prospects
5. Conclusions
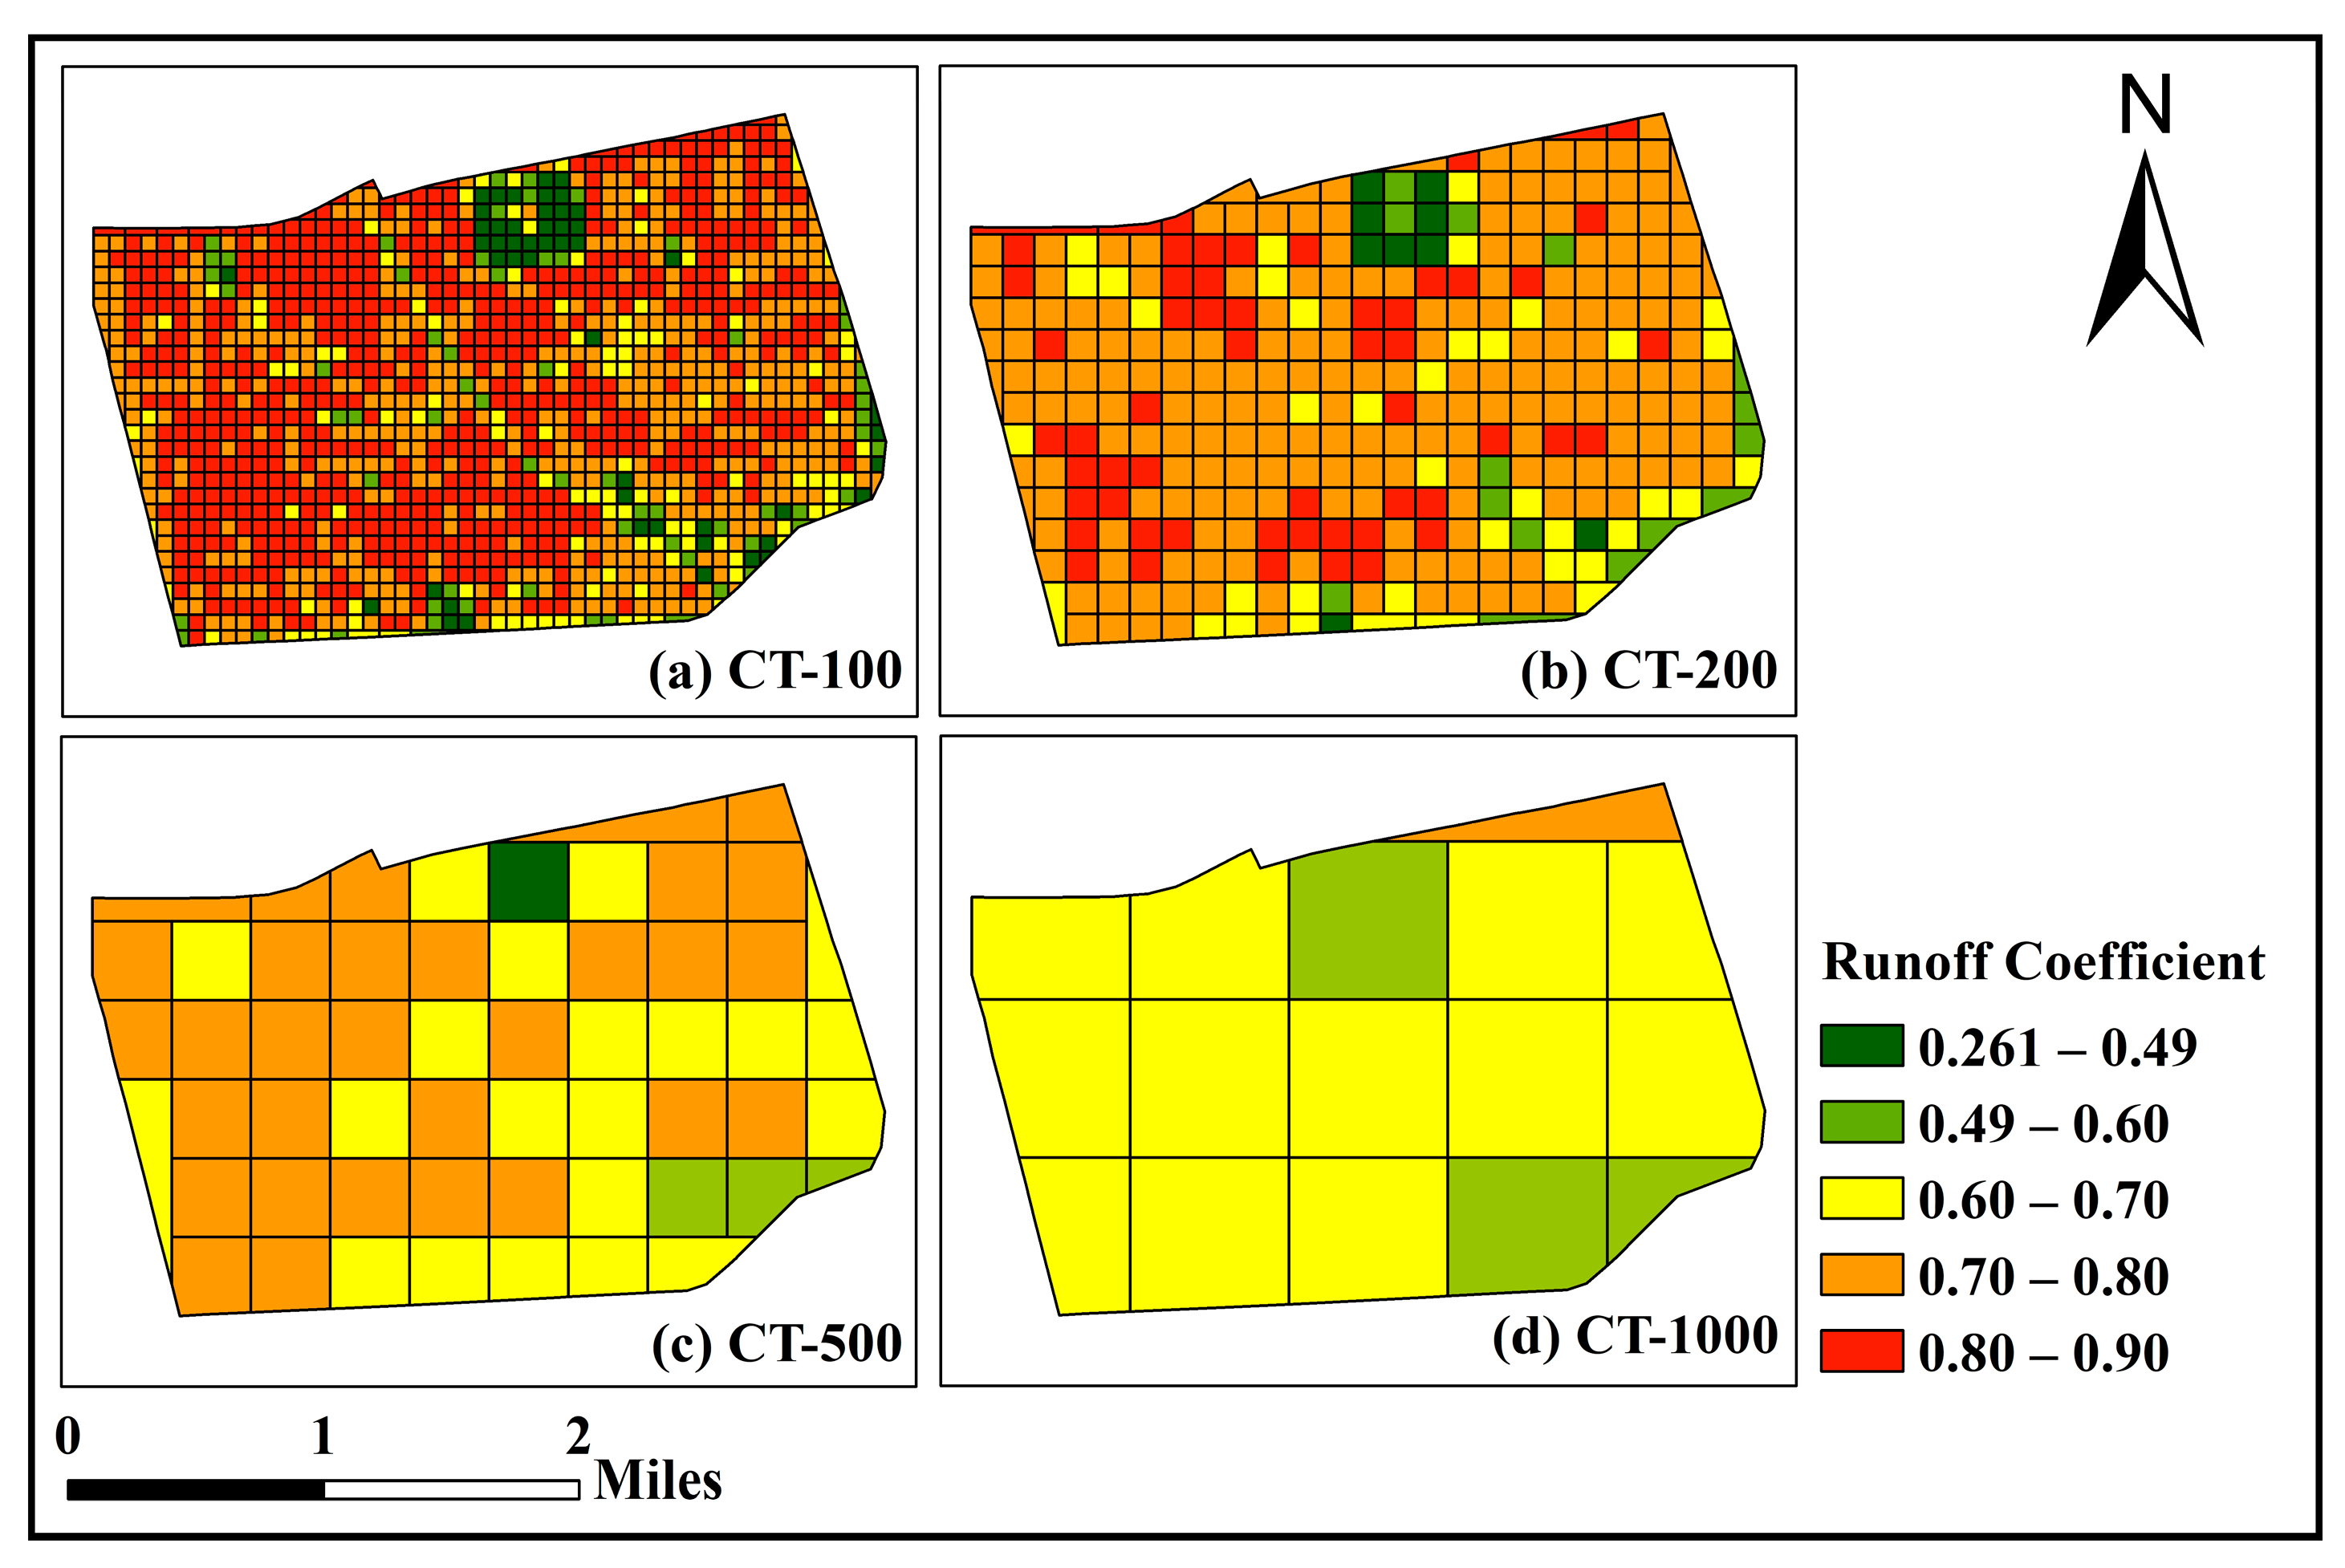
- (1)
- Small-scale grids (CT-100 and CT-200) identify “hotspot” areas within the region, with the largest runoff coefficient difference reaching 0.6. They capture local runoff reduction demand more accurately. In contrast, large-scale grids (CT-500 and CT-1000), by integrating broader regions, significantly improve runoff reduction efficiency.
- (2)
- Construction intensity is negatively correlated with runoff reduction benefits. At low construction proportions, CT-500 and CT-1000 exhibit better marginal benefits than other trading scales. At higher construction proportions, CT-100 and CT-500 show superior marginal benefits. In general, CT-500 achieves the best marginal benefits across different construction proportions, offering superior resource allocation and reduction effects, making it highly applicable in practical planning.
- (3)
- As the trading scale increases, the required LID facility area gradually decreases. The required areas for meeting the Global Constraint for CT-100, CT-200, CT-500, and CT-1000 are 505.59 ha, 480.09 ha, 384.11 ha, and 308.4 ha, respectively, with runoff control rate increases of 46.18%, 43.66%, 39%, and 33.67%. Meanwhile, to address all surplus needs under each trading scale, the required LID facility areas are 284.67 ha, 256.34 ha, 195.09 ha, and 141.81 ha, respectively. Correspondingly, the comprehensive runoff coefficients decreased by 0.283, 0.261, 0.212, and 0.153. However, once the trading scale expands beyond a certain point, the benefits gained from further expansion decrease significantly. In practical applications, the appropriate trading scale should be selected based on factors such as the specific region’s topography, precipitation characteristics, functional zone distribution, and resource allocation needs to achieve optimal resource distribution and runoff reduction effects.
- (4)
- CT-500 is considered the optimal trading scale for the study area. It effectively integrates the runoff reduction potential of surplus areas and achieves significant runoff reduction effects under different construction intensities. It avoids the high construction costs associated with smaller trading scales and overcomes the diminishing returns of larger scales, ensuring the efficiency and economy of CT.
- (5)
- Traditional functional zones, which rely on land use characteristics for trading, lack flexibility in resource allocation, and the reduction potential of some surplus units may not meet the needs of deficit units. Multi-scale grid partitioning enables trading under more equitable conditions, and CT in such a context demonstrates higher efficiency in fine-tuned resource allocation.
Author Contributions
Funding
Institutional Review Board Statement
Informed Consent Statement
Data Availability Statement
Acknowledgments
Conflicts of Interest
References
- Ayenew, W.A.; Kebede, H.A. GIS and remote sensing based flood risk assessment and mapping: The case of Dikala Watershed in Kobo Woreda Amhara Region, Ethiopia. Environ. Sustain. Indic. 2023, 18, 100243. [Google Scholar] [CrossRef]
- Iradukunda, P.; Mwanaumo, E.M.; Kabika, J. A review of integrated multicriteria decision support analysis in the climate resilient infrastructure development. Environ. Sustain. Indic. 2023, 20, 100312. [Google Scholar] [CrossRef]
- Moustakis, Y.; Papalexiou, S.M.; Onof, C.J.; Paschalis, A. Seasonality, Intensity, and Duration of Rainfall Extremes Change in a Warmer Climate. Earth’s Future 2021, 9, e2020EF001824. [Google Scholar] [CrossRef]
- Tanaka, T.; Kiyohara, K.; Tachikawa, Y. Comparison of fluvial and pluvial flood risk curves in urban cities derived from a large ensemble climate simulation dataset: A case study in Nagoya, Japan. J. Hydrol. 2020, 584, 124706. [Google Scholar] [CrossRef]
- Sui, X.; van de Ven, F.H.M. The influence of Low Impact Development (LID) on basin runoff in a half-urbanized catchment: A case study in San Antonio, Texas. J. Hydrol. 2023, 616, 128793. [Google Scholar] [CrossRef]
- Ferrans, P.; Torres, M.N.; Temprano, J.; Sánchez, J.P.R. Sustainable Urban Drainage System (SUDS) modeling supporting decision-making: A systematic quantitative review. Sci. Total Environ. 2022, 806, 150447. [Google Scholar] [CrossRef]
- Fan, Y.Y.; Wang, C.W.; Yu, H.J.; Pan, J.; Ouyang, Z. Coupling of SWMM With 2D Hydrodynamic Model for Simulation of Sponge City Construction Scheme. IOP Conf. Ser. Earth Environ. Sci. 2021, 643, 12002. [Google Scholar] [CrossRef]
- Huo, Y.C.; Wu, X.; Luan, Q.H.; Liu, J.H.; Ma, D. Effectiveness evaluation of LIDs through SWMM: A case study of typical urban unit in Handan, China. IOP Conf. Ser. Earth Environ. Sci. 2019, 344, 12056. [Google Scholar] [CrossRef]
- Yang, M.; Chen, D.; Shi, L.; He, J.; Liu, L.; Shang, X. How do construct a sponge city that can improve residents’ satisfaction? Evidence from a suburb of Huizhou City, China. Ecol. Indic. 2022, 142, 109238. [Google Scholar] [CrossRef]
- Godyń, I.; Grela, A.; Muszyński, K.; Pamuła, J. The Impact of Green Infrastructure on the Quality of Stormwater and Environmental Risk. Sustainability 2024, 16, 8530. [Google Scholar] [CrossRef]
- Mao, Y.; Li, Y.; Bai, X.; Yang, X.; Han, Y.; Fu, X. Scenario-Based Green Infrastructure Installations for Building Urban Stormwater Resilience—A Case Study of Fengxi New City, China. Sustainability 2024, 16, 3990. [Google Scholar] [CrossRef]
- Yang, B.; Zhang, T.; Li, J.; Feng, P.; Miao, Y. Optimal designs of LID based on LID experiments and SWMM for a small-scale community in Tianjin, north China. J. Environ. Manag. 2023, 334, 117442. [Google Scholar] [CrossRef] [PubMed]
- Zhao, Y.; Zhan, Y. Optimization of Large Urban Green Space Sponge Facilities Using the SWMM Model Coupled with the MOPSO Algorithm. Glob. Seabuckthorn Res. Dev. 2024, 10, 15–23. [Google Scholar] [CrossRef]
- Rong, Q.; Liu, Q.; Yue, W.; Xu, C.; Su, M. Optimal design of low impact development at a community scale considering urban non-point source pollution management under uncertainty. J. Clean. Prod. 2024, 434, 139934. [Google Scholar] [CrossRef]
- Wang, T.; Wang, H.; Wang, Z.; Huang, J. Dynamic risk assessment of urban flood disasters based on functional area division—A case study in Shenzhen, China. J. Environ. Manag. 2023, 345, 118787. [Google Scholar] [CrossRef] [PubMed]
- Zhu, Y.; Xu, C.; Yin, D.; Xu, J.; Wu, Y.; Jia, H. Environmental and economic cost-benefit comparison of sponge city construction in different urban functional regions. J. Environ. Manag. 2022, 304, 114230. [Google Scholar] [CrossRef]
- Li, S.; Wang, Z.; Wu, X.; Zeng, Z.; Shen, P.; Lai, C. A novel spatial optimization approach for the cost-effectiveness improvement of LID practices based on SWMM-FTC. J. Environ. Manag. 2022, 307, 114574. [Google Scholar] [CrossRef]
- Zhu, Y.; Xu, C.; Liu, Z.; Yin, D.; Jia, H.; Guan, Y. Spatial layout optimization of green infrastructure based on life-cycle multi-objective optimization algorithm and SWMM model. Resour. Conserv. Recycl. 2023, 191, 106906. [Google Scholar] [CrossRef]
- Dai, P.; Xu, Y.; Zhou, X. Research on the Stormwater Drainage Permit System and Runoff Transfer Trading Mechanism Based on Sponge City Construction. In Proceedings of the 2017 (12th) Urban Development and Planning Conference, Haikou, China, 25–26 October 2017; p. 7. [Google Scholar]
- Xu, Q.; Jia, Z.; Tang, S.; Luo, W.; Xu, C. Achieving Urban Stormwater Mitigation Goals on Different Land Parcels with a Capacity Trading Approach. Water 2019, 11, 1091. [Google Scholar] [CrossRef]
- Jia, Z.; Xu, C.; Luo, W. Optimizing Green Infrastructure Implementation with a Land Parcel-Based Credit Trading Approach on Different Spatial Scales. Water Resour. Manag. 2020, 34, 1709–1723. [Google Scholar] [CrossRef]
- Zhang, M.; Jia, Z.; Luo, W.; Tang, S.; Wang, S. Capacity trading approach-based analysis on optimal planning scale of sponge city. Water Resour. Hydropower Eng. 2022, 53, 112–122. [Google Scholar] [CrossRef]
- Xu, C.; Jia, Z.; Luo, W.; Xu, Q. Urban functional zone sponge capacity transaction-based method for optimization of spongecity construction. Water Resour. Hydropower Eng. 2021, 52, 1–11. [Google Scholar]
- Chen, X.; Qiao, L.; Liu, Y.; Gao, M.; Zhao, J. Risk Assessment of Rainstorm Disasters Based on Grid. J. China Hydrol. 2023, 43, 84–89. [Google Scholar] [CrossRef]
- Yang, F.; Hu, Y.; Song, L.; Zhao, J. The Acceleration Method of Urban Flood Model Based on Dynamic Grid and Local Time Step Technology. J. Tsinghua Univ. (Sci. Technol.) 2024, 64, 2132–2143. [Google Scholar] [CrossRef]
- Xu, J.; Wenze, Y.; Tan, W. A statistical study on spatial scaling effects of urban landscape pattern: A case study of the central area of the External Circle Highway in Shanghai. Acta Geogr. Sin. 2004, 59, 1058–1067. [Google Scholar]
- Ministry of Housing and Urban-Rural Development of the People’s Republic of China. Technical Guidelines for Sponge City Construction; Ministry of Housing and Urban-Rural Development of the People’s Republic of China: Beijing, China, 2014. [Google Scholar]
- Lianyungang Municipal Bureau of Housing and Urban-Rural Development (LMBOHAURD). Lianyungang Sponge City Special Plan (2016–2030); Lianyungang Municipal Bureau of Housing and Urban-Rural Development (LMBOHAURD): Lianyungang, China, 2019. [Google Scholar]
- Wang, Q.; Zhang, R.; Li, H.; Zang, X. Analysis of mechanism and optimal value of urban built environment resilience in response to stormwater flooding. Ecol. Indic. 2024, 158, 111625. [Google Scholar] [CrossRef]
- Ye, C.; Duc Dang, T.; Xu, X.; Stewart, C.J.; Arias, M.E.; Zhang, Y.; Zhang, Q. Coupled effects of future rainfall and land use on urban stormwater drainage system in Tampa, Florida (USA). Ecol. Indic. 2023, 153, 110402. [Google Scholar] [CrossRef]
- Yang, J.; Xu, Y.; Liang, J.; Tang, Y.; Liu, Z. Subcatchment division and simulation precision of rainwater pipe network model. South-North Water Transf. Water Sci. Technol. 2022, 20, 338–351. [Google Scholar] [CrossRef]
- Jiang, Y.; Li, J.; Xia, J.; Gao, J. Sensitivity identification of SWMM parameters and response patterns of runoff pollution on hydrological and water quality parameters. Ecohydrol. Hydrobiol. 2024, in press. [CrossRef]
- Hu, J.; Deng, C.; Chang, X.; Pang, A. Urban Flood Risk analysis using the SWAGU-coupled model and a cloud-enhanced fuzzy comprehensive evaluation method. Environ. Modell. Softw. 2025, 189, 106461. [Google Scholar] [CrossRef]
- Zhang, B.; Liang, Z.; Zhao, L.; Ma, L.; Zhang, S.; Gao, T.; Chen, L. Optimizing Eco-Efficiency of green Infrastructure: A comparative study of woody plant species Utilizing SWMM-HYDRUS model and Analytic Hierarchy process. Ecol. Indic. 2025, 173, 113388. [Google Scholar] [CrossRef]
- Guo, H.; Yang, J.; Dai, Q.; Xu, Q.; Tang, H. Evaluation of Sponge City Construction in Polder Areas Based on the SWMM-MIKE21 Coupling Model. Munic. Eng. Technol. 2024, 42, 164–172. [Google Scholar] [CrossRef]
- Fei, Y.; Rene, E.R.; Shang, Q.; Singh, R.P. Comprehensive effect evaluation of LID facilities implemented in sponge campuses: A case study. Ecol. Indic. 2023, 155, 110912. [Google Scholar] [CrossRef]
- Liu, X. Parameter calibration method for urban rainfall-runoff model based on runoff coefficient. Water Wastewater Eng. 2009, 35, 213–217. [Google Scholar] [CrossRef]
- GB50014-2021; Outdoor Drainage Design Standards. Ministry of Housing and Urban-Rural Development of the People’s Republic of China: Beijing, China, 2021.
- Taghizadeh, S.; Khani, S.; Rajaee, T. Hybrid SWMM and particle swarm optimization model for urban runoff water quality control by using green infrastructures (LID-BMPs). Urban For. Urban Green. 2021, 60, 127032. [Google Scholar] [CrossRef]
- Wadhwa, A.; Kumar, K.P. Selection of best stormwater management alternative based on storm control measures (SCM) efficiency indices. Water Policy 2020, 22, 702–715. [Google Scholar] [CrossRef]
- Gong, M.; Zhao, F.; Zeng, S.; Li, C. An experimental study on local and global optima of linear antenna array synthesis by using the sequential least squares programming. Appl. Soft Comput. 2023, 148, 110859. [Google Scholar] [CrossRef]
- Yao, F.; Duan, Y.; Qin, Y.; Xu, L.; Wang, Z.; Ma, Y.; Yang, X. Encounter Probability Analysis of Typhoon Precipitation and Meiyu Rain Intensity in the Yangtze-Huaihe River Basin Based on Copula Function. Water Resour. Power 2024, 42, 41–45. [Google Scholar] [CrossRef]
- Luan, B.; Yin, R.; Xu, P.; Wang, X.; Yang, X.; Zhang, L.; Tang, X. Evaluating Green Stormwater Infrastructure strategies efficiencies in a rapidly urbanizing catchment using SWMM-based TOPSIS. J. Clean. Prod. 2019, 223, 680–691. [Google Scholar] [CrossRef]
- Gao, M.; Chi, Y.; Zhao, J.; Jiang, Y.; Fu, C. Composition Ratio of Low Impact Development Facilities Based on Marginal Benefit Analysis. China Water Wastewater 2019, 35, 127–132, 138. [Google Scholar]
- Li, M.; Yin, H.; Tang, S. Research on Cost-Effectiveness of LID Construction under Support of SUSTAIN System: A Case Study of Gulou District, Nanjing. Landsc. Archit. 2020, 27, 57–63. [Google Scholar] [CrossRef]
- Xu, Q.; Jia, Z.; Luo, W.; Tang, S.; Ma, X.; Wu, S.; Shao, Z.; Song, W. Research on Sponge City Suitability Based on Functional Area Difference—A case Study of Yangzhou City. China Rural Water Hydropower 2018, 53–57. Available online: https://kns.cnki.net/kcms2/article/abstract?v=fNwONIwGMRLMZSZCQ4GhWiMrE10dmkCfkXi4lcDxnUksUFDhNMf2Nf5lMspy6I24sQLkgSFEN9QJgOVE9BD6d6wqtqpbDiGNYIjwwCc7p-bA0r9GaplWBUANyYaQ-mqo6US5UmHIVA2fTNMqD7y661gu4Dtr_BTZjn3q3jN56SsFmZcM14IF8_9pfttzDIAy2GEAYHstYYI=&uniplatform=NZKPT&language=CHS (accessed on 10 May 2025).
- Ji, M.; Bai, X. Construction of the sponge city regulatory detailed planning index system based on the SWMM model. Environ. Technol. Innov. 2021, 23, 101645. [Google Scholar] [CrossRef]
- Liu, C.; Li, W.; Zhao, C.; Xie, T.; Jian, S.; Wu, Q.; Xu, Y.; Hu, C. BK-SWMM flood simulation framework is being proposed for urban storm flood modeling based on uncertainty parameter crowdsourcing data from a single functional region. J. Environ. Manag. 2023, 344, 118482. [Google Scholar] [CrossRef]
- Tanim, A.H.; Smith-Lewis, C.; Downey, A.R.J.; Imran, J.; Goharian, E. Bayes_Opt-SWMM: A Gaussian process-based Bayesian optimization tool for real-time flood modeling with SWMM. Environ. Modell. Softw. 2024, 179, 106122. [Google Scholar] [CrossRef]
- Anvigh, R.M.; Silva, J.F.; Macedo, J. Designing Sustainable Drainage Systems as a Tool to Deal with Heavy Rainfall—Case Study of Urmia City, Iran. Sustainability 2024, 16, 7349. [Google Scholar] [CrossRef]
- Zhang, T.; Zhou, Y.; Li, M.; Zhang, H.; Wang, T.; Tian, Y. Impacts of Urbanization on Drainage System Health and Sustainable Drainage Recommendations for Future Scenarios—A Small City Case in China. Sustainability 2022, 14, 16998. [Google Scholar] [CrossRef]


| Data Types | Source | Time |
|---|---|---|
| Satellite map | Gaode Map | 2020 |
| Digital elevation model (DEM) | China Geospatial Data Cloud | 2021 |
| Pipe networks | Lianyungang Municipal Bureau of Housing and Urban-Rural Development | 2012 |
| Rainfall data | Lianyungang Municipal Bureau of Housing and Urban-Rural Development | 2014 |
| Region Characteristics | Impervious Area Proportion (%) | Composite Runoff Coefficient |
|---|---|---|
| Central Area with High Density | >70 | 0.6–0.8 |
| Central Area with Moderate Density | 50–70 | 0.5–0.7 |
| Residential Area with Low Density | 30–50 | 0.4–0.6 |
| Residential Area with Very Low Density | <30 | 0.3–0.5 |
| Scale | 1 Years | 2 Years | 3 Years | 5 Years |
|---|---|---|---|---|
| CT-100 | 0.725 | 0.763 | 0.781 | 0.800 |
| CT-200 | 0.703 | 0.741 | 0.758 | 0.777 |
| CT-500 | 0.657 | 0.692 | 0.710 | 0.729 |
| CT-1000 | 0.600 | 0.634 | 0.652 | 0.672 |
| Parameter Name | Value Range | Reference Value | Calibrated Value |
|---|---|---|---|
| N-Imperv | 0.01–0.05 | 0.01 | 0.023 |
| N-Perv | 0.05–0.4 | 0.25 | 0.25 |
| D-Imperv (mm) | 0–3 | 2.5 | 2.5 |
| D-Perv (mm) | 2–10 | 7.0 | 7 |
| Max. Infil. Rate (mm/h) | 10–100 | 90 | 76 |
| Min. Infil. Rate (mm/h) | 0–10 | 4 | 6.6 |
| Decay constant (1/h) | 0–7 | 4 | 2 |
| Drying Time (days) | 1–7 | 7 | 7 |
| Runoff Coefficient | CT-100 | CT-200 | CT-500 | CT-1000 |
|---|---|---|---|---|
| 0–0.49 (Surplus) | 48.51 | 34.14 | 24.99 | 0 |
| 0.491–0.6 (Deficit) | 60.4 | 55.05 | 51.29 | 209 |
| 0.601–0.7 (Deficit) | 105.34 | 149.18 | 471.25 | 1023.99 |
| 0.701–0.8 (Deficit) | 446.48 | 814.62 | 720.48 | 35.02 |
| 0.801–0.9 (Deficit) | 607.28 | 215.02 | 0 | 0 |
| Trading Scales | 2 Years | 3 Years | 5 Years |
|---|---|---|---|
| CT-100 | 69.98% | 66.48% | 62.83% |
| CT-200 | 69.95% | 66.93% | 63.98% |
| CT-500 | 69.9% | 67.57% | 65.0% |
| CT-1000 | 69.97% | 67.95% | 65.74% |
| Trading Scales | Number of Units | |||||||||||
|---|---|---|---|---|---|---|---|---|---|---|---|---|
| 0 | 3% | 6% | 9% | 12% | 15% | 18% | 21% | 24% | 27% | 30% | ||
| CT-100 | 98 | −12.21 | −9.92 | −7.64 | −5.42 | −3.28 | −1.20 | 0.84 | 2.82 | 4.79 | 6.69 | 8.50 |
| CT-200 | 25 | −10.79 | −8.41 | −6.09 | −3.84 | −1.65 | 0.45 | 2.52 | 4.5 | 6.42 | 8.28 | 10.04 |
| CT-500 | 4 | −7.88 | −5.35 | −2.88 | −0.53 | 1.78 | 4.05 | 6.2 | 8.28 | 10.28 | 12.22 | 14.11 |
| CT-1000 | 1 | −4.68 | −2.11 | 0.33 | 2.7 | 5.01 | 7.28 | 9.35 | 11.48 | 13.44 | 15.34 | 17.19 |
Disclaimer/Publisher’s Note: The statements, opinions and data contained in all publications are solely those of the individual author(s) and contributor(s) and not of MDPI and/or the editor(s). MDPI and/or the editor(s) disclaim responsibility for any injury to people or property resulting from any ideas, methods, instructions or products referred to in the content. |
© 2025 by the authors. Licensee MDPI, Basel, Switzerland. This article is an open access article distributed under the terms and conditions of the Creative Commons Attribution (CC BY) license (https://creativecommons.org/licenses/by/4.0/).
Share and Cite
Liu, A.-K.; Xu, Q.; Zhu, W.-J.; Zhang, Y.; Huang, D.-L.; Xie, Q.-H.; Jiang, C.-B.; Wang, H.-R. Multi-Scale Sponge Capacity Trading and SLSQP for Stormwater Management Optimization. Sustainability 2025, 17, 4646. https://doi.org/10.3390/su17104646
Liu A-K, Xu Q, Zhu W-J, Zhang Y, Huang D-L, Xie Q-H, Jiang C-B, Wang H-R. Multi-Scale Sponge Capacity Trading and SLSQP for Stormwater Management Optimization. Sustainability. 2025; 17(10):4646. https://doi.org/10.3390/su17104646
Chicago/Turabian StyleLiu, An-Kang, Qing Xu, Wen-Jin Zhu, Yang Zhang, De-Long Huang, Qing-Hai Xie, Chun-Bo Jiang, and Hai-Ruo Wang. 2025. "Multi-Scale Sponge Capacity Trading and SLSQP for Stormwater Management Optimization" Sustainability 17, no. 10: 4646. https://doi.org/10.3390/su17104646
APA StyleLiu, A.-K., Xu, Q., Zhu, W.-J., Zhang, Y., Huang, D.-L., Xie, Q.-H., Jiang, C.-B., & Wang, H.-R. (2025). Multi-Scale Sponge Capacity Trading and SLSQP for Stormwater Management Optimization. Sustainability, 17(10), 4646. https://doi.org/10.3390/su17104646