Article

Human Capital Spending and Its Impact on Economic Growth in Saudi Arabia: An NARDL Approach

by
Fakhre Alam
1,*,
Harman Preet Singh
2,
Ajay Singh
2,
Yaser Hasan Al-Mamary
2,
Aliyu Alhaji Abubakar
2 and
Vikas Agrawal
3
1
Department of Economics and Finance, College of Business Administration, University of Ha’il, Ha’il 81451, Saudi Arabia
2
Department of Management and Information Systems, College of Business Administration, University of Ha’il, Ha’il 81451, Saudi Arabia
3
Davis College of Business, Jacksonville University, 2800 University Blvd. N, Jacksonville, FL 32211, USA
*
Author to whom correspondence should be addressed.
Sustainability 2025, 17(10), 4639; https://doi.org/10.3390/su17104639
Submission received: 20 March 2025 / Revised: 6 May 2025 / Accepted: 13 May 2025 / Published: 19 May 2025
(This article belongs to the Section Health, Well-Being and Sustainability)

Abstract

:
The principal objectives of this study were to determine how government spending on human capital, specifically on education and healthcare, impacts Saudi Arabia’s economic growth and its policy implications for sustained economic growth and development. Given the above objectives, this study examined the short-term dynamics and long-term relationships between government spending on human capital, measured by per capita education and healthcare expenditures, and its impact on Saudi Arabia’s economic growth, measured by per capita real GDP, from 1985 to 2021. The Non-linear Auto-regressive Distributed Lag (NARDL) models were used to estimate and examine the relationships. The study concluded that per capita GDP is negatively correlated with per capita government spending on healthcare and positively correlated with per capita spending on education in Saudi Arabia. Per capita GDP is also positively related to exports per capita. The results of the coefficient symmetry test show that per capita spending on healthcare and education causes long-term, asymmetric effects on Saudi Arabia’s per capita GDP, that is, the decline in per capita GDP resulting from a decrease in education spending per capita is larger than the increase in per capita GDP resulting from an increase in education spending per capita. However, the decline in per capita GDP resulting from an increase in healthcare spending per capita is larger than the increase in per capita GDP resulting from a decrease in healthcare spending per capita. The study also found unidirectional causality from per capita spending on healthcare, education, and exports to per capita GDP. Therefore, this study infers that increases in government healthcare spending reduce economic growth, whereas increases in spending on education contribute to it. Saudi Arabia’s economy also experiences export-led economic growth. The results of this study provide the government and policymakers with valuable insights with respect to the efficient allocation of scarce government resources to education and healthcare for sustained economic growth and development.

1. Introduction

Achieving a high level of economic growth is the primary macroeconomic goal of a country [1], as it is one of the crucial indicators of a country’s overall economic health [2,3]. A nation’s economic growth and development primarily hinge on its people and economic resources [4]. An efficient national workforce helps to utilize scarce resources efficiently [5,6]. Human capital, which includes people’s health, education, knowledge, and training, significantly impacts their ability to utilize limited resources effectively and achieve rapid growth, development, and technological advancements [7,8]. A nation’s socioeconomic progress depends on its educational system [9,10]. The elimination of crime, poverty, unemployment, and disease is facilitated by education [10,11,12]. Additionally, it is vital to the development of technology and the acquisition of diverse skills by individuals, both of which are essential for a country’s economic prosperity [13].
After realizing the value of education for a country’s progress and development, Saudi Arabia began developing large-scale educational infrastructure in the late 1990s [14]. Since then, a significant portion of its overall government spending has been allocated to education. During the period of 1985–2021, the average annual growth rate of government expenditure on education was 10.4%, and that of healthcare expenditure was 13.4%. Government per capita expenditure on education increased from SAR 3165 in 1985 to SAR 5553 in 2021. The expenditure on education grew at an annual rate of 2.1% from 1985 to 2021. Similarly, government healthcare expenditure increased from SAR 1083 per capita in 1985 to SAR 2343 in 2021. Government healthcare expenditure increased at an annual rate of 3.2% from 1985 to 2021. In relative terms, overall government spending dropped from 31.9% of GDP in 1985 to 24.6% in 2018, as reported by [15]. Public expenditures on education rose from 5.3% of GDP in 1985 to 7.5% in 2018 [16], despite a decline in overall public expenditures.
Furthermore, the percentage allocated to education grew dramatically from 16.7% of total government spending in 1985 to 30.7% in 2018 [17]. This indicates that Saudi Arabia, in keeping with Vision 2030, has been making significant investments in education to build human capital and fulfill its requirement for a workforce with a high level of education. On the other hand, government spending on healthcare increased from 1.83% of GDP in 1985 to 3.19% in 2018. In 1985, government spending on healthcare accounted for 5.72% of total government spending, further increasing to 12.94% in the year 2018 (SAMA, The Saudi Arabian Monetary Agency (SAMA) publishes data on its website (https://www.sama.gov.sa) on government spending on healthcare and education at current prices. Using the GDP deflator, these data were converted to real values at constant prices, and the percentage of spending was computed.
Previous studies have generally demonstrated that investments in healthcare and education can support a country’s long-term economic growth by cultivating a knowledgeable, healthy, and productive workforce [18,19,20]. Government spending on education can also accelerate a nation’s economic recovery in the short term by reviving a faltering economy [18]. For wealthy nations, healthcare and education spending appear to positively impact economic growth [19]. However, for developing nations, the findings are less consistent [20,21,22]. While a previous study [20] found evidence to the contrary in 49 African countries, other studies in Namibia [21] and Bangladesh [22] found a positive link between expenditure on both healthcare and education and economic growth. A meta-analysis [19] concluded that public spending on education is positively related to economic growth, but government spending on healthcare is negatively correlated. However, several empirical research studies on developing countries have unequivocally demonstrated a positive relationship between government spending on healthcare and economic growth [23,24,25,26,27]. Similarly, government spending on education and economic growth are positively correlated [28,29,30,31].
Saudi Arabia’s economy is mainly dependent on oil-based exports. Hence, from both the demand and supply sides, any change in oil production and exports can directly affect economic growth [32,33,34,35,36].
It is imperative to investigate whether the government’s substantial investments in education and healthcare foster Saudi Arabia’s economic growth and development [37,38]. Specifically, the current study seeks to answer two main research questions: (1) Does the government’s per capita education spending have long-run positive and asymmetric effects on GDP per capita in Saudi Arabia? (2) Does the government’s per capita spending on healthcare have long-run positive and asymmetric effects on GDP per capita in Saudi Arabia?
In recent years, Saudi Arabia has sought alternative sources of sustained economic growth and development beyond oil exports through large-scale investment in education. Hence, the core objective of this study is to determine how government spending on human capital—specifically, spending on education and healthcare—impacts Saudi Arabia’s economic growth and its policy implications for sustained economic growth and development. This study offers the government and policymakers valuable insights into the efficient allocation of scarce government resources, with the goal of achieving sustained economic growth and development.

2. Literature Review

2.1. Theoretical Underpinning

The impact of education, health, and exports on economic growth can be theoretically explained through several established economic frameworks and theories.
Human capital theory posits that education enhances workforce skills and productivity, thereby boosting economic output [39]. Better educated workers are more innovative and adaptable to new technologies, contributing to long-term economic growth. The endogenous growth theory posits that education promotes knowledge accumulation and innovation, which are crucial drivers of sustained economic growth [40,41]. It creates positive externalities, such as technological spillovers. The Solow growth model, augmented for human capital, proposes that human capital, including education, is a key input in the production function and is essential for increasing per capita income and productivity levels [42].
Health can also be treated as a part of human capital [43]. Good health increases worker productivity by reducing absenteeism and extending working life, contributing to higher economic output. The Demographic Transition Theory states that improvements in health reduce mortality rates, leading to demographic transitions that enable the population to contribute more effectively to economic activities. Macroeconomic productivity models explain that healthier populations are associated with reduced healthcare costs, allowing resources to be reallocated to productive investments, thereby enhancing GDP growth.
The export-led growth hypothesis states that exports enable countries to specialise based on comparative advantage (Ricardian trade theory) and access larger international markets, thereby driving productivity and economic growth. Endogenous growth models suggest that exports facilitate technology transfer and learning-by-doing effects, enhancing innovation and overall economic performance. The balance-of-payments constraint theory states that sustained growth depends on a country’s ability to finance imports with export earnings [44].
There can also be synergy between education and health. Educated individuals are more likely to adopt healthy behaviours, and a healthy population can better utilise educational opportunities, creating a virtuous cycle for economic growth [45].
Exports can contribute to education and health. Export revenues can be reinvested in education and healthcare systems, enhancing human capital development.

2.2. Empirical Evidence

The quality of education, measured by cognitive skills, is more important than the quantity of schooling for long-term economic growth [46]. In a cross-country study, a positive correlation was found between educational attainment and economic growth [47].
A 2013 study [18] examined the impact of government spending on healthcare and education on economic growth in 25 EU member states. The authors used fixed-effects models to evaluate data from 1995 to 2010. They concluded that government spending on the healthcare and education sectors boosted economic growth during both recessionary and non-recessionary periods.
Applying OLS and GMM panel estimates to 49 African countries, using data from 1996 to 2010, it was found that public healthcare and education spending negatively impact economic growth [48]. The authors of [19] conducted a meta-analysis of 306 estimates from 31 studies to investigate the relationship between public healthcare, education spending, and economic development. Their analysis showed that public spending on healthcare was negatively correlated with economic growth, but government spending on education was positively correlated with economic growth. Using vector autoregression, the relationship between government expenditures on healthcare and education and GDP growth in Namibia was analyzed, and it was found that these expenditures positively impact GDP growth [21]. Using the ARDL technique, the authors of [22] investigated the relationship between public expenditures on health and education and economic growth in Bangladesh. They inferred that public expenditures on healthcare had a positive long-term impact but a negative short-term impact on Bangladesh’s economic growth. Additionally, they discovered that government expenditures on education had short-term favourable effects but long-term negative ones on economic growth.
Data from 12 Asia–Pacific countries covering 1981 to 2011 were examined by the authors of [28]. They concluded that government investment in education positively influences GDP in nine countries they examined using VECM and Johansen cointegration techniques. Using the ARDL model, an investigation of Turkish time-series data from 1970 to 2012 revealed that education expenditure favoured Turkey’s economic growth [29]. In their study, the authors of [49] employed Smooth Transition Regression (STR) and found a positive and non-linear relationship between education spending and economic development in Spain. The authors of [30] studied Vietnam to examine the relationship between public education expenditure and economic growth from 2006 to 2019. Using Granger causality and VAR for their data analysis, these researchers found a two-way causal relationship between public investment in education and economic growth. The results of the cointegration study also showed a favourable relationship between GDP growth and public spending on education.
Using the ARDL method, a study on the impact of education spending on Saudi Arabia’s economy from 1990 to 2017 concluded that spending on education positively impacted Saudi Arabia’s economic growth [31]. Specifically, the analysis revealed that a 1% increase in education spending was associated with a 0.89% increase in long-term economic growth. The study also estimated that, in the near run, a 1% increase in education spending translated into a 0.3% rise in domestic production volume.
Improvements in health increase labour productivity and income growth in developing countries [45]. Better health conditions significantly contribute to economic growth, particularly through increased physical and cognitive labour productivity [50].
Applying the GMM technique to data from 1995 to 2014, an analysis of the link between government healthcare expenditures and economic growth in sub-Saharan Africa revealed that health spending boosted economic expansion [51]. A study of the effects of healthcare spending using empirical data was conducted to examine the effect of health care spending and economic growth [52]. The study found a bidirectional causal relationship but a unidirectional causal association between GDP per capita and healthcare spending. The study demonstrated that healthcare expenditure had a favourable influence on economic growth. Another study examined the relationship between US government expenditure on healthcare and economic growth [53]. The study used visual analytics to examine US healthcare and economic data from 2003 to 2014. It found that government expenditure on healthcare positively impacts economic growth, GDP, income, and labour productivity. The findings highlight the positive effects of healthcare spending, which boosted productivity, improved human capital, and promoted economic growth.
Based on a thorough analysis of empirical research, an investigation into the driving forces of Saudi Arabia’s privatisation of the healthcare industry concluded that despite growth in the privatisation of the health sector, the public healthcare system remained essential in improving the health of Saudi Arabians [54]. The study further suggested that the government should support public healthcare to ensure everyone in Saudi Arabia can access high-quality, cost-effective healthcare. An investigation based on panel data of 21 developing nations using the panel threshold model examined the relationships between healthcare spending, human capital development, and economic growth from 2000 to 2016 [52]. The study demonstrated that health spending and economic growth had significant interval implications due to significant variations in human capital development. At low levels of human capital development, a significant negative correlation exists between healthcare spending and economic growth; at intermediate levels, a marginally positive correlation is observed; and at high levels, a substantial positive correlation is present. Using annual data from 1975 to 2018, the authors of [55] investigated the link between healthcare expenditures and economic growth in Turkey. Based on Granger causality testing and Johansen cointegration analysis, they found that healthcare spending had a substantial and favourable long-run influence on economic growth.
Countries focusing on export-oriented policies, such as the East Asian Tigers, have experienced rapid and sustained economic growth [56,57]. It was found that there exists a strong positive relationship between openness to trade, measured by exports and imports, and long-term economic growth [58].
To analyse the linkages between exports and economic growth, a study was conducted on Bulgaria (1994–2004), the Czech Republic (1993–2002), and Poland (1995–2004) [59]. It was found that exports contributed to the growth of those nations’ economies. A multivariate cointegration analysis of the linkages between Malaysia’s economic growth and exports from 1965 to 2005 revealed that exports positively impact Malaysia’s economic growth [60]. The Granger causation between exports and economic growth was examined using time-series data from China from 1978 to 2002 [61]. The study discovered a bidirectional Granger causal relationship between China’s economic growth and exports. A cointegration analysis of the impact of various government spending programmes on Saudi Arabia’s economic growth based on annual data from 1969 to 2010 revealed that while public and private-sector healthcare spending and investments boosted long-term economic growth, trade openness and government spending on the housing sector increased output and production in the short term in Saudi Arabia [62].
An investigation into the impact of exports, imports, and trade openness on economic growth in Namibia revealed that economic growth was negatively correlated with imports and positively correlated with exports and trade openness [63]. An empirical study on Pakistan examined the impact of exports on economic growth using annual time-series data from 1971 to 2016. Based on the results of dynamic error correction and cointegration analysis, it can be concluded that exports contributed to economic growth in Pakistan [64].
A study on the relationships between Saudi Arabia’s economic growth, government oil exports, imports, and consumption spending from 1984 to 2015 concluded that oil exports and government consumption expenditures had a long-term positive influence; however, imports negatively influenced economic growth, as determined using the Johansen cointegration approach [65]. Using annual data from 1970 to 2015, the linkage between Japan’s economic growth and exports was analysed in [35]. The analysis revealed that exports had a positive impact on Japan’s economic growth. Applying an ARDL model to analyse the effects of exports on Indonesia’s economic growth using annual data from 2004 to 2018, a positive correlation was found between them [36].
The above empirical studies present conflicting findings on the influence of public healthcare and education spending on economic growth in different countries. The association of government spending on healthcare and education with economic growth in Saudi Arabia has not been extensively studied empirically before, and most studies have lacked a comprehensive, credible, and consistent analytical methodology. In Saudi Arabia, the availability of formal published studies examining the impact of education and healthcare spending is rare. Hence, we also attempted to address this gap in our study. Moreover, the impact of the government’s education and healthcare spending on GDP may be asymmetric, which previous studies have not examined.
Therefore, with our work, we attempted to address these methodological flaws and contribute to existing knowledge. We adopted non-linear autoregressive distributed lag (NARDL) approaches to examine the possible asymmetric impact of the government’s per capita education and healthcare spending on GDP after conducting proper stationarity tests and applying all diagnostic checks for the validity of these models. We also applied the modified Wald test to analyse the Granger causality. This method is suitable for variables with different orders of integration.

3. Materials and Methods

We collected annual data from 1985 to 2021 from the World Development Indicators (WDI) database, the World Bank (https://databank.worldbank.org, accessed on 19 March 2025), and the Saudi Arabian Monetary Agency (SAMA) (https://www.sama.gov.sa, accessed on 19 March 2025). The GDP price deflator was used to transform data on current government spending on healthcare and education at constant prices. GDP, exports, and government spending on healthcare and education are expressed in logarithms of per capita values.
The current study examines the long-run impact of per capita government expenditures on education and healthcare on GDP per capita. Government expenditure on education and healthcare measures human capital spending. We included export per capita as a control variable, as oil exports are a predominant component of the Saudi economy. Exports can also be considered a type of expenditure that foreign countries make by purchasing goods and services from Saudi Arabia. The following is the expression of the functional relationship between GDP and its possible determinants:
GDP = f (EXPO, EEXP, HEXP);
GDP = Logarithm of gross domestic product per capita in millions of SAR;
EXPO = Logarithm of the value of exports per capita in millions of SAR;
EEXP = Logarithm of the government education expenditure per capita in millions of SAR;
HEXP = Logarithm of the government healthcare expenditure per capita in millions of SAR.
Assuming that these variables are cointegrated, we estimate the long-run relationship of GDP with EXPO, EEXP, and HEXP as follows:
G D P t = α 0 + α 1 E X P O t + α 2 E E X P t + α 3 H E X P t + u t
where α i represents parameters; u t is the error term; and we expect α 1 > 0 , α 2 > 0 , and α 3 > 0 .
However, the long-run relationship may also be asymmetric, that is, the long-term impact of the positive and negative changes in EXPO, EEXP, and HEXP on GDP may differ.
Therefore, the two principal hypotheses to be tested are presented as follows.
  • Government education spending per capita has a long-run positive and asymmetric impact on GDP per capita.
  • Government healthcare spending per capita has a long-run positive and asymmetric impact on GDP per capita.
Considering the above two hypotheses, we apply a non-linear autoregressive distributed lag (NARDL) model [66] to analyse the long-run asymmetric impact of government education and healthcare spending (the two types of human capital spending), as it captures asymmetric effects.
To perform the NARDL bound test [64] of cointegration, the long-run form of the NARDL model, including the GDP, EXPO, EEXP, and HEXP variables, is specified as follows:
G D P t = μ 0 + γ G D P t 1 + α 1 + ( E X P O _ P O S ) t 1 + α 1 ( E X P O _ N E G ) t 1 + α 2 + ( E E X P _ P O S ) t 1 + α 2 ( E E X P _ N E G ) t 1 + α 3 + ( H E X P _ P O S ) t 1 + α 3 ( H E X P _ N E G ) t 1 + j = 0 q 1 1 θ 1 j + ( E X P O _ P O S ) t j + j = 0 q 1 1 θ 1 j ( E X P O _ N E G ) t j + j = 0 q 2 1 θ 2 j + ( E E X P _ P O S ) t j + j = 0 q 2 1 θ 2 j ( E E X P _ N E G ) t j + j = 0 q 2 1 θ 3 j + ( H E X P _ P O S ) t j + j = 0 q 3 1 θ 3 j ( H E X P _ N E G ) t j + ε t
where is the first difference operator; positive/negative superscripts (+/−) represent positive and negative decompositions of explanatory variables (i.e., asymmetry), respectively; α j + and   α j are long-run coefficients for positive and negative changes in the associated variables, respectively; θ j + and θ j are short-run dynamics of positive and negative changes in the associated variables, respectively; and ε t is the error term.
After estimating the model expressed in (1), we test the null hypothesis of no long-run relationship between variables:
H 0 : γ = α 1 + = α 1 = α 2 + = α 2 =   α 3 + = α 3 = 0
We apply the F-statistic from the joint significance test and compare it against the critical values [64]. If F-stat > the upper bound, we reject H0 and conclude that the variables have a long-run relationship.
Furthermore, we estimate the NARDL error correction model (ECM) to account for the long-run correlations and the short-run adjustment dynamics that underpin the long-run correlations. It is assumed that these variables show a single cointegrating or long-run relationship.
The NARDL error correction model takes the following form:
G D P t = π 0 + λ ( ( G D P t 1 + β 1 + ( E X P O _ P O S ) t 1 + β 1 ( E X P O _ N E G ) t 1 + β 2 + ( E E X P _ P O S ) t 1 + β 2 ( E E X P _ N E G ) t 1 + β 3 + ( H E X P _ P O S ) t 1 + β 3 ( H E X P _ N E G ) t 1 ) + j = 0 q 1 1 δ 1 j + ( E X P O _ P O S ) t j + j = 0 q 1 1 δ 1 j ( E X P O _ N E G ) t j + j = 0 q 2 1 δ 2 j + ( E E X P _ P O S ) t j + j = 0 q 2 1 δ 2 j ( E E X P _ N E G ) t j + j = 0 q 3 1 δ 3 j + ( H E X P _ P O S ) t j + j = 0 q 3 1 δ 3 j ( H E X P _ N E G ) t j + φ t
where λ is the speed of adjustment; β j + and   β j are the long-run coefficients for positive and negative changes in the associated explanatory variables, respectively; δ j + and   δ j are the short-run dynamics of positive and negative changes in the associated variables, respectively; and φ t is the error term.

4. Results

4.1. Stationarity Test

To determine the integration order of each variable, we initially conducted four unit root tests on each variable at the level and the first difference. The order of integration for variables is an important consideration when selecting a suitable econometric model for time-series data. The unit root test described in [67], an augmented version of the test described in [68], and the test described in [69]. The unit root test described in [70] was also applied to take into account the series break. Additionally, considering variables with mixed orders of integration, we estimated the long- and short-run parameters using the NARDL model. The dynamics of the short-term adjustments and long-term relationships among the variables were investigated using the bound test of cointegration. We estimated the error correction model (ECM) of the NARDL model and conducted model adequacy tests to verify the long-term correlations among the variables. Finally, the modified Wald test was conducted to examine the Granger causality between the variables.
We cross-checked and ascertained the integration order of each variable by applying the Augmented Dickey–Fuller (ADF), Phillips–Perron, and Kwiatkowski–Phillips–Schmidt–Shin (KPSS) unit root tests, each of which presupposes the null hypothesis of a unit root in a variable. The ADF test shows that EEXP and HEXP are I(0) and, hence, stationary at the level, while the other two variables, GDP and EXPO, are I(1) and, hence, stationary at the first difference (Table 1). The ADF and Phillips–Perron stationary test results are consistent (Table 2). The results presented in Table 1, Table 2 and Table 3 display the alignment between the findings of the ADF, Phillips–Perron, and KPSS unit root tests.
A unit root test with the possibility of a single break [70] in a variable was considered. The test indicated a break in the dependent variable, GDP per capita. Nevertheless, the variables are of a mixed order of integration, i.e., I(0) or I(1) (Table 4).

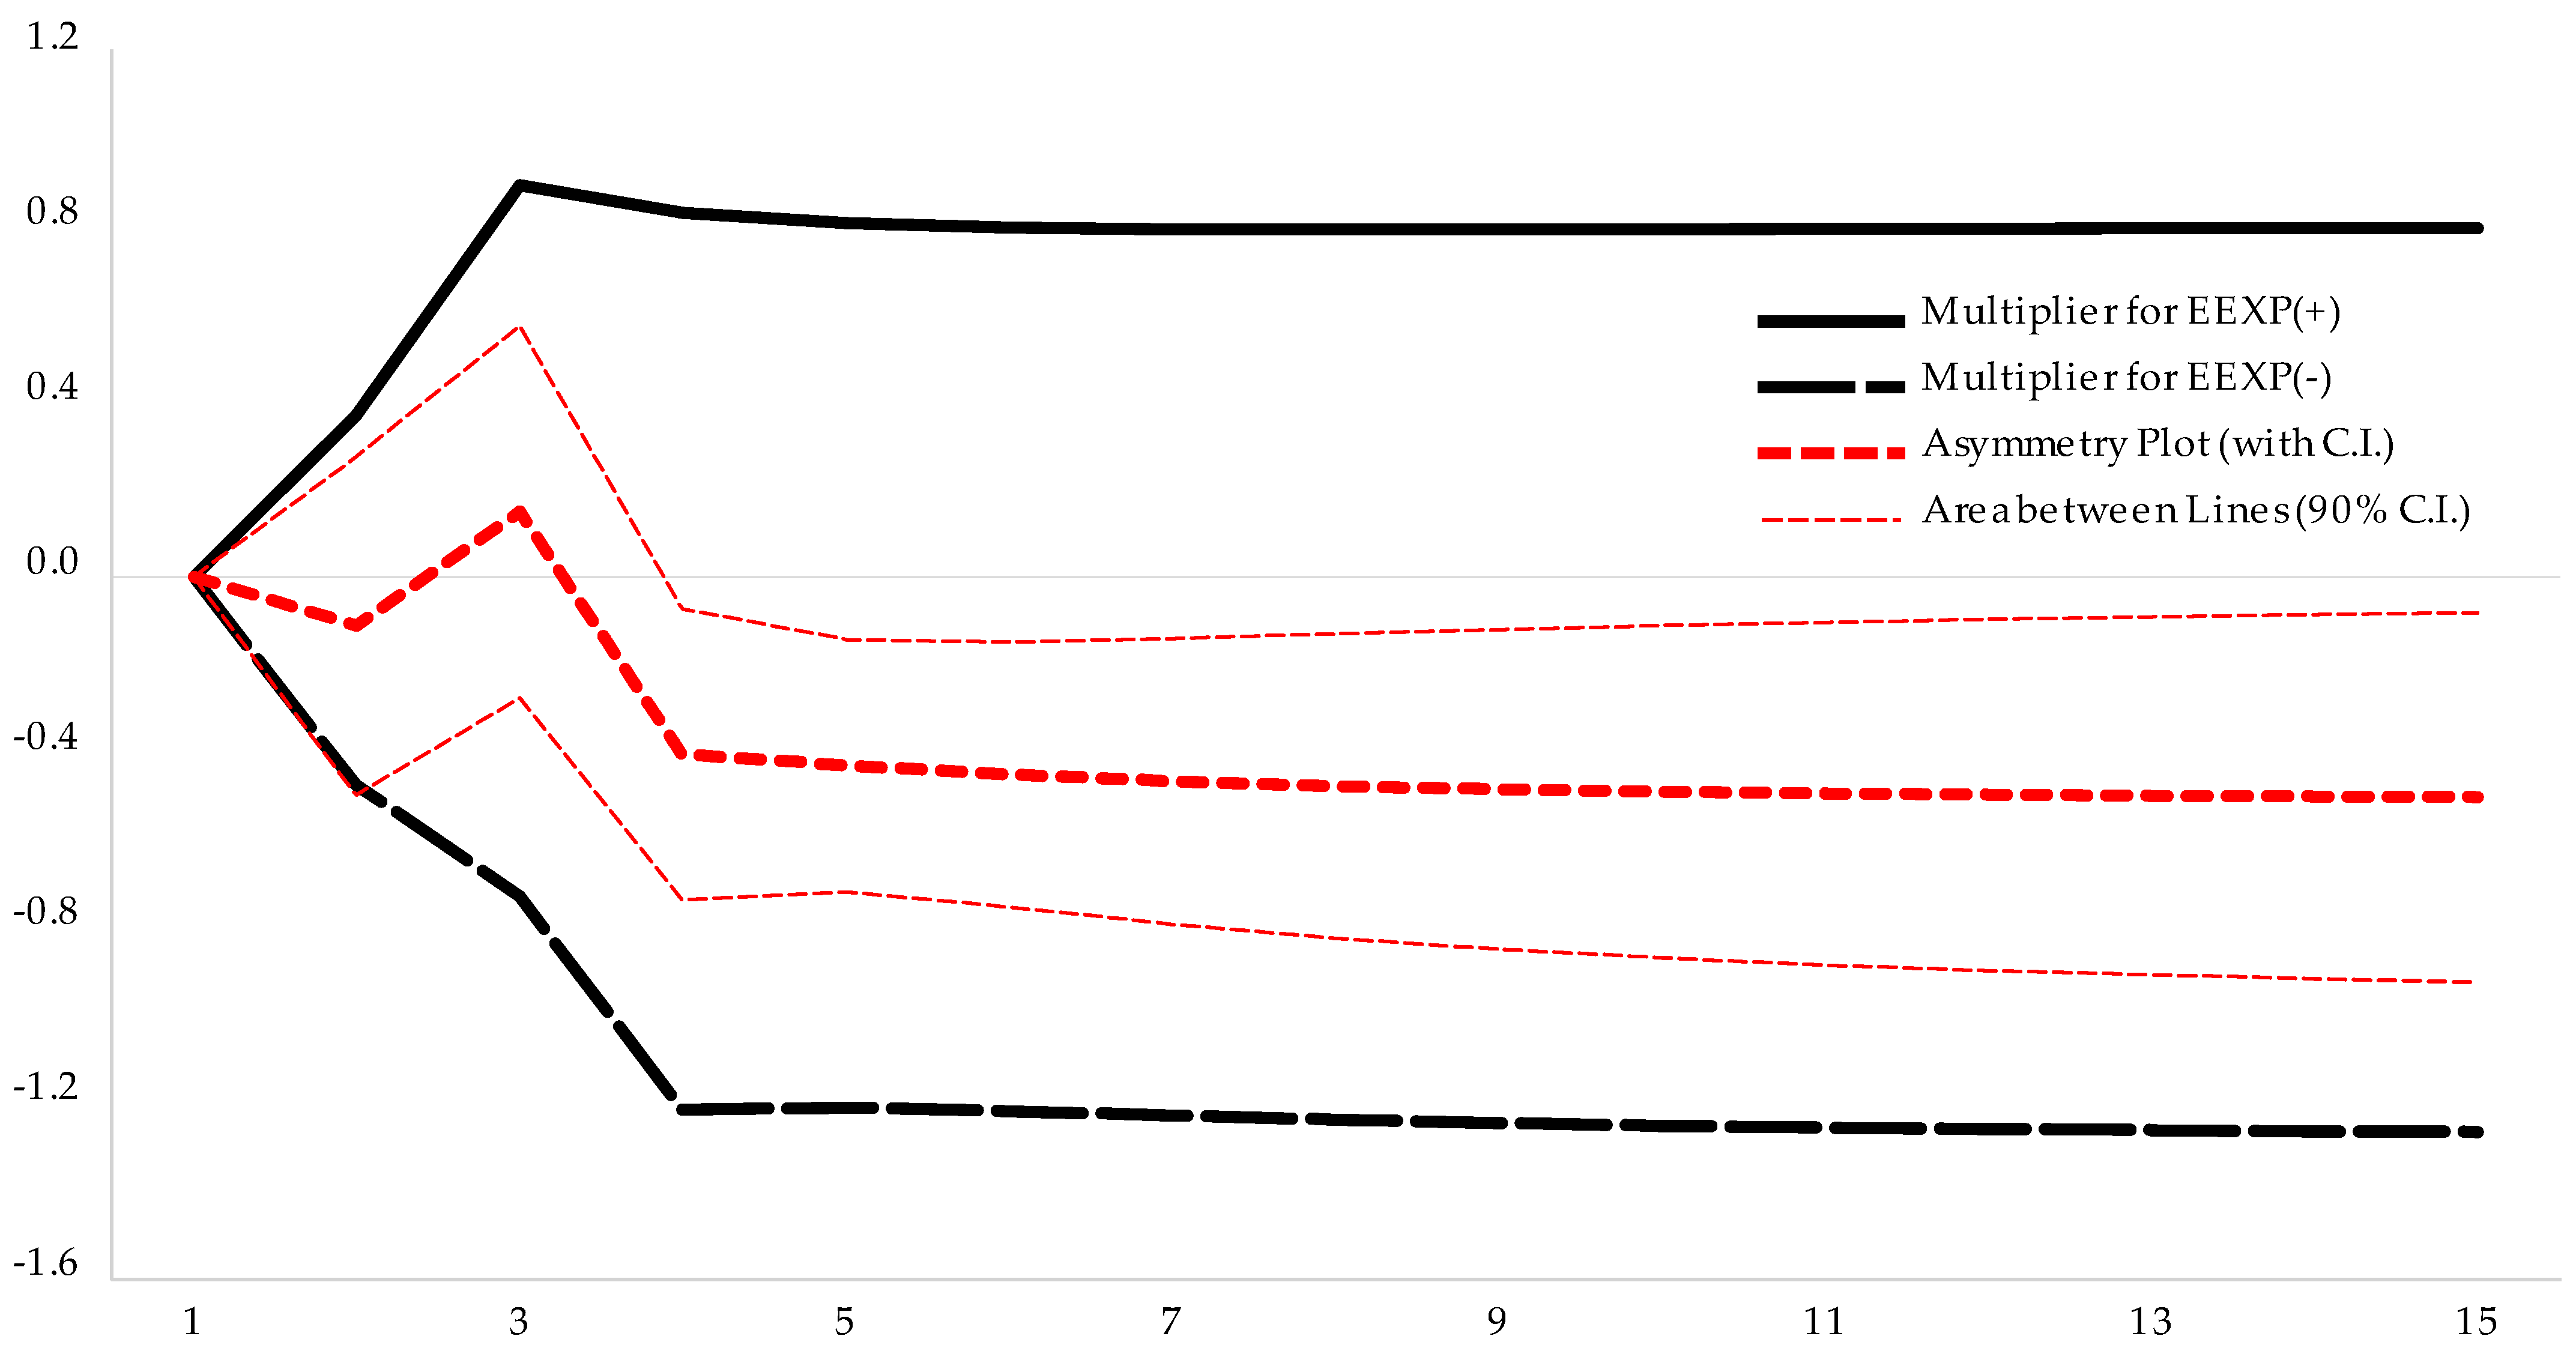
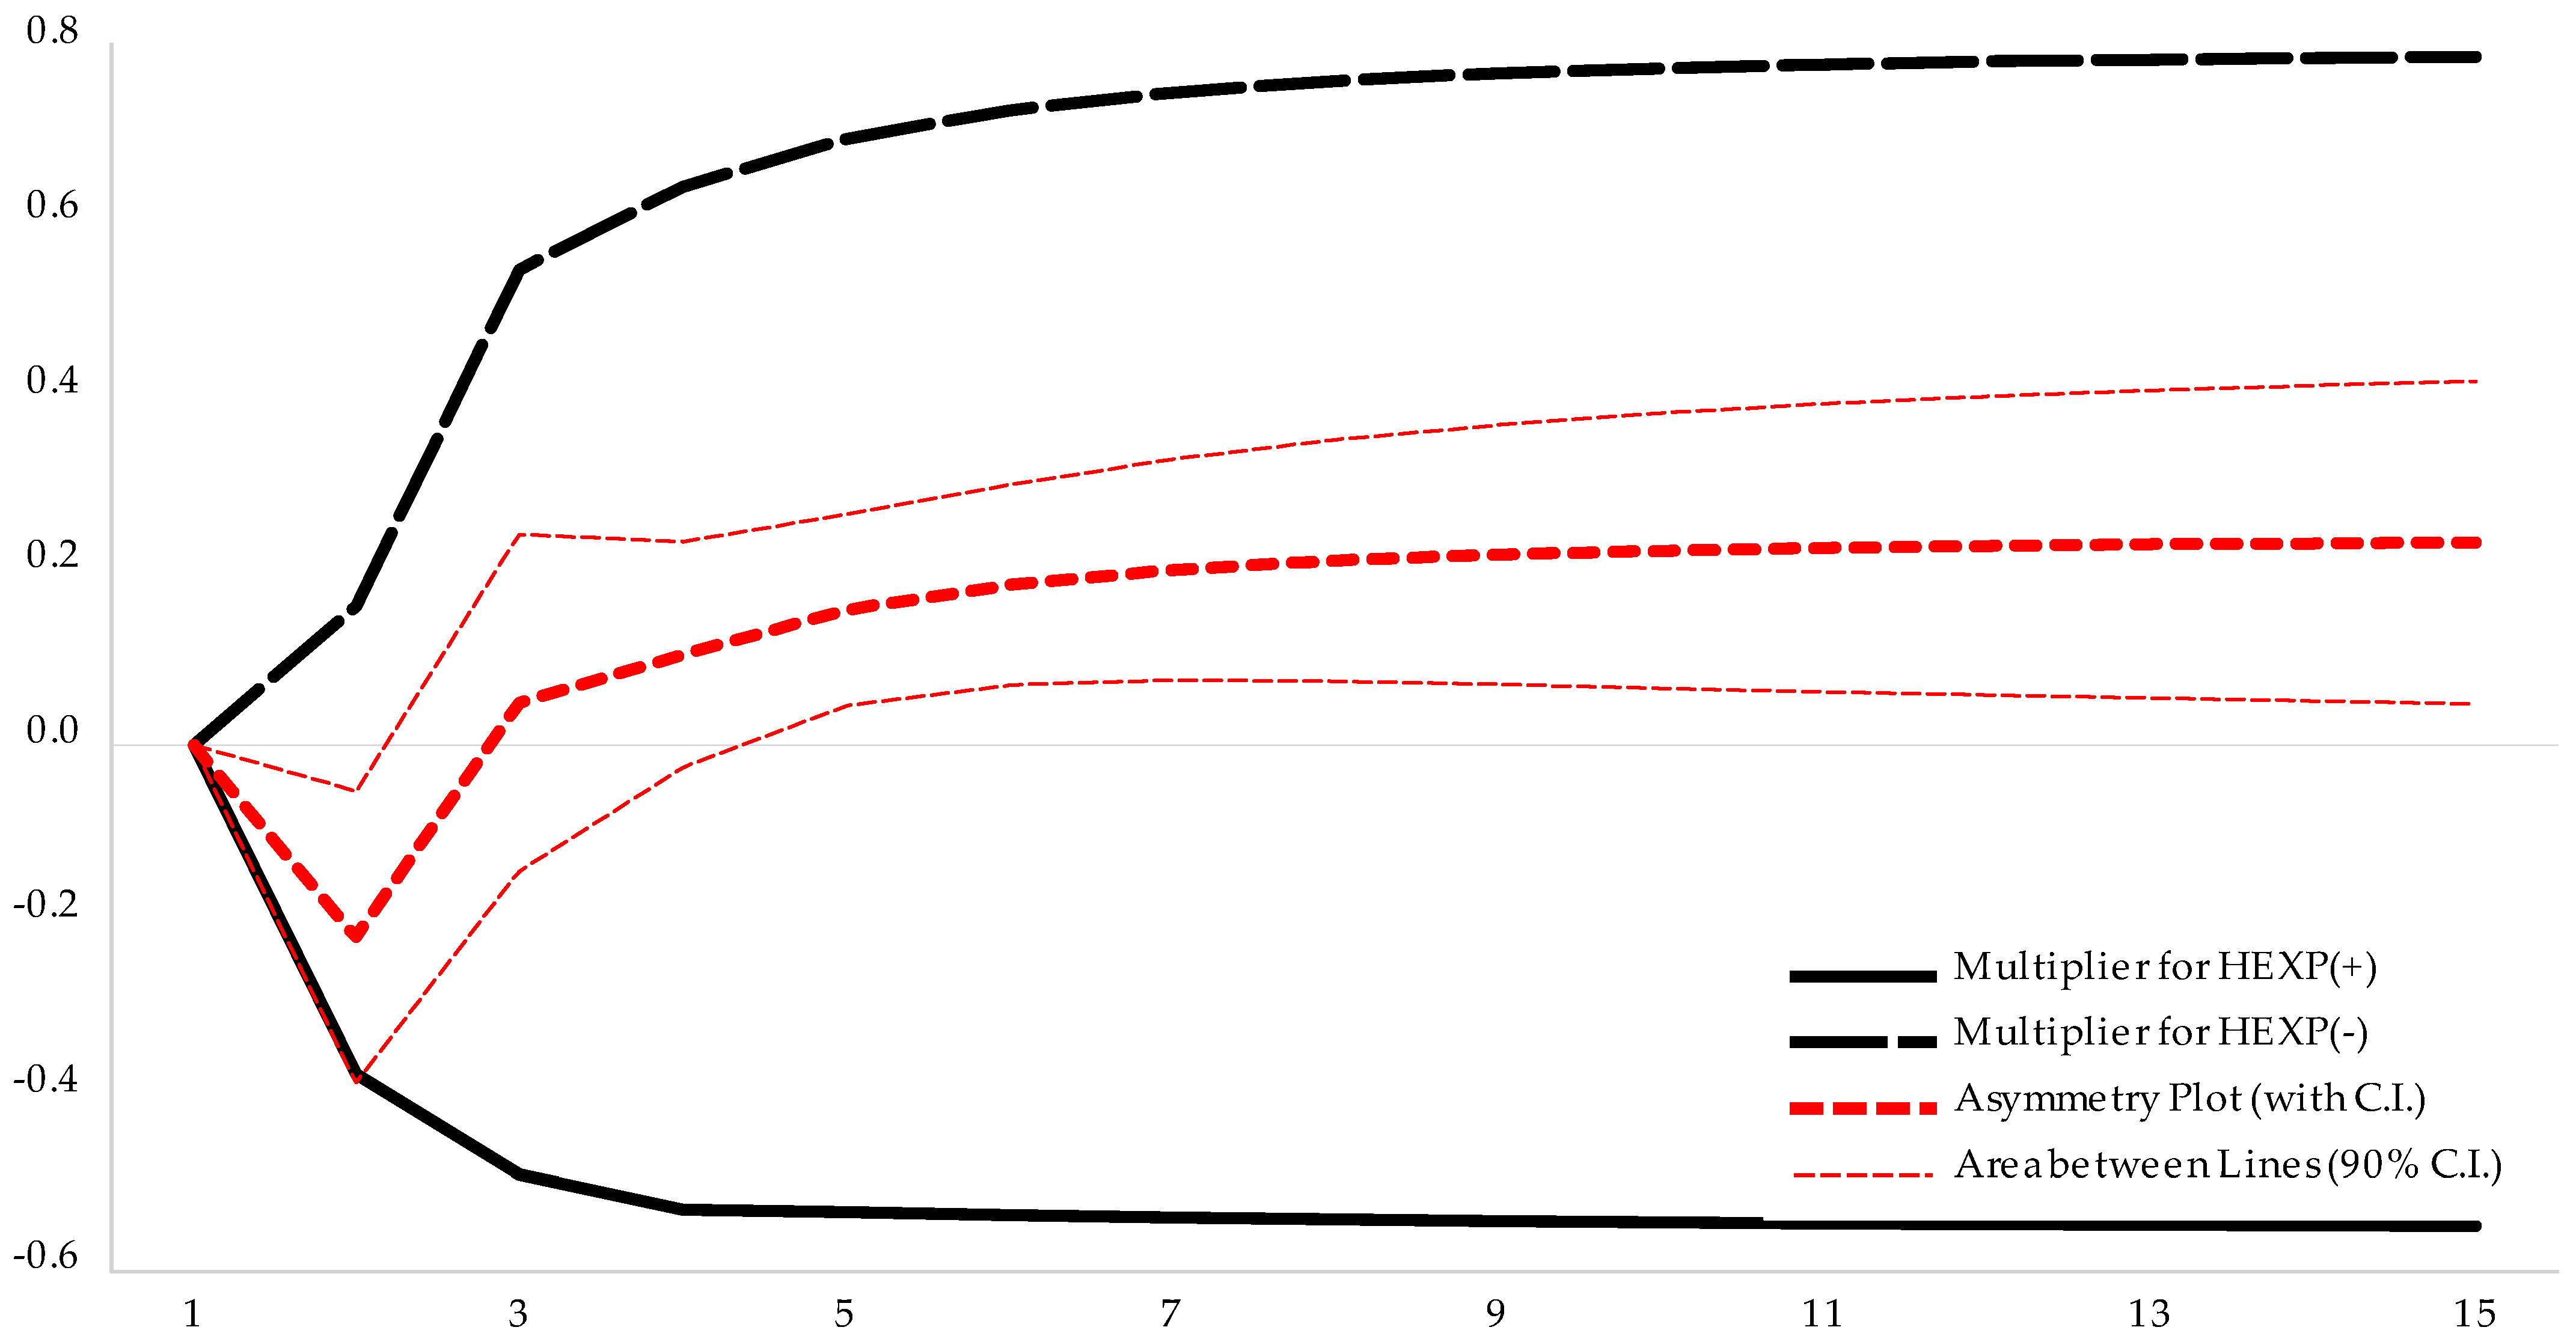
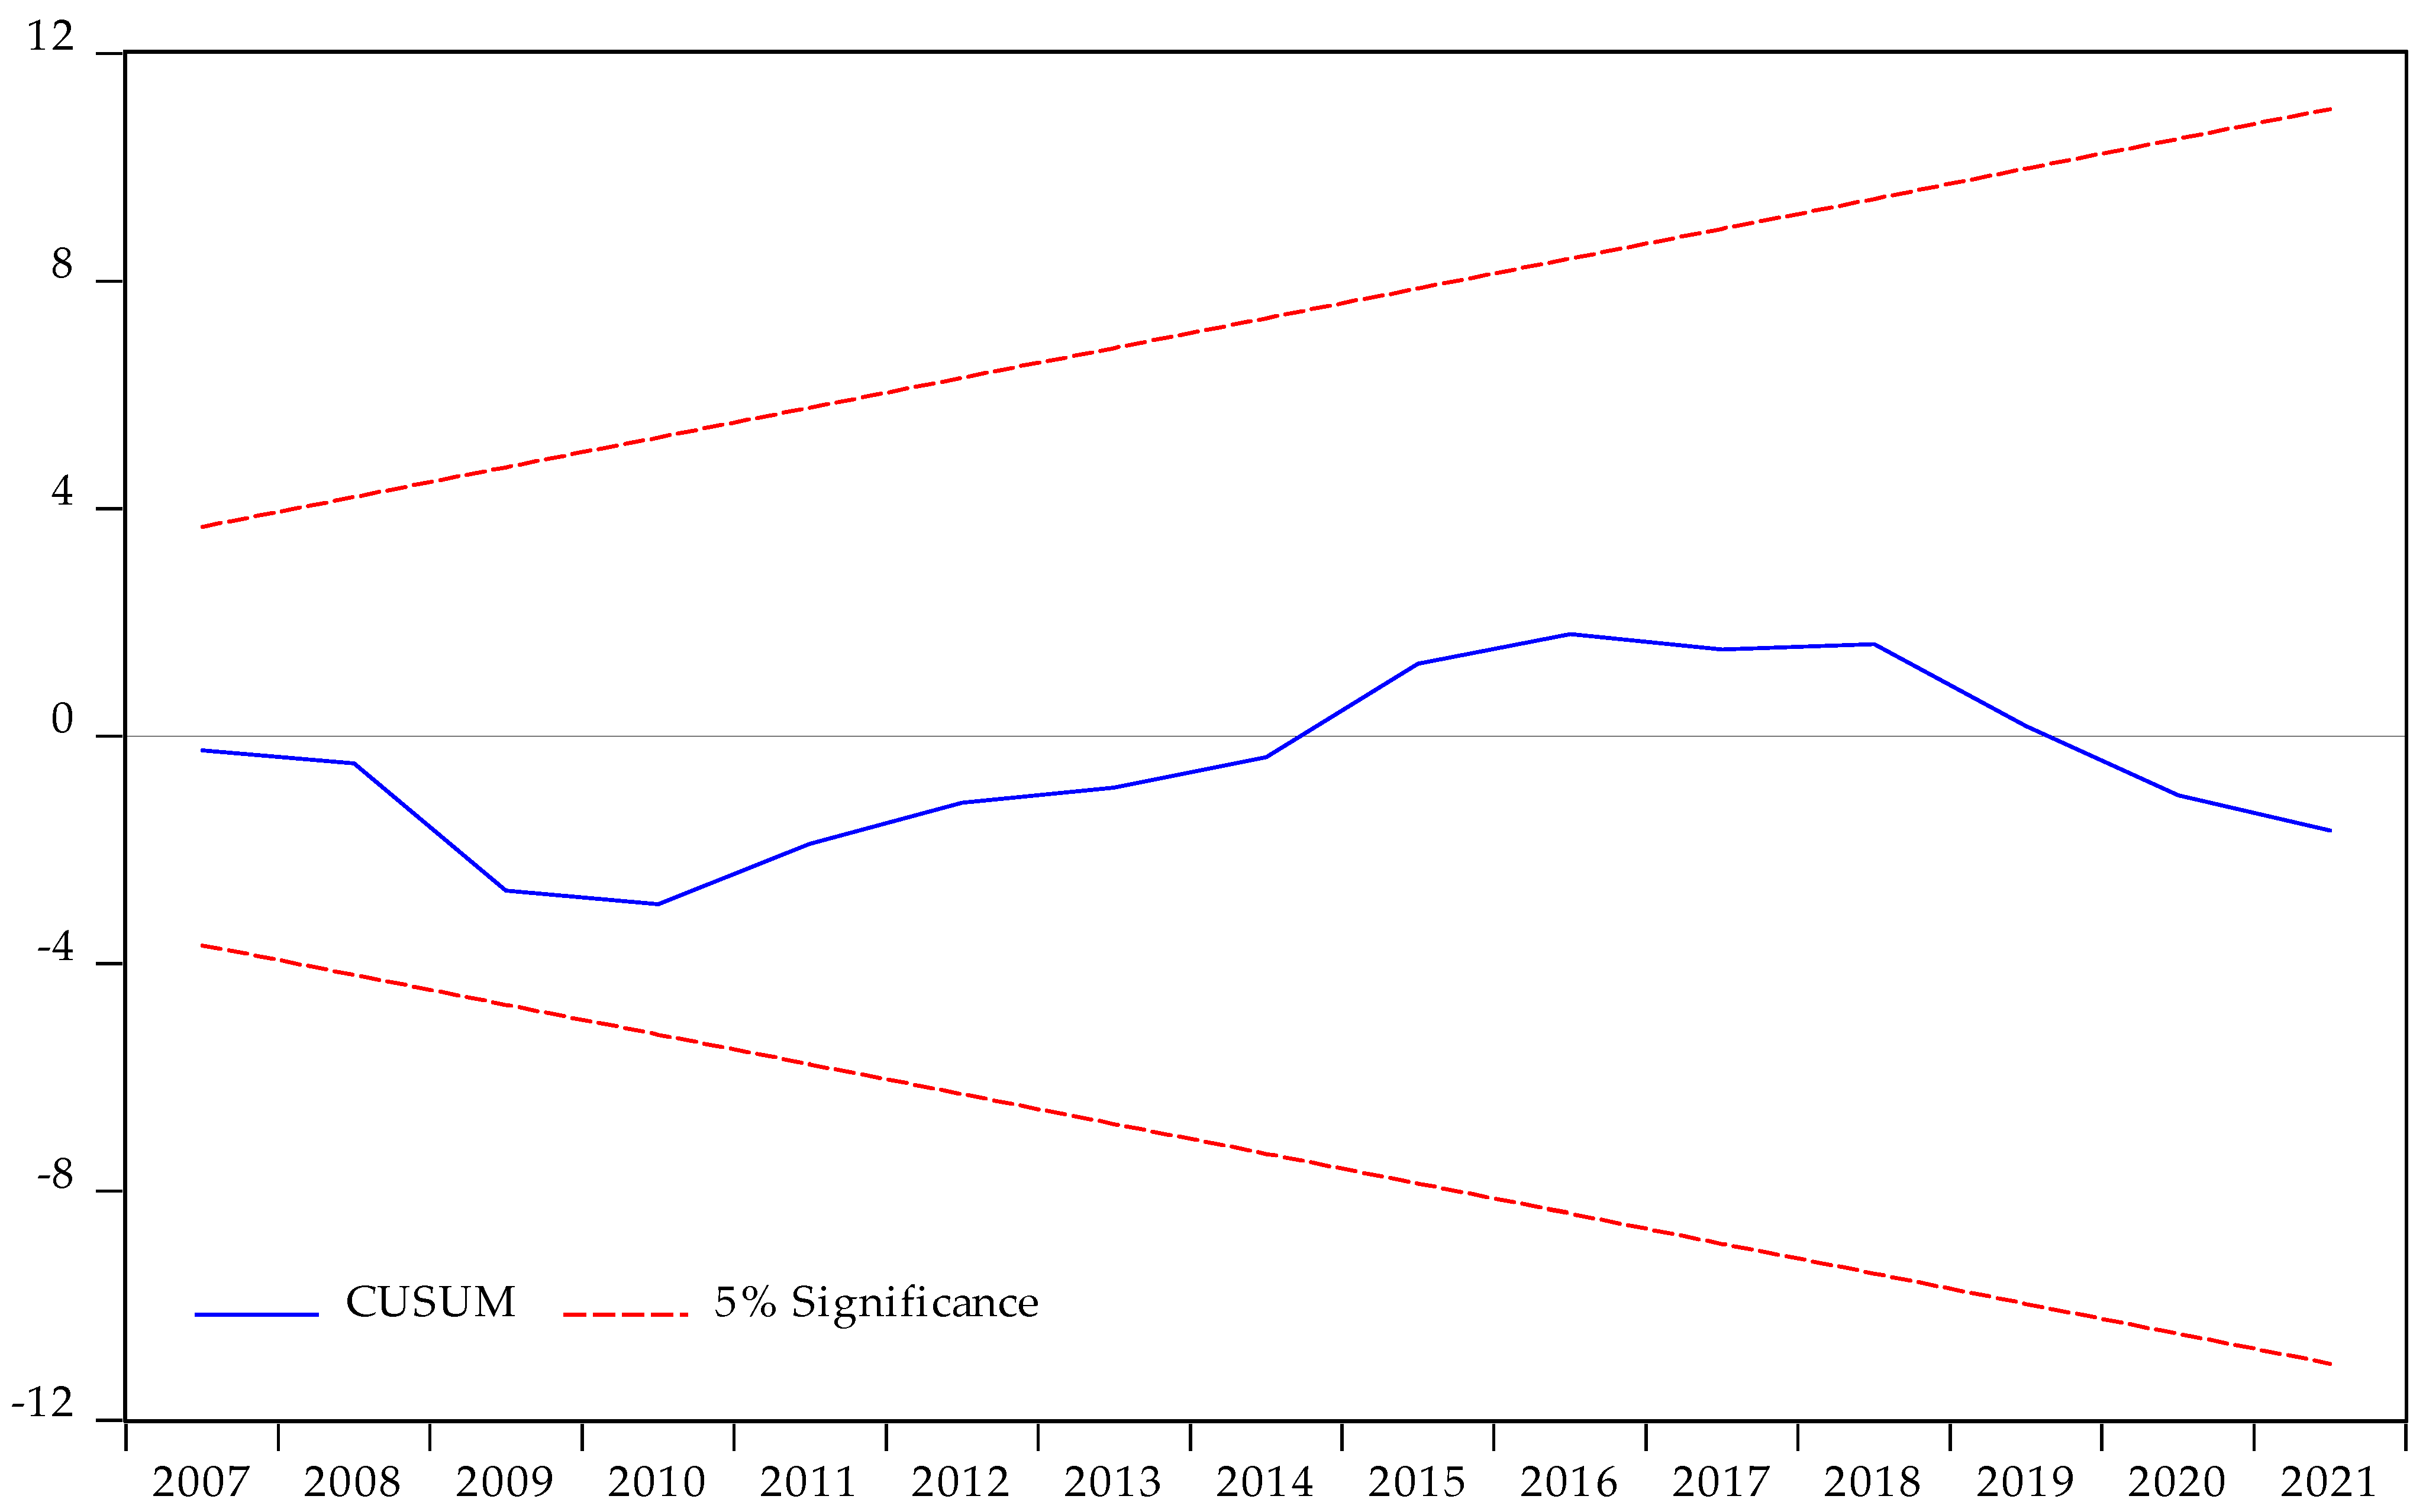
4.2. NARDL Model and Its Results

To apply an NARDL model, the order of integration for each variable must be no more than one. This requirement is fulfilled, as the variables are I(0) or I(1). Under such conditions, an NARDL model is considered suitable. Hence, we chose to apply and estimate an NARDL model by including the EXPO, EEXP, HEXP, and GDP variables, with GDP as the dependent variable and the remaining as explanatory variables.
Per capita spending on healthcare and education may have long-run asymmetric effects on GDP per capita. The Non-linear Auto-regressive Distributed Lag (NARDL) modelling is applied to capture these possible asymmetric relationships between GDP, exports, and healthcare and education spending. This modelling enables us to consider any possible asymmetry in how government spending on healthcare and education affects GDP growth. To check for a long-run relationship, we need to examine cointegration among the variables. Cointegration among the variables will provide evidence for any long-run relationship among them.
To determine if cointegration exists among the variables, we applied the bound test to the dependent variable after estimating the model expressed in Equation (2). After determining the optimum lag using the Bayesian Information Criterion (BIC), we selected and estimated the NARDL (1, 1, 2, 3, 3, 2) model. The F-bound test statistic value of 5.260 exceeds the 5% upper critical-bound I(1) value. Thus, the null hypothesis of no cointegration among the variables is rejected. The bound test results provide evidence in support of a long-run relationship between GDP, exports, and government spending on healthcare and education. A strong cointegration is implied by the statistically significant and negative value of the coefficient of CointEq(−1) (Table 5 and Table 6).
We proceed to estimate the NARDL (1, 1, 2, 3, 3, 2) error correction model (ECM), which represents the model specified in Equation (3), and subsequently perform model adequacy tests to verify the validity of the above NARDL model. Table 6 presents the results of the NARDL error correction model. In Equation (3), the value of the error correction coefficient ( λ ) must be negative and statistically significant to validate a long-run relationship among the variables and short-run adjustment dynamics that restore the long-term relationship in case of divergence from the long-run relationship.
The speed of adjustment coefficient ( λ ), or the coefficient of the CointEq(−1) term, has a value of −0.4697, which is negative and statistically significant at the 1% level. Thus, the bound test and the ECM’s results attest to a long-run relationship among the variables and the dynamics of short-run adjustments to restore the long-run relationship. Moreover, the speed-of-adjustment value suggests that about 46.97% of the deviation from the long-run relationship is corrected in one year. In the short term, increases in exports per capita and education spending per capita result in higher GDP per capita. However, in the short run, an increase in healthcare spending per capita or a decrease in education spending per capita results in a reduction in GDP per capita (Table 6).
To determine the asymmetric impacts of per capita healthcare and education spending on GDP per capita in Saudi Arabia, we conducted the Wald test. The chi-square and F-statistic values reject the null hypothesis of coefficient symmetry for healthcare and education spending at the 1% significance level, indicating that long-term coefficient symmetry is not supported. Nevertheless, neither the chi-square statistic nor the F-statistic rejects the null hypothesis of short-term symmetry. For both types of human capital expenditures, the F-statistic and chi-square test statistics reject the null hypotheses of combined long-term and short-term symmetry (Table 7).
Thus, the Wald test provides evidence for the long-run asymmetric effects of per capita healthcare and education spending on Saudi Arabia’s GDP per capita. The impact of increases and decreases in per capita education and healthcare spending on GDP per capita varies in strength.
The following table and figures present the results of the level and long-term relationships between the variables. A rise in per capita government expenditures on education and growth in exports per capita lead to an increase in GDP per capita. However, a rise in per capita government spending on healthcare can lead to a fall in GDP per capita. The partial elasticity of the effect of per capita government education spending on GDP per capita exceeds the elasticity of exports. Put differently, a 1% increase in per capita government spending on education results in approximately 0.33% growth in GDP per capita. In contrast, a 1% rise in export value yields approximately 0.13% growth in GDP per capita in the long term (Table 8).
The impact of negative shocks to per capita education expenditure on GDP per capita is stronger than the positive shocks. A 1% positive shock to per capita education expenditures leads to 0.75% growth in GDP per capita over approximately 3 years, while a 1% negative shock to per capita education expenditures results in a 1.21% decline in GDP per capita over approximately 4 years (Figure 1 and Table 8). The impact of negative shocks to per capita healthcare expenditure on GDP per capita is more substantial than the impact of positive shocks. A 1% positive shock to per capita healthcare expenditures results in a 0.53% decline in GDP per capita over five years. In comparison, a negative shock to per capita healthcare expenditures results in 0.74% growth in GDP per capita over 7 years (Figure 2 and Table 8).
The long-run elasticity of a positive shock to per capita education expenditure of GDP per capita is 0.75, while the long-run elasticity of a negative shock to per capita education expenditure of GDP per capita is 1.21. Long-run elasticity of a positive shock to per capita healthcare expenditure of GDP per capita is 0.53, while the long-run elasticity of a negative shock to per capita healthcare expenditure of GDP per capita is 0.74 (Table 8).
The results of the diagnostic test performed on the fitted NARDL model are presented in the table below. The errors of the NARDL model follow a normal probability distribution, as the Jarque–Bera test fails to reject the null hypothesis of a normal probability distribution. Even at a 10% level of statistical significance, the Breusch–Pagan–Godfrey test of heteroskedasticity, with an F-statistic value of 1.5703, does not reject the null hypothesis that the errors are homoscedastic. Similarly, the F-statistic value of 0.9624 from the LM test of the Breusch–Godfrey serial correlation does not reject the null hypothesis of no serial correlation in errors. Furthermore, Table 9 demonstrates that the model is correctly specified, as the F-statistic value of 0.9908 does not reject the null hypothesis of a correctly specified model in the Ramsey RESET test (Table 9).
The fitted NARDL model is stable, as evident from the results of the CUSUM and CUSUM of squares tests of model stability. In the graphs, the blue lines remain confined within the two dotted boundary lines (Figure 3 and Figure 4).
To further evaluate the robustness of the estimated NARDL models and determine the long-run cointegrating relationships among the variables, we estimated the Fully Modified OLS (FMOLS), Dynamic OLS (DOLS), and Canonical Cointegrating Regression (CCR). The results of the FMOLS, CCR, and DOLS estimators substantiate the robustness of the long-run relationships among the variables. Based on the value of adj. R2, DOLS performs the best among these three models, as indicated by the largest value of 0.7748 for adj. R2. Thus, the relationships among the variables shown by the FMOLS, DOLS, and CCR models align with the long-term (level) relationships among the variables established by the NARDL model. The results of DOLS show that GDP per capita grows by 0.11% and 0.41%, respectively, for a 1% increase in per capita export value and per capita government expenditure on education. However, GDP per capita declines by 0.22% for a 1% increase in per capita government healthcare expenditure (Table 10).

4.3. The Toda–Yamamoto Test of Causality

The causality test described in [71] is applied when variables are stationary and non-cointegrated. The variables in this study are cointegrated and exhibit varying orders of integration. The causality test described in [72] is suitable when the variables display mixed integration or cointegration. Using the techniques described in [72], we estimated the augmented VAR by adding lags equal to the highest order of integration (dmax) to each variable in the group of variables. To achieve this, we first determined the optimal lag (p) using the optimal lag criterion (BIC). The augmented VAR model is specified as follows.
Y t = a 11 + i = 1 n α i 1 Y t i + i = n + 1 n + d m a x α i 1 Y t i + i = 1 n β i 1 X t i + i = n + 1 n + d m a x β i 1 X t i + u 1 t
X t = a 21 + i = 1 n α i 2 X t i + i = n + 1 n + d m a x α i 2 X t i + i = 1 n β i 2 Y t i + i = n + 1 n + d m a x β i 2 Y t i + u 2 t
As mentioned above, we applied the modified Wald (MWald) test to the augmented VAR(n+dmax).
The following is the null hypothesis for the causality test between variables Y and X:
H 0 :   β i 1 = 0 ,   i = 1 ,   2 ,   .   n .
The null hypothesis for the test of causality from variable X to variable Y is expressed as follows:
H 0 :   β i 2 = 0 ,   i = 1 ,   2 ,   .   n .
Table 11 displays the findings of the modified Wald test of causality [72]. The findings demonstrate a one-way causality from each explanatory variable (HEXP, EEXP, and EXPO) to GDP (Table 11).

5. Discussion

The outcomes of the NARDL and cointegrating regression (FMOLS, CCR, and DOLS) models reveal that per capita government expenditures on healthcare negatively influence GDP per capita. However, per capita export and per capita government education spending have a long-term positive impact on Saudi Arabia’s per capita GDP.
Our analysis supports the first hypothesis that per capita government education spending has a long-run positive and asymmetric impact on GDP per capita in Saudi Arabia. However, our analysis does not support the second hypothesis that per capita government healthcare spending has a long-run positive and asymmetric impact on GDP per capita. Instead, the study found that per capita government healthcare spending has a long-run negative and asymmetric impact on GDP per capita in Saudi Arabia
Our study found that Saudi Arabia’s GDP per capita grows when per capita exports and per capita education spending rise. Nevertheless, the analysis reveals that a rise in per capita government healthcare spending reduces Saudi Arabia’s GDP per capita. The findings of our study align with those of earlier research [32,33,34,35,36,64,73,74]. These studies also revealed that a rise in exports has a beneficial impact on GDP growth. The findings of the present study on the positive correlation of government spending on education with GDP growth are consistent with the majority of empirical research conducted in developing and developed nations, e.g., in 12 Asia-Pacific countries [28], 25 EU countries [18], Turkey [29], Spain [49], Bangladesh [75], 25 EU countries [76], Namibia [21], Vietnam [30], and Saudi Arabia [31]. All of these studies attest that government expenditures on education have a favourable influence on a nation’s economic growth and development. However, the results of the current study contradict those of a study of African countries [50], which asserted that government spending on education impeded economic growth. The current study’s findings also differ from those of a study that showed that public spending on education has a long-term detrimental influence on economic growth [24]. However, the current study’s findings are consistent with other empirical research showing that government spending on education typically boosts economic growth in developing nations such as Saudi Arabia.
The current study’s findings on the negative relationship between government spending on healthcare and GDP are consistent with those of Ref. [19]. However, our findings of the negative impact of government health expenditures on GDP are not consistent with those of Refs. [18,21,22,24,25,27,62,77]. This inverse link may be due to Saudi Arabia’s low human capital development ranking of 73rd out of 157 nations and its overdependence on foreign health workers [78]. Cost-Disease theory provides a possible explanation as to why labour-intensive services such as healthcare, education, etc., might experience rising costs over time without corresponding increases in productivity [79]. In Saudi Arabia, productivity growth in education appears to outweigh rising education costs, leading to GDP per capita growth. However, productivity growth in healthcare is outpaced by rising healthcare costs, leading to a net negative impact on GDP per capita. Saudi Arabia’s comparatively low level of human capital development may be causing a significant and negative link between government healthcare expenditures and GDP, which aligns with the findings reported in [26].
The discrepancy between the results of the current study and those of prior studies may be due to differences in (a) the research methods used, (b) socioeconomic conditions in the countries under investigation, (c) periods of data used in the studies, or both (b) and (c) [36,80].

6. Conclusions

This study examined the short-term dynamics and the long-term relationships between government human capital spending, measured by per capita expenditures on education and healthcare, and economic growth, measured by per capita GDP. Exports per capita were included as a control variable, as Saudi Arabia’s economy is primarily based on oil exports.
We used yearly time-series data on real GDP per capita, government healthcare spending, education spending, and exports, each in per capita terms, from 1985 to 2021 to examine the relationships among these variables. The study found that the included variables have a mixed order of integration based on various unit root tests conducted on each variable. Hence, after determining the optimal number of lags using the lag selection technique, an appropriate NARDL model was selected, and its parameters were estimated. The NARDL bound test results, along with the statistically significant and negative value of the speed of adjustment coefficient, confirmed the long-run relationships between GDP per capita exports, as well as per capita government education and healthcare spending.
To examine the direction of causation between the variables, we conducted modified Wald tests of causality, as in [72]. The study found a unidirectional causality from per capita government spending on education and healthcare and export per capita to GDP per capita in Saudi Arabia.
The study concludes that GDP per capita is negatively correlated with per capita government spending on healthcare and positively correlated with per capita spending on education in Saudi Arabia. Furthermore, GDP per capita is positively related to Saudi Arabia’s per capita exports. The results of the coefficient symmetry test show that per capita spending on healthcare and education has long-term and asymmetric effects on Saudi Arabia’s GDP per capita, that is, the decline in GDP per capita resulting from a decrease in education spending per capita is larger than the increase in GDP per capita resulting from an increase in education spending per capita. However, the decline in GDP per capita resulting from an increase in healthcare spending per capita is larger than the increase in GDP per capita resulting from a decrease in healthcare spending per capita. The study also found unidirectional causality from per capita spending on healthcare, education, and exports to GDP per capita. Therefore, this study infers that an increase in per capita government healthcare spending reduces economic growth, whereas an increase in per capita spending on education contributes to it. Saudi Arabia’s economy also experiences export-led economic growth.
Thus, while Saudi Arabia benefits from economic growth triggered by productivity growth resulting from a sustained increase in government education spending, the rise in healthcare spending hinders its economic growth.
The findings of our study have significant policy implications for how the government and policymakers can respond to enhance economic growth and development in Saudi Arabia. The government should maintain the current level of education spending or, preferably, increase it and eliminate unnecessary and wasteful spending on healthcare to facilitate faster economic growth and development in Saudi Arabia. The government should strive to reduce disguised unemployment in the healthcare sector and mitigate overdependency on foreign health workers to alleviate some of the costs in the sector. Sustained growth in education spending is essential for building human capital, meeting the needs of the education and healthcare sectors, and reducing dependence on an expensive foreign workforce. The efficiency of resources employed in Saudi Arabia’s healthcare system can also be enhanced by reducing government control and management of the health sector while increasing private-sector participation in it. Economic policies that favour export promotion and diversification can also bolster economic growth and development in the country.
Capital stock could be an important control variable for our applied model. Nevertheless, the current study could not include capital stock as a control variable due to the unavailability of time-series data, which might have influenced the results. Hence, researchers can further explore the influence of education and healthcare expenditures on Saudi Arabia’s GDP by constructing a capital stock series and including it as a control variable in their model.

Author Contributions

Conceptualisation, F.A.; Data curation, H.P.S., A.S., Y.H.A.-M., A.A.A. and V.A.; Formal analysis, F.A.; Funding acquisition, H.P.S.; Investigation, F.A.; Methodology, F.A.; Project administration, H.P.S.; Re-sources, H.P.S., A.S., Y.H.A.-M., A.A.A. and V.A.; Software, H.P.S., A.S., Y.H.A.-M., A.A.A. and V.A.; Supervision, H.P.S. and V.A.; Validation, H.P.S., A.S., Y.H.A.-M., A.A.A. and V.A.; Visualization, F.A, H.P.S., A.S., Y.H.A.-M., A.A.A. and V.A.; Writing—original draft, F.A.; Writing—review and editing, F.A., H.P.S., A.S., Y.H.A.-M. and A.A.A. All authors have read and agreed to the published version of the manuscript.

Funding

This research was funded by the Scientific Research Deanship at the University of Ha’il, Saudi Arabia, through project number RG-23 205. The current paper is a part of approved research project number RG-23 205 titled “Prospects for Economic Growth and Sustainable Human Capital Development in Saudi Arabia through Learning, Education, and Training”. The authors thank the Scientific Research Deanship at the University of Ha’il, Saudi Arabia, for their support.

Institutional Review Board Statement

Not applicable.

Informed Consent Statement

Not applicable.

Data Availability Statement

The data used in this study were obtained from the World Bank and the Saudi Arabian Monetary Agency’s online databases.

Conflicts of Interest

The authors declare that they have no competing financial interests or personal relationships that could have appeared to influence the work reported in this paper.

References

  1. Gabriel, L.F.; de Santana Ribeiro, L.C. Economic Growth and Manufacturing: An Analysis Using Panel VAR and Intersectoral Linkages. Struct. Change Econ. Dyn. 2019, 49, 43–61. [Google Scholar] [CrossRef]
  2. Atolia, M.; Chahrour, R. Intersectoral Linkages, Diverse Information, and Aggregate Dynamics. Rev. Econ. Dyn. 2020, 36, 270–292. [Google Scholar] [CrossRef]
  3. Tang, J.; Williams, A.M.; Makkonen, T.; Jiang, J. Are Different Types of Interfirm Linkages Conducive to Different Types of Tourism Innovation? Int. J. Tour. Res. 2019, 21, 901–913. [Google Scholar] [CrossRef]
  4. Mohamed, E.S.E. Resource Rents, Human Development and Economic Growth in Sudan. Economies 2020, 8, 99. [Google Scholar] [CrossRef]
  5. Nkogbu, G.O. Enhancing Sustainable Economic Growth and Development through Human Capital Development. Int. J. Hum. Resour. Stud. 2015, 5, 1. [Google Scholar] [CrossRef]
  6. Abdullahi, M.S. Human Resource Development and Utilization: A Tool for National Economic Growth. Mediterr. J. Soc. Sci. 2013, 4, 153–159. [Google Scholar] [CrossRef]
  7. Laursen, K.; Meliciani, V. The Importance of Technology-Based Intersectoral Linkages for Market Share Dynamics. Rev. World Econ. 2000, 136, 702–723. [Google Scholar] [CrossRef]
  8. Alba, M.F.; García Álvarez-Coque, J.M.; Mas-Verdú, F. New Firm Creation and Innovation: Industrial Patterns and Inter-Sectoral Linkages. Int. Entrep. Manag. J. 2013, 9, 501–519. [Google Scholar] [CrossRef]
  9. Mckenzie, P. Education and Training: Still Distinguishable? Vocat. Asp. Educ. 1995, 47, 35–49. [Google Scholar] [CrossRef]
  10. Singh, H.P.; Agarwal, A.; Das, J.K. Implementation of E-Learning in Adult Education: A Roadmap. Mumukshu J. Humanit. 2013, 5, 229–232. [Google Scholar]
  11. Singh, H.P.; Alhulail, H.N. Predicting Student-Teachers Dropout Risk and Early Identification: A Four-Step Logistic Regression Approach. IEEE Access 2022, 10, 6470–6482. [Google Scholar] [CrossRef]
  12. Agboola, S. Relationship between Educational Expenditure and Unemployment Rate on Economic Growth in Nigeria. Educ. J. 2018, 1, 100. [Google Scholar] [CrossRef]
  13. Jabbour, L.; Mucchielli, J.L. Technology Transfer Through Vertical Linkages: The Case of the Spanish Manufacturing Industry. J. Appl. Econ. 2007, 10, 115–136. [Google Scholar] [CrossRef]
  14. Ibeaheem, H.A.; Elawady, S.; Ragmoun, W. Saudi Universities and Higher Education Skills on Saudi Arabia. Int. J. High. Educ. Manag. 2018, 4, 69–82. [Google Scholar] [CrossRef]
  15. Benlagha, N.; Hemrit, W. The Impact of Government Spending on Non-Oil-GDP in Saudi Arabia (Multiplier Analysis). Int. J. Econ. Bus. Res. 2018, 15, 350. [Google Scholar] [CrossRef]
  16. Nishiyama, Y. Causality between Government Spending and Income: The Case of Saudi Arabia. Appl. Econ. Lett. 2019, 26, 433–435. [Google Scholar] [CrossRef]
  17. Alnahdi, G.H. Factors Influencing the Decision to Major in Special Education in Saudi Arabia. S. Afr. J. Educ. 2020, 40, 1–9. [Google Scholar] [CrossRef]
  18. Reeves, A.; Basu, S.; McKee, M.; Meissner, C.; Stuckler, D. Does Investment in the Health Sector Promote or Inhibit Economic Growth? Glob. Health 2013, 9, 43. [Google Scholar] [CrossRef]
  19. Awaworyi Churchill, S.; Ugur, M.; Yew, S.L. Government Education Expenditures and Economic Growth: A Meta-Analysis. BE J. Macroecon. 2017, 17, 20160109. [Google Scholar] [CrossRef]
  20. Cerf, M.E. The Social-Education-Economy-Health Nexus, Development and Sustainability: Perspectives from Low- and Middle-Income and African Countries. Discov. Sustain. 2023, 4, 37. [Google Scholar] [CrossRef]
  21. Shafuda, C.P.P.; De, U.K. Government Expenditure on Human Capital and Growth in Namibia: A Time Series Analysis. J. Econ. Struct. 2020, 9, 21. [Google Scholar] [CrossRef]
  22. Islam, M.S.; Alam, F. Influence of Human Capital Formation on the Economic Growth in Bangladesh During 1990–2019: An ARDL Approach. J. Knowl. Econ. 2023, 14, 3010–3027. [Google Scholar] [CrossRef]
  23. Alam, F.; Singh, H.P.; Singh, A. Economic Growth in Saudi Arabia through Sectoral Reallocation of Government Expenditures. SAGE Open 2022, 12, 215824402211271. [Google Scholar] [CrossRef]
  24. Singh, H.P.; Singh, A.; Alam, F.; Agrawal, V. Impact of Sustainable Development Goals on Economic Growth in Saudi Arabia: Role of Education and Training. Sustainability 2022, 14, 14119. [Google Scholar] [CrossRef]
  25. Piabuo, S.M.; Tieguhong, J.C. Health Expenditure and Economic Growth—A Review of the Literature and an Analysis between the Economic Community for Central African States (CEMAC) and Selected African Countries. Health Econ. Rev. 2017, 7, 23. [Google Scholar] [CrossRef] [PubMed]
  26. Singh, A.; Singh, H.P.; Alam, F.; Agrawal, V. Role of Education, Training, and E-Learning in Sustainable Employment Generation and Social Empowerment in Saudi Arabia. Sustainability 2022, 14, 8822. [Google Scholar] [CrossRef]
  27. Olumekor, M.; Singh, H.P.; Alhamad, I.A. Online Grocery Shopping: Exploring the Influence of Income, Internet Access, and Food Prices. Sustainability 2024, 16, 1545. [Google Scholar] [CrossRef]
  28. Maitra, B.; Mukhopadhyay, C.K. Public Spending on Education, Health Care and Economic Growth in Selected Countries of Asia and the Pacific. Asia Pac. Dev. J. 2013, 19, 19–48. [Google Scholar] [CrossRef]
  29. Mercan, M.; Sezer, S. The Effect of Education Expenditure on Economic Growth: The Case of Turkey. Procedia Soc. Behav. Sci. 2014, 109, 925–930. [Google Scholar] [CrossRef]
  30. Le, M.P.; Tran, T.M. Government Education Expenditure and Economic Growth Nexus: Empirical Evidence from Vietnam. J. Asian Financ. Econ. Bus. 2021, 8, 413–421. [Google Scholar]
  31. Gheraia, Z.; Benmeriem, M.; Abed Abdelli, H.; Saadaoui, S. The Effect of Education Expenditure on Economic Growth: The Case of the Kingdom of Saudi Arabia. Humanit. Soc. Sci. Lett. 2021, 9, 14–23. [Google Scholar] [CrossRef]
  32. Abubakar, A.A.; Al-Mamary, Y.H.; Preet Singh, H.; Singh, A.; Alam, F.; Agrawal, V. Exploring Factors Influencing Sustainable Human Capital Development: Insights from Saudi Arabia. Heliyon 2024, 10, e35676. [Google Scholar] [CrossRef]
  33. Olumekor, M.; Polbitsyn, S.N.; Khan, M.S.; Singh, H.P.; Alhamad, I.A. Ageing and Digital Shopping: Measurement and Validation of an Innovative Framework. PLoS ONE 2025, 20, e0315125. [Google Scholar] [CrossRef] [PubMed]
  34. Singh, H.P.; Jindal, S.; Jindal, A. Globalisation and Inclusive Growth. Gyanprastha Accman J. Manag. 2011, 3, 135–139. [Google Scholar]
  35. Bakari, S. The Impact of Domestic Investment on Economic Growth New Policy Analysis from Algeria. Bull. Econ. Theory Anal. 2018, 3, 35–51. [Google Scholar] [CrossRef]
  36. Millia, H.; Syarif, M.; Adam, P.; Rahim, M.; Gamsir, G.; Rostin, R. The Effect of Export and Import on Economic Growth In Indonesia. Int. J. Econ. Financ. Issues 2021, 11, 17–23. [Google Scholar] [CrossRef]
  37. Alrasheedy, A.; Alrazyeg, R. Government Expenditure and Economic Growth in Saudi Arabia. Am. Int. J. Bus. Manag. (AIJBM) 2020, 3, 126–134. [Google Scholar]
  38. Almohaithef, M.; Elsayed, E. Health Education in Schools: An Analysis of Health Educator Role in Public Schools of Riyadh, Saudi Arabia. Saudi J. Health Sci. 2019, 8, 31. [Google Scholar] [CrossRef]
  39. Daniere, A.; Becker, G.S. Human Capital: A Theoretical and Empirical Analysis, with Special Reference to Education. Pp. Xvi, 187. New York: National Bureau of Economic Research. Ann. Am. Acad. Pol. Soc. Sci. 1965, 360, 208–209. [Google Scholar] [CrossRef]
  40. Romer, P.M. Increasing Returns and Long-Run Growth. J. Polit. Econ. 1986, 94, 1002–1037. [Google Scholar] [CrossRef]
  41. Lucas, R.E. On the Mechanics of Economic Development. J. Monet. Econ. 1988, 22, 3–42. [Google Scholar] [CrossRef]
  42. Mankiw, N.G.; Romer, D.; Weil, D.N. A Contribution to the Empirics of Economic Growth. Q. J. Econ. 1992, 107, 407–437. [Google Scholar] [CrossRef]
  43. Grossman, M. On the Concept of Health Capital and the Demand for Health. J. Political Econ. 1972, 80, 223–255. [Google Scholar] [CrossRef]
  44. Thirlwall, A.P. The Balance of Payments Constraint as an Explanation of International Growth Rate Differences. BNL Q. Rev. 1979, 32, 45–53. [Google Scholar]
  45. Bloom, D.E.; Canning, D. The Health and Wealth of Nations. Science 2000, 287, 1207–1209. [Google Scholar] [CrossRef]
  46. Hanushek, E.A.; Woessmann, L. The Role of Cognitive Skills in Economic Development. J. Econ. Lit. 2008, 46, 607–668. [Google Scholar] [CrossRef]
  47. Barro, R.J. Economic Growth in a Cross Section of Countries. Q. J. Econ. 1991, 106, 407. [Google Scholar] [CrossRef]
  48. Eggoh, J.; Houeninvo, H.; Sossou, G. Education, Health and Economic Growth in African Countries. J. Econ. Dev. 2015, 44, 93–111. [Google Scholar] [CrossRef]
  49. Marquez-Ramos, L.; Mourelle, E. Education and Economic Growth: An Empirical Analysis of Nonlinearities. Appl. Econ. Anal. 2019, 27, 21–45. [Google Scholar] [CrossRef]
  50. Well, D.N. Accounting for the Effect Of Health on Economic Growth. Q. J. Econ. 2007, 122, 1265–1306. [Google Scholar] [CrossRef]
  51. Aboubacar, B.; Xu, D. The Impact of Health Expenditure on the Economic Growth in Sub-Saharan Africa. Theor. Econ. Lett. 2017, 07, 615–622. [Google Scholar] [CrossRef]
  52. Gaies, B. Reassessing the Impact of Health Expenditure on Income Growth in the Face of the Global Sanitary Crisis: The Case of Developing Countries. Eur. J. Heal. Econ. 2022, 23, 1415–1436. [Google Scholar] [CrossRef]
  53. Rahman, R. The Privatization of Health Care System in Saudi Arabia. Health Serv. Insights 2020, 13, 1178632920934497. [Google Scholar] [CrossRef]
  54. Yang, X. Health Expenditure, Human Capital, and Economic Growth: An Empirical Study of Developing Countries. Int. J. Health Econ. Manag. 2020, 20, 163–176. [Google Scholar] [CrossRef] [PubMed]
  55. Esen, E.; Çelik Keçili, M. Economic Growth and Health Expenditure Analysis for Turkey: Evidence from Time Series. J. Knowl. Econ. 2022, 13, 1786–1800. [Google Scholar] [CrossRef]
  56. Krueger, A.O. Importance of General Policies to Promote Economic Growth. World Econ. 1985, 8, 93–108. [Google Scholar] [CrossRef]
  57. Balassa, B. Exports and Economic Growth. J. Dev. Econ. 1978, 5, 181–189. [Google Scholar] [CrossRef]
  58. Sachs, J.; Warner, A. Natural Resource Abundance and Economic Growth; Oxford University Press: New York, NY, USA, 1995. [Google Scholar]
  59. Awokuse, T.O. Causality between Exports, Imports, and Economic Growth: Evidence from Transition Economies. Econ. Lett. 2007, 94, 389–395. [Google Scholar] [CrossRef]
  60. Sulaiman, M.; Saad, N.M. An Analysis of Export Performance and Economic Growth of Malaysia Using Co-Integraton and Error Correction Models. J. Dev. Areas 2009, 43, 217–231. [Google Scholar] [CrossRef]
  61. Tsen, W.H. Exports, Domestic Demand, and Economic Growth in China: Granger Causality Analysis. Rev. Dev. Econ. 2010, 14, 625–639. [Google Scholar] [CrossRef]
  62. Alshahrani, S.; Alsadiq, A. Economic Growth and Government Spending in Saudi Arabia: An Empirical Investigation. IMF Work. Pap. 2014, 14, 1. [Google Scholar] [CrossRef]
  63. Sunde, T.; Tafirenyika, B.; Adeyanju, A. Testing the Impact of Exports, Imports, and Trade Openness on Economic Growth in Namibia: Assessment Using the ARDL Cointegration Method. Economies 2023, 11, 86. [Google Scholar] [CrossRef]
  64. Sultan, Z.A.; Haque, M.I. Oil Exports and Economic Growth: An Empirical Evidence from Saudi Arabia. Int. J. Energy Econ. Policy 2018, 8, 281–287. [Google Scholar]
  65. Toda, H.Y.; Yamamoto, T. Statistical Inference in Vector Autoregressions with Possibly Integrated Processes. J. Econom. 1995, 66, 225–250. [Google Scholar] [CrossRef]
  66. Pesaran, M.H.; Shin, Y.; Smith, R.J. Bounds Testing Approaches to the Analysis of Level Relationships. J. Appl. Econom. 2001, 16, 289–326. [Google Scholar] [CrossRef]
  67. Phillips, P.C.B.; Perron, P. Testing for a Unit Root in Time Series Regression. Biometrika 1988, 75, 335. [Google Scholar] [CrossRef]
  68. Dickey, D.A.; Fuller, W.A. Distribution of the Estimators for Autoregressive Time Series With a Unit Root. J. Am. Stat. Assoc. 1979, 74, 427. [Google Scholar] [CrossRef]
  69. Ng, S.; Perron, P. LAG Length Selection and the Construction of Unit Root Tests with Good Size and Power. Econometrica 2001, 69, 1519–1554. [Google Scholar] [CrossRef]
  70. Zivot, E.; Andrews, D.W.K. Further Evidence on the Great Crash, the Oil-Price Shock, and the Unit-Root Hypothesis. J. Bus. Econ. Stat. 1992, 10, 251. [Google Scholar] [CrossRef]
  71. Granger, C.W.J. Investigating Causal Relations by Econometric Models and Cross-Spectral Methods. Econometrica 1969, 37, 424. [Google Scholar] [CrossRef]
  72. Shin, Y.; Yu, B.; Greenwood-Nimmo, M. Modelling Asymmetric Cointegration and Dynamic Multipliers in a Nonlinear ARDL Framework. In Festschrift in Honor of Peter Schmidt; Springer: New York, NY, USA, 2014; pp. 281–314. [Google Scholar]
  73. Bakari, S.; Mabrouki, M. Impact Of Exports And Imports On Economic Growth: New Evidence From Panama. J. Smart Econ. Growth 2017, 2, 67–79. [Google Scholar]
  74. Fatemah, A.; Qayyum, A. Modelling the Impact of Exports on the Economic Growth of Pakistan. Turk. Econ. Rev. 2018, 5, 56–64. [Google Scholar]
  75. Islam, M.S. Do Education and Health Influence Economic Growth and Food Security Evidence from Bangladesh. Int. J. Happiness Dev. 2020, 6, 59. [Google Scholar] [CrossRef]
  76. Kutasi, G.; Marton, Á. The Long-Term Impact of Public Expenditures on GDP-Growth. Soc. Econ. 2020, 42, 403–419. [Google Scholar] [CrossRef]
  77. Raghupathi, V.; Raghupathi, W. Healthcare Expenditure and Economic Performance: Insights From the United States Data. Front. Public Health 2020, 8, 156. [Google Scholar] [CrossRef]
  78. Alghaith, T.; Liu, J.X.; Alluhidan, M.; Herbst, C.H.; Alazemi, N. A Labor Market Assessment of Nurses and Physicians in Saudi Arabia: Addressing Future Imbalances Between Need, Supply, and Demand; World Bank Group: Washington, DC, USA, 2021; Volume 1. [Google Scholar]
  79. Baumol, W.J. Health Care, Education and the Cost Disease: A Looming Crisis for Public Choice. Public Choice 1993, 77, 17–28. [Google Scholar] [CrossRef]
  80. Adam, P.; Rosnawintang, R.; Nusantara, A.W.; Muthalib, A.A. A Model of The Dynamic of the Relationship Between Exchange Rate and Indonesia’s Export. Int. J. Econ. Financ. Issues 2017, 7, 255–261. [Google Scholar]
Figure 1. Plot of asymmetry of positive and negative shocks to education expenditures. Source: Authors’ work.
Sustainability 17 04639 g001
Figure 2. Plot of asymmetry of positive and negative shocks to healthcare expenditures. Source: Authors’ work.
Sustainability 17 04639 g002
Figure 3. CUSUM test. Source: Authors’ work.
Sustainability 17 04639 g003
Figure 4. CUSUM of squares test. Source: Authors’ work.
Sustainability 17 04639 g004
Table 1. The ADF test results.
VariablesInterceptTrend and Intercept
LevelFirst DifferenceLevelFirst Difference
t-Statisticsp-Valuest-Statisticsp-Valuest-Statisticsp-Valuest-Statisticsp-Values
GDP−2.653520.0921−7.64465 *0.0000−2.921300.1681−7.56274 *0.0000
EXPO−1.255870.6391−5.71567 *0.0000−1.938580.6139−5.72550 *0.0002
EEXP−3.16025 **0.0309−10.6950 *0.0000−4.75476 *0.0027−10.5329 *0.0000
HEXP−3.62274 *0.0101−9.73190 *0.0000−5.77717 *0.0002−9.58400 *0.0000
Significance at the 1% and 5% levels indicated by * and **, respectively. Source: The authors.
Table 2. Phillips–Perron test results.
VariableInterceptTrend and Intercept
LevelFirst DifferenceLevelFirst Difference
Adj. t-Statisticsp-ValuesAdj. t-Statisticsp-ValuesAdj. t-Statisticsp-ValuesAdj. t-Statisticsp-Values
GDP−2.640330.0945−7.47886 *0.0000−2.921080.1681−7.45611 *0.0000
EXPO−1.146440.6865−5.80780 *0.0000−2.085690.5360−6.05644 *0.0001
EEXP−3.16377 **0.0307−11.6723 *0.0000−4.88670 *0.0019−11.50984 *0.0000
HEXP−3.65783 *0.0092−24.2035 *0.0001−5.77300 *0.0002−23.66124 *0.0000
* and ** are significant at the 1% and 5% levels, respectively. Source: The authors.
Table 3. KPSS test results.
VariablesIntercept OnlyTrend and Intercept
LevelFirst DifferenceLevel First Difference
LM StatisticsLM StatisticsLM StatisticsLM Statistics
GDP0.57836 **0.172300.066810.09519
EXPO0.62322 **0.130450.113380.11027
EEXP0.61527 **0.067090.080610.06629
HEXP0.67767 **0.222890.058160.22266 *
The * and ** denote 1% and 5% significance level, respectively. The 1% and 5% critical values with an intercept only are 0.73900 and 0.46300, respectively. The 1% and 5% critical values with intercept and trend are 0.21600 and 0.14600, respectively. Source: The authors.
Table 4. Zivot–Andrews unit root test results.
Type of Break Type of Break
VariableInterceptIntercept and Trend First Diff.Intercept Intercept and Trend
GDP−3.873 [2]−3.802 [2]Δ(GDP)−8.640 * [0]−9.949 * [0]
EXPO−4.052 [0]−3.838 [0]Δ(EXPO)−5.613 * [1]−5.727 * [1]
EEXP−5.980 * [0]−5.861 * [0]Δ(EEXP)−10.889 * [0]−11.262 * [0]
HEXP−6.182 * [0]−7.065 * [0]Δ(HEXP)−6.235 * [1]−7.357 * [1]
The critical values for intercept break at 1%, 5%, and 10% are −5.34, −4.80, and −4.58, respectively. For 1%, 5%, and 10%, the trend and intercept-break critical values are −5.57, −5.08, and −4.82, respectively. * denotes that the t-statistics are significant at the 1% level. The optimal lag of the BCI criterion is given in parentheses. Source: The authors.
Table 5. The NARDL F-bounds test of cointegration (model: NARDL (1, 1, 2, 3, 3, 2)).
F-Bound Test Null: There is No Level Relationship
Test StatisticsValuesLevel of SignificanceI(0)I(1)
Asymptotic: n = 1000
F-statistics5.2605%2.3903.380
k 51%3.0604.150
Actual Sample Size33
Finite Sample: n = 35
5%2.8044.013
1%3.9005.419
Finite Sample: n = 30
5%2.9104.193
1%4.1345.761
Source: The authors.
Table 6. Results of the NARDL (1, 1, 2, 3, 3, 2) model with restricted constant and no trend.
NARDL Error Correction Regression
Dependent Variable: D(GDP)
Included Observations: 33
VariableCoefficientStd. Errort-StatisticProb.
D(EXPO)0.0715 *0.01764.05410.0010
D(EEXP_POS)0.3648 *0.08284.40650.0005
D(EEXP_POS(−1))0.3382 *0.07034.81130.0002
D(EEXP_NEG)0.4847 *0.10524.60860.0003
D(EEXP_NEG(−1))−0.09250.0942−0.98210.3416
D(EEXP_NEG(−2))0.2616 *0.05834.48980.0004
D(HEXP_POS)−0.3821 *0.0638−5.99000.0000
D(HEXP_POS(−1))−0.04380.0270−1.61810.1265
D(HEXP_POS(−2))−0.02240.0134−1.67740.1142
D(HEXP_NEG)−0.1590 *0.0301−5.27660.0001
D(HEXP_NEG(−1))−0.1083 **0.0471−2.29840.0363
CointEq(−1)−0.4697 *0.0654−7.17940.0000
R-squared 0.8878
Adjusted R-squared 0.8290
Durbin-Watson Statistic 2.0339
* and ** denote 1% and 5% significance levels, respectively. Source: The authors.
Table 7. Results of the coefficient symmetry test.
Null Hypothesis: Coefficient is Symmetric.
VariableStatisticValueProbability
Long Run
EEXPF-statistic9.882076 *0.0067
Chi-square9.882076 *0.0017
HEXPF-statistic11.70779 *0.0038
Chi-square11.70779 *0.0006
Short Run
EEXPF-statistic0.0214550.8855
Chi-square0.0214550.8835
HEXPF-statistic1.5429350.2333
Chi-square1.5429350.2142
Joint (Long Run and Short Run)
EEXPF-statistic4.954710 **0.0223
Chi-square9.909420 *0.0071
HEXPF-statistic6.377160 *0.0099
Chi-square12.75432 *0.0017
* and ** denote significance at the 1% and 5% levels, respectively. Source: The authors.
Table 8. Level equation of the NARDL (1, 1, 2, 3, 3, 2) model with restricted constant and no trend.
VariableCoefficientStd. Errort-StatisticProb.
EXPO0.3084 *0.08353.69560.0022
EEXP_POS0.7578 *0.22023.44200.0036
EEXP_NEG1.2118 *0.37203.25730.0053
HEXP_POS−0.5358 *0.1470−3.64360.0024
HEXP_NEG−0.7472 *0.1943−3.84490.0016
C−1.3411 *0.3956−3.38980.0040
* Indicates 1% level of significance. Source: The authors.
Table 9. The NARDL diagnostic check results.
Test TypeNull HypothesisTest StatisticValuesProbabilities
Ramsey RESET (2) Test The model is appropriately specifiedF-statistic0.99080.3977
Likelihood ratio4.68180.0962
Test of Normality Errors follow a normal distributionJarque–Bera0.48890.7831
Breusch–Godfrey LM Test of Serial CorrelationThere is no serial correlation in errors for up to ten lagsF-statistic0.96240.4657
Obs*R-squared8.55460.0732
Breusch–Pagan–Godfrey Heteroskedasticity TestErrors are homoscedasticF-statistic1.57030.1925
Obs*R-squared21.12830.2206
Scaled explained SS5.37470.9965
Source: The authors.
Table 10. Cointegrating regressions results.
FMOLSDOLSCCR
VariableCoefficientt-StatisticCoefficientt-StatisticCoefficientt-Statistic
EXPO0.08434.8963 *
(0.0000)
0.11806.1353 *
(0.0000)
0.08994.7697 *
(0.0000)
EEXP0.29573.1476 *
(0.0036)
0.41154.3356 *
(0.0003)
0.30903.2160 *
(0.0030)
HEXP−0.1165−2.6448 **
(0.0126)
−0.2249−4.0808 *
(0.0005)
−0.1336−2.6511 **
(0.0124)
C−1.4314−4.6517 *
(0.0001)
−1.3566−4.6359 *
(0.0001)
−1.4455−4.5585 *
(0.0001)
Adjusted R-squared0.61060.77480.5928
Jarque-Bera0.1917
(0.9085)
1.5669
(0.4568)
0.1999
(0.9048)
* and ** denote 1% and 5% significance, respectively. Source: The authors.
Table 11. MWald Granger causality test [VAR(n+dmax) n = 1, dmax = 1)].
Null HypothesisChi-Sq. ValuedfProb.Inference
There is no causality from EXPO to GDP25.1386 *20.0000Causality from EXPO to GDP
There is no causality from GDP to EXPO2.644420.2665No causality from GDP to EXPO
There is no causality from EEXP to GDP10.2856 *20.0058Causality from EEXP to GDP
There is no causality from GDP to EEXP2.149520.3414No causality from GDP to EEXP
There is no causality from HEXP to GDP 17.1729 *30.0002Causality from HEXP to GDP
There is no causality from GDP to HEXP2.104930.3491No causality from GDP to HEXP
* Indicates 1% level of significance of the chi-square statistics. Source: The authors.
Disclaimer/Publisher’s Note: The statements, opinions and data contained in all publications are solely those of the individual author(s) and contributor(s) and not of MDPI and/or the editor(s). MDPI and/or the editor(s) disclaim responsibility for any injury to people or property resulting from any ideas, methods, instructions or products referred to in the content.

