Abstract
Ecosystem service flows are critical linkages between ecological supply and human demand. As a vital component of ecosystem services, water yield service is essential for human survival and development. Therefore, it is of great significance to explore the supply–demand relationship of water yield service and its spatial flow process. This study investigates the supply–demand dynamics and spatial flow of water yield service in the transnational area of Tumen River (2000–2020), utilizing the InVEST model and the miniature delivery-path-mechanism model. The results show the following: (1) From 2000 to 2020, the supply of water yield service in the Tumen River Basin exhibited a spatial distribution pattern of “low center, high surrounding”, with significant spatial heterogeneity in the distribution of supply and demand. (2) Despite the substantial surplus of water yield service in the study area, the ecosystem service supply–demand ratio (ESDR) shows an overall declining trend. The dominant spatial mismatch type is high-supply–low-demand (HL type) zones, primarily located in mountainous and hilly areas, accounting for over 40% of the total identified pixel types. (3) Driven by economic and social development, the spatial scope of water yield service flow has gradually expanded. Supply-side flows initially increased before declining, while demand-side flows followed the opposite trend. By mapping ecosystem service flows, this study provides a reference and basis for establishing the regional ecological compensation mechanism and promoting integrated water resource management, both of which are crucial for the long-term sustainable development of the basin.
1. Introduction
Ecosystem services refer to the various benefits that natural ecosystems provide to humans, including supporting, provisioning, regulating, and cultural services [1]. These services are directly linked to human well-being and serve as a bridge between natural ecosystems and socioeconomic systems [2,3,4]. Water resources, essential for human survival and development, are increasingly threatened in the context of global climate change and population growth [5,6,7]. As a crucial ecosystem service provided by aquatic ecosystems, water yield service plays a vital role in regional water security [8]. The concept of ecosystem service flow (ESF) emerged from the relationship between the supply and demand of ecosystem services, focusing on the entire process of how services flow from the supply sides (SPAs) to the demand sides (SBAs) [9,10]. Research on ESF is pivotal for addressing key questions in ecosystem service management, such as where benefits are generated, to what extent they are utilized, and by whom [11,12]. Water yield service flow has become a prominent area of ESF research due to its clear flow nature [13,14]. Therefore, strengthening dynamic research on water yield service flow is critical for understanding its development trends, identifying effective and rational water resource management strategies, and promoting the sustainable and balanced cycle of water resource utilization.
Several studies have explored water ecosystem service flows. Serna-Chavez et al. (2014) proposed a framework to quantify water yield service flow and assess global variations [15]. Datry et al. (2018) proposed a conceptual model to assess the multiple ecosystem services of intermittent water bodies, extending it to ecosystem service flows [16]. Qin et al. (2019) integrated ecosystem service flows into water security simulations using a simplified Service Path Attribution Network (SPANs) model [17]. This approach simulated future water flow scenarios in the lower Yellow River and compared them to the current water security situation, offering a systematic evaluation of regional water security. Garau et al. (2021) applied participatory mapping methodologies to analyze water ecosystem service flows in the Mediterranean Muga River Basin in Spain from a stakeholder perspective [18]. Wang (2022) developed a network model to assess water ecosystem service flows in the Wuding River Basin [19]. Zou et al. (2022) used a freshwater ecosystem service flow model to simulate the impacts of land use changes on freshwater ecosystem services in the Lianshui River Basin [20]. Zhang J et al. (2023) applied the breakpoint model to analyze multiple ecosystem service flows, including water yield service, in the Huangshui River Basin and its surrounding areas [9]. De Jesus Crespo et al. (2023) used the socio-ecological network (SEN) framing to quantify the flow of water purification services in reservoirs on the island of Puerto Rico [21]. However, these studies face limitations in capturing the spatiotemporal dynamics of water ecosystem service flows, as well as in the allocation of service amounts between the supply and demand sides. Inspired by the SPANs model, Su et al. (2024) developed the miniature delivery-path-mechanism model, which successfully simulates and quantifies ecosystem service flows in the Hangzhou Bay area [22]. Based on the “supply–flow–demand” framework, this model focuses on the ecosystem service flow and is suitable for simulating various service flows. One of its key advantages is the ability to distinguish between different flows from the supply and demand sides, providing a more comprehensive understanding of the supply–demand relationship and the development trends of ecosystem service flows. Therefore, the miniature delivery-path-mechanism model holds great potential for comprehensively evaluating ecosystem service flows.
The transnational area of Tumen River, located at the tri-junction of China, North Korea, and Russia, is a key ecological functional zone in Northeast Asia and a strategic hub connecting the “Land Silk Road” and the “Polar Silk Road” [23,24]. Since the launch of the Belt and Road Initiative, increased regional cooperation among China, North Korea, South Korea, Japan, and Russia has fostered rapid socioeconomic growth, cross-border tourism, and international trade in the basin. However, urbanization and population growth have placed significant pressure on water resources, leading to declining water availability, deteriorating quality, and increased risks to regional water security and human well-being [25,26].
Recent studies have focused on water yield service flow in the Tumen River Basin. Zhang et al. (2022) used the InVEST model to simulate water yield service in the basin from 1990 to 2019 [25]. The analysis revealed that precipitation and actual evapotranspiration were the dominant natural factors affecting water yield service. Zhang et al. (2023) combined the InVEST and LUSD-urban models to assess the indirect impacts of urban expansion on ecosystem services, including in the Tumen River Basin [27]. Qi et al. (2023) used the SWAT model to quantify blue and green water resources in the Tumen River Basin from 2015 to 2020, examining the water resource supply–demand balance [28]. Jin et al. (2023) analyzed the impact of land use change on six ecosystem services in the cross-border Tumen River area, revealing a positive correlation between water yield service and net primary productivity (NPP) [26]. However, most studies focus primarily on the supply side of water yield service, with limited research on the demand side and related supply–demand patterns. Additionally, existing research of water yield service in the Tumen River Basin is static, with little evaluation of the temporal dynamics of water yield service flow and its spatial delivery pathways.
This study aims to investigate the dynamic characteristics of water yield service flow in the Tumen River Basin through an integrated approach that combines the InVEST model, water demand model, ESDR model, and miniature delivery-path-mechanism model. First, we integrated the water yield module of the InVEST model with the water demand model to quantify the supply and demand of water yield service across the basin from 2000 to 2020 and analyze their spatiotemporal variation. Then, the ESDR model and bivariate local Moran’s I index were used to analyze the imbalance between supply and demand and its spatial matching pattern. Finally, the miniature delivery-path-mechanism model was introduced to simulate and quantify the flow of water yield service in the Tumen River Basin. Based on these results, this study proposes strategies and recommendations for achieving sustainable development in this transnational region.
2. Materials and Methods
2.1. Study Area
The Tumen River Basin (Chinese section), located at the tri-junction of China, North Korea, and Russia, is a transboundary river of regional significance in Northeast Asia. It originates from the eastern slopes of the Changbai Mountains’ main peak and extends 525 km northward, flowing through China’s Jilin Province (including Helong, Longjing, Tumen, and Hunchun cities), North Korea’s Ryanggang and North Hamgyong provinces, and Russia’s Primorsky Krai before draining into the Sea of Japan at the Russia–North Korea border (Figure 1).

Figure 1.
The study area.
The basin is characterized by diverse and complex terrain, primarily comprising mountains, hills, and plains. It spans a total area of 33,200 km2, with approximately 22,600 km2 located on the Chinese side. The region experiences a typical temperate continental climate, with average annual temperatures ranging from 2 °C to 6 °C and annual precipitation between 400 and 650 mm. Summers are warm and humid, while winters are cold and dry [29,30,31]. The basin boasts a favorable natural environment and plays a crucial role in the ecological network of Northeast Asia. It is home to diverse flora and fauna, including endangered species such as the Siberian tiger and Amur leopard. It also serves as an important migratory bird habitat and is a key ecological functional zone in China, as well as a pilot area for the national park system [32].
Between 2000 and 2020, the study area experienced rapid economic growth and urban expansion. The GDP increased from 13.43 billion yuan in 2000 to 72.69 billion yuan in 2020, reflecting a growth of 441.25% (Yanbian Prefecture Statistical Yearbook, 2020 [33]). The urban land area expanded from 260.64 km2 in 2000 to 422.22 km2 in 2020, placing increased pressure on regional water resources. Furthermore, from 1960 to 2016, the average annual runoff depth in the Tumen River Basin showed a decreasing trend. The contributions of climate change and human activities to the reduction in runoff were 26.26% and 73.74%, respectively [34]. Between 2015 and 2020, both blue and green water resources in the Tumen River Basin exhibited distinct seasonal characteristics. The average annual volume of blue and green water resources was 11.716 billion m3, with blue water at 3.014 billion m3 and green water at 8.702 billion m3. The available blue water resources were insufficient to meet demand, and the supply–demand imbalance was particularly prominent in years with low precipitation [28]. Therefore, it is imperative to simulate and quantify the flow of water yield service in this region, as this will provide a foundation for enhancing the sustainability of regional water resources and improving human well-being.
2.2. Materials
The data used in this study include land use/land cover, precipitation, potential evapotranspiration, elevation, soil properties, bedrock depth, available soil water capacity, and socioeconomic data (Table 1). Land use/land cover (LULC) data for the years 2000, 2010, and 2020 were obtained from the National Catalogue Service for Geographic Information. The data were classified into six categories: cropland, woodland, grassland, wetland, water body, and urban land. The 30 m Digital Elevation Model (DEM) data were sourced from the US Geological Survey (USGS) Earth Explorer. Precipitation and potential evapotranspiration data were acquired from the 1 km monthly precipitation dataset for China (1901–2023) of the National Qinghai–Tibet Plateau Scientific Data Center and processed into annual data using ArcGIS. Soil data were obtained from the Harmonized World Soil Database (HWSD). Bedrock depth and soil water holding capacity data, with a resolution of 250 m, were obtained from ISRIC. Socioeconomic data, including population data, GDP data, water consumption data, and river runoff data, were incorporated into the analysis. Population data were obtained from the World Pop Dataset (100 m resolution) and corrected using ArcGIS 10.8.2 and other software, along with demographic data. Water consumption data, GDP data, and demographic data for correction were sourced from the Statistical Yearbook and the Yanbian Prefecture Bureau of Statistics. Annual runoff data were taken from the Jilin Provincial Water Resources Bulletin. All data were projected using a transverse Mercator projection.

Table 1.
Data sources.
2.3. Methods
This study adopts the “supply–flow–demand” framework to assess water yield service flow in the Tumen River Basin (Figure 2). First, we quantify water yield supply and demand from 2000 to 2020 using the InVEST model and ArcGIS, identifying their spatiotemporal patterns. Next, we evaluate spatial mismatches by combining the ecosystem service supply–demand ratio (ESDR) with bivariate local Moran’s I analysis to pinpoint regions of imbalance. Finally, the miniature delivery-path-mechanism model simulates dynamic water yield service flow, tracing their pathways from ecological sources to human settlements. This integrated approach provides valuable insights for optimizing water resource sustainability in response to evolving socioeconomic and environmental pressures.
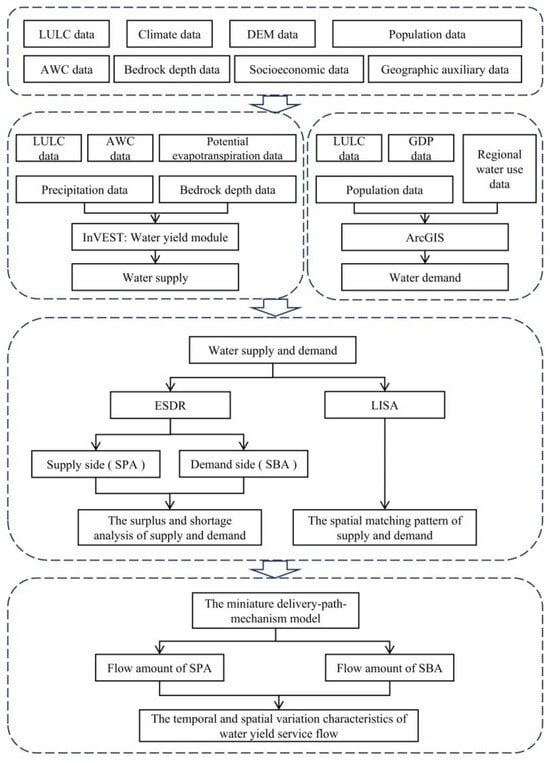
Figure 2.
Flowchart.
2.3.1. The Supply of Water Yield Service
The Integrated Valuation of Ecosystem Services and Trade-offs (InVEST) model, developed by the Natural Capital Project at Stanford University, is an open-source tool for systematically assessing ecosystem services such as water yield, carbon storage, soil retention, and habitat quality [35]. This study utilizes the InVEST annual water yield module to calculate the water supply in the Tumen River Basin based on the water balance principle. The specific calculation formula is as follows:
In Equation (1), Y(x) represents the annual water yield of pixel x, AET(x) is the actual annual evapotranspiration of pixel x, and P(x) is the annual precipitation on pixel x. The specific calculation formula is as follows:
In Equation (2), AET(x) is the potential evapotranspiration on pixel x, and w is the non-physical parameter that characterizes the natural climate–soil properties.
w(x) is expressed using the formula proposed by Donohue et al. (2012) [36], calculated as follows:
In Equation (3), AWC(x) is the available water content of plants on pixel x, and Z is Zhang coefficient, an empirical constant usually ranging from 1 to 30. Based on studies by Xiang et al. (2020), Zhang X et al. (2021), and Huang et al. (2023), we continuously adjusted the Zhang coefficient and compared the resulting simulated water yield with the annual runoff data reported in the Jilin Province Water Resources Bulletin [37,38,39]. Through this process, we identified the optimal parameter value. The final parameter values are summarized in Table 2.
Table 2.
Verification of water yield and Zhang coefficients used.
This study follows the research of Wang et al. (2024) and An et al. (2025) and sets the biophysical parameters based on the actual conditions of the study area, as shown in Table 3 [40,41].
Table 3.
Biophysical parameters of water yield module.
2.3.2. The Demand of Water Yield Service
Following established methodologies, total water demand was calculated as the sum of four sectors: agricultural, domestic, industrial, and public/ecological uses [42,43,44]. Demand quantification integrated LULC and population distribution data. The specific calculation formula is as follows:
In Equation (4), Wd denotes the water requirement for permeate services. Wagr, Wpop, Wind, and Wpub represent agricultural water, residential water, industrial water, and public/ecological water, respectively.
2.3.3. Ecosystem Service Supply–Demand Ratio
The ESDR integrates ecosystem service supply (ESS) and human demand (ESD) to assess their spatial equilibrium [42]. The formula is as follows:
In Equation (5), ESS and ESD are the actual supply and demand of ecosystem services, respectively.
2.3.4. Spatial Matching of Water Yield Service Demand and Supply
The bivariate Local Indicators of Spatial Association (LISA) is an indicator used to analyze spatial data of different regions or units in the study area, reflecting the degree and significance of spatial differences between each region or unit and its surrounding areas [45]. The bivariate local Moran’s I index captures five types of spatial agglomeration, namely, “high–high match”, “low–low match”, “high–low mismatch”, “low–high mismatch”, and “not significant”. In this study, a 500 m × 500 m grid was established to collect statistics on the supply and demand of water yield service in the study area. The data were then analyzed using the Geoda model. The specific calculation formula is as follows:
In Equation (6), n is the number of pixels; xi is the raster value of pixel i; x is the average value of the pixel i; wij is the spatial weight matrix.
2.3.5. Simulation and Quantification of Water Yield Service Flow
Due to gravitational and topographic influences, water resources naturally flow via rivers, streams, and artificial channels from upstream (higher elevations) to downstream (lower elevations) [22,46]. Consequently, water yield service flow is unidirectional: the supply sides (SPAs) located downstream cannot transfer surpluses to the demand sides (SBAs) upstream. Based on this, we combined the regional water system and DEM data to simulate water yield service flow by using the natural river channel as the flow path (Figure A1).
Building on Su et al. (2024) [22], we applied the miniature delivery-path-mechanism model to quantify flow and interactions between supply and demand sides. The model distinguishes two flow components (Figure 3):

Figure 3.
Schematic diagram of water yield service flow (adapted from Su et al., 2024 [22]).
For demand sides D0: SBAs receive water surpluses routed through these pathways.
For supply sides S0: Surplus water from SPAs propagates downstream along designated pathways to meet SBAs’ demands.
In Equations (7) to (10), S represents the service surplus on the supply side (SPAs). D represents the service deficit on the demand side (SBAs). w is the Gaussian decay function. The specific calculation formula is as follows:
In Equation (11), dmn is the flow path between supply and demand, d0 is the maximum flow distance, and d0 is set to 200 km according to the actual situation of the study area.
3. Results
3.1. Characteristics of Temporal and Spatial Variation in the Water Yield Service Supply and Demand
3.1.1. Temporal and Spatial Variation in Water Yield
In 2020, the Tumen River Basin exhibited a distinct spatial pattern of water yield, characterized by lower values in the central areas and higher values in the peripheral regions (Figure 4 and Table 4). The total annual water yield across the basin was 6.303 × 10⁹ m3, with an average areal yield of 2.790 × 10⁵ m3/km2. Sub-basin analysis identified the Gaya River sub-basin as the largest contributor, accounting for 1.617 × 10⁹ m3 (25.7% of total yield) and a unit-area yield of 2.505 × 10⁵ m3/km2. This was followed by the Hunchun River (1.326 × 10⁹ m3, 21.0%) and Burhatong River (1.013 × 10⁹ m3, 16.1%), while the Mijiang River contributed the least (0.217 × 10⁹ m3).
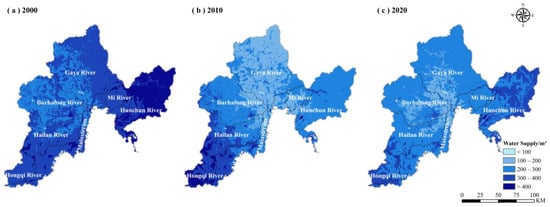
Figure 4.
Water yield in 2000, 2010, and 2020.
Table 4.
Water yield at regional and sub-basin scales.
Between 2000 and 2020, the basin experienced a marked decline in water yield, particularly in the central and northern regions (Figure 4 and Table 4). Total annual yield decreased by 25.8%, from 8.492 × 10⁹ m3 to 6.303 × 10⁹ m3, accompanied by a reduction in areal yield of 0.969 × 10⁵ m3/km2. Sub-basin trends revealed substantial losses: the northeastern Mijiang River sub-basin recorded the steepest decline (−30.3%, with areal yield reduced by 1.232 × 10⁵ m3/km2), followed by the northern Gaya River. In contrast, the Hongqi River sub-basin exhibited the smallest reduction (−10.2%).
3.1.2. Temporal and Spatial Variation in Water Demand
In 2020, the demand for water yield service in the Tumen River Basin exhibited a distinct spatial pattern, with higher values in the central areas and lower values in the peripheral regions (Figure 5). The total water demand for the entire basin was 0.413 × 10⁹ m3, with an average demand of 0.183 × 10⁵ m3/km2 (Table A1). The annual water demand across the basin was 0.413 × 10⁹ m3, corresponding to a mean areal demand of 0.183 × 10⁵ m3/km2. Sub-basin analyses identified the Burhatong River sub-basin as the primary demand hotspot, accounting for 0.138 × 10⁹ m3 (33.4% of total demand) and a unit-area demand of 0.333 × 10⁵ m3/km2. This was followed by the Hailan River (0.087 × 10⁹ m3, 20.9%) and the Gaya River (0.083 × 10⁹ m3, 20.1%). In contrast, the Mijiang River sub-basin exhibited minimal demand (0.001 × 10⁹ m3).

Figure 5.
Water demand in 2000, 2010, and 2020.
Between 2000 and 2020, the basin experienced a gradual decline in water demand, with the most significant reductions occurring in the central regions (Figure 5 and Table A1). The total annual demand decreased by 11.4%, from 0.467 × 10⁹ m3 to 0.413 × 10⁹ m3, accompanied by a reduction in the per-unit demand intensity of 0.024 × 10⁵ m3/km2. Sub-basin trends revealed that the Gaya River sub-basin experienced the steepest demand decline (a 15.6% reduction). The Hailan River and Tumen River Mainstream basin showed more moderate reductions. In contrast, the Hongqi River sub-basin was the only area where demand increased, rising by 17.1%.
3.2. Analysis of Supply and Demand Relationship of Water Yield Service
3.2.1. Temporal and Spatial Changes in Water Yield Service Supply–Demand Ratio
In 2020, the Tumen River Basin exhibited a distinct supply–demand imbalance: low ESDR values clustered in urban and cropland areas, whereas forests and grasslands maintained comparatively high ratios (Figure 6 and Figure A2), underscoring greater water resource pressures in developed landscapes. Between 2000 and 2020, the basin maintained an overall water yield surplus, yet its mean ESDR declined from 0.896 to 0.877 (Table 5). Notably, the spatial extent of areas with ESDR values in “0–0.5” expanded by 23%, primarily within middle and lower sub-basins. Concurrently, the number of townships experiencing imbalances (ESDR < 0) first increased from 15 (2000) to 21 (2010) but later decreased to 16 (2020), reflecting improved water management interventions in recent years.
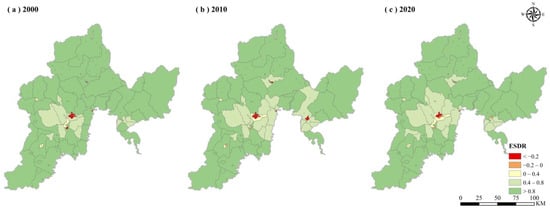
Figure 6.
ESDR for water yield service.
Table 5.
Water surplus at the regional and sub-basin scales.
3.2.2. Analysis of Spatial Matching Pattern of Water Yield Service Supply and Demand
In 2020, the Tumen River Basin was dominated by high-supply–low-demand mismatch zones (HL type), concentrated in the southern and northeastern regions (Figure 7, Table 6). These areas covered 24,487 pixels (49.8% of all categorized pixels), reflecting significant spatial disparities. Low-supply–low-demand match zones (LL type) were secondary, occupying 13,632 pixels (27.7%) in northern areas. High-supply–high-demand clusters (HH type) and low-supply–high-demand mismatches (LH type) were sporadically distributed in the central and eastern basins.
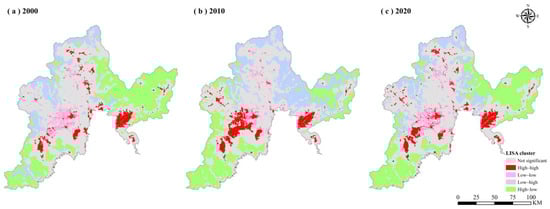
Figure 7.
Spatial matching pattern of water yield service supply and demand.
Table 6.
Statistics on spatial matching types.
Between 2000 and 2020, spatial mismatch patterns shifted markedly (Figure 8 and Table 6). The prevalence of HL-type zones initially declined from 54.2% (2000) to 40.1% (2010) before rebounding to 49.8% (2020). LL-type zones gradually expanded into the northeast, while LH-type and HL-type zones remained stable, fluctuating within 1% of their original coverage.
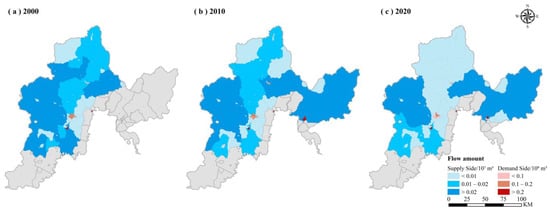
Figure 8.
Water yield service flow amount in 2000, 2010, and 2020.
3.3. Water Yield Service Flow Analysis
Between 2000 and 2020, the Tumen River Basin exhibited consistent yet evolving dynamics in water yield service flow (Figure 8). By 2020, service flows remained muted in the northern and southern reaches while rising markedly in the eastern and western sectors. Supply-side contributions fell sharply—from 0.025 × 10⁹ m3 in 2000 to 0.017 × 10⁹ m3 in 2020—with a brief peak in 2010 (Table 7). Notably, San Daowan Township (Yanji City) remained the largest supply contributor in 2020 (0.0037 × 10⁹ m3, 21.7%), followed by Mingyue and Laotougou townships. Conversely, demand-side flows climbed from 4.363 × 10⁹ m3 in 2000 to 4.515 × 10⁹ m3 in 2020. Jinghe Subdistrict (Hunchun City) alone absorbed 30.6% of the basin’s water demand, outstripping other urban centers such as Xinhua (22.4%) and Xiangshang (13.1%) subdistricts in Tumen City. These shifts reflect growing urban pressures in demand hotspots alongside constrained supply capacities in upstream zones, underscoring the need for spatially adaptive management strategies.
Table 7.
Statistics on water yield service flow related information.
4. Discussion
4.1. Analysis of Water Yield Service Supply–Demand Dynamics in Key Urban Areas
In this study, we paid special attention to the changes in supply and demand of water yield service in economically developed and populous areas in the study area, using Yanji City as a focal example. As the political and economic core of Yanbian Prefecture, Yanji exemplifies the challenges of balancing growth with water sustainability. From 2000 to 2020, the city’s water yield decreased by 27.3% (from 0.579 × 10⁹ m3 to 0.421 × 10⁹ m3), while demand declined marginally (9.2%, from 0.094 × 10⁹ m3 to 0.086 × 10⁹ m3). These trends are deeply tied to land use transformations: urbanization expanded by 61.8%, replacing vital grasslands (−34.1%) and croplands (−7.7%). Impervious surfaces in new urban areas increased local runoff, boosting urban water yield by 61.8%, while grassland and cropland losses reduced infiltration capacity, exacerbating basin-wide supply shortages. This is consistent with the results of Aneseyee et al. (2022), Shi et al. (2022), and Cui et al. (2021) [47,48,49].
On the demand side, socioeconomic dynamics—most notably, population growth and industrial restructuring—have shaped water use patterns, echoing the conclusions of Wang X et al. (2023) [50]. Between 2000 and 2020, Yanji’s population rose by 43.2% (from 389,500 to 557,830), driving a 63.4% surge in domestic water consumption (to 0.0219 × 10⁹ m3 in 2020). In contrast, industrial water use dropped by 55.1% (from 0.037 × 10⁹ m3 to 0.016 × 10⁹ m3). This is due to the optimization and adjustment of the industrial structure. After 2010, under the guidance of the national concept of “ecological civilization construction” and Yanbian Prefecture’s “ecological prefecture” strategy, Yanji City actively promoted the optimization and upgrading of the industrial sector, regulated high-water-consuming and high-pollution industries, and achieved a significant decline in industrial water consumption.
4.2. Analysis of Influencing Factors of Regional Water Yield Service Flow
This study dynamically simulates water yield service flow in the Tumen River Basin using the miniature delivery-path-mechanism model. The primary objective is to explore the complex water yield supply and demand relationship in the region, specifically focusing on the origins and destinations of water yield service flow. Building upon this, we further investigate the factors influencing water yield service flow in the region, aiming to provide scientific support for the management and optimization of regional water resources. Existing studies indicate that the flow of ecosystem services results from the combined effects of natural and human factors [10,51]. Analyzing the main driving factors of water yield service flow can provide a solid foundation for making sustainable water management decisions.
We quantified the influence of nine factors on regional water yield service flow using the Geographical Detector method (Figure 9). These factors encompass both human and natural aspects: population density (Population), gross national product (GDP), land use/land cover (LULC), Normalized Difference Vegetation Index (NDVI), precipitation (Pre), evapotranspiration (Pet), plant available water content (PAWC), bedrock depth, elevation (DEM), and slope. The results show that, among the human factors, population density has the greatest explanatory power for the flow of water yield service in the region, while LULC has the least. Among the natural factors, NDVI has the greatest explanatory power, while bedrock depth has the least. The factor interaction detection reveals that population density interacts most significantly with other influencing factors, producing the largest q-value. This suggests that population density is the dominant factor influencing the flow of regional water yield service. In regions with rapid economic growth and high population density, the demand for water resources increases. When local supply fails to meet this demand, external support is sought, which significantly promotes the flow of water yield service.
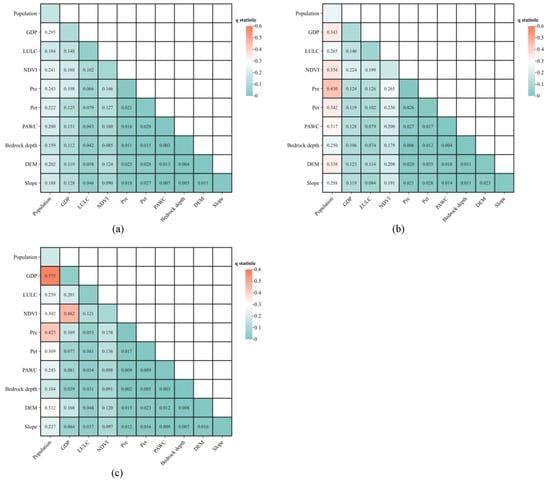
Figure 9.
Interaction detection for water yield ecosystem service flow. (a) 2000; (b) 2010; (c) 2020.
As an important ecological functional zone in Jilin Province, water security in the Tumen River Basin is a critical prerequisite for ensuring regional ecological safety. Therefore, greater emphasis must be placed on the management and protection of water resources. In water resource management, it is crucial not only to consider the impact of natural factors on regional water security but also to recognize the significant role of human activities. Establishing a comprehensive water resource management framework that integrates both natural and human factors is essential. Through data monitoring and analysis, the flow of water resources should be assessed in real time to ensure that policies are scientifically grounded and effective.
4.3. Limitations and Future Perspectives
This study has several limitations. First, the analysis of water yield service supply was conducted using the InVEST model, which focuses solely on surface water, neglecting groundwater resources. This omission may result in an underestimation of the total water resources in the region. Second, when quantifying water demand, the study was constrained by the available data. It only considered industrial, agricultural, residential, and urban public/ecological water uses, excluding other forms of water use across both human activities and natural ecosystems. Finally, in the simulation and quantification of water yield service flow, the study was limited by data acquisition and quantification constraints, incorporating only natural river channels as the flow paths for water yield service. It did not account for infrastructure such as artificial canals or reservoirs, leading to an incomplete representation of the flow paths of water yield service in the study area.
Future studies will aim to incorporate multi-source data, including remote sensing data and statistical datasets, to provide a more comprehensive assessment and quantification of the supply and demand for water yield service. Additionally, we plan to adopt various methods to include artificial infrastructure such as water channels and reservoirs in our models. By incorporating different water flow paths, we aim to better understand the movement of water resources within the region and across ecosystems. Moreover, we will focus on analyzing the water flow characteristics within specific regions or ecosystems, exploring the complex interactions between them.
5. Conclusions
The findings provide valuable insights for the formulation of regional water sustainable development policies. The research reveals that from 2000 to 2020, both water yield supply and demand in the Tumen River Basin showed declining trends, with reductions of 25.8% and 11.4%, respectively. Spatially, supply followed a pattern of “low center, high surrounding”, while demand showed an inverse distribution. Despite substantial water yield surpluses (ESDR: 0.877–0.896), spatial mismatches dominated the basin’s supply–demand dynamics, with over 40% of the areas classified as high-supply–low-demand mismatches (HL type), primarily concentrated in mountainous and hilly regions. Socioeconomic development has increasingly integrated townships into water yield service flow. Initially, supply-side flows increased before declining, whereas demand-side flows followed the opposite trend. Notably, population density, especially in conjunction with factors like GDP and NDVI, emerged as the dominant driver of service flow, reflecting the increasing anthropogenic pressures on water security.
To address these challenges, we propose the following recommendations. First, in densely populated areas, it is crucial to develop scientifically grounded population management policies that take into account both natural and socioeconomic conditions, in order to alleviate pressure on water resources and reduce supply–demand imbalances. Second, water resource management systems should be improved by legally implementing comprehensive water resource plans and conducting systematic scientific assessments and evaluations. In the development and utilization of water resources, priority should be given to surface water, while groundwater extraction must be strictly controlled. Regional water resources should be allocated in a balanced and efficient manner, with an emphasis on the rational use of non-conventional water sources such as reclaimed water, harvested rainwater, and mine water. Finally, a differentiated ecological compensation mechanism should be established, where regions on the demand side provide financial compensation and support to regions on the supply side. This will ensure that ecological protection and economic development proceed in parallel, fostering the sustainable development of regional ecosystems. These measures would promote a sustainable equilibrium between water resource utilization and water ecosystem protection, ensuring long-term water security for the Tumen River Basin.
Author Contributions
Conceptualization, H.X.; methodology, H.X.; software, H.X.; validation, D.Z.; formal analysis, H.X.; investigation, Y.N.; resources, Y.N.; data curation, Y.N.; writing—original draft preparation, H.X.; writing—review and editing, D.Z.; visualization, H.X.; supervision, D.Z.; project administration, D.Z.; funding acquisition, D.Z. All authors have read and agreed to the published version of the manuscript.
Funding
This research was funded by the Jilin Science and Technology Development Program (Grant/Award Number: 20210203138SF) and the National Natural Science Foundation of China (Grant/Award Number: 42271314).
Institutional Review Board Statement
Not applicable.
Informed Consent Statement
Not applicable.
Data Availability Statement
The data that support the findings of this study are available from the corresponding author upon reasonable request.
Conflicts of Interest
The authors declare no conflicts of interest. The funders had no role in the design of the study; in the collection, analyses, or interpretation of data; in the writing of the manuscript; or in the decision to publish the results.
Appendix A
Table A1.
Water demand at the regional and sub-basin scales.
Table A1.
Water demand at the regional and sub-basin scales.
| Year | Total Water Demand (109 m3) | Average Water Demand (105 m3/km2) | Ratio (%) | |||||
|---|---|---|---|---|---|---|---|---|
| Sub-Basin | 2000 | 2010 | 2020 | 2000 | 2010 | 2020 | ||
| Burhatong River | 0.153 | 0.155 | 0.138 | 0.368 | 0.375 | 0.333 | −9.370 | |
| Gaya River | 0.098 | 0.089 | 0.083 | 0.152 | 0.138 | 0.129 | −15.590 | |
| Hailan River | 0.102 | 0.093 | 0.087 | 0.351 | 0.322 | 0.299 | −14.810 | |
| Hongqi River | 0.002 | 0.002 | 0.002 | 0.015 | 0.017 | 0.018 | 17.112 | |
| Hunchun River | 0.061 | 0.068 | 0.058 | 0.154 | 0.171 | 0.146 | −5.401 | |
| Mjiang River | 0.001 | 0.001 | 0.001 | 0.020 | 0.018 | 0.018 | −6.833 | |
| Tumen River Mainstream Basin | 0.049 | 0.048 | 0.044 | 0.157 | 0.153 | 0.139 | −10.979 | |
| TRB | 0.467 | 0.457 | 0.413 | 0.207 | 0.202 | 0.183 | −11.406 | |
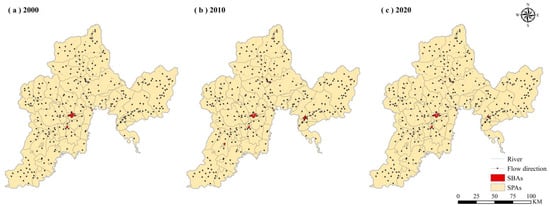
Figure A1.
Water yield service flow paths and directions.
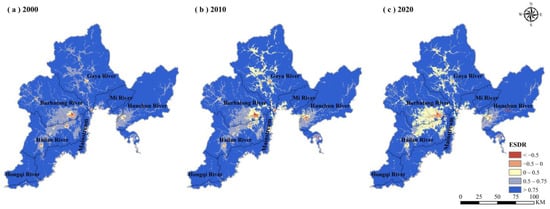
Figure A2.
ESDR for water yield service (pixel scale).
References
- Millennium Ecosystem Assessment. Ecosystems and Human Well-Being: Synthesis; The Millennium Ecosystem Assessment Series; Island Press: Washington, DC, USA, 2005; ISBN 978-1-59726-040-4. [Google Scholar]
- Daily, G.C.; Polasky, S.; Goldstein, J.; Kareiva, P.M.; A Mooney, H.; Pejchar, L.; Ricketts, T.H.; Salzman, J.; Shallenberger, R. Ecosystem Services in Decision Making: Time to Deliver. Front. Ecol. Environ. 2009, 7, 21–28. [Google Scholar] [CrossRef]
- Summers, J.K.; Smith, L.M.; Case, J.L.; Linthurst, R.A. A Review of the Elements of Human Well-Being with an Emphasis on the Contribution of Ecosystem Services. AMBIO 2012, 41, 327–340. [Google Scholar] [CrossRef]
- Wang, Z.; Zhang, L.; Li, X.; Li, Y.; Wang, P.; Yan, J. Spatio-Temporal Pattern of Supply-Demand Risk of Ecosystem Services at Regional Scale: A Case Study of Water Yield Service in Shaanxi Province. Acta Ecol. Sin. 2020, 40, 1887–1900. [Google Scholar] [CrossRef]
- Frederick, K.D.; Major, D.C. Climate Change and Water Resources. Clim. Change 1997, 37, 7–23. [Google Scholar] [CrossRef]
- Larsen, T.A.; Hoffmann, S.; Lüthi, C.; Truffer, B.; Maurer, M. Emerging Solutions to the Water Challenges of an Urbanizing World. Science 2016, 352, 928–933. [Google Scholar] [CrossRef]
- Lin, Y.; Xu, X.; Tan, Y.; Chen, M. Multi-Scalar Assessment of Ecosystem-Services Supply and Demand for Establishing Ecological Management Zoning. Appl. Geogr. 2024, 172, 103435. [Google Scholar] [CrossRef]
- Zhu, Q.; Tran, L.T.; Wang, Y.; Qi, L.; Zhou, W.; Zhou, L.; Yu, D.; Dai, L. A Framework of Freshwater Services Flow Model into Assessment on Water Security and Quantification of Transboundary Flow: A Case Study in Northeast China. J. Environ. Manag. 2022, 304, 114318. [Google Scholar] [CrossRef]
- Zhang, J.; He, C.; Huang, Q.; Li, L. Understanding Ecosystem Service Flows through the Metacoupling Framework. Ecol. Indic. 2023, 151, 110303. [Google Scholar] [CrossRef]
- Wang, L.; Zheng, H.; Chen, Y.; Ouyang, Z.; Hu, X. Systematic Review of Ecosystem Services Flow Measurement: Main Concepts, Methods, Applications and Future Directions. Ecosyst. Serv. 2022, 58, 101479. [Google Scholar] [CrossRef]
- Bagstad, K.J.; Johnson, G.W.; Voigt, B.; Villa, F. Spatial Dynamics of Ecosystem Service Flows: A Comprehensive Approach to Quantifying Actual Services. Ecosyst. Serv. 2013, 4, 117–125. [Google Scholar] [CrossRef]
- Syrbe, R.-U.; Walz, U. Spatial Indicators for the Assessment of Ecosystem Services: Providing, Benefiting and Connecting Areas and Landscape Metrics. Ecol. Indic. 2012, 21, 80–88. [Google Scholar] [CrossRef]
- Martin-Ortega, J.; Ferrier, R.C.; Gordon, I.J.; Khan, S. Water Ecosystem Services: A Global Perspective; International Hydrology Series; Cambridge University Press UNESCO: Cambridge, UK, 2015; ISBN 978-1-107-10037-4. [Google Scholar]
- Chen, X.; Lin, S.; Tian, J.; Wang, Y.; Ye, Y.; Dong, S.; Gong, X.; Lin, Q.; Zhu, L. Simulation Study on Water Yield Service Flow Based on the InVEST-Geoda-Gephi Network: A Case Study on Wuyi Mountains, China. Ecol. Indic. 2024, 159, 111694. [Google Scholar] [CrossRef]
- Serna-Chavez, H.M.; Schulp, C.J.E.; Van Bodegom, P.M.; Bouten, W.; Verburg, P.H.; Davidson, M.D. A Quantitative Framework for Assessing Spatial Flows of Ecosystem Services. Ecol. Indic. 2014, 39, 24–33. [Google Scholar] [CrossRef]
- Datry, T.; Boulton, A.J.; Bonada, N.; Fritz, K.; Leigh, C.; Sauquet, E.; Tockner, K.; Hugueny, B.; Dahm, C.N. Flow Intermittence and Ecosystem Services in Rivers of the Anthropocene. J. Appl. Ecol. 2018, 55, 353–364. [Google Scholar] [CrossRef]
- Qin, K.; Liu, J.; Yan, L.; Huang, H. Integrating Ecosystem Services Flows into Water Security Simulations in Water Scarce Areas: Present and Future. Sci. Total Environ. 2019, 670, 1037–1048. [Google Scholar] [CrossRef]
- Garau, E.; Pueyo-Ros, J.; Palom, A.R.; Vila-Subiros, J. Follow the Flow: Analysis of Relationships between Water Ecosystem Service Supply Units and Beneficiaries. Appl. Geogr. 2021, 133, 102491. [Google Scholar] [CrossRef]
- Wang, Y.; Li, J.; Wang, Y.; Bai, J. Regional Social-Ecological System Coupling Process from a Water Flow Perspective. Sci. Total Environ. 2022, 853, 158646. [Google Scholar] [CrossRef]
- Zou, Y.; Mao, D. Simulation of Freshwater Ecosystem Service Flows under Land-Use Change: A Case Study of Lianshui River Basin, China. Sustainability 2022, 14, 3270. [Google Scholar] [CrossRef]
- Crespo, R.D.J.; Valladares-Castellanos, M.; Mihunov, V.V.; Douthat, T.H. Going with the Flow: The Supply and Demand of Sediment Retention Ecosystem Services for the Reservoirs in Puerto Rico. Front. Environ. Sci. 2023, 11, 1214037. [Google Scholar] [CrossRef]
- Su, D.; Cao, Y.; Dong, X.; Wu, Q.; Fang, X.; Cao, Y. Evaluation of Ecosystem Services Budget Based on Ecosystem Services Flow: A Case Study of Hangzhou Bay Area. Appl. Geogr. 2024, 162, 103150. [Google Scholar] [CrossRef]
- Wang, J.; Zhang, D.; Nan, Y.; Liu, Z.; Qi, D. Spatial Patterns of Net Primary Productivity and Its Driving Forces: A Multi-Scale Analysis in the Transnational Area of the Tumen River. Front. Earth Sci. 2020, 14, 124–139. [Google Scholar] [CrossRef]
- Nan, Y.; Wang, B.; Zhang, D.; Liu, Z.; Qi, D.; Zhou, H. Spatial Patterns of LULC and Driving Forces in the Transnational Area of Tumen River: A Comparative Analysis of the Sub-Regions of China, the DPRK, and Russia. Chin. Geogr. Sci. 2020, 30, 588–599. [Google Scholar] [CrossRef]
- Zhang, P.; Wang, J.; Jin, R.; Yan, H.; Li, C.; Zhu, W. Changes of Water Yield in Tumen River Basin, China: Trade-Offs between Precipitation and Actual Evapotranspiration. Arab. J. Geosci. 2022, 15, 1232. [Google Scholar] [CrossRef]
- Jin, M.; Han, X.; Li, M. Trade-Offs of Multiple Urban Ecosystem Services Based on Land-Use Scenarios in the Tumen River Cross-Border Area. Ecol. Model. 2023, 482, 110368. [Google Scholar] [CrossRef]
- Zhang, D.; Nan, Y.; Zhu, W.; He, C.; Liu, Z.; Yang, Y. Indirect Impacts of Future Urban Expansion on Ecosystem Services in the Transnational Area of China, North Korea, and Russia. Land Degrad. Dev. 2023, 34, 2334–2348. [Google Scholar] [CrossRef]
- Qi, W.; Jin, Y.; Yin, Z.; Zhu, W. Analysis of Blue and Green Water Scarcity Based on SWAT Model in the Tumen River Basin. Acta Ecol. Sin. 2023, 43, 3116–3127. [Google Scholar] [CrossRef]
- Li, B.; Liu, Z.; Nan, Y.; Li, S.; Yang, Y. Comparative Analysis of Urban Heat Island Intensities in Chinese, Russian, and DPRK Regions across the Transnational Urban Agglomeration of the Tumen River in Northeast Asia. Sustainability 2018, 10, 2637. [Google Scholar] [CrossRef]
- Yu, H.; Li, L.; Zhu, W.; Piao, D.; Cui, G.; Kim, M.; Jeon, S.W.; Lee, W.-K. Drought Monitoring of the Wetland in the Tumen River Basin between 1991 and 2016 Using Landsat TM/ETM+. Int. J. Remote Sens. 2019, 40, 1445–1459. [Google Scholar] [CrossRef]
- Du, H.; Nan, Y.; Zhu, W. Impact of Land Use Change on Ecosystem Service Value in Tumen River Basin. J. Jilin Univ. 2010, 40, 671–677. [Google Scholar] [CrossRef]
- Lv, J.; Jin, R.; Wang, J.; Zhang, P.; Zhu, W. Analysis of Driving Factors and Predictions of Arable Land Area Based on PLUS Model—A Case Study of Tumen River Basin. Bull. Soil Water Conserv. 2023, 43, 203–212+224. [Google Scholar] [CrossRef]
- Yanbian Korean Autonomous Prefecture Statistics Bureau Yanbian Statistical Yearbook 2022; China Statistics Press: Beijing, China, 2022; ISBN 978-7-5230-0062-5.
- Zhang, S.; Liu, J.; Li, C.; Yu, F.; Jing, L.; Sun, J. Analyzing the Impact of Climate Change and Human Activities on Surface Runoff in the Changbai Mountain Area, Northeast China. Water 2021, 13, 3473. [Google Scholar] [CrossRef]
- Stanford University; University of Minnesota; Chinese Academy of Sciences; The Nature Conservancy; World Wildlife Fund; Stockholm Resilience Centre and the Royal Swedish Academy of Sciences InVEST. Available online: https://naturalcapitalproject.stanford.edu/software/invest (accessed on 30 October 2024).
- Donohue, R.J.; Roderick, M.L.; McVicar, T.R. Roots, Storms and Soil Pores: Incorporating Key Ecohydrological Processes into Budyko’s Hydrological Model. J. Hydrol. 2012, 436–437, 35–50. [Google Scholar] [CrossRef]
- Xiang, H.; Wang, Z.; Mao, D.; Zhang, J.; Xi, Y.; Du, B.; Zhang, B. What Did China’s National Wetland Conservation Program Achieve? observations of Changes in Land Cover and Ecosystem Services in the Sanjiang Plain. J. Environ. Manag. 2020, 267, 110623. [Google Scholar] [CrossRef]
- Zhang, X.; Zhang, G.; Long, X.; Zhang, Q.; Liu, D.; Wu, H.; Li, S. Identifying the Drivers of Water Yield Ecosystem Service: A Case Study in the Yangtze River Basin, China. Ecol. Indic. 2021, 132, 108304. [Google Scholar] [CrossRef]
- Huang, W.; Wang, P.; He, L.; Liu, B. Improvement of Water Yield and Net Primary Productivity Ecosystem Services in the Loess Plateau of China since the “Grain for Green” Project. Ecol. Indic. 2023, 154, 110707. [Google Scholar] [CrossRef]
- Wang, C.; Li, K.; Yuan, C. Study of the Effects of Land Use Change on Water Yield in the Qilian Mountains in Western China. Ecol. Indic. 2024, 158, 111464. [Google Scholar] [CrossRef]
- An, Z.; Sun, C.; Hao, S. Exploration of Ecological Compensation Standard: Based on Ecosystem Service Flow Path. Appl. Geogr. 2025, 178, 103588. [Google Scholar] [CrossRef]
- Zhang, X.; Wang, Y.; Yuan, X.; Shao, Y.; Bai, Y. Identifying Ecosystem Service Supply-Demand Imbalance for Sustainable Land Management in China’s Loess Plateau. Land Use Policy 2022, 123, 106423. [Google Scholar] [CrossRef]
- Gong, J.; Shi, J.; Zhu, C.; Li, X.; Zhang, Z.; Zhang, W.; Li, Y.; Hu, Y. Accounting for Land Use in an Analysis of the Spatial and Temporal Characteristics of Ecosystem Services Supply and Demand in a Desert Steppe of Inner Mongolia, China. Ecol. Indic. 2022, 144, 109567. [Google Scholar] [CrossRef]
- Yin, D.; Yu, H.; Shi, Y.; Zhao, M.; Zhang, J.; Li, X. Matching Supply and Demand for Ecosystem Services in the Yellow River Basin, China: A Perspective of the Water-Energy-Food Nexus. J. Clean. Prod. 2023, 384, 135469. [Google Scholar] [CrossRef]
- Xiang, H.; Zhang, J.; Mao, D.; Wang, Z.; Qiu, Z.; Yan, H. Identifying Spatial Similarities and Mismatches between Supply and Demand of Ecosystem Services for Sustainable Northeast China. Ecol. Indic. 2022, 134, 108501. [Google Scholar] [CrossRef]
- Wu, J.; Fan, X.; Li, K.; Wu, Y. Assessment of Ecosystem Service Flow and Optimization of Spatial Pattern of Supply and Demand Matching in Pearl River Delta, China. Ecol. Indic. 2023, 153, 110452. [Google Scholar] [CrossRef]
- Aneseyee, A.B.; Soromessa, T.; Elias, E.; Noszczyk, T.; Feyisa, G.L. Evaluation of Water Provision Ecosystem Services Associated with Land Use/Cover and Climate Variability in the Winike Watershed, Omo Gibe Basin of Ethiopia. Environ. Manag. 2022, 69, 367–383. [Google Scholar] [CrossRef] [PubMed]
- Shi, X.; Matsui, T.; Machimura, T.; Haga, C.; Hu, A.; Gan, X. Impact of Urbanization on the Food–Water–Land–Ecosystem Nexus: A Study of Shenzhen, China. Sci. Total Environ. 2022, 808, 152138. [Google Scholar] [CrossRef]
- Cui, F.; Wang, B.; Zhang, Q.; Tang, H.; De Maeyer, P.; Hamdi, R.; Dai, L. Climate Change versus Land-Use Change—What Affects the Ecosystem Services More in the Forest-Steppe Ecotone? Sci. Total Environ. 2021, 759, 143525. [Google Scholar] [CrossRef]
- Wang, X.; Rao, W.; Feng, X.; Jia, Z.; Zhang, X.; Ma, J.; Zhou, J.; Tu, Y.; Sun, Z. Changes and Driving Factors of Ecosystem Services Supply and Demand on the Tibetan Plateau. Acta Ecol. Sin. 2023, 43, 6968–6982. [Google Scholar] [CrossRef]
- Vallecillo, S.; La Notte, A.; Zulian, G.; Ferrini, S.; Maes, J. Ecosystem Services Accounts: Valuing the Actual Flow of Nature-Based Recreation from Ecosystems to People. Ecol. Model. 2019, 392, 196–211. [Google Scholar] [CrossRef]
Disclaimer/Publisher’s Note: The statements, opinions and data contained in all publications are solely those of the individual author(s) and contributor(s) and not of MDPI and/or the editor(s). MDPI and/or the editor(s) disclaim responsibility for any injury to people or property resulting from any ideas, methods, instructions or products referred to in the content. |
© 2025 by the authors. Licensee MDPI, Basel, Switzerland. This article is an open access article distributed under the terms and conditions of the Creative Commons Attribution (CC BY) license (https://creativecommons.org/licenses/by/4.0/).