Abstract
Extreme precipitation events are one of the common hazards in eastern Texas, generating a large amount of storm water. Water running off urban areas may carry non-point source (NPS) pollution to natural resources such as rivers and lakes. Urbanization exacerbates this issue by increasing impervious surfaces that prevent natural infiltration. This study evaluated the efficacy of rain gardens, a nature-based best management practice (BMP), in mitigating NPS pollution from urban stormwater runoff. Stormwater samples were collected at inflow and outflow points of three rain gardens and analyzed for various water quality parameters, including pH, electrical conductivity, fluoride, chloride, nitrate, nitrite, phosphate, sulfate, salts, carbonates, bicarbonates, sodium, potassium, aluminum, boron, calcium, mercury, arsenic, copper iron lead magnesium, manganese and zinc. Removal efficiencies for nitrate, phosphate, and zinc exceeded 70%, while heavy metals such as lead achieved reductions up to 80%. However, certain parameters, such as calcium, magnesium and conductivity, showed increased outflow concentrations, attributed to substrate leaching. These increases resulted in a higher outflow pH. Overall, the pollutants were removed with an efficiency exceeding 50%. These findings demonstrate that rain gardens are an effective and sustainable solution for managing urban stormwater runoff and mitigating NPS pollution in eastern Texas, particularly in regions vulnerable to extreme precipitation events.
1. Introduction
In settlement areas, urbanization has converted natural permeable land into impervious cover. The amount of impervious land in urban areas ranges from 20% in residential areas to as much as 85% in commercial areas [1]. These areas, such as parking lots, concrete roads, and cemented surfaces, prevent infiltration of water through the soil. This has a significant impact on numerous biotic and abiotic components in the environment, including watershed hydrology and the quality of water resources [2]. In streams, these impacts include higher peak stream flows, which increases channel incision, bank erosion, and increased transport of sediment and other nonpoint pollutants [3]. Urban stormwater runoff in the United States of America is the leading concern in terms of water quality impairment and it is also the third largest source of water impairment overall [4]. Urbanization’s extensive transformation of natural landscapes into impervious surfaces underscores the urgent need to address the environmental challenges associated with urban stormwater runoff, particularly its profound effects on hydrology and water quality.
Eastern Texas’s unique geographic location, influenced by movements of seasonal air masses, including subtropical west winds, tropical storms, and a subtropical high-pressure system, makes it prone to hurricanes [5]. It has a humid subtropical climate with an average annual precipitation of approximately 1100 to 1300 mm, but is frequently impacted by short-duration, high-intensity storm events, particularly in the late spring and summer months. Storms associated with tropical cyclones, mesoscale convective systems, and frontal activity can produce over 50 mm of rainfall in less than an hour, with 2- to 10-year recurrence intervals for 1-hour rainfall intensities exceeding 65 mm [6]. During recent decades, such extreme precipitation events have increased in frequency and intensity in eastern Texas [7], leading to heavy storms and dramatically increased flooding risks [8]. These climatic trends exacerbate the impacts of urbanization on watershed hydrology and water resources, as increased impervious cover amplifies stormwater runoff and diminishes natural infiltration processes [9]. Elevated runoff volumes overwhelm the stormwater infrastructure, increasing the risk of flash flooding and pollutant transport into receiving water bodies. This has profound implications for water quality, including the introduction of heavy metals, nutrients, and sediments, which degrade aquatic habitats and threaten biodiversity. Furthermore, the altered hydrologic regime contributes to stream channel instability, erosion, and sedimentation, further impacting watershed health.
Thus, the main purpose of the study was to evaluate the efficacy of raingardens as structural BMPs by measuring the surface runoff water quality in eastern Texas, USA. We hypothesized that (1) Rain gardens effectively reduce pollutant concentrations in urban stormwater runoff; and (2) Pollutant removal efficiency varies across sites due to local factors such as soil composition and subsurface geology. To test these hypotheses, we conducted a field study monitoring stormwater runoff from impervious surfaces (parking lots and rooftops) entering and exiting three rain gardens in a subtropical urban setting. We evaluated the concentrations of multiple water quality parameters, including nutrients, trace metals, salts, and major ions, across inflow and outflow locations to assess pollutant removal efficiency.
2. Literature Review
Stormwater runoff mainly consists of suspended solids, heavy metals and chlorides, while it may also contain oil, grease and other related hydrocarbons [10]. Heavy metals in stormwater are products of vehicular emission and industrial activities. They can be found in one to two order magnitudes greater than sewage effluent [11]. The sources of heavy metals in vehicular emissions include lead deposits from lead oxides, zinc from tire wear; copper, chromium and nickel from the wear of the plating, bearings, brake linings and other moving parts of the vehicle [12]. Runoff from non-point sources is known to carry a substantial pollutant load. Parking lots and rooftops in particular are associated with elevated concentrations of nutrients and trace metals [13,14]. The impacts of urban storm runoff on the receiving water bodies depend on the ambient quality of the receiving water and the quantity of the water pollutants entering that water body [15]. Lead typically accumulates in stream sediments and can affect fish survival, growth, and reproduction [16]. Zinc and copper at certain concentrations are toxic to fish and macroinvertebrates as well [17]. Cadmium and chromium are mutagenic and carcinogenic to aquatic life [18]. Excess nutrients like nitrogen and phosphorus causes algal blooms, which can increase algal turbidity thus blocking sunlight and decay of excess biomass can consume stream dissolved oxygen [19]. Oil and grease can affect fish reproduction. Sediment particles deposited by storm runoff or resulting from channel erosion can endanger fish survival and reproduction [20], it can cover the stream bottom reducing available spawning habitat [21]. Therefore, the diverse pollutants in stormwater runoff, including heavy metals, hydrocarbons, nutrients, and sediments, pose significant ecological threats to aquatic ecosystems, underscoring the critical need for effective mitigation strategies to protect water quality and aquatic life.
Rain gardens, a best management practice (BMP), mitigate urban stormwater impacts by enhancing infiltration, reducing runoff, and improving water quality [22,23,24]. These shallow, vegetated depressions capture and retain stormwater for infiltration, aquifer recharge, pollutant removal, and peak flow reduction [25]. Their design includes runoff conveyance, pretreatment, treatment, and maintenance [26] while mimicking natural hydrologic processes such as infiltration, filtration, adsorption, and decomposition [22]. Additionally, their vegetation provides both functional hydrological benefits and aesthetic value [25].
Over the past two decades, numerous studies have demonstrated the multifunctional benefits of rain gardens. Comparing the environmental impacts of rain gardens with rainwater harvesting systems, rain gardens offered more substantial benefits in water quality improvement and carbon footprint reduction under certain urban conditions [27]. Rain garden also improved microclimate, enhanced urban biodiversity by supporting plants and insects, and contributed to air quality improvement [28]. Recent research has focused on optimizing rain garden designs to enhance pollutant removal efficiency, such as implementing two-stage tandem rain gardens for improved retention [29], integrating polyculture plantings to increase pollutant removal rate [30], and modifying soil fauna to enhance microbial activity and pollutant breakdown [31]. Planting mixtures significantly affected removal efficiency of heavy metals and nitrogen compounds. A comprehensive analysis of plant species was used in rain gardens in China and reported that plant configuration significantly affects decontamination efficiency, particularly for nutrients and suspended solids [32]. Another study also showed that native polycultures generally outperform monocultures in terms of pollutant retention and resilience across seasonal variations [33].
Recent reviews have further highlighted their importance in climate adaptation strategies. A review emphasized the benefits and limitations of rain garden applications under climate change scenarios, advocating for integrated planning to maximize ecological and hydrological benefits [34]. The study that assessed rain garden performance in urban Japan, demonstrated their effectiveness in reducing peak runoff and improving infiltration during high-intensity rainfall events [35]. Structural modifications such as permeable pavement layering in rain gardens enhanced their purification capacity, especially for organics and hydrocarbons [36]. These advancements highlight the ongoing efforts to refine rain garden functionality, making them more effective and adaptable for sustainable urban stormwater management. Despite extensive research on BMPs, rain garden studies in recent five years are more focus on temperate regions [37], relatively few have examined their effectiveness under the hydrologically volatile conditions of humid subtropical climates. In regions like eastern Texas, stormwater BMPs must contend with high-intensity rainfall, short antecedent dry periods, and high runoff volumes due to impervious surface cover. These factors can compromise bioretention performance by reducing contact time, overloading infiltration capacity, and triggering bypass or overflow events.
3. Materials and Methods
3.1. Study Area
This study was conducted at the Pineywoods Native Plant Center (PNPC), located on the northern edge of Stephen F. Austin State University (SFASU) in Nacogdoches, Texas, USA (31°36′11″ N; 94°39′19″ W). The PNPC spans 17 hectares and consists of a mix of uplands, mesic mid-slopes, and wet creek bottomlands. The area has a humid subtropical climate, characterized by hot summers and cool winters. Annual rainfall is relatively evenly distributed throughout the year, with April and May receiving the highest precipitation.
The primary contributing areas to the three rain gardens are upgradient parking lots and building rooftops (Figure 1). Each rain garden was designed to accommodate runoffs from different infrastructure types and varied in size. Rain Garden 1 primarily receives runoff from the Raguet Elementary School parking lot, while Rain Garden 2 is supplied with runoff from the main office parking lot of the PNPC. Rain Garden 3 receives runoff from the Music Preparatory building parking lot at SFASU.
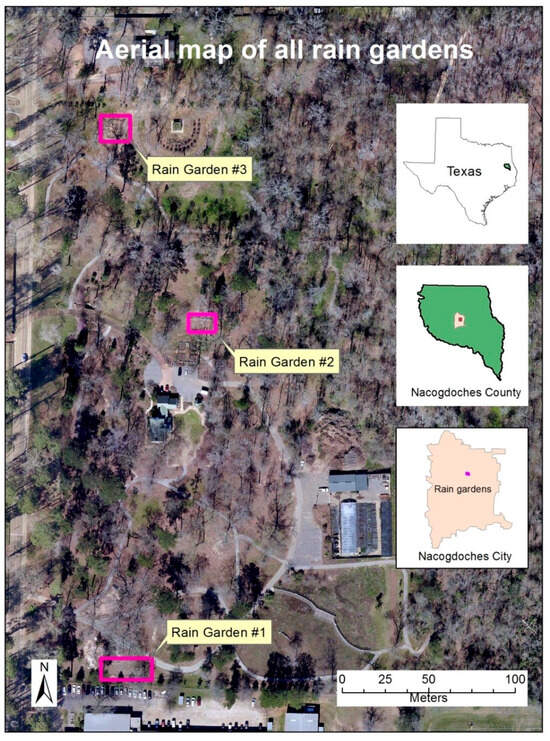
Figure 1.
Aerial map showing the locations of rain gardens 1, 2, and 3 on the Stephen F. Austin State University campus in Nacogdoches, TX, USA. The map indicates the contributing drainage areas for each rain garden, including surrounding impervious surfaces such as parking lots, sidewalks, and buildings. These contributing areas were the primary sources of stormwater runoff sampled during the study.
Rain Garden 1 is located on the soil of the Attoyac-Urban Land Complex (Soil Unit 8) with 0–4% slopes [38]. The major soil components include 40% urban land, 40% Attoyac and similar soils, and 20% minor components. The parent material consists of loamy alluvium with a moderately high to high saturated hydraulic conductivity (Ksat) of 1.45–5.03 cm/h Rain Garden 2 is situated on Trawick-Urban Land Complex soils (Soil Unit 65) with 8–20% slopes. The major soil components include 55% Trawick and similar soils, 30% urban land, and 15% minor components. The parent material is clayey residuum weathered from glauconite and sandstone. The Ksat is moderately high (0.51–1.45 cm/h), and the available water capacity is low (14.22 cm). Rain Garden 3 is located on a combination of Nacogdoches-Urban Land Complex soils (Soil Unit 47) and Trawick-Urban Land Complex soils (Soil Unit 65). For Soil Unit 47, the composition consists of 45% Nacogdoches and similar soils, 35% urban land, and 20% minor components. The parent material is clayey residuum weathered from glauconite sandstone. The Ksat is moderately high (0.51–1.45 cm/h), and the available water capacity is 22.61 cm. Rain garden contributing areas had no indications of point sources of water pollution and neither were there any point-source discharge permits issued for these areas by the state environmental agency.
3.2. Rain Garden Design
The contributing area for each rain garden was determined through site evaluation and geospatial hydrological analysis. Rain gardens were constructed in accordance with the Knox County, Tennessee Stormwater Management Manual [23]. Based on the guidelines outlined in this manual, the contributing areas for each rain garden were calculated to ensure optimal stormwater retention and treatment capacity (Table 1).

Table 1.
Contributing area, impervious area, percentage of impervious area, calculated bed area, and constructed bed area (in square meters) for the three rain gardens.
3.3. Structural Design
The flow of stormwater through a rain garden treatment system, beginning at the parking lot, serves as the primary source of runoff. The runoff water passed through multiple structures within the rain gardens before reaching the outflow, where treated water was collected for quality analysis. The first component of the system was an instrument box equipped with a Thermo Scientific® 1000 mL HDPE Nalgene® stormwater sampler (Thermo Scientific, Mansfield, TX, USA) and a Hobo® U24-001 temperature and conductivity data logger (Hobo, Bourne, MA, USA). An untreated runoff from the parking lot was first collected in the water sampler inside the instrument box for analysis before entering the rain garden for treatment.
A 0.15 m drainage pipe transported water from the pre-treatment instrument box into the rain garden, where it flowed onto the surface and temporarily pooled within a designated ponding zone, enclosed by a 0.25 m high berm. This area was planted with native eastern Texas vegetation; however, nitrogen-fixing plants were intentionally excluded from both the rain garden and the surrounding berm. The stormwater then infiltrated through the mulch and sand layers, where natural treatment processes such as sedimentation, adsorption, and microbial activity occurred.
Water percolating through these layers accumulated at the base of the rain garden and was directed through a series of 0.1 m drainage pipes before reaching the outflow instrument box. The outflow structure was equipped with the same sampling and monitoring equipment as the inflow, ensuring consistency in data collection for water quality analysis.
3.4. Cross Sectional Structure
The cross-sectional area of the rain gardens is divided into two major zones: the rooting zone and the drainage zone, comprising five distinct structural elements (Figure 2). The rooting zone consists of a mulch layer and sand layer. The mulch layer, approximately 0.15 m thick, is composed of dry leaves and finely shredded hardwood chips applied uniformly. This layer serves multiple functions, including filtering pollutants, preventing soil erosion, and supporting microbial activity for pollutant degradation. Beneath the mulch layer, the 0.9 m sand layer acts as an infiltration medium, slowing runoff and promoting water percolation.
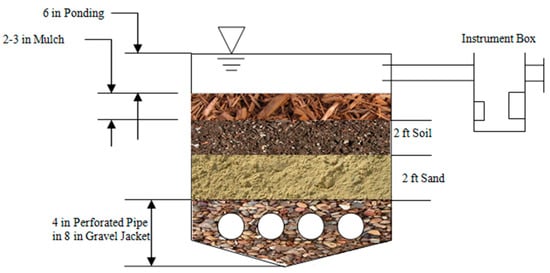
Figure 2.
Cross-sectional view of the rain garden. The 10.16 cm drainage pipes are covered with 12.54–20.32 cm of pea gravel. The rain garden also contains a sand layer, a planting soil layer and a mulch layer.
The drainage zone, located below the rooting zone, consists of three key layers: filter fabric, gravel, and perforated pipes. The filter fabric separates the rooting and drainage zones, providing additional filtration while acting as a root barrier and preventing organic matter from clogging the drainage system. Below this, a 0.2 m pea gravel bed (Figure 3 and Figure 4) enhances stormwater storage capacity and prevents waterlogging in the upper layers. At the bottom, 0.1 m perforated drainage pipes, spaced 0.9 m apart, facilitate passive gravity drainage. These pipes are connected to a main discharge pipe that directs treated stormwater downgradient.
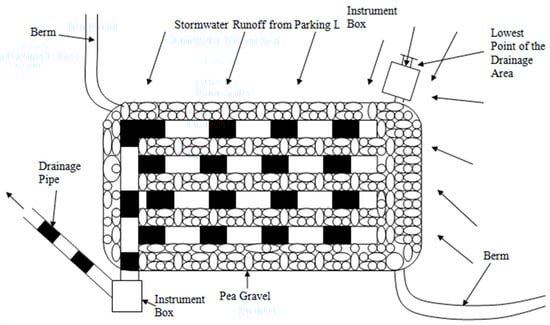
Figure 3.
Top view of rain garden design. The figure illustrates the berm, 10.16 cm drainage pipe, pea gravel and instrumentation boxes.
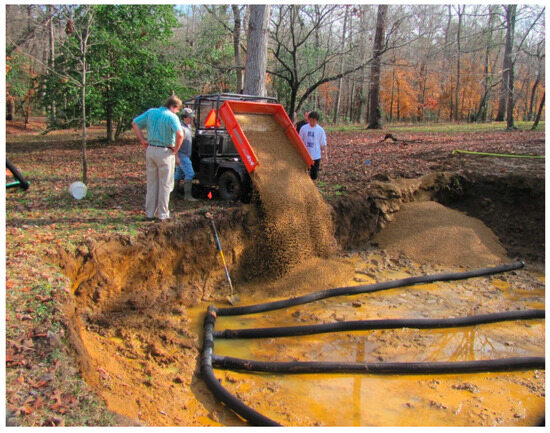
Figure 4.
Installation of drainage pipes and pea gravel layer during the construction phase of Rain Garden 2 in Nacogdoches, TX, USA. After excavation, perforated drainage pipes were placed at the base of the rain garden to facilitate excess water outflow. The pea gravel layer, approximately 0.2 m thick, was then evenly distributed over the pipes to enhance drainage efficiency and prevent clogging. This foundational layer supports proper water infiltration and contributes to the overall functionality of the rain garden system.
A selection of native plants, including Echinacea purpurea, Tradescantia humilis, Scutellaria ovata, Salvia lyrate, Phlox divaricate, and Chasmanthium latifolium, were planted in the rain gardens due to their low maintenance requirements, pollutant uptake capacity, and adaptability to local growing conditions. These species also provide habitat and food sources for native fauna while enhancing the visual appeal of the rain gardens. No nitrogen-fixing plants were included, ensuring that nitrogen levels in the system were influenced solely by the soil and incoming stormwater.
3.5. Water Sample Collection
During the study period (September 2013 to September 2014), a total of 25 storm runoff events were recorded. For each event, two water samples—one from the inflow and one from the outflow—were collected from each of the three rain gardens. However, in some instances, insufficient outflow prevented sample collection, resulting in a total of 135 samples obtained from the 25 storm events.
Water samples were collected using Thermo Scientific® 1000 mL HDPE Nalgene® stormwater samplers (Thermo Scientific, Mansfield, TX, USA) installed in the inflow and outflow collection boxes. The samplers were equipped with a float ball shut-off valve to prevent dilution from late-stage runoff. Water collected in each bottle was transferred into acid-washed 500 mL HDPE sample bottles and transported immediately to the Soil, Plant, and Water Analysis Laboratory at Stephen F. Austin State University (Nacogdoches, TX, USA).
Each sample was split for the separate analysis of total and water-soluble metal concentrations. For water-soluble metals, a subsample was passed through a 0.45 µm cellulose acetate membrane filter (VWR, Radnor, PA, USA) and analyzed without digestion. For total metals, unfiltered subsamples were digested with nitric acid according to U.S. EPA Method 200.7. Both fractions were analyzed using inductively coupled plasma–optical emission spectrometry (ICP-OES; Optima 8000, PerkinElmer Inc., Waltham, MA, USA).
Water quality parameters analyzed in this study included pH, electrical conductivity (EC), temperature (T), fluoride (F−), chloride (Cl−), nitrate (NO3−), nitrite (NO2−), phosphate (PO43−), sulfate (SO42−), salts, carbonates (CO32−), bicarbonates (HCO3−), sodium (Na+), potassium (K+), aluminum (Al), boron (B), calcium (Ca2+), magnesium (Mg2+), iron (Fe), manganese (Mn), copper (Cu), zinc (Zn), arsenic (As), lead (Pb), and mercury (Hg).
Major anions and cations—including F−, Cl−, NO3−, NO2−, PO43−, SO42−, Na+, K+, Ca2+, and Mg2+—were analyzed using ion chromatography (IC) on a Thermo Dionex ICS-2100 system (Thermo Fisher Scientific, Sunnyvale, CA, USA), in accordance with EPA Method 300.0. Carbonates and bicarbonates were assessed via acid titration and interpreted using Standard Method 2320 B, based on pH and total alkalinity.
Trace and heavy metals—including Al, B, Fe, Mn, Cu, Zn, As, Pb, and Hg—were quantified using inductively coupled plasma–optical emission spectrometry (ICP-OES) with an Optima 8000 system (PerkinElmer Inc., Waltham, MA, USA). Total concentrations were determined by digesting unfiltered samples with nitric acid, while water-soluble fractions were obtained from 0.45 µm filtered samples and analyzed without digestion, following EPA Method 200.7. Mercury (Hg) concentrations were determined under specific cold vapor mode settings to enhance detection sensitivity.
All samples were preserved with ultrapure nitric acid (HNO3) to pH < 2 and stored at 4 °C until analysis. Quality assurance measures included the use of blanks, matrix spikes, and certified reference materials.
3.6. Conductivity and Temperature Measurement
In situ electrical conductivity (EC) and temperature (T) were continuously monitored using HOBO® U24-001 conductivity data loggers (Onset Computer Corporation, Bourne, MA, USA). The loggers record EC standardized to 25 °C with an accuracy of ±3% of reading or ±5 µS/cm (whichever is greater), and a temperature accuracy of ±0.1 °C over 0 °C to 50 °C. Devices were installed inside instrument boxes at each sampling location, and data were retrieved using a HOBO® U-DTW-1 waterproof shuttle.
3.7. Rain Garden Soil Sampling
During the construction process, all three rain gardens were filled with material from the same source. However, an evaluation was necessary to ensure that the difference in performance among rain gardens was not attributable to variations in soil materials. Therefore, soil samples were randomly collected from the mulch layer and the top 30 cm of the sand layer. A total tissue digestion method was used to analyze the samples for nutrients and various metals. To analyze the difference in the soil of the rain gardens, an ANOVA test was performed. All normally distributed soil data were analyzed using an F-test (α = 0.05) and non-normally distributed data were analyzed using a Kruskal–Wallis test (α = 0.05).
3.8. Sample Period Analysis
Two distinct sample periods were evaluated. The first period ranged from September 2012 to August 2013. This period signified the time immediately following construction. During this interval, it was anticipated that the performance of the rain garden would be non-representative as the vegetation was not fully established [22]. The second period extended from September 2013 through September 2014. This represented the first year after vegetation establishment. The results presented herein focus on the second period, although comparisons are made with the first period to evaluate the overall performance of the rain gardens [39].
3.9. Statistical Analysis
Descriptive statistics were calculated for water quality parameters by rain garden. The water quality parameters before and after stormwater enters the rain garden were compared. Parameter concentrations were compared with the water quality standards established by the World Health Organization (WHO), the Texas Commission on Environmental Quality (TCEQ) and USEPA (Table 2). The Shapiro–Wilks test for normality was conducted prior to performing any other statistical test. If the water sample data were normally distributed, then a parametric test (paired t-test) was conducted between contrasting rain gardens. For all non-normally distributed water sample data, the non-parametric Kruskal–Wallis test was performed (α = 0.05). For concentrations below the method detection limit for a given chemical analysis, one-half of the method detection limit was utilized for calculation and statistical analysis. Pollutant removal efficiency was also evaluated and calculated for the rain gardens using the Formula (1):
Table 2.
Water quality criteria for surface water to protect human and aquatic health, as established by the United States Environmental Protection Agency and the Texas Commission on Environmental Quality, used in this study for evaluation.
4. Results
4.1. Precipitation and Environmental Conditions
Precipitation and weather monitoring were carried out at the weather station maintained by SFASU/United States National Weather Service (NWS). The weather station is located at Pecan Park, which is 2.5 km south of the rain gardens. Table 3 presents the total precipitation during the study period and long-term average precipitation (1901–2009). Nacogdoches received a total of 1168.7 mm precipitation during the study period, which is slightly greater than the long-term average precipitation of 1125.1 mm. The highest amount of precipitation was recorded in October 2013. However, no significant differences were observed in monthly precipitation between the study and historical periods (p = 0.192, α = 0.05).
Table 3.
Monthly precipitation (mm) during the study period and long-term average precipitation (1901–2009; 2015–2024) from the Stephen F. Austin State University/National Weather Service weather station.
4.2. Comparison with Water Quality Standards
The concentrations of water quality parameters were compared against the most relevant regulatory standards. For ecological protection, we used the TCEQ freshwater aquatic life criteria, including hardness-adjusted thresholds where applicable. For human health comparisons, we applied the USEPA Maximum Contaminant Levels (MCLs) or Secondary MCLs (SMCLs) for public drinking water systems. Nutrients (nitrate, nitrite, and phosphate) were compared with both the USEPA and TCEQ guidelines where available.
Across the recorded storm events, the concentrations of most parameters were within regulatory thresholds following treatment by the rain gardens. However, some exceedances were observed at the inflow and, in limited cases, also at the outflow: Aluminum: Exceeded TCEQ aquatic life criteria at both inflow and outflow, likely due to naturally high background levels in the local soils. Copper: Exceeded the hardness-adjusted TCEQ criterion at the inflow in several events but was reduced below the standard after rain garden treatment. All values remained well below the USEPA drinking water action level of 1.3 mg/L. Iron: No TCEQ aquatic life criterion is available; however, iron exceeded the USEPA Secondary MCL of 0.3 mg/L at both the inflow and outflow. This is attributed to naturally high iron oxide content in the rain garden media. Manganese: Occasionally exceeded the USEPA SMCL of 0.05 mg/L at the inflow but was reduced in outflow samples. Nitrite: Generally remained below the USEPA MCL of 1.0 mg/L, with only isolated inflow events slightly exceeding this threshold. All outflow samples were compliant. Nitrate: Remained consistently below the USEPA MCL of 10 mg/L. Arsenic, Mercury, Lead: Concentrations were well below their respective USEPA MCLs (0.01 mg/L for Arsenic, 0.002 mg/L for Mercury, 0.015 mg/L for Lead). Chloride, Sulfate, Fluoride, and Zinc: All values were well within their respective SMCLs.
4.3. Concentrations of Metals
4.3.1. Copper
For water-soluble copper concentrations, the highest observed average concentration was 0.05 mg/L, which exceeds the water quality standard. The mean water-soluble copper concentration was significantly lower in the outflow waters for all three rain gardens (Table 4). For total copper concentrations, the highest average concentration was 0.09 mg/L, observed at the inflow of Rain Garden 1. These results indicate that rain gardens are an effective BMP for removing copper (Table 4).
Table 4.
Mean water-soluble concentrations (mg/L) for metals in samples collected from September 2013 through September 2014 for three rain gardens at the Piney Woods Native Plant Center in Nacogdoches, TX, USA. Bold underlined values are significantly greater within each rain garden pair (inflow vs. outflow) at α = 0.05.
4.3.2. Zinc
The highest water-soluble zinc concentration, 0.28 mg/L, was observed in the outflow of Rain Garden 1. None of the observed concentrations exceeded the water quality standard of 0.215 mg/L. The TCEQ standard for zinc is determined based on water hardness. During the study period, total hardness was 205 mg/L, corresponding to a water quality standard of 0.215 mg/L. Similar to copper, outflow concentrations of both total and water-soluble zinc were significantly lower across all three rain gardens (Table 3 and Table 4).
4.3.3. Arsenic
The highest total arsenic concentration observed was 0.05 mg/L, while the highest water-soluble arsenic concentration was 0.01 mg/L. The total concentration exceeded the USEPA drinking water MCL for arsenic (0.01 mg/L), whereas the water-soluble fraction was at the threshold. No significant differences in average concentrations were observed between inflow and outflow for any of the rain gardens.
4.3.4. Lead
The highest total lead concentration observed was 0.08 mg/L in the inflow of Rain Garden 1. This was a one-time occurrence during the experiment, while all other observations were below 0.02 mg/L. These concentrations remained below the water quality standard. Similar to arsenic, water-soluble Pb concentrations did not differ significantly between inflow and outflow across the three rain gardens.
4.3.5. Iron
The highest water-soluble iron concentration was observed in the outflow of Rain Garden 2 (2.04 mg/L), while the lowest recorded concentration was below the detection limit of 0.003 mg/L. The highest total iron concentration observed during the study period was 13.197 mg/L in the outflow of Rain Garden 1. For both water-soluble and total iron concentrations, outflow concentrations were significantly lower than inflow in Rain Garden 2, whereas outflow concentrations were significantly higher than inflow in Rain Garden 1 (Table 4 and Table 5). No significant differences were observed between the inflow and outflow concentration in Rain Garden 3 for either form of iron.
Table 5.
Total concentrations (mg/L) of metals in samples collected from September 2013 through September 2014 for three rain gardens at the Piney Woods Native Plant Center in Nacogdoches, TX, USA. Bold underlined values indicate concentrations that are significantly greater within each rain garden pair (inflow vs. outflow) at α = 0.05.
4.3.6. Aluminum
For water soluble aluminum concentrations, average inflow concentrations were significantly lower than outflow concentrations in Rain Gardens 1 and 3 (Table 4 and Table 5). However, in Rain Garden 2, water-soluble aluminum concentrations were significantly lower in the outflow than in the inflow. Similar patterns were observed for total aluminum, with inflow concentrations significantly lower than outflow in Rain Garden 1, while inflow concentrations were significantly greater in Rain Garden 2. However, for total aluminum, no significant differences were observed between inflow and outflow in Rain Garden 3.
4.3.7. Magnesium
For water-soluble magnesium, the highest observed concentration was 54.220 mg/L in the outflow of Rain Garden 2, while the highest total magnesium concentration was 50.335 mg/L. In all three rain gardens, outflow concentrations of both water-soluble and total Mg were significantly higher than inflow concentrations (Table 4 and Table 5). This suggests that, rather than acting as a sink for Mg, the rain gardens function as a source, likely due to contributions from the soil fill materials and/or surrounding geology. This phenomenon will be further explored in Section 5. However, as noted earlier, these concentrations remained below established water quality standards.
4.3.8. Manganese
For water soluble manganese, inflow concentrations were significantly higher than outflow concentrations in Rain Garden 2, while no differences were observed between inflow and outflow in the other two rain gardens. Similarly, for total Mn, inflow concentrations were significantly lower than outflow concentrations in Rain Garden 2, but no differences were observed between inflow and outflow in Rain Gardens 1 and 3 (Table 4 and Table 5).
4.3.9. Boron
For water soluble boron, the highest average concentration observed was 0.062 mg/L in the outflow of Rain Garden 2 (Table 4). This concentration is below the provisional guideline value of 0.5 mg/L set by the WHO for drinking water. A significant difference was observed only in Rain Garden 2, where outflow concentrations were significantly higher than inflow concentrations. For total boron concentration, the highest average concentration observed was 2.452 mg/L in the inflow of Rain Garden 2 (Table 5), while the lowest recorded value was below the detection limit of 0.002 mg/L. No significant differences were observed between inflow and outflow concentrations for any of the rain gardens.
4.3.10. Sodium
For water soluble sodium, the highest concentration was 48.020 mg/L in the outflow of Rain Garden 2, while the lowest concentration was below the detection limit of 0.02 mg/L. Significant differences were observed in Rain Gardens 2 and 3, where mean outflow concentrations were higher than mean inflow concentrations (Table 4). However, no significant differences were found between the inflow and outflow concentrations in Rain Garden 1. For total sodium, the highest concentration observed was 34.806 mg/L in the outflow of Rain Garden 3. A significant difference was observed only in Rain Garden 1, where outflow concentrations were higher than inflow concentrations (Table 5). However, no significant differences in total Na concentrations were found for Rain Gardens 2 and 3.
4.4. Concentrations of Plant Nutrients and Other Water Quality Parameters
4.4.1. Phosphorus
For water-soluble phosphorus, significant differences were observed in all three rain gardens (Table 6), with outflow concentrations significantly lower than inflow concentrations. Similarly, for total phosphorus, significant differences were found in all three rain gardens; however, outflow concentrations were significantly higher than inflow concentrations.
Table 6.
Mean concentrations (mg/L) of nutrients and other parameters in samples collected from September 2013 through September 2014 for three rain gardens at the Piney Woods Native Plant Center in Nacogdoches, TX, USA. Bold underlined values indicate concentrations that are significantly greater within each rain garden pair (inflow vs. outflow) at α = 0.05.
4.4.2. Nitrate
For nitrate concentrations, the highest observed value was 60.377 mg/L in the outflow of Rain Garden 3, exceeding the methemoglobinemia standard of 10 mg/L set by the EPA and TCEQ. However, this was a single occurrence during the entire observation period. In the outflow of Rain Garden 2, nitrate concentrations were below the detection limit for 21 out of 25 events. A significant difference was observed only in Rain Garden 3, where outflow concentrations were higher than inflow concentrations (Table 6).
4.4.3. Nitrite
For nitrite concentrations, the highest recorded value was 54.98 mg/L in the outflow of Rain Garden 3. This was a single occurrence, while all other readings in the same rain garden were below 12.5 mg/L. Most measurements exceeded the methemoglobinemia drinking water standard of 1 mg/L set by the EPA and TCEQ. A significant difference was observed only in Rain Garden 2, where outflow concentrations were lower than inflow concentrations (Table 6). No significant differences were observed in Rain Garden 1.
4.4.4. Potassium
For water soluble potassium, the highest concentration observed was 29.83 mg/L in the inflow of Rain Garden 3. No significant differences were found between inflow and outflow concentrations in Rain Gardens 1 and 2. However, in Rain Garden 3, a significant difference was observed, with an average inflow concentration of 6.735 mg/L and an average outflow concentration of 3.114 mg/L. For total potassium, the highest observed concentration was 38.093 mg/L. In Rain Garden 3, significantly lower concentrations were recorded in the outflow (Table 6). No significant differences were observed between inflow and outflow concentrations in Rain Gardens 1 or 2.
4.4.5. Calcium
The maximum water-soluble calcium concentration observed was 143.810 mg/L in the outflow of Rain Garden 1, while the minimum was 2.190 mg/L in the inflow of Rain Garden 3. In Rain Gardens 1 and 2, the average Ca inflow concentration was significantly lower than the outflow average concentration (Table 6). For total calcium, the highest recorded concentration was 156.680 mg/L, while the lowest was below the detection limit of 0.01 mg/L. The highest average concentration was 76.572 mg/L in the outflow of Rain Garden 2, whereas the lowest average concentration was 8.961 mg/L in the inflow of Rain Garden 3. In all three rain gardens, outflow Ca concentrations were significantly higher than inflow concentrations.
4.4.6. Sulfur
For water soluble sulfur, significantly different results were seen for all the rain gardens. The outflow concentrations were significantly higher than the inflow concentrations (Table 6). For total sulfur, concentrations were significantly different only in Rain Gardens 2 and 3 where the rain gardens had significantly higher concentrations in the outflow than in the inflow (Table 6).
4.4.7. pH
All pH observations in the rain gardens were below the TCEQ maximum water quality standard of 8.5. The highest recorded pH was 8.41 in the outflow of Rain Garden 3, while the lowest was 6.24 in the inflow of the same rain garden. A significant difference was observed in all three rain gardens, with outflow waters being more alkaline than inflow waters. This trend is expected due to the higher concentrations of base cations, such as calcium, magnesium, and sodium, in the outflow waters.
4.4.8. Electrical Conductivity
A significant difference in electrical conductivity was observed in all three rain gardens, with outflow values significantly higher than inflow values. Electrical conductivity remained within the TCEQ standard, except for Rain Garden 2. Similar to pH, the higher conductivity values in the outflow waters may be attributed to increased concentrations of sodium and other ionizing compounds.
4.4.9. Bicarbonate
For bicarbonate concentrations, significantly greater outflow concentrations were observed in Rain Gardens 2 and 3. In Rain Garden 1, inflow and outflow concentrations were similar.
4.4.10. Fluoride
No significant differences were observed between inflow and outflow fluoride concentrations in any of the rain gardens. Overall, fluoride concentrations were relatively low compared to established water quality standards.
4.4.11. Chloride
Chloride concentrations were significantly higher in the outflow waters than in the inflow waters for all three rain gardens. This suggests that, along with Ca, Mg, and Na, these rain gardens act as net sources of these elements. However, overall chloride concentrations remained low compared to established water quality standards, indicating no major concern regarding chloride levels.
4.5. Water Quality Treatment Performance over Time for the Rain Gardens
4.5.1. Changes in Metal Uptake over Time—Total Concentrations
During the first year of the study in Rain Garden 1, total concentrations of aluminum, iron, magnesium, and sodium were significantly higher in the outflow (Table 7). In the second year, significant differences were also observed for calcium and phosphorus in addition to aluminum, iron, magnesium, and sodium. Total metals such as copper and zinc were effectively removed during the second year. Pollutant removal efficiency was highest for copper (91%), followed by zinc (68%), in the second year.
Table 7.
Comparative study of significantly different total concentrations of water quality parameters in rain gardens during the first and second year of construction, based on outflow mean concentrations. Mean values highlighted in red represent p-values where the outflow concentration was higher than the inflow concentration. Mean values highlighted in yellow represent p-values where the inflow concentration was higher than the outflow concentration. Fields without values indicate no significant difference.
In Rain Garden 2, significantly higher outflow concentrations were observed for calcium, magnesium, sodium, and sulfur during the first year, while in the second year, calcium, magnesium, sulfur, manganese, and phosphorus also showed elevated outflow concentrations. However, many water quality parameters were significantly lower in the outflow during both years. In the first year, manganese, phosphorus, aluminum, copper, iron, potassium, and zinc had significantly lower concentrations in the outflow. In the second year, aluminum, copper, iron, potassium, and zinc remained significantly lower in the outflow.
In Rain Garden 3, calcium, magnesium, and sulfur had significantly higher outflow concentrations in both study years. Additionally, sodium showed higher outflow concentrations in the first year, while phosphorus exhibited higher outflow concentrations in the second year. Copper, potassium, and zinc had significantly lower outflow concentrations in both years, whereas potassium and manganese were removed only in the first year.
4.5.2. Changes in Metal Uptake over Time—Water-Soluble Concentrations
In Rain Garden 1, during the first year of the study, significantly higher concentrations in the outflow were observed for aluminum, iron, magnesium, sodium, and calcium (Table 8). In the second year, significantly higher outflow concentrations were observed for aluminum, iron, magnesium, calcium, and sulfur. During the first year, water-soluble phosphorus was removed with an efficiency of 66.7%, while in the second year, it was removed with an efficiency of 69%. Additionally, copper and zinc were removed from the rain garden in the second year with efficiencies of 77.6% and 46.9%, respectively.
Table 8.
Comparative study of significantly different water-soluble concentrations of water quality parameters in the rain gardens during the first and second year of construction, based on mean concentrations. Mean values highlighted in red represent p-values where the outflow concentration was higher than the inflow concentration. Mean values highlighted in yellow represent p-values where the inflow concentration was higher than the outflow concentration. Fields without values indicate no significant difference.
In Rain Garden 2, significantly higher outflow concentrations were observed for calcium, magnesium, sodium, and sulfur during both years. Significantly lower concentrations at the outflow were observed for aluminum, copper, iron, manganese, phosphorus, and zinc in both years. The only parameter removed in the first year was potassium, while boron was removed only in the second year.
In Rain Garden 3, during the first year, aluminum, copper, iron, potassium, zinc, and phosphorus had significantly lower concentrations at the outflow. In the second year, copper, potassium, zinc, and phosphorus were removed by this rain garden. Parameters with higher outflow concentrations in the first year included calcium, magnesium, sodium, and sulfur. In the second year, calcium, magnesium, sodium, sulfur, aluminum, and manganese had higher outflow concentrations.
4.5.3. Changes over Time—Total Concentrations
In Rain Garden 1, during the first year of the study, significant differences in the outflow were observed for electrical conductivity and sodium (Table 9). In the second year, significantly higher outflow concentrations were also observed for pH, phosphate, and bicarbonate, in addition to electrical conductivity and salt.
Table 9.
Comparative study of significantly different water-soluble concentrations of plant nutrients in rain gardens during the first and second year of construction based on the p-value. Mean values highlighted in red represent p-values for parameters with an outflow concentration higher than the inflow concentration.
In Rain Garden 2, significantly higher outflow concentrations were observed for pH, electrical conductivity, chloride, and nitrate-nitrite during the first year of the study. In the second year, higher outflow concentrations were observed for pH, electrical conductivity, chloride, nitrate-nitrite, phosphate, sulfate, salt, and bicarbonate.
In Rain Garden 3, higher outflow concentrations were observed for pH, electrical conductivity, chloride, sulfate, and salt throughout the two-year study period. During both years, phosphates had significantly lower concentrations in the outflow. In the second year, bicarbonate also had significantly higher outflow concentrations in addition to the other parameters.
4.6. Pollutant Removal Efficiency
Percentage efficiency calculations for the rain gardens indicated a total copper removal of nearly 90% (Figure 5). Water-soluble copper removal efficiency ranged from 77% to 83% across the three rain gardens. For parameters where outflow concentrations were lower than inflow concentrations, pollutants were generally removed with an efficiency of 50% or higher. The exceptions were water-soluble zinc and potassium, which exhibited lower removal efficiencies. When comparing efficiency percentages from different studies in the literature, copper removal was found to range from 36% to 93% [40]. Phosphorus was removed with an efficiency ranging from 40% to 80%, while zinc was removed with an efficiency ranging from 31% to 99% [41]. Comparing the results from the previous year’s study, boron and fluoride were the only two parameters that were not removed in any rain garden during the first year but were removed in the second year. Copper, which was removed with higher efficiency in all three rain gardens during the second year, was not removed from all rain gardens in the first year.
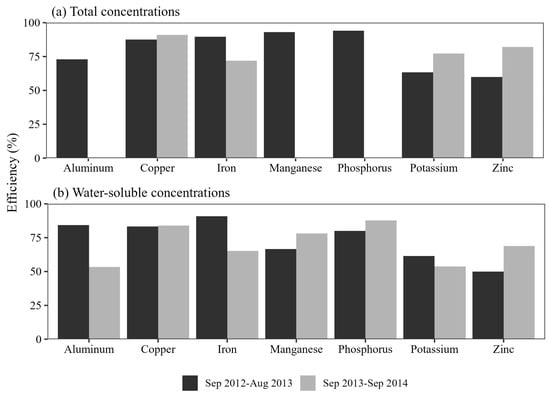
Figure 5.
Comparison of the efficiency (%) of pollutant removals for water soluble (WS) and total concentrations (TC) for rain gardens during the first (plant establishment, September 2012–August 2013) and second (September 2013–September 2014) years of study at three rain gardens in Nacogdoches, Texas, USA. Blank bars indicate parameters that were not measured in specific rain gardens.
4.7. Rain Garden Fill Materials
The fill materials for the rain gardens were sourced from the same location, so similar physicochemical properties were expected. However, soil analysis of the sand layer in the three rain gardens revealed significant differences for most of the variables (Table 10). The only parameters showing no significant difference were silver, cadmium, mercury, molybdenum, and selenium. In the mulch layer, half of the parameters exhibited significant differences. Nutrients such as sodium, calcium, magnesium, potassium, and phosphorus were significantly different, as were manganese, boron, copper, and sulfur. These significant differences may be one of the factors contributing to the increased concentration observed in the rain garden outflow for these parameters.
Table 10.
Mean concentrations (ppm) from rain garden fill materials by layer. Means preceded by different letters are significantly different at α = 0.05.
5. Discussion
This study evaluated the effectiveness of rain gardens in managing non-point source pollution in eastern Texas by analyzing water quality parameters at inflow and outflow points. The inflow stormwater samples revealed pollutant concentrations that, in several cases, exceeded regulatory thresholds, indicating moderate to high pollution risk. For instance, arsenic concentrations in unfiltered inflow samples reached 0.05 mg/L, which is five times higher than the USEPA MCL of 0.01 mg/L for drinking water. Aluminum levels routinely exceeded the TCEQ aquatic life protection criterion (0.087 mg/L), with inflow concentrations as high as 0.28 mg/L. Copper also exceeded site-specific TCEQ hardness-adjusted standards during multiple events. While nitrate levels (maximum 2.7 mg/L) remained below the USEPA MCL of 10 mg/L, they reflect significant nutrient loading from impervious surfaces, contributing to eutrophication risk in downstream systems. These findings suggest that untreated stormwater from rooftops and parking lots poses substantial ecological and regulatory concern, particularly with respect to trace metal toxicity.
After treatment through the rain gardens, the concentrations of aluminum, copper, iron, potassium, zinc, boron, manganese, phosphorus, fluoride, and phosphate at the outflow were significantly reduced, achieving a pollutant removal efficiency exceeding 50%. Specifically, median inflow concentrations of nitrate were reduced by 52%, from 2.7 mg/L to 1.3 mg/L at the outflow, with statistically significant reductions (p < 0.05) in over 70% of events. Copper, a key toxicant in urban runoff, showed a 44% average reduction, from 90 µg/L to 50 µg/L, with complete compliance with the USEPA action level after treatment. Phosphate removal was more variable, with reductions ranging from 10–40% depending on site and antecedent conditions. Metals such as lead, zinc, and iron also showed consistent downward trends, with Pb reduced by 38% and Zn by 56%. However, iron concentrations remained above the USEPA Secondary MCL in all cases, suggesting leaching from the rain garden media. Aluminum exceeded TCEQ criteria at both inflow and outflow, indicating potential mobilization or insufficient retention. These findings contrast with those from temperate climates, where rain garden effectiveness may be enhanced by more moderate and predictable rainfall patterns. It also underscores the need for climate-adaptive BMP designs in subtropical and tropical urban watersheds, where storm intensities can exceed conventional design thresholds and performance expectations [37]. Similar removal efficiencies have been reported in rain garden systems, including one in Kurukshetra, India, which incorporated 75% topsoil and 25% compost and achieved a 49% pollutant removal efficiency [33]. A hybrid rain garden system in Korea, tested with synthetic runoff, demonstrated a 56% removal efficiency for heavy metals [42]. The mean concentrations of most water quality parameters were significantly lower in the outflow than in the inflow, confirming the effectiveness of rain gardens in treating urban stormwater runoff. Additionally, runoff estimates were calculated using the United States Department of Agriculture (USDA) Curve Number (CN) method to assess potential relationships between runoff volume and outflow concentrations, but no significant correlation was identified. Most water quality parameters in the outflow met the surface runoff standards established by the USEPA and TCEQ, reinforcing the viability of rain gardens as a sustainable stormwater management practice.
Total and water-soluble concentrations of most metals were lower in outflow water than in the inflow, demonstrating the rain gardens’ effectiveness in metal pollutant removal. Significant reductions in copper, zinc, and iron align with documented decreases in metal concentrations observed in bioretention systems designed for stormwater treatment [43]. Similarly, sandy substrates combined with organic amendments have been associated with reductions in heavy metal concentrations exceeding 50% [44]. Pollutant removal in rain gardens occurs through multiple mechanisms, including filtration, adsorption, precipitation, and biological treatment [45], all of which likely contributed to the reductions observed in this study. Bioretention systems remain among the most widely implemented best management practices for urban stormwater control, effectively reducing runoff volume, peak flows, and pollutant loads, including heavy metals.
In contrast, lead and arsenic showed no significant removal, which is consistent with Trowsdale and Simcock [46], who reported limited lead and arsenic reduction in bioretention systems due to their low mobility under typical pH conditions. The lack of significant removal may be attributed to the relatively low initial concentrations of these metals in the inflow, as well as their strong affinity for particulate matter rather than dissolved phases, which reduces their susceptibility to filtration and adsorption processes in the rain garden substrates [47].
However, aluminum and magnesium concentrations were higher in the outflow than in the inflow, likely due to underlying geological conditions or differences in fill material composition across the three study sites. Ponded runoff in the rain gardens was exposed to Weches Formation rock, known to contain elevated aluminum and magnesium levels due to its glauconitic and clay-rich composition [48]. The leaching of aluminum and magnesium from the Weches Formation could have contributed to the increased outflow concentrations, similar to observations of elevated dissolved metal concentrations in outflow water resulting from interactions with underlying geological substrates [49].
Laboratory analysis of the rain garden soil revealed significant differences in manganese concentrations among the three sites. The mulch layer in Rain Gardens 2 and 3 contained substantially higher manganese concentrations (1762.96 mg/L and 1775.46 mg/L, respectively) than in Rain Garden 1 (710.42 mg/L), with statistically significant differences (p < 0.0001). In the sand layer, manganese concentrations also varied significantly, with Rain Garden 2 having the highest (243.20 mg/L), followed by Rain Garden 3 (106.25 mg/L) and Rain Garden 1 (54.39 mg/L). These variations may have contributed to the manganese levels detected in the outflow, as bioretention media composition strongly influences manganese and other metal leaching [50].
Elevated calcium concentrations in the outflow were likely due to the dissolution of calcium from the underlying soil. The parent material in Rain Gardens 2 and 3 consists of sandstone containing silica and calcium carbonate as cementing agents, which undergoes weathering and releases calcium into percolating water. In regions where the parent material comprises sandstone cemented with CaCO3, chemical weathering processes can release calcium into percolating water. The dissolution of calcite, a common form of CaCO3, in sandstone has been studied to understand its impact on reservoir properties. Research indicates that calcite dissolution rates in reservoir sandstones can be significant, leading to increased calcium levels in the surrounding water [51]. The elevated concentrations of calcium, sodium, and manganese can also alter pH and electrical conductivity, influencing the solubility and mobility of other metals. Higher pH values, such as those observed in the outflow in this study (Table 5 and Table 7), can enhance metal precipitation and adsorption processes, ultimately improving the removal efficiency of certain heavy metals [52].
The performance of the rain gardens improved from Year 1 to Year 2 of the study. During the first year, vegetation was still establishing, but by the second year, woody perennials had matured, increasing pollutant uptake and enhancing overall stormwater treatment efficiency. Metal and nutrient removal efficiency in rain gardens has been shown to significantly improve as plant root systems develop and microbial communities become more active, reinforcing the role of vegetation maturity in optimizing bioretention performance over time [53].
Variability in removal rates among the rain gardens was influenced by differences in initial inflow water conditions and site-specific factors, particularly for aluminum, iron, manganese, sodium, boron, nitrate, and nitrite. This variation aligns with research indicating that rain garden performance is site-dependent and affected by hydrologic conditions, substrate composition, and pollutant loading rates [54]. Future studies should consider long-term monitoring and controlled experiments to further isolate the effects of substrate composition, vegetation type, and hydrologic variability on pollutant removal efficiency.
6. Conclusions
This study assessed the pollutant removal performance of three rain gardens in eastern Texas over 25 storm events under a subtropical climate regime. Despite the challenges posed by high-intensity precipitation and short residence times, the rain gardens demonstrated substantial pollutant mitigation capacity. Median nitrate concentrations were reduced by 52%, phosphate by up to 40%, and copper by 44%, with consistent reductions also observed for lead (38%) and zinc (56%). However, some pollutants—notably aluminum and iron—remained above ecological or aesthetic thresholds, likely due to local soil composition and media characteristics. These findings confirm the effectiveness of bioretention systems in managing urban stormwater in hydrologically variable environments but also point to important limitations. This study did not quantify flow rates or total mass removal, and monitoring was limited to a one-year period. Additionally, the rain gardens varied in design and substrate characteristics, making it difficult to isolate performance drivers.
Future research should incorporate multi-year monitoring, quantify pollutant loads, and evaluate the impact of different media types, vegetation assemblages, and maintenance regimes on pollutant retention. Further work is also needed to assess how rain gardens function during overflow events and under repeated high-intensity rainfall. Given the growing intensity of storm events under climate change, adaptive BMP designs—tailored to subtropical conditions—are essential for resilient urban water management.
Author Contributions
Conceptualization, M.M., Y.Z. and D.C.; methodology, K.S.; validation, K.S., M.M. and Y.Z.; formal analysis, K.S.; investigation, S.S.J. and Z.W.; resources, M.M.; data curation, K.S.; writing—original draft preparation, S.S.J., Z.W. and Z.C.; writing—review and editing, Z.C.; visualization, S.S.J., Z.W. and Z.C.; supervision, M.M. and Y.Z.; project administration, M.M.; funding acquisition, M.M. All authors have read and agreed to the published version of the manuscript.
Funding
This study was funded by the Environmental Science Division at Stephen F. Austin State University and the Piney Woods Native Plant Center.
Institutional Review Board Statement
Not applicable.
Informed Consent Statement
Not applicable.
Data Availability Statement
Data are available on request.
Acknowledgments
The numerous contributions by the staff of SFASU Gardens are gratefully acknowledged. The analyses and other in-kind contributions provided by the SFASU Soil Plant and Water Analysis Laboratory and Leon Young and Wayne Weatherford were indispensable.
Conflicts of Interest
Author Zhengyi Wang was employed by the company Perennial Environmental Services. The remaining authors declare that the research was conducted in the absence of any commercial or financial relationships that could be construed as a potential conflict of interest.
References
- Novotny, V.; Olem, H. Water Quality: Prevention, Identification and Management of Diffuse Pollution; Van Nostrand-Reinhold Publishers: New York, NY, USA, 1994. [Google Scholar]
- O’Driscoll, M.; Clinton, S.; Jefferson, A.; Manda, A.; McMillan, S. Urbanization Effects on Watershed Hydrology and In-Stream Processes in the Southern United States. Water 2010, 2, 605–648. [Google Scholar] [CrossRef]
- Whipple, W.; Dilouie, J.M.; Pytlar, T. Erosional Potential of Streams in Urbanizing Areas. Water Resour. Bull 1981, 17, 36–45. [Google Scholar] [CrossRef]
- United States Environmental Protection Agency. Ambient Air Quality for Dissolved Oxygen, Water Clarity and Chlorophyll a for Chesapeake Bay and Its Tidal Tributaries; United States Environmental Protection Agency: Washington, DC, USA, 2003. [Google Scholar]
- Mishra, A.K.; Singh, V.P. Changes in extreme precipitation in Texas. J. Geophys. Res. Atmos. 2010, 115, D14. [Google Scholar] [CrossRef]
- Perica, S.; Pavlovic, S.; Laurent, M.S.; Trypaluk, C.; Unruh, D.; Wilhite, O. NOAA Atlas 14 Precipitation-Frequency Atlas of the United States Volume 11 Version 2.0: Texas; NOAA: Silver Spring, MD, USA, 2018. [Google Scholar]
- Prein, A.F.; Mearns, L.O. US Extreme Precipitation Weather Types Increased in Frequency During the 20th Century. J. Geophys. Res. Atmos. 2021, 126, e2020JD034287. [Google Scholar] [CrossRef]
- Fagnant, C.; Gori, A.; Sebastian, A.; Bedient, P.B.; Ensor, K.B. Characterizing spatiotemporal trends in extreme precipitation in Southeast Texas. Nat. Hazards 2020, 104, 1597–1621. [Google Scholar] [CrossRef]
- Shao, M.; Zhao, G.; Kao, S.-C.; Cuo, L.; Rankin, C.; Gao, H. Quantifying the effects of urbanization on floods in a changing environment to promote water security––A case study of two adjacent basins in Texas. J. Hydrol. 2020, 589, 125154. [Google Scholar] [CrossRef]
- Aryal, R.; Vigneswaran, S.; Kandasamy, J.; Naidu, R. Urban stormwater quality and treatment. Korean J. Chem. Eng. 2010, 27, 1343–1359. [Google Scholar] [CrossRef]
- Tsihrinttzis, V.A.; Hamid, R. Modeling and management of urban stormwater runoff quality: A review. Water Resour. Manag. 1997, 11, 136–164. [Google Scholar] [CrossRef]
- Nordberg, G.F.; Costa, M. Handbook on the Toxicology of Metals, 5th ed.; Volume I: General Considerations; Academic Press: Cambridge, MA, USA, 2022. [Google Scholar]
- Chang, M.; McBroom, M.W.; Beasley, R.S. Roofing as a source of nonpoint water pollution. J. Environ. Manag. 2004, 73, 307–315. [Google Scholar] [CrossRef]
- Stump, B.; McBroom, M.W.; Darville, R. Demographics, practices, and water quality from domestic potable rainwater harvesting systems. J. Water Supply Res. Technol. AQUA 2012, 61, 261–271. [Google Scholar] [CrossRef]
- Muller, A.; Osterlund, H.; Marsalek, J.; Viklander, M. The pollution conveyed by urban runoff: A review of sources. Sci. Total Environ. 2020, 709, 136125. [Google Scholar] [CrossRef] [PubMed]
- Besser, J.M.; Brumbaugh, W.G.; Allert, A.L.; Poulton, B.C.; Schmitt, C.J.; Ingersoll, C.G. Ecological impacts of lead mining on Ozark streams: Toxicity of sediment and pore water. Ecotoxicol. Environ. Saf. 2009, 72, 516–526. [Google Scholar] [CrossRef] [PubMed]
- Iwasaki, Y.; Kagaya, T.; Miyamoto, K.; Matsuda, H. Effects of heavy metals on riverine benthic macroinvertebrate assemblages with reference to potential food availability for drift-feeding fishes. Environ. Toxicol. Chem. 2009, 28, 354–363. [Google Scholar] [CrossRef] [PubMed]
- Fishbein, L. Overview of analysis of carcinogenic and/or mutagenic metals in biological and environmental samples. I. Arsenic, beryllium, cadmium, chromium and selenium. Int. J. Environ. Anal. Chem. 1984, 17, 113–170. [Google Scholar] [CrossRef]
- Lan, J.X.; Liu, P.F.; Hu, X.; Zhu, S.S. Harmful Algal Blooms in Eutrophic Marine Environments: Causes, Monitoring, and Treatment. Water 2024, 16, 2525. [Google Scholar] [CrossRef]
- United States Environmental Protection Agency. Water Quality and Biological Effects of Urban Runoff on Coyote Creek: Phase 1: Preliminary Survey Report; EPA: Cincinnati, OH, USA, 1980. [Google Scholar]
- Wanda Masifwa, F.; Matuha, M.; Magezi, G.; Nabwire, R.; Amondito, B. Potential Impacts of Oil and Grease on Algae, Invertebrates and Fish in the Bujagali Hydropower Project Area. Uganda J. Agric. Sci. 2022, 20, 23–35. [Google Scholar] [CrossRef]
- Prince George’s County Department of Environmental Sciences. Design manual for use of bio retention in stormwater management. In Sciences PGsCDoE; Prince George County: Largo, MD, USA, 1993. [Google Scholar]
- Knox County Stormwater Ordinance. TN Stormwater Management Manual. 2008. Available online: https://knoxcounty.org/stormwater/manual/Volume%201/Volume1Combined.pdf (accessed on 11 May 2025).
- McBroom, M.W.; Zhang, Y. Best Management Practices (BMPs). In Berkshire Encyclopedia of Sustainability: Measurements, Indicators, and Research Methods for Sustainability, 6th ed.; Anderson, R., Ed.; Berkshire Publishing: Barrington, MA, USA, 2012. [Google Scholar]
- Dietz, M.F.; Clausen, J.C. A field evaluation of rain garden flow and pollutant treatment. Water Air Soil Pollut. 2005, 167, 123–138. [Google Scholar] [CrossRef]
- Schueler, T.R. Design of stormwater wetland systems; Guidelines for creating diverse and effective stormwater wetlands in the mid- Atlantic region. In Programs; Do, E., Ed.; Department of Environmental Programs: Lacey, WA, USA, 1992. [Google Scholar]
- Rashid, A.R.M.; Bhuiyan, M.A.; Pramanik, B.; Jayasuriya, N. A comparison of environmental impacts between rainwater harvesting and rain garden scenarios. Process Saf. Environ. Prot. 2022, 159, 198–212. [Google Scholar] [CrossRef]
- Wang, M.; Zhuang Ja Sun, C.; Wang, L.; Zhang, M.; Fan, C.; Li, J. The Application of Rain Gardens in Urban Environments: A Bibliometric Review. Land 2024, 13, 1702. [Google Scholar] [CrossRef]
- Tang, S.; Song, Y.; Wang, Y.; Jia, Z.; Gao, X.; Cheng, N.; Lu, T. Optimizing stormwater runoff treatment: The role of two-stage tandem rain gardens. Environ. Res. 2024, 262 Pt 1, 119831. [Google Scholar] [CrossRef]
- Morash, J.; Wright, A.; LeBleu, C.; Meder, A.; Kessler, R.; Brantley, E.; Howe, J. Increasing Sustainability of Residential Areas Using Rain Gardens to Improve Pollutant Capture, Biodiversity and Ecosystem Resilience. Sustainability 2019, 11, 3269. [Google Scholar] [CrossRef]
- Mehring, A.S.; Levin, L.A.; Li, J.T. REVIEW: Potential roles of soil fauna in improving the efficiency of rain gardens used as natural stormwater treatment systems. J. Appl. Ecol. 2015, 52, 1445–1454. [Google Scholar] [CrossRef]
- Zhou, P.L.; Han, J.Q.; Zhang, H.X. A Review of Researches on Plant Configuration and Decontamination Efficiency of Rain Gardens in China. In IOP Conference Series: Earth and Environmental Science; IOP Publishing: Bristol, UK, 2020; p. 510. [Google Scholar]
- Kumar, S.; Singh, K.K. Pollutant removal efficiency of bare and planted rain gardens with diverse planting mixtures. Water Sci. Technol. 2024, 89, 3226–3236. [Google Scholar] [CrossRef] [PubMed]
- Bąk, J.; Barjenbruch, M. Benefits, Inconveniences, and Facilities of the Application of Rain Gardens in Urban Spaces from the Perspective of Climate Change—A Review. Water 2022, 14, 1153. [Google Scholar] [CrossRef]
- Zhang, L.; Ye, Z.; Shibata, S. Assessment of Rain Garden Effects for the Management of Urban Storm Runoff in Japan. Sustainability 2020, 12, 9982. [Google Scholar] [CrossRef]
- Liu, W.; Pei, Q.; Dong, W.; Chen, P. Study on the purification capacity of rain garden paving structures for rainfall runoff pollutants. Arch. Environ. Prot. 2023, 48, 28–36. [Google Scholar]
- Chaves, M.T.R.; Farias, T.R.L.; Eloi, W.M. Comparative analysis of bioretention design strategies for urban runoff infiltration: A critical overview. Ecol. Eng. 2024, 207, 107352. [Google Scholar] [CrossRef]
- Web Soil Survey [Internet]. Natural Resources Conservation Service. United States Department of Agriculture. 2020. Available online: https://websoilsurvey.nrcs.usda.gov/app/HomePage.htm (accessed on 30 October 2024).
- Wang, Z. Effectiveness of Rain Gardens for Managing Nonpoint Source Pollution from Urban Storm Runoff. Master’s Thesis, Stephen F. Austin State University, Nacogdoches, TX, USA, 2014. [Google Scholar]
- Prince George’s County Department of Environmental Sciences. Bio retention manual. In Sciences PGsCDoE; Prince George County: Largo, MD, USA, 2002. [Google Scholar]
- Fletcher, T.; Duncan, H.; Poelsma, P.; Lloyd, S. Stormwater Flow and Quality, and the Effectiveness of Non-Proprietary Stormwater Treatment Measures—A Review and Gap Analysis, 4th ed.; Cooperative Research Centre for Catchment Hydrology, Monash University: Clayton, VIC, Australia, 2004; pp. 70–71. [Google Scholar]
- Flores, P.E.D.; Maniquiz-Redillas, M.C.; Geronimo, F.K.F.; Alihan, J.C.P.; Kim, L.-H. Transport of nonpoint source pollutants and stormwater runoff in a hybrid rain garden system. J. Wetl. Res. 2016, 18, 481–487. [Google Scholar] [CrossRef]
- Hunt, W.F.; Smith, J.T.; Jadlocki, S.J.; Hathaway, J.M.; Eubanks, P.R. Pollutant Removal and Peak Flow Mitigation by a Bioretention Cell in Urban Charlotte, N.C. J. Environ. Eng. 2008, 134, 403–408. [Google Scholar] [CrossRef]
- Hunt, W.F.; Jarrett, A.R.; Smith, J.T.; Sharkey, L.J. Evaluating Bioretention Hydrology and Nutrient Removal at Three Field Sites in North Carolina. J. Irrig. Drain. Eng. 2006, 132, 600–608. [Google Scholar] [CrossRef]
- Davis, A.P.; Hunt, W.F.; Traver, R.G.; Clar, M. Bioretention Technology: Overview of Current Practice and Future Needs. J. Environ. Eng. 2009, 135, 109–117. [Google Scholar] [CrossRef]
- Trowsdale, S.A.; Simcock, R. Urban stormwater treatment using bioretention. J. Hydrol. 2011, 397, 167–174. [Google Scholar] [CrossRef]
- Baum, P.; Kuch, B.; Dittmer, U. Adsorption of Metals to Particles in Urban Stormwater Runoff—Does Size Really Matter? Water 2021, 13, 309. [Google Scholar] [CrossRef]
- Kantala, T. An Outcrop Based Study of the Weches Formation in Sabine County, Texas: Investigating Its Unconventional Resource Potential Through the Study of Stratigraphy, Sedimentology, Petrology, and Geochemistry. Master’s Thesis, Stephen F. Austin State University, Nacogdoches, TX, USA, 2018. [Google Scholar]
- Li, J.; Davis, A.P. A unified look at phosphorus treatment using bioretention. Water Res. 2016, 90, 141–155. [Google Scholar] [CrossRef]
- Hatt, B.E.; Fletcher, T.D.; Deletic, A. Hydrologic and pollutant removal performance of stormwater biofiltration systems at the field scale. J. Hydrol. 2009, 365, 310–321. [Google Scholar] [CrossRef]
- Hale, S.; Trindade Pedrosa, E.; Jacob, A.; Reinhardt, M.; Enzmann, F.; Kersten, M.; Butscher, C.; Blum, P. Upscaling calcite dissolution rates in a tight reservoir sandstone. Environ. Earth Sci. 2022, 81, 303. [Google Scholar] [CrossRef]
- Fu, F.; Wang, Q. Removal of heavy metal ions from wastewaters: A review. J. Environ. Manag. 2011, 92, 407–418. [Google Scholar] [CrossRef]
- Denich, C.; Bradford, A. Estimation of Evapotranspiration from Bioretention Areas Using Weighing Lysimeters. J. Hydrol. Eng. 2010, 15, 522–530. [Google Scholar] [CrossRef]
- Barrett, M.E.; Limouzin, M.; Lawler, D.F. Effects of Media and Plant Selection on Biofiltration Performance. J. Environ. Eng. 2013, 139, 462–470. [Google Scholar] [CrossRef]
Disclaimer/Publisher’s Note: The statements, opinions and data contained in all publications are solely those of the individual author(s) and contributor(s) and not of MDPI and/or the editor(s). MDPI and/or the editor(s) disclaim responsibility for any injury to people or property resulting from any ideas, methods, instructions or products referred to in the content. |
© 2025 by the authors. Licensee MDPI, Basel, Switzerland. This article is an open access article distributed under the terms and conditions of the Creative Commons Attribution (CC BY) license (https://creativecommons.org/licenses/by/4.0/).