

Removal of Total Phenolic Compounds and Heavy Metal Ions from Olive Mill Wastewater Using Sodium-Activated Jordanian Kaolinite

 , , ,
, , ,  ,
,
Abstract
1. Introduction
2. Materials and Methods
2.1. Materials
2.2. Raw Kaolinite Purification
2.3. Purified Kaolinite Sodium Activation
2.4. Purified and Activated Kaolinite Characterization
2.5. Physical-Chemical Characterization of OMW
2.6. TPC Concentration in OMW
2.7. Adsorption Experiments: Batch for TPC Removal, Column for Heavy Metal Ions Removal
2.8. Adsorption Isotherm Studies
3. Results and Discussion
3.1. Adsorbents Characterization (PK and PK-NaCl)
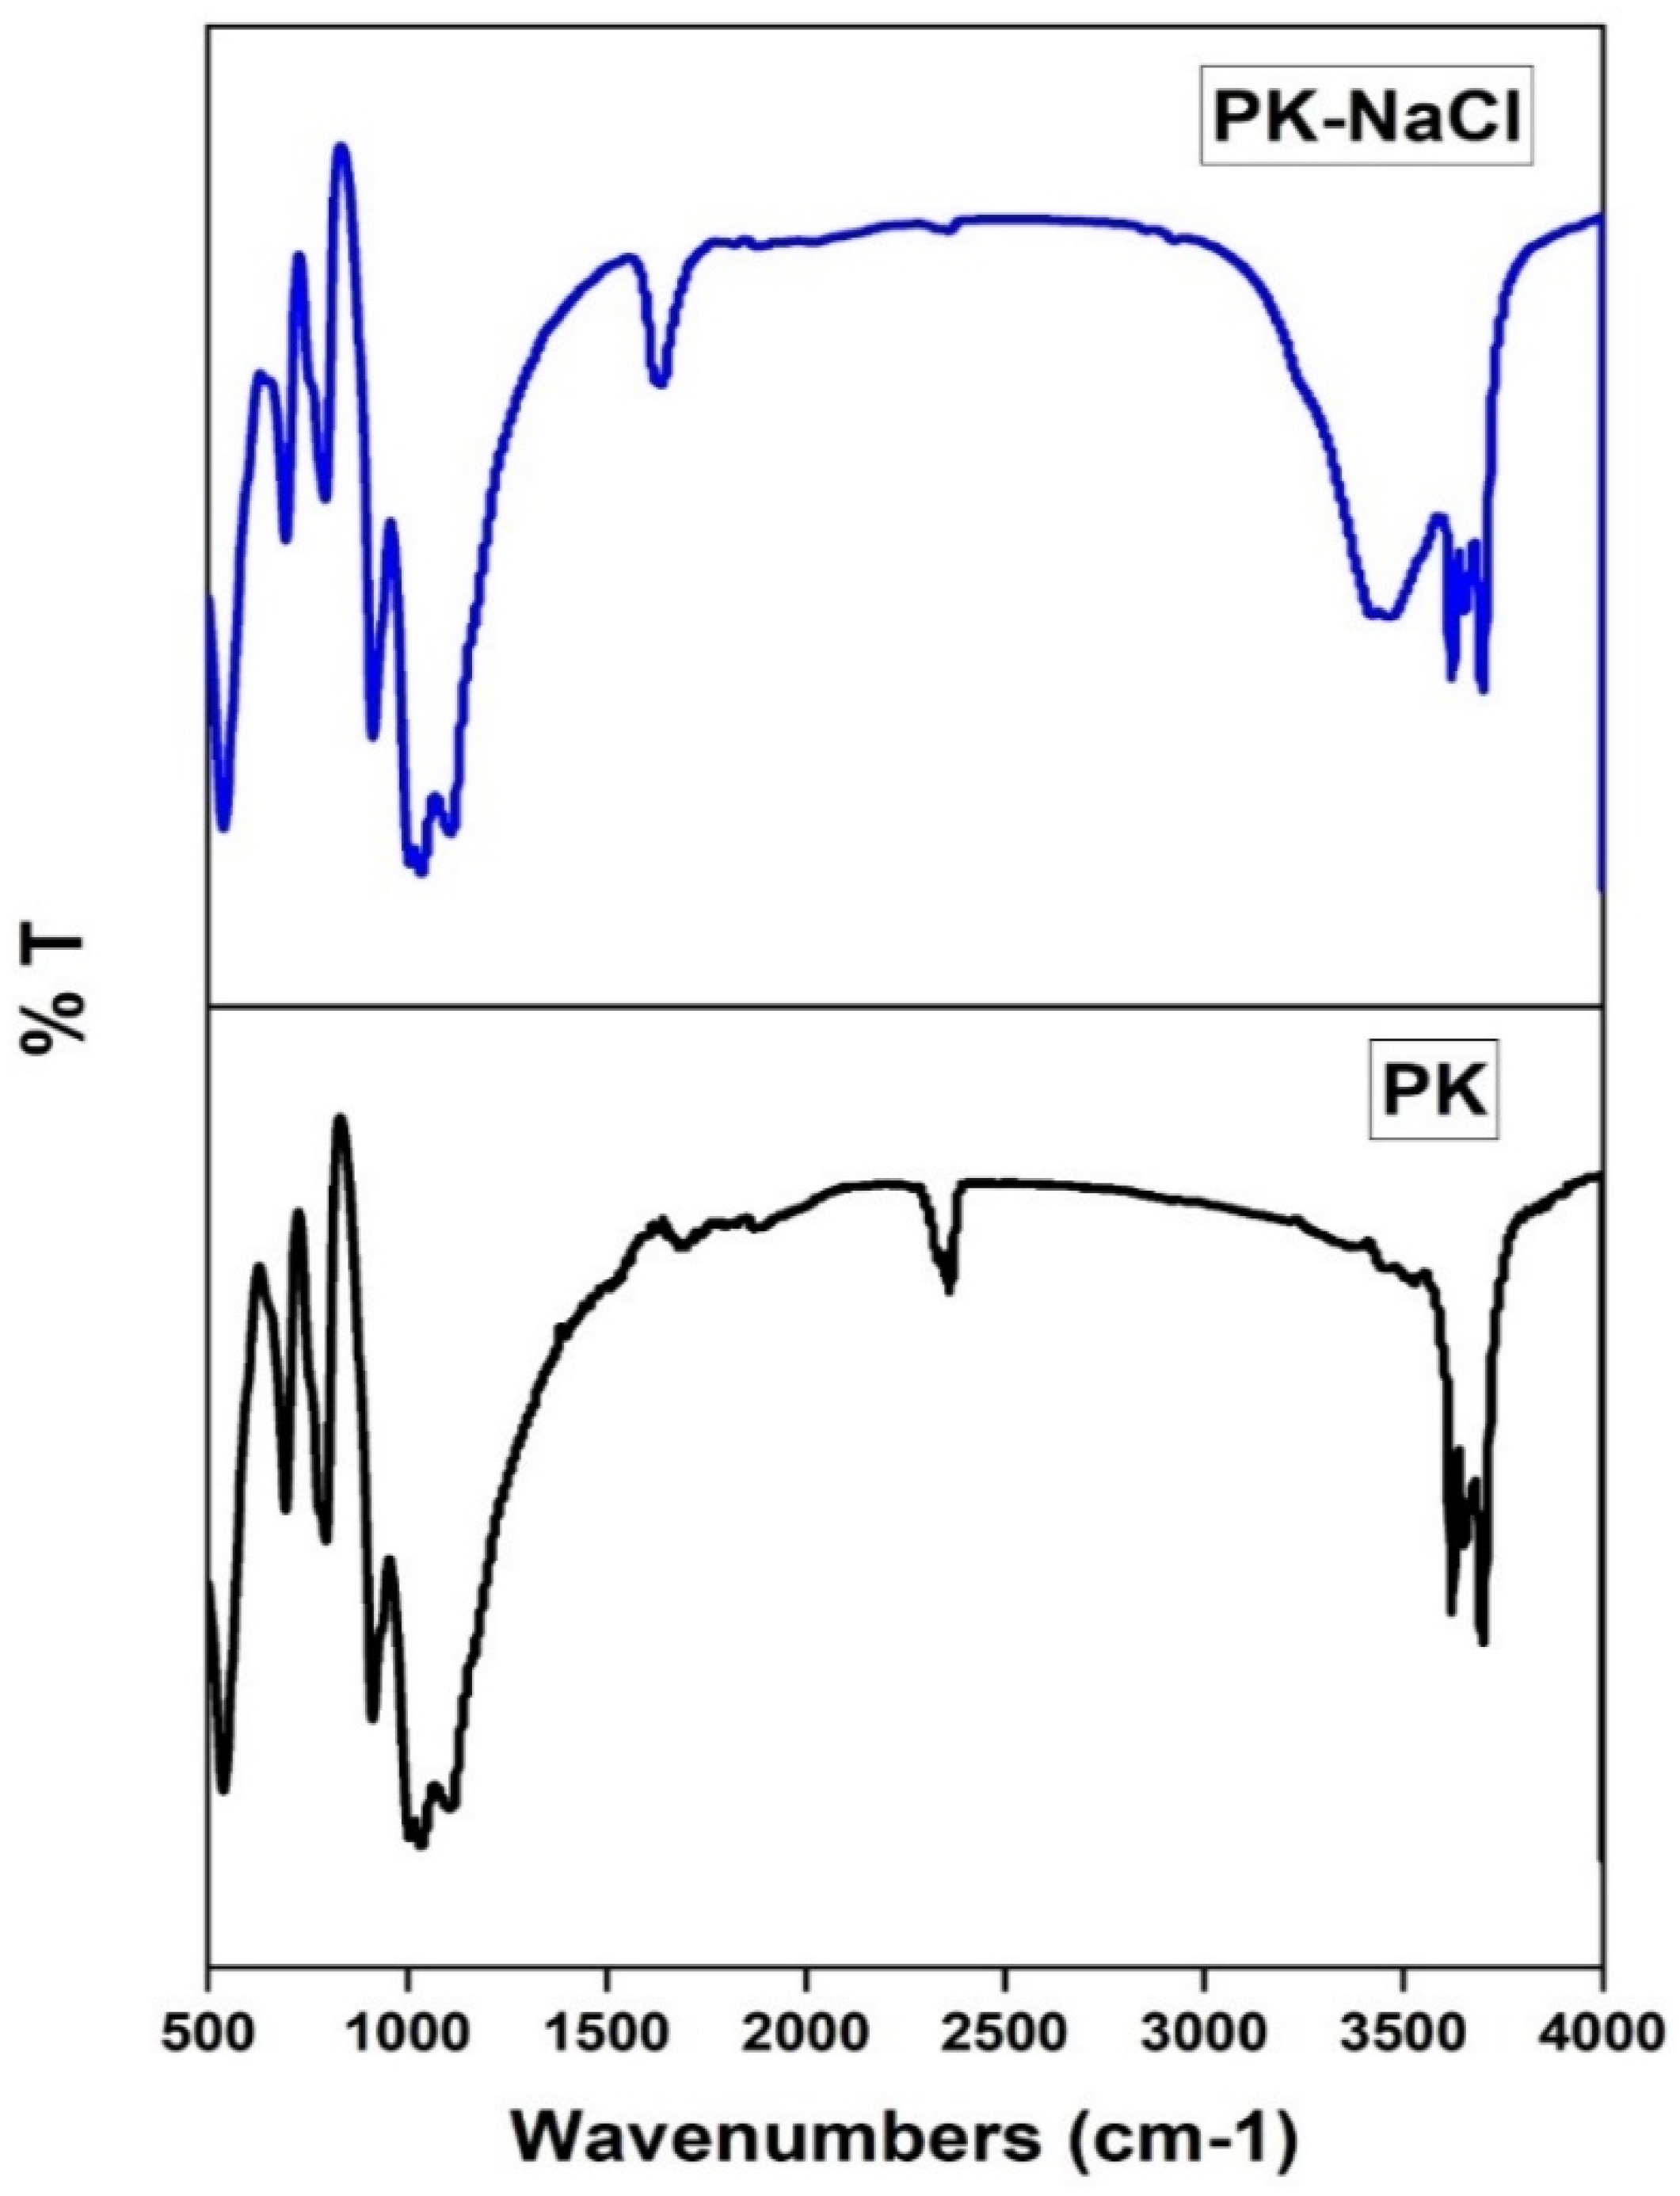
3.1.1. FTIR Spectra
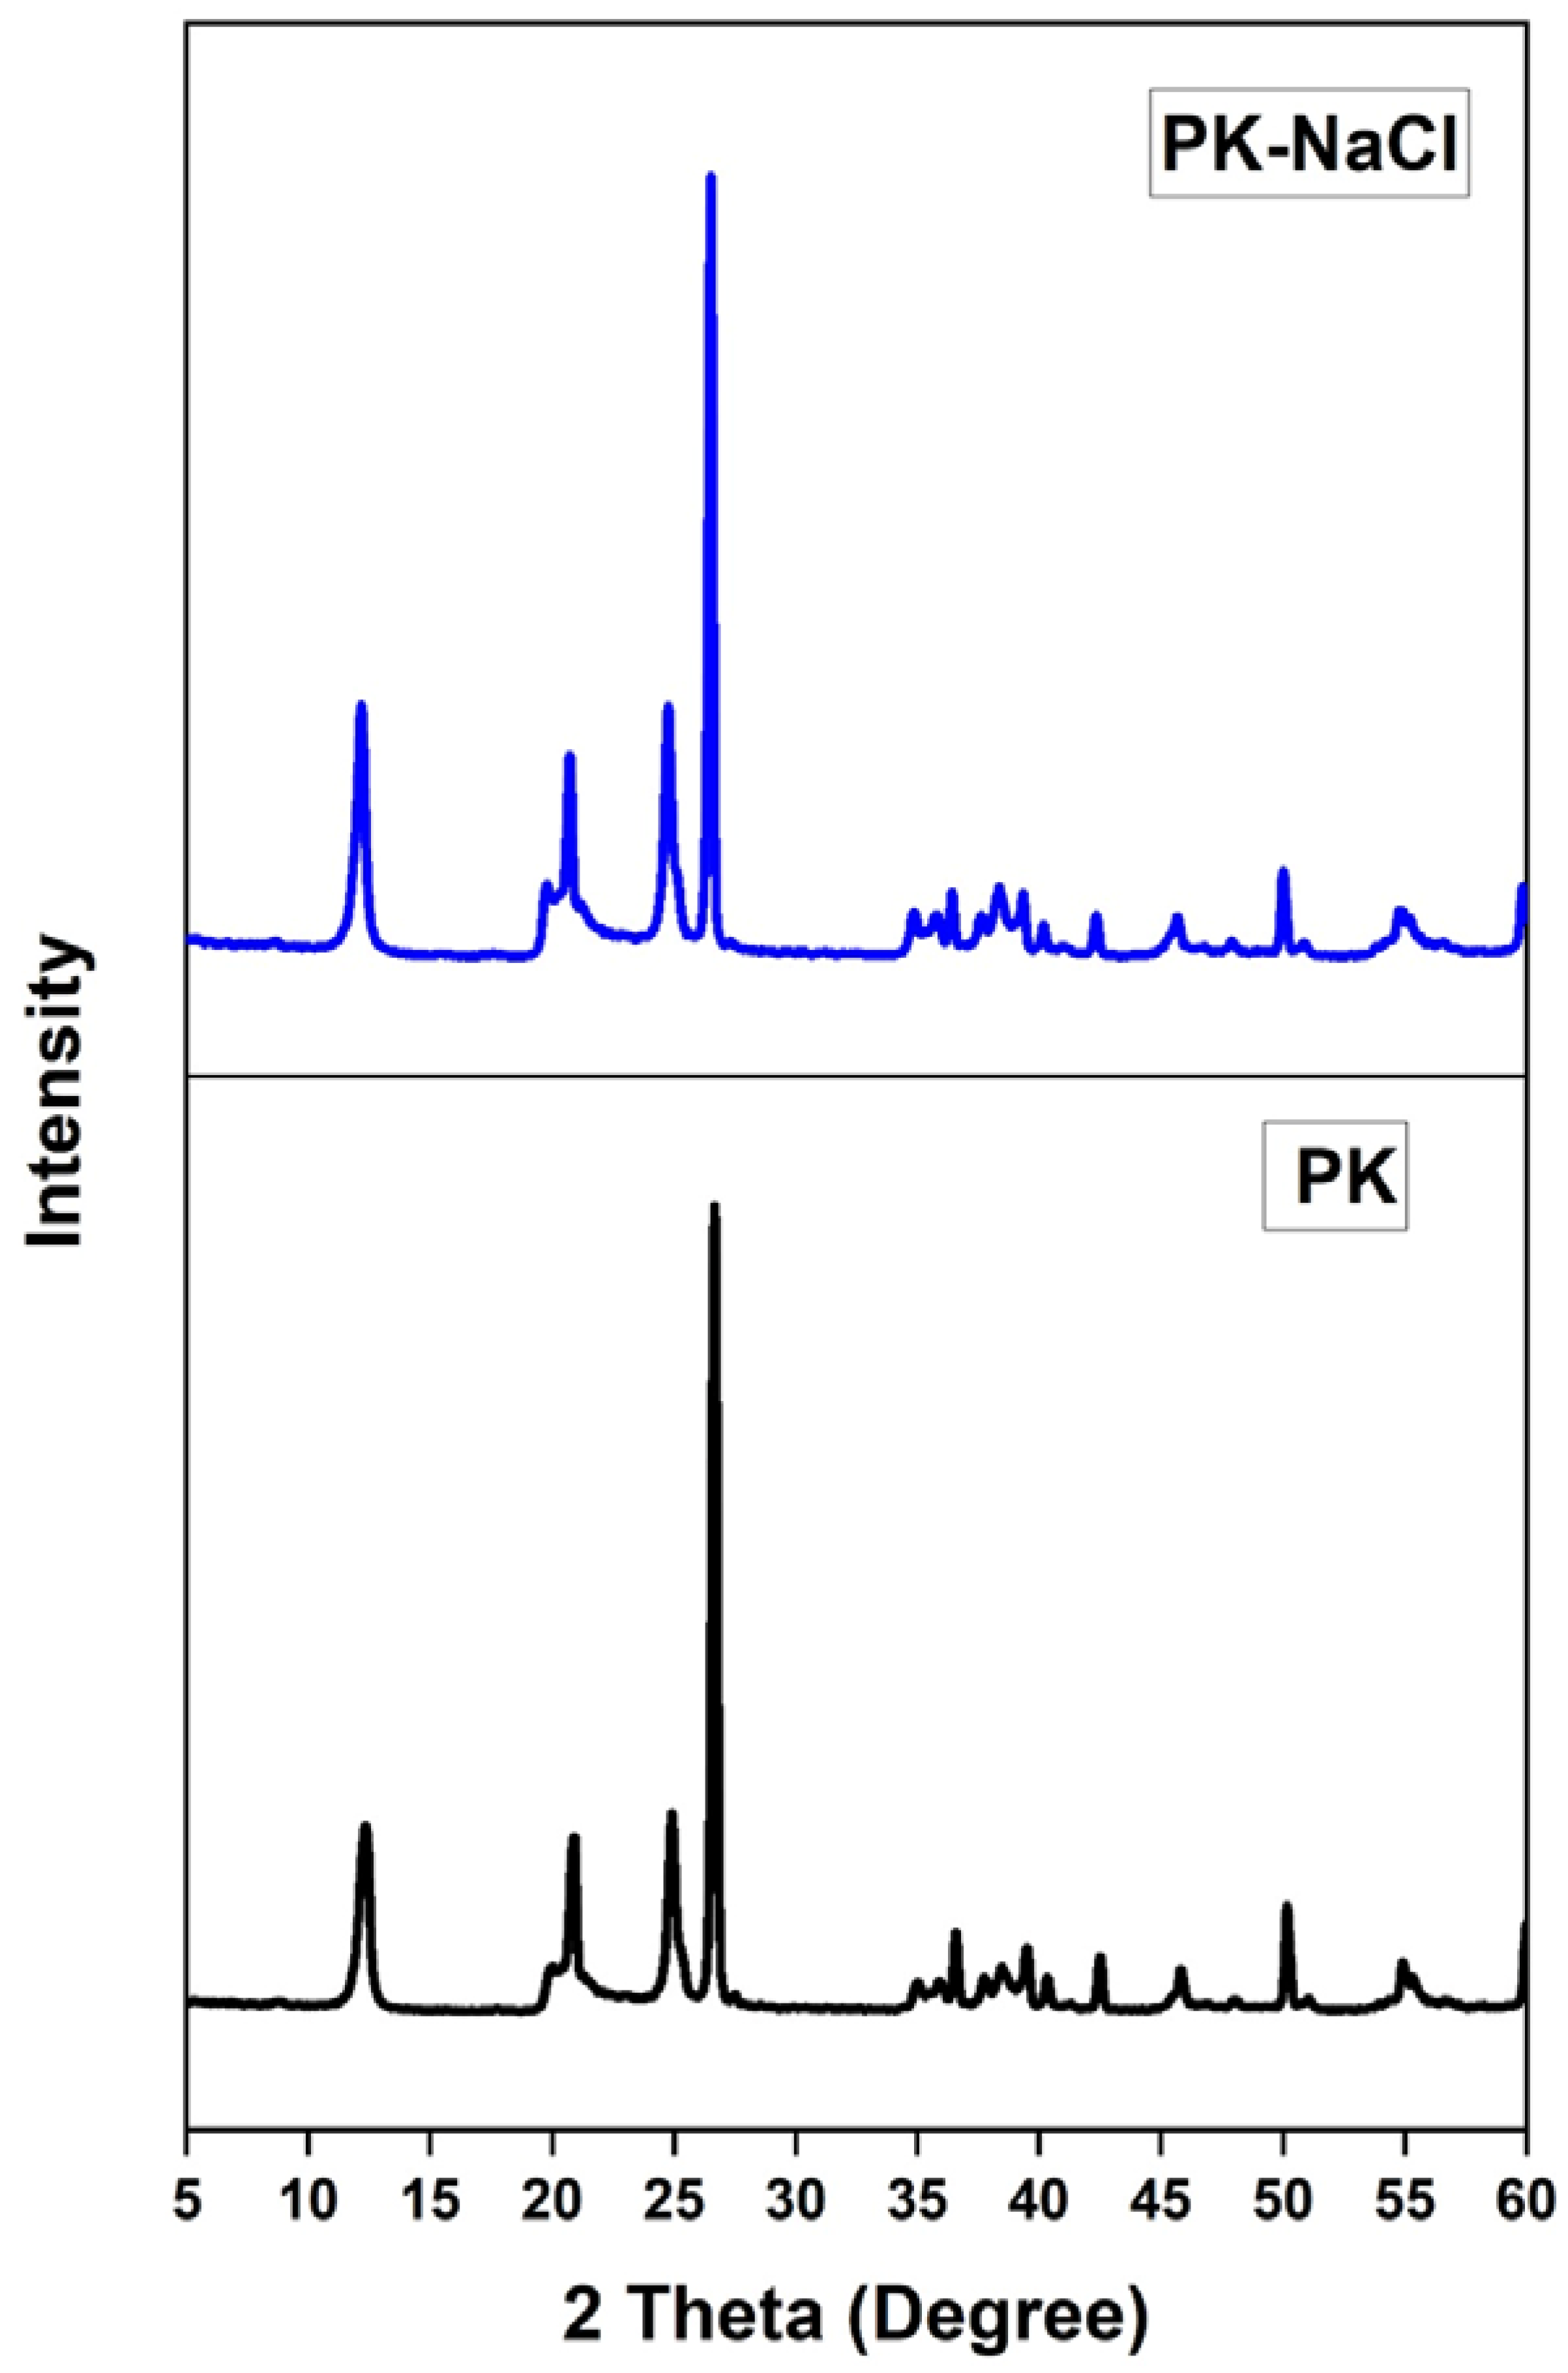
3.1.2. XRD Spectra
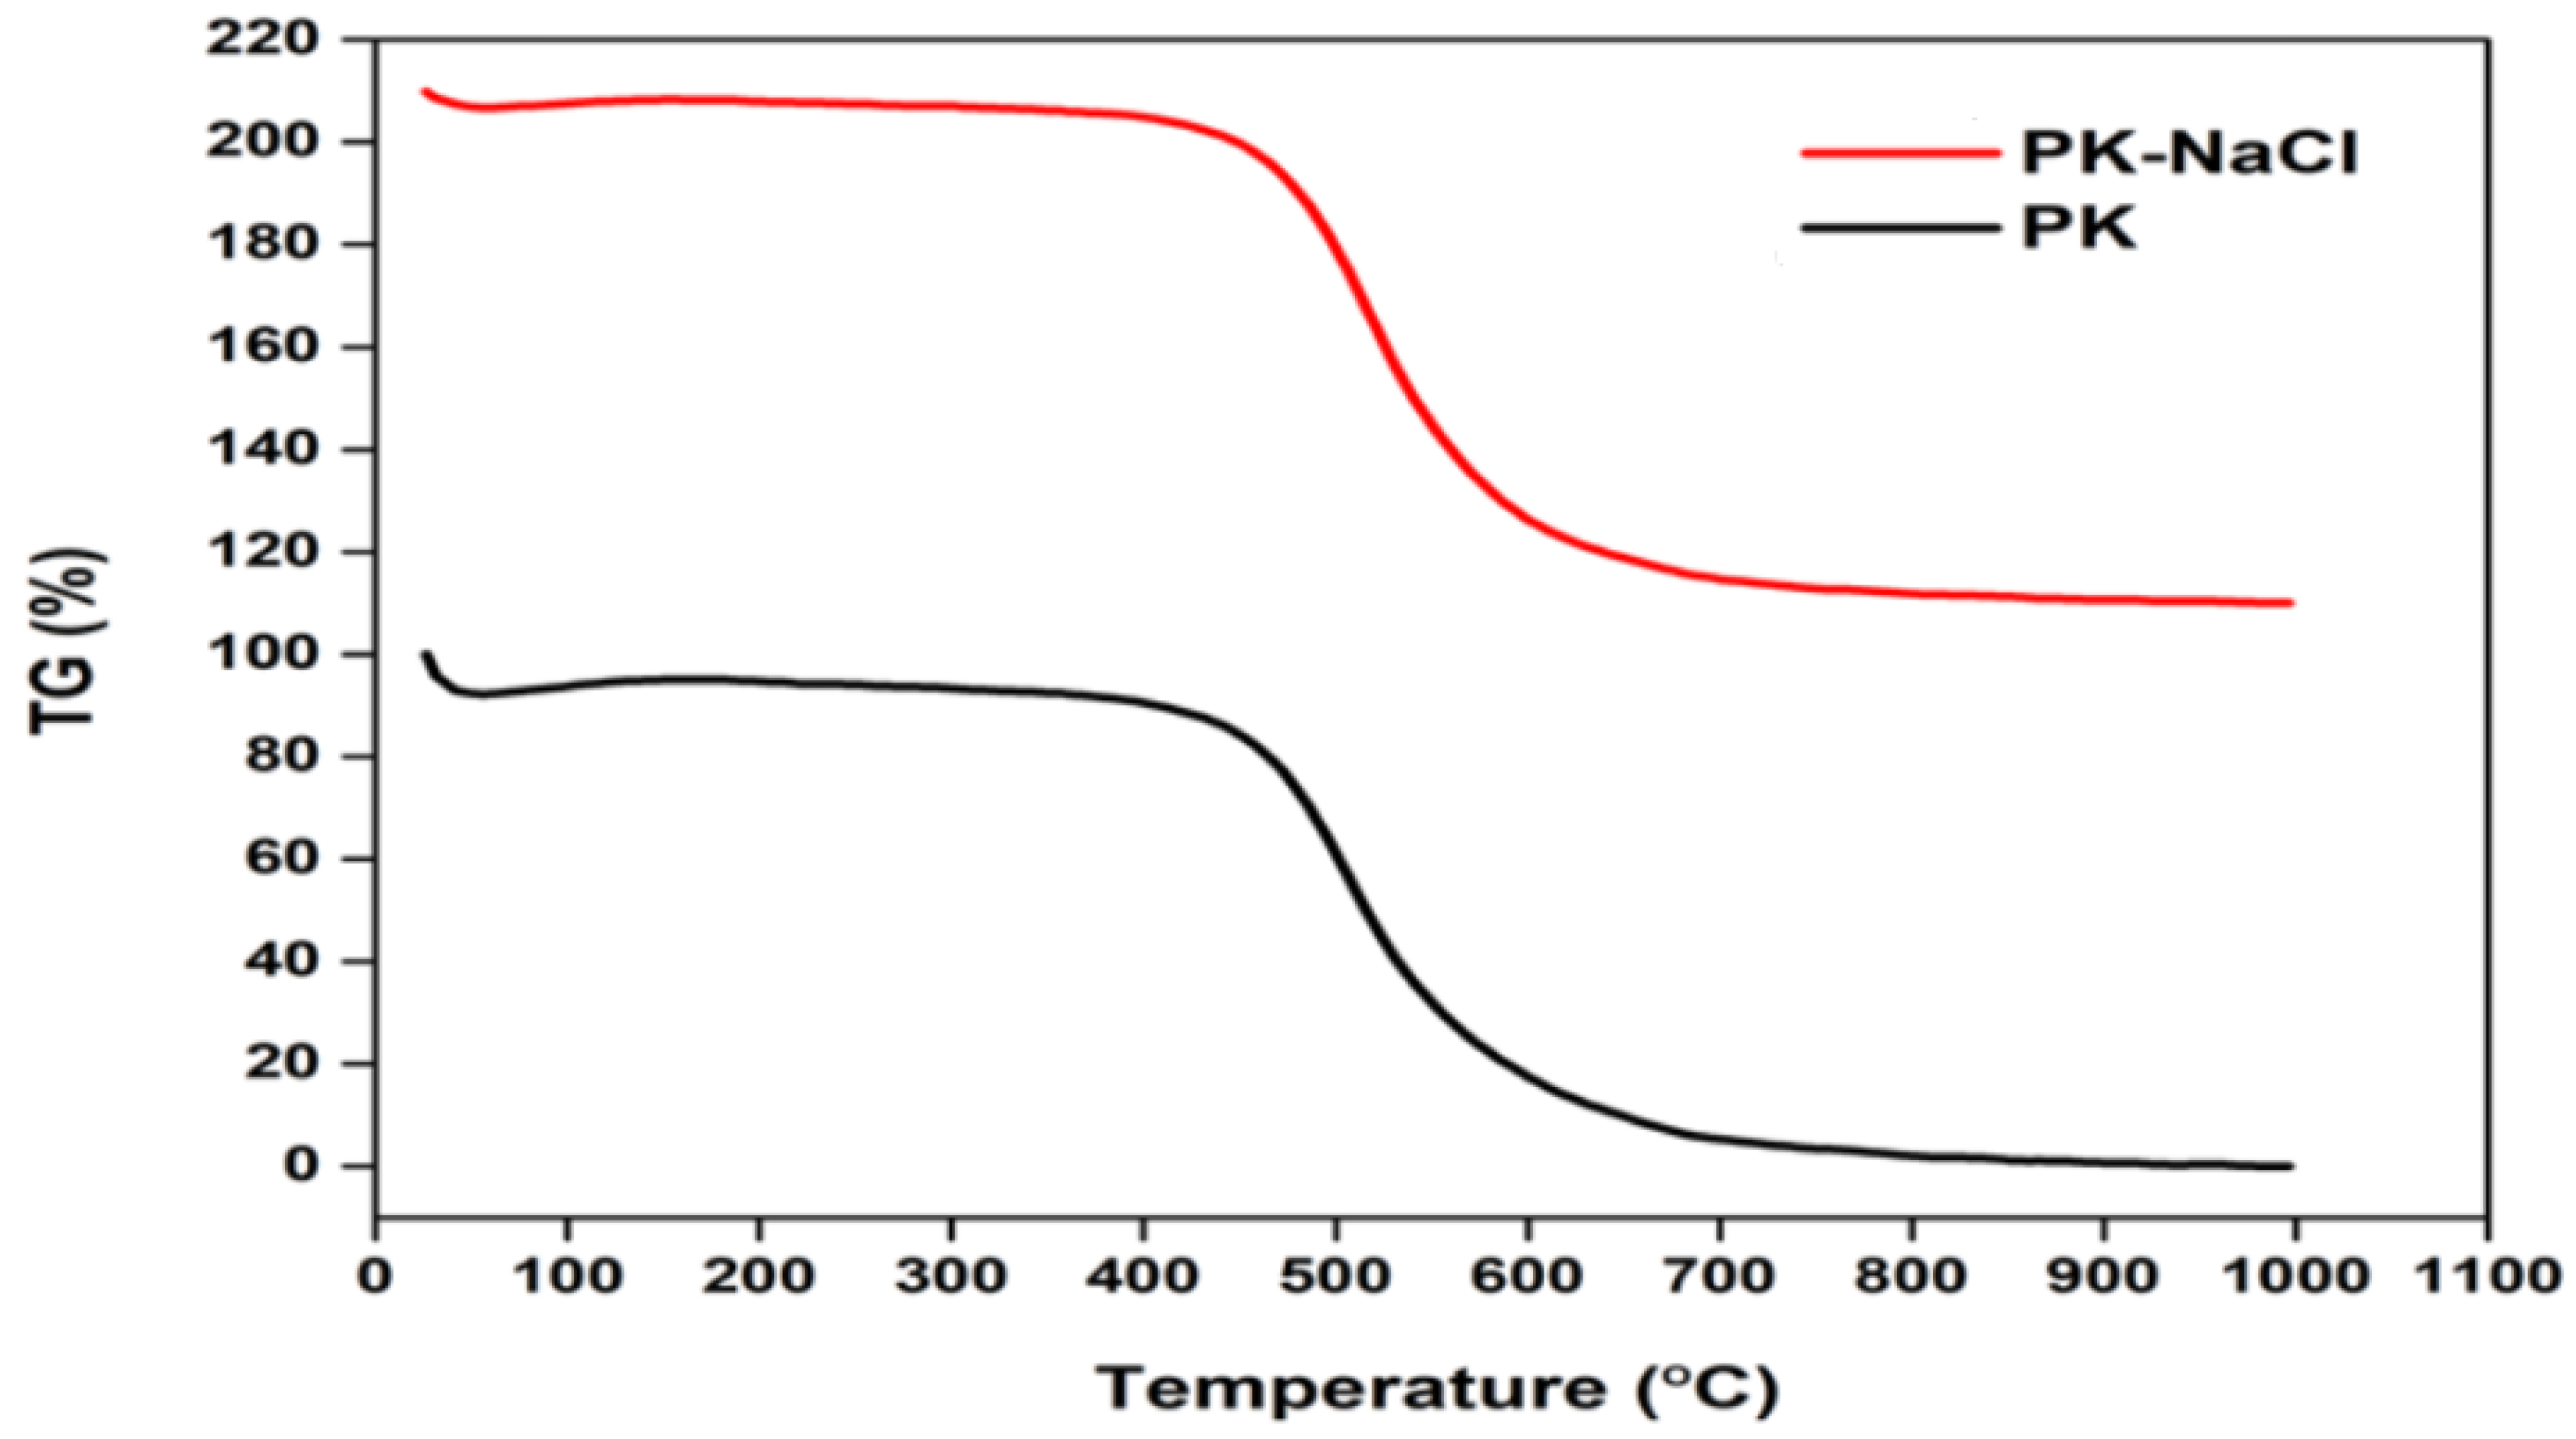
3.1.3. Thermogravimetric Analysis (TGA)
3.1.4. BET Surface Area
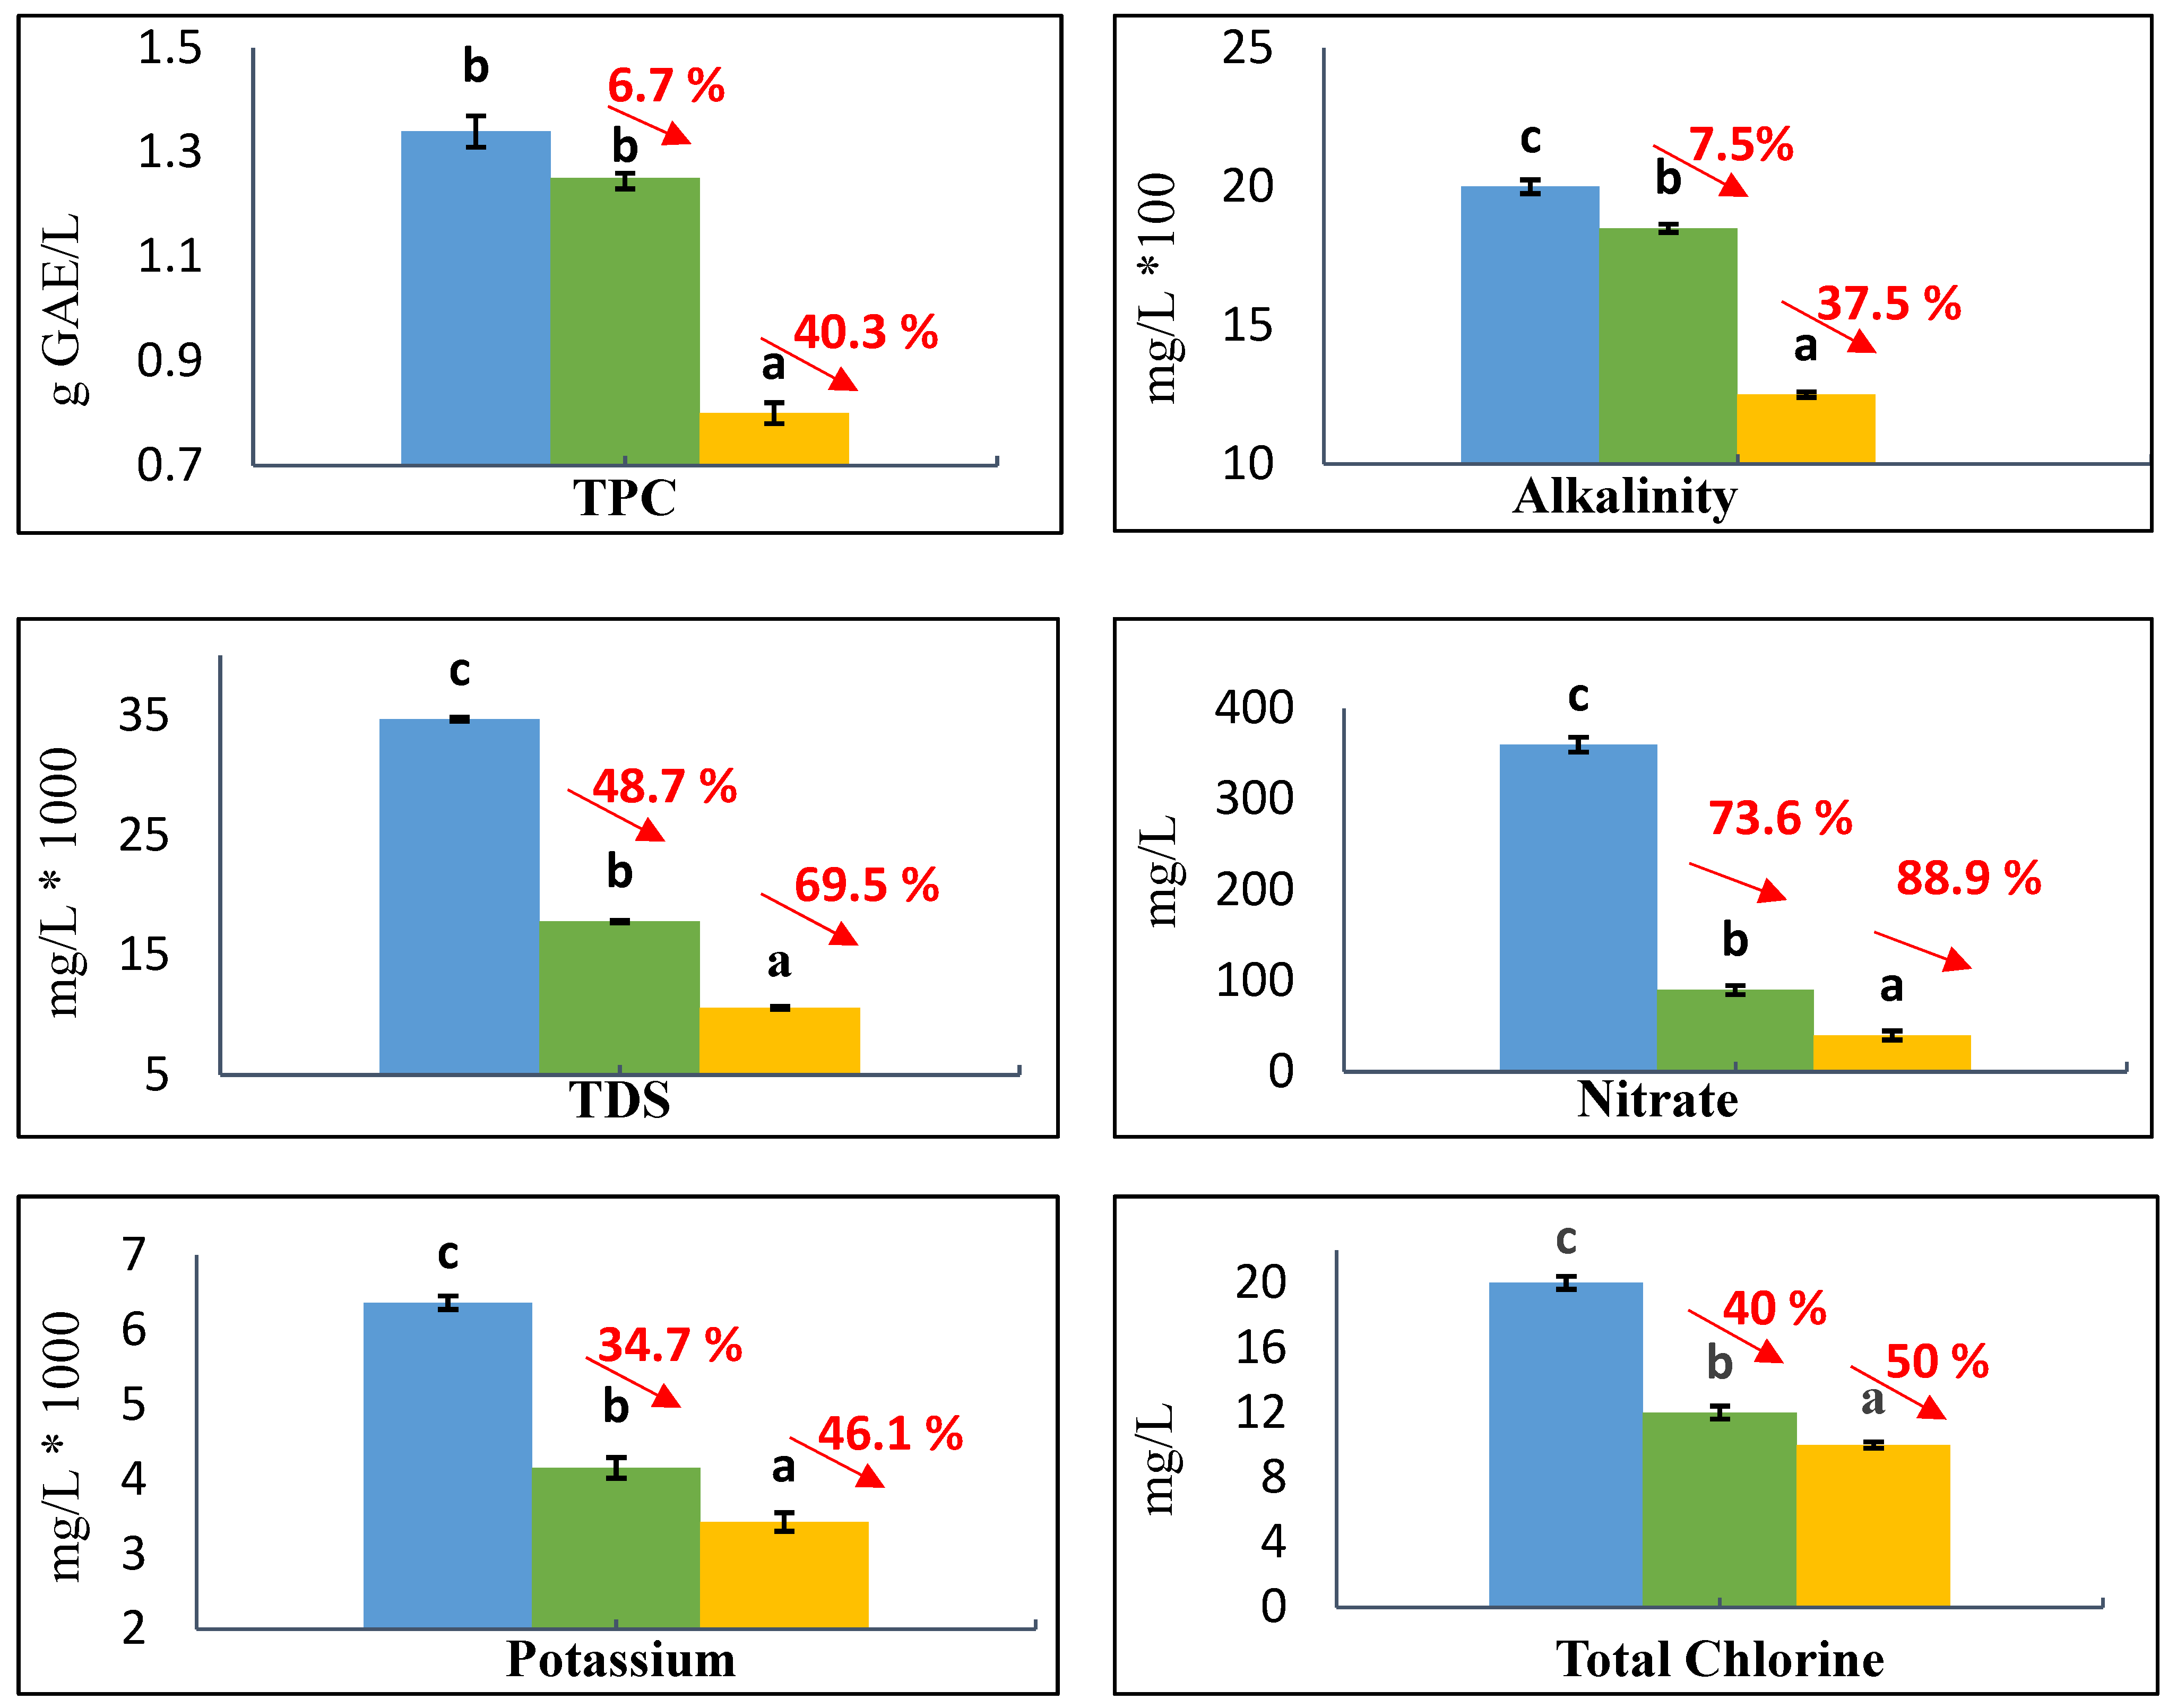
3.2. Results of Physical-Chemical Characterization of OMW
3.3. TPC Removal by Batch Adsorption Experiments
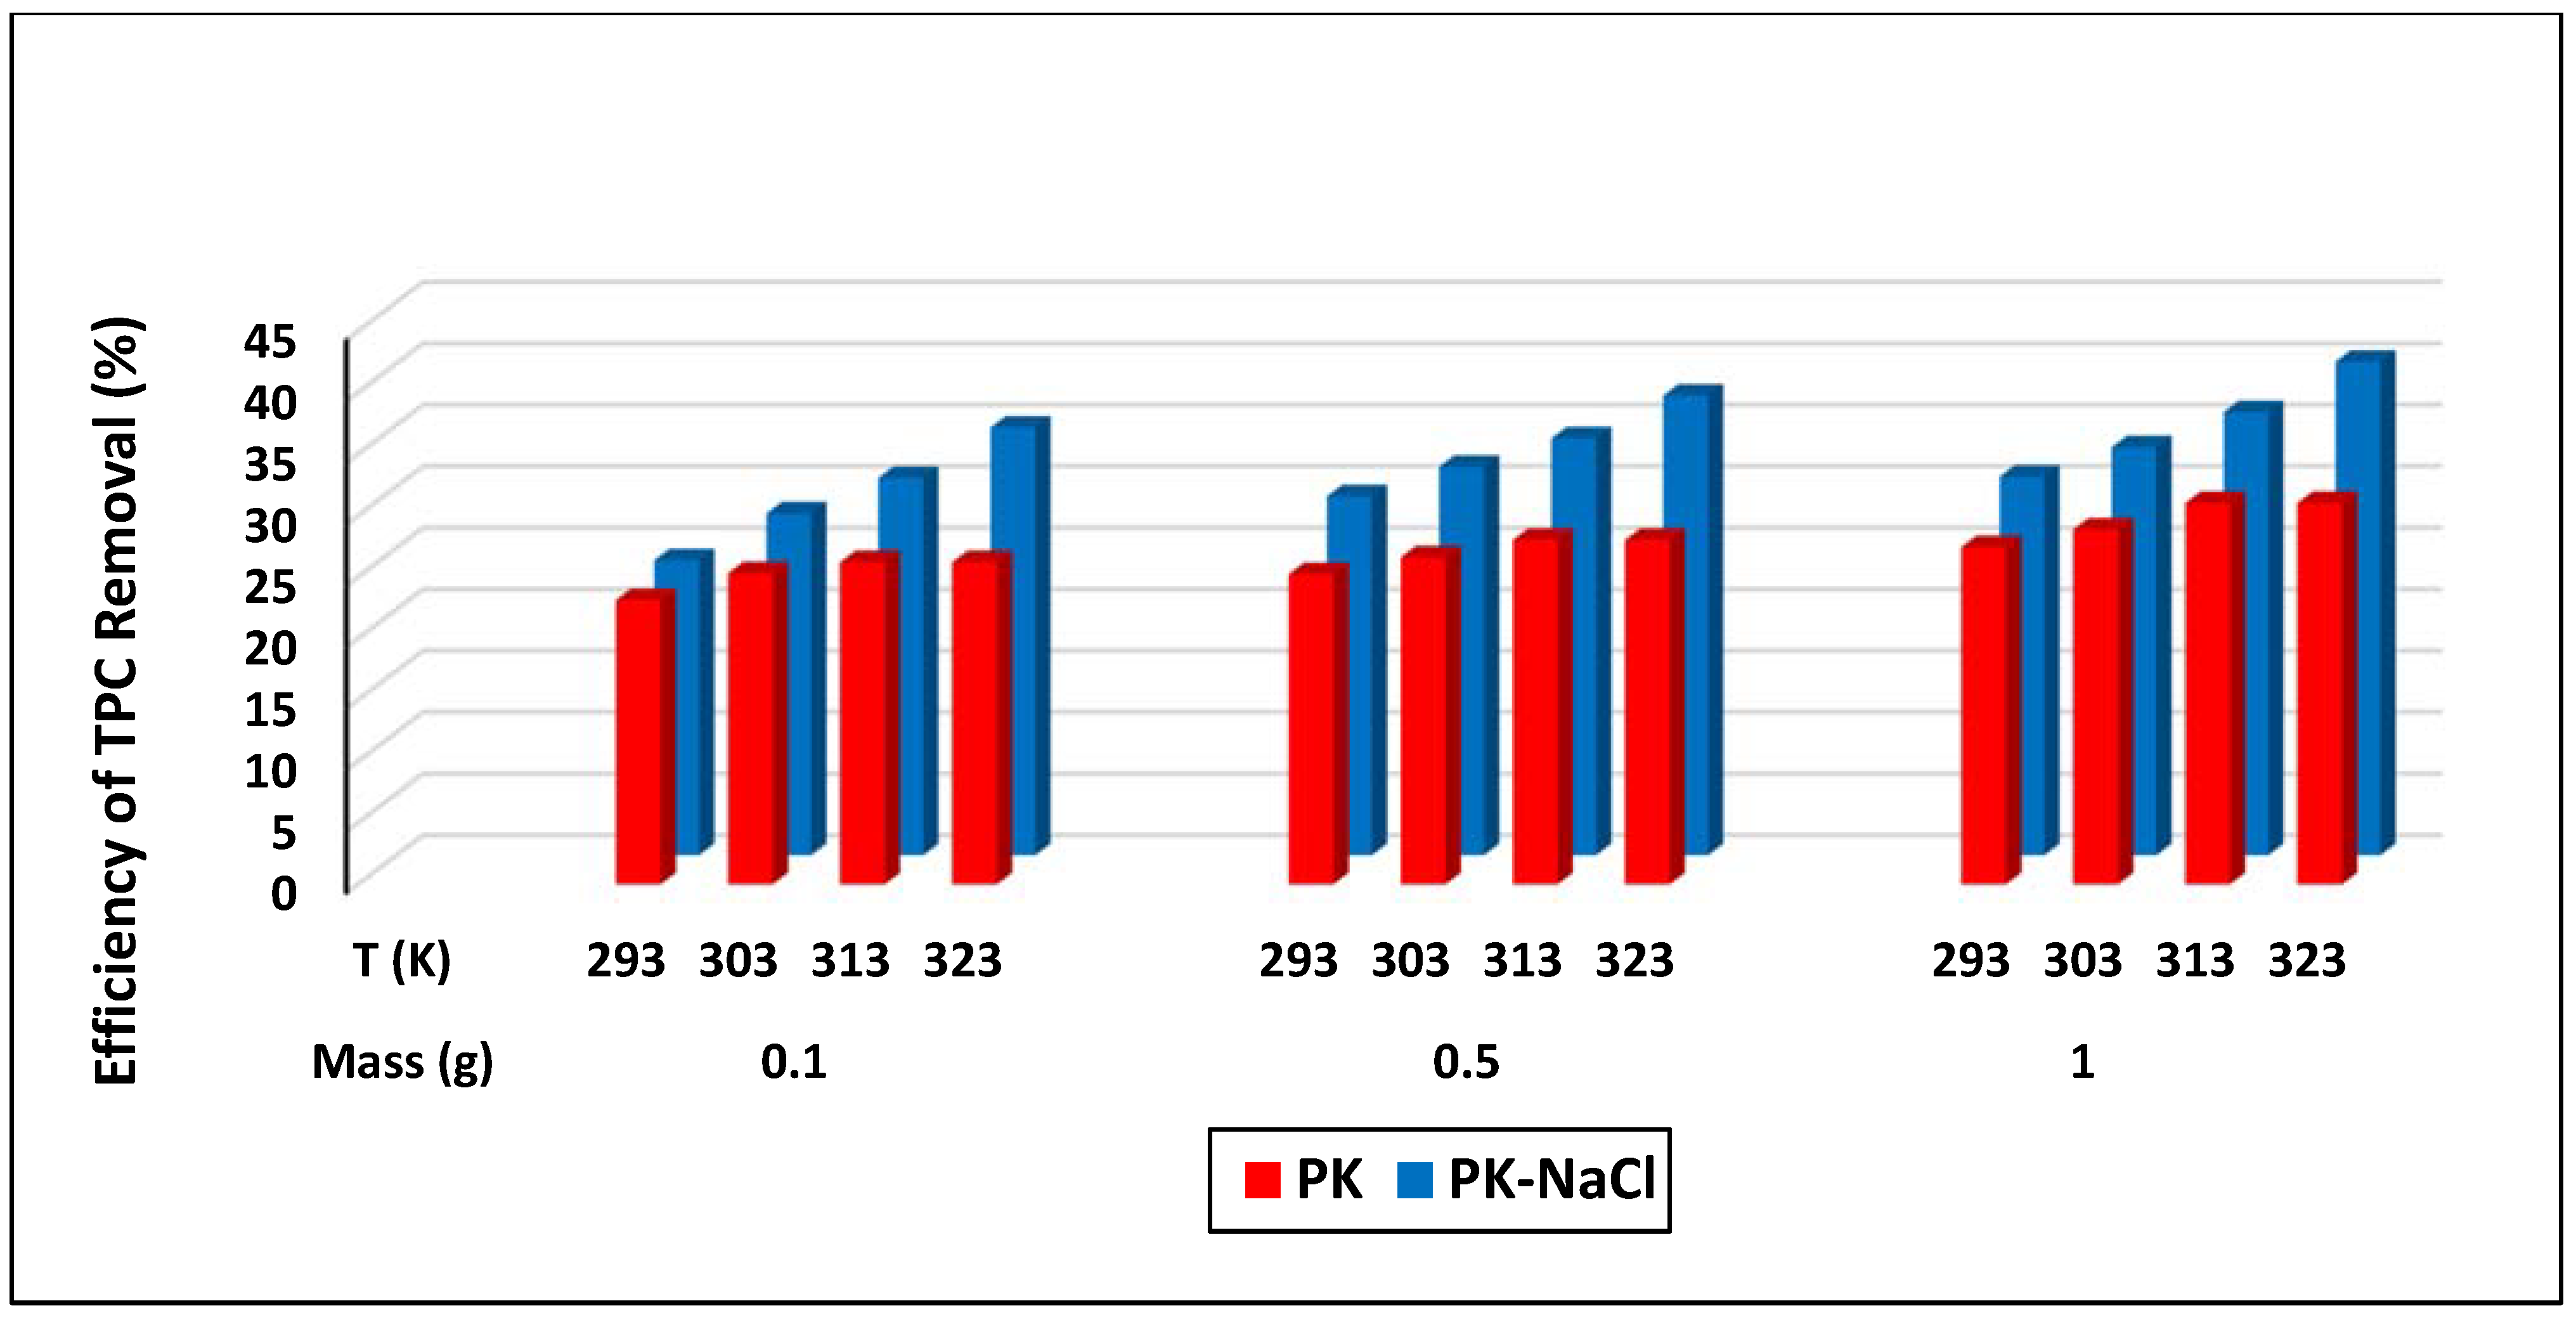
3.3.1. Effect of Adsorbent Dosage
3.3.2. Effect of Initial TPC Concentration
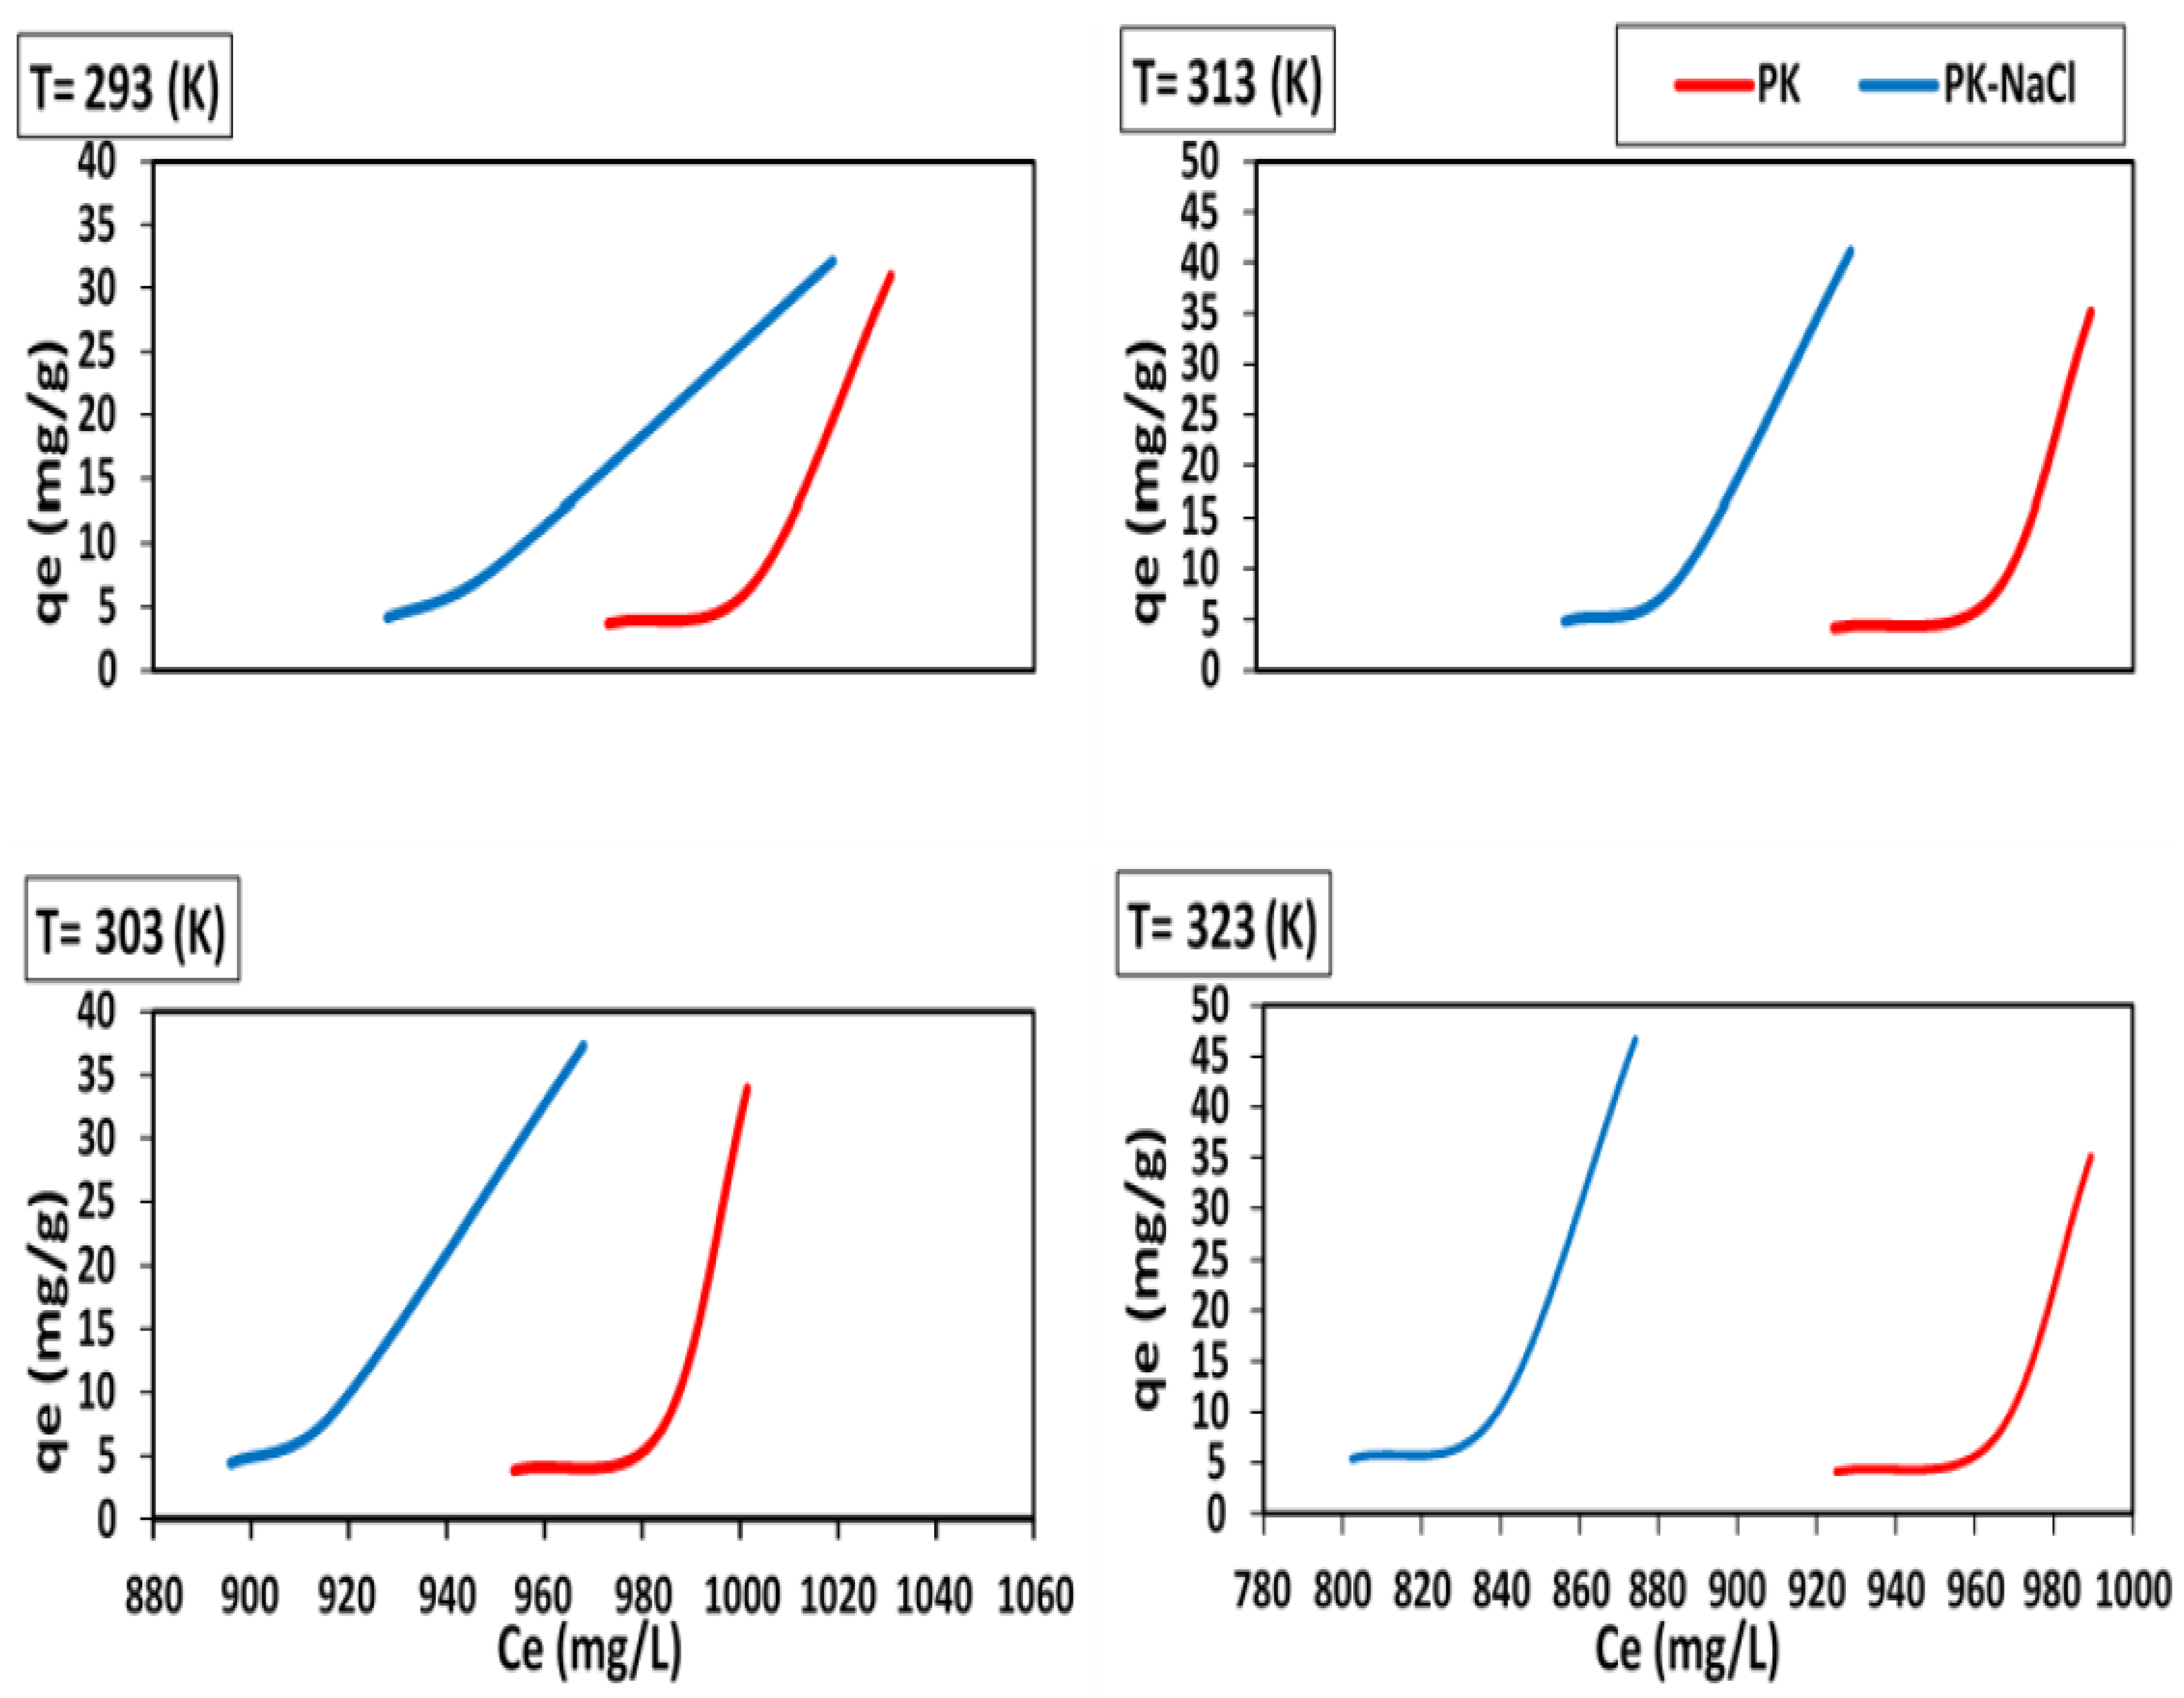
3.4. Adsorption Isotherm Studies
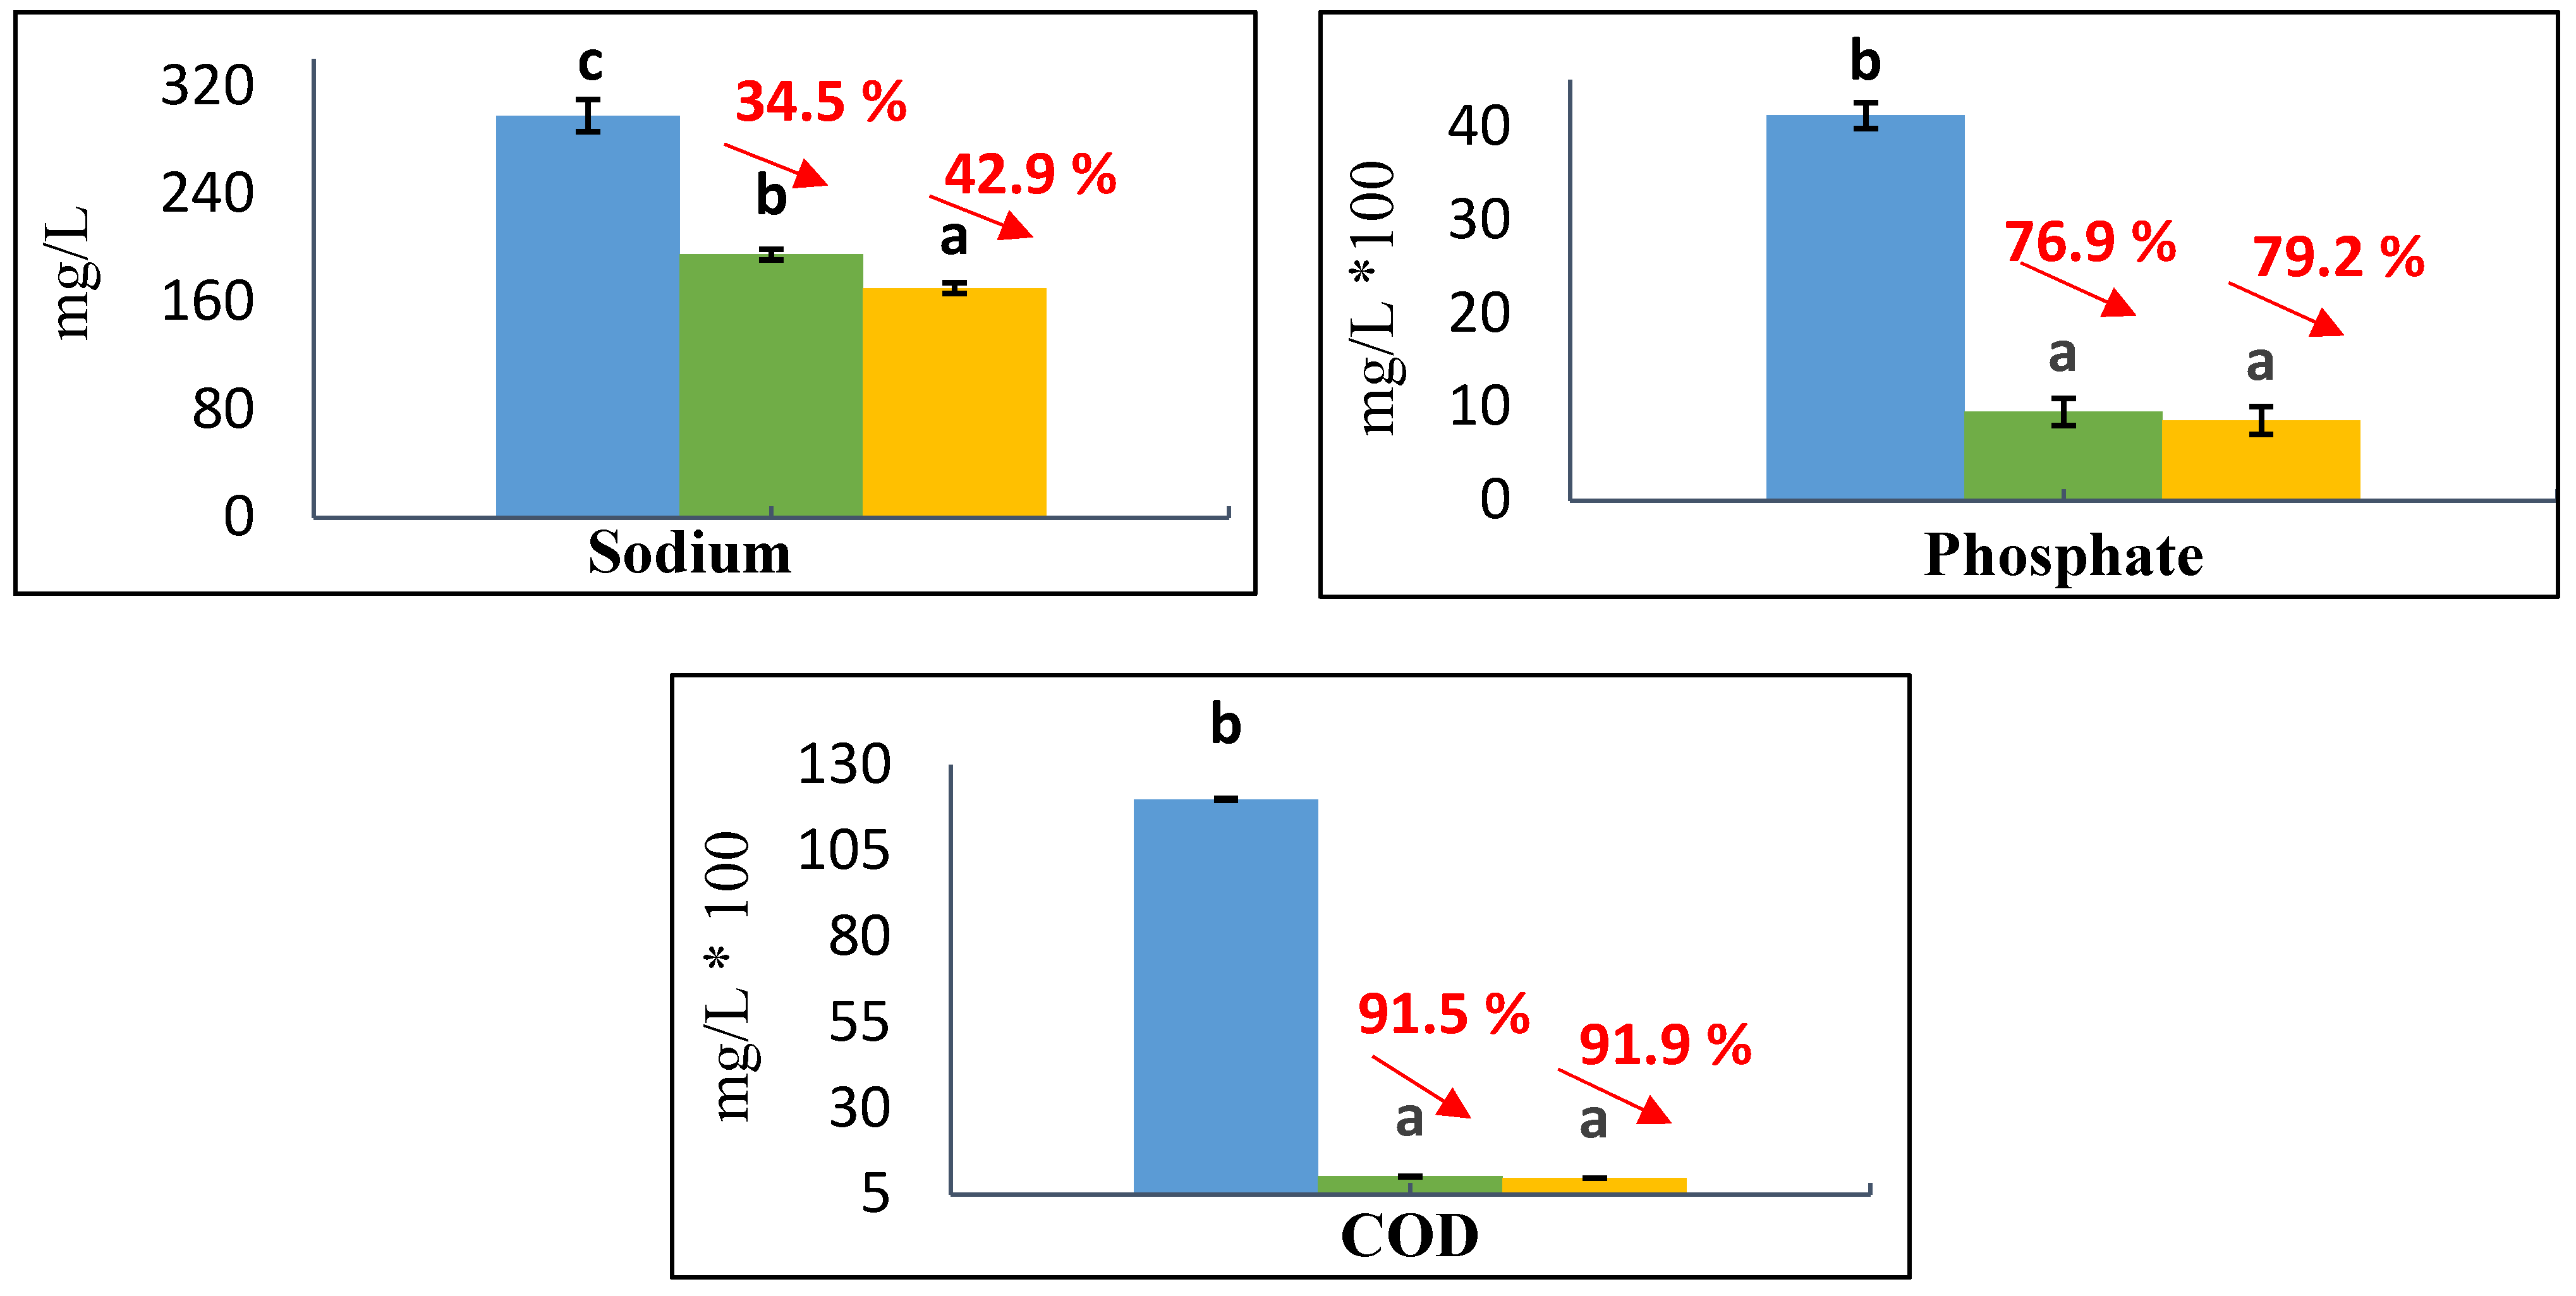
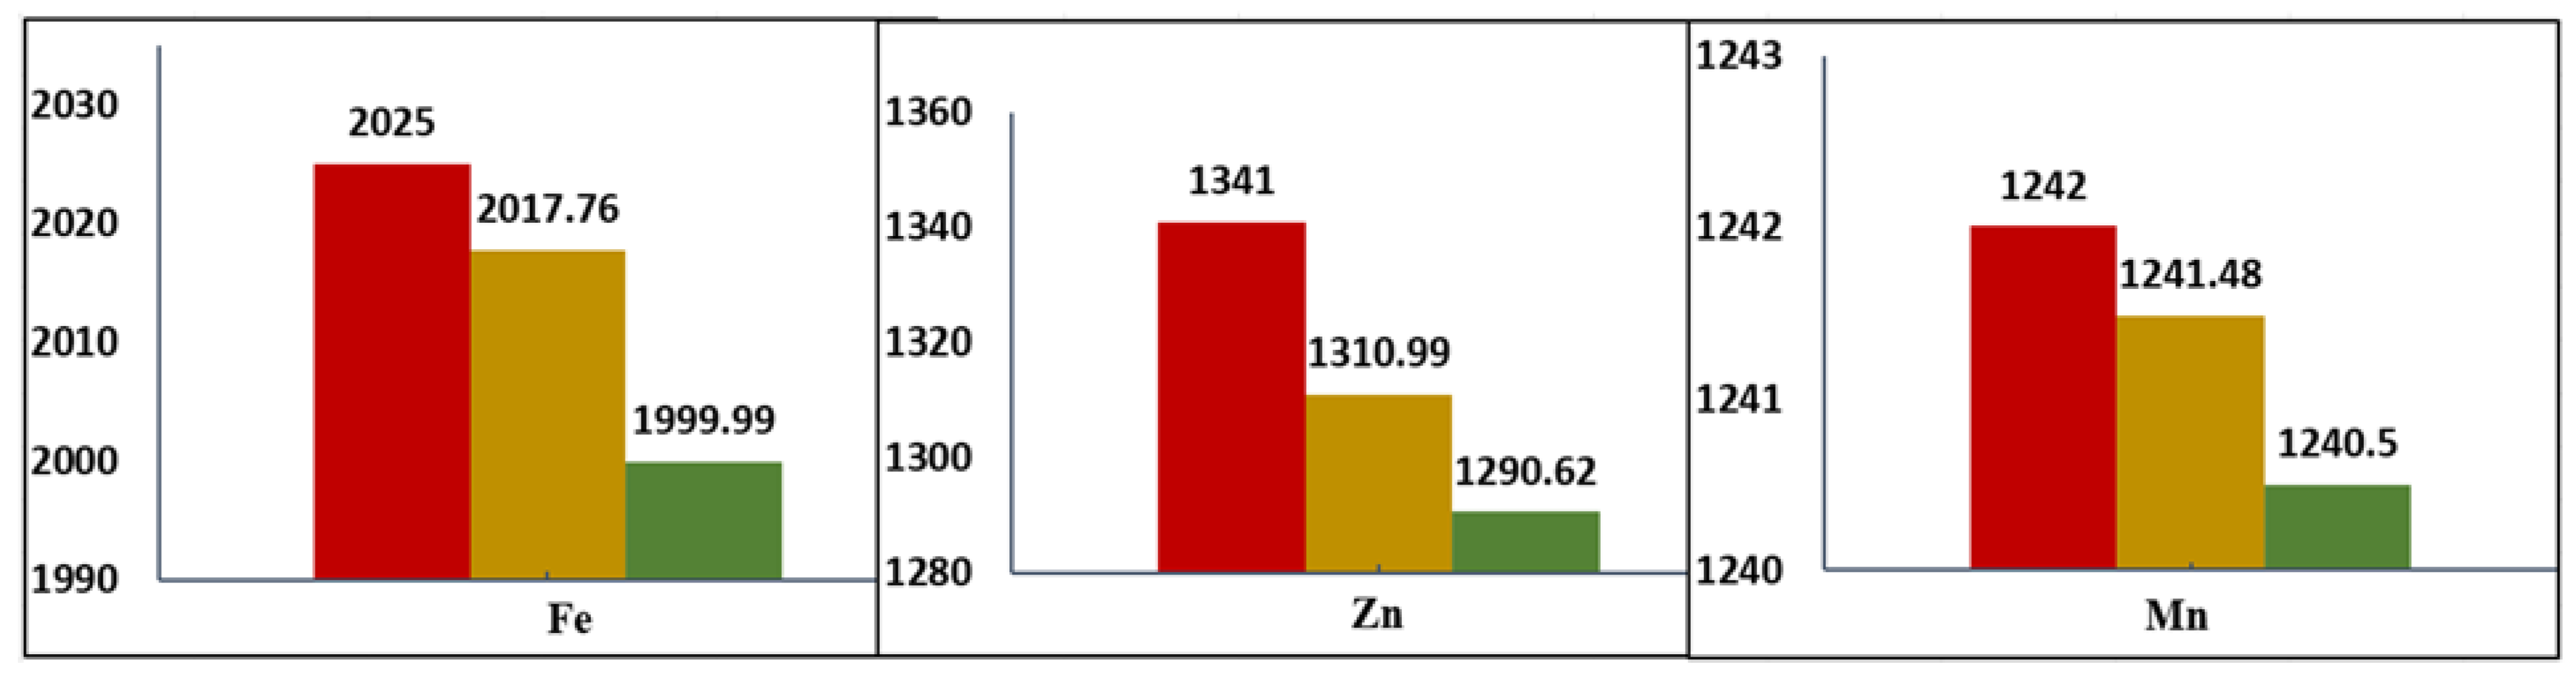
3.5. Heavy Metals Removal by Column Adsorption Experiments
4. Conclusions
Supplementary Materials
Author Contributions
Funding
Institutional Review Board Statement
Informed Consent Statement
Data Availability Statement
Acknowledgments
Conflicts of Interest
References
- Bougassa, R.; Tahri, L.; Nassri, I.; Fekhaoui, M. Organic pollutants removal from Olive Mill Wastewater using a new ecosystem treatment. Pollution 2023, 9, 984–993. [Google Scholar]
- El Moussaoui, T. Studies on the activated sludge process crucial parameters controlling olive mill wastewater treatment. Sci. Total Environ. 2022, 838, 156455. [Google Scholar] [CrossRef]
- Haddad, K.; Jeguirim, M.; Jerbi, B.; Chouchene, A.; Dutournié, P.; Thevenin, N.; Ruidavets, L.; Jellali, S.; Limousy, L. Olive mill wastewater: From a pollutant to green fuels, agricultural water source and biofertilizer. ACS Sustain. Chem. Eng. 2017, 5, 8988–8996. [Google Scholar] [CrossRef]
- Doula, M.K.; Moreno-Ortego, J.L.; Tinivella, F.; Inglezakis, V.J.; Sarris, A.; Komnitsas, K. Olive mill waste: Recent advances for the sustainable development of olive oil industry. In Olive Mill Waste; Academic Press: Cambridge, MA, USA, 2017; pp. 29–56. [Google Scholar]
- Bouhia, Y.; Hafidi, M.; Ouhdouch, Y.; Lyamlouli, K. Olive mill waste sludge: From permanent pollution to a highly beneficial organic biofertilizer: A critical review and future perspectives. Ecotoxicol. Environ. Saf. 2023, 259, 114997. [Google Scholar] [CrossRef]
- Prazeres, A.; Afonso, A.; Guerreiro, R.; Jerónimo, E. Contamination reduction of real olive oil mill wastewater using innovative acid and basic chemical precipitation processes. Int. J. Environ. Sci. Technol. 2021, 18, 799–808. [Google Scholar] [CrossRef]
- Tapia-Quirós, P.; Montenegro-Landívar, M.F.; Reig, M.; Vecino, X.; Saurina, J.; Granados, M.; Cortina, J. Integration of membrane processes for the recovery and separation of polyphenols from winery and olive mill wastes using green solvent-based processing. J. Environ. Manag. 2022, 307, 114555. [Google Scholar] [CrossRef]
- El-Khateeb, M.; Khedr, A.A. Valorization of olive mill wastewater using physical, chemical, and biological treatment. Desalination Water Treat. 2022, 280, 1–8. [Google Scholar] [CrossRef]
- Zagklis, D.P.; Papageorgiou, C.S.; Paraskeva, C.A. Technoeconomic analysis of the recovery of phenols from olive mill wastewater through membrane filtration and resin adsorption/desorption. Sustainability 2021, 13, 2376. [Google Scholar] [CrossRef]
- Agabo-García, C.; Repetto, G.; Albqmi, M.; Hodaifa, G. Evaluation of the olive mill wastewater treatment based on advanced oxidation processes (AOPs), flocculation, and filtration. J. Environ. Chem. Eng. 2023, 11, 109789. [Google Scholar] [CrossRef]
- Solomakou, N.; Goula, A.M. Treatment of olive mill wastewater by adsorption of phenolic compounds. Rev. Environ. Sci. Bio/Technol. 2021, 20, 839–863. [Google Scholar] [CrossRef]
- Jamrah, A.; Al-Zghoul, T.M.; Darwish, M.M. A comprehensive review of combined processes for olive mill wastewater treatments. Case Stud. Chem. Environ. Eng. 2023, 8, 100493. [Google Scholar] [CrossRef]
- Ponnuchamy, M.; Balasubramanian, S.; Kapoor, A.; Prabhakar, S. Natural materials as adsorbents for water purification. In Green Sustainable Process for Chemical and Environmental Engineering and Science; Inamuddin, T.A., Alrooqi, A., Eds.; Elsevier: Amsterdam, The Netherlands, 2023; pp. 123–144. [Google Scholar]
- Lissaneddine, A.; Pons, M.-N.; Aziz, F.; Ouazzani, N.; Mandi, L.; Mousset, E. Electro-sorption/-desorption with bio-sourced granular activated carbon electrode for phenols recovery and combination with advanced electro-oxidation for residual olive mill wastewater treatment. J. Water Process Eng. 2025, 69, 106663. [Google Scholar] [CrossRef]
- Cifuentes-Cabezas, M.; Sanchez-Arévalo, C.M.; Mendoza-Roca, J.A.; Vincent-Vela, M.C.; Álvarez-Blanco, S. Recovery of phenolic compounds from olive oil washing wastewater by adsorption/desorption process. Sep. Purif. Technol. 2022, 298, 121562. [Google Scholar] [CrossRef]
- Gao, W.; Zhao, S.; Wu, H.; Deligeer, W.; Asuha, S. Direct acid activation of kaolinite and its effects on the adsorption of methylene blue. Appl. Clay Sci. 2016, 126, 98–106. [Google Scholar] [CrossRef]
- Otunola, B.O.; Ololade, O.O. A review on the application of clay minerals as heavy metal adsorbents for remediation purposes. Environ. Technol. Innov. 2020, 18, 100692. [Google Scholar] [CrossRef]
- Adebowale, K.O.; Unuabonah, I.E.; Olu-Owolabi, B.I. The effect of some operating variables on the adsorption of lead and cadmium ions on kaolinite clay. J. Hazard. Mater. 2006, 134, 130–139. [Google Scholar] [CrossRef]
- Melo-López, A.; Veloz-Rodríguez, M.; Reyes-Cruz, V.; Urbano-Reyes, G.; Cobos-Murcia, J.; Legorreta-García, F. Electrochemical purification of kaolinitic for removing Fe and Ti oxides applying an ultrasonic pre-treatment. Appl. Clay Sci. 2018, 162, 461–468. [Google Scholar] [CrossRef]
- Cao, Z.; Wang, Q.; Cheng, H. Recent advances in kaolinite-based material for photocatalysts. Chin. Chem. Lett. 2021, 32, 2617–2628. [Google Scholar] [CrossRef]
- Mulushewa, Z.; Dinbore, W.T.; Ayele, Y. Removal of methylene blue from textile waste water using kaolin and zeolite-x synthesized from Ethiopian kaolin. Environ. Anal. Health Toxicol. 2021, 36, e2021007-0. [Google Scholar] [CrossRef]
- Motlagh, A.H.; Hosseinzadeh, M.; Hassanlourad, M.; Hamedsalman, M. Shear strength, adsorption, and microstructural behavior of sand-bentonite and sand-kaolinite mixtures contaminated with heavy metals. Arab. J. Geosci. 2023, 16, 425. [Google Scholar] [CrossRef]
- Gupta, S.S.; Bhattacharyya, K.G. Adsorption of heavy metals on kaolinite and montmorillonite: A review. Phys. Chem. Chem. Phys. 2012, 14, 6698–6723. [Google Scholar] [CrossRef] [PubMed]
- Al-Essa, K.; Khalili, F. Heavy metals adsorption from aqueous solutions onto unmodified and modified Jordanian kaolinite clay: Batch and column techniques. Am. J. Appl. Chem. 2018, 6, 25–34. [Google Scholar] [CrossRef]
- Al-Essa, K.; Khalili, F.I. Sorption of Pb (II) ions by kaolinite modified with humic acids. J. Environ. Sci. Eng. A 2016, 5, 416–431. [Google Scholar]
- Rasaki, S.A.; Bingxue, Z.; Guarecuco, R.; Thomas, T.; Minghui, Y. Geopolymer for use in heavy metals adsorption, and advanced oxidative processes: A critical review. J. Clean. Prod. 2019, 213, 42–58. [Google Scholar] [CrossRef]
- Osman, A.I.; El-Monaem, E.M.A.; Elgarahy, A.M.; Aniagor, C.O.; Hosny, M.; Farghali, M.; Rashad, E.; Ejimofor, M.I.; López-Maldonado, E.A.; Ihara, I. Methods to prepare biosorbents and magnetic sorbents for water treatment: A review. Environ. Chem. Lett. 2023, 21, 2337–2398. [Google Scholar] [CrossRef]
- Kim, J.-M.; Zhang, X.; Zhang, J.-G.; Manthiram, A.; Meng, Y.S.; Xu, W. A review on the stability and surface modification of layered transition-metal oxide cathodes. Mater. Today Proc. 2021, 46, 155–182. [Google Scholar] [CrossRef]
- Sultana, M.; Rownok, M.H.; Sabrin, M.; Rahaman, M.H.; Alam, S.N. A review on experimental chemically modified activated carbon to enhance dye and heavy metals adsorption. Clean. Eng. Technol. 2022, 6, 100382. [Google Scholar] [CrossRef]
- Chen, M.; Yang, T.; Han, J.; Zhang, Y.; Zhao, L.; Zhao, J.; Li, R.; Huang, Y.; Gu, Z.; Wu, J. The application of mineral kaolinite for environment decontamination: A review. Catalysts 2023, 13, 123. [Google Scholar] [CrossRef]
- Khairy, M.; Ayoub, H.A.; Rashwan, F.A.; Abdel-Hafez, H.F. Chemical modification of commercial kaolin for mitigation of organic pollutants in environment via adsorption and generation of inorganic pesticides. Appl. Clay Sci. 2018, 153, 124–133. [Google Scholar] [CrossRef]
- Qasem, N.A.; Mohammed, R.H.; Lawal, D.U. Removal of heavy metal ions from wastewater: A comprehensive and critical review. npj Clean Water 2021, 4, 36. [Google Scholar] [CrossRef]
- Siafu, S. Examining the Features of NaCl Activated Kaolinite Nano-layers for Use in Excipients. Bioceram. Dev. Appl. 2018, 8, 106. [Google Scholar]
- Al-Essa, K.; Al-Essa, E.M. Effective approach of activated Jordanian bentonite by sodium ions for total phenolic compounds removal from olive mill wastewater. J. Chem. 2021, 2021, 7405238. [Google Scholar] [CrossRef]
- Al-Essa, K. Activation of Jordanian bentonite by hydrochloric acid and its potential for olive mill wastewater enhanced treatment. J. Chem. 2018, 2018, 8385692. [Google Scholar] [CrossRef]
- Leouifoudi, I.; Zyad, A.; Amechrouq, A.; Oukerrou, M.A.; Mouse, H.A.; Mbarki, M. Identification and characterisation of phenolic compounds extracted from Moroccan olive mill wastewater. Food Sci. Technol. 2014, 34, 249–257. [Google Scholar] [CrossRef]
- Al-Musawi, T.J.; Almajidi, Y.Q.; Al-Essa, E.M.; Romero-Parra, R.M.; Alwaily, E.R.; Mengelizadeh, N.; Ganji, F.; Balarak, D. Levofloxacin Adsorption onto MWCNTs/CoFe2O4 Nanocomposites: Mechanism, and Modeling Using Non-Linear Kinetics and Isotherm Equations. Magnetochemistry 2023, 9, 9. [Google Scholar] [CrossRef]
- Ghosal, P.S.; Gupta, A.K. Determination of thermodynamic parameters from Langmuir isotherm constant-revisited. J. Mol. Liq. 2017, 225, 137–146. [Google Scholar] [CrossRef]
- Ahalya, N.; Kanamadi, R.; Ramachandra, T. Biosorption of chromium (VI) from aqueous solutions by the husk of Bengal gram (Cicer arientinum). Electron. J. Biotechnol. 2005, 8, 258–264. [Google Scholar] [CrossRef]
- Wang, J.; Guo, X. Adsorption isotherm models: Classification, physical meaning, application and solving method. Chemosphere 2020, 258, 127279. [Google Scholar] [CrossRef]
- Saikia, B.J.; Parthasarathy, G. Fourier transform infrared spectroscopic characterization of kaolinite from Assam and Meghalaya, Northeastern India. J. Mod. Phys. 2010, 1, 206–210. [Google Scholar] [CrossRef]
- Mahdavi, F.; Abdul, R.S.; Khanif, Y.M. Intercalation of urea into kaolinite for preparation of controlled release fertilizer. Chem. Ind. Chem. Eng. Q. 2014, 20, 207–213. [Google Scholar] [CrossRef]
- Tironi, A.; Trezza, M.; Irassar, E.; Scian, A. Thermal treatment of kaolin: Effect on the pozzolanic activity. Procedia Mater. Sci. 2012, 1, 343–350. [Google Scholar] [CrossRef]
- Madejová, J.; Kečkéš, J.; Pálková, H.; Komadel, P. Identification of components in smectite/kaolinite mixtures. Clay Miner. 2002, 37, 377–388. [Google Scholar] [CrossRef]
- Zhirong, L.; Uddin, M.A.; Zhanxue, S. FT-IR and XRD analysis of natural Na-bentonite and Cu (II)-loaded Na-bentonite. Spectrochim. Acta Part A Mol. Biomol. Spectrosc. 2011, 79, 1013–1016. [Google Scholar] [CrossRef]
- Vootukuru, J.R.; Kuntigorla, M.; Hemakumar, U.; Renigunta, P.; Nirlakalla, R.; Kummara, V.K. FTIR, Raman and XPS structural studies of bismuth modified phosphosilicate glasses for orange-red lighting sources. J. Solid State Sci. Technol. 2023, 12, 096004. [Google Scholar] [CrossRef]
- Mekhamer, W. Energy storage through adsorption and desorption of water vapour in raw Saudi bentonite. Arab. J. Chem. 2016, 9, S264–S268. [Google Scholar] [CrossRef]
- Lazorenko, G.; Kasprzhitskii, A.; Yavna, V. Synthesis and structural characterization of betaine-and imidazoline-based organoclays. Chem. Phys. Lett. 2018, 692, 264–270. [Google Scholar] [CrossRef]
- Gougazeh, M.; Buhl, J.-C. Synthesis and characterization of zeolite A by hydrothermal transformation of natural Jordanian kaolin. J. Assoc. Arab Univ. Basic Appl. Sci. 2014, 15, 35–42. [Google Scholar] [CrossRef]
- Shaban, M.; Sayed, M.I.; Shahien, M.G.; Abukhadra, M.R.; Ahmed, Z.M. Adsorption behavior of inorganic-and organic-modified kaolinite for Congo red dye from water, kinetic modeling, and equilibrium studies. J. Sol-Gel Sci. 2018, 87, 427–441. [Google Scholar] [CrossRef]
- Tian, L.; Abukhadra, M.R.; Mohamed, A.S.; Nadeem, A.; Ahmad, S.F.; Ibrahim, K.E. Insight into the loading and release properties of an exfoliated kaolinite/cellulose fiber (EXK/CF) composite as a carrier for oxaliplatin drug: Cytotoxicity and release kinetics. ACS Omega 2020, 5, 19165–19173. [Google Scholar] [CrossRef]
- Hiendro, A.; Hadary, F.; Rahmalia, W.; Wahyuni, N. Enhanced performance of bixin sensitized TiO2 solar cells with activated kaolinite. In Proceedings of the 2012 International Conference on Enabling Science and Nanotechnology, Johor Bahru, Malaysia, 5–7 January 2012. [Google Scholar]
- Sheikh, R.A. The Synthesis of Cementitious Compounds in Molten Salts. Ph.D. Thesis, UCL (University College London), London, UK, 2016. [Google Scholar]
- Izadifar, M.; Thissen, P.; Steudel, A.; Kleeberg, R.; Kaufhold, S.; Kaltenbach, J.; Schuhmann, R.; Dehn, F.; Emmerich, K. Comprehensive examination of dehydroxylation of kaolinite, disordered kaolinite, and dickite: Experimental studies and density functional theory. Clays Clay Miner. 2020, 68, 319–333. [Google Scholar] [CrossRef]
- Maged, A.; Kharbish, S.; Ismael, I.S.; Bhatnagar, A. Characterization of activated bentonite clay mineral and the mechanisms underlying its sorption for ciprofloxacin from aqueous solution. Environ. Sci. Pollut. Res. 2020, 27, 32980–32997. [Google Scholar] [CrossRef] [PubMed]
- Toor, M.; Jin, B.; Dai, S.; Vimonses, V. Activating natural bentonite as a cost-effective adsorbent for removal of Congo-red in wastewater. J. Ind. Eng. Chem. 2015, 21, 653–661. [Google Scholar] [CrossRef]
- Kumari, N.; Mohan, C. Basics of clay minerals and their characteristic properties. In Clay and Clay Minerals; IntechOpen: London, UK, 2021; Volume 24, pp. 1–29. [Google Scholar]
- Seppälä, A.; Puhakka, E.; Olin, M. Effect of layer charge on the crystalline swelling of Na+, K+ and Ca2+ montmorillonites: DFT and molecular dynamics studies. Clay Miner. 2016, 51, 197–211. [Google Scholar] [CrossRef]
- Zhang, L.; Lu, X.; Liu, X.; Zhou, J.; Zhou, H. Hydration and mobility of interlayer ions of (Na X, Ca Y)-montmorillonite: A molecular dynamics study. J. Phys. Chem. C 2014, 118, 29811–29821. [Google Scholar] [CrossRef]
- Liu, X.; Yang, S.; Gu, P.; Liu, S.; Yang, G. Adsorption and removal of metal ions by smectites nanoparticles: Mechanistic aspects, and impacts of charge location and edge structure. Appl. Clay Sci. 2021, 201, 105957. [Google Scholar] [CrossRef]
- Ahmed Khan, R.; Murtaza, M.; Abdulraheem, A.; Kamal, M.S.; Mahmoud, M. Imidazolium-based ionic liquids as clay swelling inhibitors: Mechanism, performance evaluation, and effect of different anions. ACS Omega 2020, 5, 26682–26696. [Google Scholar] [CrossRef]
- Al Bsoul, A.; Hailat, M.; Abdelhay, A.; Tawalbeh, M.; Jum’h, I.; Bani-Melhem, K. Treatment of olive mill effluent by adsorption on titanium oxide nanoparticles. Sci. Total Environ. 2019, 688, 1327–1334. [Google Scholar] [CrossRef]
- Al-Hmoud, L.; Al-Saida, B.; Sandouqa, A. Olive mill wastewater treatment: A recent review. Jordanian J. Eng. Chem. Ind. 2020, 3, 91–106. [Google Scholar]
- Azzam, M.O.; Al-Gharabli, S.I.; Al-Harahsheh, M.S. Olive mills wastewater treatment using local natural Jordanian clay. Desalination Water Treat. 2015, 53, 627–636. [Google Scholar] [CrossRef]
- Qiu, B.; Shao, Q.; Shi, J.; Yang, C.; Chu, H. Application of biochar for the adsorption of organic pollutants from wastewater: Modification strategies, mechanisms and challenges. Sep. Purif. Technol. 2022, 300, 121925. [Google Scholar] [CrossRef]
- Tang, L.; Li, X.; Feng, H.; Ma, C.; Chang, Q.; Zhang, J. Infiltration of salt solutions through illite particles: Effect of nanochannel size and cation type. Colloids Surf. A Physicochem. Eng. Asp. 2022, 641, 128581. [Google Scholar] [CrossRef]
- Dehmani, Y.; Dridi, D.; Lamhasni, T.; Abouarnadasse, S.; Chtourou, R.; Lima, E.C. Review of phenol adsorption on transition metal oxides and other adsorbents. J. Water Process Eng. 2022, 49, 102965. [Google Scholar] [CrossRef]
- Hussien Hamad, M.T.M. Optimization study of the adsorption of malachite green removal by MgO nano-composite, nano-bentonite and fungal immobilization on active carbon using response surface methodology and kinetic study. Environ. Sci. Eur. 2023, 35, 26. [Google Scholar] [CrossRef]
- Gul, S.; Ahmad, Z.; Asma, M.; Ahmad, M.; Rehan, K.; Munir, M.; Bazmi, A.A.; Ali, H.M.; Mazroua, Y.; Salem, M.A. Effective adsorption of cadmium and lead using SO3H-functionalized Zr-MOFs in aqueous medium. Chemosphere 2022, 307, 135633. [Google Scholar] [CrossRef]
- Georgin, J.; Franco, D.S.; da Boit Martinello, K.; Lima, E.C.; Silva, L.F. A review of the toxicology presence and removal of ketoprofen through adsorption technology. J. Environ. Chem. Eng. 2022, 10, 107798. [Google Scholar] [CrossRef]
- Chen, X.; Hossain, M.F.; Duan, C.; Lu, J.; Tsang, Y.F.; Islam, M.S.; Zhou, Y. Isotherm models for adsorption of heavy metals from water-A review. Chemosphere 2022, 307, 135545. [Google Scholar] [CrossRef]
- Liu, S.; Huang, J.; Zhang, W.; Shi, L.; Yi, K.; Zhang, C.; Pang, H.; Li, J.; Li, S. Investigation of the adsorption behavior of Pb (II) onto natural-aged microplastics as affected by salt ions. J. Hazard. Mater. 2022, 431, 128643. [Google Scholar] [CrossRef]
- Stenina, I.A.; Yaroslavtsev, A.B. Ionic mobility in ion-exchange membranes. Membranes 2021, 11, 198. [Google Scholar] [CrossRef]
- Guo, R.; Liu, L.; Huang, Y.; Lv, M.; Zhu, Y.; Wang, Z.; Zhu, X.; Sun, B. Effect of Na+ and Ca2+ on the texture, structure and microstructure of composite protein gel of mung bean protein and wheat gluten. Food Res. Int. 2023, 172, 113124. [Google Scholar] [CrossRef]
- Kwak, J.-H.; Islam, M.S.; Wang, S.; Messele, S.A.; Naeth, M.A.; El-Din, M.G.; Chang, S.X. Biochar properties and lead (II) adsorption capacity depend on feedstock type, pyrolysis temperature, and steam activation. Chemosphere 2019, 231, 393–404. [Google Scholar] [CrossRef]
- Xu, D.; Cao, J.; Li, Y.; Howard, A.; Yu, K. Effect of pyrolysis temperature on characteristics of biochars derived from different feedstocks: A case study on ammonium adsorption capacity. Waste Manag. 2019, 87, 652–660. [Google Scholar] [CrossRef] [PubMed]
- Stefaniu, C.; Brezesinski, G.; Möhwald, H. Langmuir monolayers as models to study processes at membrane surfaces. Adv. Colloid Interface Sci. 2014, 208, 197–213. [Google Scholar] [CrossRef] [PubMed]
- Ragadhita, R.; Nandiyanto, A.B.D. How to calculate adsorption isotherms of particles using two-parameter monolayer adsorption models and equations. Indones. J. Sci. Technol. 2021, 6, 205–234. [Google Scholar] [CrossRef]
- Amro, A.; Al-Essa, K.; Al-Essa, E.M.; Alakhras, A.; Habib, M.; Odeh, T. A study on the Ability of Processed Squeezed Bitter Almond for the Removal of Cadmium Ions from Contaminated Water. Desalination Water Treat. 2022, 276, 133–141. [Google Scholar] [CrossRef]
- Oliveira, A.M.d.; Milhomeb, M.A.L.; Carvalho, T.V.; Cavalcante, R.M.; Nascimento, R.F.d. Use of low-cost adsorbents to chlorophenols and organic matter removal of petrochemical wastewater. Orbital Electron. J. Chem. 2013, 5, 171–178. [Google Scholar]
- Chen, Y.-g.; Ye, W.-m.; Zhang, K.-n. Factors affecting phenol adsorption on clay-solidified grouting curtain. J. Cent. South Univ. 2011, 18, 854–858. [Google Scholar] [CrossRef]
- Arabi, M.; Elias, A.; Younes, Y.A.; Kamel, Z.; Toumert, I.; Mansouri, B. Study of the Sorption of the Total Phenolic Compounds from Olive Mill Wastewater by Natural Soils: Conventional and Under Microwave Irradiation Kinetics. 2021. Available online: https://www.researchsquare.com/article/rs-1004270/v1 (accessed on 29 November 2021).
- Alkaram, U.F.; Mukhlis, A.A.; Al-Dujaili, A.H. The removal of phenol from aqueous solutions by adsorption using surfactant-modified bentonite and kaolinite. J. Hazard. Mater. 2009, 169, 324–332. [Google Scholar] [CrossRef]
- Raggam, S.; Mohammad, M.; Choo, Y.; Naidu, G.; Zargar, M.; Shon, H.K.; Razmjou, A. Advances in metal organic framework (MOF)–Based membranes and adsorbents for lithium-ion extraction. Sep. Purif. Technol. 2023, 307, 122628. [Google Scholar] [CrossRef]
- DuChanois, R.M.; Porter, C.J.; Violet, C.; Verduzco, R.; Elimelech, M. Membrane materials for selective ion separations at the water–energy nexus. Adv. Mater. 2021, 33, 2101312. [Google Scholar] [CrossRef]
- Tang, Y.; Qiao, H.; Chen, X.; Huang, Z.; Qi, X. Performance optimization for multicolor electrochromic devices: Morphology and composition regulation of inorganic electrochromic materials and selectivity of Ions. Adv. Mater. Technol. 2024, 9, 2302139. [Google Scholar] [CrossRef]
- Taha, M.F.; Kiat, C.F.; Shaharun, M.S.; Ramli, A. Removal of Ni (II), Zn (II) and Pb (II) ions from single metal aqueous solution using activated carbon prepared from rice husk. World Acad. Sci. Eng. Technol. 2011, 5, 1473–1478. [Google Scholar]
- Adekola, F.; Hodonou, D.; Adegoke, H. Thermodynamic and kinetic studies of biosorption of iron and manganese from aqueous medium using rice husk ash. Appl. Water Sci. 2016, 6, 319–330. [Google Scholar] [CrossRef]
- Pfeifer, A.; Škerget, M.; Čolnik, M. Removal of iron, copper, and lead from aqueous solutions with zeolite, bentonite, and steel slag. Sep. Sci. Technol. 2021, 56, 2989–3000. [Google Scholar] [CrossRef]
- Al-Ma’abreh, A.M.; Hmedat, D.A.; Edris, G.; Hamed, M.A. Removal of heavy metal ions (Pb2+, Co2+, and Cd2+) by activated carbon from cypress fruit: An investigation of kinetics, thermodynamics, and isotherms. J. Chem. 2024, 2024, 1984821. [Google Scholar] [CrossRef]
- Khater, D.; Alkhabbas, M.; Al-Ma’abreh, A.M. Adsorption of Pb, Cu, and Ni ions on activated carbon prepared from oak cupules: Kinetics and thermodynamics studies. Molecules 2024, 29, 2489. [Google Scholar] [CrossRef]
- Al-Ma’abreh, A.M.; AlKhabbas, M.; Alawaideh, S.; Hussein-Al-Ali, S.H.; Hmedat, D.A.; Edris, G.; Abuassaf, R.A.; Hamed, M.A. Investigation of kinetics, thermodynamics, and isotherms of the simultaneous removal of heavy metal ions by activated carbon from cypress fruit. Adsorpt. Sci. Technol. 2024, 42, 02636174241256853. [Google Scholar] [CrossRef]


| Wavenumber (cm−1) | Functional Groups | Kaolinite Adsorbents | References |
|---|---|---|---|
| 2360 | Quartz | PK | [45] |
| 1637–1683 | Both CO stretching and NH2 bending motions | PK and PK-NaCl | [42] |
| 1032–1110 | Si-O stretching | PK and PK-NaCl | [46] |
| 912–913 | OH deformation, linked to 2Al+3 | PK and PK-NaCl | [43] |
| 798–794 | OH deformation, linked to Al+3, Mg+2, quartz | PK and PK-NaCl | [47] |
| 694–695 | Si-O quartz | PK and PK-NaCl | [48] |
| 537 | Fe-O, Fe2O3 Si-O-Al stretching | PK | [44] |
| 428–430 | Si-O-Si bending | PK and PK-NaCl | [41] |
| Adsorbent Type | Surface Area (m2/g) |
|---|---|
| PK | 38.3 |
| PK-NaCl | 131.1 |
| Parameters | OMW Analysis | Literature Ranges Values |
|---|---|---|
| Potassium, mg/L | 6366.3 | 639–10,800 |
| Phosphate, mg/L | 4120 | 31.8–1820 |
| Sodium, mg/L | 297.9 | 200–570 |
| Alkalinity, mg/L | 2000 | 3150–9070 |
| Nitrate, mg/L | 360 | 350–390 |
| Total Chlorine, mg/L | 20 | 33.3–142.7 |
| TPC, g GAE/L | 1.34 | 0.26–10.7 |
| COD, mg/L | 12,000 | 1900–220,000 |
| TDS, mg/L | 34,700 | 5900–103,200 |
| Isotherm Model | Adsorbent | Isotherm Constant | Temperature (K) | |||
|---|---|---|---|---|---|---|
| 293 | 303 | 313 | 323 | |||
| Langmuir Isotherm | PK-NaCl | RL | 0.1282 | 0.1123 | 0.0976 | 0.0754 |
| PK | 0.1220 | 0.1067 | 0.0969 | 0.0750 | ||
| PK-NaCl | KL | 0.0051 | 0.0059 | 0.0069 | 0.0090 | |
| PK | 0.0054 | 0.0062 | 0.0070 | 0.0091 | ||
| PK-NaCl | qm | 7.8168 | 8.0201 | 8.0640 | 8.8828 | |
| PK | 7.7503 | 7.9575 | 8.0262 | 8.8121 | ||
| Freundlich Isotherm | PK-NaCl | n | 4.9567 | 5.4151 | 5.9680 | 6.7648 |
| PK | 4.8481 | 5.2958 | 5.9404 | 6.7248 | ||
| PK-NaCl | KF | 1.6290 | 1.9271 | 2.2222 | 2.8905 | |
| PK | 1.5774 | 1.8710 | 2.2167 | 2.8059 | ||
| Natural Adsorbent | Adsorption Capacity q (mg/g) | Reference |
|---|---|---|
| Chitosan | 6.00 | [80] |
| Clay-solidified grouting curtain | 8.4 | [81] |
| Natural soil N1 | 2.67 | [82] |
| Natural soil N3 | 2.49 | [82] |
| Natural soil R | 1.66 | [82] |
| Bentonite | 0.25 | [83] |
| Kaolinite | 0.47 | [83] |
| HDTMA-kaolinite | 2.35 | [83] |
| PTMA-kaolinite | 0.68 | [83] |
| PK-NaCl | 8.88 | Present study |
| Adsorbent (Heavy Metal Ion) | % Uptake | Reference |
|---|---|---|
| RHAC4 (Zn(II)) | 84.6 | [87] |
| RHAC6 (Zn(II)) | 86.0 | [87] |
| Ash-RH (rice husk ash) (Fe(II)) | 72.0 | [88] |
| Bentonite (Fe(II)) | 98.2 | [89] |
| Zeolite (Fe(II)) | 96.1 | [89] |
| FHA-Kaolinite (Zn(II)) | 19.0 | [24] |
| FHA-Kaolinite (Cd(II)) | 52.0 | [24] |
| FHA-Kaolinite (Pb(II)) | 55.0 | [24] |
| KTD-Kaolinite (Zn(II)) | 6.0 | [24] |
| KTD-Kaolinite (Cd(II)) | 28.0 | [24] |
| KTD-Kaolinite (Pb(II)) | 59.0 | [24] |
| ACC (Pb(II)) | 96.12 | [90] |
| ACC (Cd(II)) | 80.11 | [90] |
| Oak-AC (Pb(II)) | 98 | [91] |
| AC-C (Cd(II)) | 76.45 | [92] |
| PK-NaCl (Zn(II)) | 99.9 | Present Study |
| PK-NaCl (Mn(II)) | 99.9 | Present Study |
Disclaimer/Publisher’s Note: The statements, opinions and data contained in all publications are solely those of the individual author(s) and contributor(s) and not of MDPI and/or the editor(s). MDPI and/or the editor(s) disclaim responsibility for any injury to people or property resulting from any ideas, methods, instructions or products referred to in the content. |
© 2025 by the authors. Licensee MDPI, Basel, Switzerland. This article is an open access article distributed under the terms and conditions of the Creative Commons Attribution (CC BY) license (https://creativecommons.org/licenses/by/4.0/).
Share and Cite
Al-Essa, E.M.; Al-Essa, K.; Halalsheh, N.; Lagum, A.A.; Al-Ma’abreh, A.M.; Saraireh, H.; Shatnawi, K. Removal of Total Phenolic Compounds and Heavy Metal Ions from Olive Mill Wastewater Using Sodium-Activated Jordanian Kaolinite. Sustainability 2025, 17, 4627. https://doi.org/10.3390/su17104627
Al-Essa EM, Al-Essa K, Halalsheh N, Lagum AA, Al-Ma’abreh AM, Saraireh H, Shatnawi K. Removal of Total Phenolic Compounds and Heavy Metal Ions from Olive Mill Wastewater Using Sodium-Activated Jordanian Kaolinite. Sustainability. 2025; 17(10):4627. https://doi.org/10.3390/su17104627
Chicago/Turabian StyleAl-Essa, Ethar M., Khansaa Al-Essa, Neda Halalsheh, Abdelmajeed Adam Lagum, Alaa M. Al-Ma’abreh, Hussein Saraireh, and Khaldoun Shatnawi. 2025. "Removal of Total Phenolic Compounds and Heavy Metal Ions from Olive Mill Wastewater Using Sodium-Activated Jordanian Kaolinite" Sustainability 17, no. 10: 4627. https://doi.org/10.3390/su17104627
APA StyleAl-Essa, E. M., Al-Essa, K., Halalsheh, N., Lagum, A. A., Al-Ma’abreh, A. M., Saraireh, H., & Shatnawi, K. (2025). Removal of Total Phenolic Compounds and Heavy Metal Ions from Olive Mill Wastewater Using Sodium-Activated Jordanian Kaolinite. Sustainability, 17(10), 4627. https://doi.org/10.3390/su17104627