
Toward Sustainable Electricity Markets: Merit-Order Dynamics on Photovoltaic Energy Price Duck Curve and Emissions Displacement


Abstract
1. Introduction
1.1. Background
1.2. Aim of the Study
- How do historical pricing regimes in Alberta’s electricity market influence the extent of PV price cannibalization?
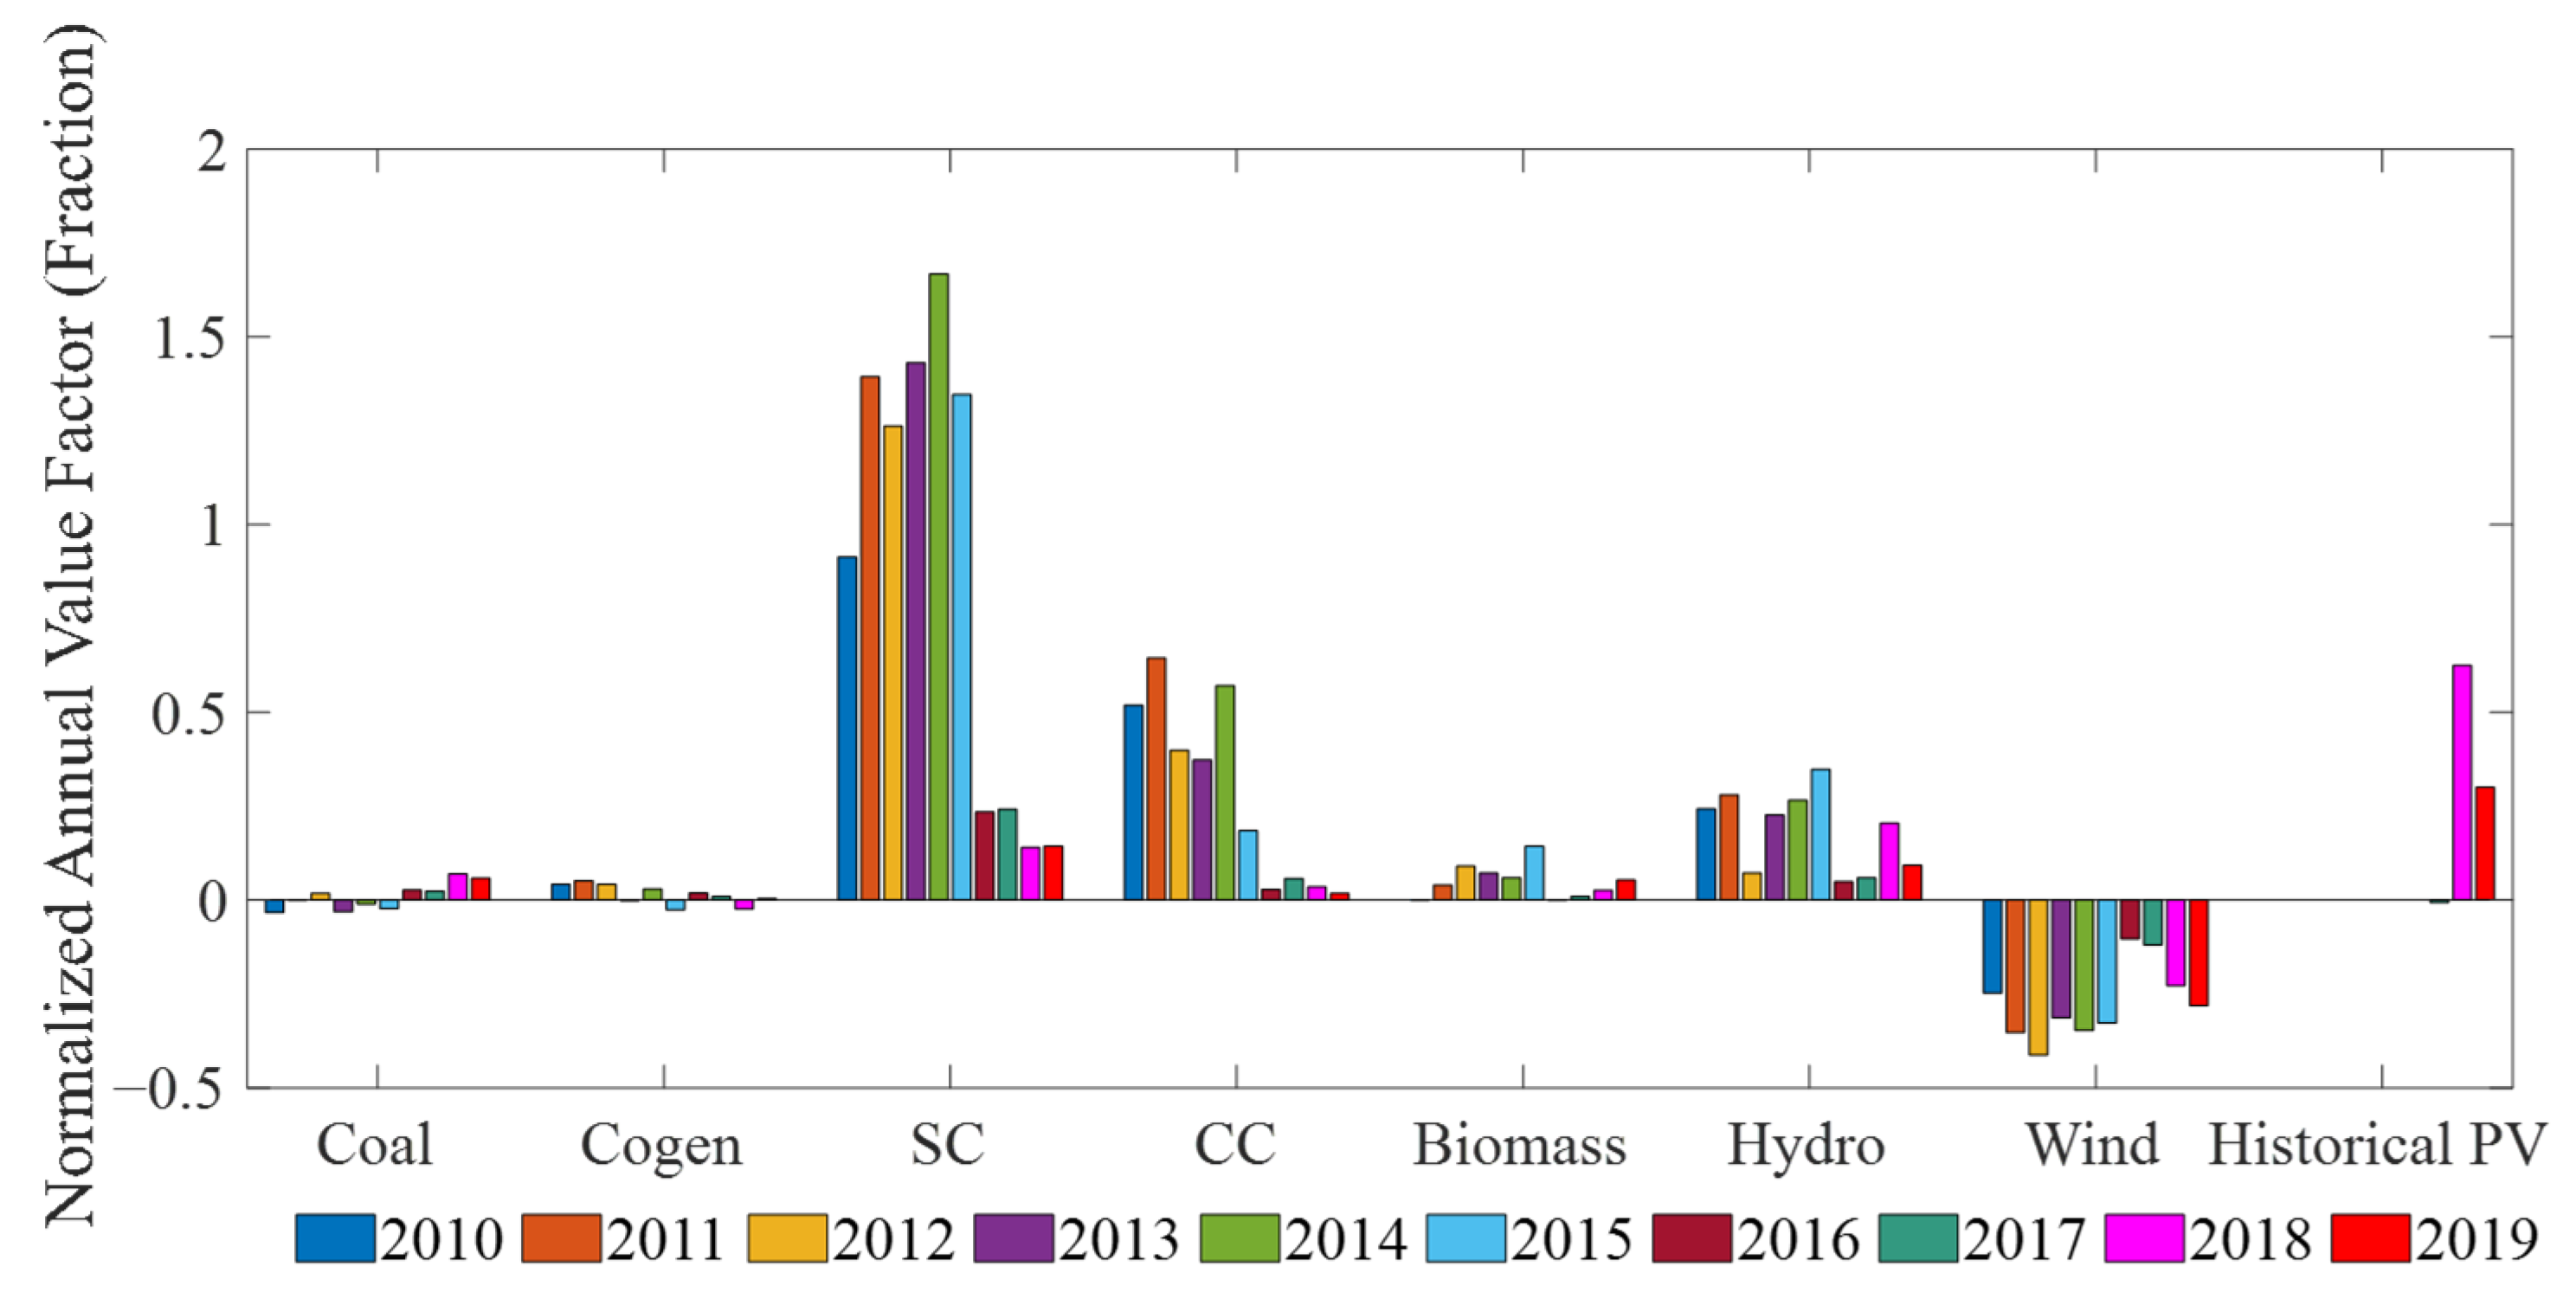
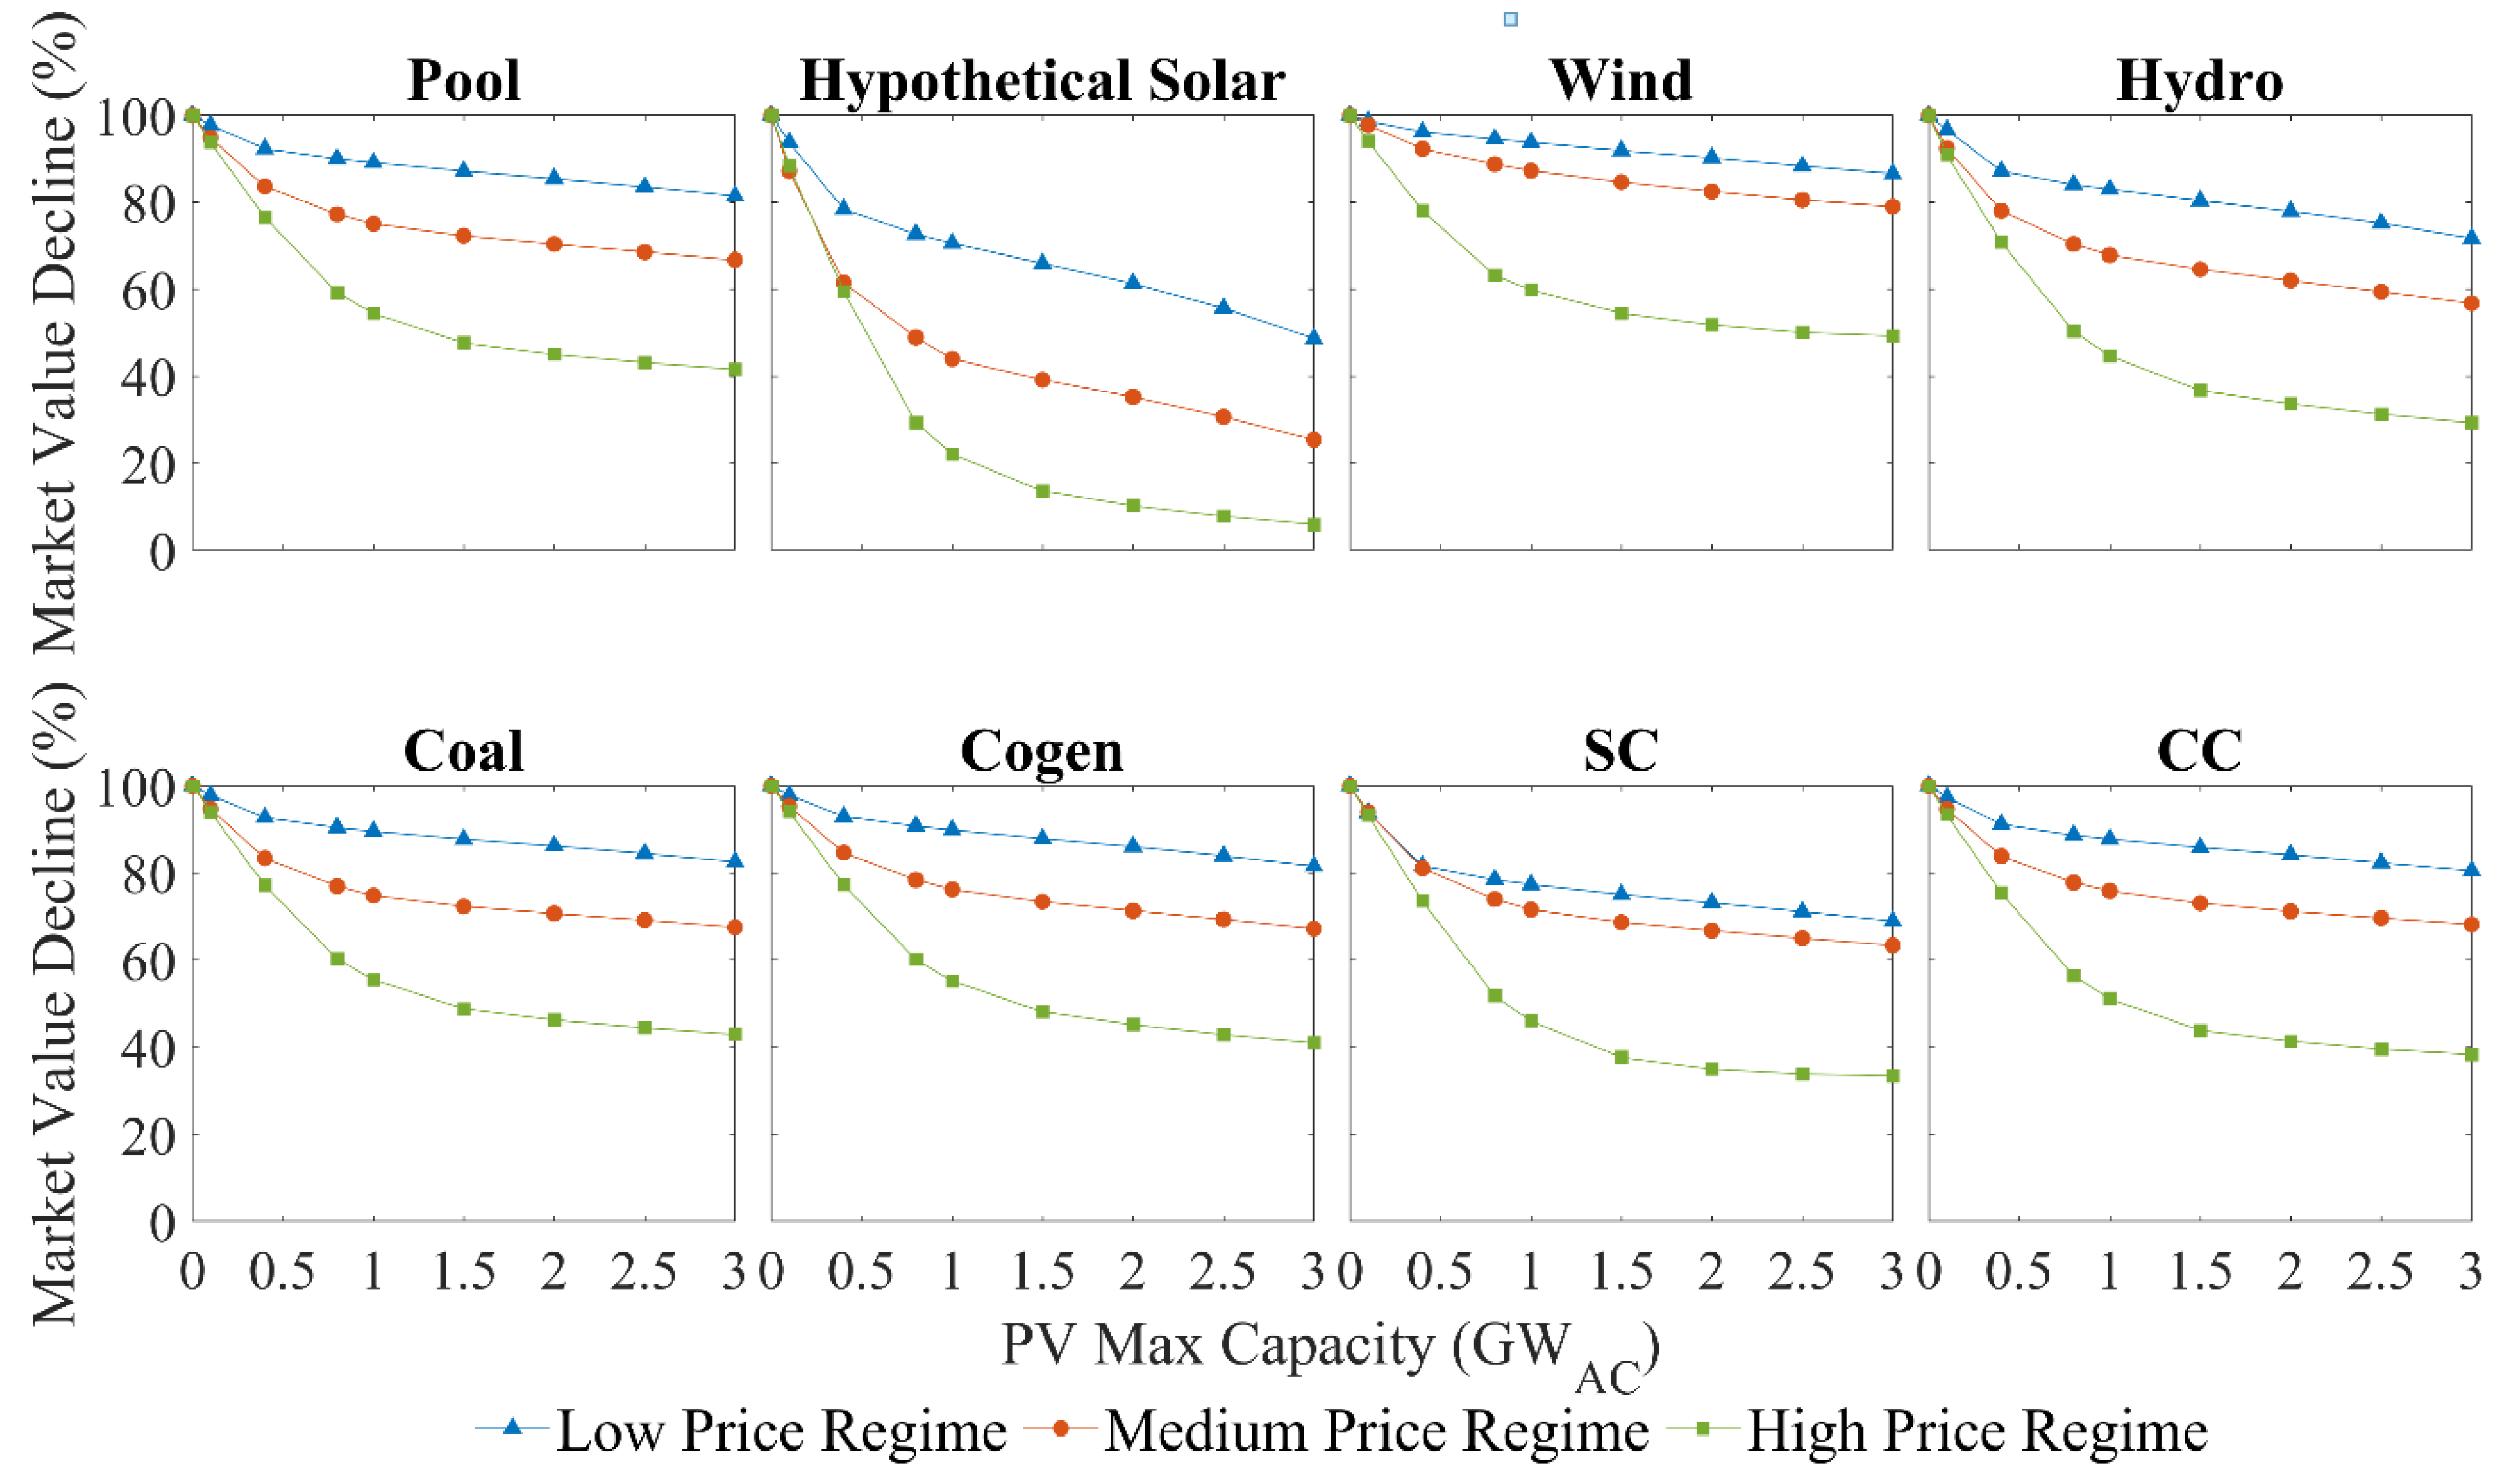
- What is the impact of increasing PV penetration on the market value of different generation technologies?
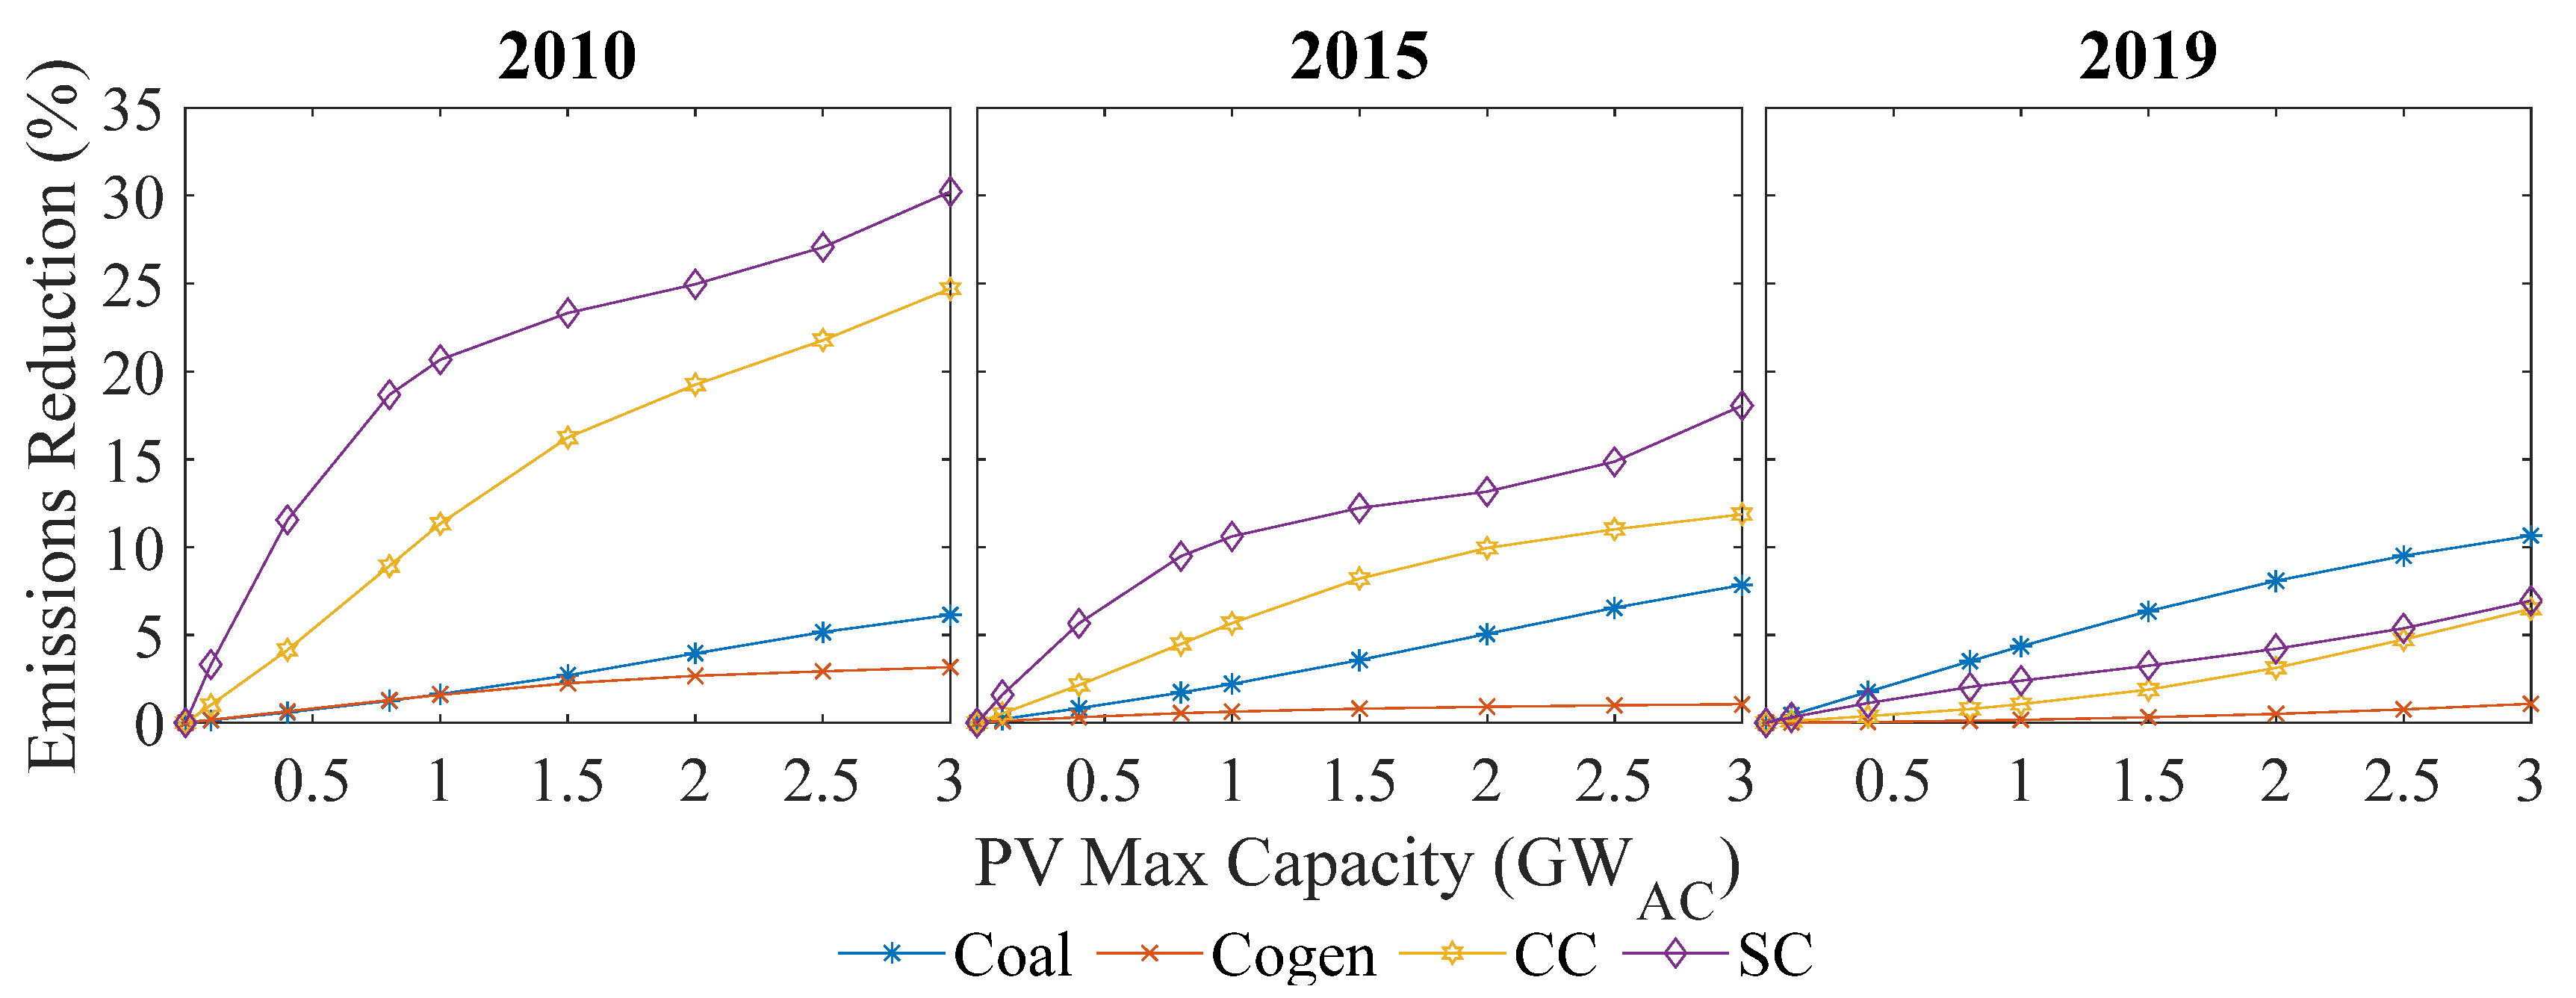
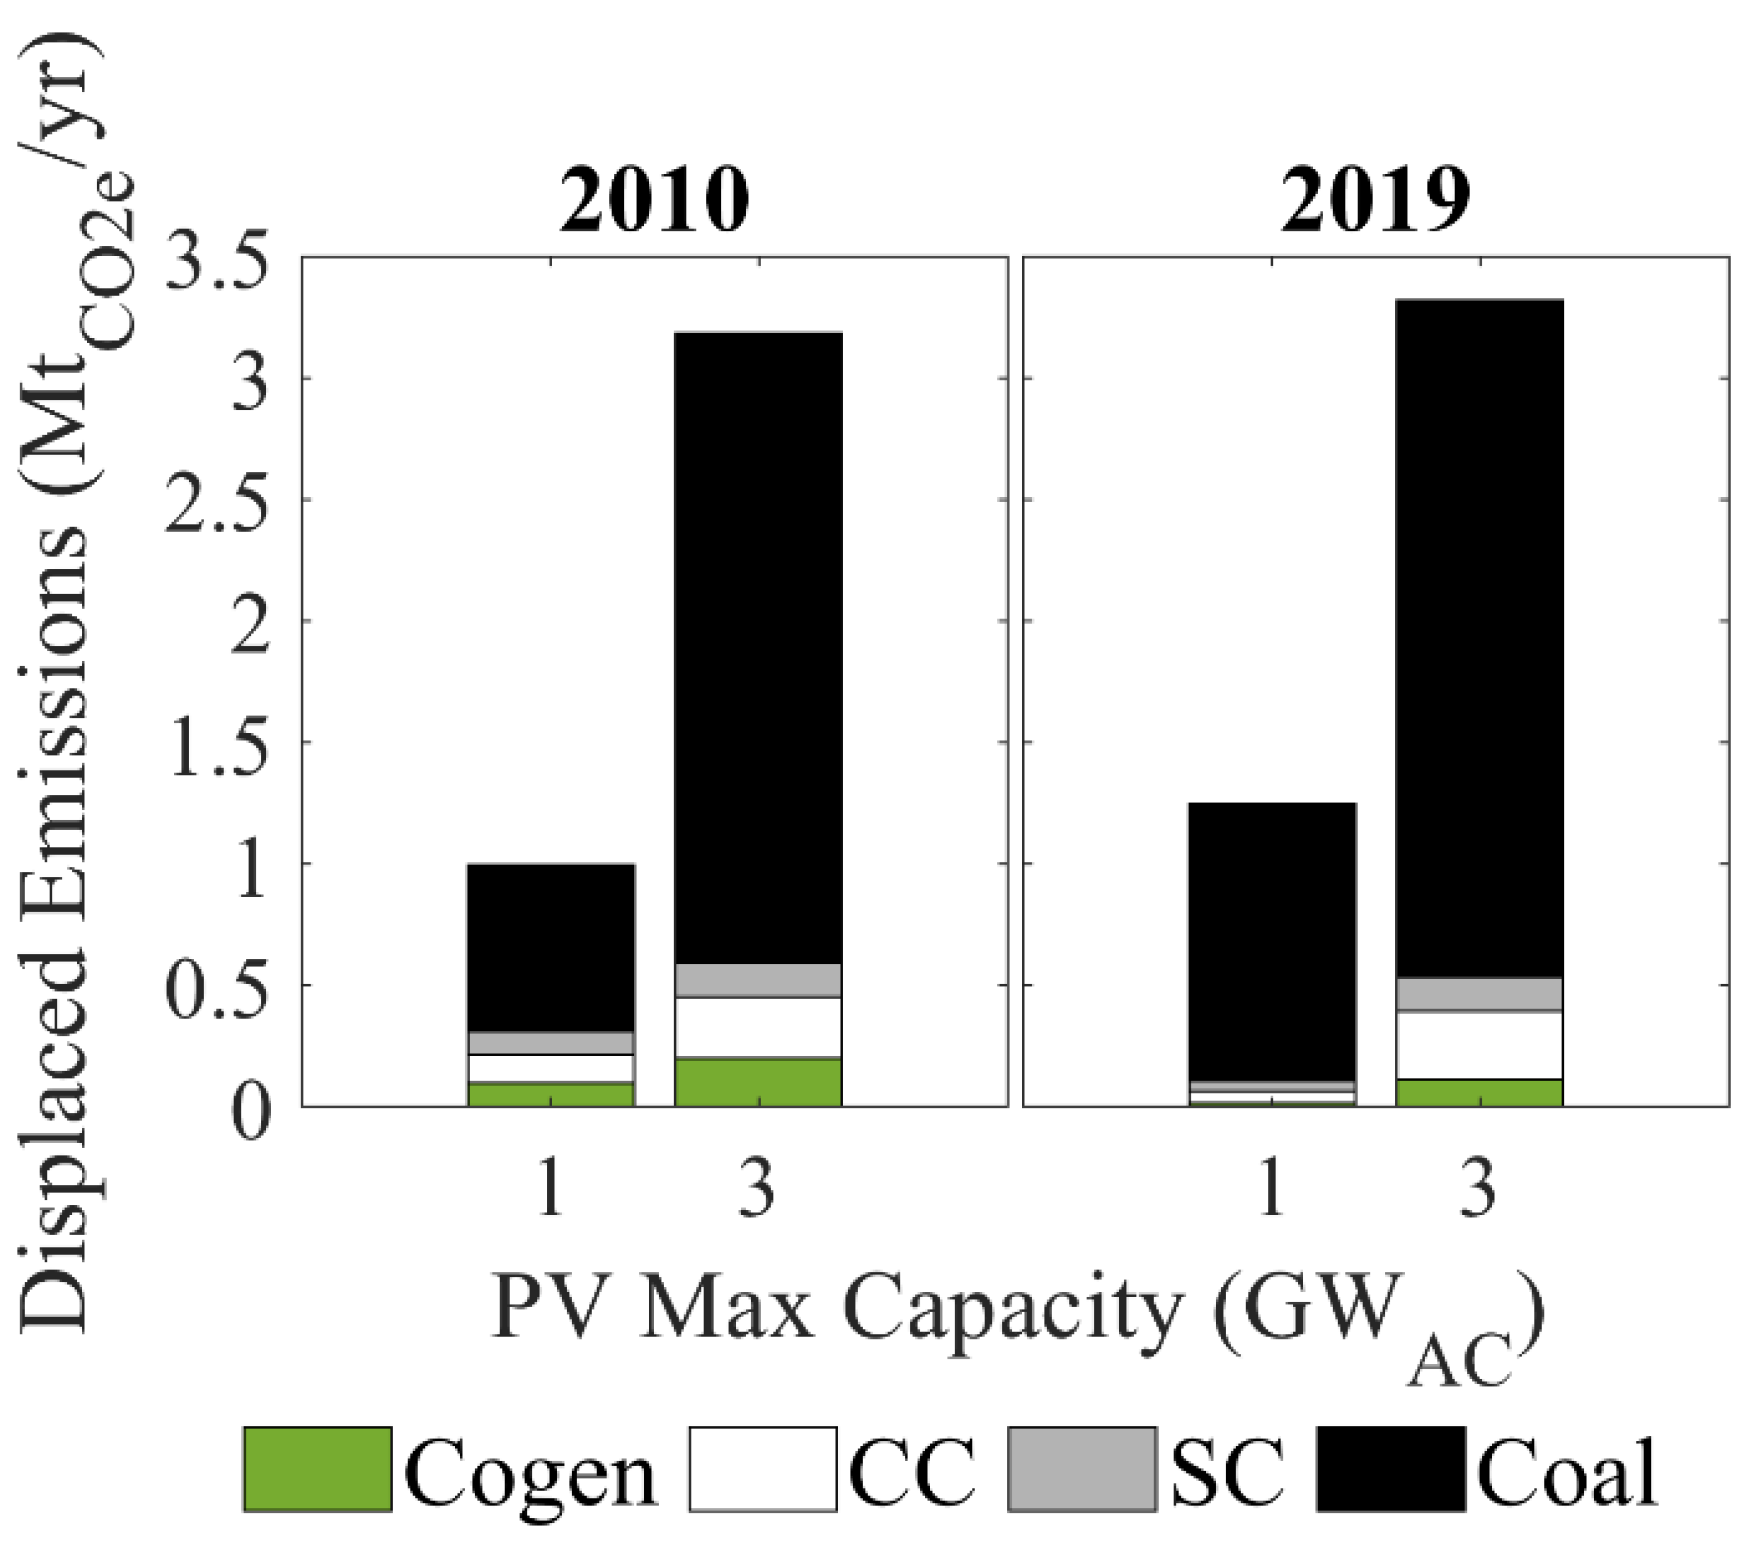
- Which generation is displaced by PV energy under different historical carbon pricing scenarios?
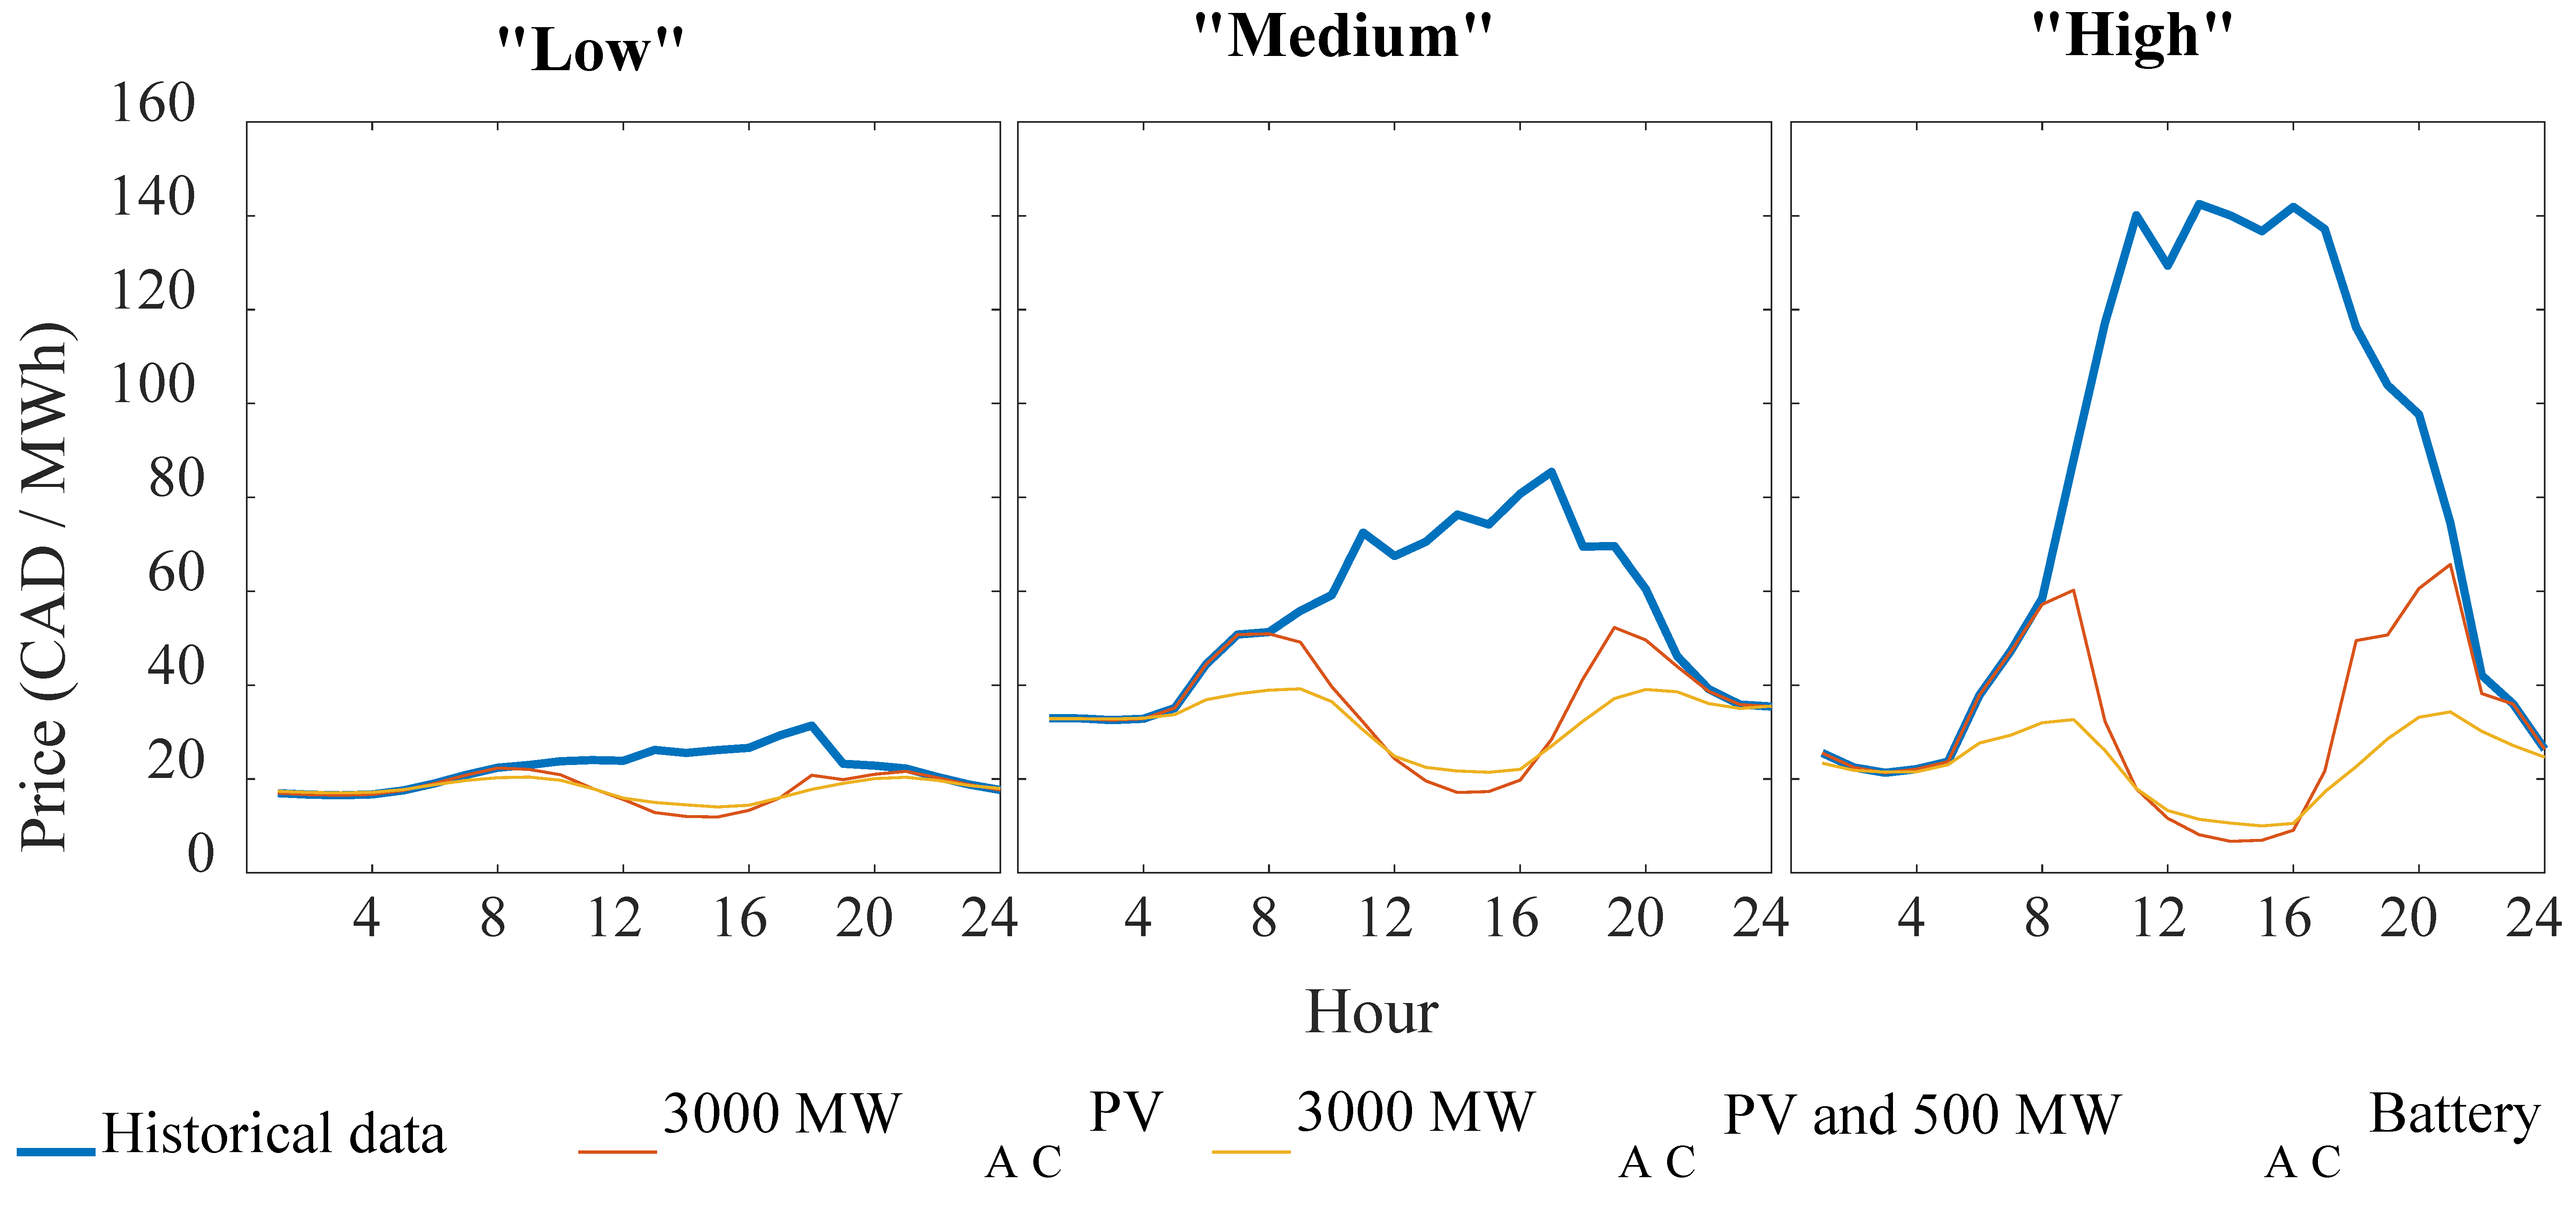
- How does battery storage influence price stabilization and market value in a PV-integrated electricity system?
1.3. Contribution of Work
2. Methodology
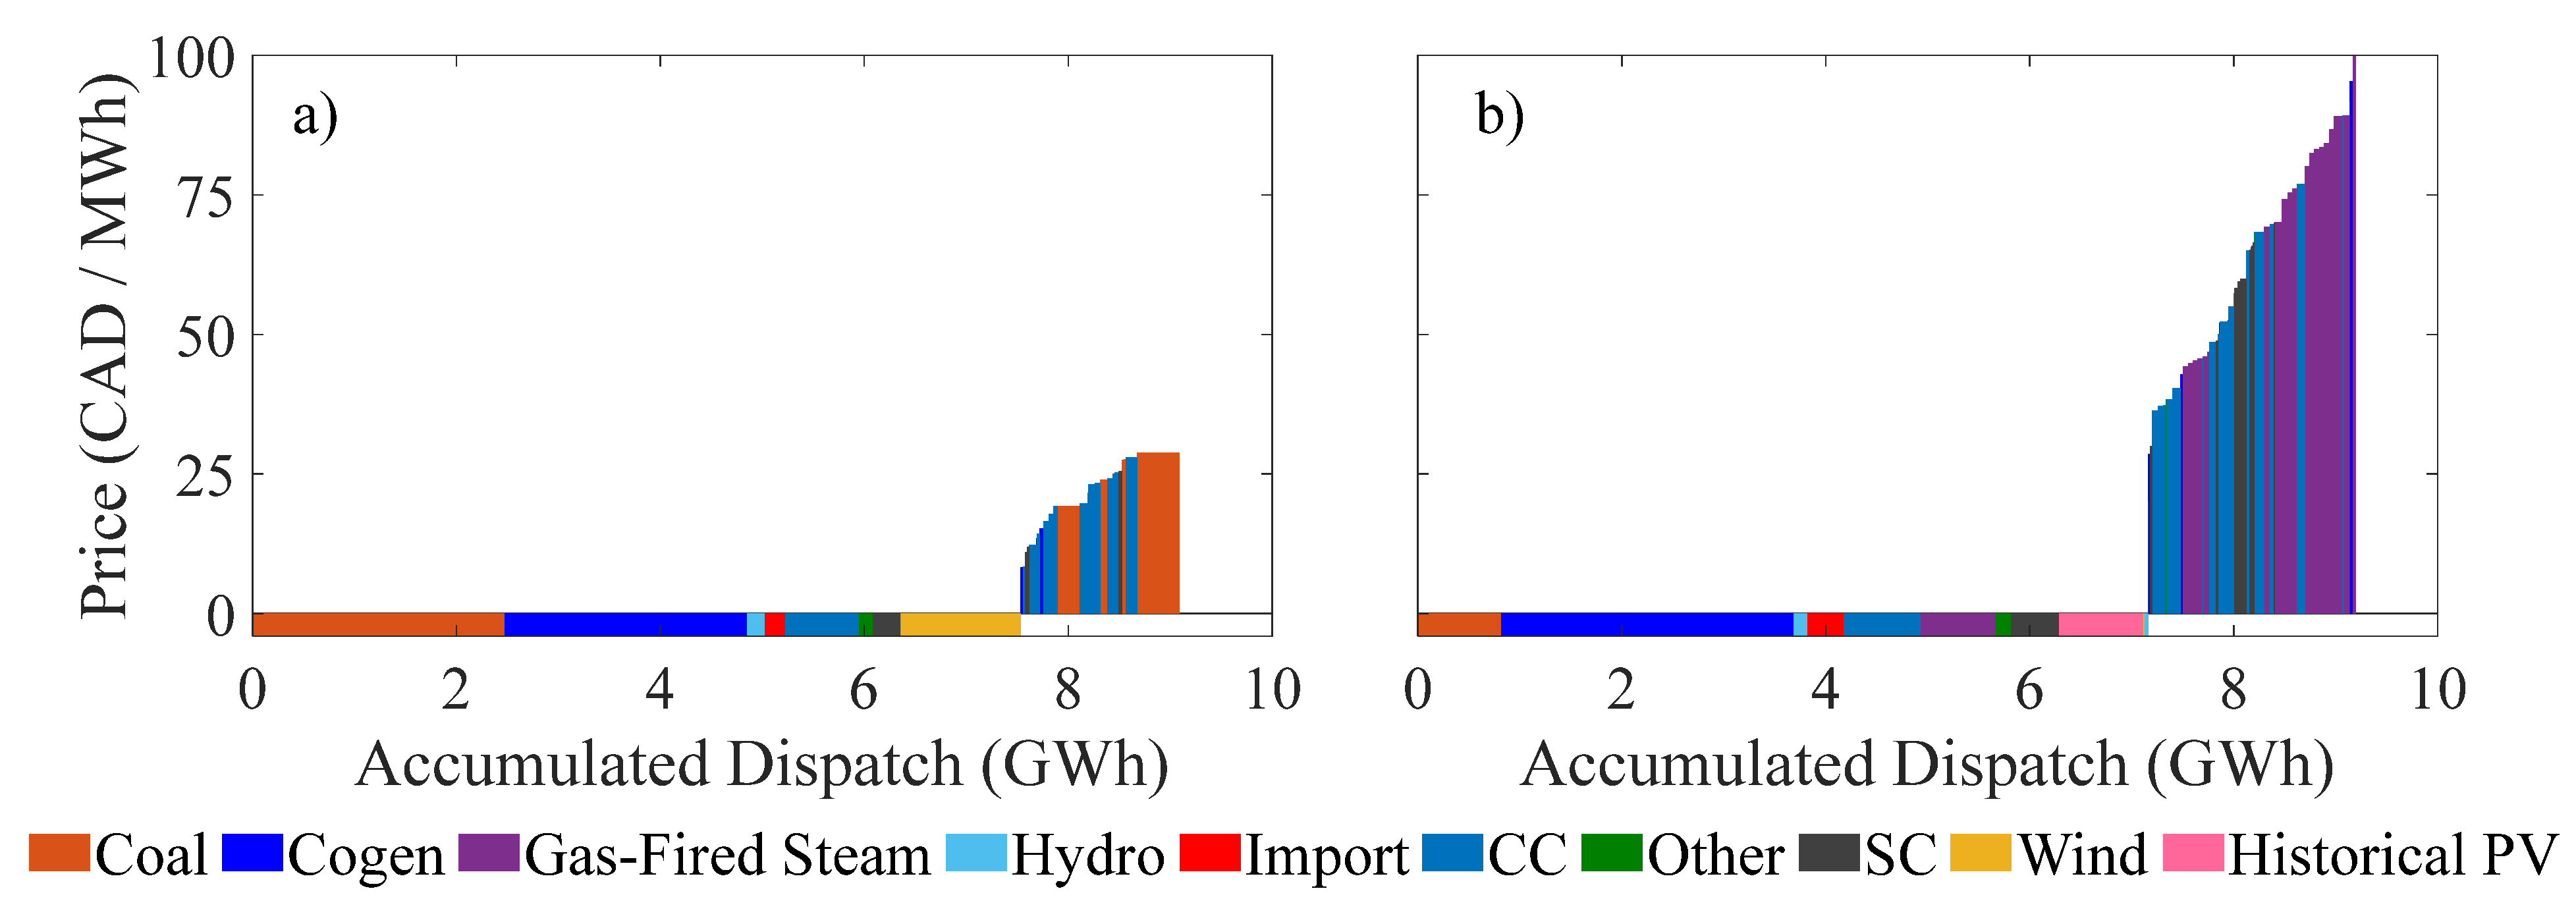
2.1. Simulation of Merit-Order Effect and Cannibalized Price
- Simulate hourly PV energy profiles: Generate hypothetical PV energy profiles for each hour of the historical years;
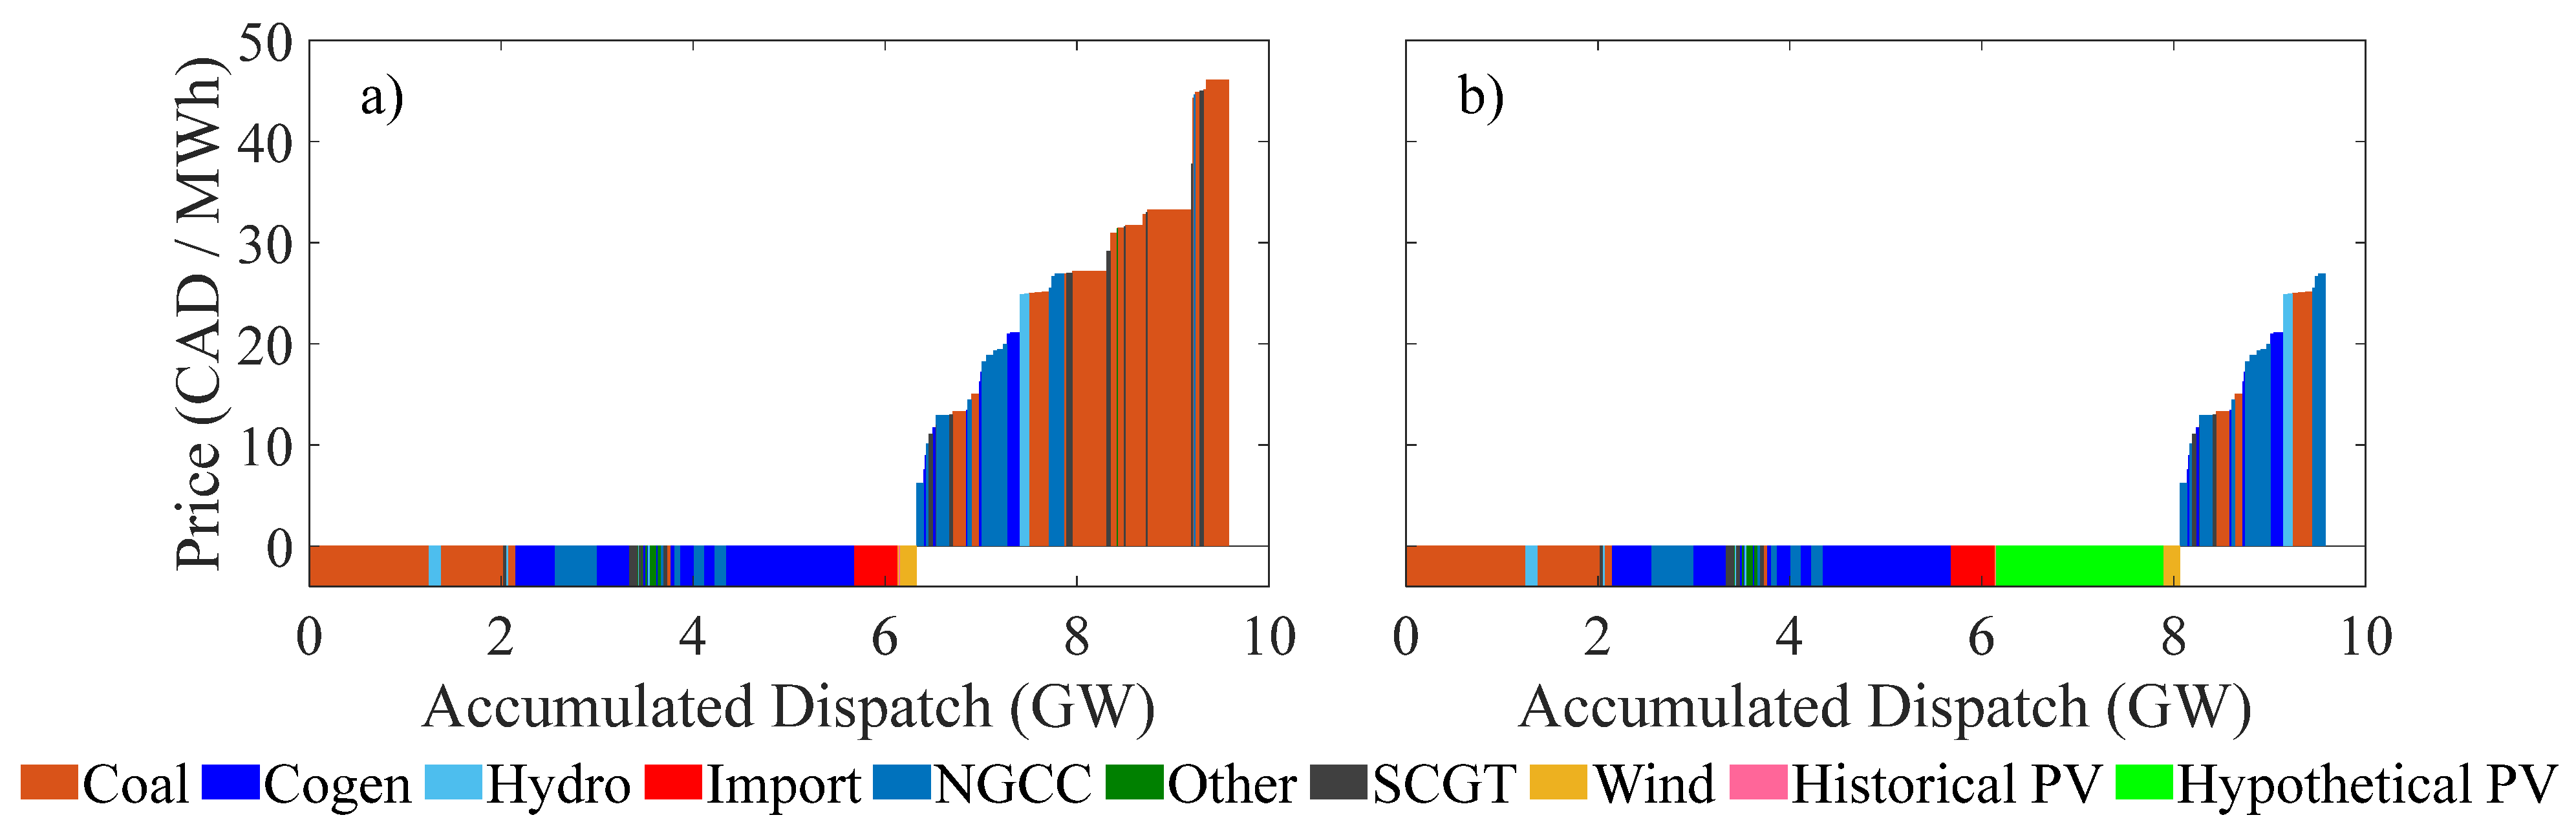
- Input PV generation: Introduce the PV generation into the historical hourly merit order as zero-dollar offers;
- Accumulate generation offers: Sum the generation offers in the merit order until the total supply meets the hourly demand;
- Determine the counterfactual price: Identify the price of the last dispatched unit, referred to as the “impacted” price;
- Analyze displacement: Quantify the remaining and displaced dispatch and emissions after introducing hypothetical PV energy into the merit order.
Batteries on Price Stabilization and Market Value
2.2. Modeling and Validating PV System Performance
2.3. Data
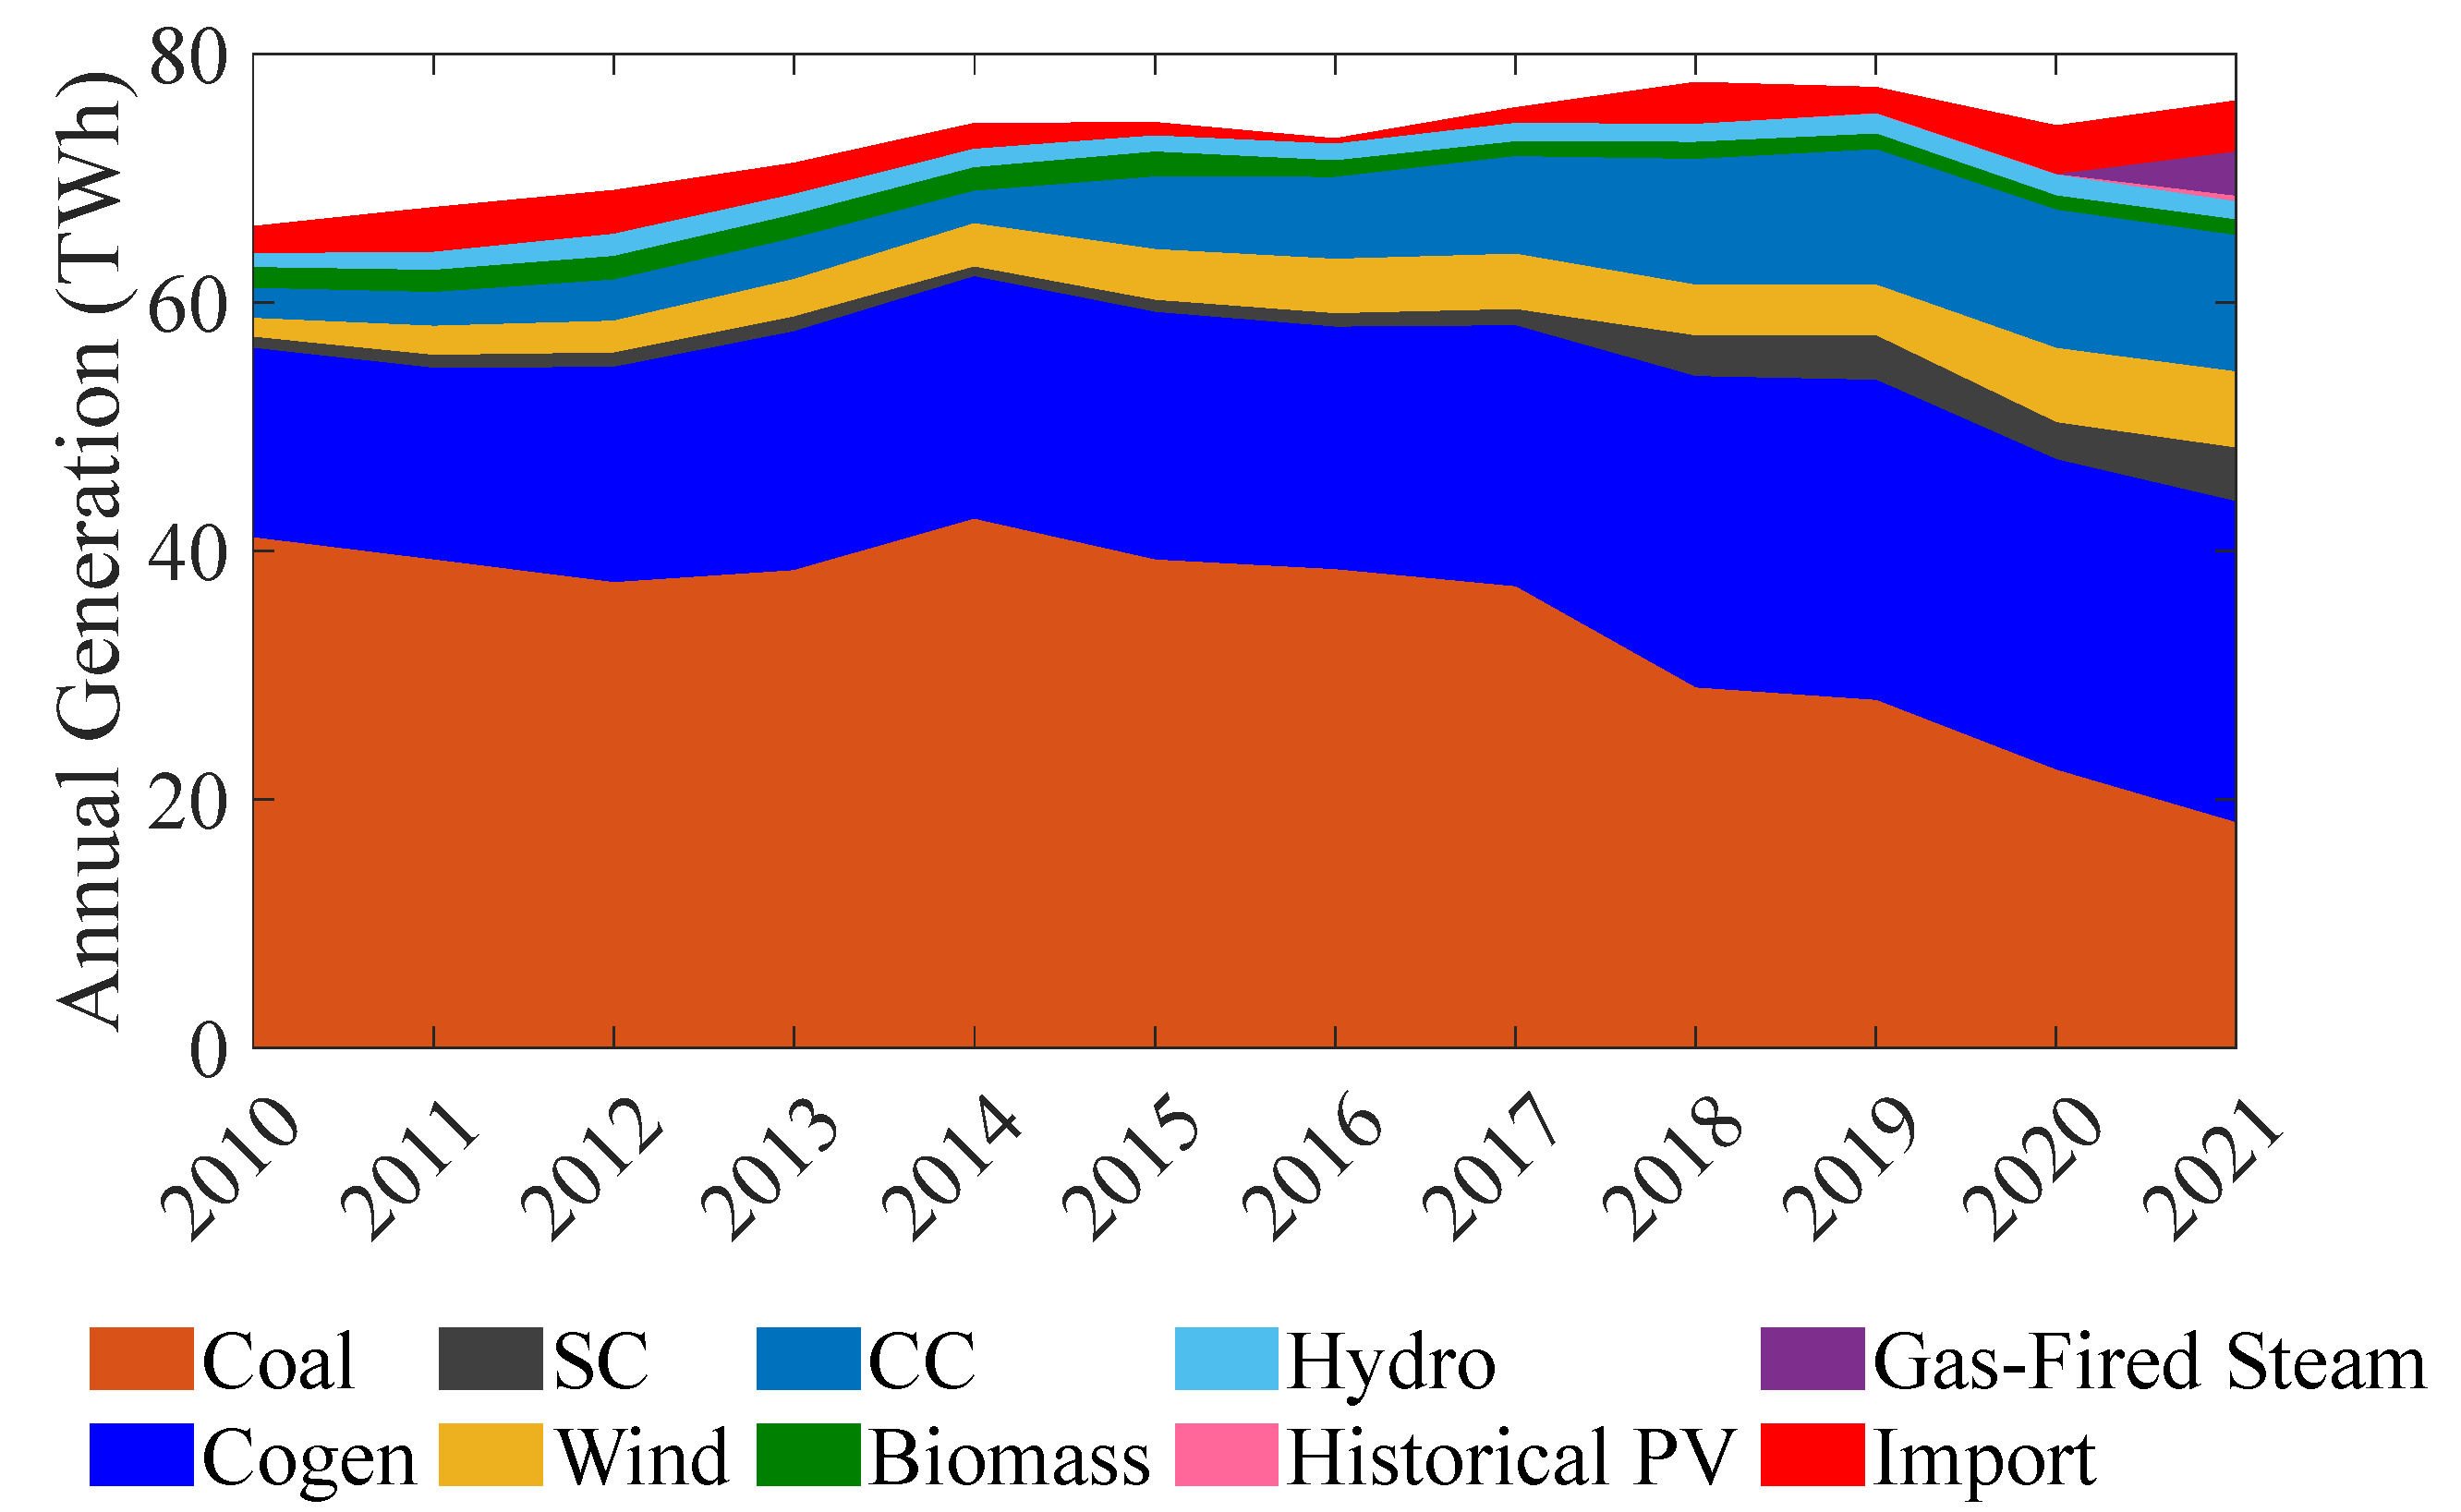
2.3.1. Merit Order
2.3.2. Emissions
2.3.3. Generation Dispatch
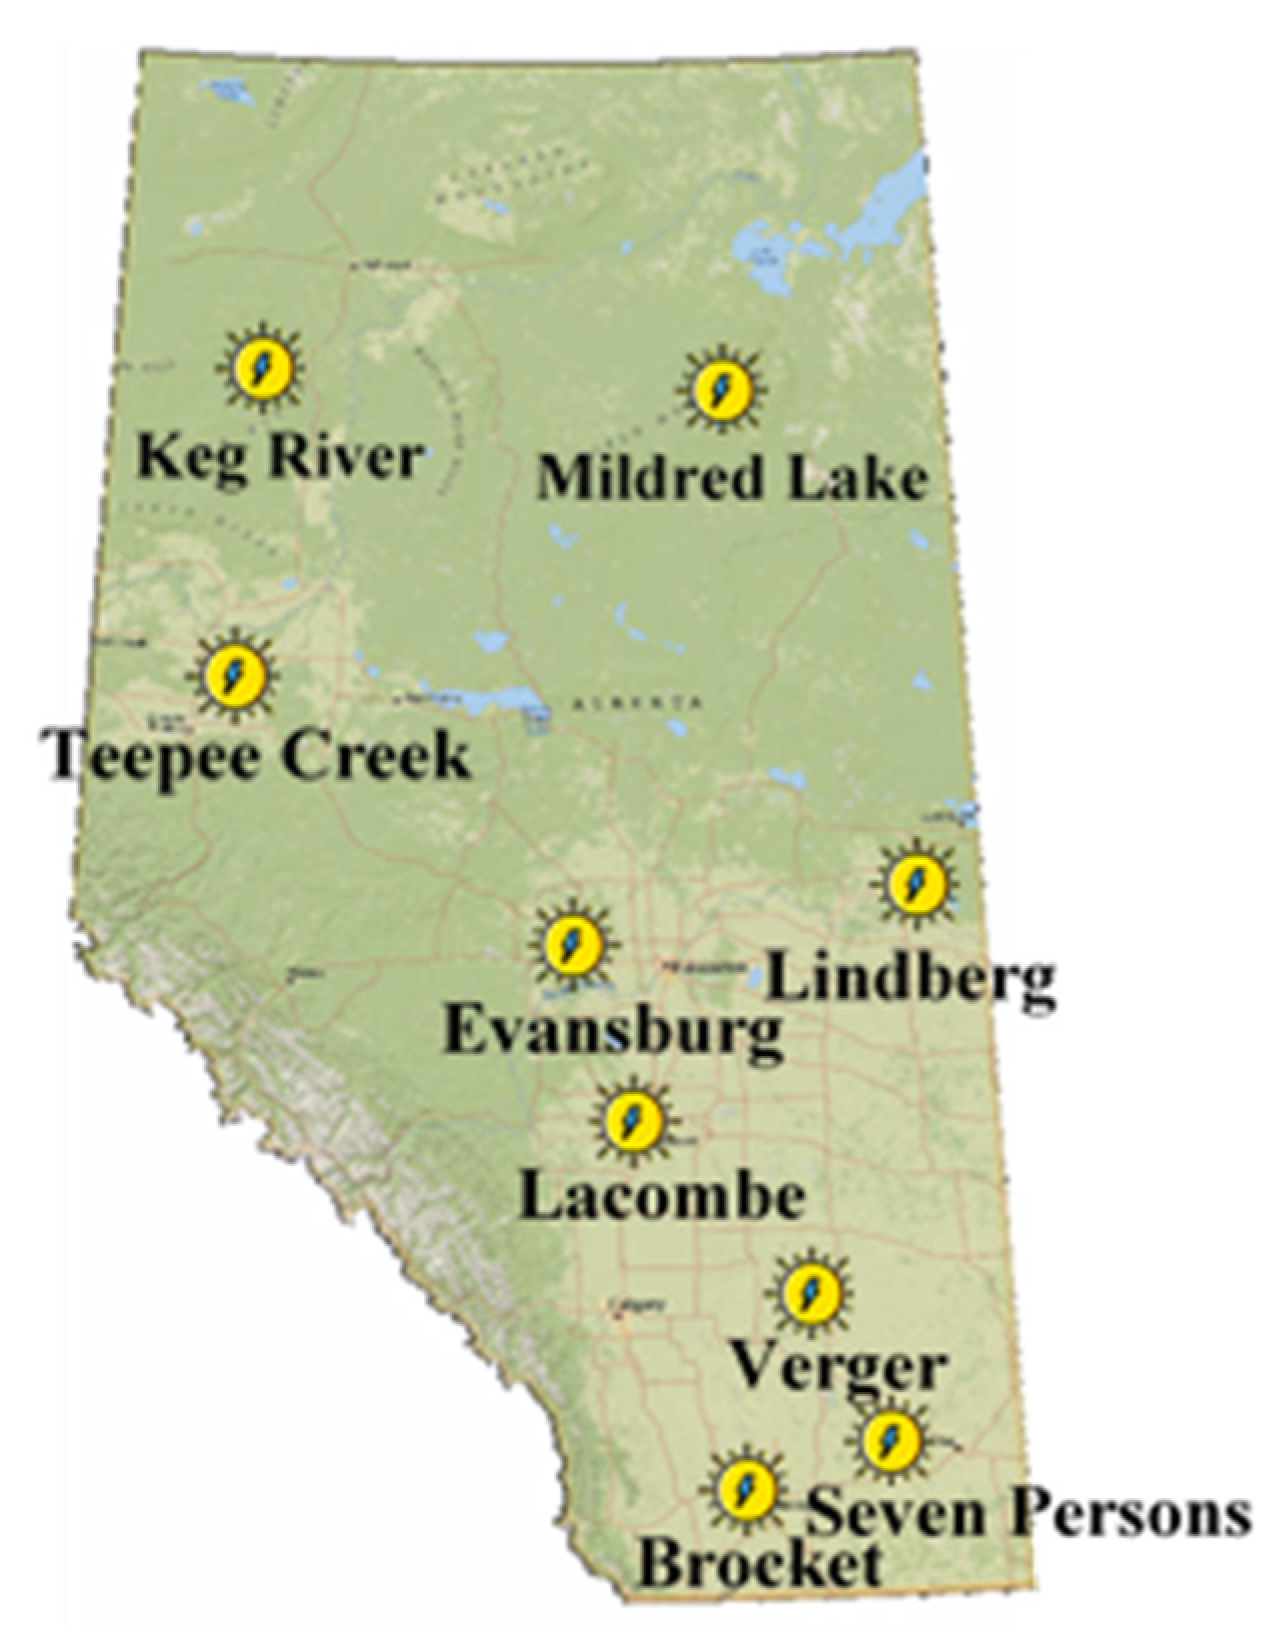
2.3.4. Meteorological Data
2.4. Economic, Environmental, and Energy Dispatch Metrics
3. Results
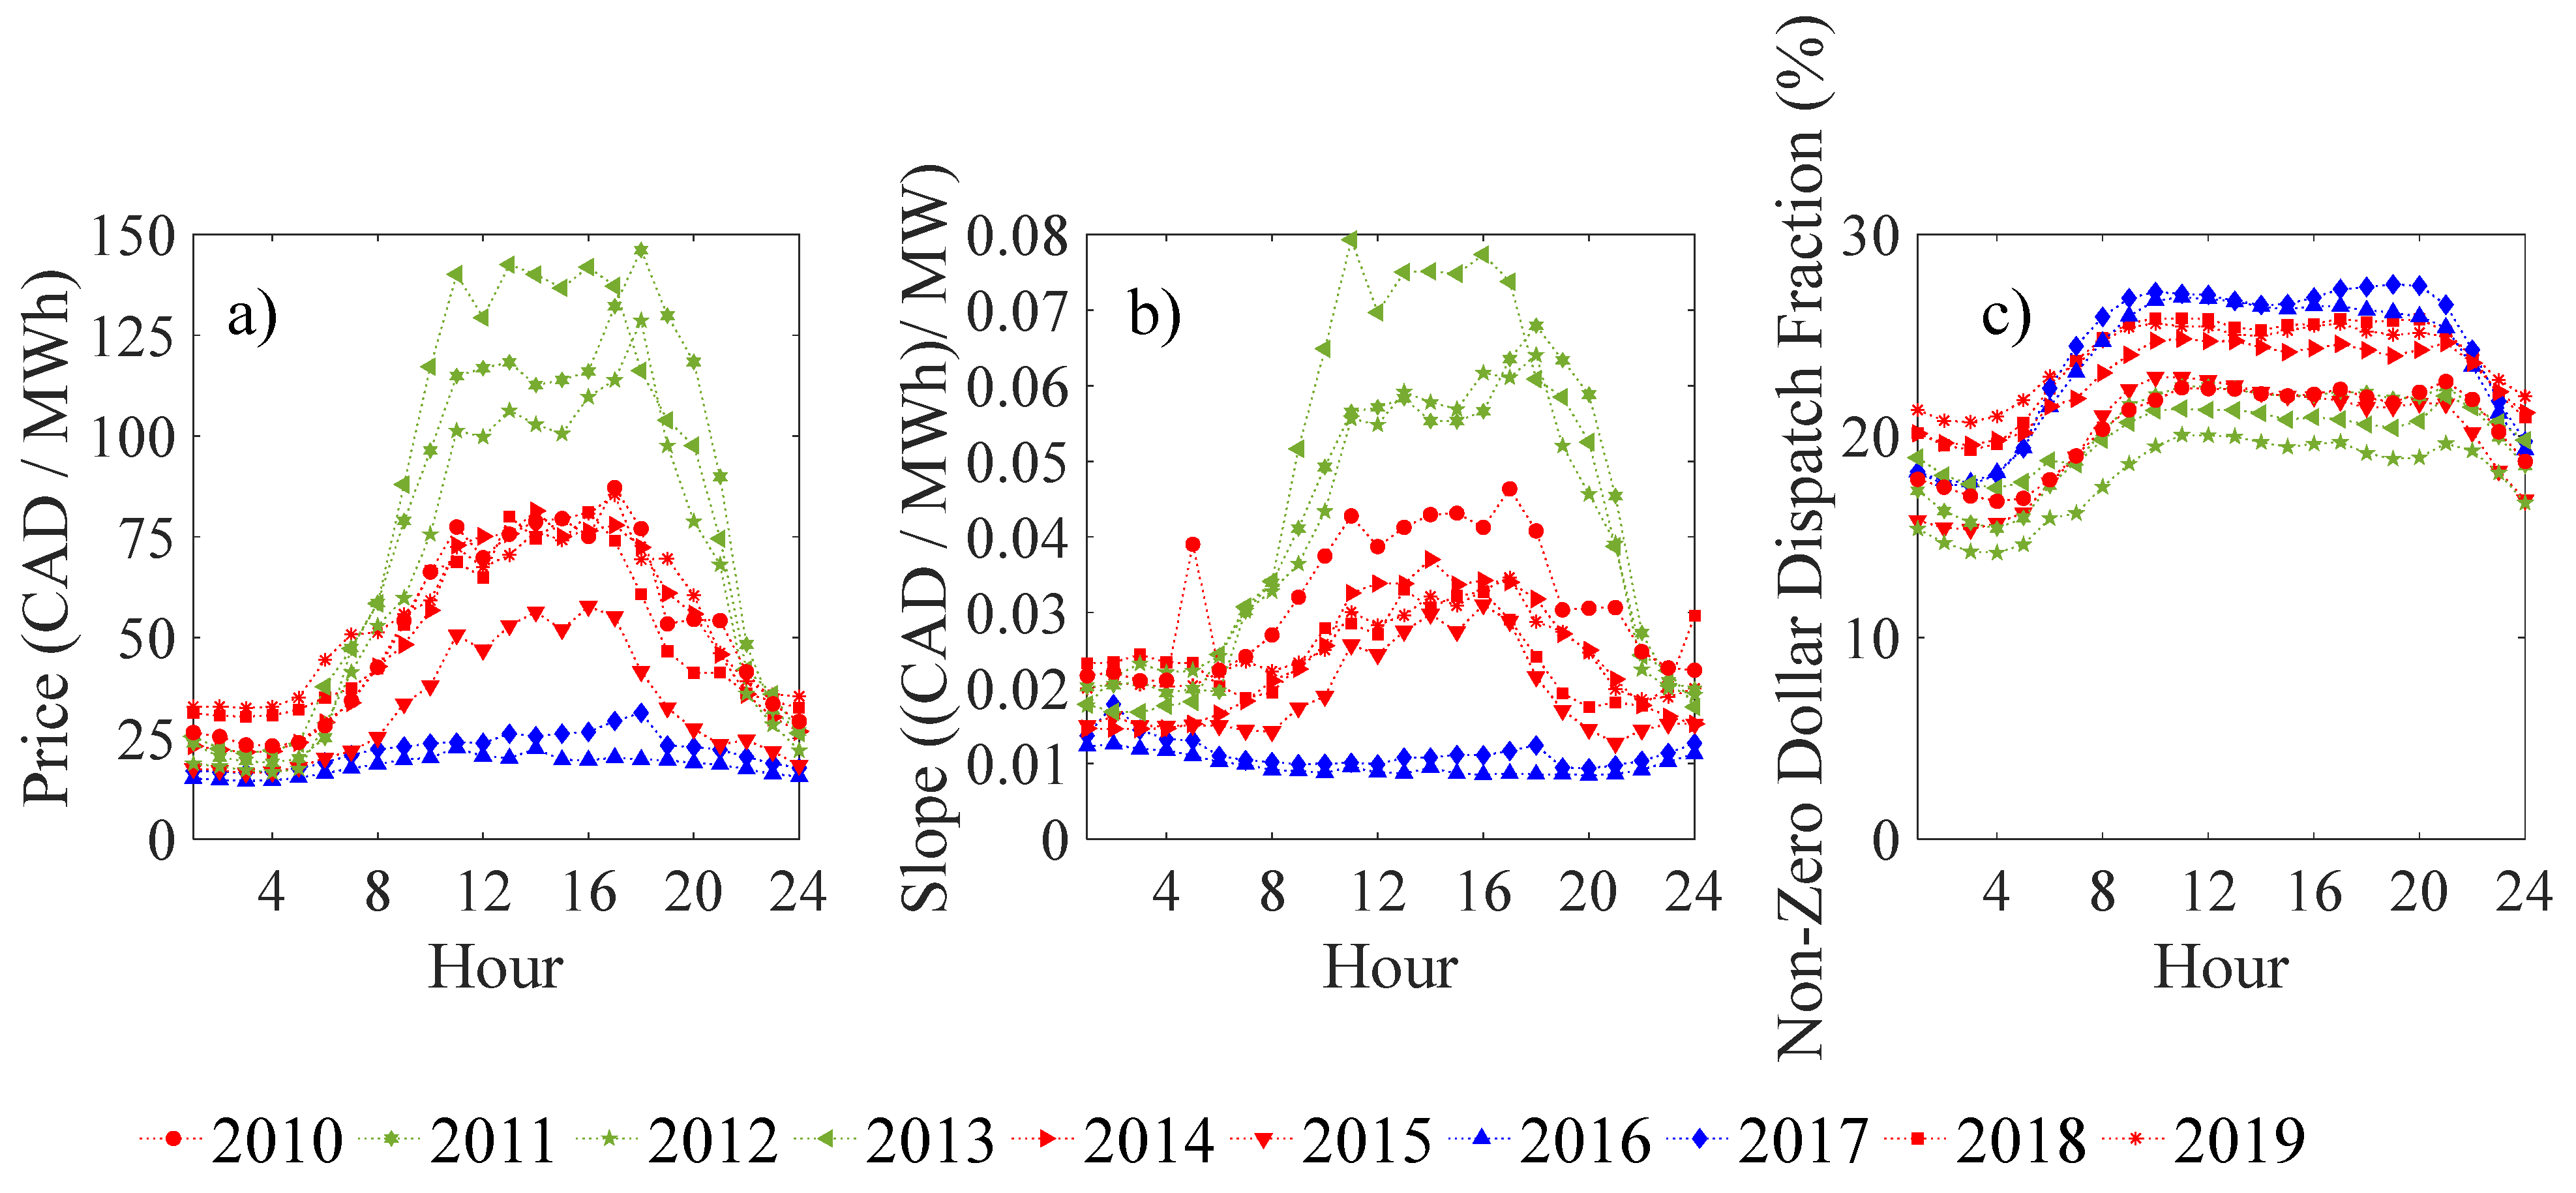
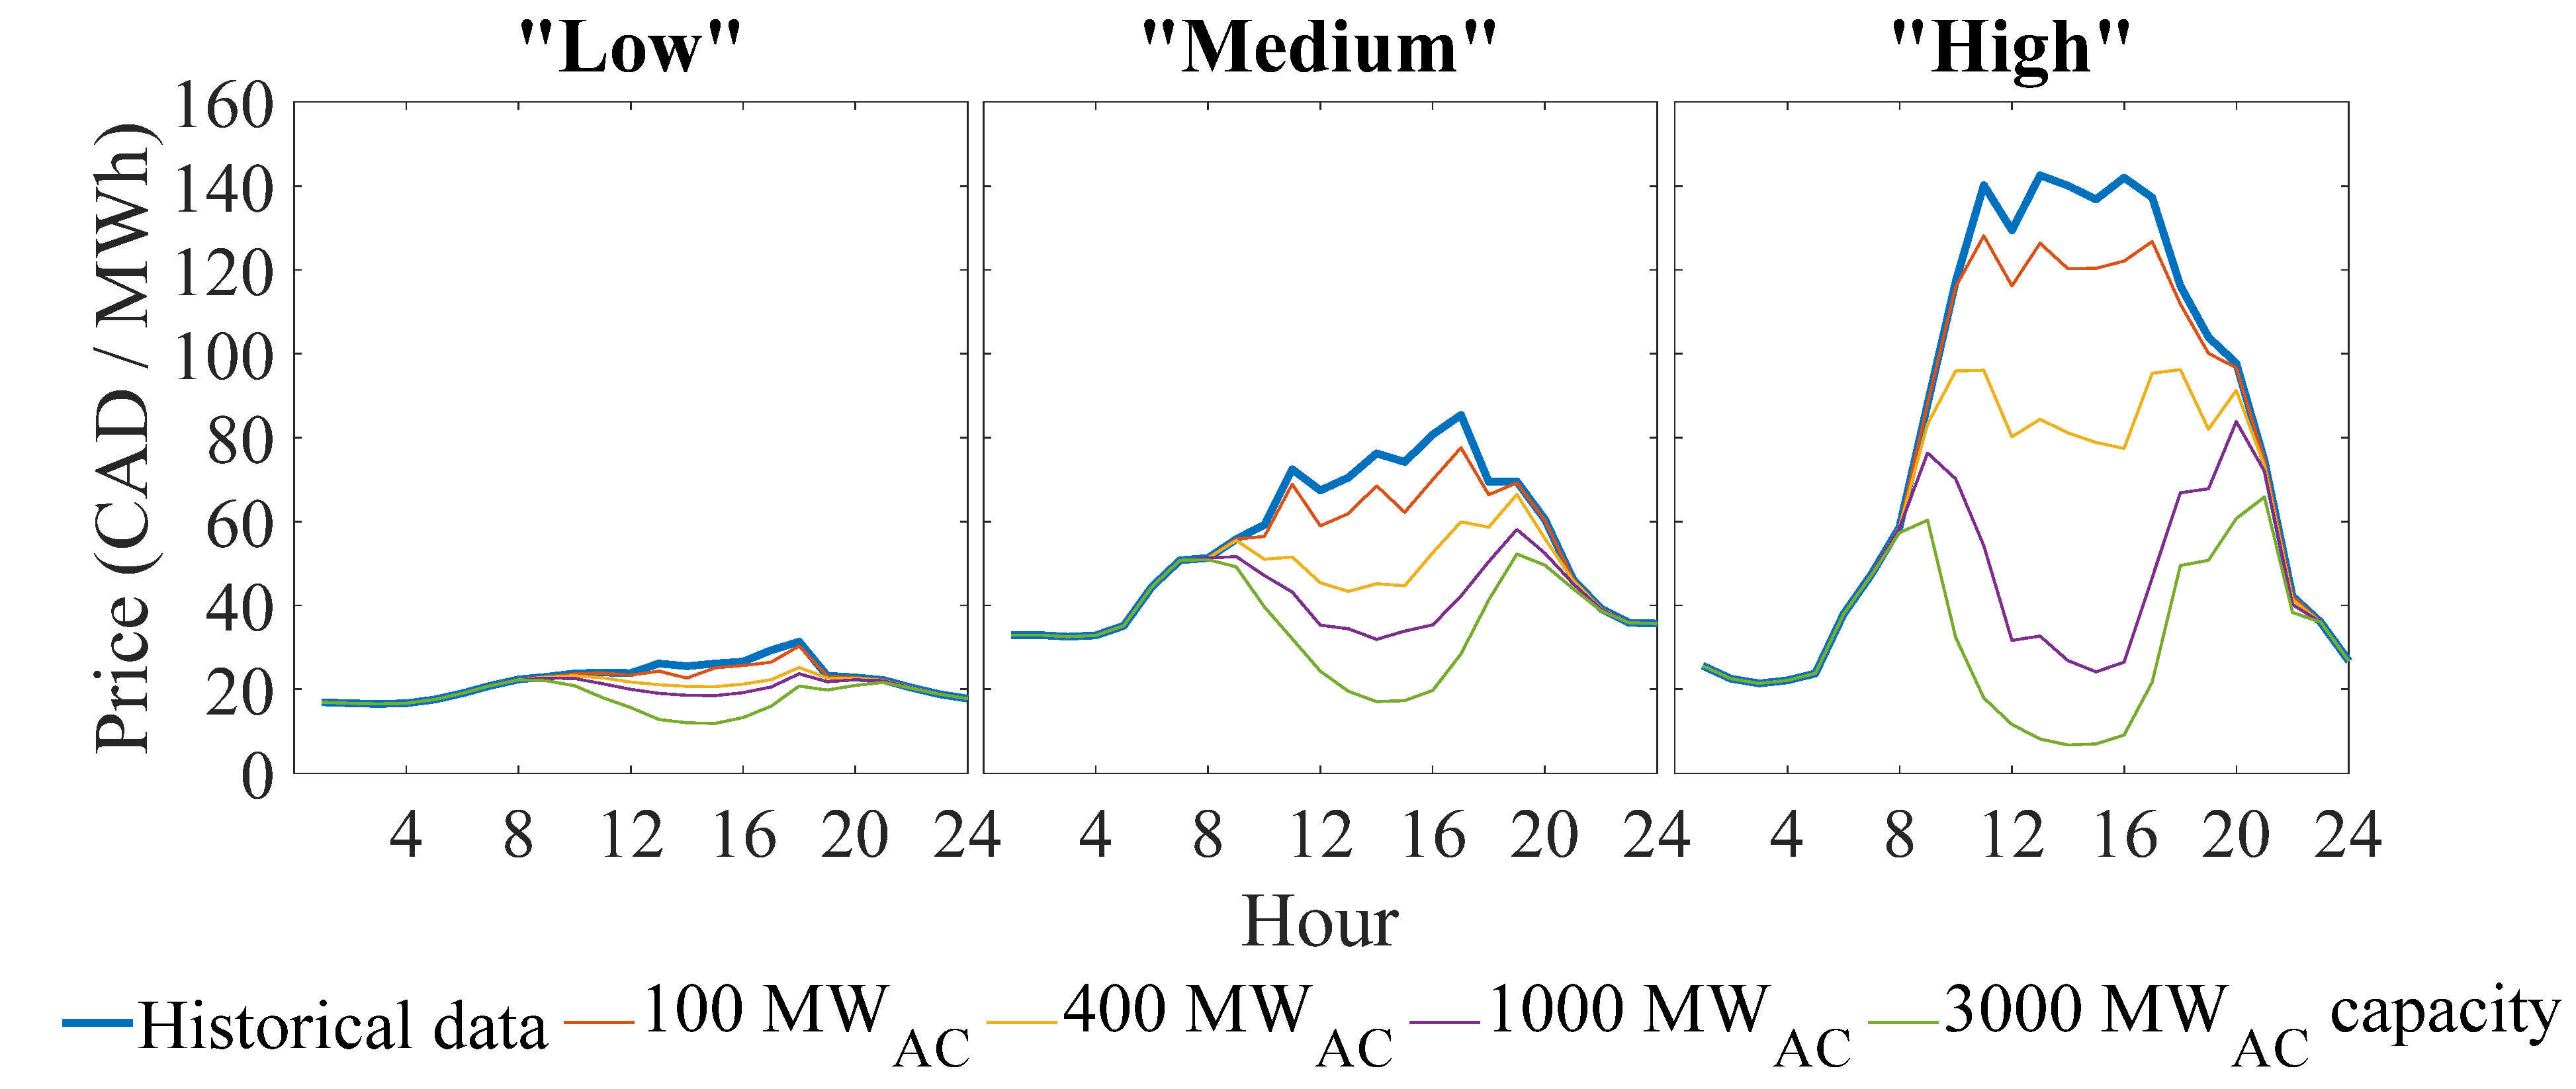
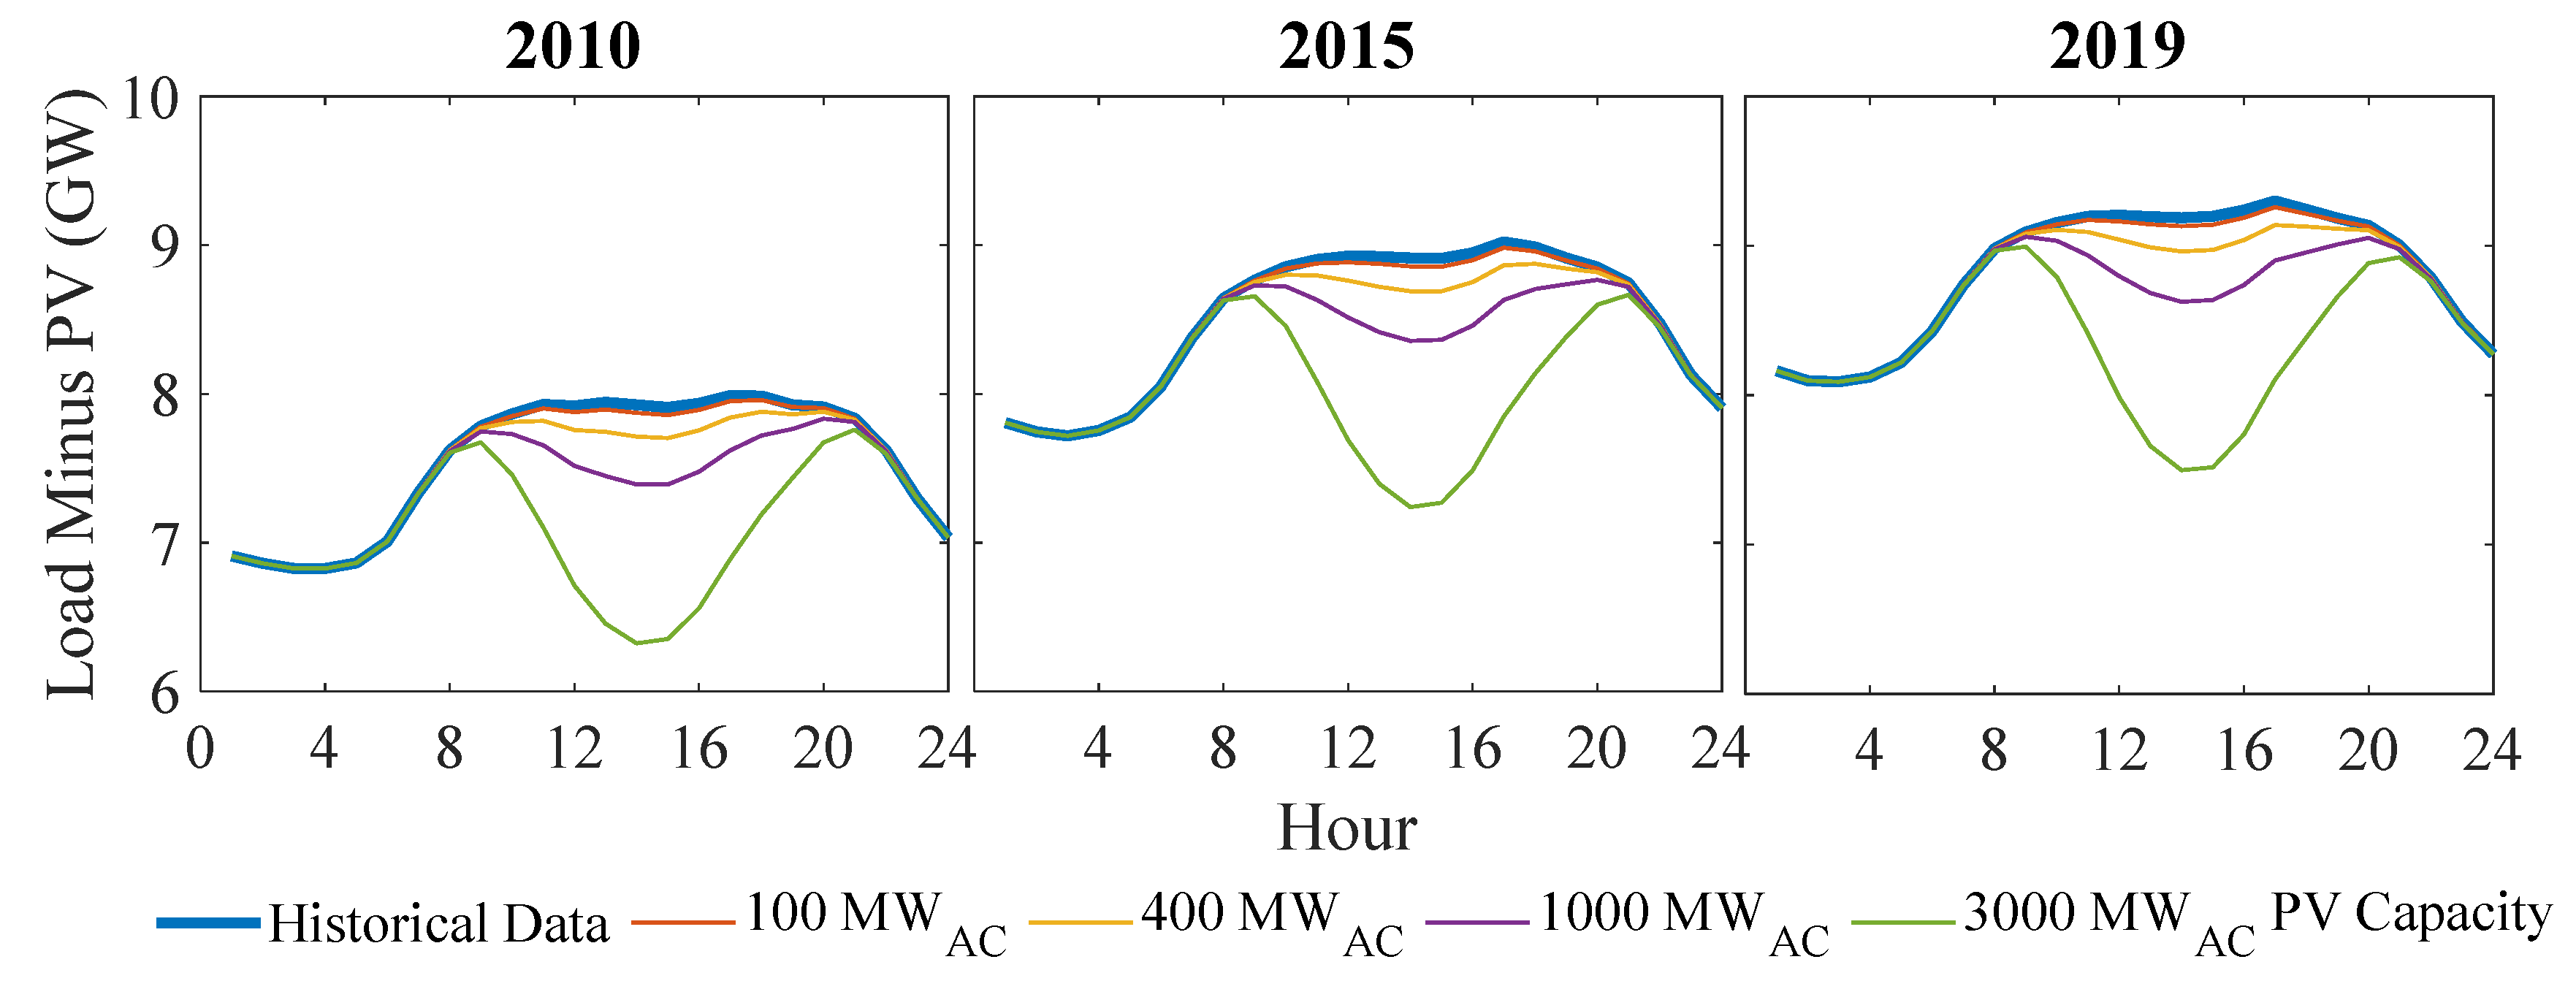
3.1. Pricing Dynamics Impacts on PV Price Cannibalization
- Low-priced years: 2016 and 2017, with average prices near 25 CAD/MWh;
- Medium-priced years: 2014, 2015, 2018, and 2019, with average prices around 50 CAD/MWh;
- High-priced years: 2011 to 2013, with average prices exceeding 100 CAD/MWh during solar generation hours.
- Introducing 1 GW of hypothetical PV capacity reduced annual mean hourly prices by the following amount:
- ○
- 11% in low-priced years (e.g., 2017);
- ○
- 25% in medium-priced years (e.g., 2019);
- ○
- 46% in high-priced years (e.g., 2013).
- Increasing PV capacity to 3 GW resulted in even larger price reductions:
- ○
- 17% in low-priced years;
- ○
- 32% in medium-priced years;
- ○
- 57% in high-priced years.
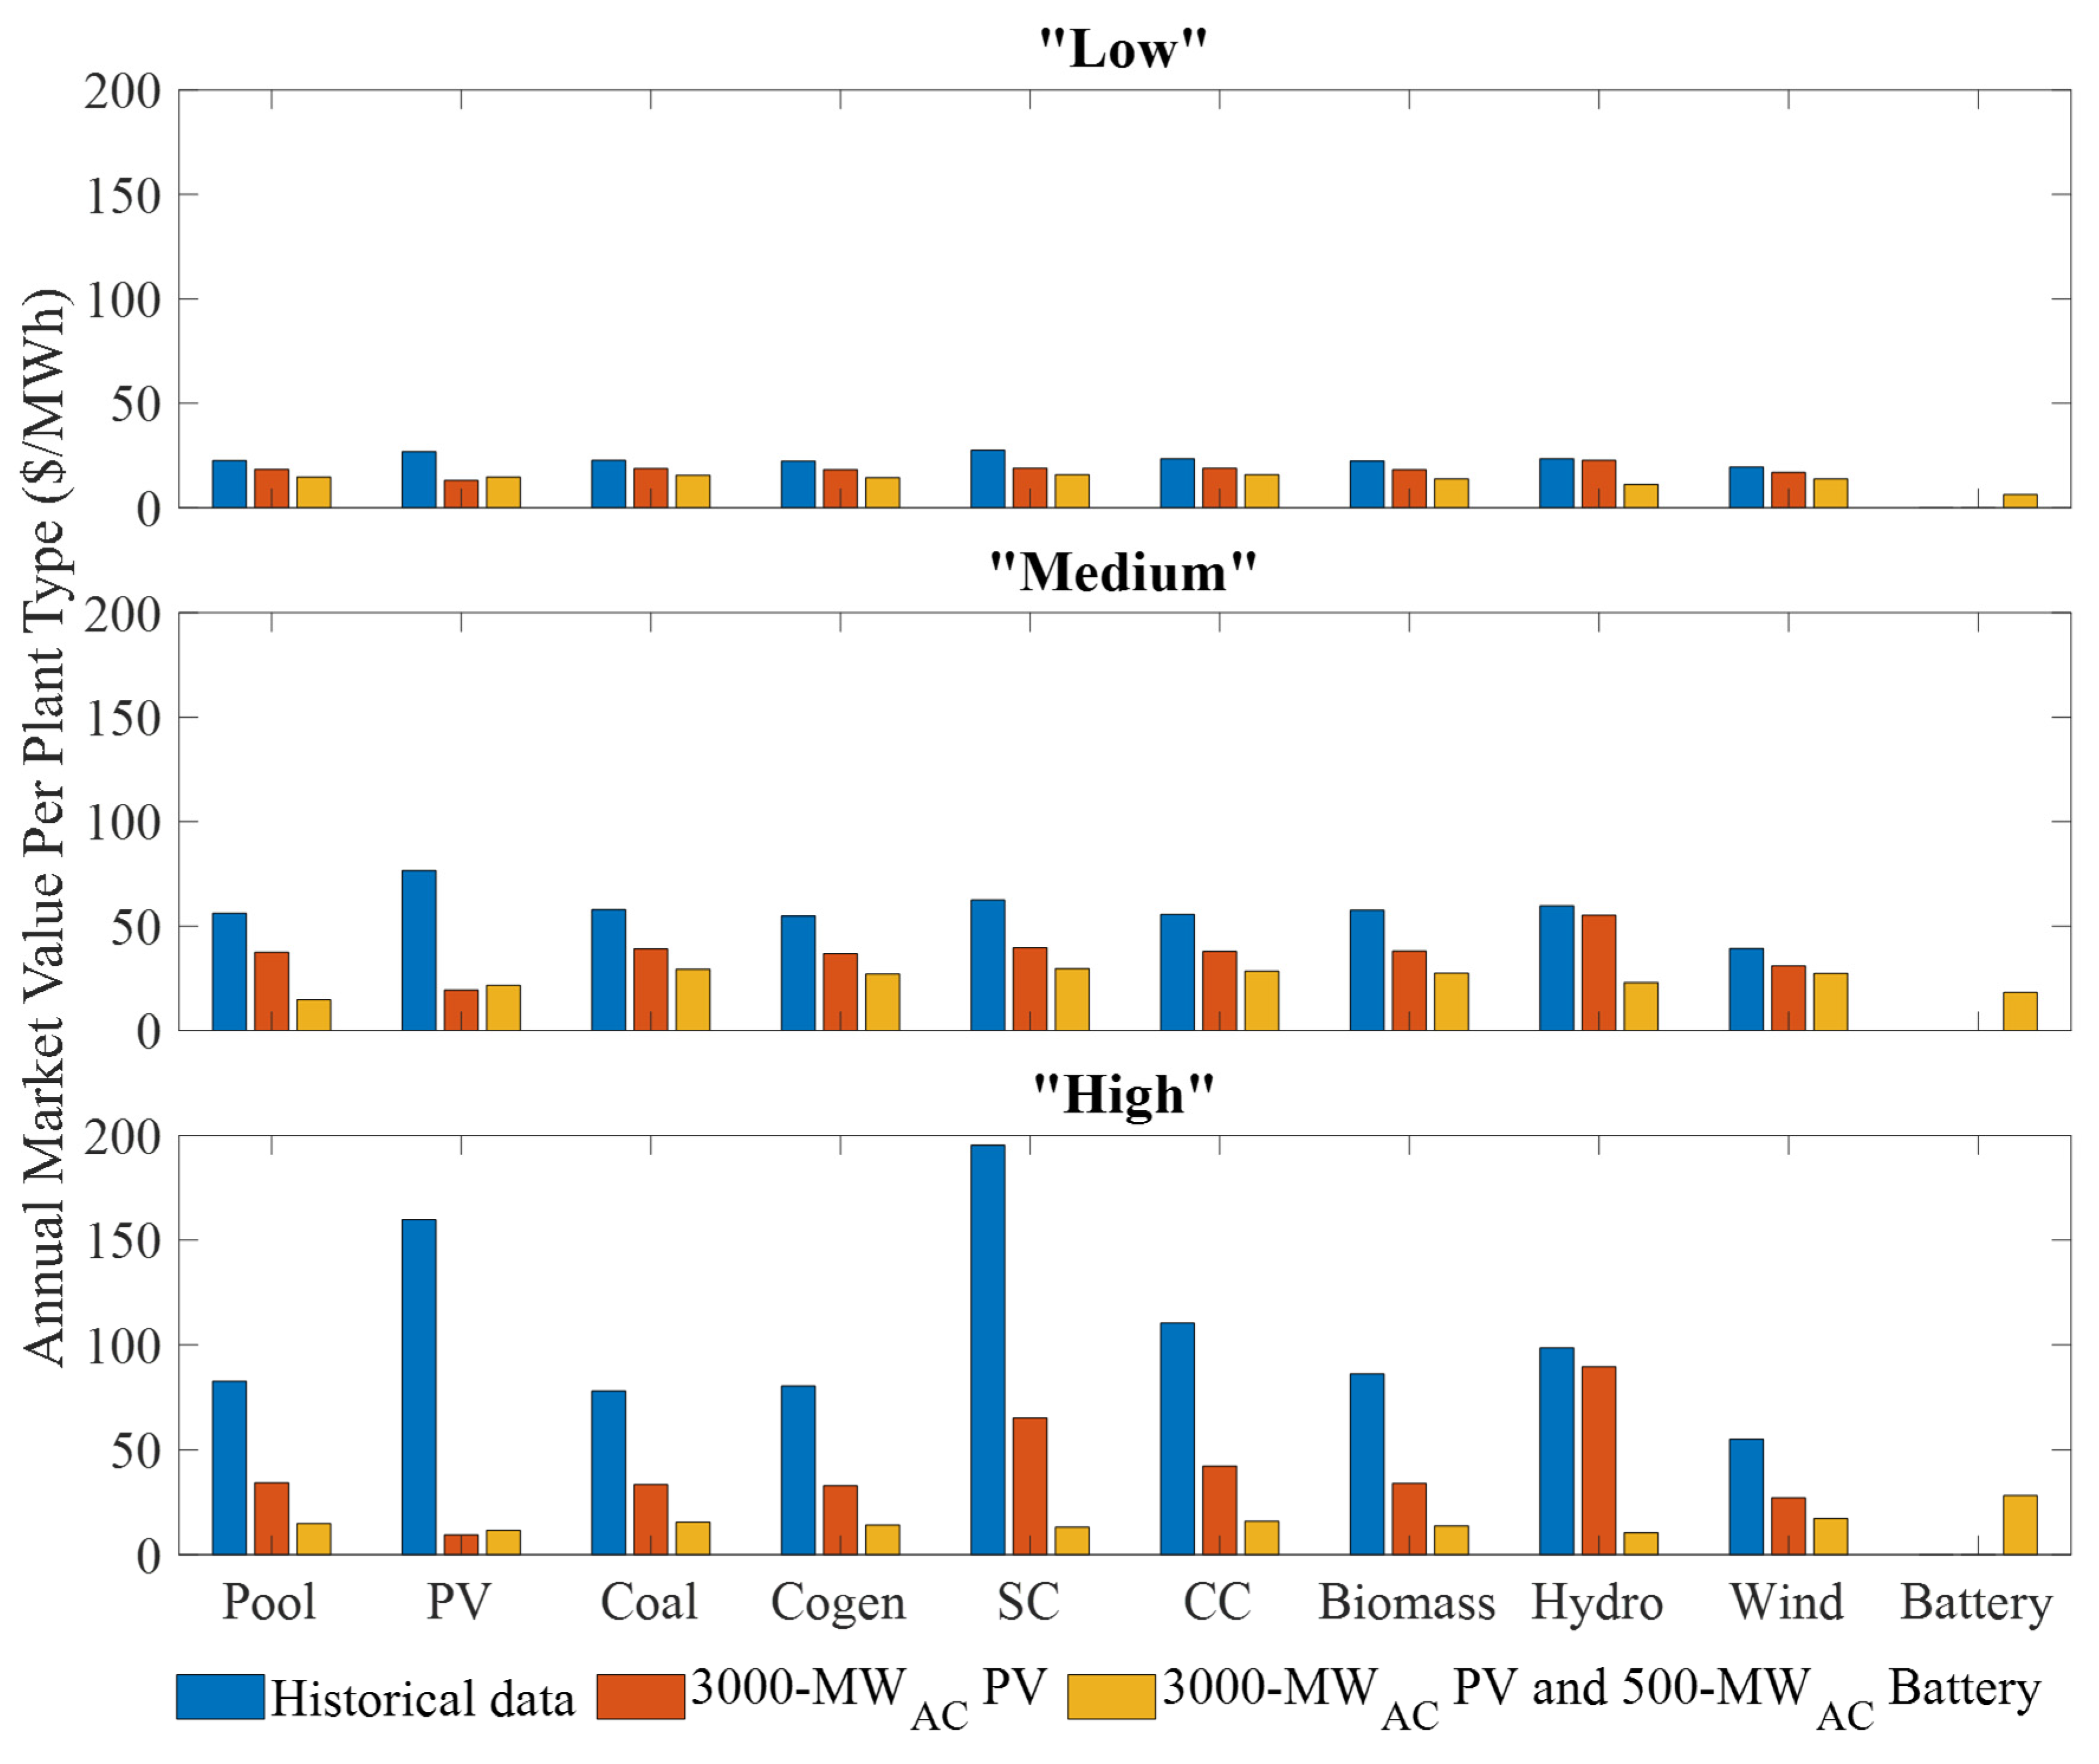
3.2. Impact of Batteries on Price Stabilization and Market Value
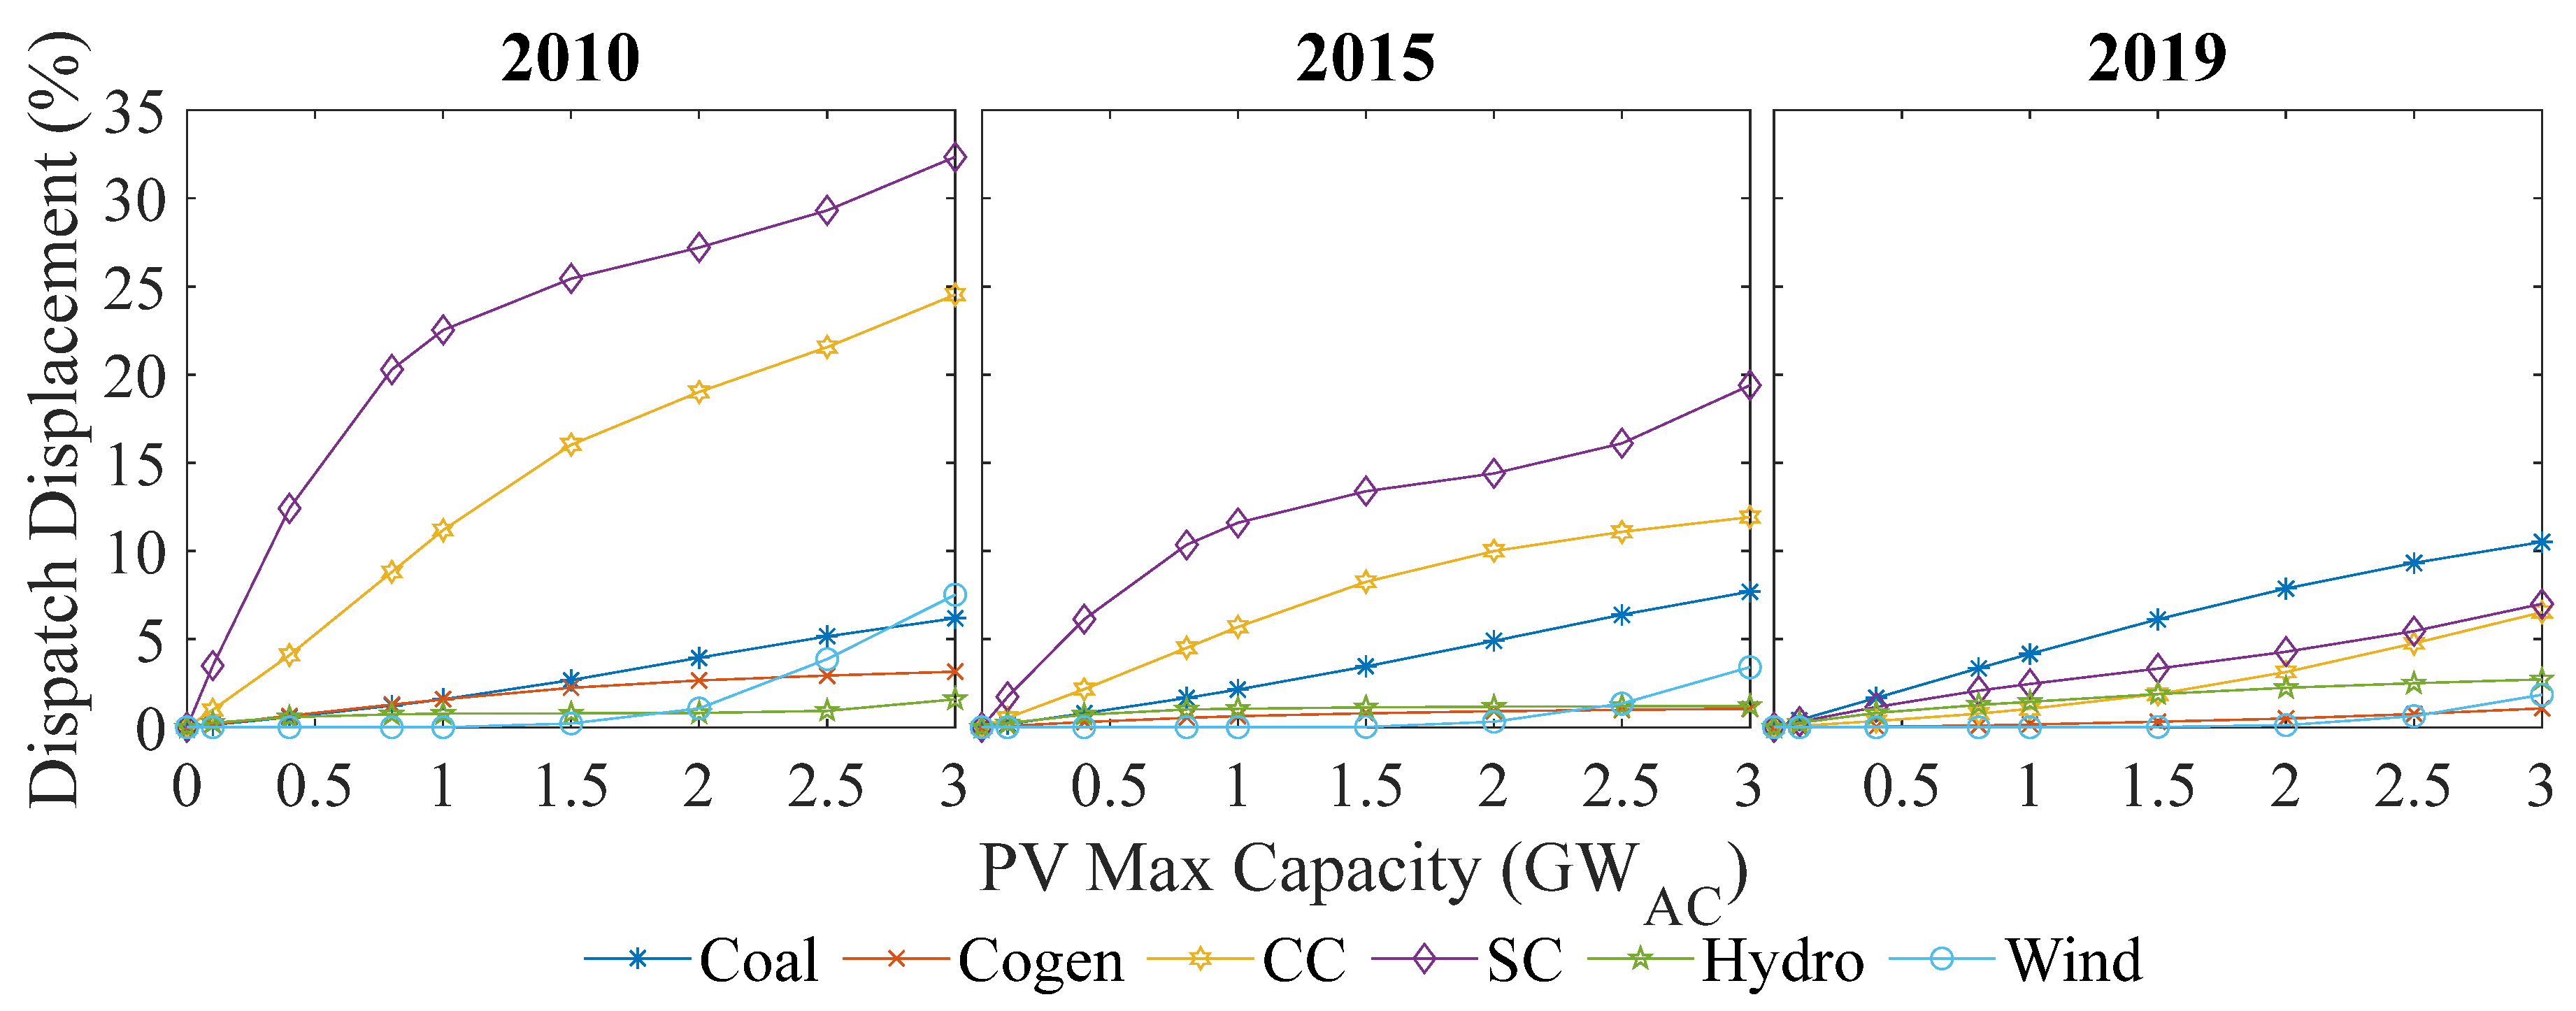
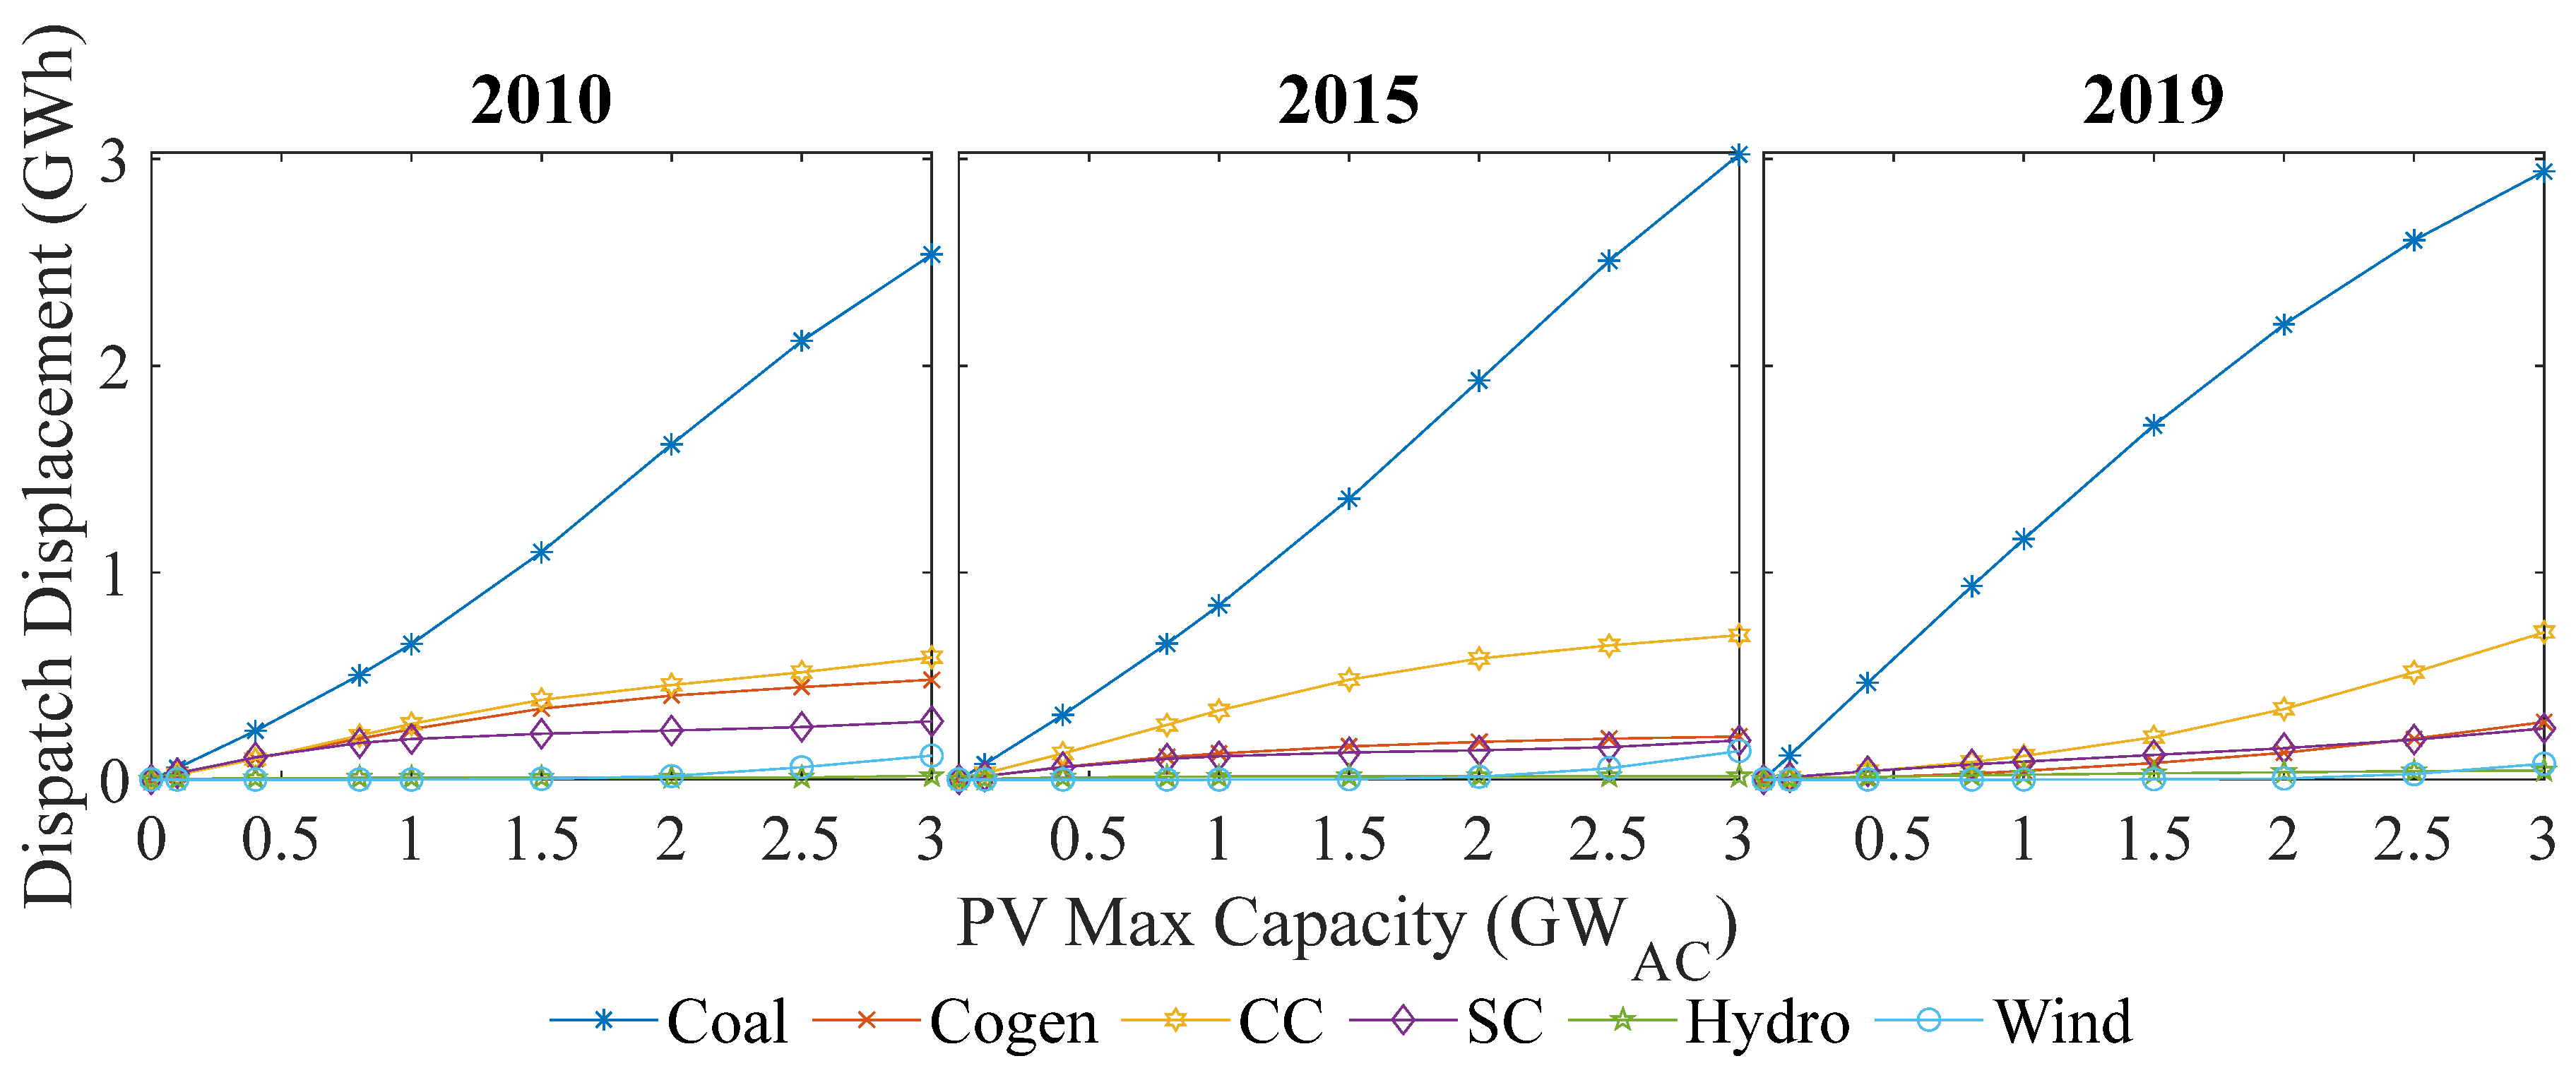
3.3. Changes to Dispatched Energy
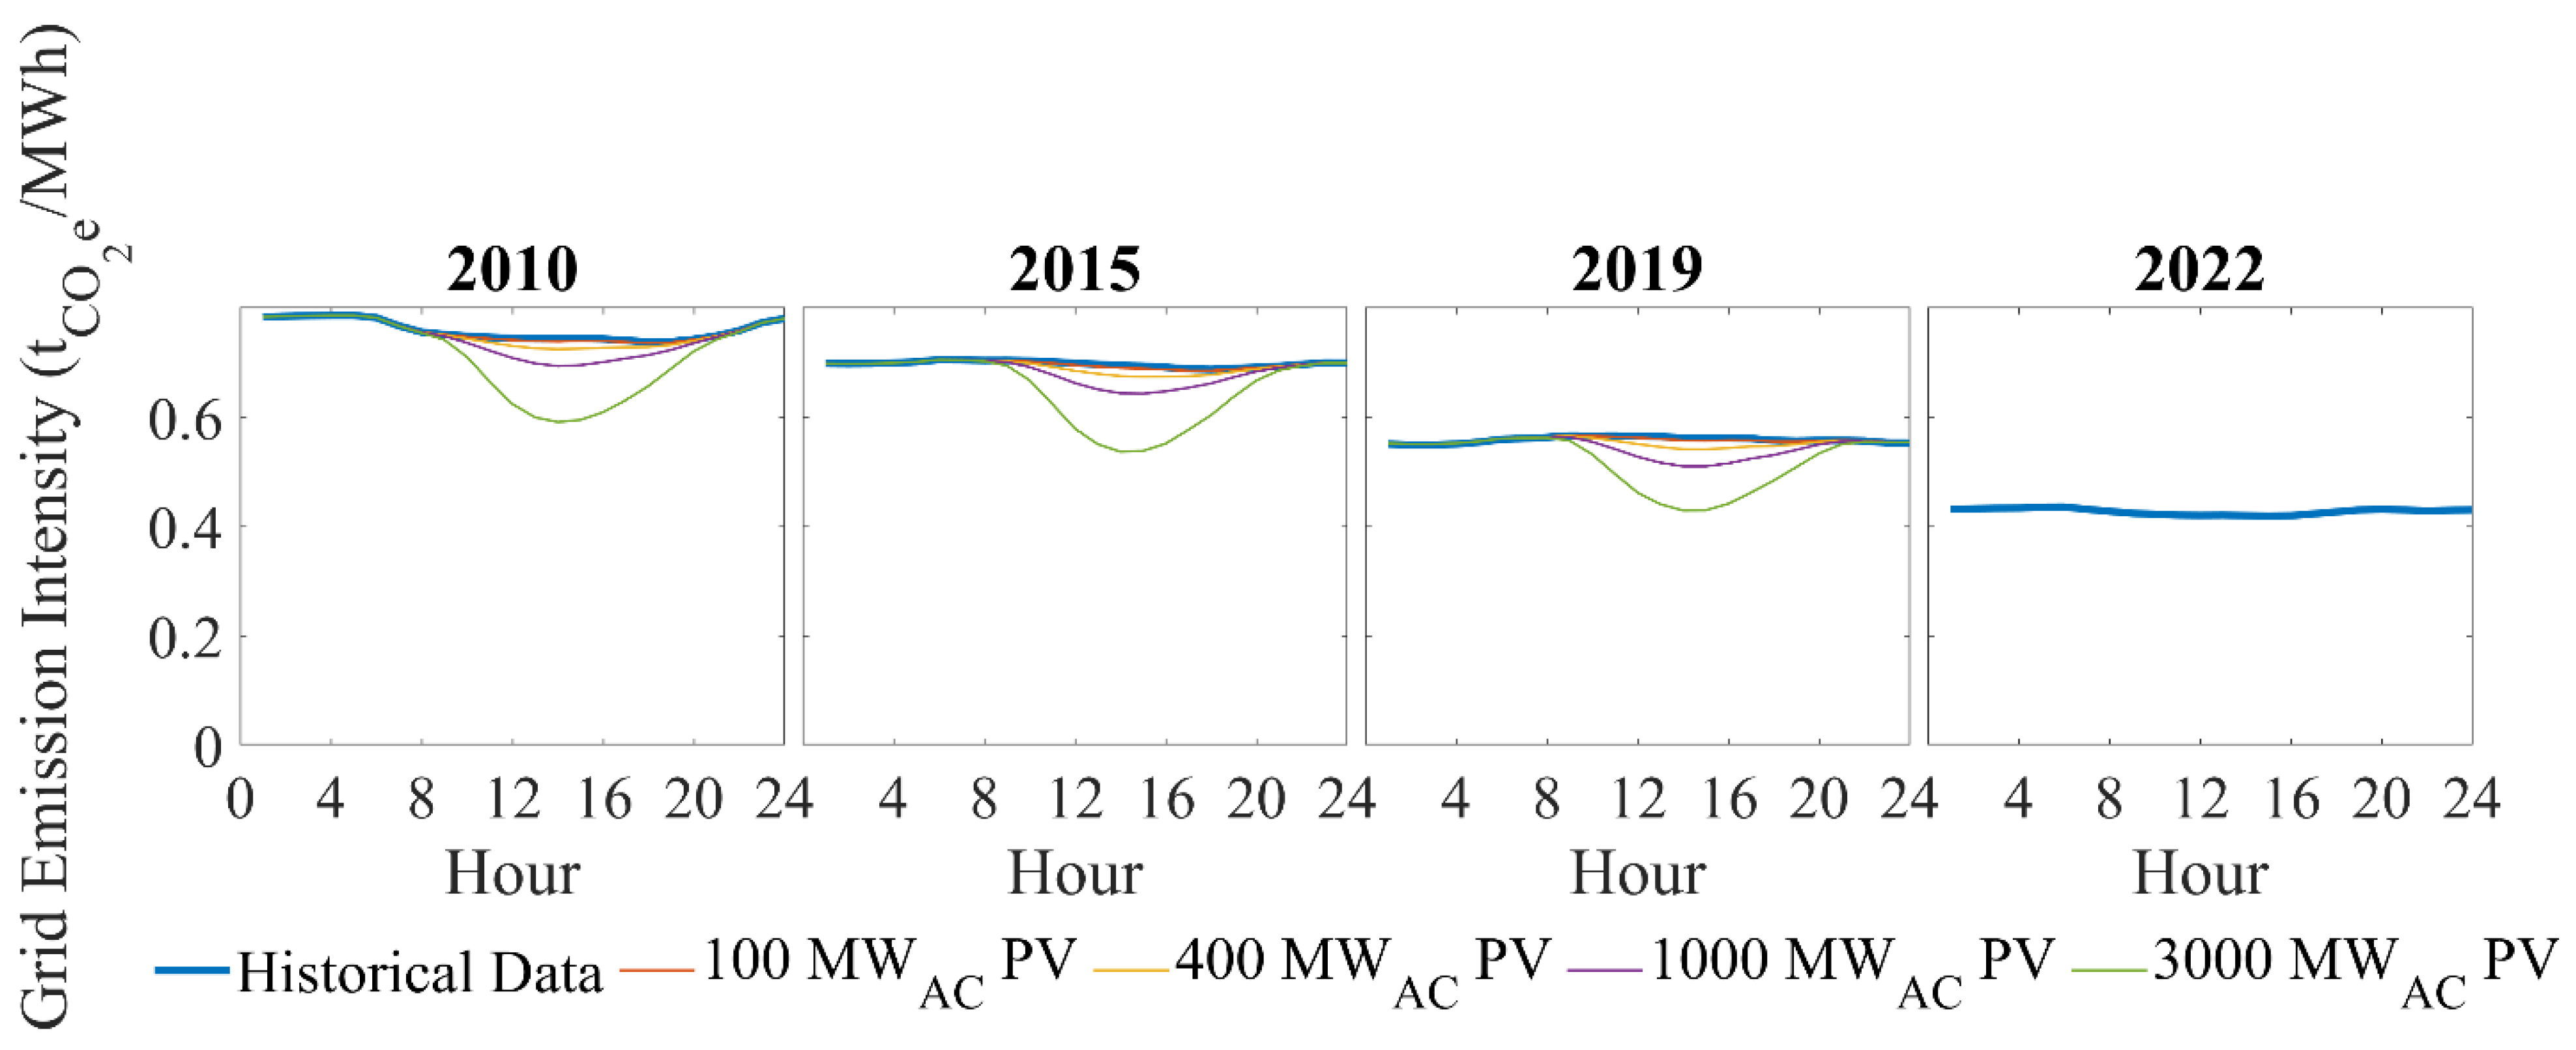
3.4. Greenhouse Gas Emissions Displacement
3.5. Comparison with the Literature
3.6. Discussion
3.7. Limitations of This Analysis
4. Conclusions and Policy Implications
Author Contributions
Funding
Institutional Review Board Statement
Informed Consent Statement
Data Availability Statement
Conflicts of Interest
References
- Pöyry, Wind Energy and Electricity Prices. Exploring the ‘Merit Order Effect’. Available online: www.artoos.be (accessed on 19 March 2025).
- Jain, S.; Shrimali, G. Impact of renewable electricity on utility finances: Assessing merit order effect for an Indian utility. Energy Policy 2022, 168, 113092. [Google Scholar] [CrossRef]
- De Siano, R.; Sapio, A. Spatial merit order effects of renewables in the Italian power exchange. Energy Econ. 2022, 108, 105827. [Google Scholar] [CrossRef]
- Macedo, D.P.; Marques, A.C.; Damette, O. The Merit-Order Effect on the Swedish bidding zone with the highest electricity flow in the Elspot market. Energy Econ. 2021, 102, 105465. [Google Scholar] [CrossRef]
- Antweiler, W.; Muesgens, F. On the long-term merit order effect of renewable energies. Energy Econ. 2021, 99, 105275. [Google Scholar] [CrossRef]
- Macedo, D.P.; Marques, A.C.; Damette, O. The impact of the integration of renewable energy sources in the electricity price formation: Is the Merit-Order Effect occurring in Portugal? Util. Policy 2020, 66, 101080. [Google Scholar] [CrossRef]
- Sirin, S.M.; Yilmaz, B.N. Variable renewable energy technologies in the Turkish electricity market: Quantile regression analysis of the merit-order effect. Energy Policy 2020, 144, 111660. [Google Scholar] [CrossRef]
- Figueiredo, N.C.; da Silva, P.P. The “Merit-order effect” of wind and solar power: Volatility and determinants. Renew. Sustain. Energy Rev. 2019, 102, 54–62. [Google Scholar] [CrossRef]
- Roldan-Fernandez, J.-M.; Burgos-Payan, M.; Riquelme-Santos, J.-M.; Trigo-Garcia, A.-L. The Merit-Order Effect of Energy Efficiency. Energy Procedia 2016, 106, 175–184. [Google Scholar] [CrossRef]
- Clò, S.; Cataldi, A.; Zoppoli, P. The merit-order effect in the Italian power market: The impact of solar and wind generation on national wholesale electricity prices. Energy Policy 2015, 77, 79–88. [Google Scholar] [CrossRef]
- Azofra, D.; Jiménez, E.; Martínez, E.; Blanco, J.; Saenz-Díez, J. Wind power merit-order and feed-in-tariffs effect: A variability analysis of the Spanish electricity market. Energy Convers. Manag. 2014, 83, 19–27. [Google Scholar] [CrossRef]
- Sensfuß, F.; Ragwitz, M.; Genoese, M. The merit-order effect: A detailed analysis of the price effect of renewable electricity generation on spot market prices in Germany. Energy Policy 2008, 36, 3086–3094. [Google Scholar] [CrossRef]
- Ueckerdt, F.; Brecha, R.J.; Luderer, G.; Sullivan, P.; Schmid, E.; Bauer, N.; Böttger, D. Variable Renewable Energy in modeling climate change mitigation scenarios. In Proceedings of the 2011 International Energy Workshop, Stanford, CA, USA, 6–8 July 2011. [Google Scholar]
- Denholm, P.; Margolis, R.; Milford, J. Production Cost Modeling for High Levels of Photovoltaics Penetration; National Renewable Energy Lab. (NREL): Golden, CO, USA, 2008. Available online: https://www.nrel.gov/docs/fy08osti/42305.pdf (accessed on 19 March 2025).
- Denholm, P.; O’Connell, M.; Brinkman, G.; Jorgenson, J. Overgeneration from Solar Energy in California: A Field Guide to the Duck Chart; National Renewable Energy Lab. (NREL): Golden, CO, USA, 2015. Available online: http://www.nrel.gov/docs/fy16osti/65453.pdf (accessed on 19 March 2025).
- NREL Transforming Energy. Ten Years of Analyzing the Duck Chart: How an NREL Discovery in 2008 Is Helping Enable More Solar on the Grid Today. Available online: https://www.nrel.gov/news/program/2018/10-years-duck-curve.html (accessed on 19 March 2025).
- Maticka, M.J. The SWIS DUCK—Value pricing analysis of commercial scale photovoltaic generation in the South West Interconnected System. Electr. J. 2019, 32, 57–65. [Google Scholar] [CrossRef]
- Brown, P.R.; O’sullivan, F.M. Shaping photovoltaic array output to align with changing wholesale electricity price profiles. Appl. Energy 2019, 256, 1–13. [Google Scholar] [CrossRef]
- Hirth, L. The market value of variable renewables: The effect of solar wind power variability on their relative price. Energy Econ. 2013, 38, 218–236. [Google Scholar] [CrossRef]
- Mansoor, A. Arshad Mansoor’s Post. Available online: https://www.linkedin.com/posts/electric-vehicle-models-expected-to-triple-activity-6745473036578803712-B0iT?trk=public_profile_like_view (accessed on 19 March 2025).
- Blazquez, J.; Fuentes-Bracamontes, R.; Bollino, C.A.; Nezamuddin, N. The renewable energy policy Paradox. Renew. Sustain. Energy Rev. 2018, 82, 1–5. [Google Scholar] [CrossRef]
- Clò, S.; D’Adamo, G. The dark side of the sun: How solar power production affects the market value of solar and gas sources. Energy Econ. 2015, 49, 523–530. [Google Scholar] [CrossRef]
- Kyritsis, E.; Andersson, J.; Serletis, A. Electricity prices, large-scale renewable integration, and policy implications. Energy Policy 2017, 101, 550–560. [Google Scholar] [CrossRef]
- Maniatis, G.I.; Milonas, N.T. The impact of wind and solar power generation on the level and volatility of wholesale electricity prices in Greece. Energy Policy 2022, 170, 113243. [Google Scholar] [CrossRef]
- Ederer, N. The market value and impact of offshore wind on the electricity spot market: Evidence from Germany. Appl. Energy 2015, 154, 805–814. [Google Scholar] [CrossRef]
- Garcia-Casals, X.; Bianco, E. Potential Limitations of Marginal Pricing for a Power System Based on Renewables; IRENA: Abu Dhabi, United Arab Emirates, 2022; Available online: https://www.irena.org/Technical-Papers/Potential-Limitations-of-Marginal-Pricing-for-a-Power-System-Based-on-Renewables (accessed on 19 March 2025).
- Gelabert, L.; Labandeira, X.; Linares, P. An ex-post analysis of the effect of renewables and cogeneration on Spanish electricity prices. Energy Econ. 2011, 33, S59–S65. [Google Scholar] [CrossRef]
- Suliman, M.S.; Farzaneh, H. Econometric analysis of pricing and energy policy regulations in Japan electric power exchange spot market. Clean. Eng. Technol. 2022, 9, 100523. [Google Scholar] [CrossRef]
- Ciarreta, A.; Espinosa, M.P.; Pizarro-Irizar, C. Is green energy expensive? Empirical evidence from the Spanish electricity market. Energy Policy 2014, 69, 205–215. [Google Scholar] [CrossRef]
- Hirth, L. The Market Value of Wind Energy. 2016. Available online: https://neon.energy/Neon_Market-value_Energiforsk.pdf (accessed on 19 March 2025).
- Steiner, P.O. Peak Loads and Efficient Pricing. Q. J. Econ. 1957, 71, 585–610. Available online: https://www.jstor.org/stable/1885712 (accessed on 19 March 2025). [CrossRef]
- Boiteux, M. Peak-load pricing. J. Bus. 1960, 33, 157–179. Available online: https://www.jstor.org/stable/2351015 (accessed on 19 March 2025). [CrossRef]
- Restel, L.; Say, K. Counteracting the duck curve: Prosumage with time-varying import and export electricity tariffs. Energy Policy 2024, 198, 114461. [Google Scholar] [CrossRef]
- Bublitz, A.; Keles, D.; Fichtner, W. An analysis of the decline of electricity spot prices in Europe: Who is to blame? Energy Policy 2017, 107, 323–336. [Google Scholar] [CrossRef]
- Market Surveillance Administrator. Alberta Wholesale Electricity Market; Market Surveillance Administrator: Calgary, AB, Canada, 2010; Available online: www.albertamsa.ca (accessed on 19 March 2025).
- Brown, D.P.; Eckert, A. Pricing Patterns in Wholesale Electricity Markets: Unilateral Market Power or Coordinated Behavior? University of Alberta: Edmonton, AB, Canada, 2019; Available online: https://sites.ualberta.ca/~econwps/2019/wp2019-09.pdf (accessed on 19 March 2025).
- Government of Alberta. Renewable Electricity Act; Government of Alberta: Edmonton, AB, Canada, 2016; Available online: https://www.qp.alberta.ca/1266.cfm?page=r16p5.cfm&leg_type=Acts&isbncln=9780779814060 (accessed on 19 March 2025).
- Severson-Baker, C. For the First Time in More Than 150 Years, Alberta’s Electricity Is Coal Free. Available online: https://www.pembina.org/op-ed/first-time-more-150-years-albertas-electricity-coal-free (accessed on 19 March 2025).
- Environment and Climate Change Canada. Pan-Canadian Approach to Pricing Carbon Pollution, Interim Report 2020; Environment and Climate Change Canada: Gatineau, QC, Canada, 2020; Available online: http://publications.gc.ca/collections/collection_2021/eccc/En4-423-1-2021-eng.pdf (accessed on 19 March 2025).
- Energy Hub Solar Energy Maps Canada (Every Province). Available online: https://www.energyhub.org/solar-energy-maps-canada/ (accessed on 19 March 2025).
- Gallagher, J.; Lopez, C.; Mah, J.; McGarrigle, A.; McGarrigle, P.; Olien, L. Alberta’s Solar PV Value Chain Opportunities; Solar Energy Consulting: Calgary, AB, Canada, 2018; Available online: https://solaralberta.ca/wp-content/uploads/2020/03/Albertas-Solar-PV-Supply-Value-Chain-Opportunities-Report.pdf (accessed on 19 March 2025).
- Durán-Castillo, G.E.; Weis, T.; Leach, A.; Fleck, B.A. Revenue-optimized photovoltaic orientation in a northern competitive electricity market with carbon offsets. Energy Rep. 2023, 10, 3133–3145. [Google Scholar] [CrossRef]
- Hirth, L. Integration costs and the value of wind power. SSRN Electron. J. 2012, 1–29. [Google Scholar] [CrossRef]
- U.S. Energy Information Administration (EIA). Capital Cost and Performance Characteristic Estimates for Utility Scale Electric Power Generating Technologies; U.S. Energy Information Administration (EIA): Washington, DC, USA, 2020. Available online: https://www.eia.gov/analysis/studies/powerplants/capitalcost/pdf/capital_cost_AEO2020.pdf (accessed on 19 March 2025).
- National Renewable Energy Laboratory. Utility-Scale Battery Storage. Available online: https://atb.nrel.gov/electricity/2021/utility-scale_battery_storage (accessed on 19 March 2025).
- Gilman, P. SAM photovoltaic model technical reference. Sol. Energy 2015, 63, 323–333. [Google Scholar]
- Ineichen, P.; Perez, R.R.; Seal, R.D.; Maxwell, E.L.; Zalenka, A.J.A.T. Dynamic global-to-direct irradiance conversion models. ASHRAE Trans. 1992, 98, 354–369. Available online: https://archive-ouverte.unige.ch/unige:38583/ATTACHMENT01 (accessed on 19 March 2025).
- Sandia National Laboratories. pvl_dirint Determine DNI from GHI Using the DIRINT Modification of the DISC Model. Available online: https://github.com/sandialabs/MATLAB_PV_LIB/blob/master/pvl_dirint.m (accessed on 19 March 2025).
- Perez, R.; Stewart, R.; Seals, R.; Guertin, T. The development and verification of the Perez diffuse radiation model. Sandia Rep. 1988. [Google Scholar]
- Perez, R.; Ineichen, P.; Seals, R.; Michalsky, J.; Stewart, R. Modeling daylight availability and irradiance components from direct and global irradiance. Sol. Energy 1990, 44, 271–289. [Google Scholar] [CrossRef]
- De Soto, W.; Klein, S.; Beckman, W. Improvement and validation of a model for photovoltaic array performance. Sol. Energy 2006, 80, 78–88. [Google Scholar] [CrossRef]
- Deline, C.; Dobos, A.; Janzou, S.; Meydbray, J.; Donovan, M. A simplified model of uniform shading in large photovoltaic arrays. Sol. Energy 2013, 96, 274–282. [Google Scholar] [CrossRef]
- Appelbaum, J.; Bany, J. Shadow effect of adjacent solar collectors in large scale systems. Sol. Energy 1979, 23, 497–507. [Google Scholar] [CrossRef]
- De Soto, W. Improvement and Validation of a Model for Photovoltaic Array Performance. Master’s Thesis, University of Wisconsin-Madison: Madison, WI, USA, 2004. [Google Scholar]
- King, D.L.; Gonzalez, S.G.; Galbraith, M.; Boyson, W.E. Performance Model for Grid-Connected Photovoltaic Inverters. Available online: https://www.osti.gov/servlets/purl/920449 (accessed on 19 March 2025).
- Leonics. Basics of MPPT Solar Charge Controller. Available online: https://www.leonics.com/support/article2_14j/articles2_14j_en.php#:~:text=MPPT%20or%20Maximum%20Power%20Point, (accessed on 19 March 2025).
- Brown, P.R.; O’Sullivan, F.M. Spatial and temporal variation in the value of solar power across United States electricity markets. Renew. Sustain. Energy Rev. 2020, 121, 109594. [Google Scholar] [CrossRef]
- Natural Resources Canada. Annual Photovoltaic Potential: South-Facing with Latitude Tilt 2020. Available online: https://natural-resources.canada.ca/sites/www.nrcan.gc.ca/files/Annual%20South-facing%20Latitude%20Tilt.jpg (accessed on 19 March 2025).
- Alberta Climate Information Service (ACIS). Current and Historical Alberta Weather Station Data Viewer. Available online: https://acis.alberta.ca/weather-data-viewer.jsp (accessed on 19 March 2025).
- Environment and Climate Change Canada (ECCC). Historical Data. Available online: https://climate.weather.gc.ca/historical_data/search_historic_data_e.html (accessed on 19 March 2025).
- National Renewable Energy Laboratory (NREL). NSRDB Data Viewer. Available online: https://maps.nrel.gov/nsrdb-viewer/?aL=x8CI3i%255Bv%255D%3Dt%26ozt_aP%255Bv%255D%3Dt%26ozt_aP%255Bd%255D%3D1&bL=clight&cE=0&lR=0&mC=4.740675384778373%2C23.027343749999996&zL=2 (accessed on 19 March 2025).
- Alberta Power Law. Understanding Alberta’s Wind Discount and Lower Capture Rates. Alberta Power Market. Available online: https://albertapowermarket.com/2017/02/28/understanding-albertas-wind-discount-and-lower-capture-rates/ (accessed on 19 March 2025).
- Hitchens, K. What Is Energy Arbitrage in Battery Storage? Available online: https://www.pcienergysolutions.com/2024/09/04/energy-arbitrage-strategies-to-maximize-profits-for-battery-storage-optimization/ (accessed on 19 March 2025).
- Brown, T.; Neumann, F.; Riepin, I. Price Formation Without Fuel Costs: The Interaction of demand elasticity with storage bidding. arXiv 2024, arXiv:2407.21409. [Google Scholar] [CrossRef]
- Carson, L.; Olexiuk, P.; Saric, D. Upcoming Developments in Alberta’s Carbon Emissions Regulations; OSLER: Calgary, AB, Canada, 2015; Available online: https://www.osler.com/en/resources/regulations/2015/upcoming-developments-in-alberta-s-carbon-emission (accessed on 19 March 2025).
- Saric, D.; Carson, L. Carbon Competitiveness Incentive Regulation Replaces and Adds Rigour to Alberta’s Existing Industrial Carbon Emissions Regulation; OSLER: Calgary, AB, Canada, 2017; Available online: https://www.osler.com/en/resources/regulations/2017/carbon-competitiveness-incentive-regulation-replac (accessed on 19 March 2025).
- Government of Alberta. Alta Reg 255/2017 Carbon Competitiveness Incentive Regulation; Government of Alberta: Edmonton, AB, Canada, 2018; Available online: www.qp.alberta.ca (accessed on 19 March 2025).
- EnergyRates.ca. Alberta Carbon Tax and Rebates. 2020. Available online: https://energyrates.ca/alberta/alberta-carbon-levy-rebates/ (accessed on 19 March 2025).
- Alberta Electric System Operator (AESO). AESO 2021 Long-Term Outlook; Alberta Electric System Operator (AESO): Calgary, AB, Canada, 2021; Available online: https://www.aeso.ca/assets/Uploads/grid/lto/2021-Long-term-Outlook.pdf (accessed on 19 March 2025).
- Prol, J.L.; Steininger, K.W.; Zilberman, D. The cannibalization effect of wind and solar in the California wholesale electricity market. Energy Econ. 2020, 85, 104552. [Google Scholar] [CrossRef]
- Cevik, S.; Ninomiya, K. Chasing the Sun and Catching the Wind: Energy Transition and Electricity Prices in Europe. J. Econ. Financ. 2023, 47, 912–935. [Google Scholar] [CrossRef]
- Market Surveillance Administrator. Q4/2016 Quarterly Report. 2016. Available online: https://www.albertamsa.ca/assets/Documents/2017-02-16-2016-Q4-Quarterly-Report.pdf (accessed on 19 March 2025).
- Market Surveillance Administrator. Quarterly Report for Q4 2022. 2023. Available online: https://www.albertamsa.ca/assets/Documents/Q4-2022-Quarterly-Report.pdf (accessed on 19 March 2025).
- Frew, B.A.; Clark, K.; Bloom, A.P.; Milligan, M. Marginal Cost Pricing in a World Without Perfect Competition: Implications for Electricity Markets with High Shares of Low Marginal Cost Resources; National Renewable Energy Lab.(NREL): Golden, CO, USA, 2017. [Google Scholar]
- Ciarreta, A.; Espinosa, M.P.; Pizarro-Irizar, C. Has renewable energy induced competitive behavior in the Spanish electricity market? Energy Policy 2017, 104, 171–182. [Google Scholar] [CrossRef]
- Market Surveillance Administrator. Q2/13 Quarterly Report Market. 2013. Available online: https://www.albertamsa.ca/assets/Documents/2013Q2_Aug6.pdf (accessed on 19 March 2025).
- Market Surveillance Administrator. Quarterly Report for Q1 2022. 2022. Available online: https://www.albertamsa.ca/assets/Documents/Q1-2022-Quarterly-Report.pdf (accessed on 19 March 2025).
- Market Surveillance Administrator. Quarterly Report for Q2 2022. 2022. Available online: https://www.albertamsa.ca/assets/Documents/Q2-2022-Quarterly-Report.pdf (accessed on 19 March 2025).
- Market Surveillance Administrator. Quarterly Report for Q3 2022. 2022. Available online: https://www.albertamsa.ca/assets/Documents/Q3-2022-Presentation.pdf (accessed on 19 March 2025).
- Market Surveillance Administrator. Q4 /13 Quarterly Report Market. 2014. Available online: https://www.albertamsa.ca/assets/Documents/Q4_2013-140131-Final.pdf (accessed on 19 March 2025).
- Alberta Electric System Operator (AESO). AESO 2021 Annual Market Statistics; Alberta Electric System Operator (AESO): Calgary, AB, Canada, 2021; Available online: https://www.aeso.ca/assets/Uploads/market-and-system-reporting/2021-Annual-Market-Stats-Final.pdf (accessed on 19 March 2025).
- California ISO. What the Duck Curve Tells Us About Managing a Green Grid. Available online: https://www.caiso.com/Documents/FlexibleResourcesHelpRenewables_FastFacts.pdf (accessed on 19 March 2025).
- Alberta Electric System Operator (AESO). Reliability Requirements Roadmap; Alberta Electric System Operator (AESO): Calgary, AB, Canada, 2023; Available online: https://www.aeso.ca/assets/Uploads/future-of-electricity/AESO-2023-Reliability-Requirements-Roadmap.pdf (accessed on 19 March 2025).
- Miller, N.W.; Shao, M.; Pajic, S.; D’Aquila, R. Western Wind and Solar Integration Study Phase 3: Frequency Response and Transient Stability; NREL Technical Report; National Renewable Energy Lab. (NREL): Golden, CO, USA, 2014; pp. 1–213. [Google Scholar] [CrossRef]
- Natural Resources Canada. Canada Invests in Smart Grid Technology in Alberta. Available online: https://www.canada.ca/en/natural-resources-canada/news/2021/03/canada-invests-in-smart-grid-technology-in-alberta.html (accessed on 19 March 2025).
- Gorjian, A.; Eskandari, M.; Moradi, M.H. Conservation Voltage Reduction in Modern Power Systems: Applications, Implementation, Quantification, and AI-Assisted Techniques. Energies 2023, 16, 2502. [Google Scholar] [CrossRef]
- Shang, Y. Resilient Multiscale Coordination Control against Adversarial Nodes. Energies 2018, 11, 1844. [Google Scholar] [CrossRef]
- AESO 2022 Long-term Transmission Plan. Available online: https://www.aeso.ca/assets/Uploads/grid/ltp/AESO-2022-Long-term-Transmission-Plan.pdf (accessed on 19 March 2025).
- Alberta Electric System Operator (AESO). Current Supply Demand Report; Alberta Electric System Operator (AESO): Calgary, AB, Canada, 2025; Available online: http://ets.aeso.ca/ets_web/ip/Market/Reports/CSDReportServlet (accessed on 19 March 2025).
- Alberta Electric System Operator (AESO). Connection Project Reporting; Alberta Electric System Operator (AESO): Calgary, AB, Canada, 2025; Available online: https://www.aeso.ca/grid/transmission-projects/connection-project-reporting (accessed on 19 March 2025).
- Alberta Energy. Transmission Development. The Right Path for ALBERTA. A Policy Paper; Alberta Energy: Edmonton, AB, Canada, 2003; Available online: https://open.alberta.ca/dataset/0db52c69-eed1-4f4a-997c-a47d57cc9788/resource/7238f12e-2a43-41dc-856e-c623a9fc57a3/download/3103222-2003-transmission-development-policy.pdf (accessed on 19 March 2025).
- Greer, M. Electricity Marginal Cost Pricing; Elsevier: Amsterdam, The Netherlands, 2012. [Google Scholar] [CrossRef]

| Economic Metric | Environmental Metric | Generation Metric |
|---|---|---|
| Hourly price | Grid emission intensity | Load after PV energy is introduced |
| Market value | Displaced emissions per plant type after the introduction of PV energy | Displaced dispatch per plant type after the introduction of PV energy |
| Value factor |
| Price Regime | Charging Price (Buying) (CAD/MWh) | Discharging Price (Selling) (CAD/MWh) | Price Arbitrage (Selling Price−Buying Price) (CAD/MWh) |
|---|---|---|---|
| Low (2017) | 14.53 | 20.85 | 6.32 |
| Medium (2019) | 21.94 | 40.25 | 18.31 |
| High (2013) | 10.87 | 39.16 | 28.29 |
| Year | Total Market Energy (TWh) | Annual Emission Intensity (tCO2e/MWh) | Total Market Emissions (MtCO2e) | Hypothetical PV Capacity (GW) | Displaced Emissions Intensity (tCO2e/MWh) | Hypothetical Displaced Emissions (MtCO2e) |
|---|---|---|---|---|---|---|
| 2010 | 66.1 | 0.76 | 50.1 | 1 | 0.72 | 1.00 |
| 3 | 0.77 | 3.19 | ||||
| 2015 | 74.5 | 0.70 | 52.0 | 1 | 0.80 | 1.15 |
| 3 | 0.85 | 3.67 | ||||
| 2019 | 77.3 | 0.56 | 43.3 | 1 | 0.87 | 1.25 |
| 3 | 0.77 | 3.32 |
Disclaimer/Publisher’s Note: The statements, opinions and data contained in all publications are solely those of the individual author(s) and contributor(s) and not of MDPI and/or the editor(s). MDPI and/or the editor(s) disclaim responsibility for any injury to people or property resulting from any ideas, methods, instructions or products referred to in the content. |
© 2025 by the authors. Licensee MDPI, Basel, Switzerland. This article is an open access article distributed under the terms and conditions of the Creative Commons Attribution (CC BY) license (https://creativecommons.org/licenses/by/4.0/).
Share and Cite
Durán-Castillo, G.; Weis, T.; Leach, A.; Fleck, B.A. Toward Sustainable Electricity Markets: Merit-Order Dynamics on Photovoltaic Energy Price Duck Curve and Emissions Displacement. Sustainability 2025, 17, 4618. https://doi.org/10.3390/su17104618
Durán-Castillo G, Weis T, Leach A, Fleck BA. Toward Sustainable Electricity Markets: Merit-Order Dynamics on Photovoltaic Energy Price Duck Curve and Emissions Displacement. Sustainability. 2025; 17(10):4618. https://doi.org/10.3390/su17104618
Chicago/Turabian StyleDurán-Castillo, Gloria, Tim Weis, Andrew Leach, and Brian A. Fleck. 2025. "Toward Sustainable Electricity Markets: Merit-Order Dynamics on Photovoltaic Energy Price Duck Curve and Emissions Displacement" Sustainability 17, no. 10: 4618. https://doi.org/10.3390/su17104618
APA StyleDurán-Castillo, G., Weis, T., Leach, A., & Fleck, B. A. (2025). Toward Sustainable Electricity Markets: Merit-Order Dynamics on Photovoltaic Energy Price Duck Curve and Emissions Displacement. Sustainability, 17(10), 4618. https://doi.org/10.3390/su17104618