
Research on Rural Households’ Poverty Vulnerability in Poor Mountainous Areas: An Empirical Analysis in the Upper Reaches of the Min River, China

Abstract
1. Introduction
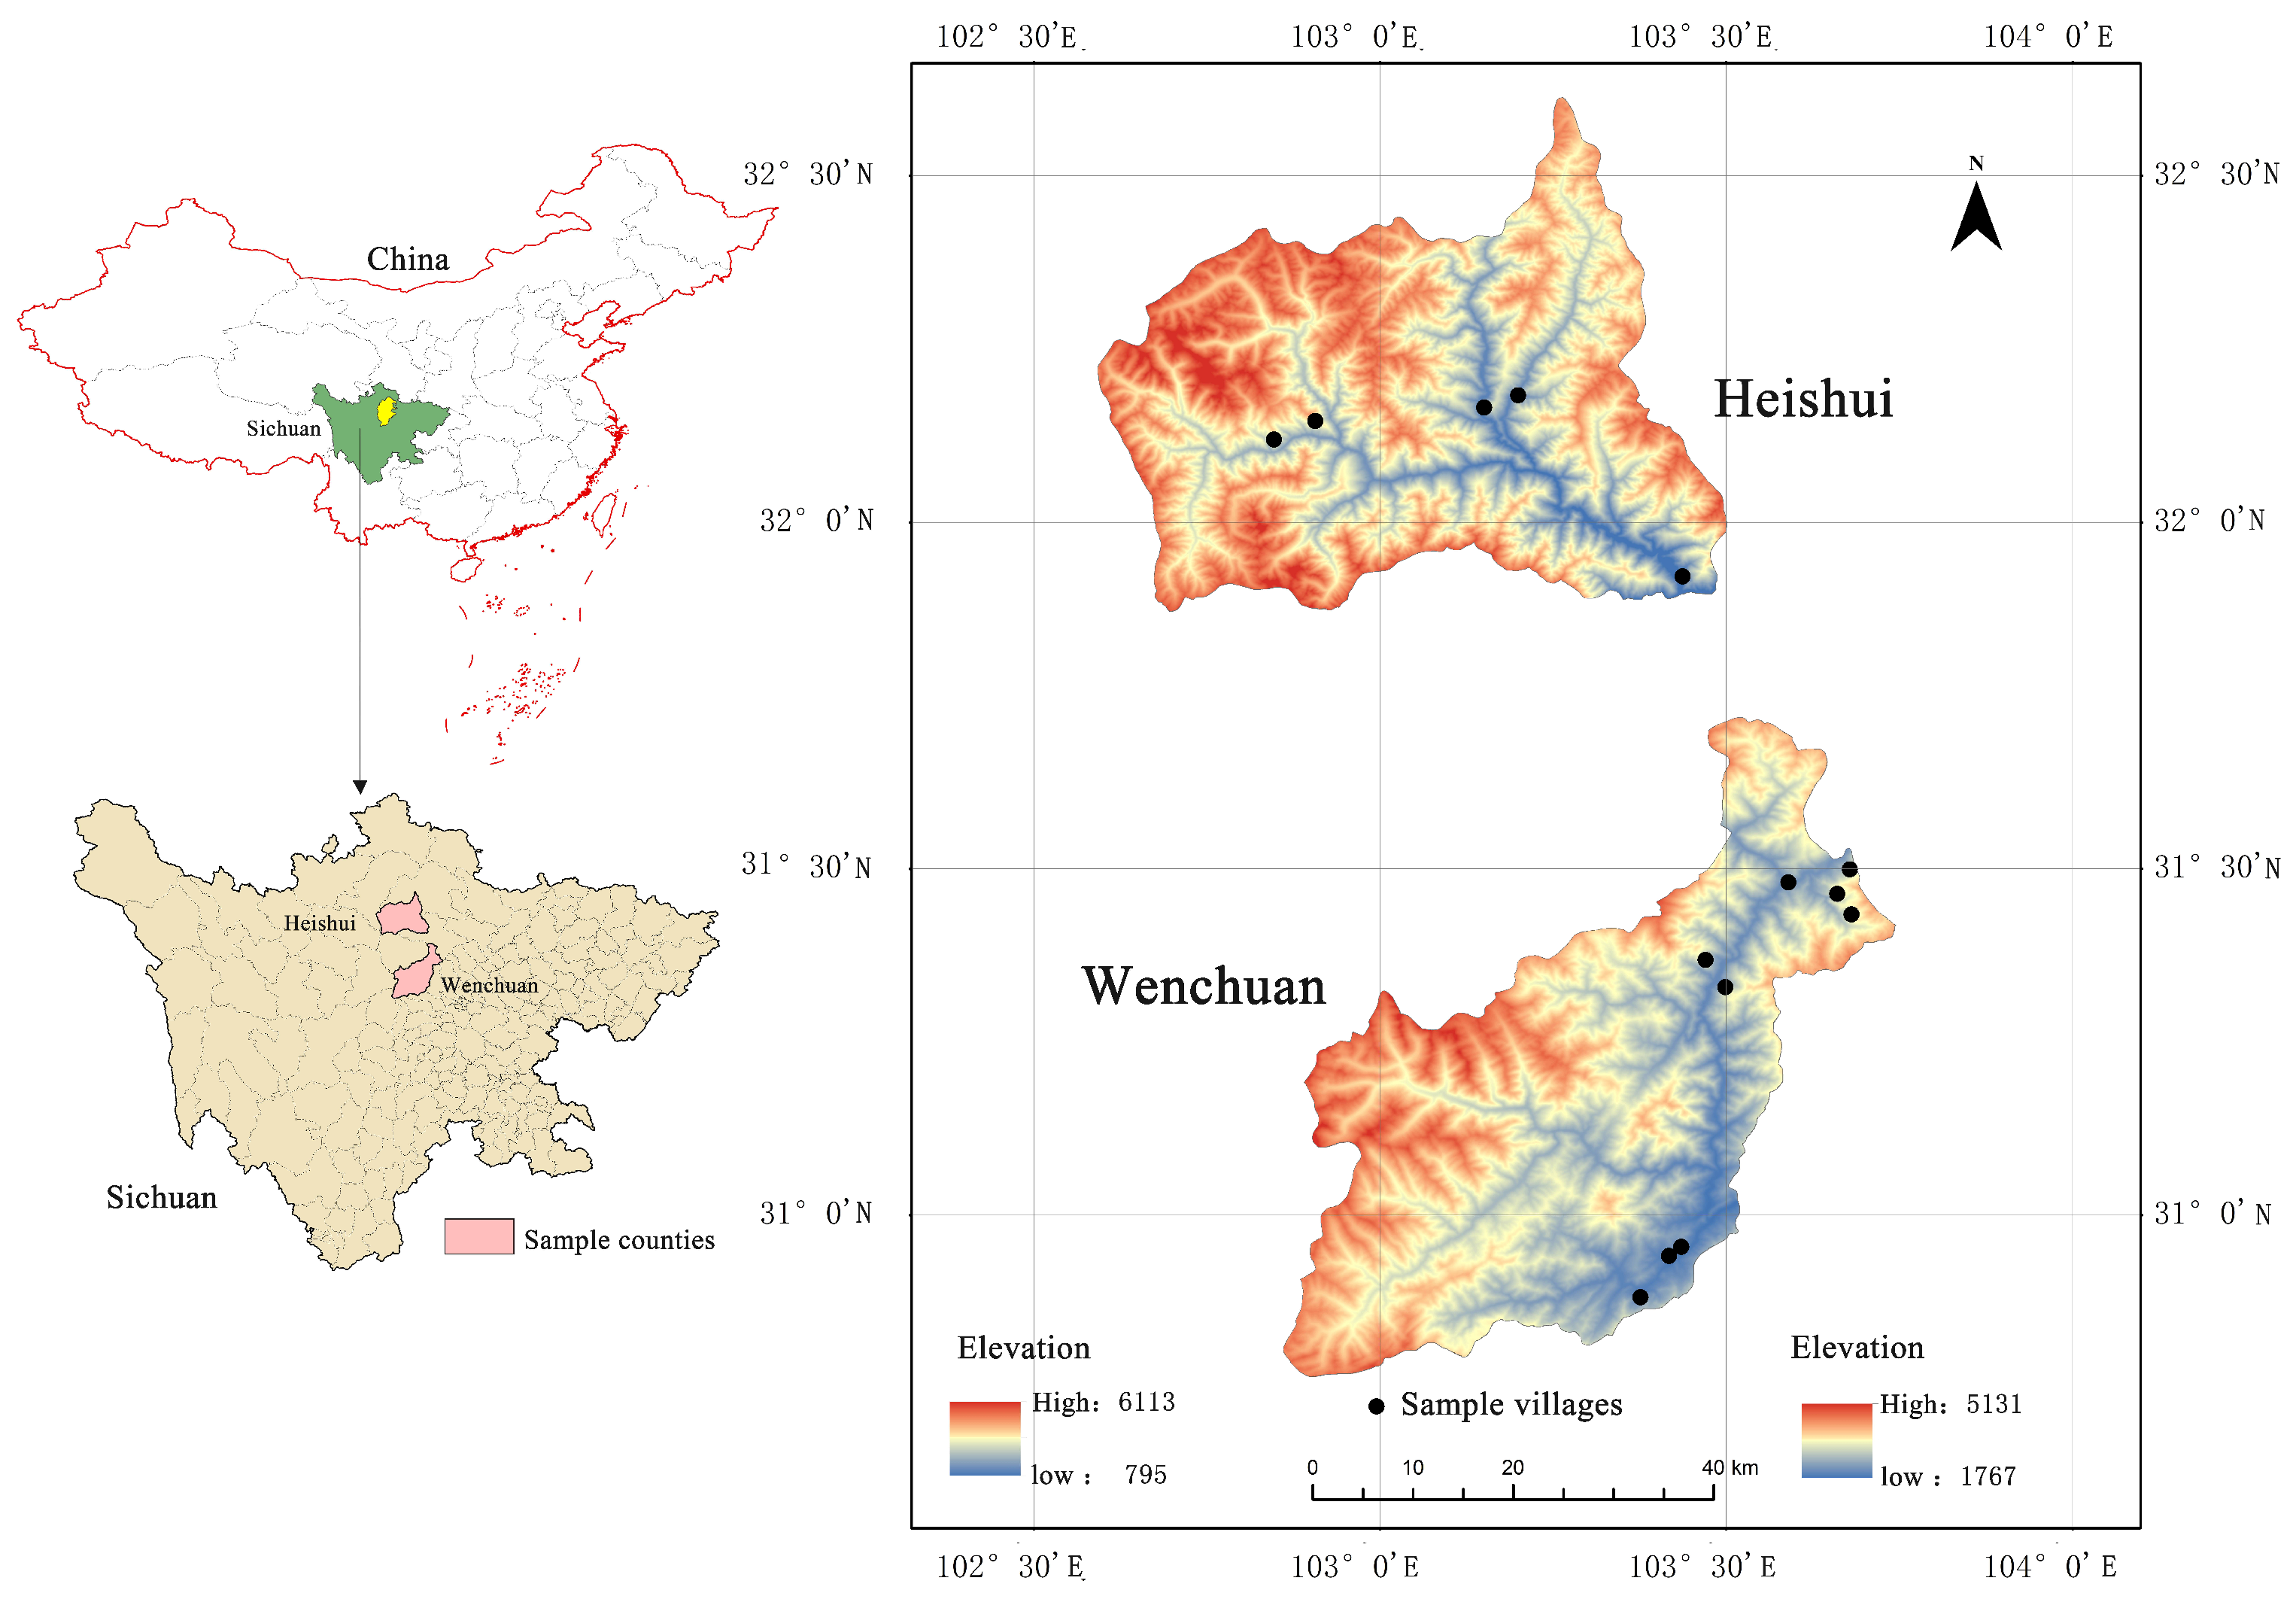
2. Study Area
3. Research Data and Research Methods
3.1. The Sources of Research Data
3.2. Theoretical Research Framework
3.3. Model and Variables
3.4. Research Methods
4. Results
4.1. Variables’ Descriptive Statistical Characteristics
4.2. Results Analysis of Farmers’ Poverty Vulnerability
4.2.1. Results Analysis of Average Consumption Value
4.2.2. Results Analysis for Consumption Fluctuations
4.3. Robustness Test
5. Discussion
6. Conclusions
Funding
Institutional Review Board Statement
Informed Consent Statement
Data Availability Statement
Acknowledgments
Conflicts of Interest
References
- Gamboa, G.; Mingorría, S.; Scheidel, A. The meaning of poverty matters: Trade-offs in poverty reduction programmes. Ecol. Econ. 2020, 169, 106450. [Google Scholar] [CrossRef]
- Alkire, S.; Kovesdi, F.; Scheja, E.; Vollmer, F. Moderate multidimensional poverty index: Paving the way out of poverty. Soc. Indic. Res. 2023, 168, 409–445. [Google Scholar] [CrossRef] [PubMed]
- Zhou, Y.; Guo, Y.; Liu, Y. Health, income and poverty: Evidence from China’s rural household survey. Int. J. Equity Health 2020, 19, 36. [Google Scholar] [CrossRef] [PubMed]
- Zhang, Z.; Song, J.; Yan, C.; Xu, D.; Wang, W. Rural household differentiation and poverty vulnerability: An empirical analysis based on the field survey in Hubei, China. Int. J. Environ. Res. Public Health 2022, 19, 4878. [Google Scholar] [CrossRef]
- Su, J.; Guo, S. Human capital and rural households’ vulnerability to relative poverty: Evidence from China. Discret. Dyn. Nat. Soc. 2022, 2022, 3960691. [Google Scholar] [CrossRef]
- Chi, X.; Liu, X.; Zhang, Z. Measuring multidimensional health poverty in China. Front. Public Health 2022, 9, 786325. [Google Scholar] [CrossRef]
- Liu, J.; Yang, M.; Zhang, Z. Can rural cooperatives reduce poverty vulnerability of smallholder households? Evidence from rural Western China. Front. Sustain. Food Syst. 2023, 7, 1222455. [Google Scholar] [CrossRef]
- Ma, Y.; Xiang, Q.; Yan, C.; Liao, H.; Wang, J. Poverty vulnerability and health risk action path of families of rural elderly with chronic diseases: Empirical analysis of 1852 families in central and western China. Front. Public Health 2022, 10, 776901. [Google Scholar]
- Hernandez, J.; Zuluaga, B. Vulnerability to multidimensional poverty: An application to Colombian households. Soc. Indic. Res. 2022, 164, 345–371. [Google Scholar] [CrossRef]
- Zhou, Z.; Yu, Z.; Wu, H. Climate shocks, household resource allocation, and vulnerability to poverty. Agriculture 2022, 12, 971. [Google Scholar] [CrossRef]
- Millard, J.; Fucci, V. The role of social innovation in tackling global poverty and vulnerability. Front. Sociol. 2023, 8, 966918. [Google Scholar] [CrossRef] [PubMed]
- Bui, L.; Hoang, H. Non-farm employment, food poverty and vulnerability in rural Vietnam. Environ. Dev. Sustain. 2021, 23, 7326–7357. [Google Scholar] [CrossRef]
- Sordo, M.; Ramos, H.; Ramos, C. Poverty measures and poverty orderings. Sort-Stat. Oper. Res. T. 2007, 31, 169–180. [Google Scholar]
- Batool, K.; Zhao, Z.; Sun, H.; Irfan, M. Modeling the impact of energy poverty on income poverty, health poverty, educational poverty, and environmental poverty: A roadmap towards environmental sustainability. Environ. Sci. Pollut. Res. 2023, 30, 85276–85291. [Google Scholar] [CrossRef]
- Noonan, D.; Sadiq, A.A. Flood risk management: Exploring the impacts of the community rating system program on poverty and income inequality. Risk Anal. 2018, 38, 489–503. [Google Scholar] [CrossRef]
- Mahanta, R.; Das, D. Flood induced vulnerability to poverty: Evidence from Brahmaputra Valley, Assam, India. Int. J. Disast. Risk Reduct. 2017, 24, 451–461. [Google Scholar] [CrossRef]
- Okuda, K.; Kawasaki, A. Effects of disaster risk reduction on socio-economic development and poverty reduction. Int. J. Disast. Risk Reduct. 2022, 80, 103241. [Google Scholar] [CrossRef]
- World Bank. World Development Report 2000/2001: Attacking Poverty; Oxford University Press: Oxford, UK, 2001. [Google Scholar]
- Olayide, O.; Alabi, T. Between rainfall and food poverty: Assessing vulnerability to climate change in an agricultural economy. J. Clean. Prod. 2018, 198, 1–10. [Google Scholar] [CrossRef]
- Martinez-Cordero, F.; Sanchez-Zazueta, E. Poverty and vulnerability assessment of tilapia farmers in the southwestern States of Oaxaca, Guerrero, and Chiapas in Mexico. Aquacult. Econ. Manag. 2022, 26, 36–56. [Google Scholar] [CrossRef]
- Pritchett, L.; Suryahadi, A.; Sumarto, S. Quantifying Vulnerability to Poverty: A Proposed Measure, Applied to Indonesia; World Bank Publications: Washington, DC, USA, 2000. [Google Scholar]
- Sarkar, B.; Islam, A. Assessing poverty and livelihood vulnerability of the fishing communities in the context of pollution of the Churni River, India. Environ. Sci. Pollut. R. 2022, 29, 26575–26598. [Google Scholar] [CrossRef]
- Salvucci, V.; Santos, R. Vulnerability to natural shocks: Assessing the short-term impact on consumption and poverty of the 2015 flood in Mozambique. Ecol. Econ. 2020, 176, 106713. [Google Scholar] [CrossRef]
- Alwang, J.; Siegel, P.; Jorgensen, S. Vulnerability as Viewed from Different Disciplines; Social Protection Discussion Paper Series; World Bank: Washington, DC, USA, 2001. [Google Scholar]
- Bello, L.; Baiyegunhi, L.; Danso-Abbeam, G.; Ogunniyi, A.; Olagunju, K.; Abdoulaye, T.; Awotide, B. Assessing the impact of youth-in-agribusiness program on poverty and vulnerability to poverty in Nigeria. Agriculture 2022, 12, 735. [Google Scholar] [CrossRef]
- Ensor, T.; Bhattarai, R.; Manandhar, S.; Poudel, A.; Dhungel, R.; Baral, S.; Elsey, H. From rags to riches: Assessing poverty and vulnerability in urban Nepal. PLoS ONE 2020, 15, e0226646. [Google Scholar] [CrossRef] [PubMed]
- Kühl, J. Household poverty and vulnerability—A bootstrap approach. In Proceedings of the Northeast Universities Development Consortium Conference, Yale University, New Haven, CT, USA, 17–19 October 2003. [Google Scholar]
- Addai, K.; Ng’ombe, J.; Lu, W. Disaggregated impacts of off-farm work participation on household vulnerability to food poverty in Ghana. J. Econ. Inequal. 2023, 21, 83–104. [Google Scholar] [CrossRef]
- Chaudhuri, S.; Jalan, J.; Suryahadi, A. Assessing Household Vulnerability to Poverty from Cross-Sectional Data: A Methodology and Estimates from Indonesia; Columbia University, Department of Economics, Discussion Papers Series; Columbia University: New York, NY, USA, 2002; pp. 1–25. [Google Scholar]
- Li, Y.; Gong, X.; Zhang, J.; Xiang, Z.; Liao, C. The impact of mobile payment on household poverty vulnerability: A study based on CHFS2017 in China. Int. J. Environ. Res. Public Health 2022, 19, 14001. [Google Scholar] [CrossRef]
- Bidisha, S.; Mahmood, T.; Hossain, M. Assessing food poverty, vulnerability and food consumption inequality in the context of COVID-19: A case of Bangladesh. Soc. Indic. Res. 2021, 155, 187–210. [Google Scholar] [CrossRef]
- Jiang, Y.X.; Liu, Y. Does financial inclusion help alleviate household poverty and vulnerability in China? PLoS ONE 2022, 17, e0275577. [Google Scholar] [CrossRef]
- Kossova, T.; Kossova, E.; Sheluntcova, M. Investigating the relationship between alcohol consumption and subjective poverty in Russia. J. Public Health Pol. 2023, 44, 23–33. [Google Scholar] [CrossRef]
- Wei, Y.; Zhang, Z.; Zhang, M. Effects of health poverty alleviation project from the perspective of vulnerability to poverty: Evidence from five Chinese prefectures. Glob. Health Action 2023, 16, 2260142. [Google Scholar] [CrossRef]
- Chaudhuri, S.; Christiaensen, L. Assessing Household Vulnerability to Poverty: Illustrative Examples and Methodological Issues. In Proceedings of the IFPRI-World Bank Conference on Risk and Vulnerability, Estimation and Policy Applications, Washington, DC, USA, 23–24 September 2002; pp. 23–24. [Google Scholar]
- Glewwe, P.; Hall, G. Are some groups more vulnerable to macroeconomic shocks than others? Hypothesis tests based on panel data from Peru. J. Dev. Econ. 1998, 56, 181–206. [Google Scholar] [CrossRef]
- Dercon, S. Assessing Vulnerability to Poverty; Department for International Development: London, UK, 2001. [Google Scholar]
- Amin, S.; Rai, A.; Topa, G. Does microcredit reach the poor and vulnerable? Evidence from Northern Bangladesh. J. Dev. Econ. 1999, 70, 59–82. [Google Scholar] [CrossRef]
- Tai, X.; Li, J.; Li, S. Review of research on consumption smoothing of poor farmers. Econ. Perspect. 2008, 106–110. Available online: http://kdd.epsnet.com.cn/documentDetail?aId=349684&keyword=%E8%B4%AB%E5%9B%B0%E5%86%9C%E6%88%B7%E8%A1%8C%E4%B8%BA%E7%A0%94%E7%A9%B6 (accessed on 13 May 2025). (In Chinese).
- Wan, G.; Liu, F.; Zhang, Y. Poverty vulnerability decomposition from an asset perspective: An empirical analysis based on Chinese farm household panel data. Chin. Rural. Econ. 2014, 4–19. (In Chinese) [Google Scholar] [CrossRef]
- Damien, E. Characterizing vulnerability to poverty in rural Haiti: A multilevel decomposition approach. J. Agric. Econ. 2013, 65, 131–150. [Google Scholar]
- Jalan, J.; Ravallion, M. Behavioral responses to risk in rural China. J. Dev. Econ. 2001, 66, 23–49. [Google Scholar] [CrossRef]
- Udry, C. Risk and saving in northern Nigeria. Am. Econ. Rev. 1995, 85, 1287–1300. [Google Scholar]
- Tai, X.; Luo, C.; Li, S.; Li, C. The impact of migrant work on poverty vulnerability: Evidence from rural households in western mountainous areas, China. World Econ. Pap. 2009, 67–76. (In Chinese) [Google Scholar] [CrossRef]
- Zhao, L.; Kang, X.; Shi, J. Impact of land renting-out on the households’ poverty vulnerability and its regional differences. J. Nat. Resour. 2021, 36, 3099–3113. (In Chinese) [Google Scholar] [CrossRef]
- Fan, M.; Wang, X.; Yang, G. Spatial characteristics of vegetation habitat suitability and mountainous settlements and their quantitative relationships in upstream of Min River, southwestern of China. Ecol. Inform. 2022, 68, 101541. [Google Scholar] [CrossRef]
- He, Y.; Ding, M.; Liu, K.; Lei, M. The impact of geohazards on sustainable development of rural mountain areas in the Upper Reaches of the Min River. Front Earth Sci. 2022, 10, 862544. [Google Scholar] [CrossRef]
- Rajadel, T. Vulnerability and Participation to the Non-Agricultural Sector in Rural Pakistan; TEAM Working Paper; Université Paris: Paris, France, 2002. [Google Scholar]
- Paxson, C. Using weather variability to estimate the response of savings to transitory income in Thailand. Am. Econ. Rev. 1992, 82, 15–33. [Google Scholar]
- Xu, D.; Peng, L.; Liu, S.; Su, C.; Wang, X.; Chen, T. Influences of migrant work income on the poverty vulnerability disaster threatened area: A case study of the Three Gorges Reservoir area, China. Int. J. Disast. Risk Reduct. 2017, 22, 62–70. [Google Scholar] [CrossRef]
- Kochar, A. Explaining household vulnerability to idiosyncratic income shocks. Am. Econ. Rev. 1995, 85, 159–164. [Google Scholar]
- Kochar, A. Smoothing consumption by smoothing income: Hours-of-work responses to idiosyncratic agricultural shocks in rural India. Rev. Econ. Stat. 1999, 81, 50–61. [Google Scholar] [CrossRef]


| Sample Counties | Sample Towns | Sample Villages | Number of Valid Samples |
|---|---|---|---|
| Wenchuan (H) | Shuimo (H) | Laoren (H), Xianfengyan (M), Chenjiashan (L) | 80 |
| Miansi (M) | Sanguanmiao (H), Lianghe (M), Gaodian (L) | 90 | |
| Yanmen (L) | Koushan (H), Qingpo (M), Tongshan (L) | 86 | |
| Heishui (L) | Seergu (H) | Seergu | 38 |
| Shashiduo (M) | Yangrong (H), Jiazu (L) | 52 | |
| Zhawo (L) | Kebie (H), Ruoduo (L) | 49 |
| Variable | Assignment |
|---|---|
| C | The per capita consumption level in a household (RMB/person) |
| Age | Household head’s age in a household (years) |
| Edu | Education years of household head in a household (years) |
| Laborer | Number of laborers of rural households (persons) |
| Land | Cultivated land and garden plot area in a family (hm2) |
| Tool | Whether there are large-scale productive tools (water pump, tractors, and so on) in a household (0 = no; 1 = yes) |
| Deposit | Whether there are any deposits in a household (0 = no; 1 = yes) |
| Physicap | Present values of housing, production tools, vehicles, and durable goods in a family (RMB 10,000) |
| M | Migrant income’s ratio in total income of rural households (%) |
| Agri-shock | Whether the crop losses are more than RMB 1000 due to prices or extreme weather (0 = no; 1 = yes) |
| Hea-shock | Whether the medical expenses of family members exceed RMB 3000 (0 = no; 1 = yes) |
| Edu-shock | Whether the family’s expenditure on children’s education exceeds RMB 3000 (0 = no; 1 = yes) |
| Hou-shock | Whether the consumption of house construction or durable goods exceeds RMB 5000 (0 = no; 1 = yes) |
| Haza-shock | Whether the damage caused by disaster impact exceeds RMB 5000 (0 = no; 1 = yes) |
| Variable | Min | Max | Mean | SD |
|---|---|---|---|---|
| C | 333.33 | 667,400.00 | 8910.65 | 13,637.78 |
| M | 0.00 | 1.00 | 0.35 | 0.40 |
| Age | 19.00 | 81.00 | 48.71 | 13.00 |
| Edu | 0.00 | 16.00 | 5.88 | 3.69 |
| Laborer | 0.00 | 8.00 | 3.05 | 1.69 |
| Land | 0.00 | 1.63 | 0.30 | 0.31 |
| Tool | 0.00 | 1.00 | 0.29 | 0.45 |
| Deposit | 0.00 | 1.00 | 0.24 | 0.43 |
| Physicap | 0.36 | 333.39 | 30.33 | 34.63 |
| Agri-shock | 0.00 | 1.00 | 0.02 | 0.13 |
| Hea-shock | 0.00 | 1.00 | 0.36 | 0.48 |
| Edu-shock | 0.00 | 1.00 | 0.20 | 0.40 |
| Hou-shock | 0.00 | 1.00 | 0.13 | 0.34 |
| Haza-shock | 0.00 | 1.00 | 0.00 | 0.05 |
| Variable | |||
|---|---|---|---|
| Age | −0.001 | −0.005 | −0.006 |
| Edu | 0.040 *** | −0.181 | −0.048 *** |
| Laborer | 0.048 * | −0.051 | −0.031 |
| Land | 0.342 ** | ||
| Tool | 0.078 | ||
| Deposit | −0.106 | −0.187 *** | −0.498 |
| Physicap | −0.168 ** | −0.198 *** | |
| M | −0.045 * | −0.176 *** | |
| Agri-shock | 0.189 *** | ||
| Hea-shock | 0.245 * | ||
| Edu-shock | −0.138 | ||
| Hou-shock | 0.129 ** | ||
| Haza-shock | −0.160 | ||
| Constant | 8.949 *** | 0.801 ** | 0.687 * |
| F statistics | 3.39 *** | 6.94 *** | 5.74 *** |
| N | 395 | 395 | 395 |
| R-squared | 0.095 | 0.112 | 0.130 |
| Variable | 5% Winsorization | Replacing the Core Explanatory Variable | ||||
|---|---|---|---|---|---|---|
| Model 1 | Model 2 | Model 3 | Model 1 | Model 2 | Model 3 | |
| Age | −0.003 | −0.010 | −0.009 | −0.005 | −0.002 | −0.003 |
| Edu | 0.060 *** | −0.181 | −0.053 *** | 0.120 *** | −0.330 | −0.150 *** |
| Laborer | 0.062 * | −0.080 | −0.060 | 0.037 * | −0.025 | −0.160 |
| Land | 0.461 ** | 0.241 ** | ||||
| Tool | 0.126 | 0.054 | ||||
| Deposit | −0.305 | −0.364 *** | −0.420 | −0.004 | −0.528 *** | −0.760 |
| Physicap | −0.152 ** | −0.208 *** | −0.034 ** | −0.307 *** | ||
| M | −0.006 * | −0.019 *** | −0.013 * | −0.386 *** | ||
| Agri-shock | 0.327 *** | 0.090 *** | ||||
| Hea-shock | 0.446 * | 0.315 * | ||||
| Edu-shock | −0.008 | −0.102 | ||||
| Hou-shock | 0.320 ** | 0.028 ** | ||||
| Haza-shock | −0.053 | −0.280 | ||||
| Constant | −0.003 | −0.010 | −0.009 | −0.005 | −0.002 | −0.003 |
| F statistics | 0.060 *** | −0.181 | −0.053 *** | 0.120 *** | −0.330 | −0.150 *** |
| N | 0.062 * | −0.080 | −0.060 | 0.037 * | −0.025 | −0.160 |
| R-squared | 0.461 ** | 0.241 ** | ||||
Disclaimer/Publisher’s Note: The statements, opinions and data contained in all publications are solely those of the individual author(s) and contributor(s) and not of MDPI and/or the editor(s). MDPI and/or the editor(s) disclaim responsibility for any injury to people or property resulting from any ideas, methods, instructions or products referred to in the content. |
© 2025 by the author. Licensee MDPI, Basel, Switzerland. This article is an open access article distributed under the terms and conditions of the Creative Commons Attribution (CC BY) license (https://creativecommons.org/licenses/by/4.0/).
Share and Cite
Wang, X. Research on Rural Households’ Poverty Vulnerability in Poor Mountainous Areas: An Empirical Analysis in the Upper Reaches of the Min River, China. Sustainability 2025, 17, 4568. https://doi.org/10.3390/su17104568
Wang X. Research on Rural Households’ Poverty Vulnerability in Poor Mountainous Areas: An Empirical Analysis in the Upper Reaches of the Min River, China. Sustainability. 2025; 17(10):4568. https://doi.org/10.3390/su17104568
Chicago/Turabian StyleWang, Xiaolan. 2025. "Research on Rural Households’ Poverty Vulnerability in Poor Mountainous Areas: An Empirical Analysis in the Upper Reaches of the Min River, China" Sustainability 17, no. 10: 4568. https://doi.org/10.3390/su17104568
APA StyleWang, X. (2025). Research on Rural Households’ Poverty Vulnerability in Poor Mountainous Areas: An Empirical Analysis in the Upper Reaches of the Min River, China. Sustainability, 17(10), 4568. https://doi.org/10.3390/su17104568