Article

The Impact of Organic Fertilizer Substitution on Microbial Community Structure, Greenhouse Gas Emissions, and Enzyme Activity in Soils with Different Cultivation Durations

1
College of Environmental Science and Engineering, Shandong Analysis and Test Center, Qilu University of Technology (Shandong Academy of Sciences), Jinan 250353, China
2
National Engineering Laboratory for Advanced Municipal Wastewater Treatment and Reuse Technology, Beijing University of Technology, Beijing 100124, China
3
College of Geography and Environment, Shandong Normal University, Jinan 250014, China
*
Author to whom correspondence should be addressed.
Sustainability 2025, 17(10), 4541; https://doi.org/10.3390/su17104541
Submission received: 24 March 2025 / Revised: 9 May 2025 / Accepted: 13 May 2025 / Published: 16 May 2025

Abstract

:
To address soil degradation risk caused by the long-term application of organic and nitrogen fertilizers in facility vegetable fields, this study selected soils with cumulative cultivation durations of 1, 3, 6, and 9 years to investigate the impact of organic and nitrogen fertilizer (OFN) application ratios on soil microbial community structure, greenhouse gas emissions, and enzyme activities. The results show that SOC content increases with soil cultivation duration and the proportion of organic fertilizer applied. Organic fertilizer stimulates urease and catalase activities; however, NH4+-N in the soil inhibits enzyme activities. Organic fertilizer increases the abundance of Proteobacteria and Bacteroidota, enhancing its potential carbon sequestration capacity and also resulting in higher CH4 and CO2 emissions. The microbial community structure is influenced by both fertilizer ratios and soil cultivation duration. As the taxonomic level becomes finer, the number of differential species at the phylum (3), class (3), order (6), family (8), and genus (8) levels increases. The highest Chao1 index in soils of 1, 3, 6, and 9 years was observed at 0%, 25%, 50%, and 75% organic fertilizer substitution ratios, respectively. The 25% organic fertilizer substitution ratio showed better microbial diversity and evenness in 3-, 6-, and 9-year-old soils.

1. Introduction

Facility agriculture refers to the practice of using plastic film coverage or greenhouse systems to regulate soil temperature and humidity, suppress weeds and diseases, and promote the intensive management of agricultural fields [1]. The soil in this cultivation model is referred to as facility soil. This model can shorten planting durations, increase crop rotation frequency, and enhance crop yields. As of 2018, the area covered by plastic greenhouses in China exceeded 4,000,000 hectares [2,3]. Shouguang City is one of China’s major vegetable production areas and largest vegetable distribution centers. The soil in facility-based cultivation in this region has been used for extended periods, and the application of manure is typically accompanied by large amounts of nitrogen fertilizer [4]. Chemical fertilizers are rich in nutrients such as nitrogen, phosphorus, and potassium, which significantly enhance crop yield. A representative example is that China uses 9% of the world’s arable land to feed more than 20% of the global population [5,6]. The excessive use of fertilizers in facility soils disrupts the balance between plant growth and nutrient fixation, leading to more pronounced salinization compared to open-field soils. This results in soil degradation and groundwater contamination, severely hindering the sustainable development of facility agriculture [7,8,9].
Manure, as an organic fertilizer with stable nutrient content and a readily accessible resource, can improve soil structure, promote nutrient cycling, and enhance soil carbon accumulation [10]. A well-managed OFN can provide abundant carbon, nitrogen, and other essential nutrients, improve soil carbon and nitrogen sequestration, enhance microbial abundance and enzyme activity, and mitigate the detrimental effects of excessive chemical fertilizer application on soil health [11,12,13,14]. Soil microorganisms are highly sensitive to environmental changes and serve as critical indicators of soil quality assessment. As drivers between the soil and plant roots, microorganisms participate in humus formation and organic matter decomposition. The application of organic fertilizers can stimulate microbial activity and alter the communities of bacteria (such as Firmicutes and Proteobacteria), archaea, and fungi involved in the decomposition of complex organic compounds in the soil [15,16,17].
Soil enzymes are catalytically active proteins secreted or released by microorganisms, plant roots, and soil animals, playing a crucial role in ecological processes such as the decomposition of organic matter, microbial energy acquisition, and material cycling in soil [18]. The increased activities of urease, sucrase, and catalase were beneficial for the conversion of urea, improving fertilizer efficiency, enhancing the availability of soluble nutrients, and promoting microbial processes in soil [19,20]. Furthermore, the potential of OFN to mitigate greenhouse gas emissions should also be considered in this context. N2O, CO2, and CH4 are the primary greenhouse gases, contributing 6%, 60%, and 20%, respectively, to global warming [21]. The large-scale production of greenhouse gases from agriculture accelerates global warming. Statistics indicate that total greenhouse gas emissions from China’s facility agriculture increased by 5.73 × 10¹⁰ kg CO2-eq between 2000 and 2020 [22]. Reducing greenhouse gas emissions in facility soils is a crucial measure to ensure the sustainable development of facility agriculture and plays a key role in China’s efforts to achieve its dual carbon goals.
In summary, optimizing soil fertilization management can enhance the structure of soil microbial communities, promote carbon and nitrogen cycling, reduce greenhouse gas emissions, and sustain soil fertility. After prolonged cultivation and extensive fertilization in facility agriculture, pest and disease issues increase and soil quality deteriorates. To address these issues at a relatively low cost, farmers typically opt for soil replacement. They select higher-quality soil from open fields to replace the entire cultivation layer in facility agriculture. This study is based on this agricultural approach. In Shouguang City, representative facility soils from four different planting years (1, 3, 6, and 9) were selected. The high-throughput sequencing of the 16S rRNA gene was used to investigate the comprehensive effects of OFN and planting years on soil. The objectives of this study were to (1) elucidate the effects of OFN on the physical and chemical properties, enzyme activities, and greenhouse gas emissions of soil across different planting years; (2) assess the effects of OFN on the community structure at the phylum and genus levels in microorganisms; and (3) optimize field fertilization strategies for facility soils in years 1, 3, 6, and 9 to provide a scientific basis for maintaining soil quality in these facilities.

2. Materials and Methods

2.1. Site Description and Soil Sampling

The soil used in this study was collected from typical facility vegetable fields in Shouguang City, Shandong Province, China (34°7′24″ N, 113°7′24″ E). The greenhouse structure featured a large back wall and a sunken design, and was covered with PVC high-temperature film. The area is characterized by a warm continental monsoon climate. In 2023, the average annual temperature was 14.5 °C, with a total precipitation of 1033.1 mm and 2534.7 h of sunshine throughout the year (Shandong Statistical Yearbook, 2023, http://tjj.shandong.gov.cn/) (accessed on 19 February 2025). The soil type is slightly alkaline fluvo-aquic soil, and its initial physicochemical properties are presented in Table S1. It has been used for the long-term cultivation of cucumber and bitter melon, with regular application of compound fertilizers and chicken manure. After a thorough investigation, we selected four types of facility soils with consistent crop rotation history (during the growing season, only cucumber and bitter melon are rotated once annually) and identical management practices, with cumulative planting years of 1, 3, 6, and 9, respectively. To minimize the potential impact of plant litter on the experiment, we removed the surface contaminated soil (0–0.5 cm) and collected facility soil samples from the top 0–20 cm layer using a five-point sampling method. The vegetable field, being rectangular, had five sampling points evenly distributed along the two diagonals, and samples were taken from both ridges and furrows, with each sample being repeated three times. After collection, the samples were preserved in liquid nitrogen and immediately transported to the laboratory for further processing.

2.2. Experimental Design

The nitrogen fertilizer used in this experiment was urea (N, 46%), and the organic fertilizer was pig manure that had been naturally air dried (SOM, 15%; N, 0.50%; P, 0.45–0.50%; K, 0.35–0.45%). The N treatment was applied at 0.35 g/kg (N/soil), and the OFN treatment maintained the same nitrogen application rate as the N treatment. Five fertilization treatments were designed as follows: (1) N: 100% nitrogen fertilizer, (2) T25: 25% organic fertilizer + 75% nitrogen fertilizer, (3) T50: 50% organic fertilizer + 50% nitrogen fertilizer, (4) T75: 75% organic fertilizer + 25% nitrogen fertilizer, and (5) O: 100% organic fertilizer. In total, there were 20 treatments across four soil types, with each treatment replicated three times.
The soil samples were passed through a 2 mm sieve to remove plant roots, and 180 g (dry weight) was placed into culture bottles, sealed with parafilm, and stored in a 25 °C incubator. Every two days, the soil was replenished with water using the gravimetric method to maintain soil moisture at 60% of field capacity. To activate microbial activity, the soil was pre-incubated at 25 °C for 14 days. After the pre-incubation period, samples were immediately collected for analysis to characterize the differences in the soil’s original properties. Fertilizer was then added, and the incubation continued for another 49 days. After fertilization, soil physicochemical properties and greenhouse gas concentrations were measured weekly. Soil samples were collected on days 1, 28, and 49 of the incubation to assess enzyme activity. The samples were air-dried, ground, sieved, and stored at 4 °C. Immediately after the incubation ended, samples were collected for microbial analysis.

2.3. Measurement Indexes and Methods

NH4+-N, NO2-N, and NO3-N: KCl solution extraction ultraviolet spectrophotometer method. Fresh soil and KCl solution (1 mol/L) were added to polyethylene bottles at a 1:5 ratio, and the extraction was performed by shaking in a constant-temperature water bath shaker at 20 ± 2 °C for 1 h. Approximately 60 mL of the extraction solution was transferred to a 100 mL polyethylene centrifuge tube and centrifuged at 3000 rpm (r/min) for 10 min. Then, approximately 50 mL of the supernatant was transferred to a 100 mL colorimetric tube. The absorbance of NH4+-N and NO2-N was measured at 630 nm and 543 nm, respectively, using an ultraviolet spectrophotometer. The absorbance of NO3-N was measured at 220 nm and 275 nm. Subsequently, the NO3-N concentration in the soil was calculated based on the corrected absorbance values.
Soil organic carbon (SOC) was measured using the potassium dichromate oxidation spectrophotometric method. The general procedure involves placing the sample in a clean tray and spreading it into a thin layer of 2–3 cm thickness to eliminate the interference of Fe2+ on the experimental results. Plant roots and stones are then removed, and the soil is left to air dry naturally. After drying, the soil is ground using a 2 mm sieve. A 0.3 g soil sample is placed into a digestion tube with a stopper, followed by the addition of 0.1 g mercuric sulfate and 5.00 mL potassium dichromate solution, and the mixture is shaken well. Subsequently, 7.5 mL of sulfuric acid is slowly added, followed by the gentle shaking of the mixture. The stopper-equipped digestion tubes are then placed into the heating slots of the constant-temperature heater, and the timing starts when the instrument temperature reaches 135 °C. The tubes are heated for 30 min, after which the constant-temperature heater is turned off, and the digestion tubes are removed to cool in a water bath to room temperature. Approximately 50 mL of water is slowly added to each tube, and the tubes are then further cooled to room temperature. After the solution is made up to volume, it is left to stand for 1 h. Approximately 80 mL of the supernatant is transferred to a centrifuge tube and centrifuged at 2000 rpm for 10 min. The solution is then left to stand until clarified and, finally, the supernatant is analyzed for SOC content at a wavelength of 585 nm.
N2O, CO2, and CH4: During the cultivation period, gas samples were collected once a week. Prior to sampling, the culture bottles containing the samples were placed in a ventilated environment for 30 min to allow the gas concentration inside the bottles to equilibrate with the ambient air. The culture bottles were then sealed with sealing film for 1 h to allow for the continuous accumulation of gases inside the bottles, after which sampling was performed. Gas samples from the culture bottles were extracted using a glass syringe, with the syringe being repeatedly pushed and pulled before extraction to mix the gases inside the bottles, followed by the extraction of 15 mL of gas. The greenhouse gas concentrations were then analyzed using a gas chromatograph (7890A/5975C inert MSD, Agilent, Santa Clara, CA, USA), with H2, air, and N2 serving as fuel, oxidant, and carrier gases, respectively. The detector and column temperatures were set at 300 °C and 80 °C, respectively.
The GWP of 1 mg CH4 and N2O is equivalent to 28 and 298 mg CO2 in the horizon of 100 years, respectively. The global warming potential (GWP) was calculated as follows [23].
GWP   mg   CO 2 - eq / m 3 =   CO 2   +   CH 4   ×   28 +   N 2 O   ×   298
In the equation, CO2, CH4, and N2O represent the concentrations of the corresponding gases.
Soil urease activity was determined using a colorimetric method. In total, 5 g of air-dried soil was placed into a 50 mL conical flask, and 1 mL of toluene was added. After 15 min, 10 mL of 10% urea solution and 20 mL of citrate buffer at pH 6.7 were added. The mixture was shaken thoroughly and then incubated at 37 °C for 24 h in a constant-temperature incubator. After filtration, 3 mL of the filtrate was transferred into a 50 mL volumetric flask, and distilled water was added to bring the total volume to 20 mL. Then, 4 mL of sodium phenolate solution and 3 mL of sodium hypochlorite solution were added. The mixture was shaken immediately after each addition. After 20 min, the solution was allowed to develop color and then made up to the final volume. The color was measured using a spectrophotometer at a wavelength of 578 nm within 1 h. Urease activity was expressed as the amount of NH3-N (in mg) per gram of soil after 24 h.
The activity of soil sucrase was measured using the 3, 5-dinitrosalicylic acid (DNS) colorimetric method. A 5 g soil sample was weighed and placed in a 50 mL conical flask with a stopper. To this, 15 mL of 80 g/L sucrose solution, 5 mL of pH 5.5 phosphate buffer, and 5 drops of toluene were added. After thorough mixing, the mixture was incubated at 37 °C for 24 h in a constant-temperature incubator. The mixture was then rapidly filtered. In total, 1 mL of the filtrate was accurately pipetted into a 50 mL volumetric flask, and 3 mL of DNS reagent was added. The flask was then boiled in a water bath for 5 min and transferred under running tap water to cool for 3 min. The solution turned orange-yellow due to the formation of 3-amino-5-nitrosalicylic acid. Finally, the volume was adjusted to 50 mL with water, and the absorbance was measured at 540 nm using a spectrophotometer. Sucrase activity was expressed as the amount of glucose (mg) released from 1 g of air-dried soil after 24 h of incubation.
The catalase activity was determined using ultraviolet spectrophotometry. A 2 g soil sample was weighed and placed in a triangular flask, followed by the addition of 40 mL of distilled water and 5 mL of 0.3% H2O2 solution, and 20 min of shaking on a shaker. After shaking, 1 mL of saturated potassium aluminum sulfate was quickly added, and the mixture was immediately filtered into a triangular flask containing 5 mL of 1.5 mol/L sulfuric acid solution. After filtration and drying, the filtrate was measured directly for absorbance at 240 nm using a 1 cm quartz cuvette, with controls for both blank soil and blank matrix. Hydrogen peroxide exhibits strong absorption at 240 nm. By measuring the absorbance of the solution at this wavelength after reaction with the soil, the concentration of hydrogen peroxide in the solution can be determined, thus enabling the calculation of enzyme activity.

2.4. Soil Microbial Analyses

Three replicate soil samples from the same treatment were combined to create a composite sample for analysis. Soil DNA was extracted using a DNA kit (Omega BioTek, Norcross, GA, USA) according to the manufacturer’s instructions. The ABIGeneAmp® 9700 PCR instrument was used to amplify target genes, and PCR was performed under cyclic conditions. Using the 16S rRNA amplification technique, the bacterial primers were 341F (CCTAYGGGRBGCASCAG) and 806R (GGACTACNNGGGTATCTAAT). The archaeal primers were Arch519F (CAGCCGCCGCGGTAA) and Arch915R (GTGCTCCCCCGCCAATTCCT). After obtaining the amplification product, the library was constructed using the NEB Next® UltraTM DNA Library Prep Kit for Illumina from New England Biolabs. The constructed library was quantified using Qubit and tested via library detection. After qualification, the NovaSeq 6000 was used for PE250 sequencing.

2.5. Statistical Analysis

The experiment was conducted in triplicate and, upon completion, statistical analysis of the experimental data was conducted using Microsoft Excel 2010 (Microsoft, Redmond, WA, USA). One-way ANOVA was performed with IBM SPSS Statistics 27 (SPSS Inc., Chicago, IL, USA), using LSD and Duncan’s Multiple Range Test as post hoc methods. The significance level for all tests was set at 0.05. Core diversity analysis was conducted using the QIIME2 core diversity plugin, and graphical representations were generated using Origin 2017 (OriginLab, Northampton, MA, USA). Phylogenetic relationships among ASVs were constructed with PyNAST, and Unifrac distances (Unweighted Unifrac) were calculated. Subsequently, Weighted Unifrac distances were constructed based on ASV abundance data, resulting in an NMDS plot. A non-parametric factorial Kruskal–Wallis (KW) sum-rank test was employed to detect significant differences in species abundance among different treatments, followed by group-wise Wilcoxon rank-sum tests to assess inter-group differences. Finally, Linear Discriminant Analysis (LDA) was used to perform dimensionality reduction and evaluate the effect size of differentially abundant species (i.e., LDA Score). Redundancy analysis (RDA) was performed using Canoco 5.0 to analyze the relationship between soil environmental factors and microbial composition.

3. Results

3.1. Physical and Chemical Properties of Soil

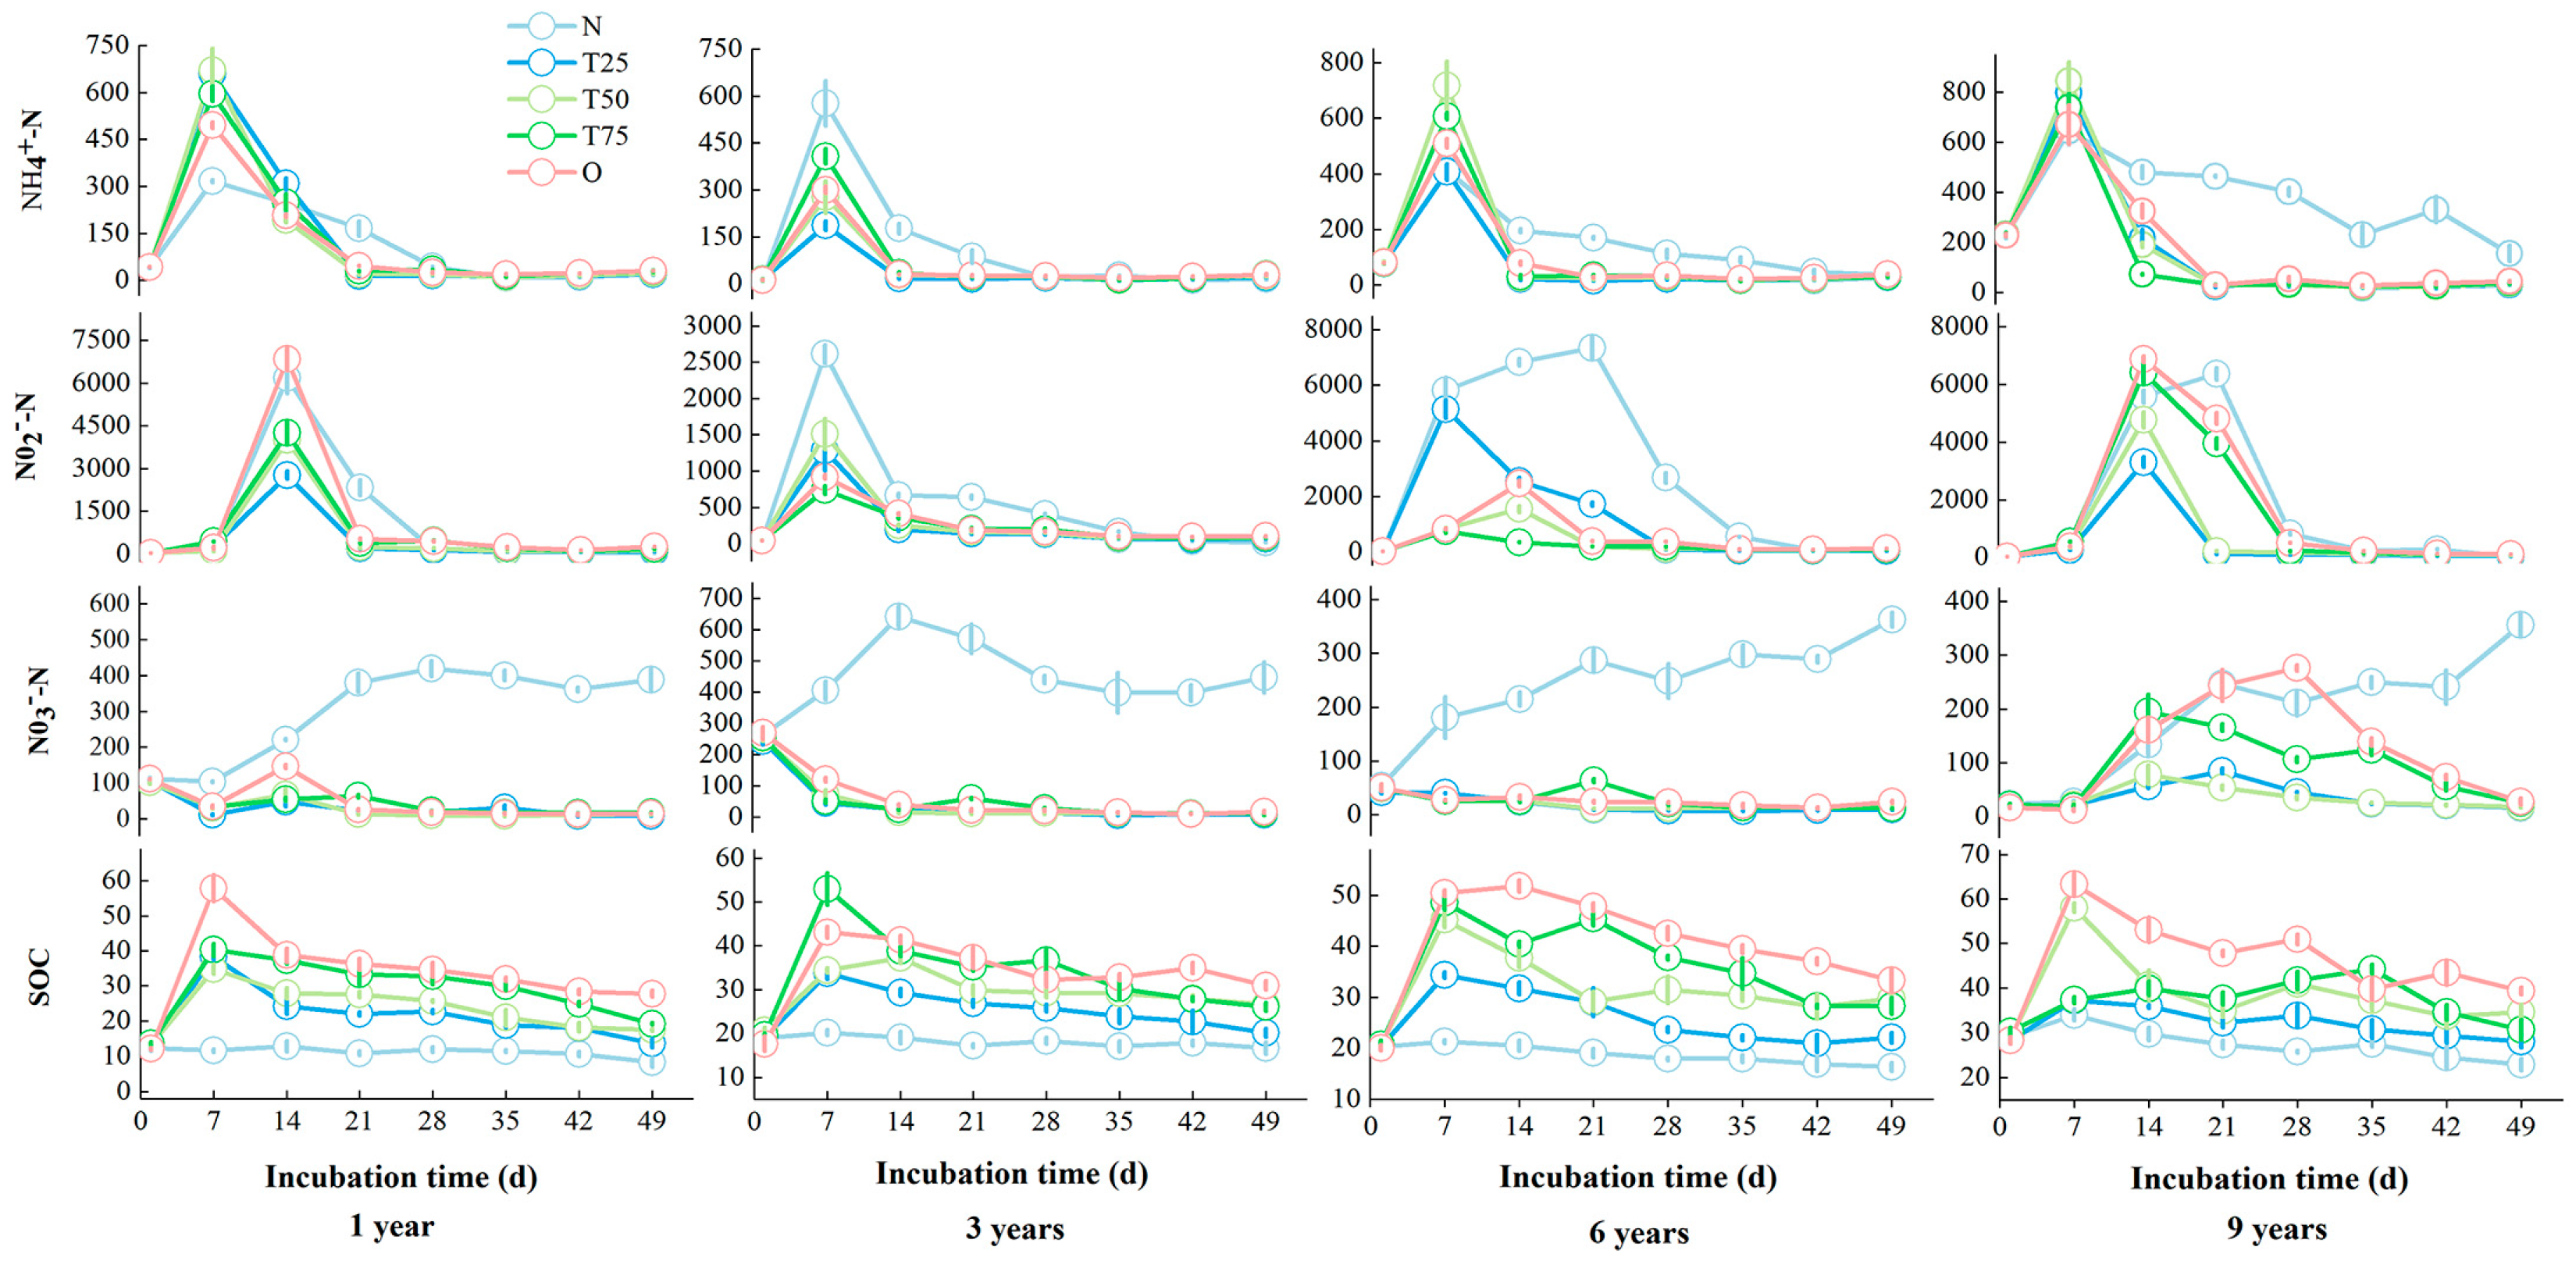
3.1.1. Carbon and Nitrogen Nutrients

At the end of the 14-day pre-culture, the SOC concentration showed an increasing trend with the length of planting years (Figure 1). The NO3-N concentration in the 3-year soil ranged from 243.94 to 269.40 mg/kg, while that in the 9-year soil ranged from 17.24 to 23.66 mg/kg, indicating a more intense denitrification effect in the 9-year soil. After fertilization, the concentrations of SOC, NH4+-N, and NO3-N initially increased and then decreased as the cultivation period progressed. The concentrations of NO2-N in soils planted for 1, 6, and 9 years peaked or began to increase significantly on day 7. Correspondingly, the concentrations of NH4+-N began to decrease significantly on the 7th day. It is speculated that intense nitrification occurred in the soil during this phase, with NH4+-N gradually converting to NO2-N. Compared to other soils, the concentrations of NO2-N in the 9-year soil showed greater fluctuations. Under N treatment, the concentration of NH4+-N exceeded 800 mg/kg.
In soils with 1, 3, and 6 years of planting history, the concentration of NO3-N under the OFN treatment exhibited an overall decreasing trend. In the 9-year soil, the NO3-N concentration under the OFN treatment first increased and then decreased, with more significant fluctuations in NO3-N concentration observed as the proportion of organic fertilizer increased. The application of nitrogen fertilizer alone did not significantly affect SOC concentration changes. Compared to pre-fertilization, after 49 days of incubation, the NH4+-N concentrations in all treatments increased with the soil planting duration and the proportion of organic fertilizer. In soils aged 1, 3, and 6 years, the NO3-N concentrations under OFN treatments decreased significantly by 50.77–96.41%. Under the OFN treatment, NO2-N concentrations gradually increased as the proportion of organic fertilizer increased. Furthermore, SOC concentrations under the OFN treatment increased, with concentrations rising as both the proportion of organic fertilizer and the planting duration increased.

3.1.2. Soil Enzyme Activity

At the end of the 14-day pre-culture, the urease and sucrase activities were highest in the 3-year soil, which showed a significant difference (p < 0.05) compared to other soils (Table S2). In the 6-year and 9-year soils, the urease (sucrase) and sucrase activities decreased by 62.37–82.64% (38.58–90.51%) compared to the 3-year soil. Additionally, a decreasing trend in sucrase activity with increasing soil cultivation years was observed. In contrast, catalase activity was significantly lower (p < 0.05) in the 1-year soil than in the other soils. On day 28 after fertilization, urease activity was the lowest in the N treatment across all soils, while the T75 treatment exhibited the highest urease activity. A trend was observed in which urease activity decreased as the proportion of organic fertilizer added decreased. Sucrase activity did not show a clear correlation with either the fertilization ratio or planting duration. The activity of catalase under all N treatments decreased by 2.92–17.09% compared to the previous levels. However, the catalase activity increased under the OFN treatment, with the highest activity observed under the O treatment. On day 28, the catalase activity under the O treatment increased by 43.92–109.73% compared to the end of the pre-culture phase. A significant difference (p < 0.05) was found between the O and N treatments.
After 49 days of culture, urease activity under different soil N treatments decreased by 30.77–79.41% compared to the end of the pre-culture phase, whereas urease activity in soils from years 1, 6, and 9 increased under the OFN treatment. Throughout the entire culture period, only the sucrase activity under the T75 treatment exhibited an initial decrease followed by an increase across all soils. In contrast, enzyme activity changes in the other treatments displayed diverse patterns. In all soils, sucrase activity under the N and T25 treatments decreased significantly by 23.14–74.47% and 31.95–76.16%, respectively. The sucrase activity under the T75 treatment was highest in soils from years 1, 6, and 9. Except for the catalase activity in the 9-year soil under nitrogen treatment, which decreased by 0.85 mg·g−1·h−1 compared to the end of the pre-culture phase, catalase activity in all other treatments was higher than at the end of pre-culture. Under N treatment, catalase activity was lower than under the OFN treatment, and the difference was significant (p < 0.05). During the culture period in the 1-year, 3-year, and 6-year soils, catalase activity exhibited a trend of increasing with a higher proportion of organic fertilizer applied.

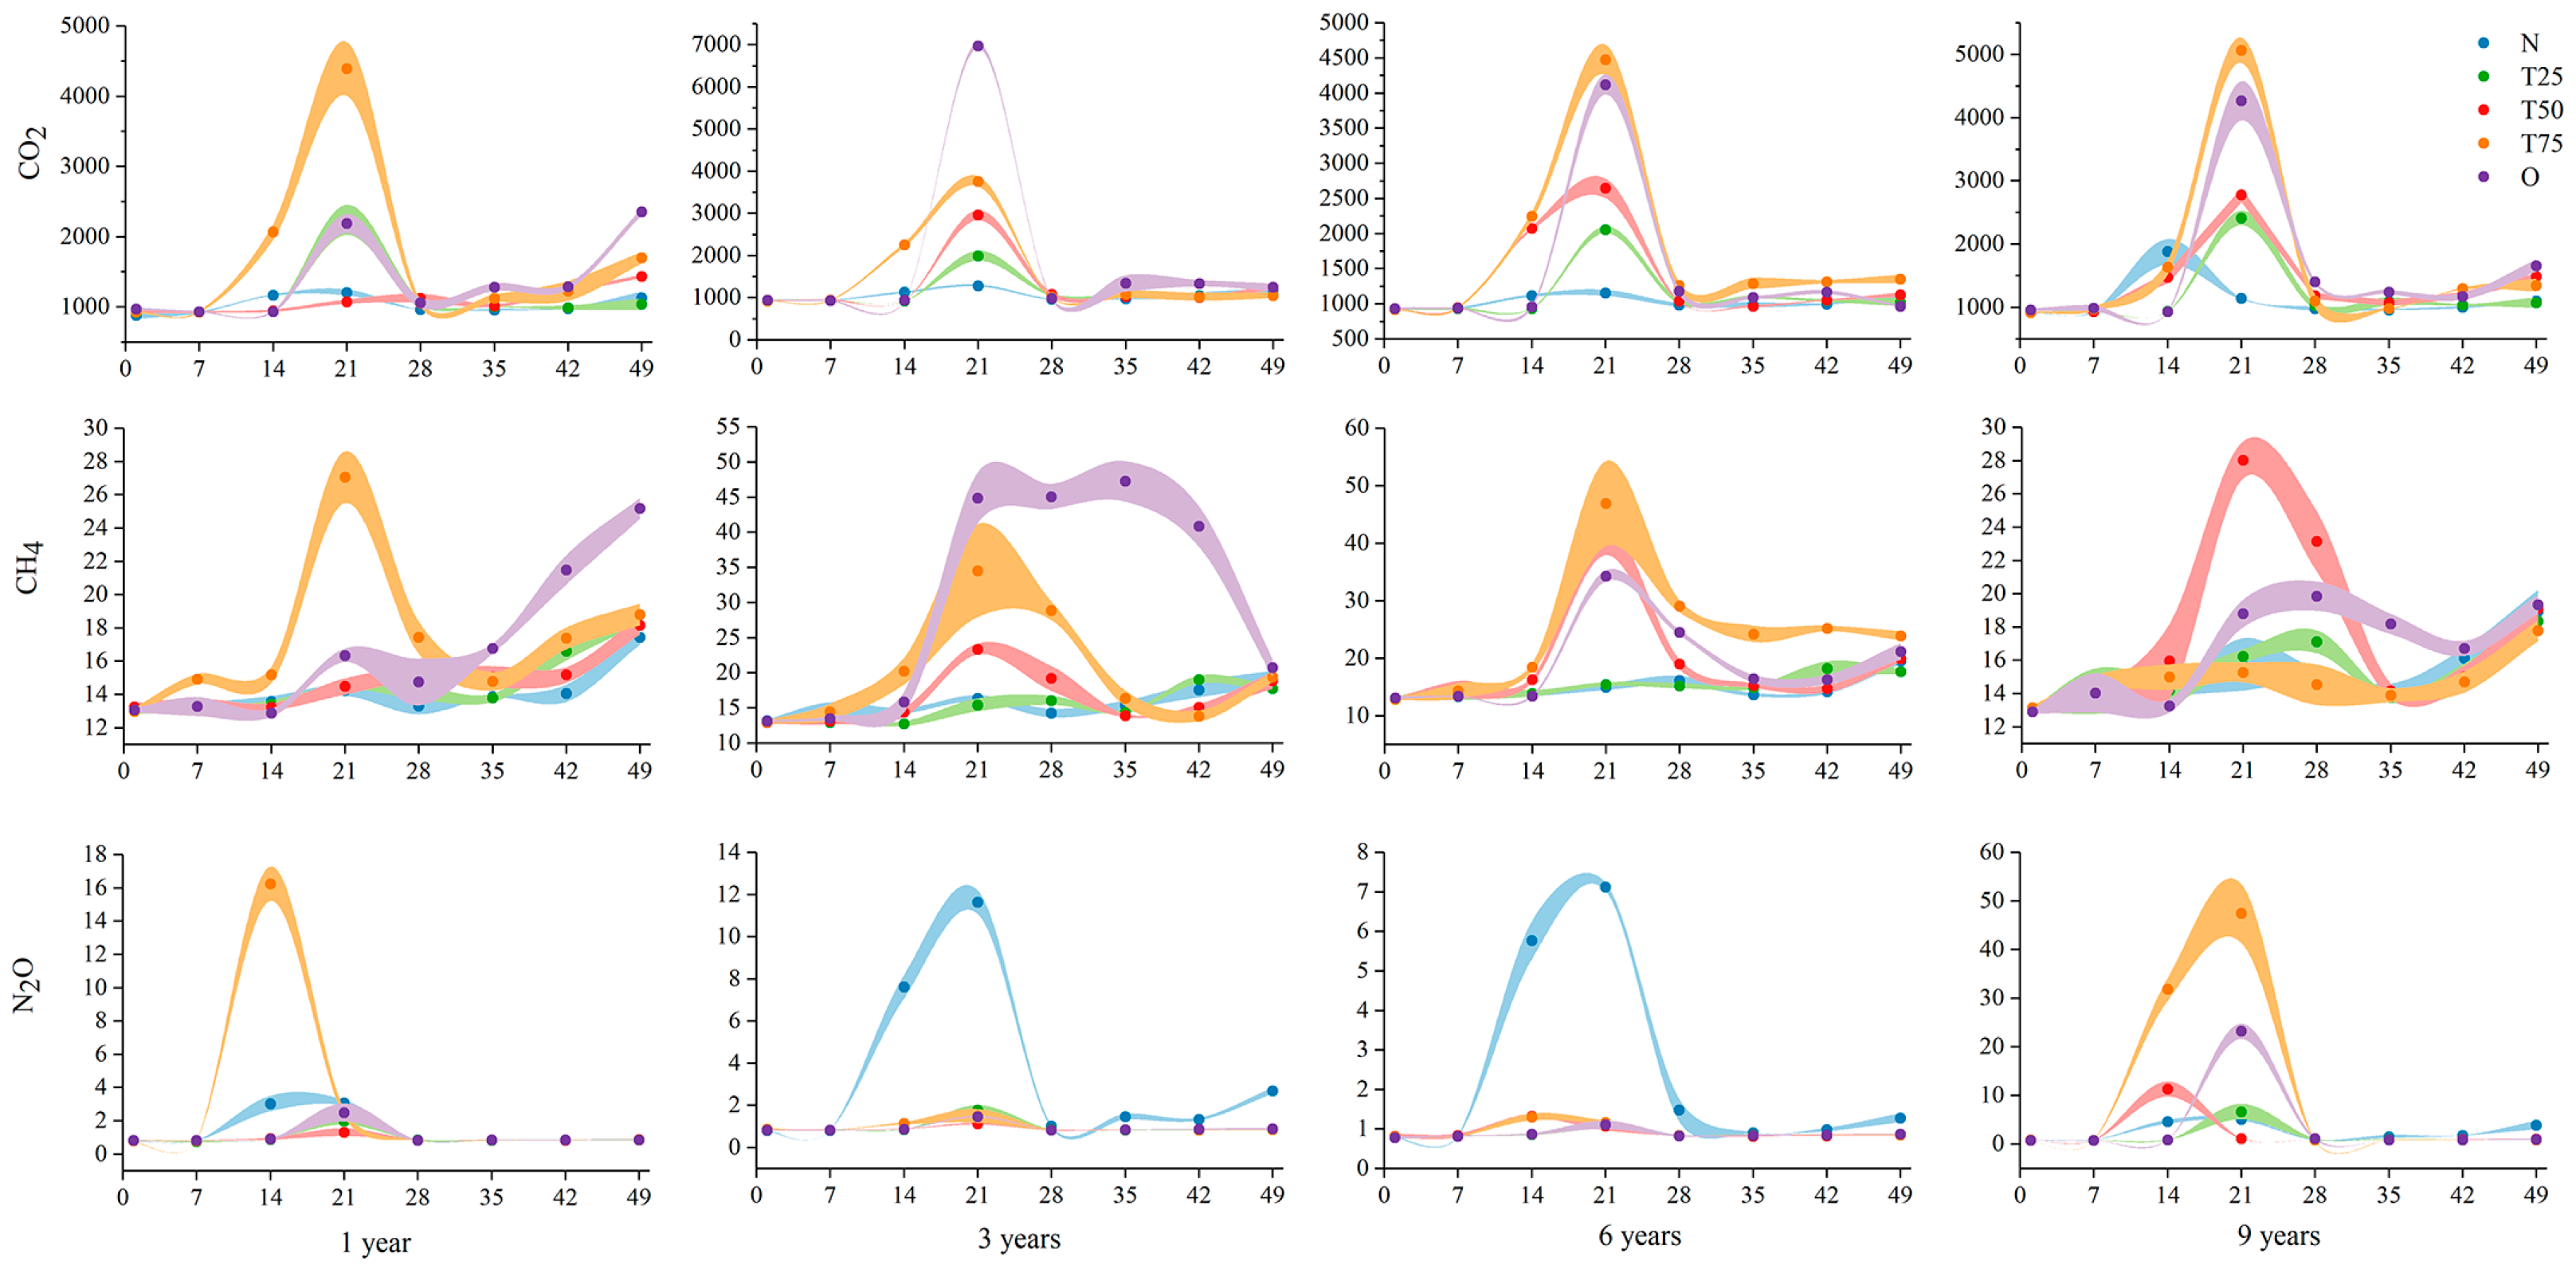
3.2. Greenhouse Gases

3.2.1. CO2, CH4, and N2O Emissions

Under the OFN treatment, the peak of CO2 emissions is concentrated on day 21 after fertilization, with the period from day 7 to day 28 after fertilization being the phase with the highest CO2 emissions (Figure 2). In soils of 1, 3, and 6 years, CO2 emissions under N treatment remained consistently below 1300 mg/m3 throughout the culture period. In contrast, in the 9-year soil, CO2 emissions under N treatment increased by 61.32–68.20% during the second week after fertilization compared to other soils treated with N. Compared to the application of nitrogen fertilizer alone, the application of organic fertilizer can increase CO2 emissions by as much as 344.19%. The peak concentrations of CH4 emissions for each treatment can reach 27.05–47.23 mg/m3. Except for the T75 treatment in the 9-year soil, the treatments with 50%, 75%, and 100% organic fertilizer addition exhibited significant peaks and concentration variations in CH4 emissions across all soil culture periods, generally higher than those under N treatment. The CH4 emission peaks in both 1-year and 9-year soils remained below 30 mg/m3, which were significantly lower than the peak concentrations observed in 3-year and 6-year soils. Except for the O treatment in the 3-year soil and the T75 treatment in the 6-year soil, CH4 concentrations showed a rebound in the later stages of the culture period under most treatments.
Peak N2O emissions across all treatments occurred on either the 14th or the 21st day following fertilization. In the 9-year soil, changes in N2O concentrations under different treatments were more pronounced than in soils with fewer years of cultivation, thereby supporting the hypothesis of a more pronounced denitrification effect. In the 1-year and 9-year soils, the T75 and N treatments exhibited the greatest fluctuations in N2O emissions, with concentrations ranging from 7.13 to 47.47 mg/m3, significantly exceeding typical atmospheric N2O levels. Based on the area under the greenhouse gas emission curve, it is inferred that the above four treatments will result in higher cumulative N2O emissions. The OFN treatment is expected to result in higher CO2 emissions throughout the culture period, with this effect becoming more pronounced as the proportion of organic fertilizer increases. Conversely, the OFN treatment that resulted in the lowest CO2 emissions in the 1-year soil was T50, whereas T25 exhibited the lowest emissions in the 3-, 6-, and 9-year soils. Meanwhile, CH4 emissions remained consistently low under the T25 treatment in the 1-, 3-, and 6-year soils. N2O emissions under the T25 treatment remained stable most of the time, except for some fluctuations during the mid-culture period. Moreover, the area under the N2O emission curve for the T50, T75, and O treatments in the 9-year soil is higher than that for the N treatment, indicating that the excessive application of organic fertilizer in soils with long cultivation periods increases N2O emissions.
Figure S1 illustrates the cumulative global warming potential (GWP) of three greenhouse gases at each sampling time point, calculated based on the concentrations of greenhouse gas emissions under various treatments. Throughout the entire incubation period, the treatments with the highest cumulative GWP at 1, 3, 6, and 9 years were T75, O, T75, and T75, respectively, with GWP values ranging from 21,448.69 to 41,776.93 mg CO2-eq/m3. The treatments with the lowest cumulative GWP at 1, 3, 6, and 9 years were T50, T25, T25, and T25, respectively, with the T25 treatment maintaining relatively stable GWP values across diverse soils. The GWP increased most rapidly between days 7 and 28 of the incubation, reflecting the significant decomposition of organic matter and the increased microbial activity in the soil. In the 9-year soil, each fertilization treatment exhibited a higher GWP compared to the same fertilization treatments in other soils.

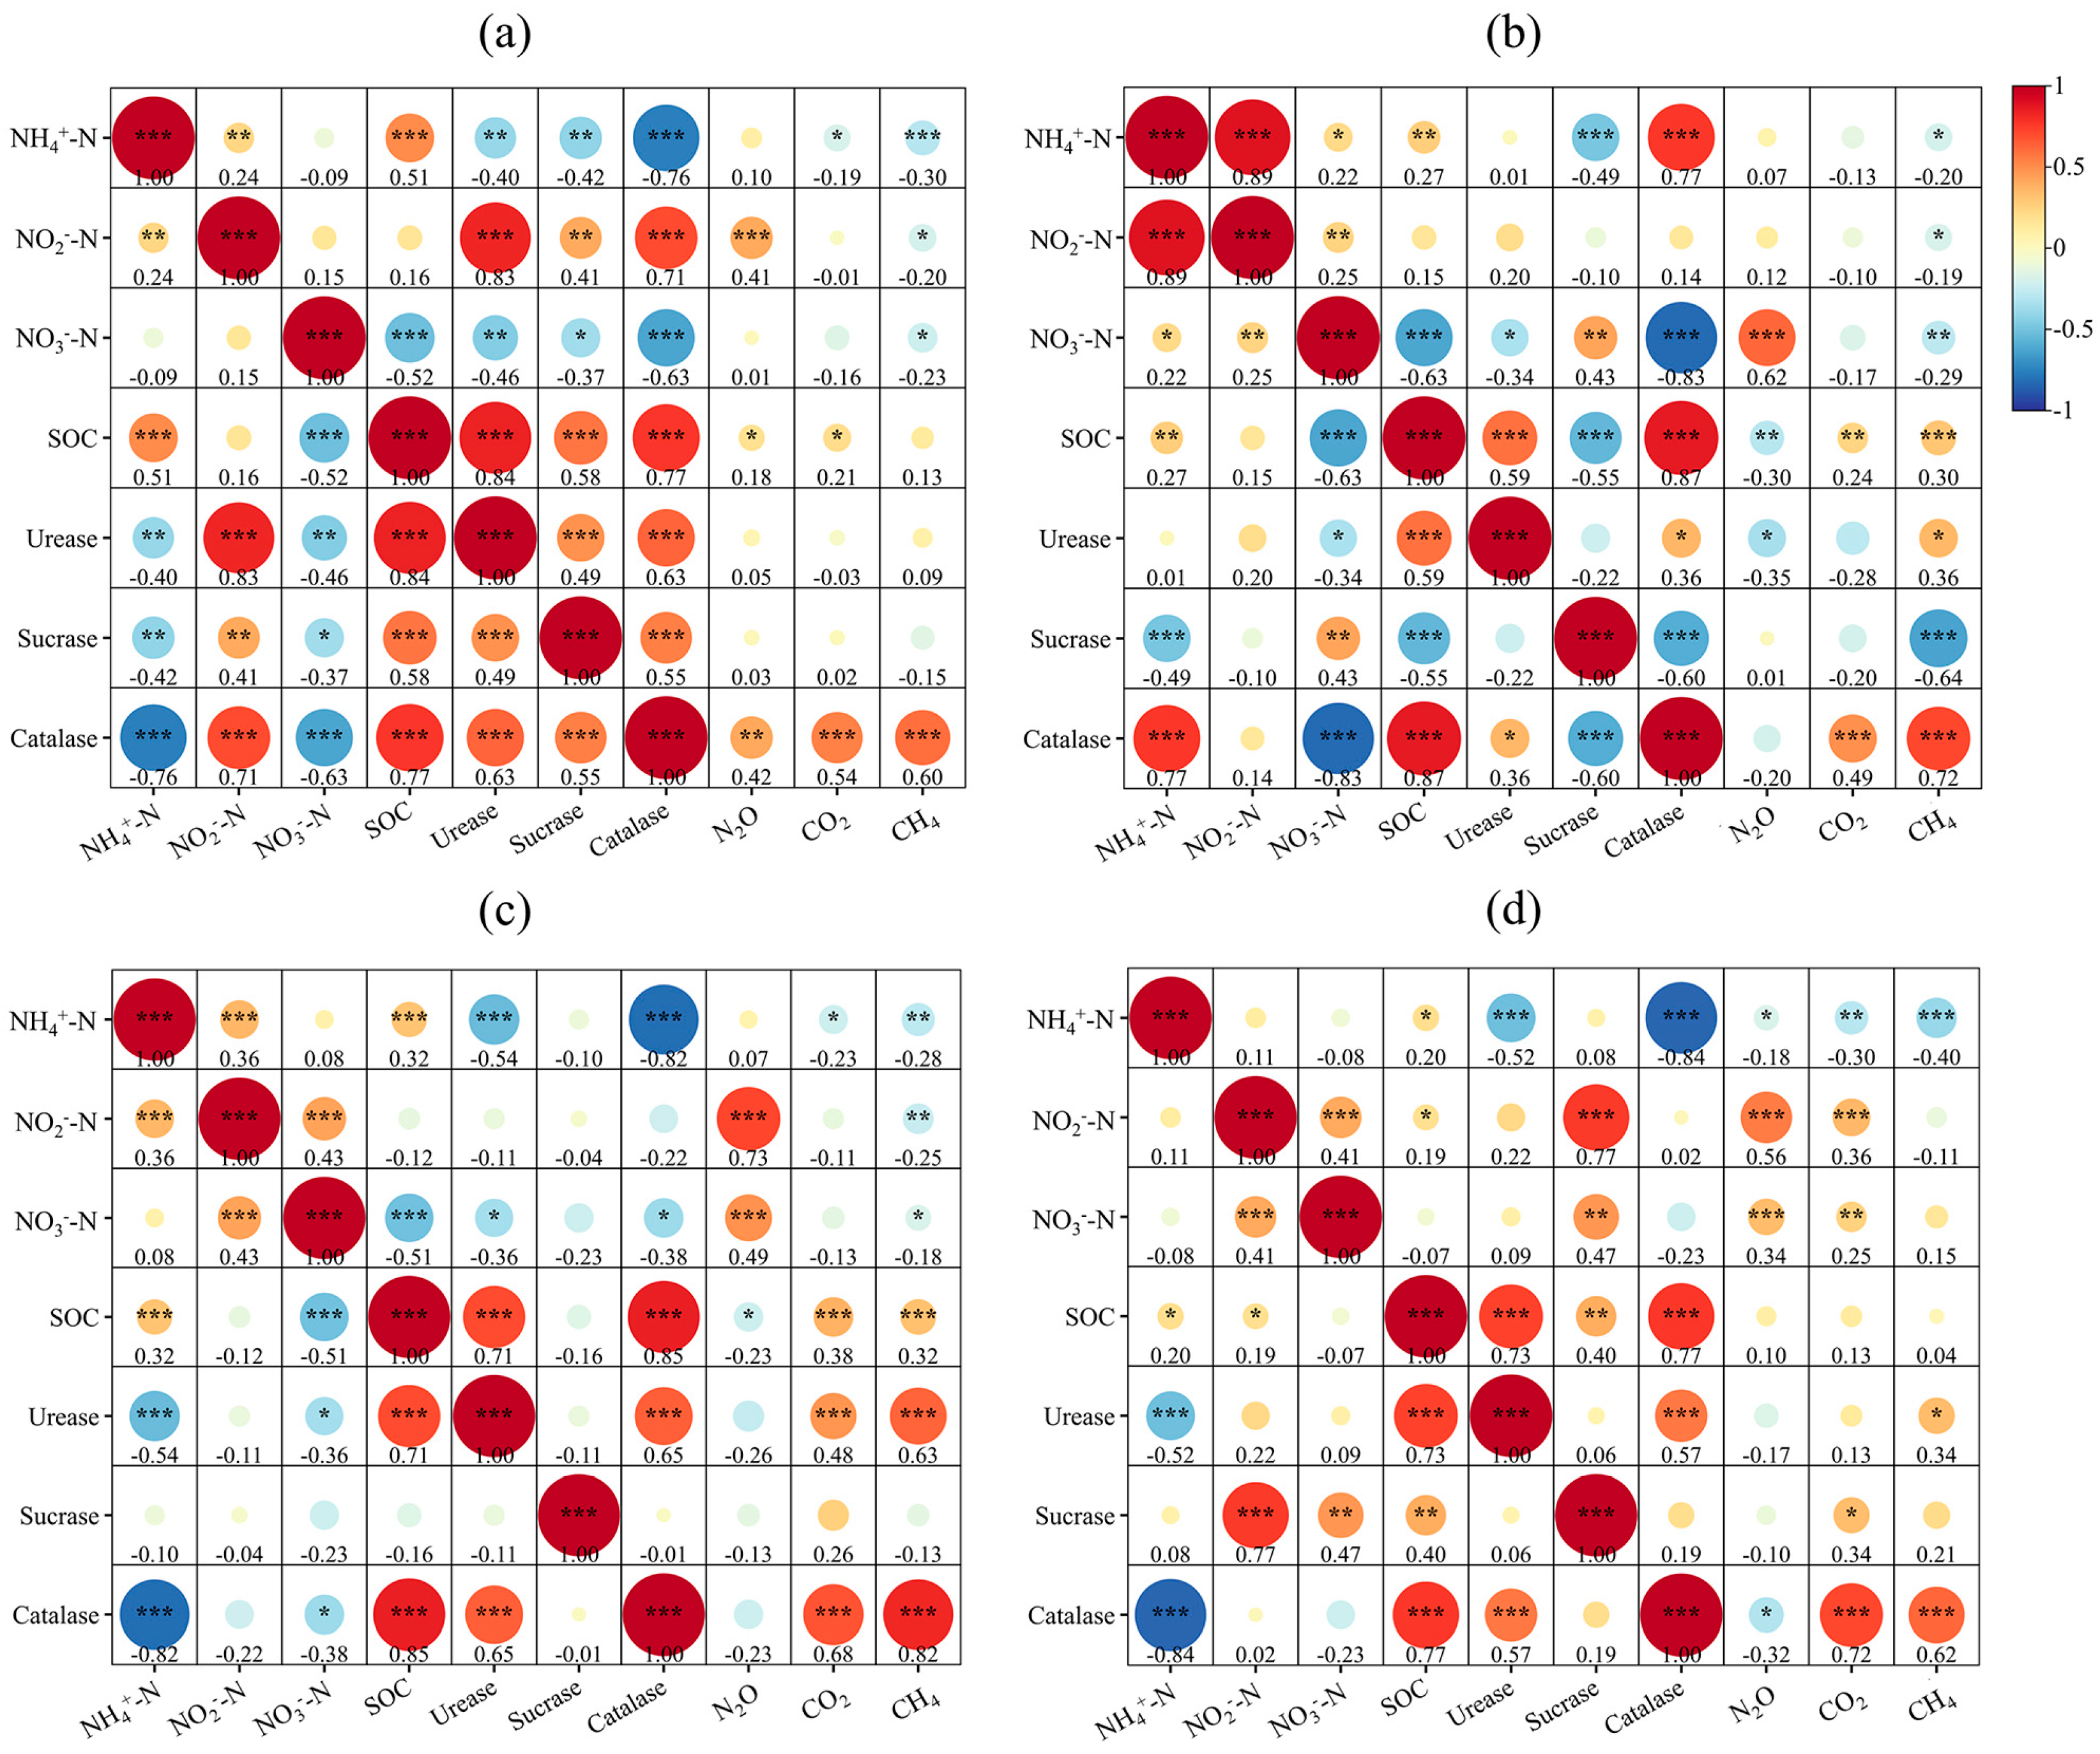
3.2.2. Correlation Analysis Between Soil Properties and Greenhouse Gas Emissions

In different soils, catalase was the most significant contributor to the increase in CO2 and CH4 emissions (p < 0.001), followed by urease and SOC, while NH4+-N inhibited CO2 and CH4 emissions (Figure 3). The presence of NO2-N and NO3-N in soil, as substrates for denitrification, increases N2O emissions. In the 1-year soil, catalase exhibited a strong correlation with all environmental factors (p < 0.01) (Figure 3a). Although this correlation varied in other soils, catalase remained a key factor influencing changes in soil properties. For example, catalase and urease activities were significantly positively correlated (p < 0.05). Additionally, SOC in all soils exhibited a strong positive correlation with urease and catalase (p < 0.001), and a significant positive correlation with NH4+-N (p < 0.05).

3.3. Soil Microbial Community Structure

3.3.1. Total Number and Diversity of Species

The alpha diversity index is used to assess the microbial community diversity within a sample. In this study, the Chao1, Shannon, and Simpson indices were used to represent the total number of microbial species, species distribution diversity, and evenness in the samples (Table 1). From a microbial taxonomy perspective, bacteria, as an important group in soil, maintain high richness and diversity across soils with different cultivation durations. In contrast, archaea show very low richness and diversity. This may be due to the fact that many archaea are better adapted to extreme acidic or alkaline environments, whereas the soil in this study is weakly alkaline, making it difficult for archaea to proliferate in large numbers. Regarding cultivation duration, the highest total microbial species count in soils of 1, 3, 6, and 9 years occurred at 0%, 25%, 50%, and 75% organic fertilizer substitution rates, respectively. The highest microbial diversity and richness in soils of 3, 6, and 9 years were observed at a 25% organic fertilizer substitution rate. The microbial community diversity and richness in 1-year-old soil were lower than in other soils, with the best treatment being T75. In contrast, after many years of cultivation, the total bacterial species count in 9-year-old soil remains predominantly low. Regarding fertilizer substitution rates, the treatments N and T25 in 3-year-old soil and T50 in 6-year-old soil exhibited superior Chao1, Shannon, and Simpson indices compared to the same treatments in other soils. In contrast, the remaining treatments did not exhibit a similar pattern.

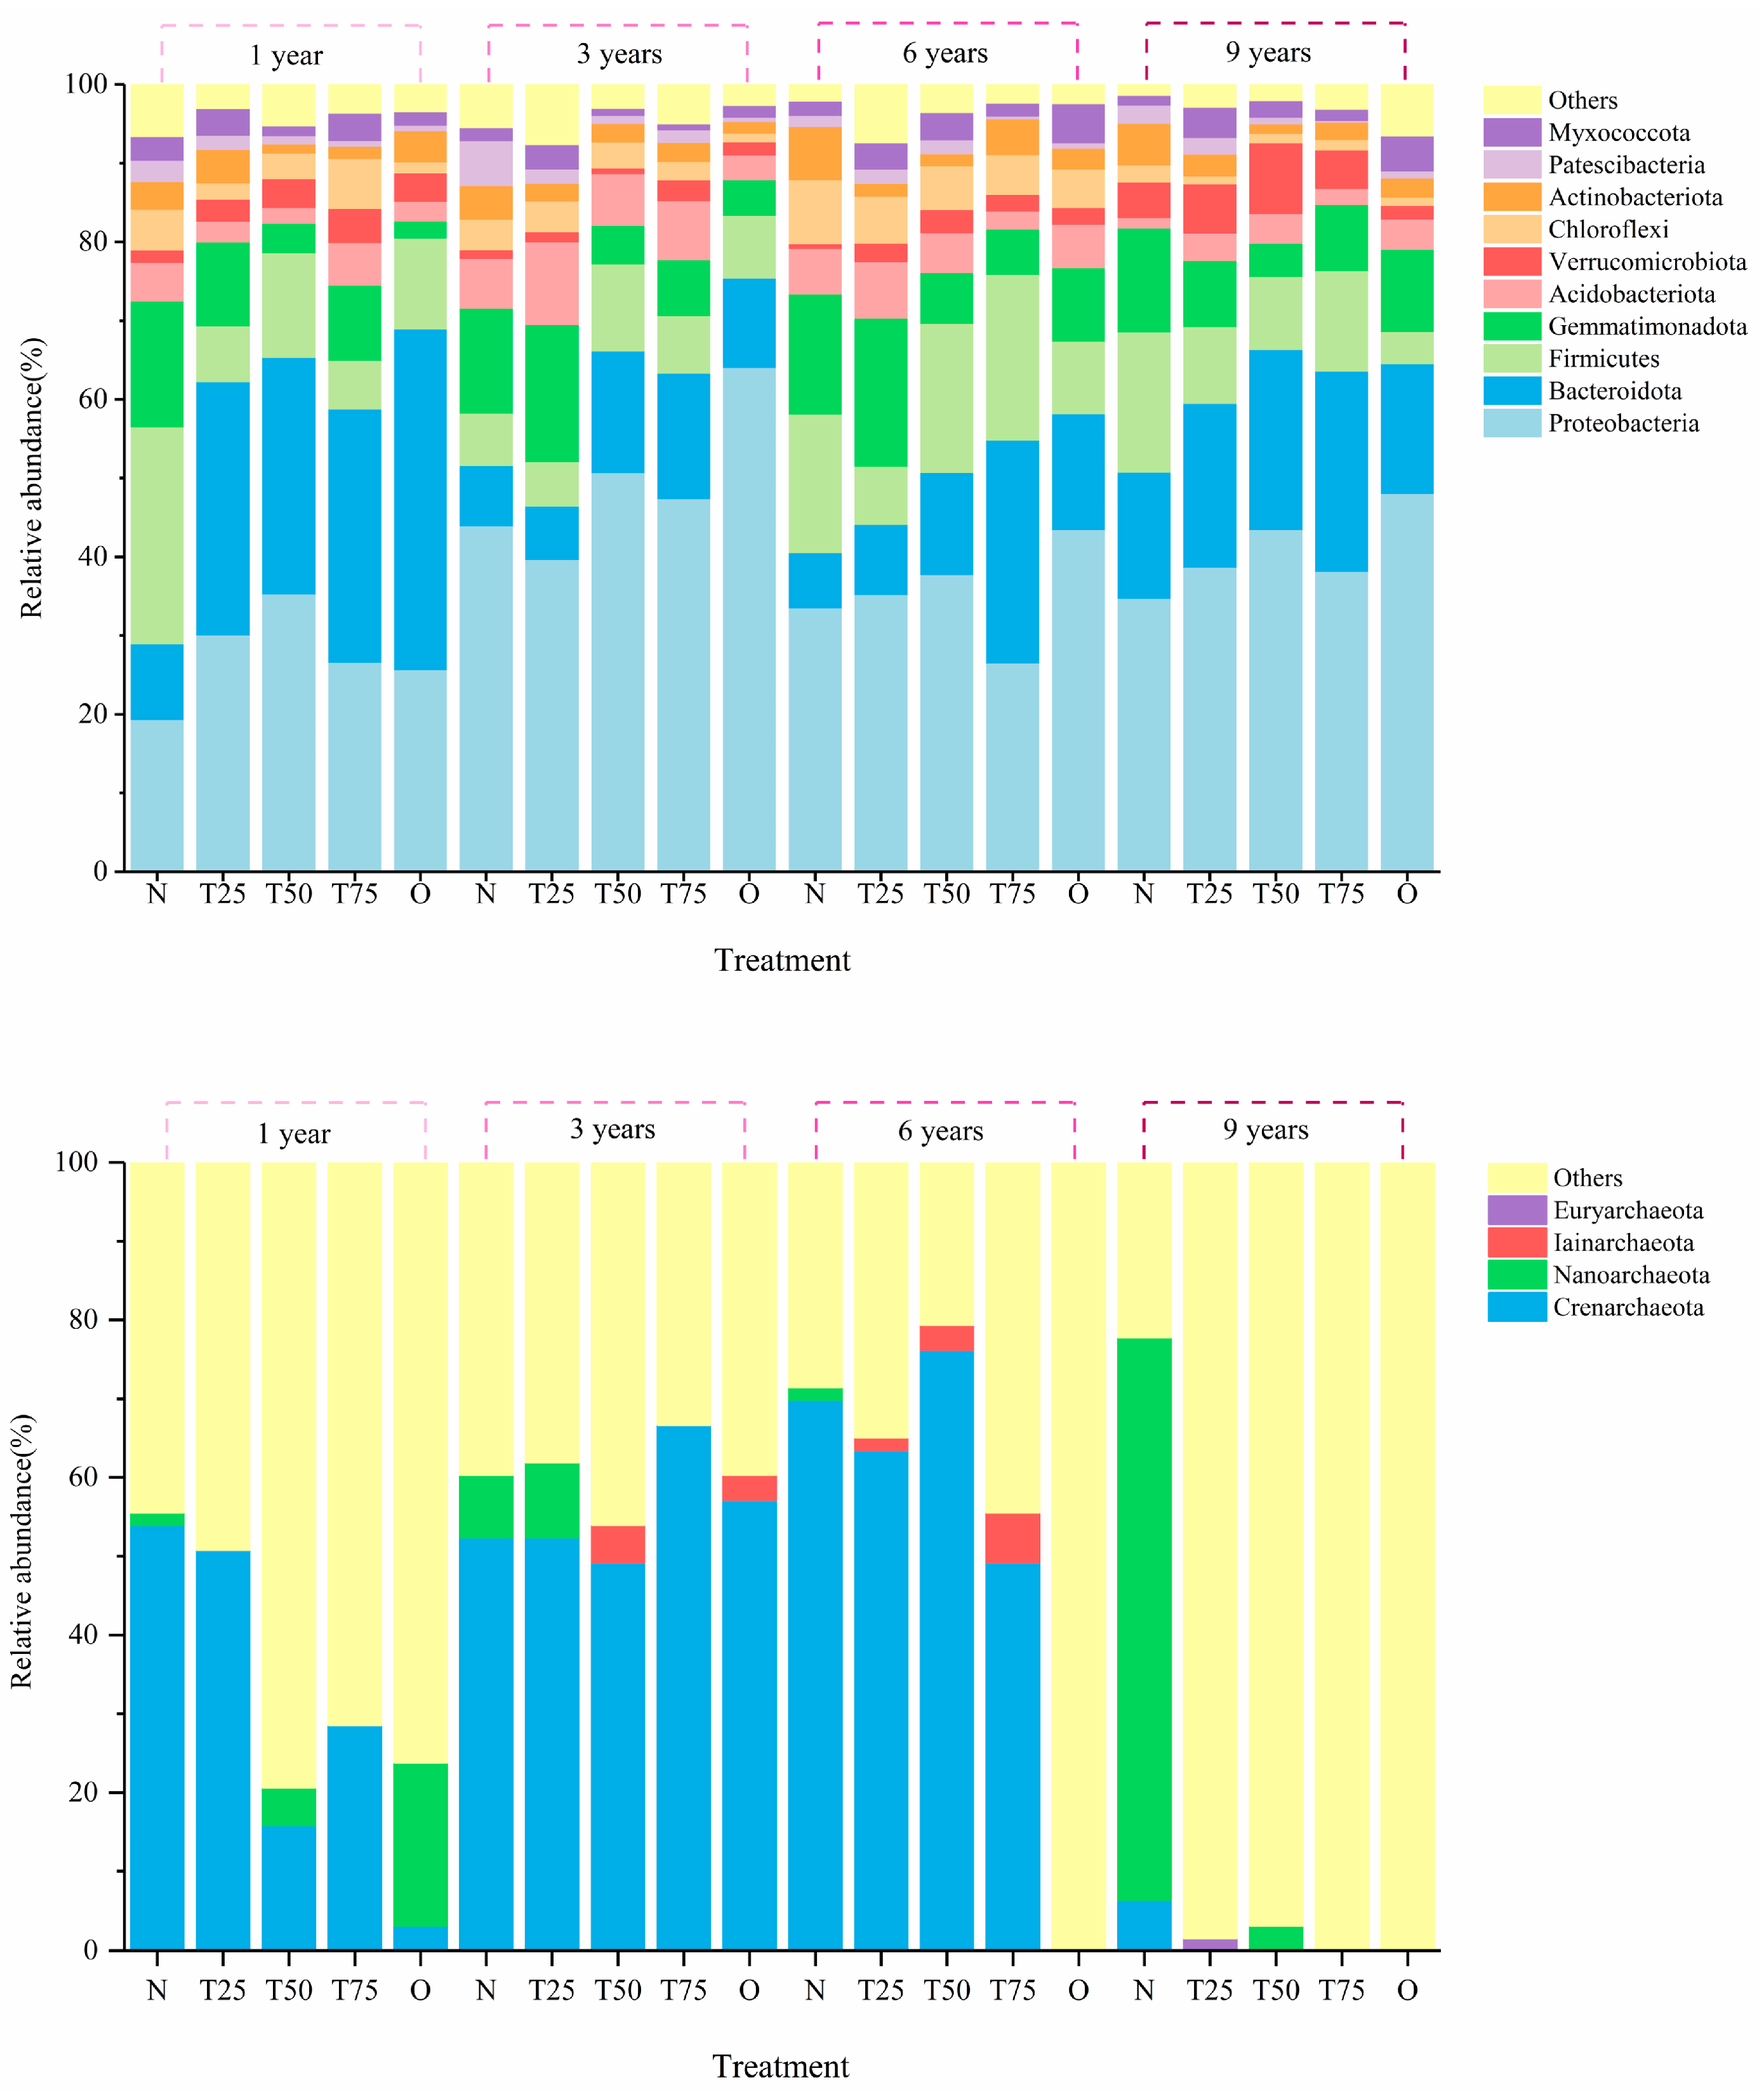
3.3.2. Relative Species Abundance at Phyla and Genus Levels

Phyla with a relative abundance greater than 5% are defined as dominant phyla. The dominant bacterial and archaeal phyla identified in the soils after incubation under different treatments include Proteobacteria, Bacteroidota, Firmicutes, Gemmatimonadota, Chloroflexi, and Crenarchaeota (Figure 4). Due to their lower biomass, archaea have fewer dominant phyla. In soils from the 1-, 3-, and 6-year plots, the dominant archaeal phylum is Crenarchaeota. In contrast, in the 9-year soil, the dominant archaeal phyla under N treatment are Nanoarchaeota and Crenarchaeota. The bacterial community structure under the same fertilization treatment shows greater diversity across different cultivation years. Compared with nitrogen fertilizers, the application of organic fertilizers generally increased the abundance of Proteobacteria (5.15–82.25%) and Bacteroidota (2.89–35.15%). Notably, the abundance of Proteobacteria increased most significantly under the O and T50 treatments. In contrast, Firmicutes and Gemmatimonadota responded more actively to nitrogen inputs. The relative abundance of Chloroflexi in the 9-year soils under various treatments was lower than that in soils with shorter cultivation durations under similar treatments. From a fertilization perspective, higher proportions of organic fertilizer are more likely to result in Proteobacteria and Bacteroidota dominating the microbial community, thereby disrupting the community balance.
The dominant bacterial genera mainly include Pseudomonas, Bacillus, and Sphingomonas (Figure 5). The abundance of Thermomonas was the lowest under N treatment. The relative abundance of Pseudomonas under N treatment was only 0.21% in the 1-year soil and 0.03% in the 3-year soil, and it was absent in the 6-year and 9-year soils. This indicates that N treatment suppresses the growth of Pseudomonas compared to OFN treatment. Under T25 treatment, the sum of the top 10 genera by relative abundance was the lowest across different soils, reflecting relatively higher species diversity at the genus level under this treatment. T75 treatment promoted the growth and reproduction of Imperialibacter, while the abundance of Bacillus was the lowest under O treatment. The relative abundance of Sphingomonas was generally higher in the 3-year soil (2.64–7.58%), while Chryseolinea exhibited higher relative abundance in the 1-year (0.65–7.23%) and 6-year (0.72–2.52%) soils, with the highest abundance under N treatment. In contrast, its relative abundance was low in the 3-year (0.04–0.11%) and 9-year (0.01–0.05%) soils. The dominant archaeal genera showed a changing pattern with increasing planting years. The dominant genera in the 1-year and 6-year soils were Candidatus Nitrososphaera, while Candidatus Nitrocosmicus was also present in the 3-year soil. Both belong to ammonia-oxidizing archaea and are widely involved in the ammonia oxidation process in the soil, playing a crucial role in the nitrogen cycle.
This study utilized the PICRUSt and Greengenes databases for comparison and, based on the alignment results, predicted functional genes in the soil at Level 3 (Figure S2). The results indicate that DNA repair and recombination proteins, the two-component system, purine metabolism, bacterial motility proteins, and ribosomes are the five most dominant functional genes across all treatments. The prevalence of these genes suggests a high degree of universality in the involvement of the soil microbiome in fundamental metabolism and the maintenance of its ecological functions. However, no significant differences were observed in the dominant functional genes across treatments, likely due to their fundamental roles in microbial survival and adaptation, which allow these genes to remain relatively stable under varying environmental conditions.

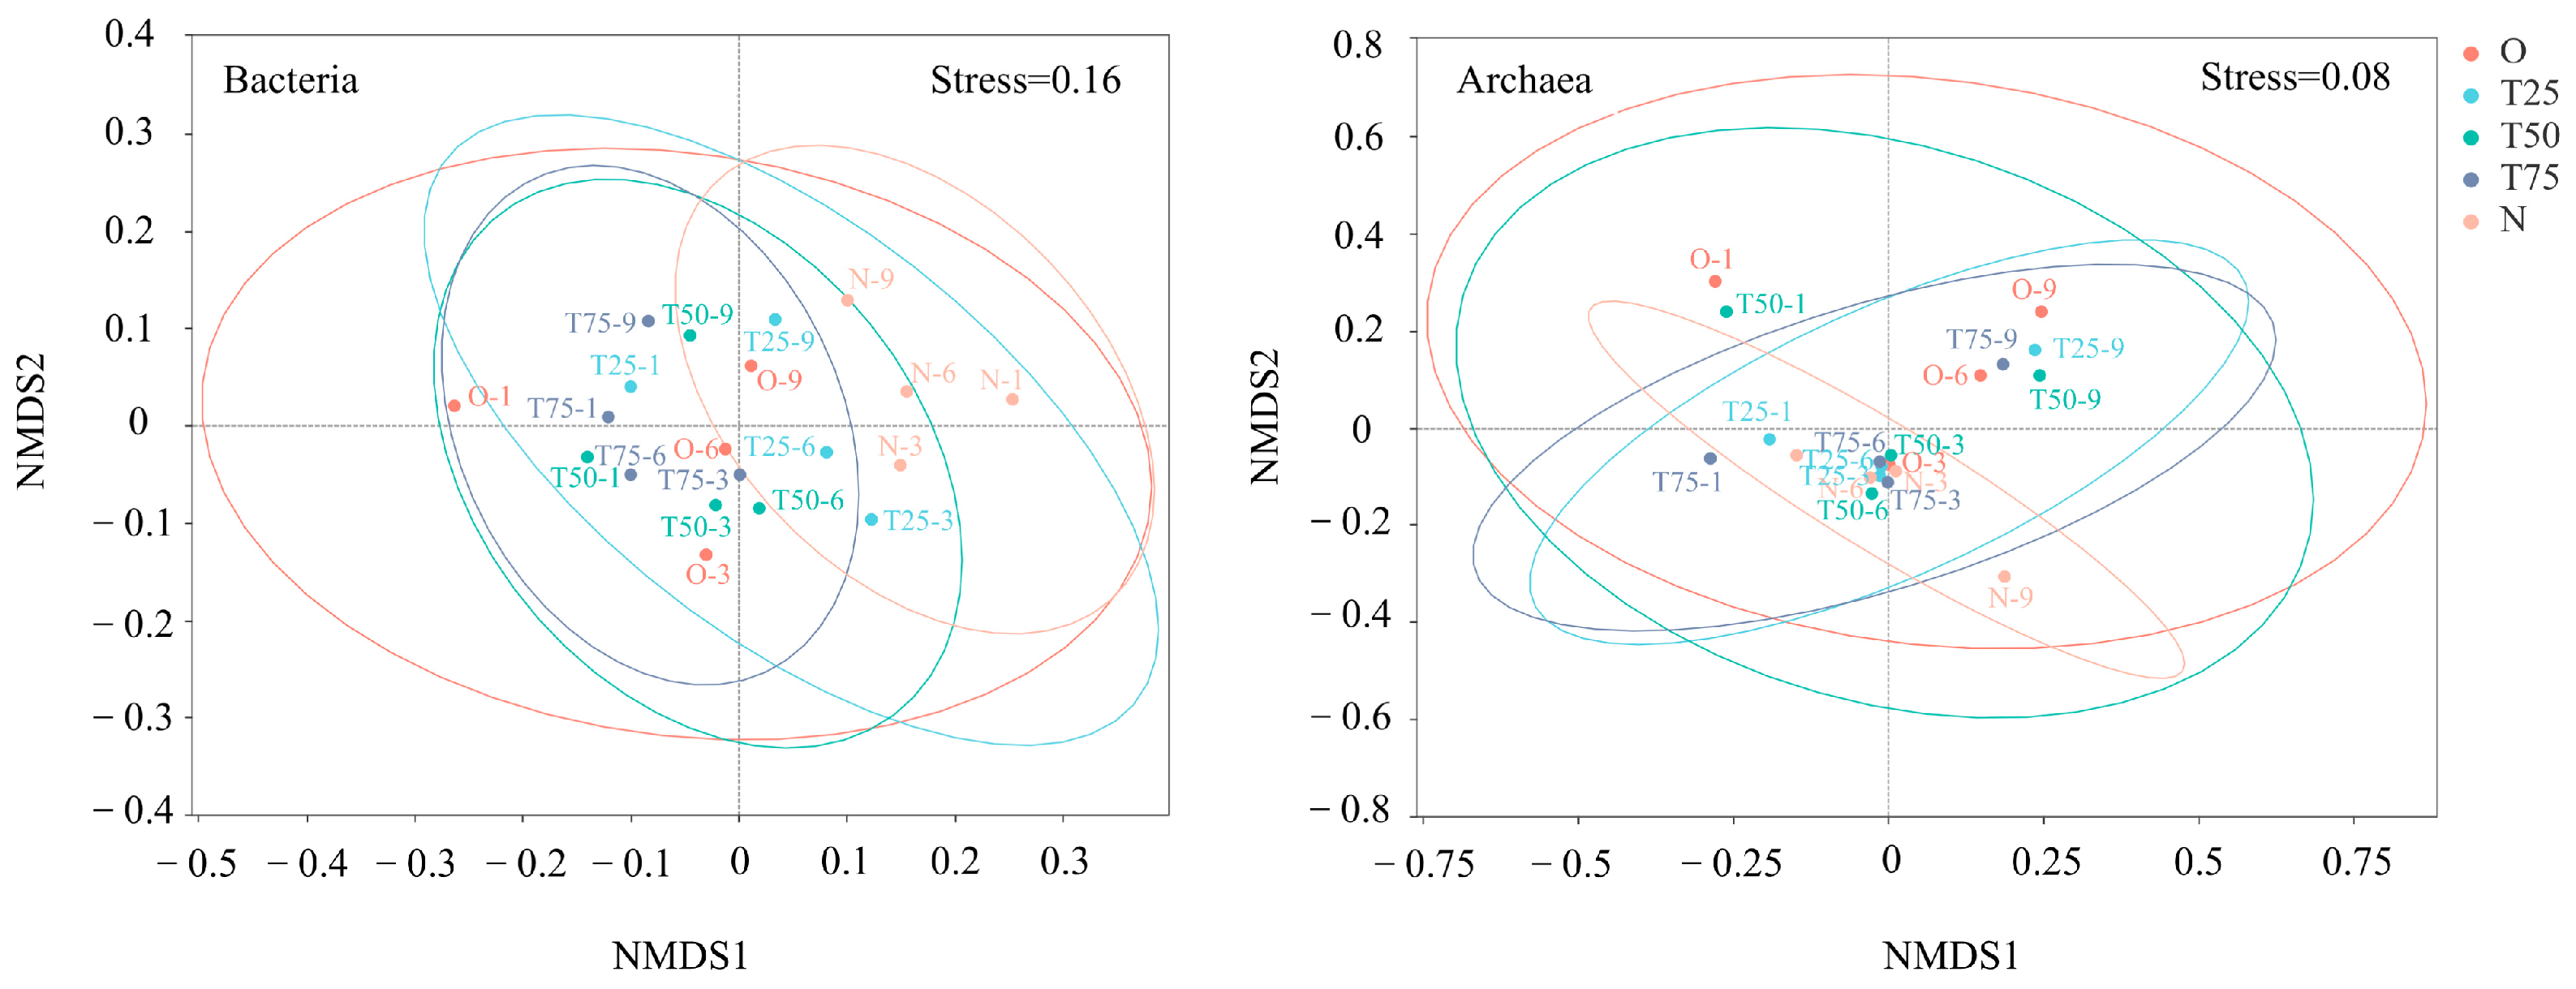
3.3.3. Non-Metric Multi-Dimensional Scaling Analysis

Non-metric multidimensional scaling (NMDS) is a nonlinear model based on the Weighted UniFrac distance, which represents the species information in the samples as points on a two-dimensional plane. The degree of difference between different treatments is reflected by the distances between points, which also reflects both inter-group and intra-group differences for each treatment. This approach overcomes the limitations of linear models (e.g., PCA, PCoA) and better reflects the nonlinear structure of ecological data. The results indicate that the bacterial community structure under different treatments is more dispersed in the NMDS plot, suggesting that the proportion of organic fertilizer substitution and soil planting years interactively influence the bacterial community structure (Figure 6). Specifically, the difference in community structure between the N treatment and the organic fertilizer substitution treatment is largest in the 1-year soil, and this difference gradually diminishes with increasing soil planting years. In the archaeal analysis, the treatments in the 3-year and 6-year soils are clustered in the NMDS plot, indicating that soil planting years have a greater impact on the archaeal community structure. In contrast, the treatments in the 1-year and 9-year soils are dispersed, suggesting that the archaeal community in these two soils is influenced by both planting years and fertilization ratios. When the stress value is less than 0.2, it indicates that NMDS can accurately reflect the degree of difference between treatments.

3.3.4. LDA Effect Size Analysis

LDA Effect Size (LEfSe) emphasizes both statistical significance and biological relevance, facilitating the identification of statistically significant biomarkers between groups to explore the significant differences in microbial communities under different fertilization treatments. No statistically significant differences in archaeal species were identified through LEfSe analysis (Figure 7). A total of 29 bacterial species with significant differences were detected across the five fertilization treatments. The magnitude of the LDA score represents the strength of the effect of the differential species. Differential species with an LDA score greater than 2 are considered reliable, with higher values indicating stronger effects. We selected species with an LDA score greater than 4 as differential species, thus applying a more stringent selection criterion. It can be observed that the T25 treatment has the fewest differential species, while the N treatment exhibits the highest number of differential species across different taxonomic levels. Additionally, the only three phylum-level differential species (Gemmatimonadota, Actinobacteriota, and Patescibacteria) are found exclusively in the N treatment. The differential species under the O treatment include Bacteroidales, Dysgonomonadaceae, and Fermentimonas, all of which could contribute to increased soil CO2 and CH4 emissions, especially under conditions where pig manure provides abundant organic matter and the soil remains moist. Meanwhile, we observed that the number of bacterial differential species increased across the phylum (3), class (3), order (6), family (8), and genus (8) levels, indicating that, as the taxonomic level becomes more refined, the environmental adaptability of the species decreases, and the impact of different fertilization treatments becomes more pronounced.

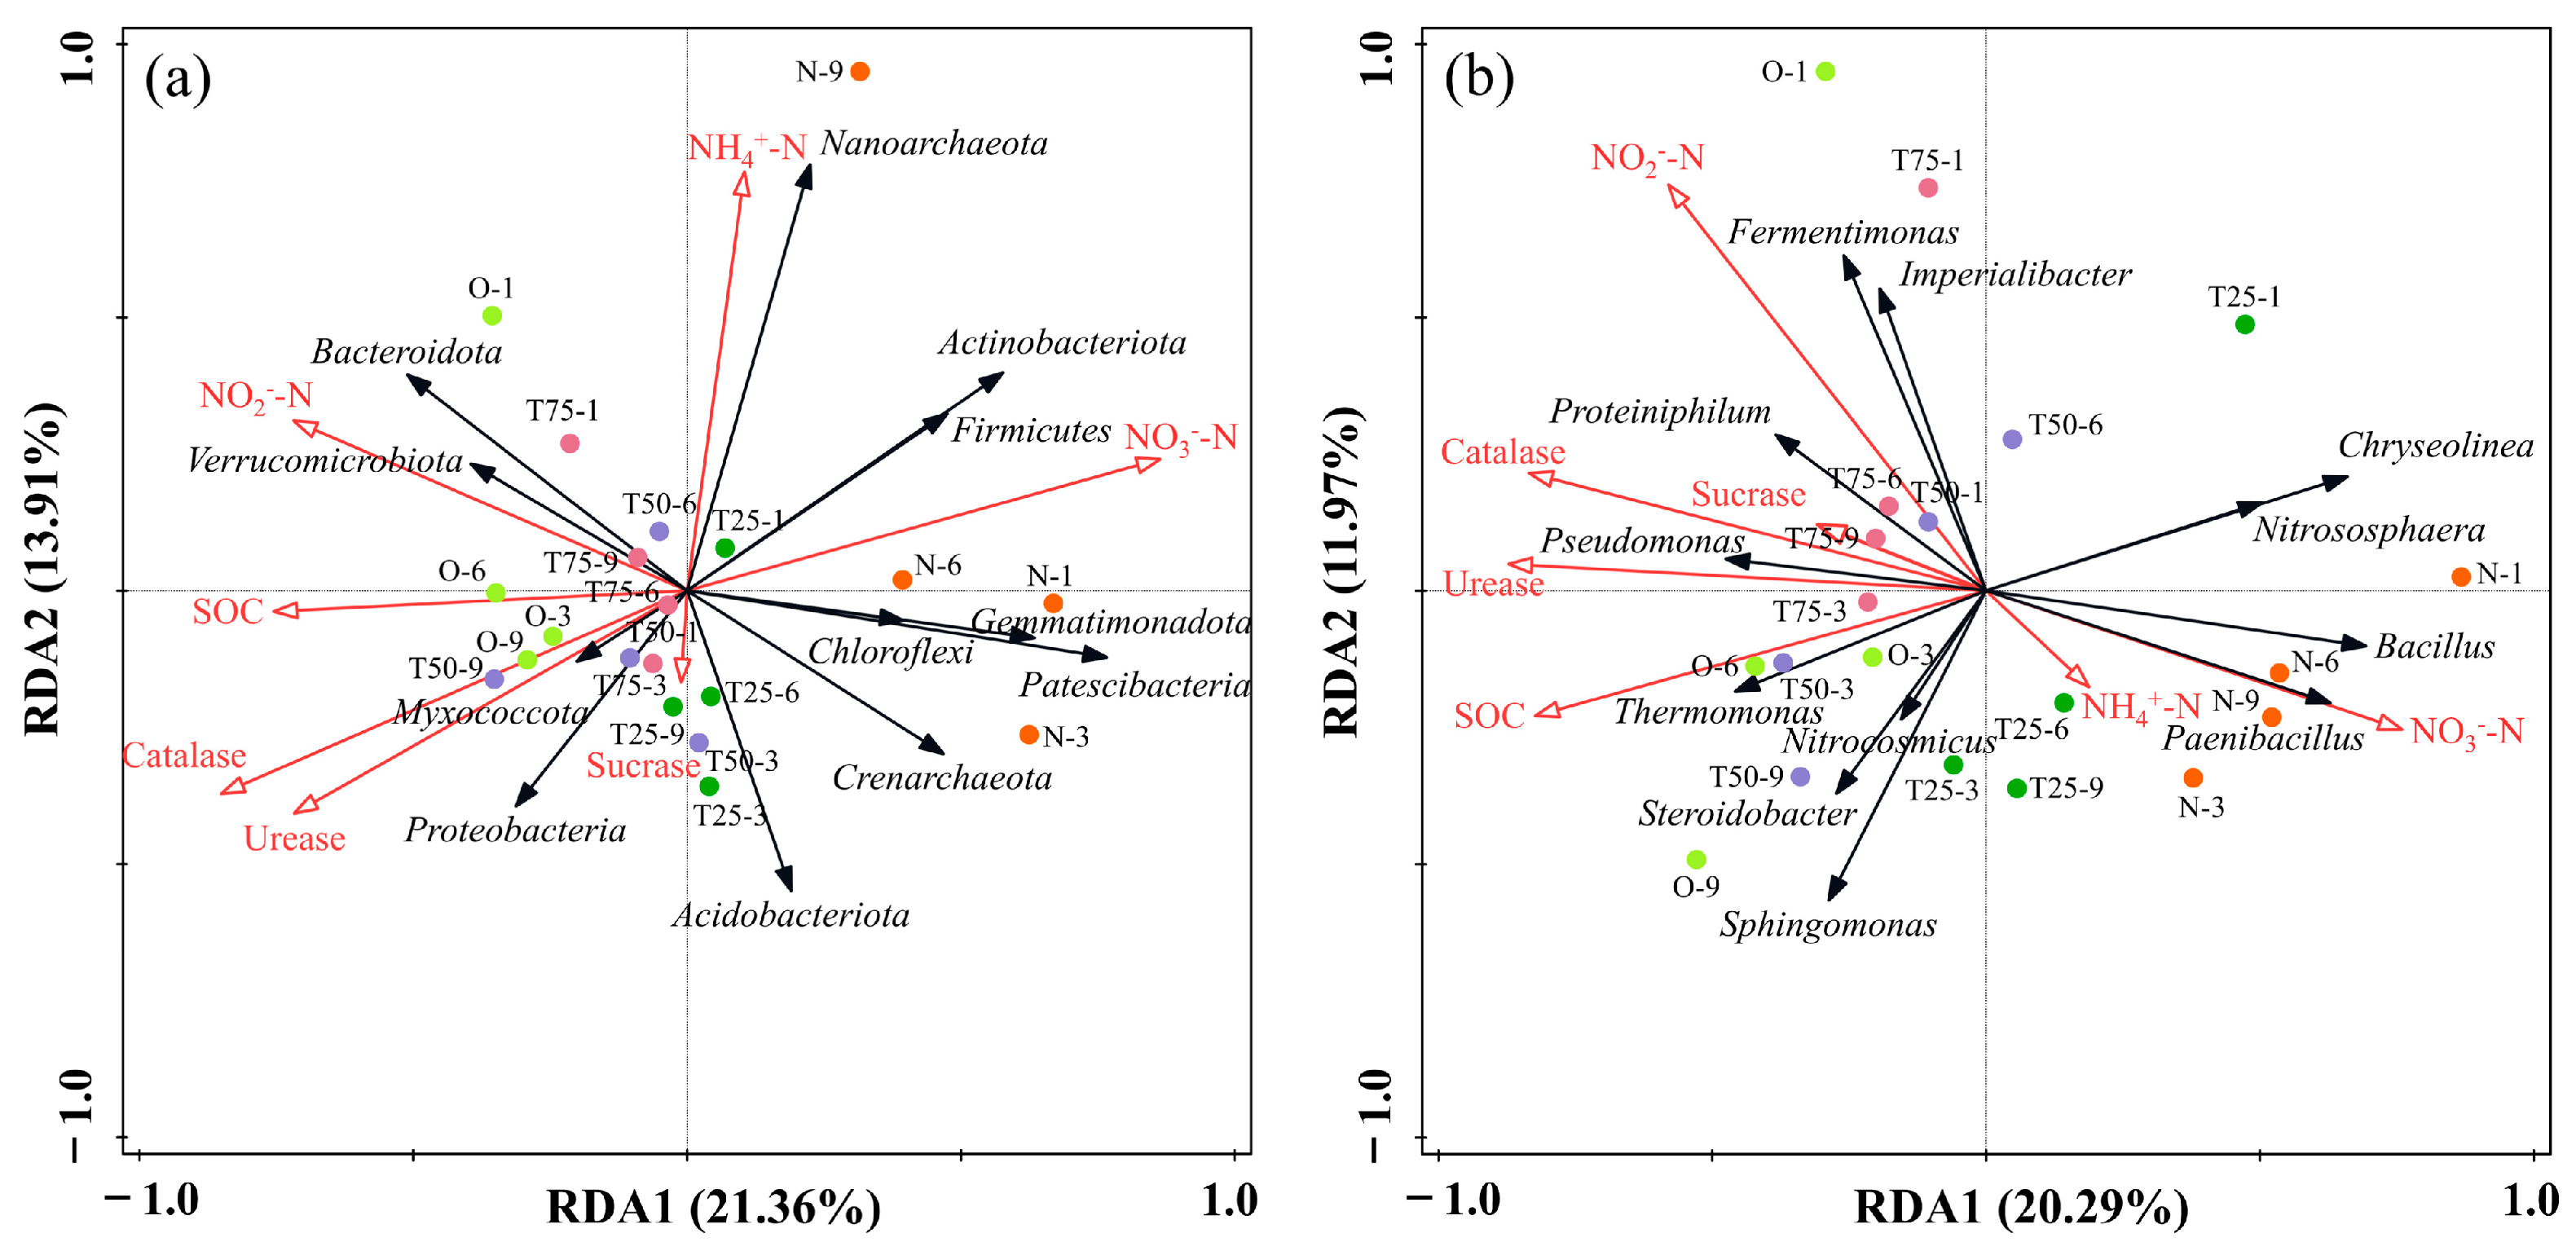
3.3.5. Redundancy Analysis

This study conducted redundancy analysis (RDA) using data from 12 microbial communities and environmental factors across 20 samples. As shown in Table 2, the model explained 48.34% (at the phylum level) and 45.41% (at the genus level) of the variation in community structure. The RDA1 and RDA2 axes explained 35.27% (at the phylum level) and 32.26% (at the genus level) of the variation in community structure. NH4+-N and catalase (p < 0.01), as well as NO2-N (p < 0.05), were significant factors affecting the phyla of bacteria and archaea. Urease (p < 0.01) and NO2-N (p < 0.05) were significant factors influencing the genera of bacteria and archaea. The sample distribution across two taxonomic levels revealed that samples under organic fertilizer substitution treatments exceeding 50% were widely distributed along the directions of catalase, NO2-N, urease, SOC, and sucrase. This indicates that, when the organic fertilizer substitution rate exceeds 50%, enzyme activity and NO2-N have a significant impact on microbial community structure (Figure 8). The samples under the N treatment were distributed along the directions of NH4+-N and NO3-N, suggesting that, under N treatment, where abundant nitrogen is provided, the content of inorganic nitrogen has a greater impact on the soil microbial community structure. The sample distribution under the T25 treatment was intermediate between the two aforementioned cases.

4. Discussion

4.1. Effects of Different Fertilization Treatments on Soil Physicochemical Properties and Enzyme Activities

SOC plays a crucial role in microbial growth and the maintenance of carbon storage [24,25]. Previous studies have shown that the SOC content in greenhouse soils planted for 3, 5, 7, and 10 years is significantly higher than that in soils planted for 0 years [26]. After 14 days of pre-culture, the SOC content in soils planted for 3, 6, and 9 years was between 5.49 g/kg and 18.13 g/kg higher than that in soils planted for 1 year. The annual application of large amounts of organic fertilizer is one of the main reasons for the gradual accumulation of SOC content with increasing planting years. Additionally, the plant litter from cucumber and bitter melon decomposes on the soil surface, contributing to SOC sources [27]. Luan et al. conducted an eight-year fertilization study and found that organic fertilization positively affected the increase in SOC content and microbial activity, as organic fertilizers provided sufficient carbon and nutrients [28]. Studies on vegetable fields have shown that, as the proportion of organic fertilizer applied increases, the SOC content also increases [29]. Our findings are consistent with these results, as the SOC concentration showed greater changes under high organic fertilizer substitution treatments after fertilization due to the rich organic matter in organic fertilizers. Since both the increase in planting years and the proportion of organic fertilizer substitution contribute to the growth of SOC, after 49 days of culture, the SOC concentration increased with the higher proportion of organic fertilizer and the longer planting years.
The concentration of NH4+-N in all soils showed a significant positive correlation with the SOC concentration (p < 0.05), likely due to the decomposition of SOC producing NH4+-N. Soils with higher SOC generally have better water and nutrient retention capacity, which aids in the fixation of NH4+-N. We found that a longer cultivation period and a higher proportion of organic fertilizer result in a higher NH4+-N concentration at the end of cultivation. The study by Yuan et al. supports this conclusion, showing that, after 11 years of cultivation in facility vegetable soils, the NH4+-N concentration increased by 32.8–58.1% under organic fertilizer treatment compared to nitrogen fertilizer treatment, as organic fertilizer improves the nitrogen supply capacity of the soil [30]. After urea enters the soil, it is first hydrolyzed by urease into NH4+-N, and then converted to NO3-N through nitrification, a microbial-driven process. When the SOC concentration is higher, microorganisms may preferentially utilize organic carbon as an energy source, thus affecting nitrate formation. Consequently, the concentration of NO3-N in soils after 1, 3, and 6 years of cultivation showed a significant negative correlation with the SOC concentration (p < 0.001). The soil used in this experiment was weakly alkaline, a property that increases the nitrification rate of the soil [31]. In combination with the results of this study, in which different soil N treatments maintained high NO3-N concentrations during culture, it is recommended that facility agriculture avoid the excessive use of nitrogen fertilizers to reduce nitrate accumulation. Moreover, catalase can regulate soil redox conditions [32]. Under reducing conditions, NO3-N is reduced to N2O, N2, and other nitrogen forms through denitrification. Therefore, the concentration of NO3-N in soils after 1, 3, and 6 years of cultivation showed a significant negative correlation with catalase activity (p < 0.05).
After 14 days of pre-culture, we found that urease activity in soils planted for 3, 6, and 9 years was significantly higher than that in the soil planted for 1 year. Plant roots can stimulate soil enzyme activity, and previous studies have shown that urease activity is higher in soils with longer cultivation periods than in those with shorter cultivation periods, with the highest activity observed in soils cultivated for 10 years [26,33]. However, at the end of the pre-culture period, urease activity was highest in the 3-year-old soil, which could be due to the inhibitory effect of NH4+-N on urease activity. The study by Zhu et al. suggests that NH4+-N is a key factor in inducing changes in soil enzyme activity, while our study found that this effect was negative [34]. At the end of the pre-culture period, NH4+-N was highest in the 6-year-old and 9-year-old soils, and its negative correlation with urease and catalase was strongest (p < 0.001). In the soil planted for 1 year, the NH4+-N content showed a significant negative correlation with urease and sucrase (p < 0.01), as well as with catalase (p < 0.001). We speculate that this phenomenon may be due to two possible reasons: (1) NH4+ may bind to the active sites of urease and catalase, preventing the binding of urea molecules and hydrogen peroxide to the enzymes, thereby inhibiting enzyme activity. (2) High concentrations of NH4+-N may lead to the production of reactive oxygen species (ROS) in the soil, which can cause oxidative damage to urease or catalase, thereby inhibiting their activity.
On day 28 of the cultivation period and at the end of the cultivation, we found that soil urease and catalase activities under the OFN treatment were significantly higher than those under the N treatment (p < 0.05). Shao et al. conducted a continuous 30-year fertilization experiment on paddy fields and demonstrated that urease and catalase activities were significantly higher when pig manure was applied along with nitrogen, phosphorus, and potassium compared to the treatment without pig manure [19]. This phenomenon is attributed to the fact that the input of organic fertilizers alters the carbon availability in the soil, which, in turn, enhances microbial activity and promotes the secretion of extracellular enzymes [35]. The results of RDA showed that catalase was significantly correlated with microbial phylum levels (p < 0.01) and exhibited a positive correlation with Proteobacteria and Bacteroidota. The input of organic fertilizers increased the relative abundance of Proteobacteria and Bacteroidota, thereby stimulating the enhancement of catalase activity.
At the same time, catalase, Proteobacteria, and Bacteroidota jointly participate in the decomposition of organic matter in the soil. We speculate that SOC may bind with mineral particles to form organic–mineral complexes, which can protect catalase from rapid decomposition, thus maintaining enzyme activity in the soil. This might explain why, in this study, SOC was significantly positively correlated with urease and catalase activity in all treatments (p < 0.001). This result further supports the notion that the input of organic fertilizers promotes nutrient cycling and utilization in facility soils, consistent with the findings of Zhao et al. [36]. However, after 28 days, as the organic matter gradually decomposed, the relevant enzyme activities gradually weakened. Therefore, at the end of the culture period, there was no significant decline in urease and catalase activity compared to day 28. This experiment was conducted under controlled temperature conditions. However, in actual greenhouse cultivation systems, changes in soil enzyme activity may still be influenced by a variety of external environmental factors, such as seasonal variations [37].
In conclusion, the fertilization process in facility soils should avoid the sole application of large amounts of nitrogen fertilizer and organic fertilizers. The excessive application of organic fertilizers not only leads to the accumulation of inorganic nitrogen and inhibition of soil enzyme activity, but also, meta-analysis indicates that, when the substitution rate of organic fertilizers exceeds 60%, crop yield and nitrogen use efficiency decline [38]. A 50% substitution of organic fertilizer resulted in an average yield increase of 6.9–8.6% in greenhouse vegetables over a 10-year period [39]. Another study demonstrated that, over a 5-year research period, replacing 50% of synthetic nitrogen fertilizer with organic fertilizer increased vegetable yields by 16.0–28.3% and economic profits by 6.6–48.2% [40]. However, when the organic fertilizer substitution rate reached 50%, the concentrations of copper, zinc, and cadmium in greenhouse soils increased by up to 24.4 mg/kg, 84.3 mg/kg, and 0.06 mg/kg, respectively, compared to the application of nitrogen fertilizer alone [41]. Therefore, it is more reasonable for farmers to select a 25–50% organic fertilizer substitution rate based on the actual situation during the soil fertilization process over 1-, 3-, 6-, and 9-year periods.

4.2. Impact on Soil Greenhouse Gas Emissions

After adding organic and nitrogen fertilizers to the soil, soil microorganisms require a certain period to adapt and proliferate. During this period, they decompose the nutrients in the fertilizers through a series of biochemical reactions, gradually producing greenhouse gases during nutrient transformation. Heterotrophic respiration in soil refers to the process by which microorganisms release CO2 while decomposing organic matter. A study by Yang et al. showed that nitrogen addition significantly reduces heterotrophic respiration [42]. This finding contributes to the higher CO2 emissions observed under more than 50% organic fertilizer substitution in this study, and the lower CO2 emissions under N treatments. Furthermore, our study found that the proportions of Proteobacteria and Bacteroidota in the OFN treatment were significantly higher than those in the nitrogen-only treatment. These two phyla are widely involved in the decomposition of organic matter in soil, and this process is also a major component of soil respiration [43]. Therefore, the addition of organic fertilizers increased the abundance of Proteobacteria and Bacteroidota, while also enhancing CO2 emissions. The significant positive correlation between SOC and CO2 emissions, as shown in Figure 3, further supports this finding. Furthermore, CO2 emissions were significantly positively correlated with catalase activity (p < 0.001), possibly because catalase accelerates the transformation of organic matter in the soil, stimulates microbial activity, and, consequently, enhances heterotrophic respiration. In soils aged 1, 6, and 9 years (p < 0.05 and p < 0.01), CO2 emissions were significantly negatively correlated with NH4+-N concentration. This may be due to the increase in CO2 emissions, which elevate the soil’s unstable carbon and nitrogen pools. The growth of these unstable pools stimulates the nitrification process [44].
A recent meta-analysis indicates that, when the manure substitution rate exceeds 66%, it significantly increases CH4 emissions from the soil [45]. Our study corroborates this finding, and CH4 emissions are significantly positively correlated with soil catalase activity (p < 0.001). Catalase activity is an important indicator of microbial processes and metabolic activity in soil. In this study, higher catalase activity was observed under the OFN treatment, indicating more active microbial processes. Fan et al. found that, after 84 days of study, the methane anaerobic oxidation process was most pronounced in soils amended with pig manure [46]. Similarly, in this study, CH4 emissions were higher under the OFN treatment than under the N treatment, as soil microorganisms decompose organic matter to produce CH4 under anaerobic conditions. The addition of organic fertilizer increased soil organic matter content, promoting the growth and metabolism of methane-producing microorganisms, which resulted in increased CH4 emissions and reduced nitrate concentrations in the soil [23,47]. Vaksmaa et al. demonstrated that, in methane anaerobic oxidation, nitrate and nitrite reductions utilize nitrate and nitrite as electron acceptors, indicating an association between CH4 emissions and nitrate and nitrite concentrations [48]. This study confirmed these findings. Correlation analysis showed that CH4 emissions in soils at 1, 3, and 6 years were significantly negatively correlated with NO3-N and NO2-N concentrations (p < 0.05).
The meta-analysis by Liu et al. indicates that when the OFN ratio exceeds 70%, nitrogen leaching losses are significantly reduced, N2O emissions decrease by 14.3%, and emissions are negatively correlated with organic matter [49]. In this study, similar to their findings, N2O emissions in soils planted for 1, 3, and 6 years are significantly negatively correlated with SOC concentration (p < 0.05). However, in the 1- and 9-year soils, the T75 treatment increased soil N2O emissions. In the T75 treatment, we identified the differential species Clostridia, an anaerobic microorganism that reduces NO3-N to N2O during denitrification in soil. This could be a potential cause of the increased N2O emissions under the T75 treatment. The study by Li et al. shows that N2O emissions in facility vegetable fields peak two weeks after fertilization, with NH4+-N and NO3-N concentrations being the main factors influencing N2O emissions (p < 0.01) [50]. This study demonstrates specific patterns in N2O emissions. In the 1-, 3-, and 6-year soils, only the N or T75 treatments exhibited higher N2O emissions at 2–3 weeks, while in the 9-year soils, more than 50% of the OFN treatments had higher N2O emissions compared to the N treatment. The significant factors contributing to the increased N2O emissions are NO3-N and NO2-N, as NO3-N is a key substrate in the denitrification process. As mentioned earlier, reducing greenhouse gas emissions in agricultural production is crucial for achieving China’s dual carbon goals. The T25 treatment can reduce the GWP by as much as 32.32–60.05% across various soils, thereby providing strong support for China’s carbon peak goal before 2030.

4.3. Effects of Different Fertilization Treatments on Soil Microbial Abundance in Different Years

Bacteria and archaea play crucial roles in soil processes, such as carbon and nitrogen fixation, denitrification, immune regulation, and pathogen control, which significantly impact soil health and crop growth [51,52,53]. Previous studies have indicated that the application of organic fertilizers combined with chemical fertilizers increases the diversity and richness of bacterial communities in soils used for growing bok choy. This is because organic fertilizers not only enhance the resilience of soil microbial communities to disturbances, but also introduce their inherent microbial populations into the soil [54]. In this study, we found that the highest total number of microbial species in soils over 1, 3, 6, and 9 years occurred at organic fertilizer substitution ratios of 0%, 25%, 50%, and 75%, respectively. Additionally, both NMDS and LEfSe analyses demonstrated that microbial community structures differed significantly under different fertilization ratios and planting durations.
The following factors may have contributed to the observed phenomenon. First, this study used naturally air dried pig manure, which contains fewer microorganisms than the fermented organic fertilizer used by Jin et al. Additionally, soil after one year of planting has not yet reached its optimal structure and fertility, resulting in lower microbial diversity and stability. This is further evidenced by the largest differences in community structure between the N treatment and the organic fertilizer substitution treatment in one-year-old soil, as shown in the NMDS analysis. The addition of 100% nitrogen fertilizer may have directly provided abundant nitrogen sources to the microorganisms in the soil, promoting their rapid growth and reproduction, and resulting in the highest total microbial community. As planting duration increased, soil fertility and structure improved, allowing the microbial community to gradually adapt to changes in the soil environment, resulting in increased diversity and stability [55]. The adaptive changes in the microbial community may have enabled it to more effectively utilize organic carbon sources and other nutrients in the soil, thereby reducing its dependence on nitrogen fertilizers. The gradually increasing proportion of organic fertilizer substitution provided abundant organic carbon sources and nutrients for soil microorganisms, promoting their growth and reproduction, and facilitating synergistic interactions among microorganisms with different functions, further enhancing the total microbial community.
Microbial diversity and richness were greatest under the T25 treatment in soils from years 3, 6, and 9. This may be attributed to the gradual improvement of soil fertility and structure, which reduces microbial dependence on nitrogen sources. The 25% organic fertilizer substitution ratio neither leads to excessive nitrogen supply nor results in the overdominance of phyla such as Proteobacteria, Bacteroidota, and Firmicutes due to excessive organic fertilizer addition. In the 9-year-old soil, the total bacterial count under treatments other than T75 was lower than under the same treatments in other soils, indicating that long-term planting and excessive fertilization reduce microbial richness. This disruption may be more evident in the rare bacterial and archaeal communities, as we found no significant differences in dominant bacteria across soils, whereas the archaeal structure in the 9-year-old soil differed markedly from that in other soils. This impact can largely be attributed to long-term fertilization, which alters soil environmental factors and enzyme activities [56].
Chen et al. demonstrated that soil microbial communities are closely related to amendments, and the SOC content is significantly associated with Proteobacteria and Gemmatimonadota [57]. This study confirms that Proteobacteria and Bacteroidota play a crucial role in soil carbon sequestration and the carbon cycle, consistent with the findings of Wang et al. [58]. Both phyla are involved in the decomposition of organic matter. The eutrophic bacterium Proteobacteria grows faster in carbon- and nutrient-rich environments than oligotrophic bacteria do. Moreover, the addition of manure can directly increase the relative abundance of Bacteroidota [9,59]. The differential species Fermentimonas under the O treatment is a dominant member of Bacteroidetes and plays an important role in the fermentation of carbohydrates and proteins. Therefore, under conditions where organic fertilizers provide sufficient carbon sources, Bacteroidota and Proteobacteria contribute to the fixation of SOC in the soil. However, the excessive application of organic fertilizers should be avoided to prevent the overdominance of Proteobacteria and Bacteroidota.
We found that the N treatment inhibited the growth of Pseudomonas compared to the OFN treatment. Pseudomonas, including strains such as Pseudomonas fluorescens, plays an important role in plant growth, maintaining soil microorganisms, and enzyme activities [60]. In the RDA results shown in Figure 8b, Pseudomonas shows a positive correlation with urease, sucrase, and catalase, which demonstrates that the addition of organic fertilizer introduces beneficial microorganisms to the soil. However, the impact of organic fertilizers on the soil microbial community structure is not always positive. Studies have shown that Bacillus abundance is lowest under the O treatment. Bacillus can secrete metabolic products such as organic acids, ammonia, and surfactants, dissolve insoluble minerals (such as phosphorus and zinc), improve soil conditions, and increase nutrient availability [61]. This may be because the complex organic substances in organic fertilizers require more time to decompose, while Bacillus relies more on rapidly available nitrogen sources for growth. Therefore, in the LEfSe analysis, the species Bacillus emerged as a differential species from the class level of Bacilli to the genus level under the N treatment. The above conclusion further demonstrates that the application of full organic or nitrogen fertilizers may lead to a decline in soil disease resistance. This is because the growth of microbial genera such as Pseudomonas and Bacillus is inhibited, and these genera have been shown to suppress the spread of soil pathogens through various mechanisms, including antibiotic production, predation, parasitism, and nutritional competition [62]. The application of organic fertilizers increases the abundance of Bacteroidota, and the genera Ohtaekwangia and Chitinophaga within Bacteroidota exert inhibitory effects on Fusarium oxysporum, thereby reducing the incidence of crop wilt disease [63].
In this study, environmental temperature and soil moisture were controlled during cultivation; however, it is undeniable that, in real greenhouse systems, both environmental temperature and soil moisture are influenced by seasonal variations and human management. Within the temperature range suitable for microbial activity, microbial activity is positively correlated with temperature [64]. Previous studies have shown that the bacterial alpha diversity index is significantly higher in summer compared to other seasons [65]. At the same time, the Chao1 index of bacterial communities is significantly higher under stable moisture conditions than when moisture fluctuates [66]. However, this study still differs from the dynamic characteristics of real greenhouse environments, particularly in production scenarios with significant diurnal temperature variation and periodic adjustments in irrigation systems, where microbial community succession patterns may exhibit significant differences. Future research should focus on the synergistic effects of temperature fluctuations and humidity variations on microbial functions. Additionally, it is recommended to integrate metagenomics and metabolomics techniques to uncover changes in key microbial functional genes (such as the nitrogen-cycling-related gene amoA) under dynamic environmental changes.

5. Conclusions

Understanding the effects of OFN on soil enzyme activity, greenhouse gas emissions, and microbial communities in facilities with varying cultivation years is crucial for the sustainable development of facility agriculture. This study found that, during the culture period, the SOC content increased with the growing cultivation years and the increasing proportion of organic fertilizer applied. Large applications of nitrogen fertilizers should be avoided in facility soils, as nitrate accumulation occurs in soils with longer cultivation years, and NH4+-N inhibits soil enzyme activity. OFN treatment can stimulate the activity of soil urease and catalase. CO2 emissions in 3-, 6-, and 9-year-old soils gradually decreased with the reduced proportion of organic fertilizer applied, but CH4 emissions were higher under the OFN treatment compared to the N treatment. Additionally, there is a risk of increased N2O emissions when the proportion of organic fertilizer is high. The substitution of 25% of chemical fertilizers with organic fertilizers has been proven to be a feasible strategy for achieving China’s carbon peak target by 2030, based on the regulation of agricultural ecosystems. Compared to the application of chemical fertilizers alone, the use of organic fertilizers increased the abundance of Proteobacteria and Bacteroidota in the soil and enhanced its potential for carbon sequestration. The highest Chao1 index in 1-, 3-, 6-, and 9-year-old soils occurred at organic fertilizer replacement ratios of 0%, 25%, 50%, and 75%, respectively. The best microbial diversity and evenness in soils at 3, 6, and 9 years were observed under the T25 treatment. NMDS analysis demonstrated that the microbial community structure was influenced by both the fertilization ratio and the cultivation years, while LefSe analysis indicated that changes in the fertilization ratio had a greater impact on the order, family, and genus classification levels.
In summary, it is recommended that farmers choose an organic fertilizer replacement ratio of 25–50% for fertilization in 1-, 3-, 6-, and 9-year-old soils based on actual conditions. As the cultivation years increase, high nitrogen and high organic fertilizer applications should be avoided. One limitation of this study is that the effect of fertilization ratios on crop yield was not investigated. Future research should consider both soil property changes and crop yield comprehensively.

Supplementary Materials

The following supporting information can be downloaded at: https://www.mdpi.com/article/10.3390/su17104541/s1.

Author Contributions

Conceptualization, Y.G.; methodology, X.L.; software, Y.G.; formal analysis, Y.G.; investigation, S.D., J.Z. and X.G.; data curation, Y.G. and C.Z.; writing—original draft preparation, Y.G.; writing—review and editing, C.Z.; visualization, Y.D. and B.G.; supervision, C.Z.; funding acquisition, C.Z., W.L. and Q.C. All authors have read and agreed to the published version of the manuscript.

Funding

This work was supported by the Natural Science Foundation of Shandong Province (ZR2024MD042), Innovation Ability Improvement Project of Small and Medium-sized High-tech Company in Zaozhuang City (2023TSGC15), National Natural Science Foundation of China (41877041), National Natural Science Foundation of China (32361143786), Natural Science Foundation of Shandong Province (ZR2022MC204), and International Cooperation Project for Pilot Project of Integration of Science, Education and Industry, Qilu University of Technology (Shandong Academy of Sciences) (2024GH07).

Institutional Review Board Statement

Not applicable.

Informed Consent Statement

Not applicable.

Data Availability Statement

The data presented in this study are available on request from the corresponding author due to the privacy policy.

Acknowledgments

We are grateful for the experimental platform provided by Shandong Analysis and Test Center, the technical support provided by Shandong Normal University, and the valuable comments of the research team members on this study.

Conflicts of Interest

The authors declare no conflicts of interest.

References

  1. Hu, W.; Zhang, Y.; Huang, B.; Teng, Y. Soil environmental quality in greenhouse vegetable production systems in eastern China: Current status and management strategies. Chemosphere 2017, 170, 183–195. [Google Scholar] [CrossRef] [PubMed]
  2. Yano, A.; Cossu, M. Energy sustainable greenhouse crop cultivation using photovoltaic technologies. Renew. Sustain. Energy Rev. 2019, 109, 116–137. [Google Scholar] [CrossRef]
  3. Qasim, W.; Xia, L.; Lin, S.; Wan, L.; Zhao, Y.; Butterbach-Bahl, K. Global greenhouse vegetable production systems are hotspots of soil N2O emissions and nitrogen leaching: A meta-analysis. Environ. Pollut. 2021, 272, 116372. [Google Scholar] [CrossRef]
  4. Li, L.; Zhao, C.; Wang, X.; Tan, Y.; Wang, X.; Liu, X.; Guo, B. Effects of nitrification and urease inhibitors on ammonia-oxidizing microorganisms, denitrifying bacteria, and greenhouse gas emissions in greenhouse vegetable fields. Environ. Res. 2023, 237, 116781. [Google Scholar] [CrossRef] [PubMed]
  5. Burke, W.J.; Frossard, E.; Kabwe, S.; Jayne, T.S. Understanding fertilizer adoption and effectiveness on maize in Zambia. Food Pol. 2019, 86, 101721. [Google Scholar] [CrossRef]
  6. Zhou, Y.; Li, X.; Liu, Y. Cultivated land protection and rational use in China. Land Use Policy 2021, 106, 105454. [Google Scholar] [CrossRef]
  7. Li, J.; Wan, X.; Liu, X.; Chen, Y.; Slaughter, L.C.; Weindorf, D.C.; Dong, Y. Changes in soil physical and chemical characteristics in intensively cultivated greenhouse vegetable fields in North China. Soil Tillage Res. 2019, 195, 104366. [Google Scholar] [CrossRef]
  8. Bai, X.; Jiang, Y.; Miao, H.; Xue, S.; Chen, Z.; Zhou, J. Intensive vegetable production results in high nitrate accumulation in deep soil profiles in China. Environ. Pollut. 2021, 287, 117598. [Google Scholar] [CrossRef]
  9. Wang, X.; Bai, J.; Xie, T.; Wang, W.; Zhang, G.; Yin, S.; Wang, D. Effects of biological nitrification inhibitors on nitrogen use efficiency and greenhouse gas emissions in agricultural soils: A review. Ecotoxicol. Environ. Saf. 2021, 220, 112338. [Google Scholar] [CrossRef]
  10. Case, S.D.C.; Oelofse, M.; Hou, Y.; Oenema, O.; Jensen, L.S. Farmer perceptions and use of organic waste products as fertilisers—A survey study of potential benefits and barriers. Agric. Syst. 2017, 151, 84–95. [Google Scholar] [CrossRef]
  11. Lin, W.; Zhen, Z.; Liu, H.; Wang, N.; Guo, L.; Meng, J.; Ding, N.; Wu, G.; Jiang, G. Effects of manure compost application on soil microbial community diversity and soil microenvironments in a temperate cropland in China. PLoS ONE 2014, 9, e108555. [Google Scholar] [CrossRef]
  12. Gai, X.; Liu, H.; Liu, J.; Zhai, L.; Yang, B.; Wu, S.; Ren, T.; Lei, Q.; Wang, H. Long-term benefits of combining chemical fertilizer and manure applications on crop yields and soil carbon and nitrogen stocks in North China Plain. Agric. Water Manag. 2018, 208, 384–392. [Google Scholar] [CrossRef]
  13. Lv, F.; Song, J.; Giltrap, D.; Feng, Y.; Yang, X.; Zhang, S. Crop yield and N2O emission affected by long-term organic manure substitution fertilizer under winter wheat-summer maize cropping system. Sci. Total Environ. 2020, 732, 139321. [Google Scholar] [CrossRef] [PubMed]
  14. Dai, X.; Song, D.; Zhou, W.; Liu, G.; Liang, G.; He, P.; Sun, G.; Yuan, F.; Liu, Z.; Yao, Y.; et al. Partial substitution of chemical nitrogen with organic nitrogen improves rice yield, soil biochemical indictors and microbial composition in a double rice cropping system in south China. Soil Tillage Res. 2021, 205, 104753. [Google Scholar] [CrossRef]
  15. Francioli, D.; Schulz, E.; Lentendu, G.; Wubet, T.; Buscot, F.; Reitz, T. Mineral vs. organic amendments: Microbial community structure, activity and abundance of agriculturally relevant microbes are driven by long-term fertilization strategies. Front. Microbiol. 2016, 7, 1446. [Google Scholar] [CrossRef]
  16. Bünemann, E.K.; Bongiorno, G.; Bai, Z.; Creamer, R.E.; De Deyn, G.; De Goede, R.; Fleskens, L.; Geissen, V.; Kuyper, T.W.; Mäder, P.; et al. Soil quality—A critical review. Soil Biol. Biochem. 2018, 120, 105–125. [Google Scholar] [CrossRef]
  17. Li, Q.; Zhang, D.; Song, Z.; Ren, L.; Jin, X.; Fang, W.; Yan, D.; Li, Y.; Wang, Q.; Cao, A. Organic fertilizer activates soil beneficial microorganisms to promote strawberry growth and soil health after fumigation. Environ. Pollut. 2022, 295, 118653. [Google Scholar] [CrossRef]
  18. Tuo, Y.; Wang, Z.; Zheng, Y.; Shi, X.; Liu, X.; Ding, M.; Yang, Q. Effect of water and fertilizer regulation on the soil microbial biomass carbon and nitrogen, enzyme activity, and saponin content of Panax notoginseng. Agric. Water Manag. 2023, 278, 108145. [Google Scholar] [CrossRef]
  19. Shao, X.; Zheng, J. Soil organic carbon, black carbon, and enzyme activity under long-term fertilization. J. Integr. Agric. 2014, 13, 517–524. [Google Scholar] [CrossRef]
  20. Riseh, R.S.; Fathi, F.; Vatankhah, M.; Kennedy, J.F. Catalase-associated immune responses in plant-microbe interactions: A review. Int. J. Biol. Macromol. 2024, 280, 135859. [Google Scholar] [CrossRef]
  21. Wang, Z.; Xing, A.; Shen, H. Effects of nitrogen addition on the combined global warming potential of three major soil greenhouse gases: A global meta-analysis. Environ. Pollut. 2023, 334, 121848. [Google Scholar] [CrossRef] [PubMed]
  22. Liu, X.; Xin, L. Spatial and temporal evolution and greenhouse gas emissions of China’s agricultural plastic greenhouses. Sci. Total Environ. 2023, 863, 160810. [Google Scholar] [CrossRef] [PubMed]
  23. Xiong, Y.; Jiang, C.; Ma, R.; Hao, Q. Effects of plastic film mulching and nitrogen fertilization on the emissions of greenhouse gases from vegetable field in Southwest China. Ecol. Front. 2024, 44, 459–466. [Google Scholar] [CrossRef]
  24. Dong, Q.; Yang, Y.; Yu, K.; Feng, H. Effects of straw mulching and plastic film mulching on improving soil organic carbon and nitrogen fractions, crop yield and water use efficiency in the Loess Plateau, China. Agric. Water Manag. 2018, 201, 133–143. [Google Scholar] [CrossRef]
  25. Lin, S.; Wang, W.; Sardans, J.; Lan, X.; Fang, Y.; Singh, B.P.; Xu, X.; Wiesmeier, M.; Tariq, A.; Zeng, F.; et al. Effects of slag and biochar amendments on microorganisms and fractions of soil organic carbon during flooding in a paddy field after two years in southeastern China. Sci. Total Environ. 2022, 824, 153783. [Google Scholar] [CrossRef] [PubMed]
  26. Zhang, J.; Wang, P.; Tian, H.; Xiao, Q.; Jiang, H. Pyrosequencing-based assessment of soil microbial community structure and analysis of soil properties with vegetable planted at different years under greenhouse conditions. Soil Tillage Res. 2019, 187, 1–10. [Google Scholar] [CrossRef]
  27. Sarker, J.R.; Singh, B.P.; Fang, Y.; Cowie, A.L.; Dougherty, W.J.; Collins, D.; Dalal, R.C.; Singh, B.K. Tillage history and crop residue input enhanced native carbon mineralisation and nutrient supply in contrasting soils under long-term farming systems. Soil Tillage Res. 2019, 193, 71–84. [Google Scholar] [CrossRef]
  28. Luan, H.; Gao, W.; Tang, J.; Li, R.; Li, M.; Zhang, H.; Chen, X.; Masiliunas, D.; Huang, S. Aggregate-associated changes in nutrient properties, microbial community and functions in a greenhouse vegetable field based on an eight-year fertilization experiment of China. J. Integr. Agric. 2020, 19, 2530–2548. [Google Scholar] [CrossRef]
  29. Shao, Y.; Chen, J.; Wang, L.; Hou, M.; Chen, D. Effects of fermented organic fertilizer application on soil N2O emission under the vegetable rotation in polyhouse. Environ. Res. 2021, 200, 111491. [Google Scholar] [CrossRef]
  30. Yuan, S.; Li, R.; Zhang, Y.; Luan, H.; Tang, J.; Wang, L.; Ji, H.; Huang, S. Effects of long-term partial substitution of inorganic fertilizer with pig manure and/or straw on nitrogen fractions and microbiological properties in greenhouse vegetable soils? J. Integr. Agric. 2024, 23, 2083–2098. [Google Scholar] [CrossRef]
  31. Liu, S.; Wu, D.; Ju, X.; Shen, J.; Cheng, Y.; Deng, N.; Song, X.; Di, H.; Li, P.; Han, L.; et al. Nitrification inhibitor induced microbial NH4+-N immobilization improves maize nitrogen use efficiency in strong ammonia oxidation soil. Soil Biol. Biochem. 2025, 202, 109687. [Google Scholar] [CrossRef]
  32. Yuan, F.; Yin, S.; Xu, Y.; Xiang, L.; Wang, H.; Li, Z.; Fan, K.; Pan, G. The Richness and Diversity of Catalases in Bacteria. Front. Microbiol. 2021, 12, 645477. [Google Scholar] [CrossRef]
  33. Touceda-González, M.; Álvarez-López, V.; Prieto-Fernández, Á.; Rodríguez-Garrido, B.; Trasar-Cepeda, C.; Mench, M.; Puschenreiter, M.; Quintela-Sabarís, C.; Macías-García, F.; Kidd, P.S. Aided phytostabilisation reduces metal toxicity, improves soil fertility and enhances microbial activity in Cu-rich mine tailings. J. Environ. Manag. 2017, 186, 301–313. [Google Scholar] [CrossRef]
  34. Zhu, M.; Song, Y.; Li, M.; Gong, C.; Liu, Z.; Yuan, J.; Li, X.; Song, C. Ammonia nitrogen and dissolved organic carbon regulate soil microbial gene abundances and enzyme activities in wetlands under different vegetation types. Appl. Soil Ecol. 2024, 196, 105310. [Google Scholar] [CrossRef]
  35. Sheoran, S.; Prakash, D.; Yadav, P.K.; Gupta, R.K.; Al-Ansari, N.; El-Hendawy, S.; Mattar, M.A. Long-term application of FYM and fertilizer N improve soil fertility and enzyme activity in 51st wheat cycle under pearl millet-wheat. Sci. Rep. 2024, 14, 21695. [Google Scholar] [CrossRef] [PubMed]
  36. Zhao, J.; Ni, T.; Li, J.; Lu, Q.; Fang, Z.; Huang, Q.; Zhang, R.; Li, R.; Shen, B.; Shen, Q. Effects of organic–inorganic compound fertilizer with reduced chemical fertilizer application on crop yields, soil biological activity and bacterial community structure in a rice–wheat cropping system. Appl. Soil Ecol. 2016, 99, 1–12. [Google Scholar] [CrossRef]
  37. Tan, H.; Tuo, Y.; Chang, X.; Liang, J.; Yang, Q.; He, X. Characteristics of forest soil enzyme activities, nutrient restriction, and physicochemical properties at different altitudes and their seasonal dynamics. Eurasian Soil Sci. 2025, 58, 4. [Google Scholar] [CrossRef]
  38. Ren, K.; Sun, Y.; Zou, H.; Li, D.; Lu, C.; Duan, Y.; Zhang, W. Effect of replacing synthetic nitrogen fertilizer with animal manure on grain yield and nitrogen use efficiency in China: A meta-analysis. Front. Plant Sci. 2023, 14, 1153235. [Google Scholar] [CrossRef] [PubMed]
  39. Zhang, Y.; Gao, W.; Luan, H.; Tang, J.; Li, R.; Li, M.; Zhang, H.; Huang, S. Effects of a decade of organic fertilizer substitution on vegetable yield and soil phosphorus pools, phosphatase activities, and the microbial community in a greenhouse vegetable production system. J. Integr. Agric. 2022, 21, 2119–2133. [Google Scholar] [CrossRef]
  40. Xu, X.; Xiao, C.; Bi, R.; Jiao, Y.; Wang, B.; Dong, Y.; Xiong, Z. Optimizing organic fertilization towards sustainable vegetable production evaluated by long-term field measurement and multi-level fuzzy comprehensive model. Agric. Ecosyst. Environ. 2024, 368, 109008. [Google Scholar] [CrossRef]
  41. Zhang, Y.; Tang, S.; Li, Y.; Li, R.; Huang, S.; Wang, H. Risk assessment of heavy metal accumulation in cucumber fruits and soil in a greenhouse system with long-term application of organic fertilizer and chemical fertilizer. Agriculture 2024, 14, 1870. [Google Scholar] [CrossRef]
  42. Yang, Y.; Li, T.; Pokharel, P.; Liu, L.; Qiao, J.; Wang, Y.; An, S.; Chang, S.X. Global effects on soil respiration and its temperature sensitivity depend on nitrogen addition rate. Soil Biol. Biochem. 2022, 174, 108814. [Google Scholar] [CrossRef]
  43. Kruczyńska, A.; Kuźniar, A.; Podlewski, J.; Słomczewski, A.; Grządziel, J.; Marzec-Grządziel, A.; Gałązka, A.; Wolińska, A. Bacteroidota structure in the face of varying agricultural practices as an important indicator of soil quality—A culture independent approach. Agric. Ecosyst. Environ. 2023, 342, 108252. [Google Scholar] [CrossRef]
  44. Du, Y.; Guo, X.; Li, J.; Liu, Y.; Luo, J.; Liang, Y.; Li, T. Elevated carbon dioxide stimulates nitrous oxide emission in agricultural soils: A global meta-analysis. Pedosphere 2022, 32, 3–14. [Google Scholar] [CrossRef]
  45. Meng, X.; Liu, S.; Zou, J.; Osborne, B. The effect of substituting inorganic fertilizer with manure on soil N2O and CH4 emissions and crop yields: A global meta-analysis. Field Crops Res. 2025, 326, 109831. [Google Scholar] [CrossRef]
  46. Fan, L.; Dippold, M.A.; Ge, T.; Wu, J.; Thiel, V.; Kuzyakov, Y.; Dorodnikov, M. Anaerobic oxidation of methane in paddy soil: Role of electron acceptors and fertilization in mitigating CH4 fluxes. Soil Biol. Biochem. 2020, 141, 107685. [Google Scholar] [CrossRef]
  47. Yang, Y.; Shen, L.; Zhao, X.; Agathokleous, E.; Wang, S.; Ren, B.; Yang, W.; Liu, J.; Jin, J.; Huang, H.; et al. Long-term fertilization enhances the activity of anaerobic oxidation of methane coupled to nitrate reduction and associated microbial abundance in paddy soils. Soil Biol. Biochem. 2023, 185, 109130. [Google Scholar] [CrossRef]
  48. Vaksmaa, A.; Guerrero-Cruz, S.; Van Alen, T.A.; Cremers, G.; Ettwig, K.F.; Lüke, C.; Jetten, M.S.M. Enrichment of anaerobic nitrate-dependent methanotrophic ‘Candidatus Methanoperedens nitroreducens’ archaea from an Italian paddy field soil. Appl. Microbiol. Biotechnol. 2017, 101, 7075–7084. [Google Scholar] [CrossRef]
  49. Liu, B.; Wang, X.; Ma, L.; Chadwick, D.; Chen, X. Combined applications of organic and synthetic nitrogen fertilizers for improving crop yield and reducing reactive nitrogen losses from China’s vegetable systems: A meta-analysis. Environ. Pollut. 2021, 269, 116143. [Google Scholar] [CrossRef]
  50. Li, Q.; Andom, O.; Li, Y.; Cheng, C.; Deng, H.; Sun, L.; Li, Z. Responses of grape yield and quality, soil physicochemical and microbial properties to different planting years. Eur. J. Soil Biol. 2024, 120, 103587. [Google Scholar] [CrossRef]
  51. Verma, K.K.; Song, X.; Li, D.; Singh, M.; Rajput, V.D.; Malviya, M.K.; Minkina, T.; Singh, R.K.; Singh, P.; Li, Y. Interactive role of silicon and plant–rhizobacteria mitigating abiotic stresses: A new approach for sustainable agriculture and climate change. Plants 2020, 9, 1055. [Google Scholar] [CrossRef] [PubMed]
  52. Ayangbenro, A.S.; Babalola, O.O. Reclamation of arid and semi-arid soils: The role of plant growth-promoting archaea and bacteria. Curr. Plant Biol. 2021, 25, 100173. [Google Scholar] [CrossRef]
  53. Zhang, X.; Zhang, C.; Liu, Y.; Zhang, R.; Li, M. Non-negligible roles of archaea in coastal carbon biogeochemical cycling. Trends Microbiol. 2023, 31, 586–600. [Google Scholar] [CrossRef]
  54. Jin, L.; Jin, N.; Wang, S.; Li, J.; Meng, X.; Xie, Y.; Wu, Y.; Luo, S.; Lyu, J.; Yu, J.; et al. Changes in the microbial structure of the root soil and the yield of Chinese baby cabbage by chemical fertilizer reduction with bio-organic fertilizer application. Microbiol. Spectr. 2022, 10, 1215–1222. [Google Scholar] [CrossRef]
  55. He, C.; Wang, R.; Ding, W.; Li, Y. Effects of cultivation soils and ages on microbiome in the rhizosphere soil of Panax ginseng. Appl. Soil Ecol. 2022, 174, 104397. [Google Scholar] [CrossRef]
  56. Xu, X.; Wang, J.; Niu, Y.; Jiang, W.; Wang, Y.; Liu, S.; Wei, W. 44-Years of Fertilization Altered Soil Microbial Community Structure by Changing Soil Physical, Chemical Properties and Enzyme Activity. J. Soil Sci. Plant Nutr. 2024, 24, 3150–3161. [Google Scholar] [CrossRef]
  57. Chen, L.; Sun, S.; Zhou, Y.; Zhang, B.; Peng, Y.; Zhuo, Y.; Ai, W.; Gao, C.; Wu, B.; Liu, D.; et al. Straw and straw biochar differently affect fractions of soil organic carbon and microorganisms in farmland soil under different water regimes. Environ. Technol. Innov. 2023, 32, 103412. [Google Scholar] [CrossRef]
  58. Wang, J.; Fu, X.; Ghimire, R.; Sainju, U.M.; Jia, Y.; Zhao, F. Responses of soil bacterial community and enzyme activity to organic matter components under long-term fertilization on the Loess Plateau of China. Appl. Soil Ecol. 2021, 166, 103992. [Google Scholar] [CrossRef]
  59. Trivedi, P.; Rochester, I.J.; Trivedi, C.; Van Nostrand, J.D.; Zhou, J.; Karunaratne, S.; Anderson, I.C.; Singh, B.K. Soil aggregate size mediates the impacts of cropping regimes on soil carbon and microbial communities. Soil Biol. Biochem. 2015, 91, 169–181. [Google Scholar] [CrossRef]
  60. Shah, A.; Nazari, M.; Antar, M.; Msimbira, L.A.; Naamala, J.; Lyu, D.; Rabileh, M.; Zajonc, J.; Smith, D.L. PGPR in Agriculture: A Sustainable Approach to Increasing Climate Change Resilience. Front. Sustain. Food Syst. 2021, 5, 667546. [Google Scholar] [CrossRef]
  61. Saxena, A.K.; Kumar, M.; Chakdar, H.; Anuroopa, N.; Bagyaraj, D.J. Bacillusspecies in soil as a natural resource for plant health and nutrition. J. Appl. Microbiol. 2019, 128, 1583–1594. [Google Scholar] [CrossRef] [PubMed]
  62. Gupta, R.; Anand, G.; Pandey, R.; Bar, M.; Yadav, D. Employing Bacillus and Pseudomonas for phytonematode management in agricultural crops. World J. Microbiol. Biotechnol. 2024, 40, 331. [Google Scholar] [CrossRef] [PubMed]
  63. Deng, X.; Zhang, N.; Shen, Z.; Zhu, C.; Liu, H.; Xu, Z.; Li, R.; Shen, Q.; Salles, J.F. Soil microbiome manipulation triggers direct and possible indirect suppression against Ralstonia solanacearum and Fusarium oxysporum. npj Biofilms Microbiomes 2021, 7, 33. [Google Scholar] [CrossRef] [PubMed]
  64. Yuan, S.; Yang, Z.; Yuan, X.; Lin, W.; Xiong, D.; Yang, Y. Effects of precipitation exclusion and warming on soil soluble carbon and nitrogen in a young Cunninghamia lanceolata plantation. J. Appl. Econ. 2018, 29, 2217–2223. [Google Scholar] [CrossRef]
  65. Xiong, R.; Qian, D.; Qiu, Z.; Hou, Y.; Li, Q.; Shen, W. Land-use intensification exerts a greater influence on soil microbial communities than seasonal variations in the Taihu Lake region, China. Sci. Total Environ. 2024, 943, 173630. [Google Scholar] [CrossRef]
  66. Liu, D.; Wang, Z.; Zhu, G.; Xu, A.; Zhang, R.; Bryant, R.; Drohan, P.J.; Long, H.; Willemsen, V. Stable soil moisture promotes shoot performance and shapes the root-rhizosphere microbiome. Agric. Water Manag. 2025, 310, 109354. [Google Scholar] [CrossRef]
Figure 1. Changes in the concentrations of NH4+-N, NO2-N, NO3-N, and SOC under different treatments. The concentrations of NH4+-N, NO2-N, and NO3-N are expressed in mg/kg, while SOC concentrations are expressed in g/kg.
Sustainability 17 04541 g001
Figure 2. Error band plot of greenhouse gas emissions concentration. The horizontal axis represents the cultivation time (days), while the vertical axis represents the gas concentration (mg/m3).
Sustainability 17 04541 g002
Figure 3. Correlation analysis between soil environmental factors and greenhouse gas emissions; (ad) represent soil years 1, 3, 6, and 9, respectively. (*: p < 0.05, **: p < 0.01, ***: p < 0.001).
Sustainability 17 04541 g003
Figure 4. Effects of different fertilization treatments on the microbial community structure at the phylum level. The upper panel shows bacteria and the lower panel shows archaea.
Sustainability 17 04541 g004
Figure 5. Effects of different fertilization treatments on the microbial community structure at the genus level. The (upper) panel shows bacteria and the (lower) panel shows archaea.
Sustainability 17 04541 g005
Figure 6. NMDS analysis. N-1 indicates N treatment in soil for 1 year, and so on. Circles of different colors represent different fertilization treatments. By observing the degree of overlap or distance between the circles of the two groups, the similarity of the samples can be analyzed.
Sustainability 17 04541 g006
Figure 7. Evolutionary cladistics. Circles radiating outward represent taxonomic levels from phylum to species, with each circle at different taxonomic levels corresponding to a level below, and the diameter of each circle being proportional to its relative abundance. Species with no significant differences are uniformly colored yellow, while distinct biomarkers are assigned unique colors for each group. For example, red nodes represent microbial groups that play a significant role within the red group.
Sustainability 17 04541 g007
Figure 8. Redundancy analysis. (a) phylum level, (b) genus level.The position of the sample points in the figure reflects the similarity or difference between the samples. The direction pointed by the arrow represents the relationship between environmental variables and samples in the multi-dimensional space, that is, their correlation with the distribution of sample points. The length of the arrow indicates the contribution degree of the explanatory variable.
Sustainability 17 04541 g008
Table 1. Microbial alpha diversity index.
Planting YearTreatmentChao1 Index 1Shannon Index 2Simpson Index 3
BacteriaArchaeaBacteriaArchaeaBacteriaArchaea
1N1680.04121.0008.2412.6060.9860.772
T251472.24319.0007.7302.1570.9670.707
T501437.96012.0007.8642.6160.9770.806
T751496.49312.0008.4153.0440.9870.838
O1624.5289.3338.1812.5060.9870.783
3N2116.37330.0009.5804.1610.9960.917
T252185.90037.2009.6834.0920.9970.922
T501840.51512.0008.5472.8550.9870.827
T751499.00015.0008.6902.9820.9890.813
O1578.08529.2508.1013.1690.9710.820
6N1807.01518.0008.9052.6470.9940.756
T251745.14713.0008.9962.6290.9940.798
T501918.95121.6008.5762.7530.9810.717
T751660.79112.0007.9912.6880.9830.781
O1635.2436.0008.5462.2180.9910.750
9N1358.88219.0008.4731.7890.9910.480
T251343.45917.0008.6712.2570.9930.642
T501413.67314.5008.1602.8710.9890.795
T751520.94012.5008.0782.7910.9790.814
O1441.50714.5008.5543.0880.9930.850
1 represents the total species count within the community sample. 2 represents the community’s diversity and the uniformity of species distribution. 3 represents the diversity and uniformity of species distribution within the community.
Table 2. Eigenvalues of the constrained axes and significance of environmental factors in redundancy analysis.
PhylumGenus
EigenvaluesAxis10.21360.2029
Axis20.13910.1197
Axis30.08940.0779
Axis40.04130.0536
PCatalase0.0020.312
NH4+-N0.0020.258
NO2-N0.0480.016
Urease0.2340.002
Disclaimer/Publisher’s Note: The statements, opinions and data contained in all publications are solely those of the individual author(s) and contributor(s) and not of MDPI and/or the editor(s). MDPI and/or the editor(s) disclaim responsibility for any injury to people or property resulting from any ideas, methods, instructions or products referred to in the content.

