
Cooling Effects of Urban Park Green Spaces in Downtown Qingdao


Abstract
1. Introduction
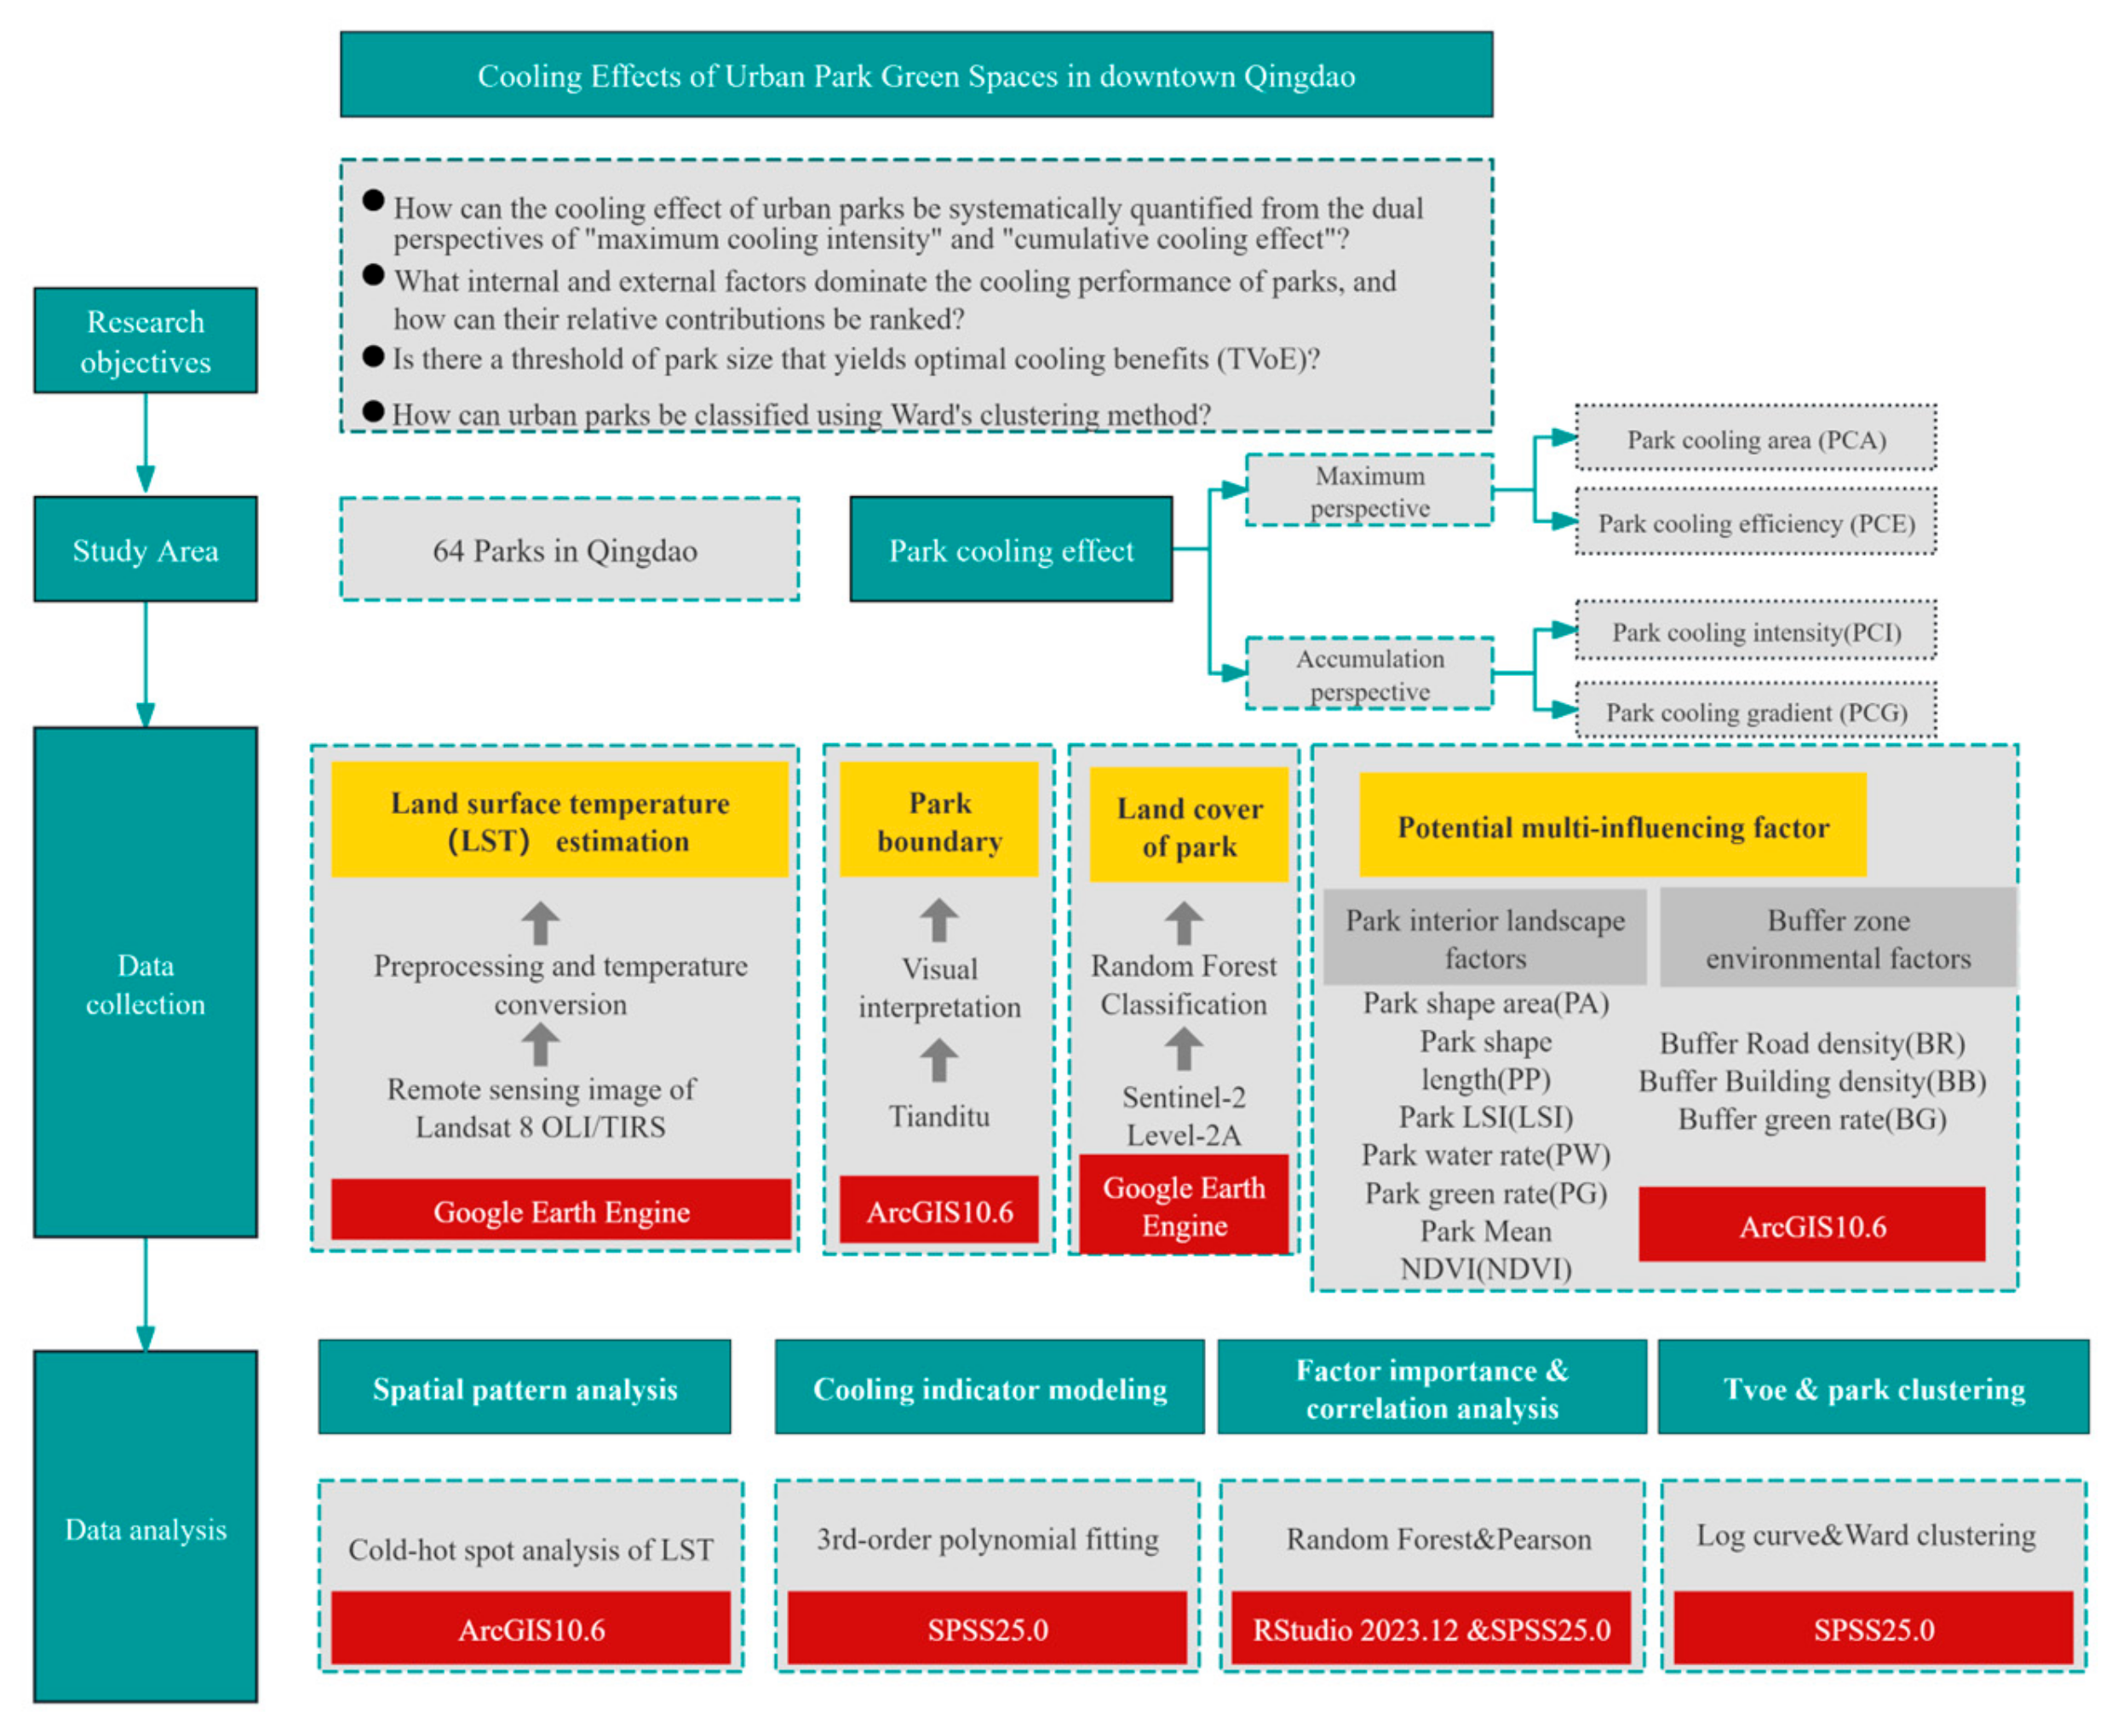
2. Materials and Methods
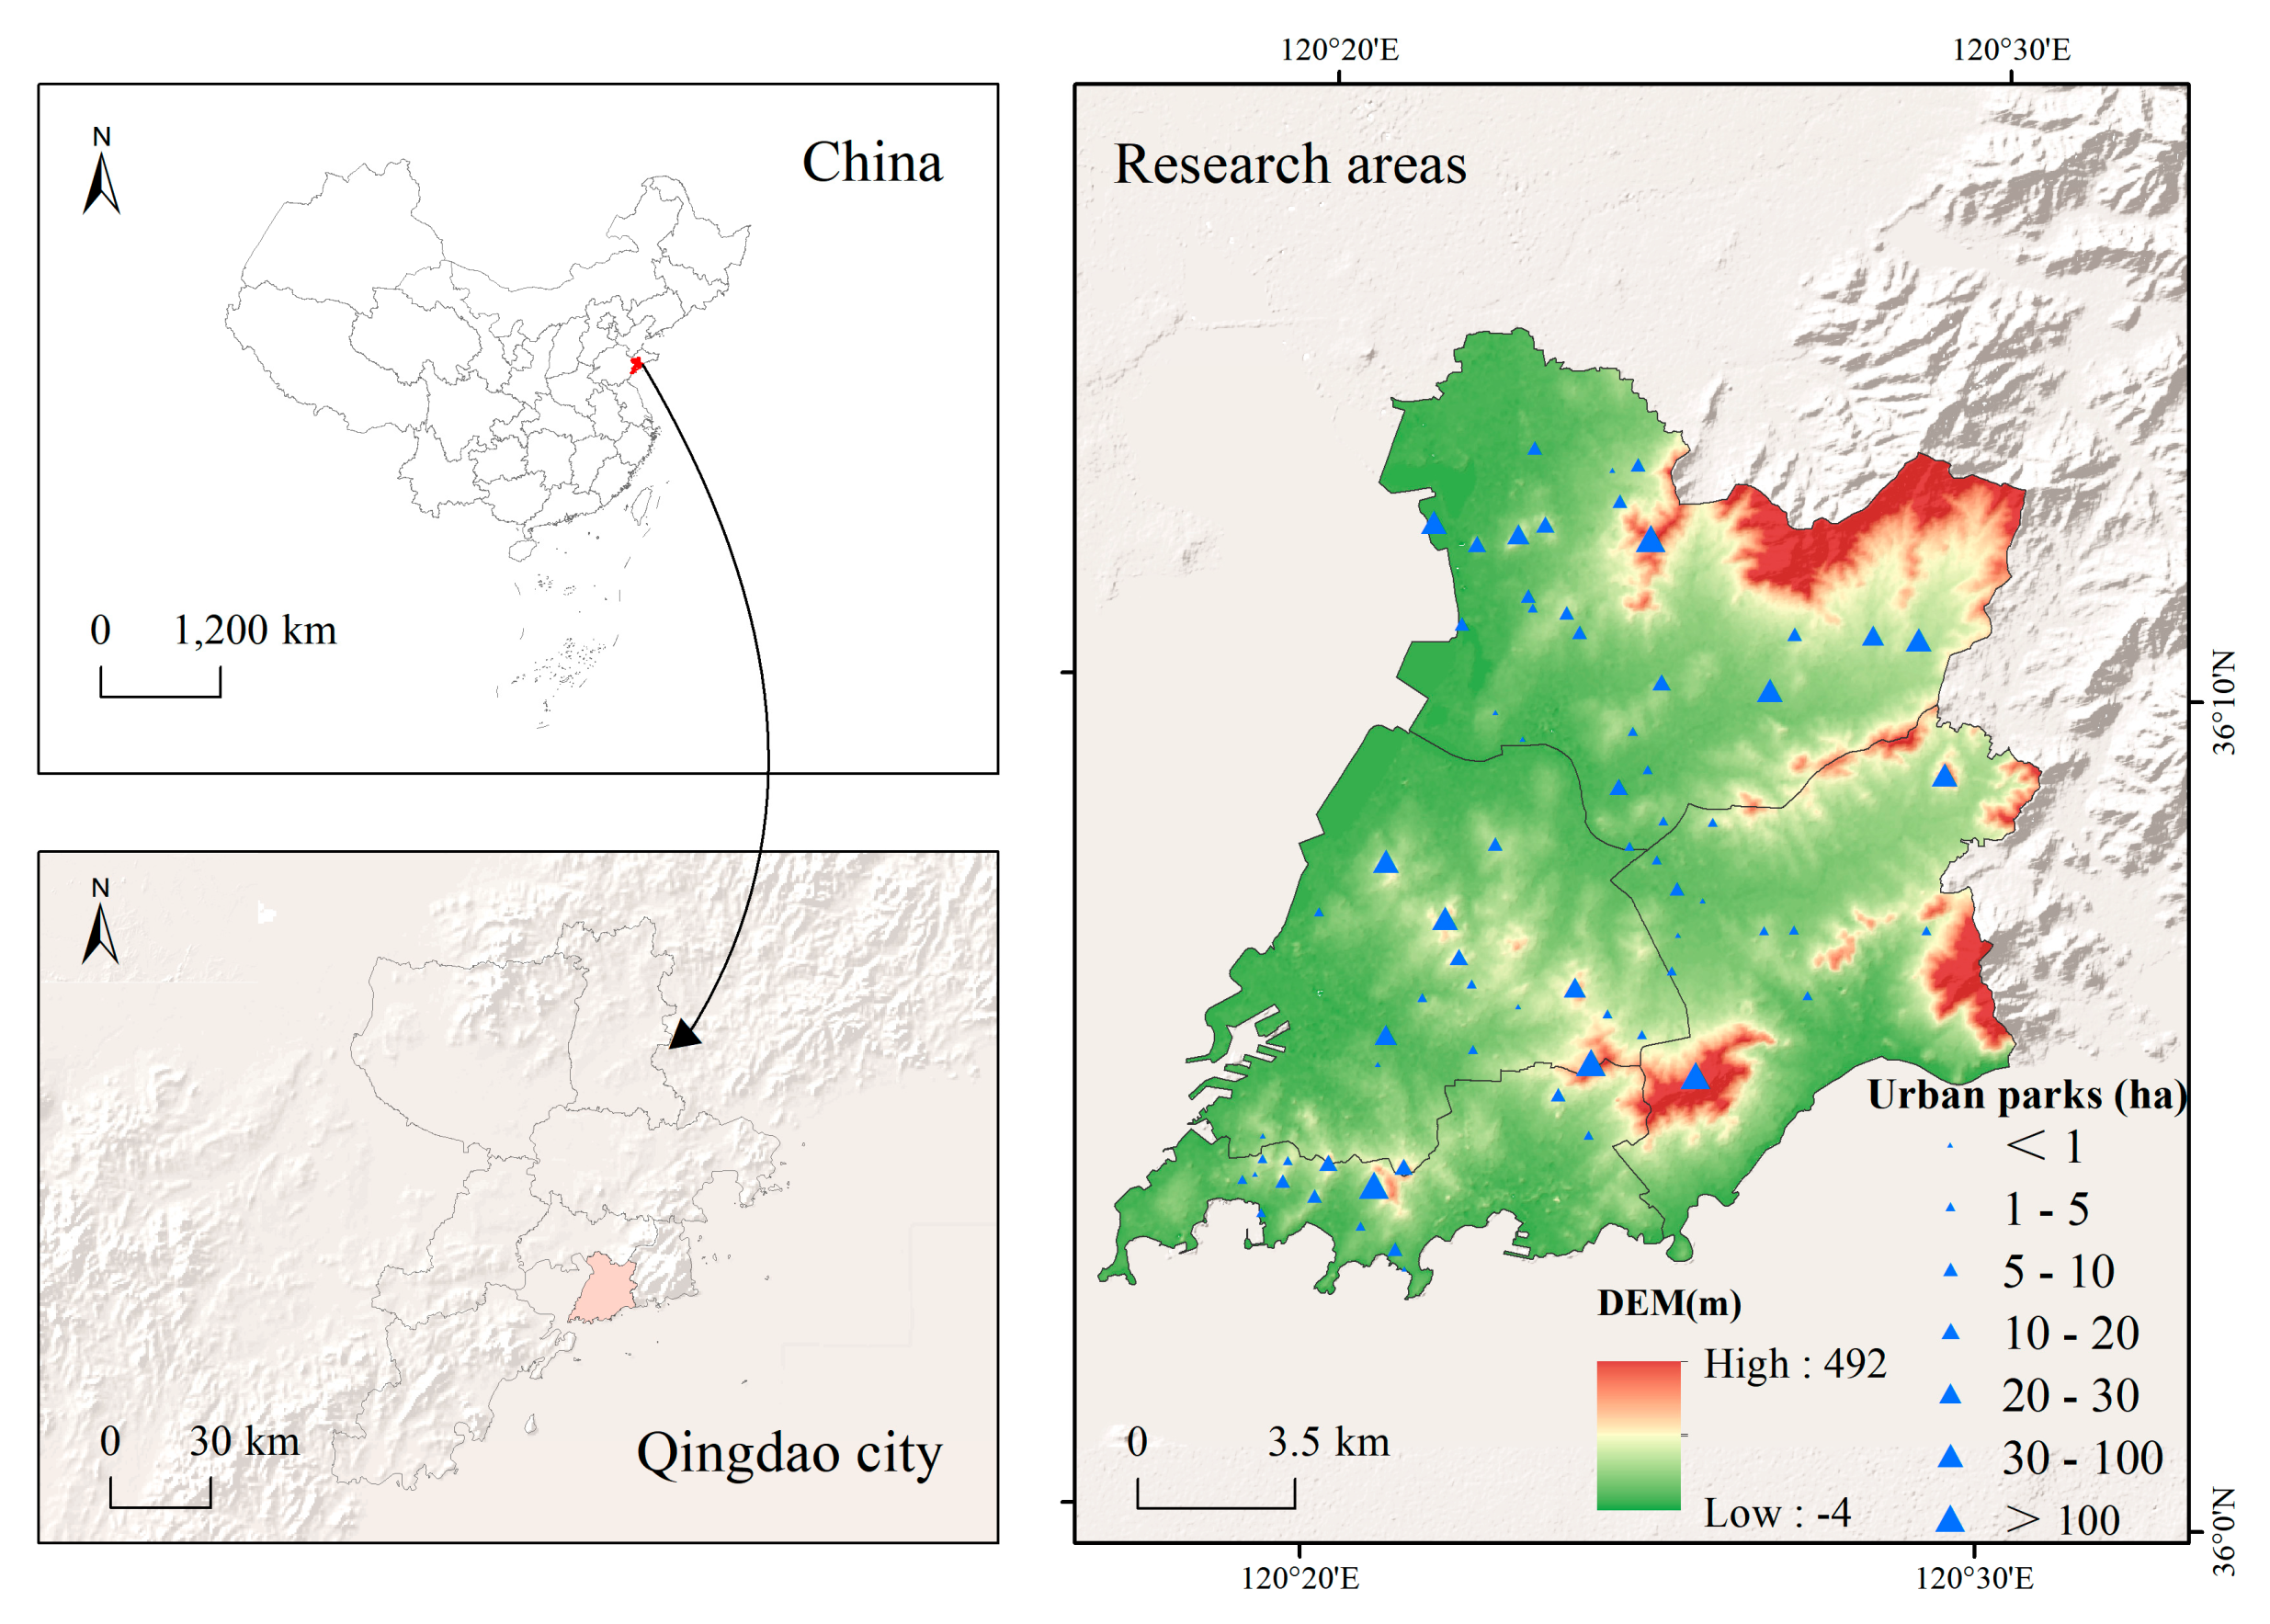
2.1. Study Area
2.2. Data Acquisition
- (1)
- NDVI (Normalized Difference Vegetation Index): Measures vegetation vitality [28].
- (2)
- NDWI (Normalized Difference Water Index): Identifies water bodies [29].
- (3)
- EVI (Enhanced Vegetation Index): Improves recognition of high-density vegetation [30].
- (4)
- BSI (Bare Soil Index): Distinguishes bare soil from other features [31].
- (5)
- IBI (Index-Based Built-up Index): Highlights built-up areas [32].
2.3. Park Boundary Extraction
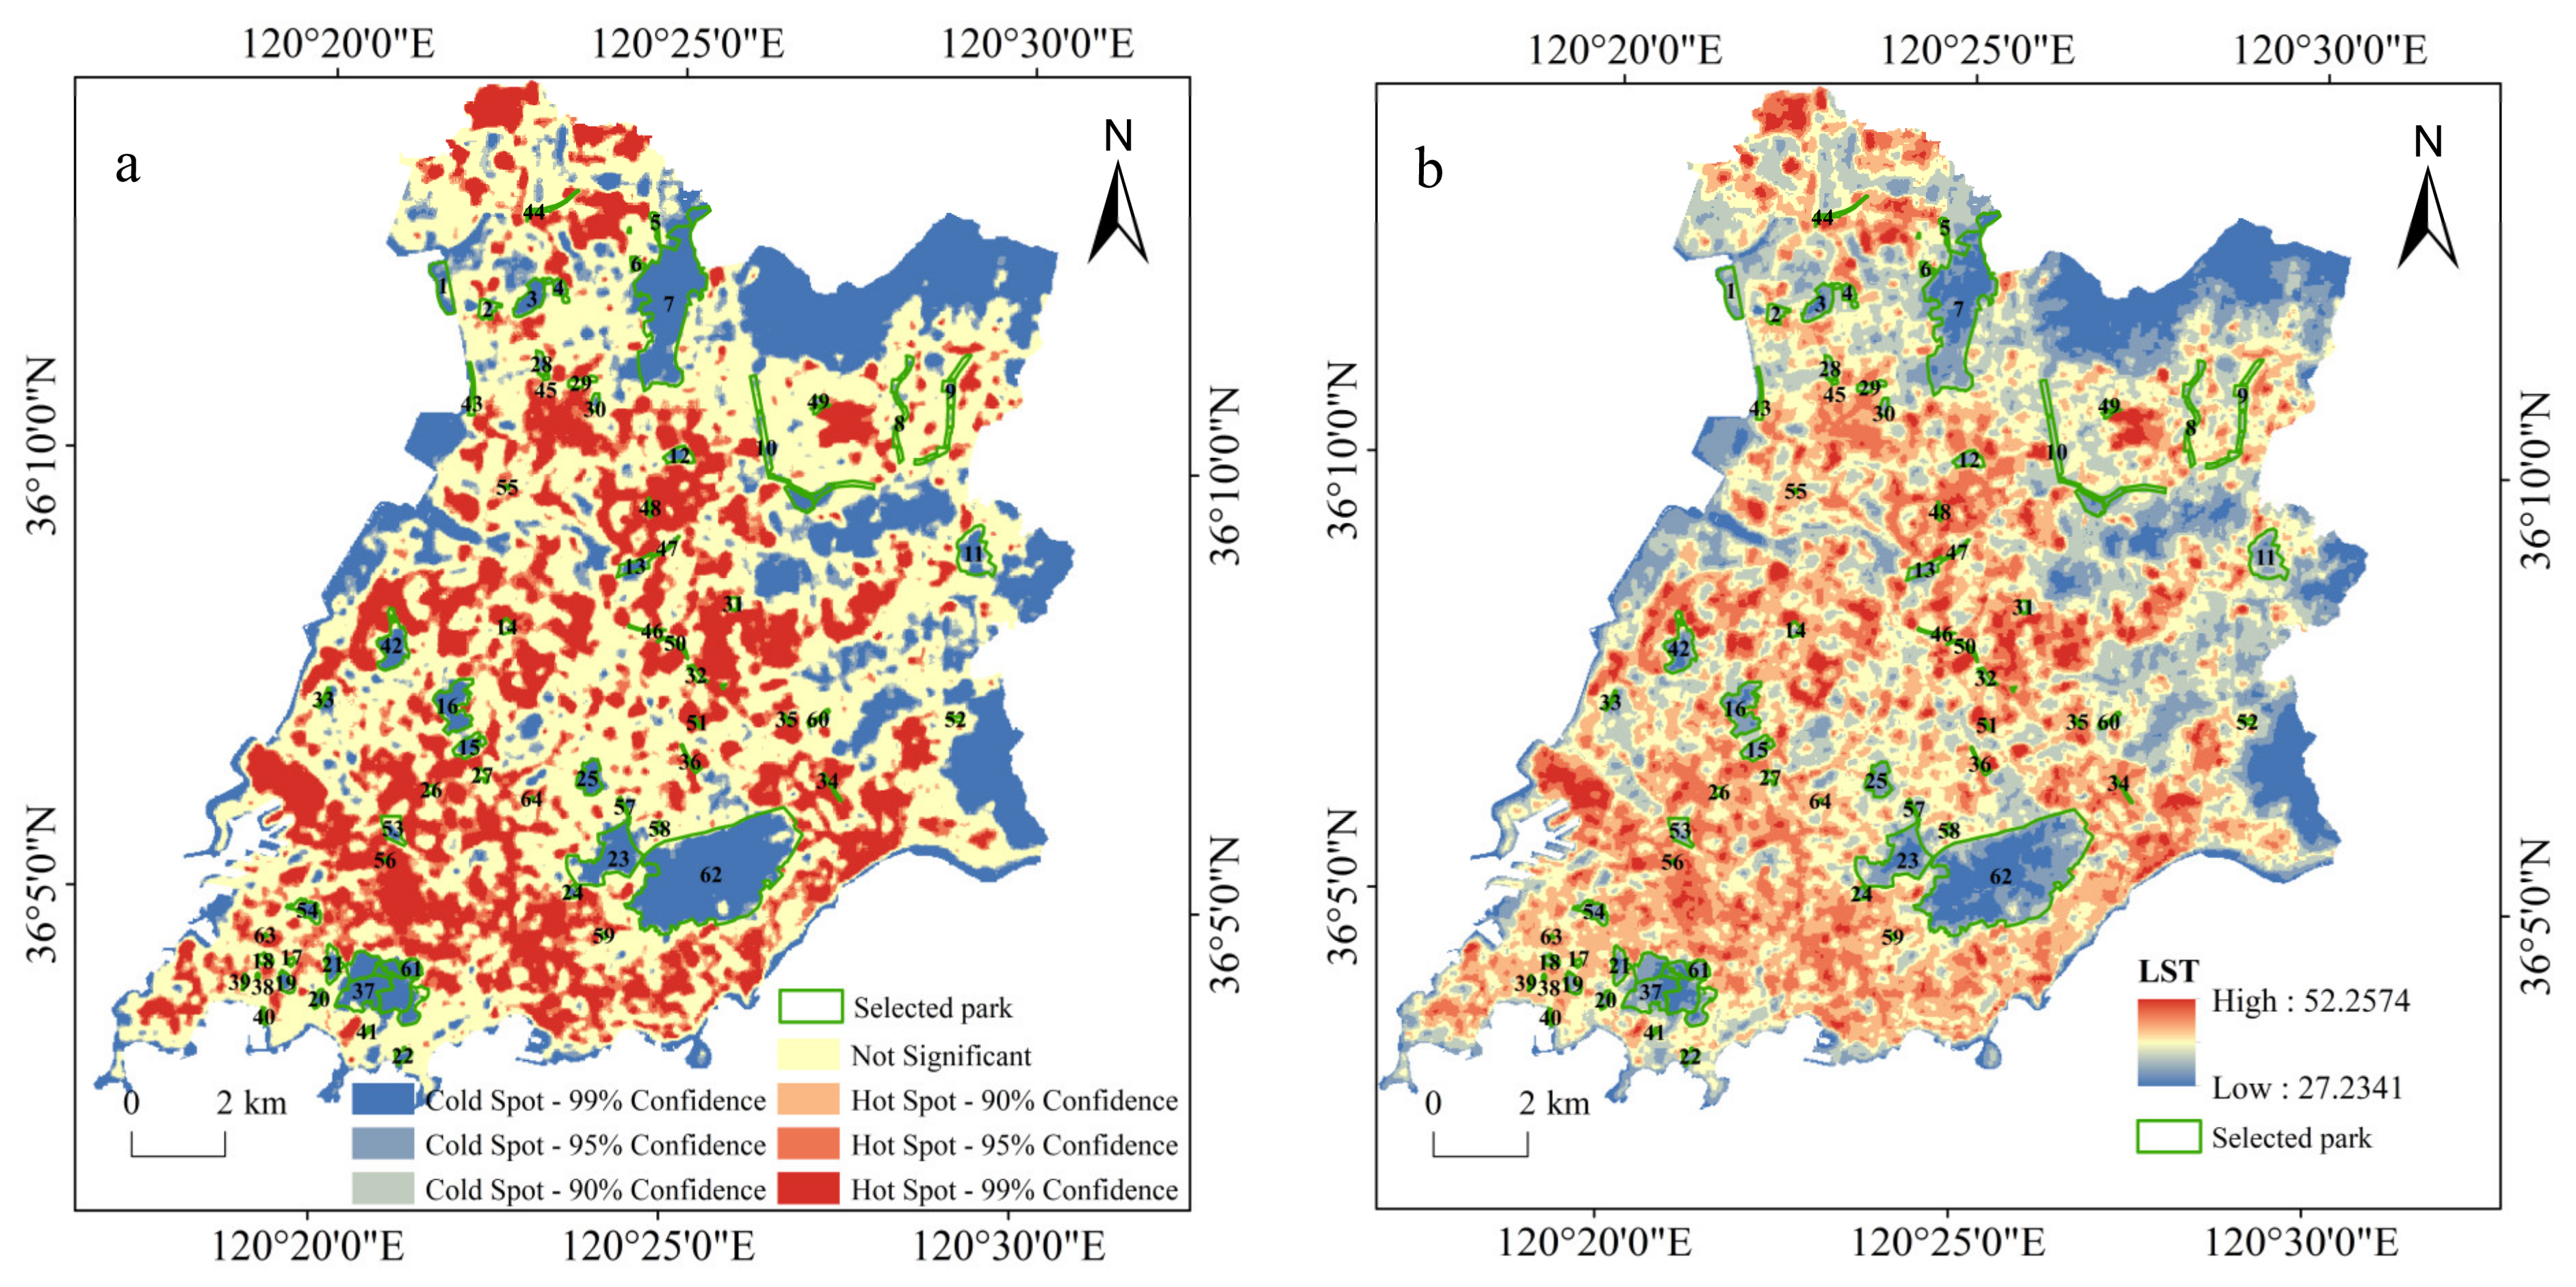
2.4. LST Retrieval and Cold/Hot Spot Analysis
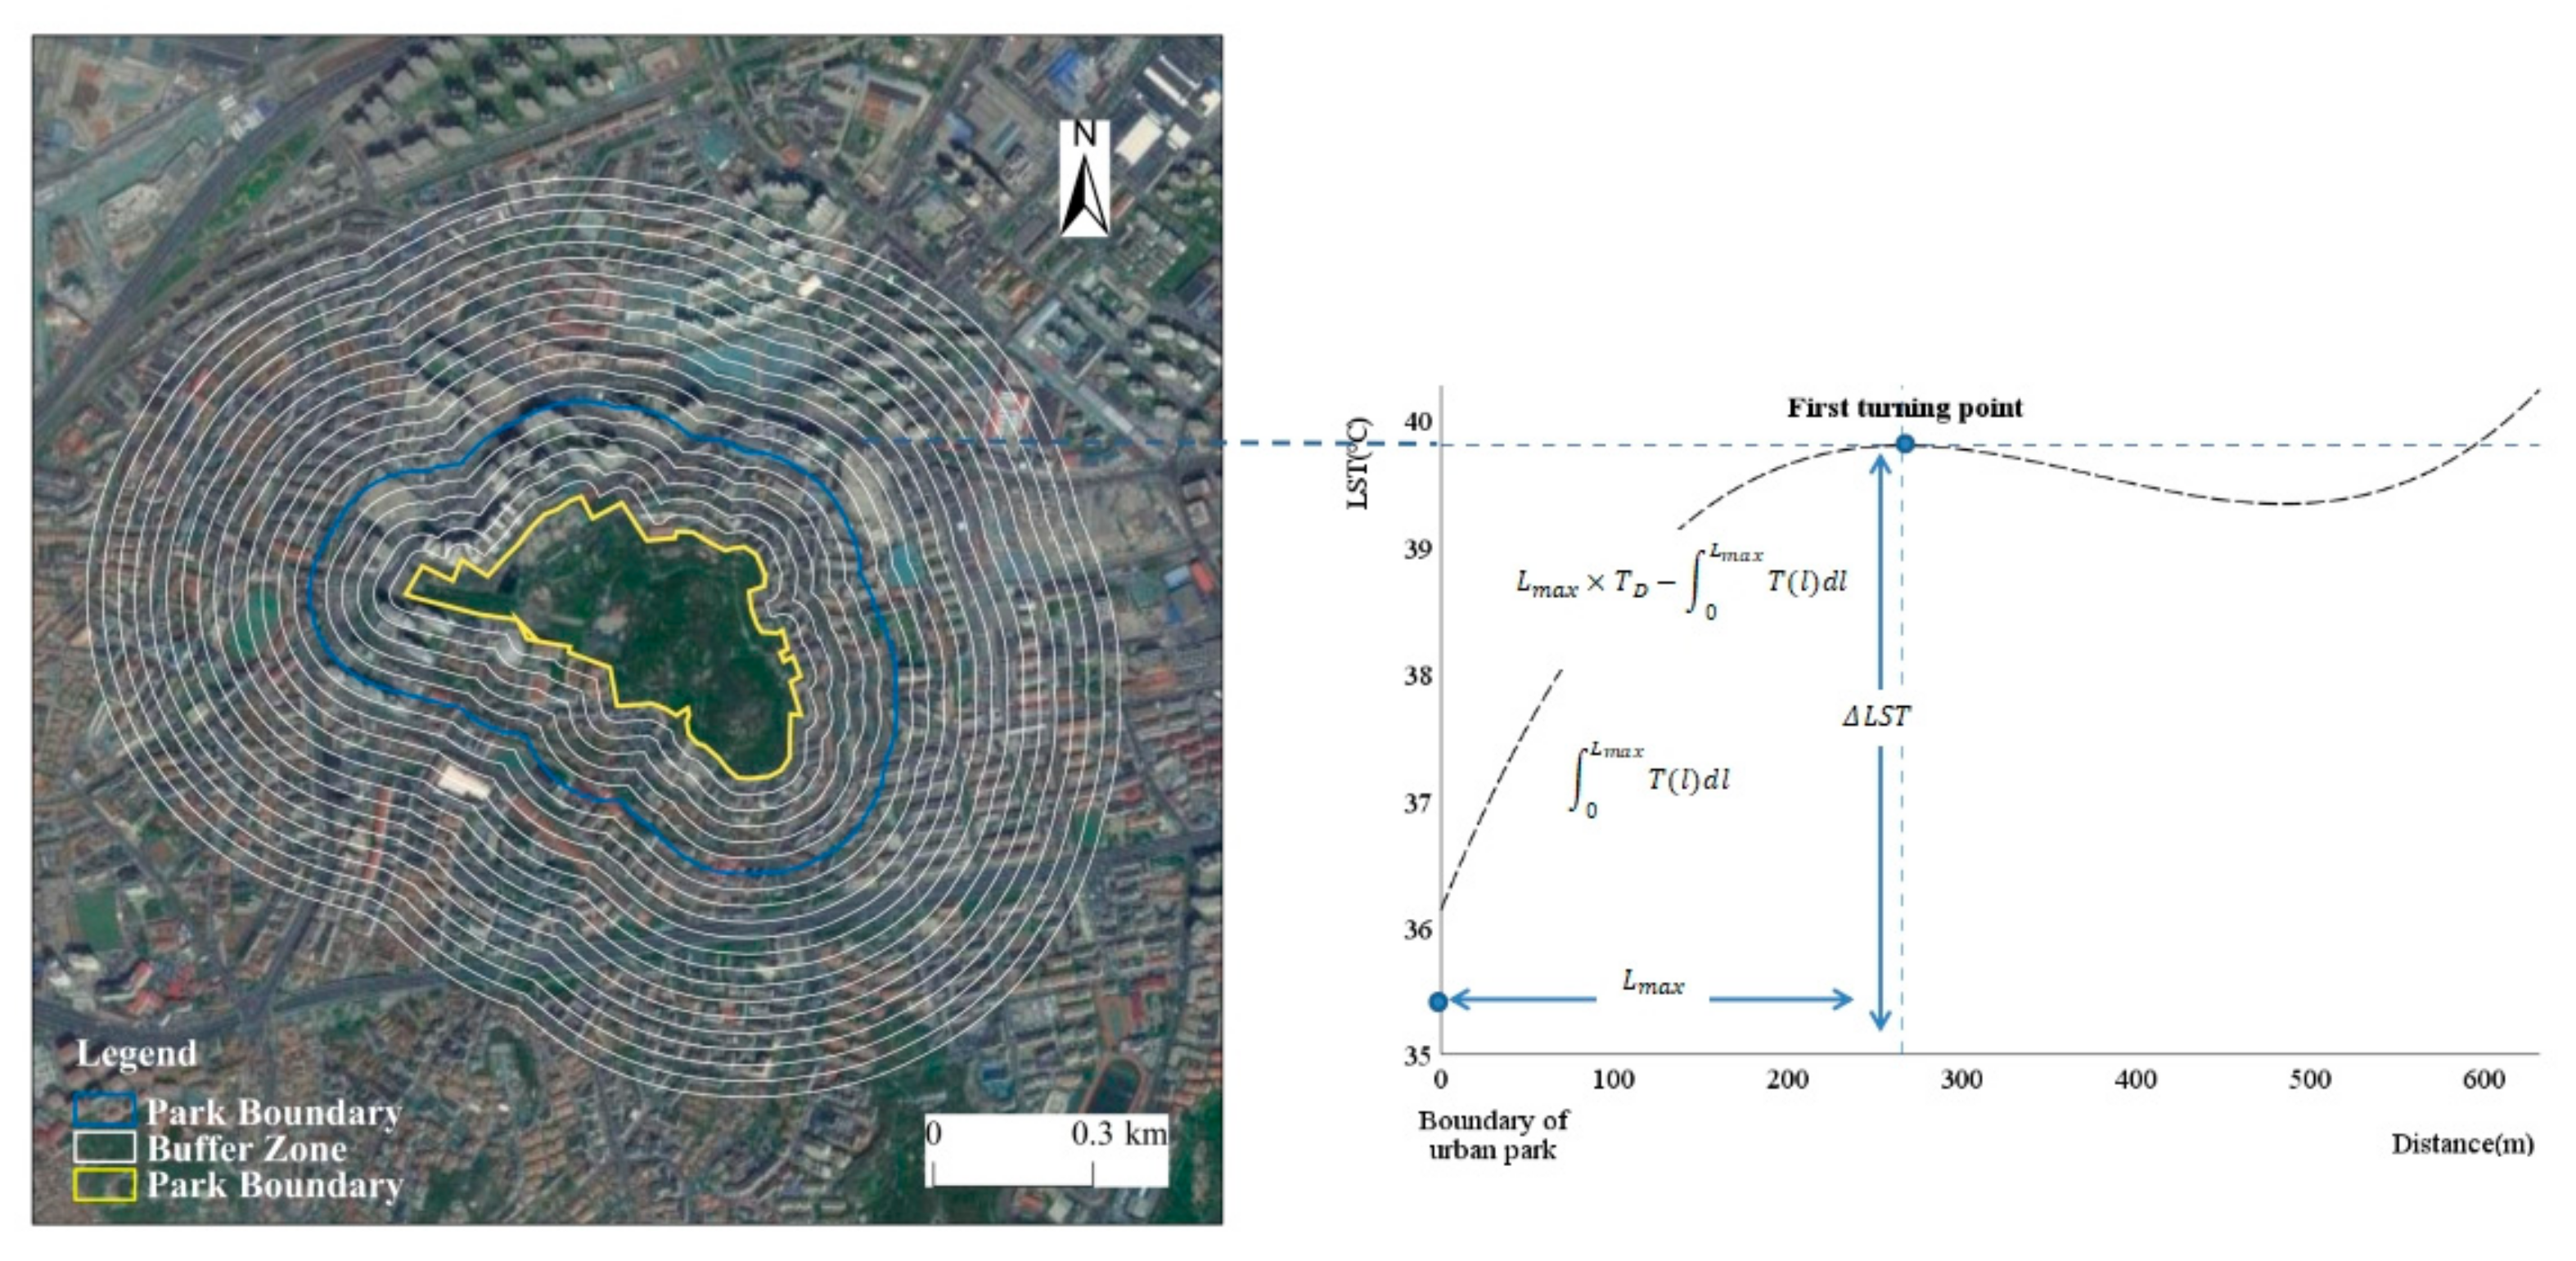
2.5. Definition and Quantification of Urban Park Cooling Effects
- (1)
- Park Cooling Area (PCA): The buffer area corresponding to the inflection point represents the maximum cooling influence range, i.e., the buffer area from the park boundary to the maximum cooling distance [39].
- (2)
- Park Cooling Efficiency (PCE): The ratio of the park cooling area to the park area, characterizing the cooling area per unit area of the urban park, reflects the economic efficiency of the park in generating cooling effects [39].
- (3)
- Previous studies have simplistically defined the quantification of park cooling intensity (PCI) as the difference between the temperature at the first inflection point and the average park temperature [1]. However, as shown in the graphs, the cooling effect process of parks is spatially nonlinear. Even if the “LST-Distance” curves differ, the value of L (e.g., maximum cooling distance) might remain the same. Therefore, evaluating PCI solely from the perspective of spatial maximum values is insufficient to fully reveal the distinct characteristics present in different parks, and spatial cumulative metrics must be incorporated [1]. Following the methodology of citation [21], this study defines PCI as the ratio of the land surface temperature (LST) reduction caused by park construction to the original LST within a specified maximum cooling range. PCI is used to gauge residents’ perception of the cooling effect: a higher PCI value indicates a more pronounced perception of cooling by residents. Specifically, the intensity is defined as the difference between the cumulative temperature without the park and the actual cumulative temperature with the park in place.
- (4)
- The park cooling gradient (PCG) is defined as the ratio of the cumulative cooling amount to the park cooling distance. A higher PCG value indicates stronger heat absorption capacity during the cooling process. PCG essentially represents the cooling magnitude of the park, reflecting the pattern of its cooling process. A large PCG corresponds to an intensive high-heat-absorption process during cooling, while a low PCG involves an extensive low-heat-absorption process [21].
2.6. Identification of Influencing Factors
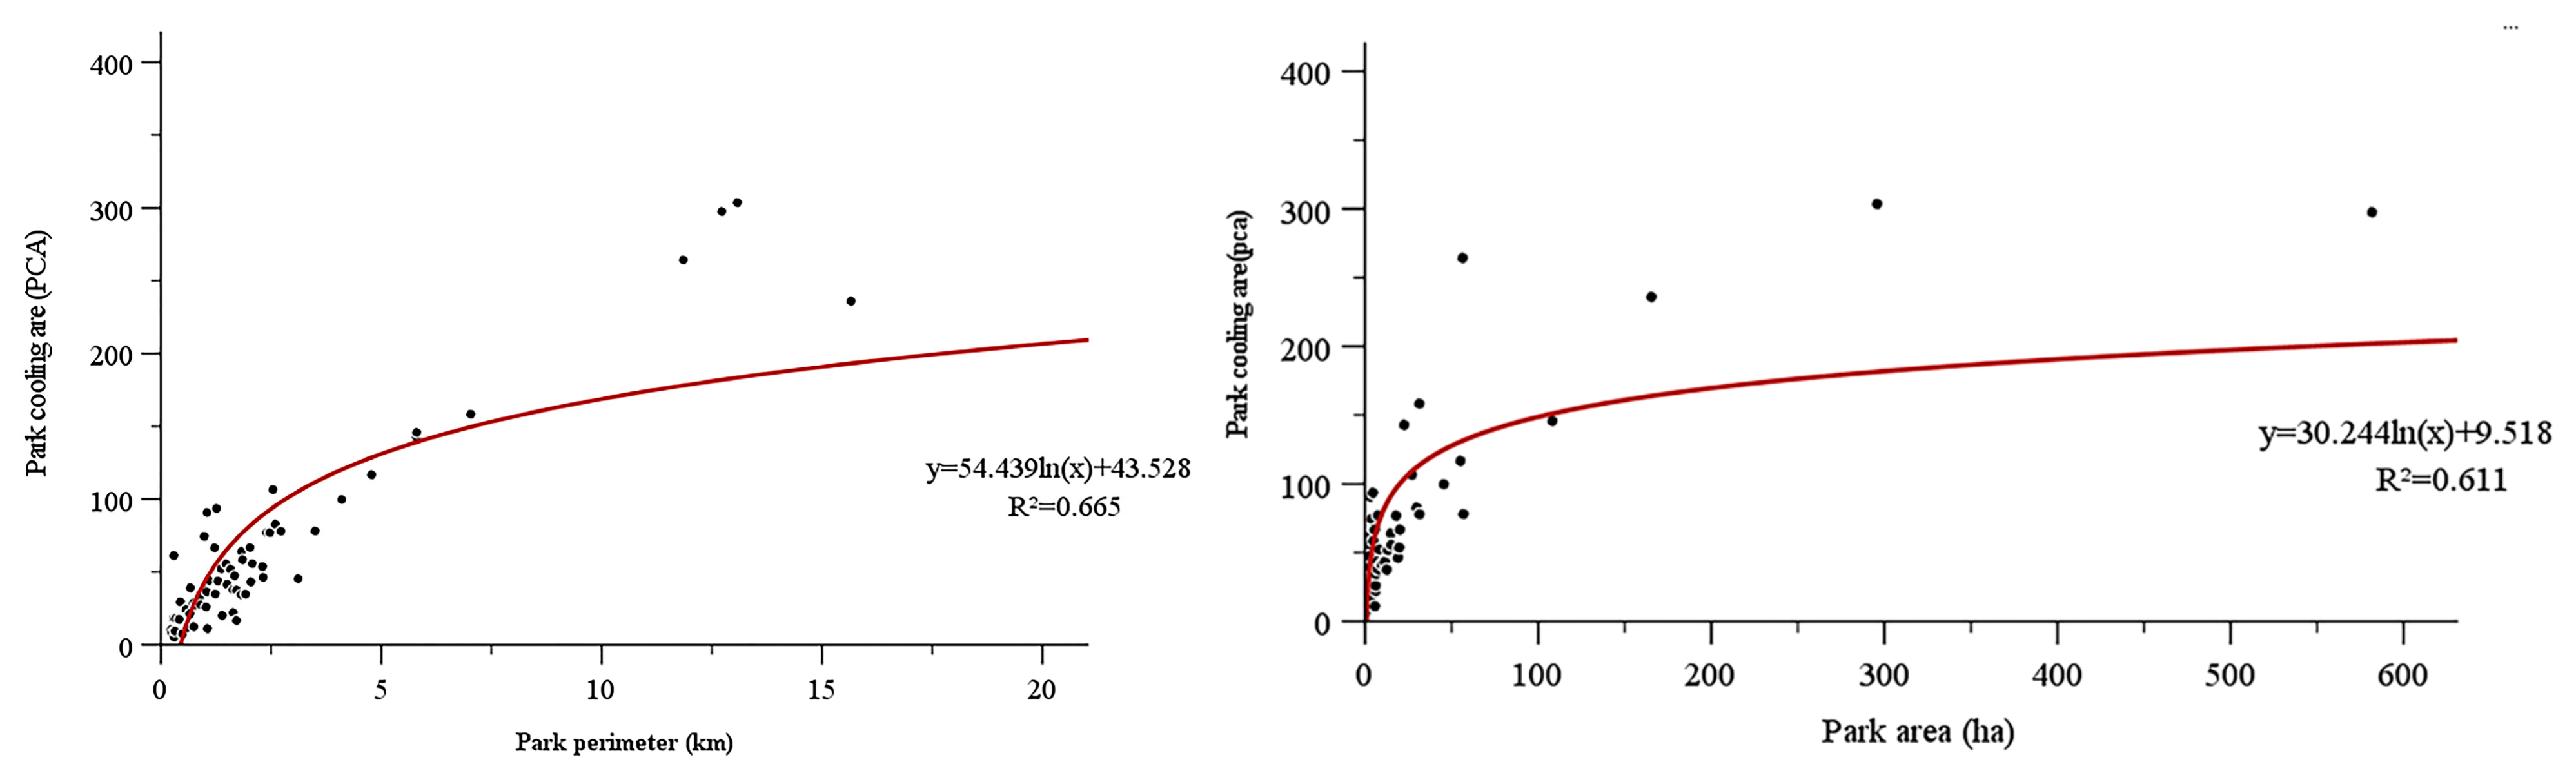
2.7. Quantification of Efficiency Threshold (TVoE)
2.8. Typical Urban Park Clusters Classified Based on Park Cooling Indices
3. Results
3.1. Cooling Effect of Urban Parks
- (1)
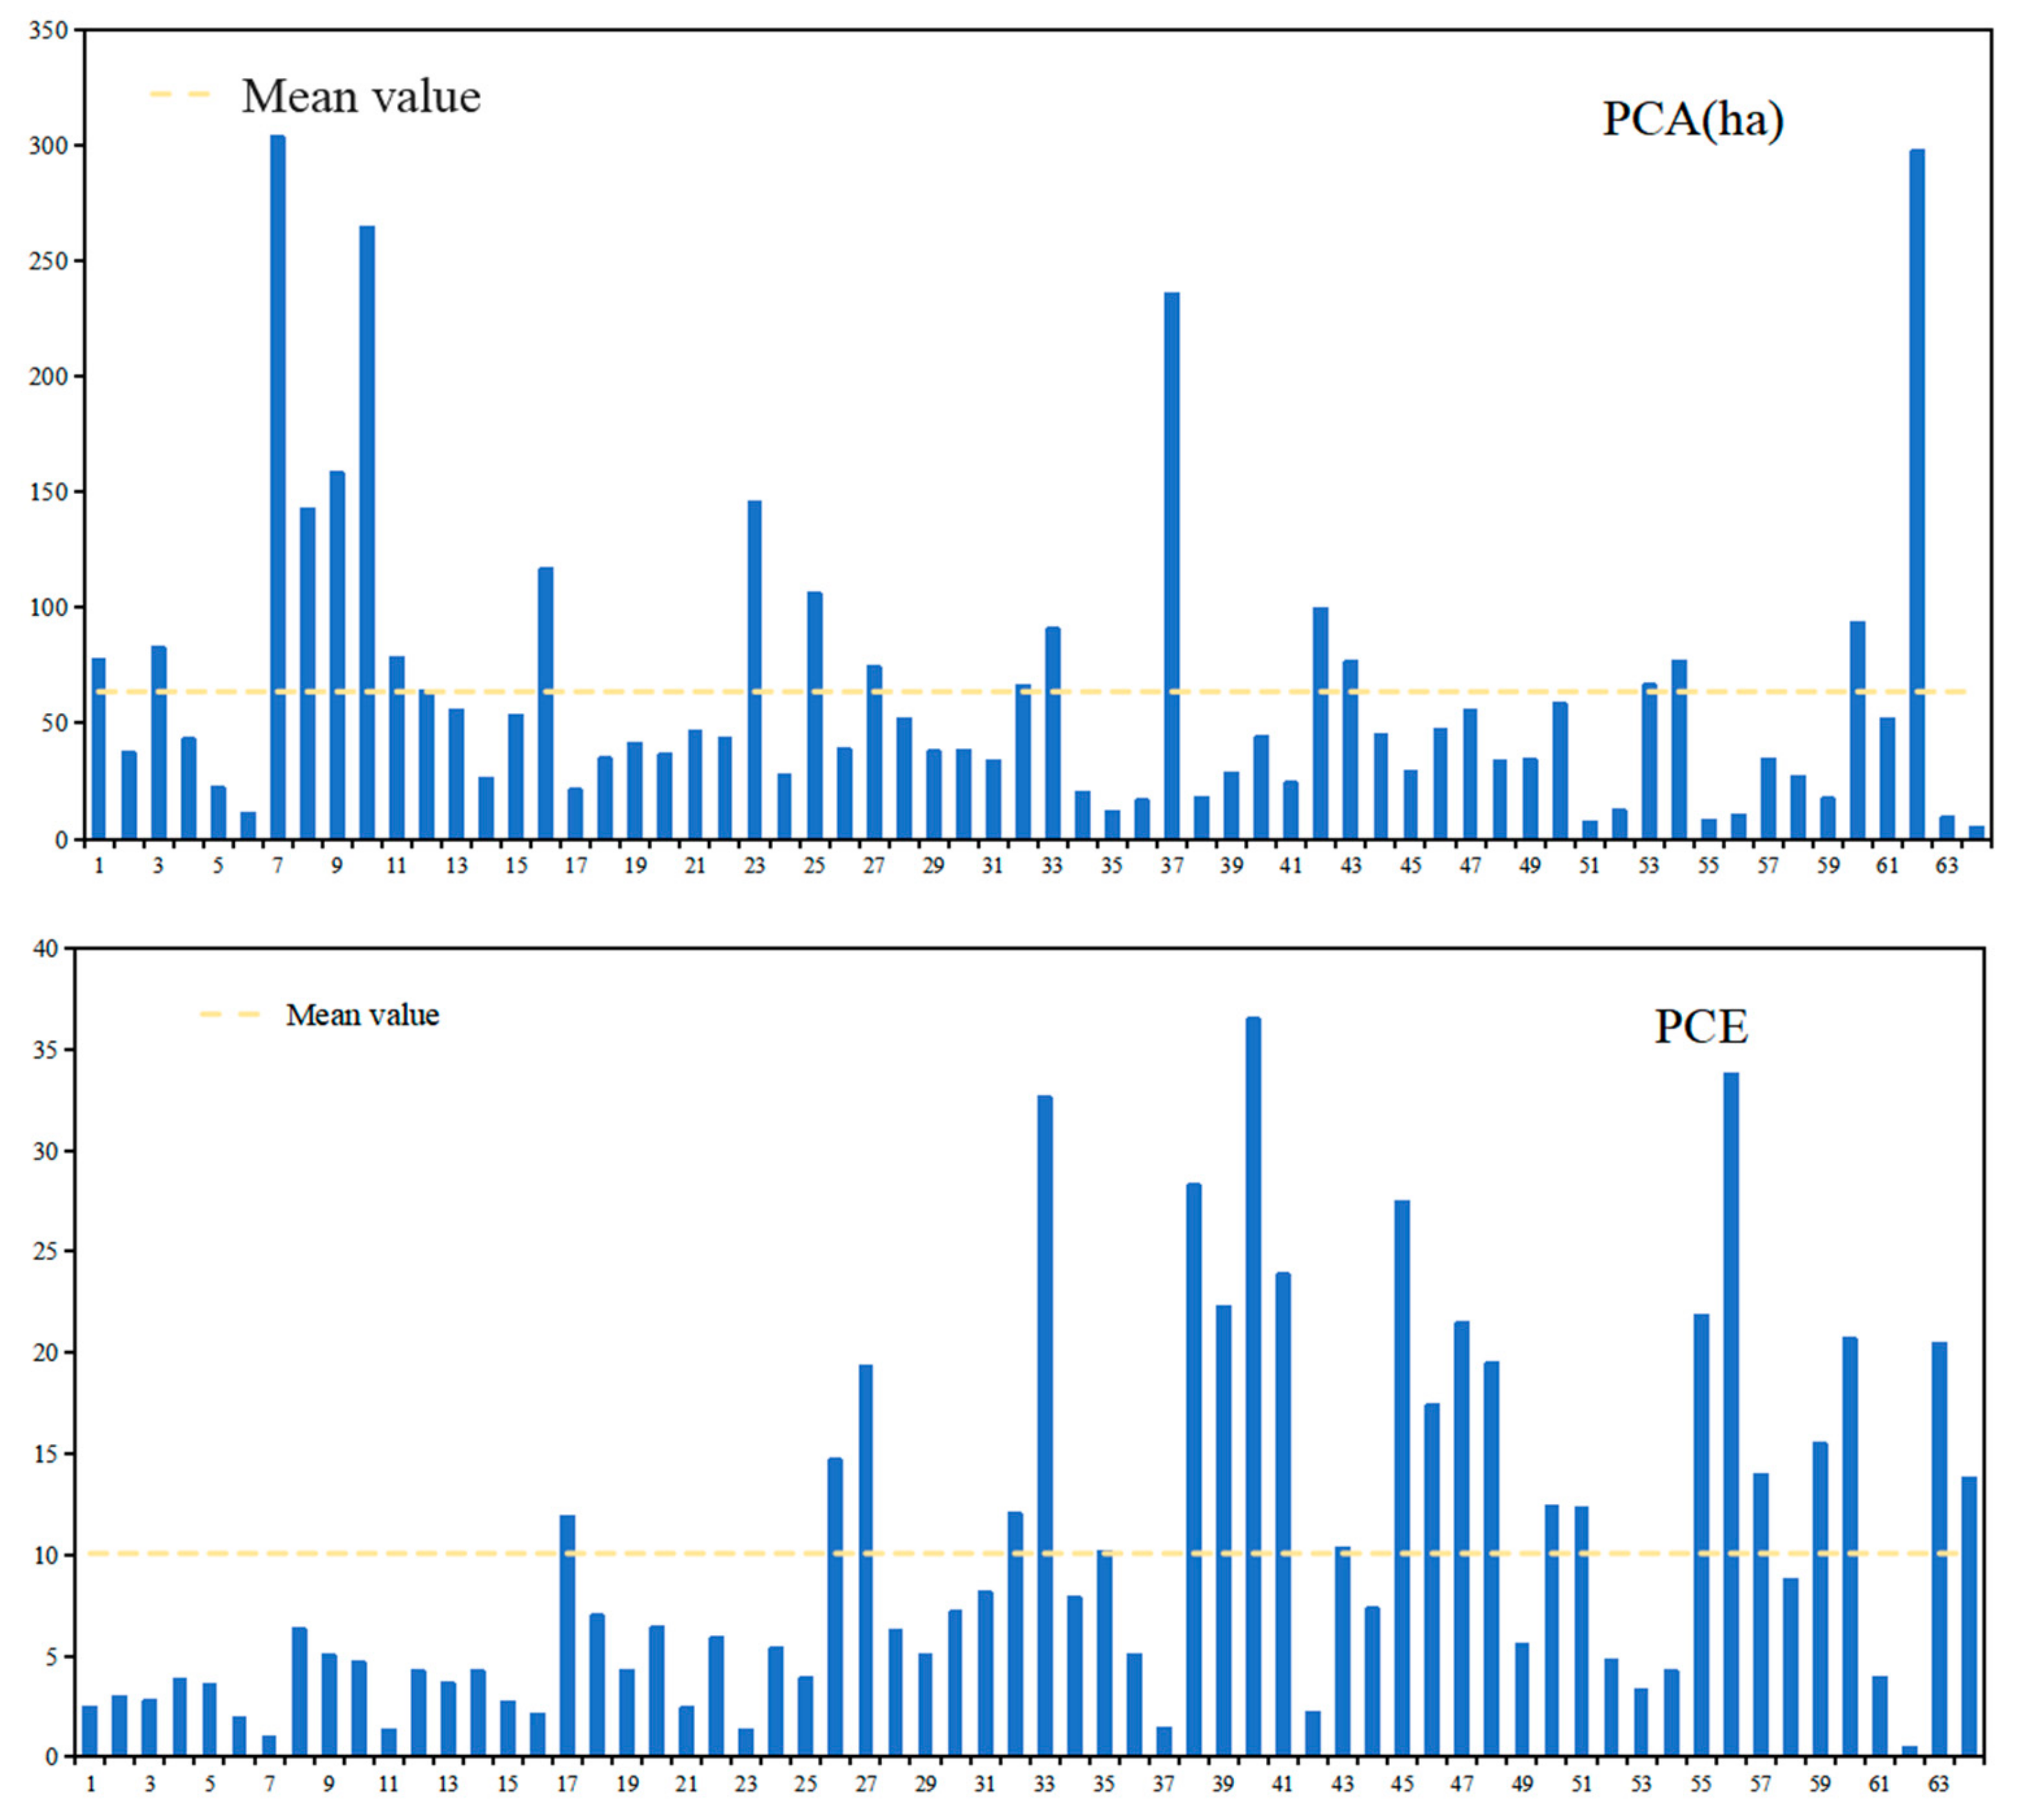
- PCA (park cooling area): It ranged from 5.31 to 303.68 ha (mean: 63.71 ha). Twenty parks exhibited PCA values above the mean, notably the Shimei’an–Laohushan Park Cluster and Fushan Forest Park, which recorded the highest values.
- (2)
- PCE (park cooling efficiency): It varied from 0.51 ha to 36.50 ha (mean: 18.50). Twenty-three urban parks exhibited above-average PCE values, including Zhanqiao Square and Qingxiaoyuan Pocket Park, both of which demonstrated relatively high performance.
- (3)
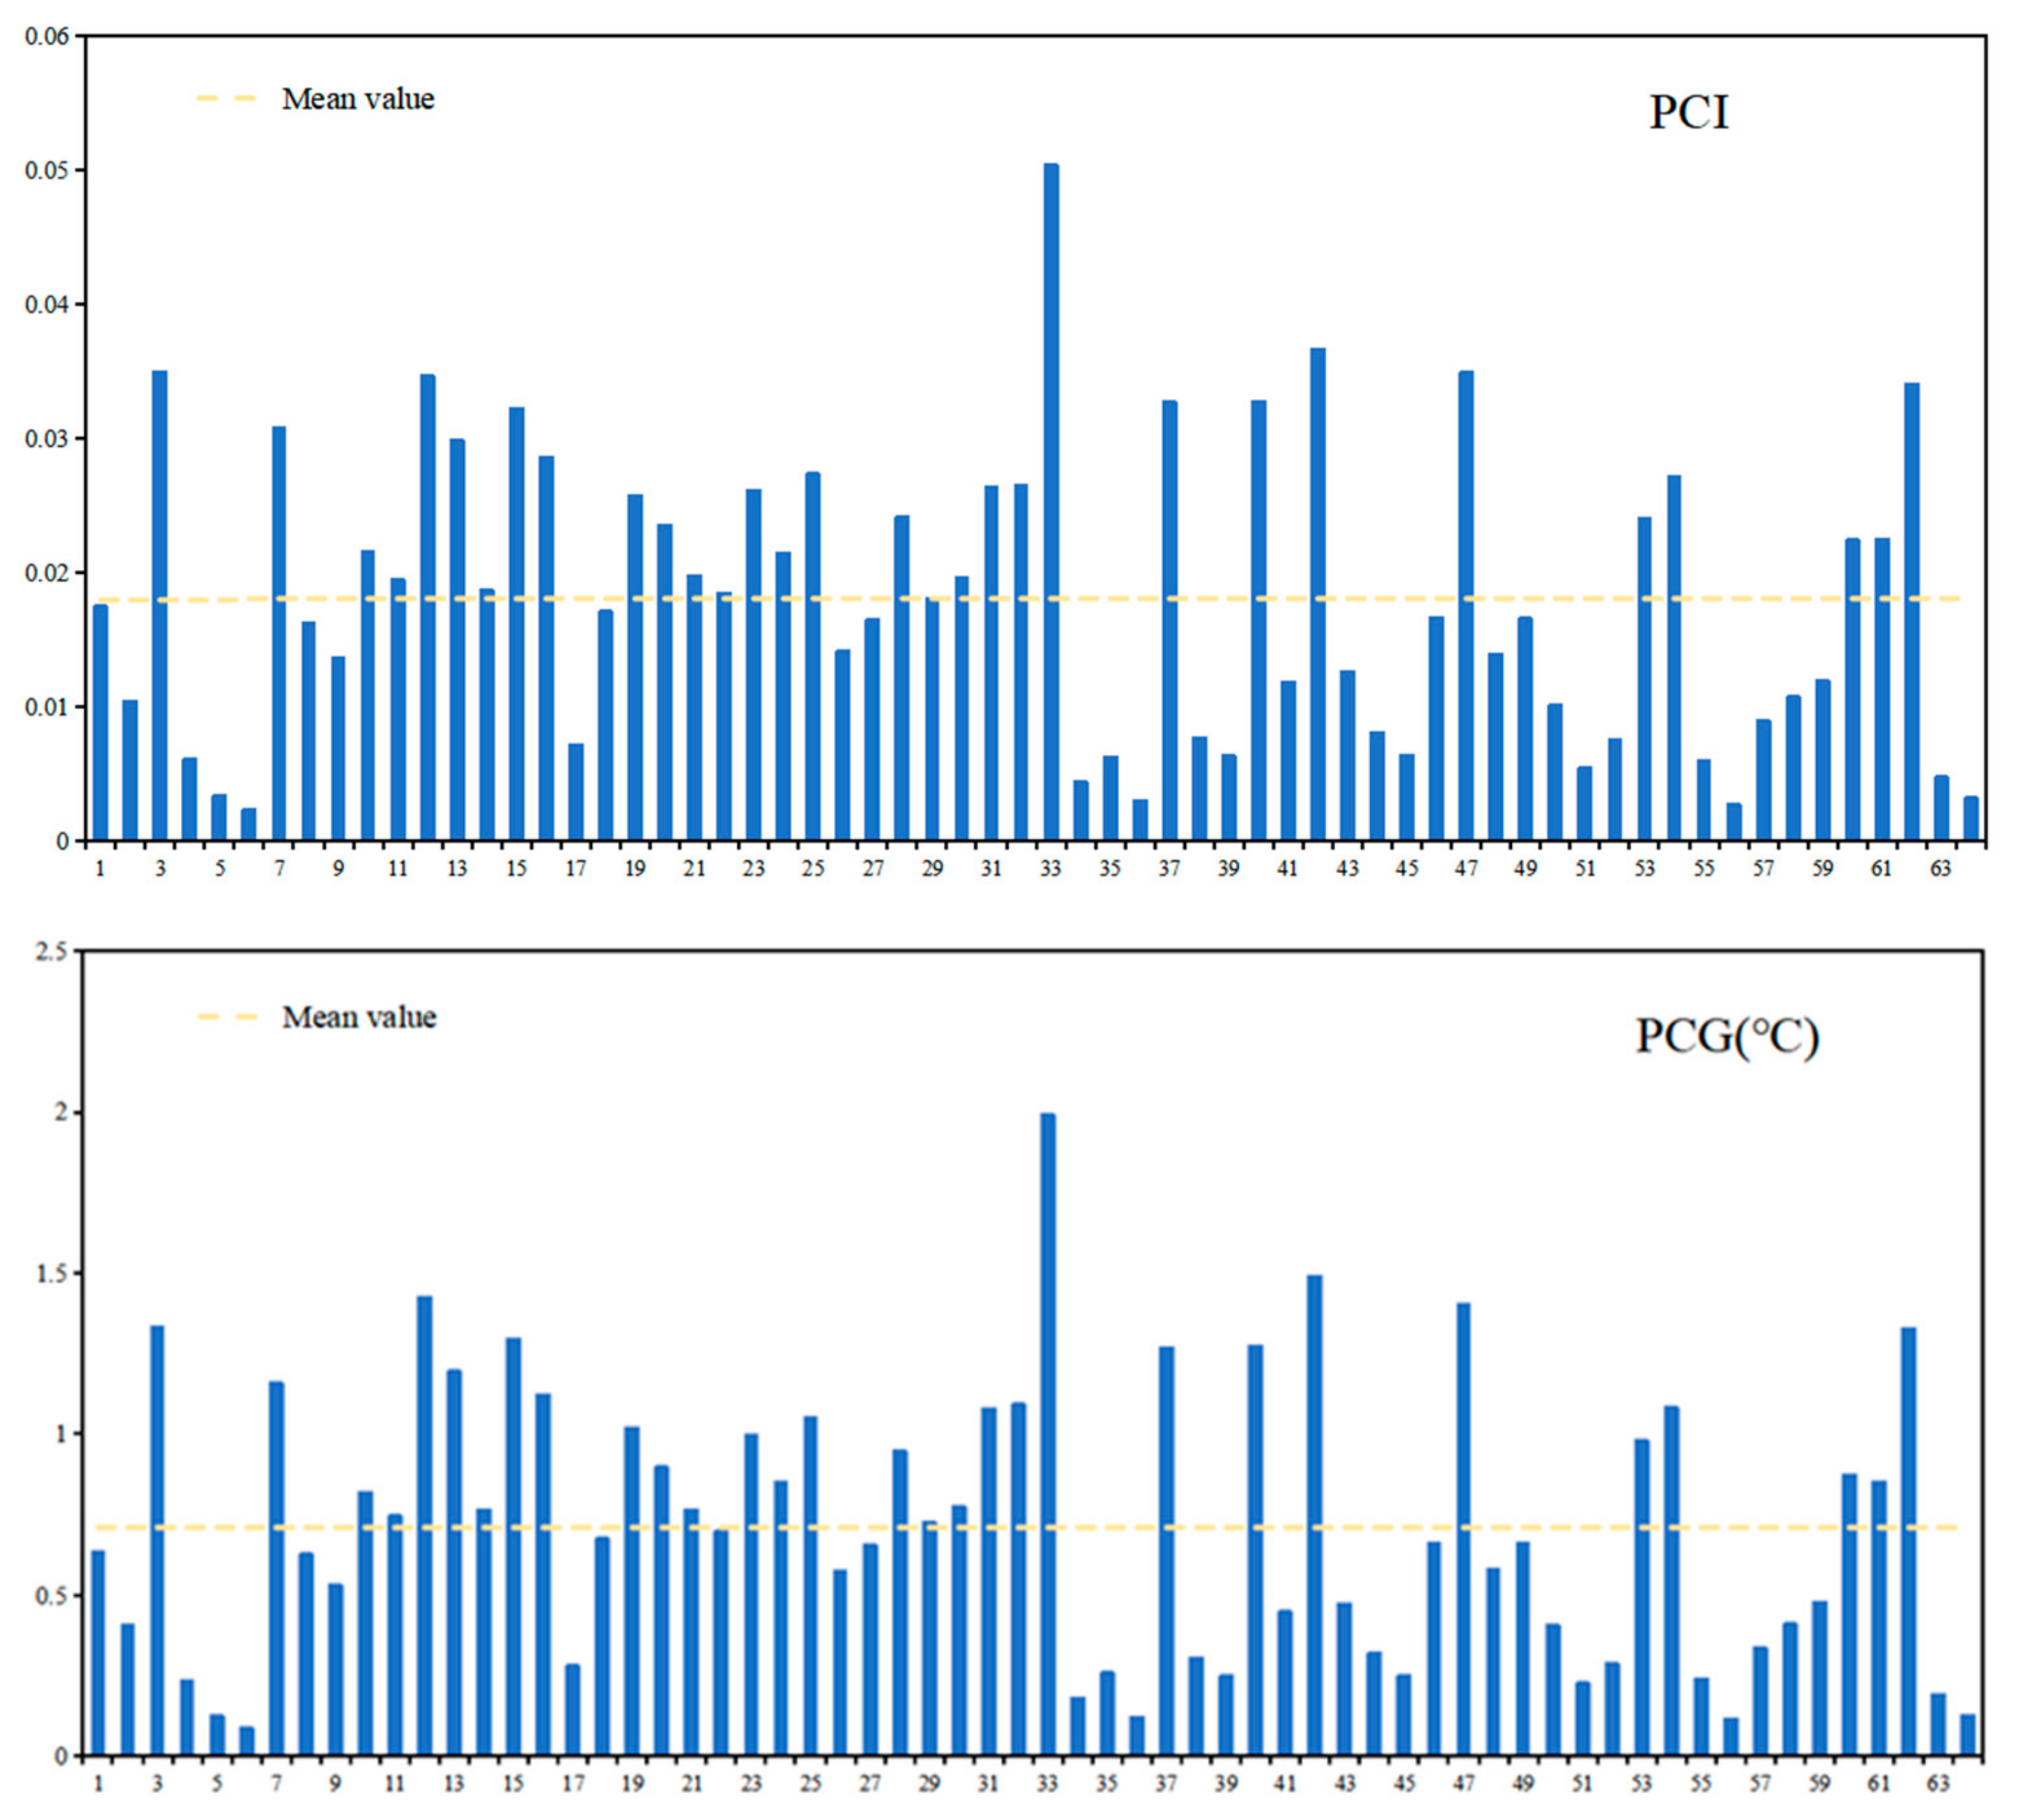
- PCI (park cooling intensity): It varied from 0.002 to 0.05 (mean: 0.026). Thirty parks recorded PCI values above the mean, with Loushan Park and Licun Park exhibiting the highest intensities.
- (4)
- PCG (park cooling gradient): It ranged from 0.09 to 1.99 ha (mean: 1.04 ha). Thirty parks exhibited PCG values above the mean, with Licun Park and Fushan Forest Park showing particularly strong gradients.
3.2. Analysis of Potential Drivers of Park Cooling Effects
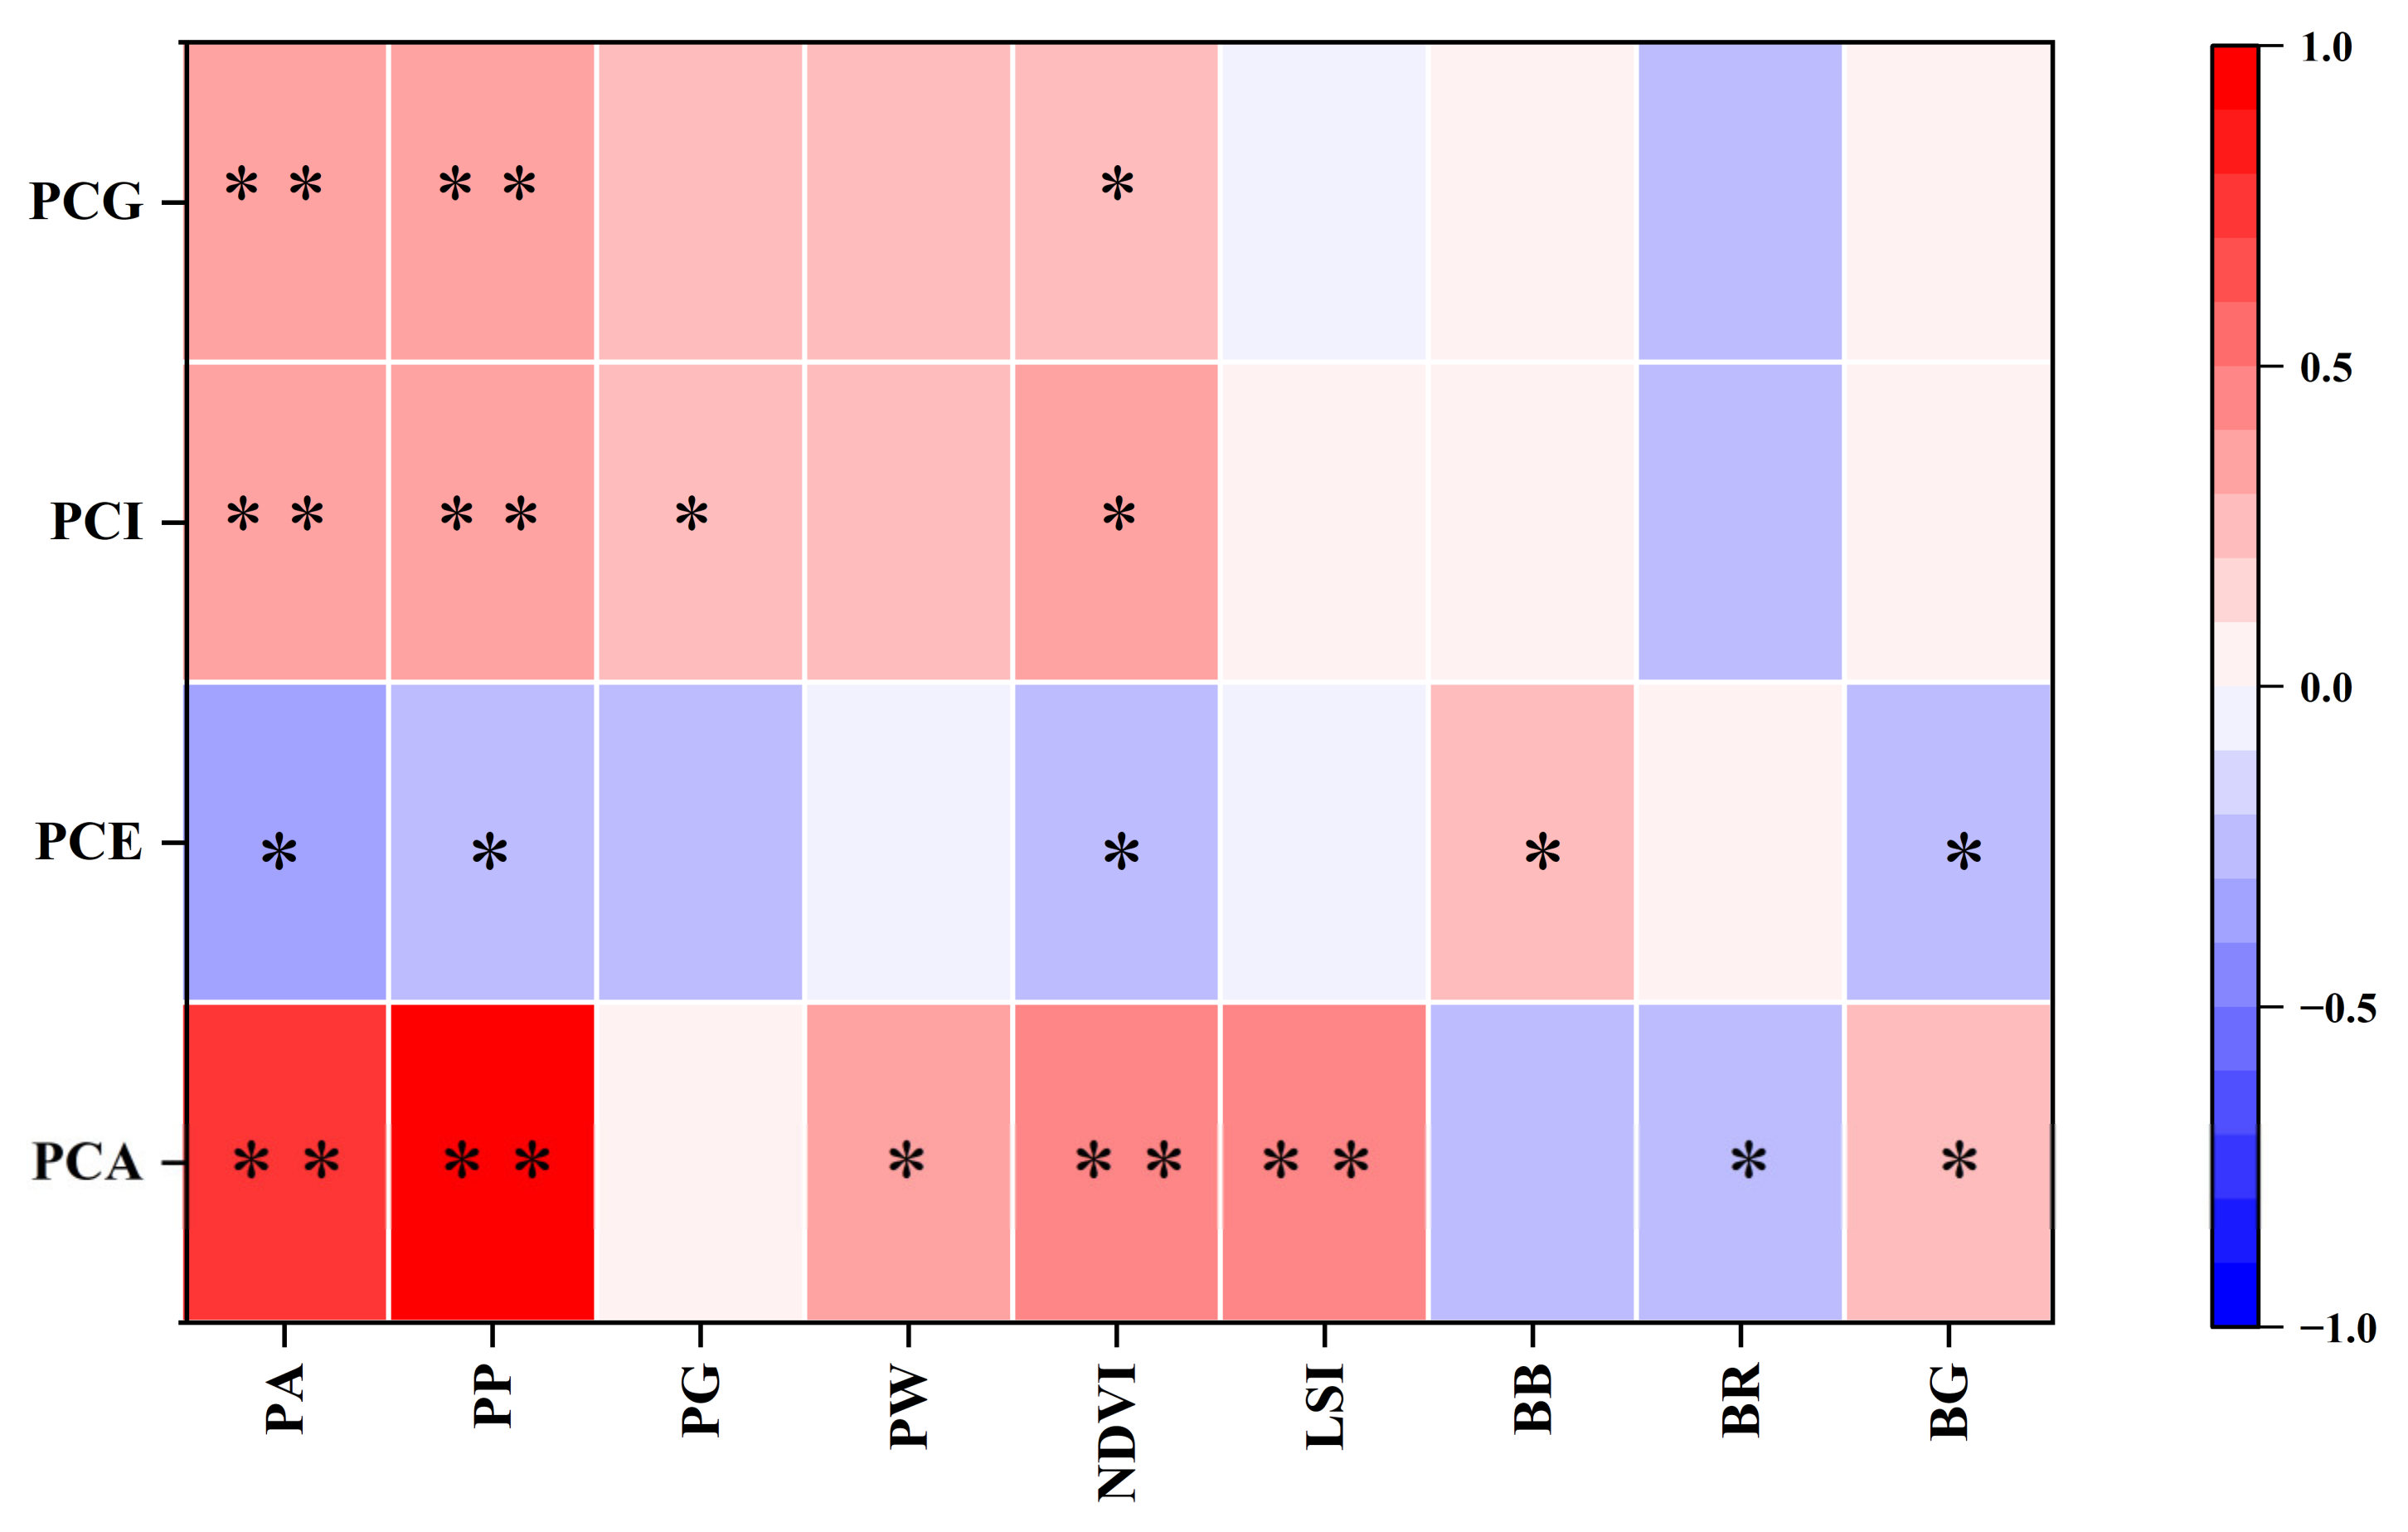
3.2.1. Correlation Between Cooling Indicators and Potential Influencing Factors
3.2.2. Relative Contribution of Influencing Factors
- (1)
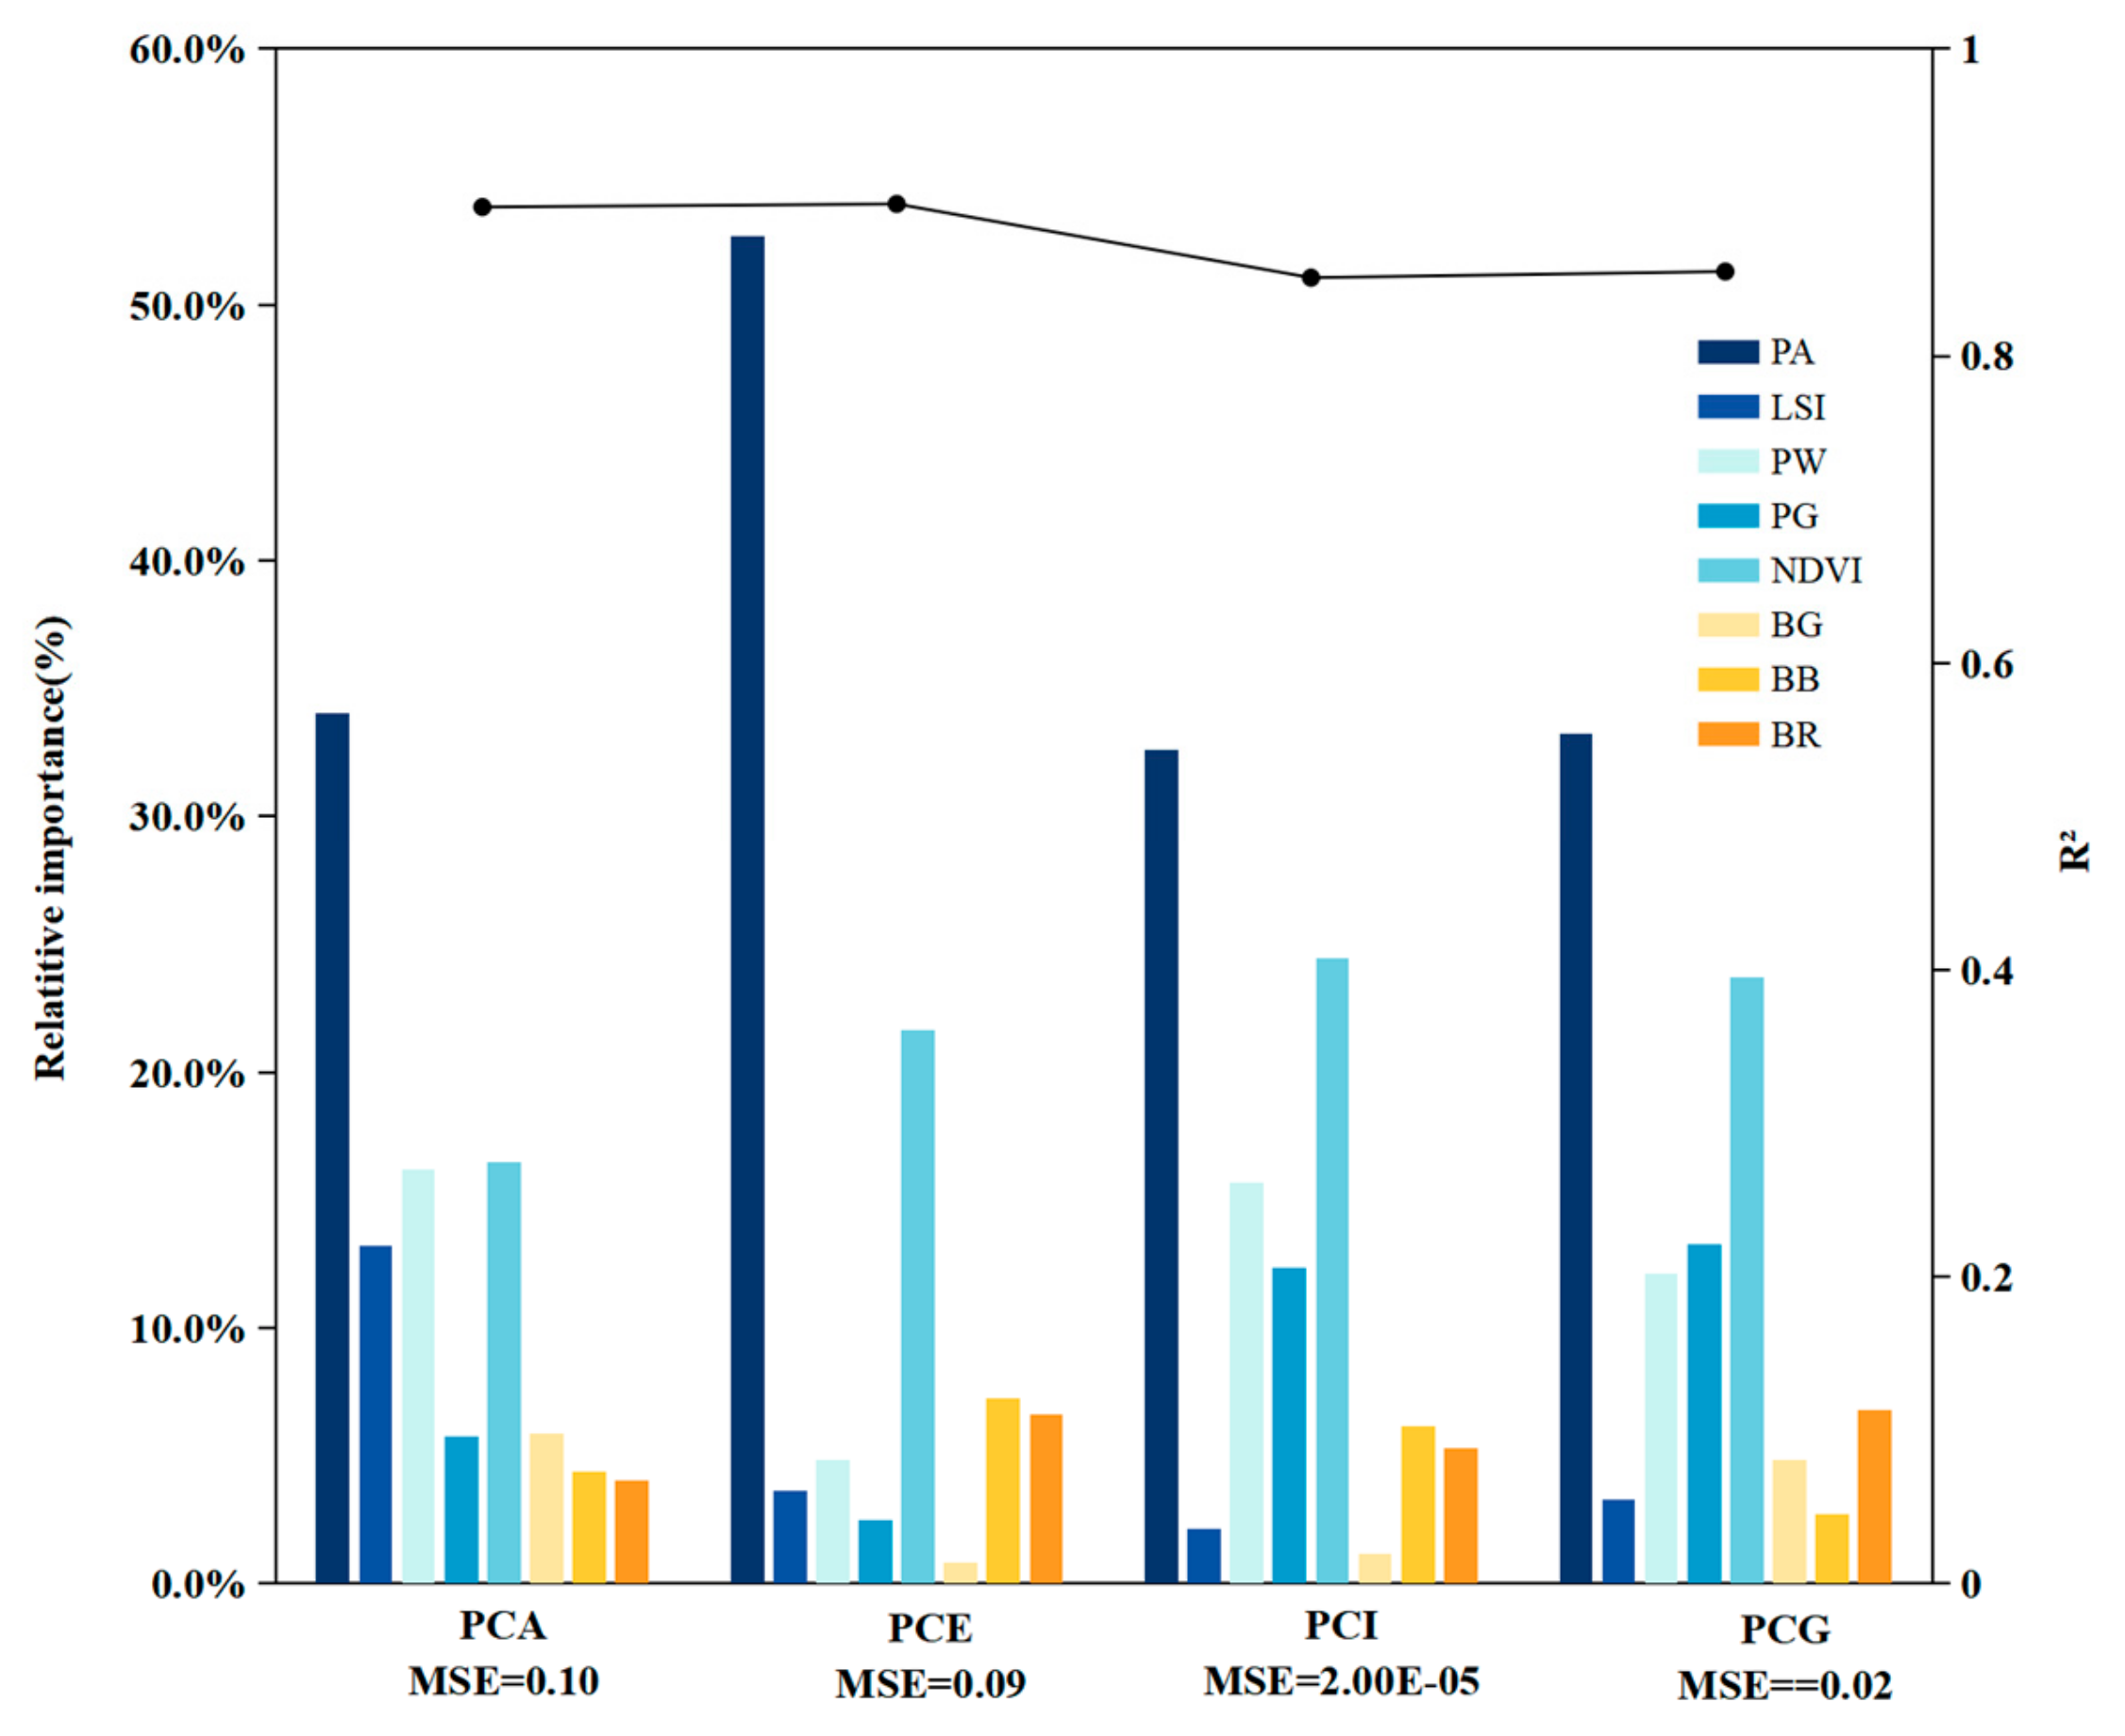
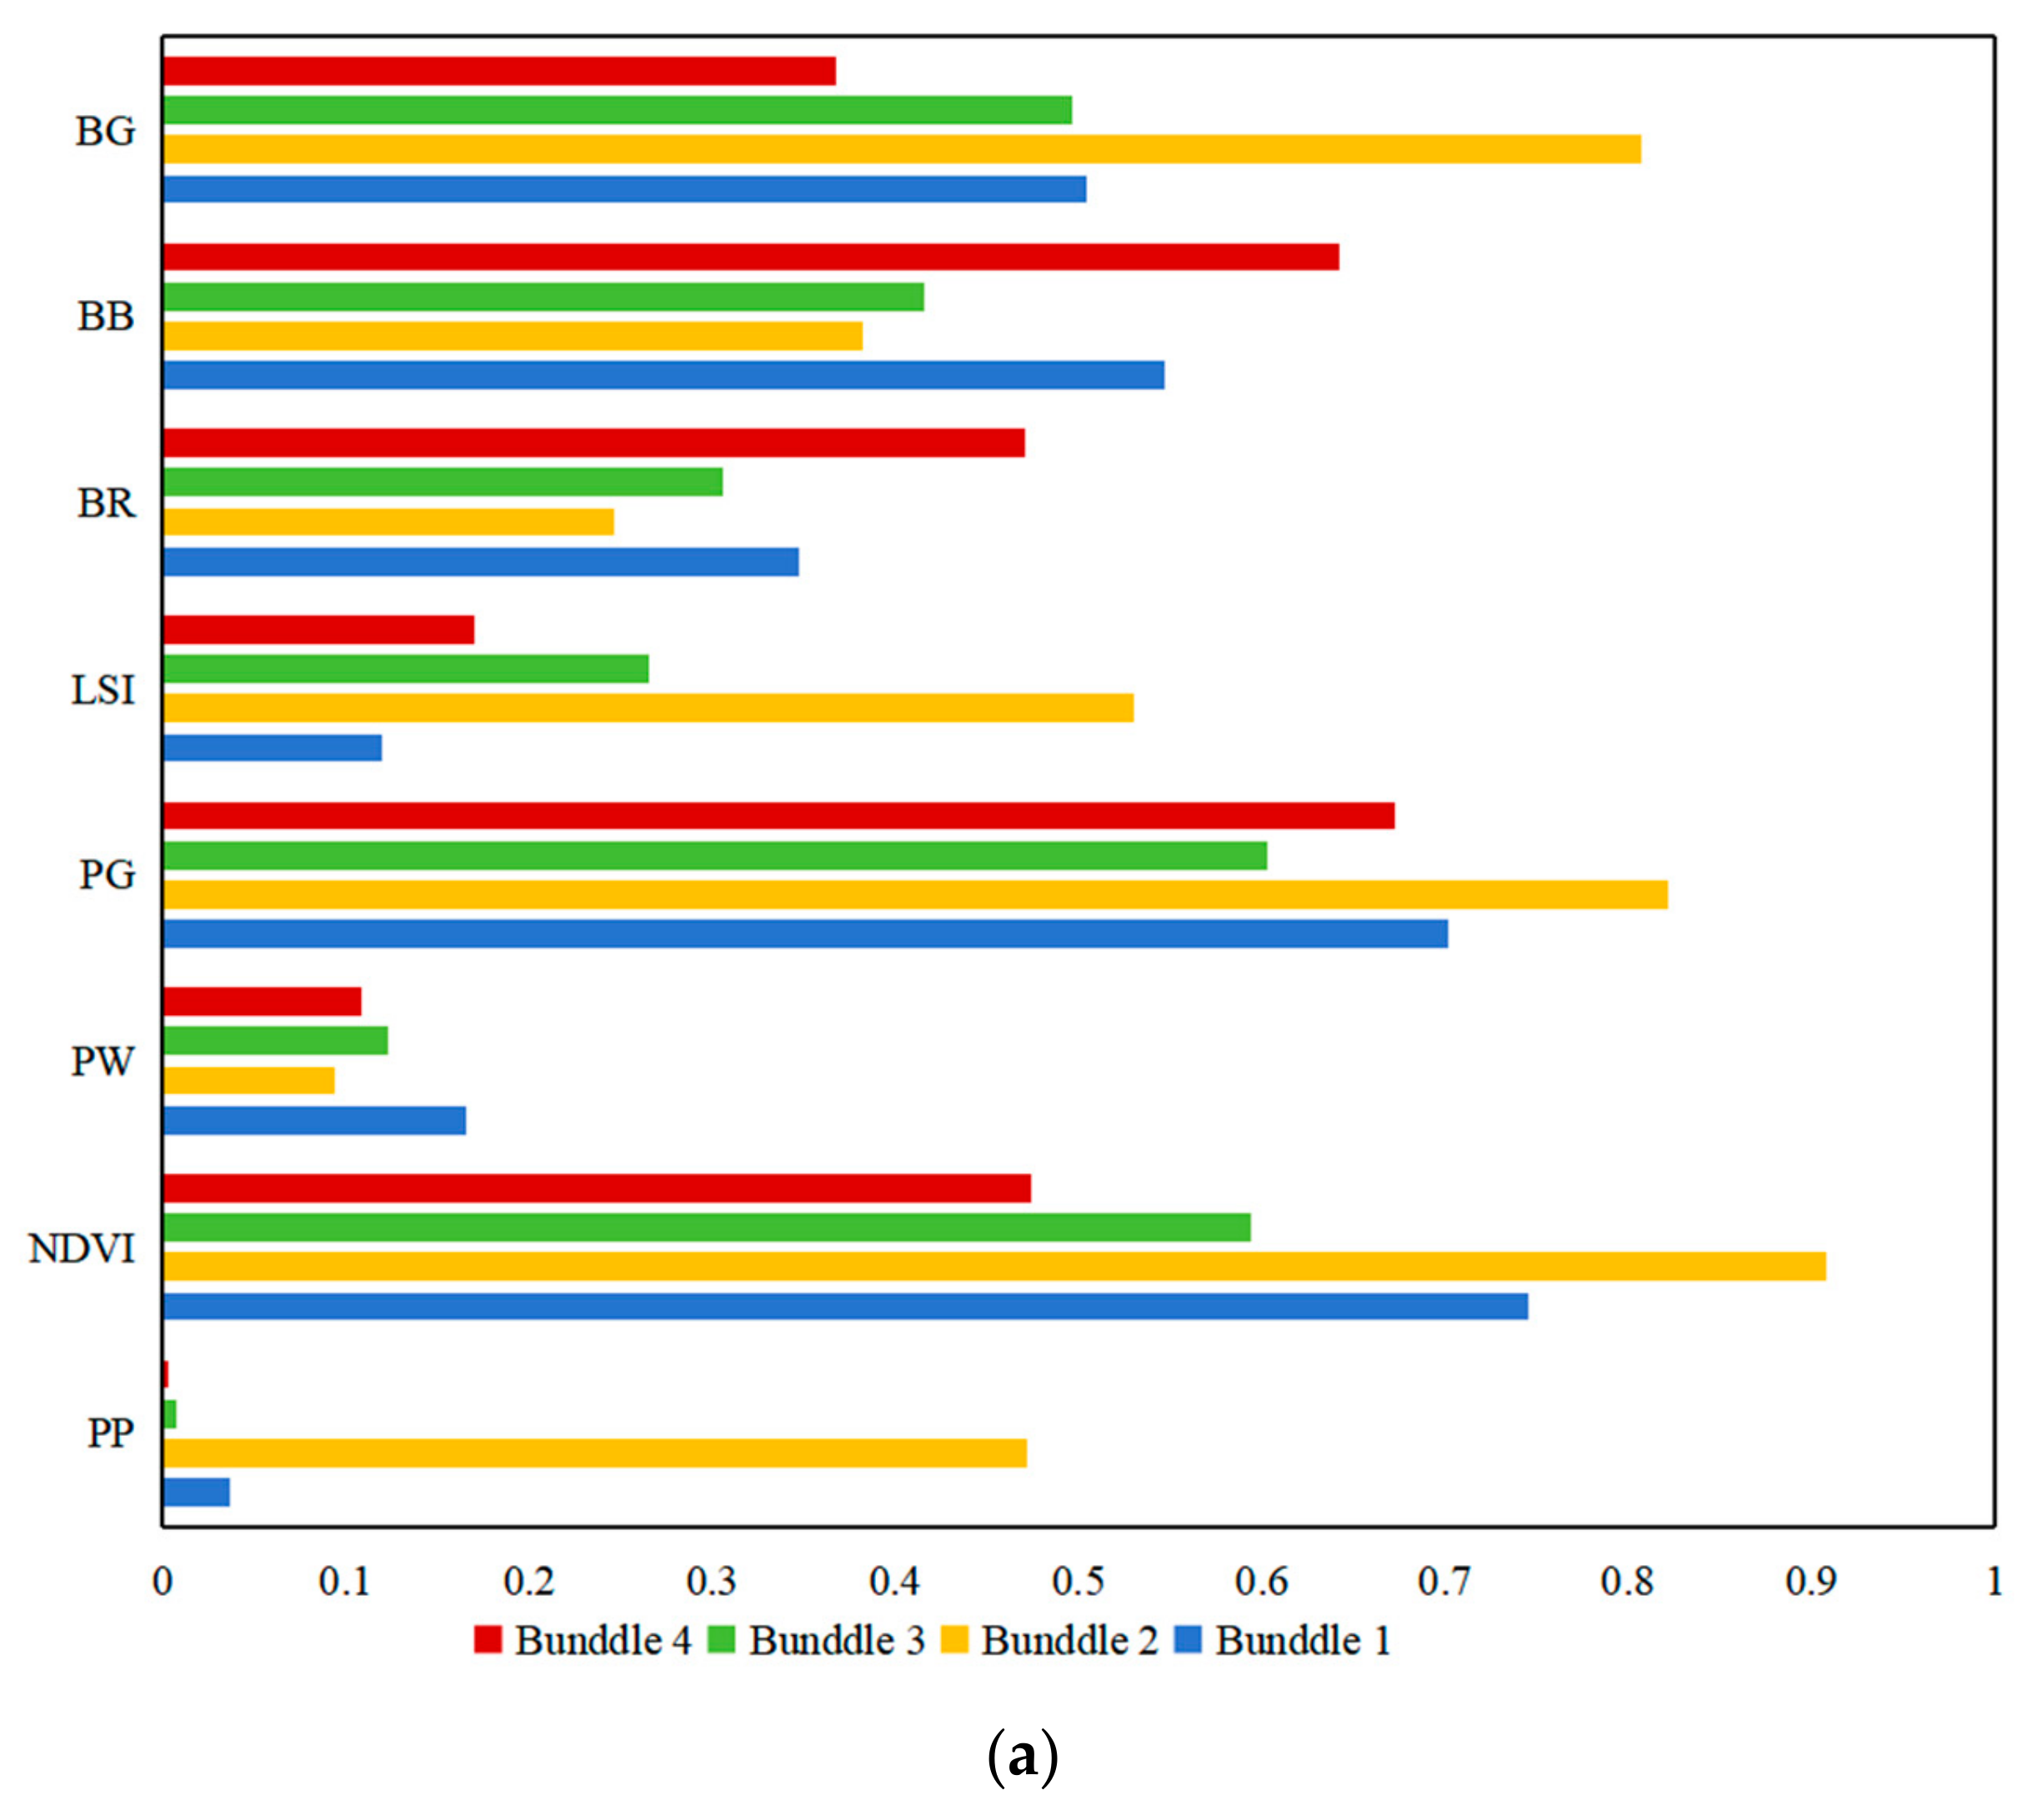
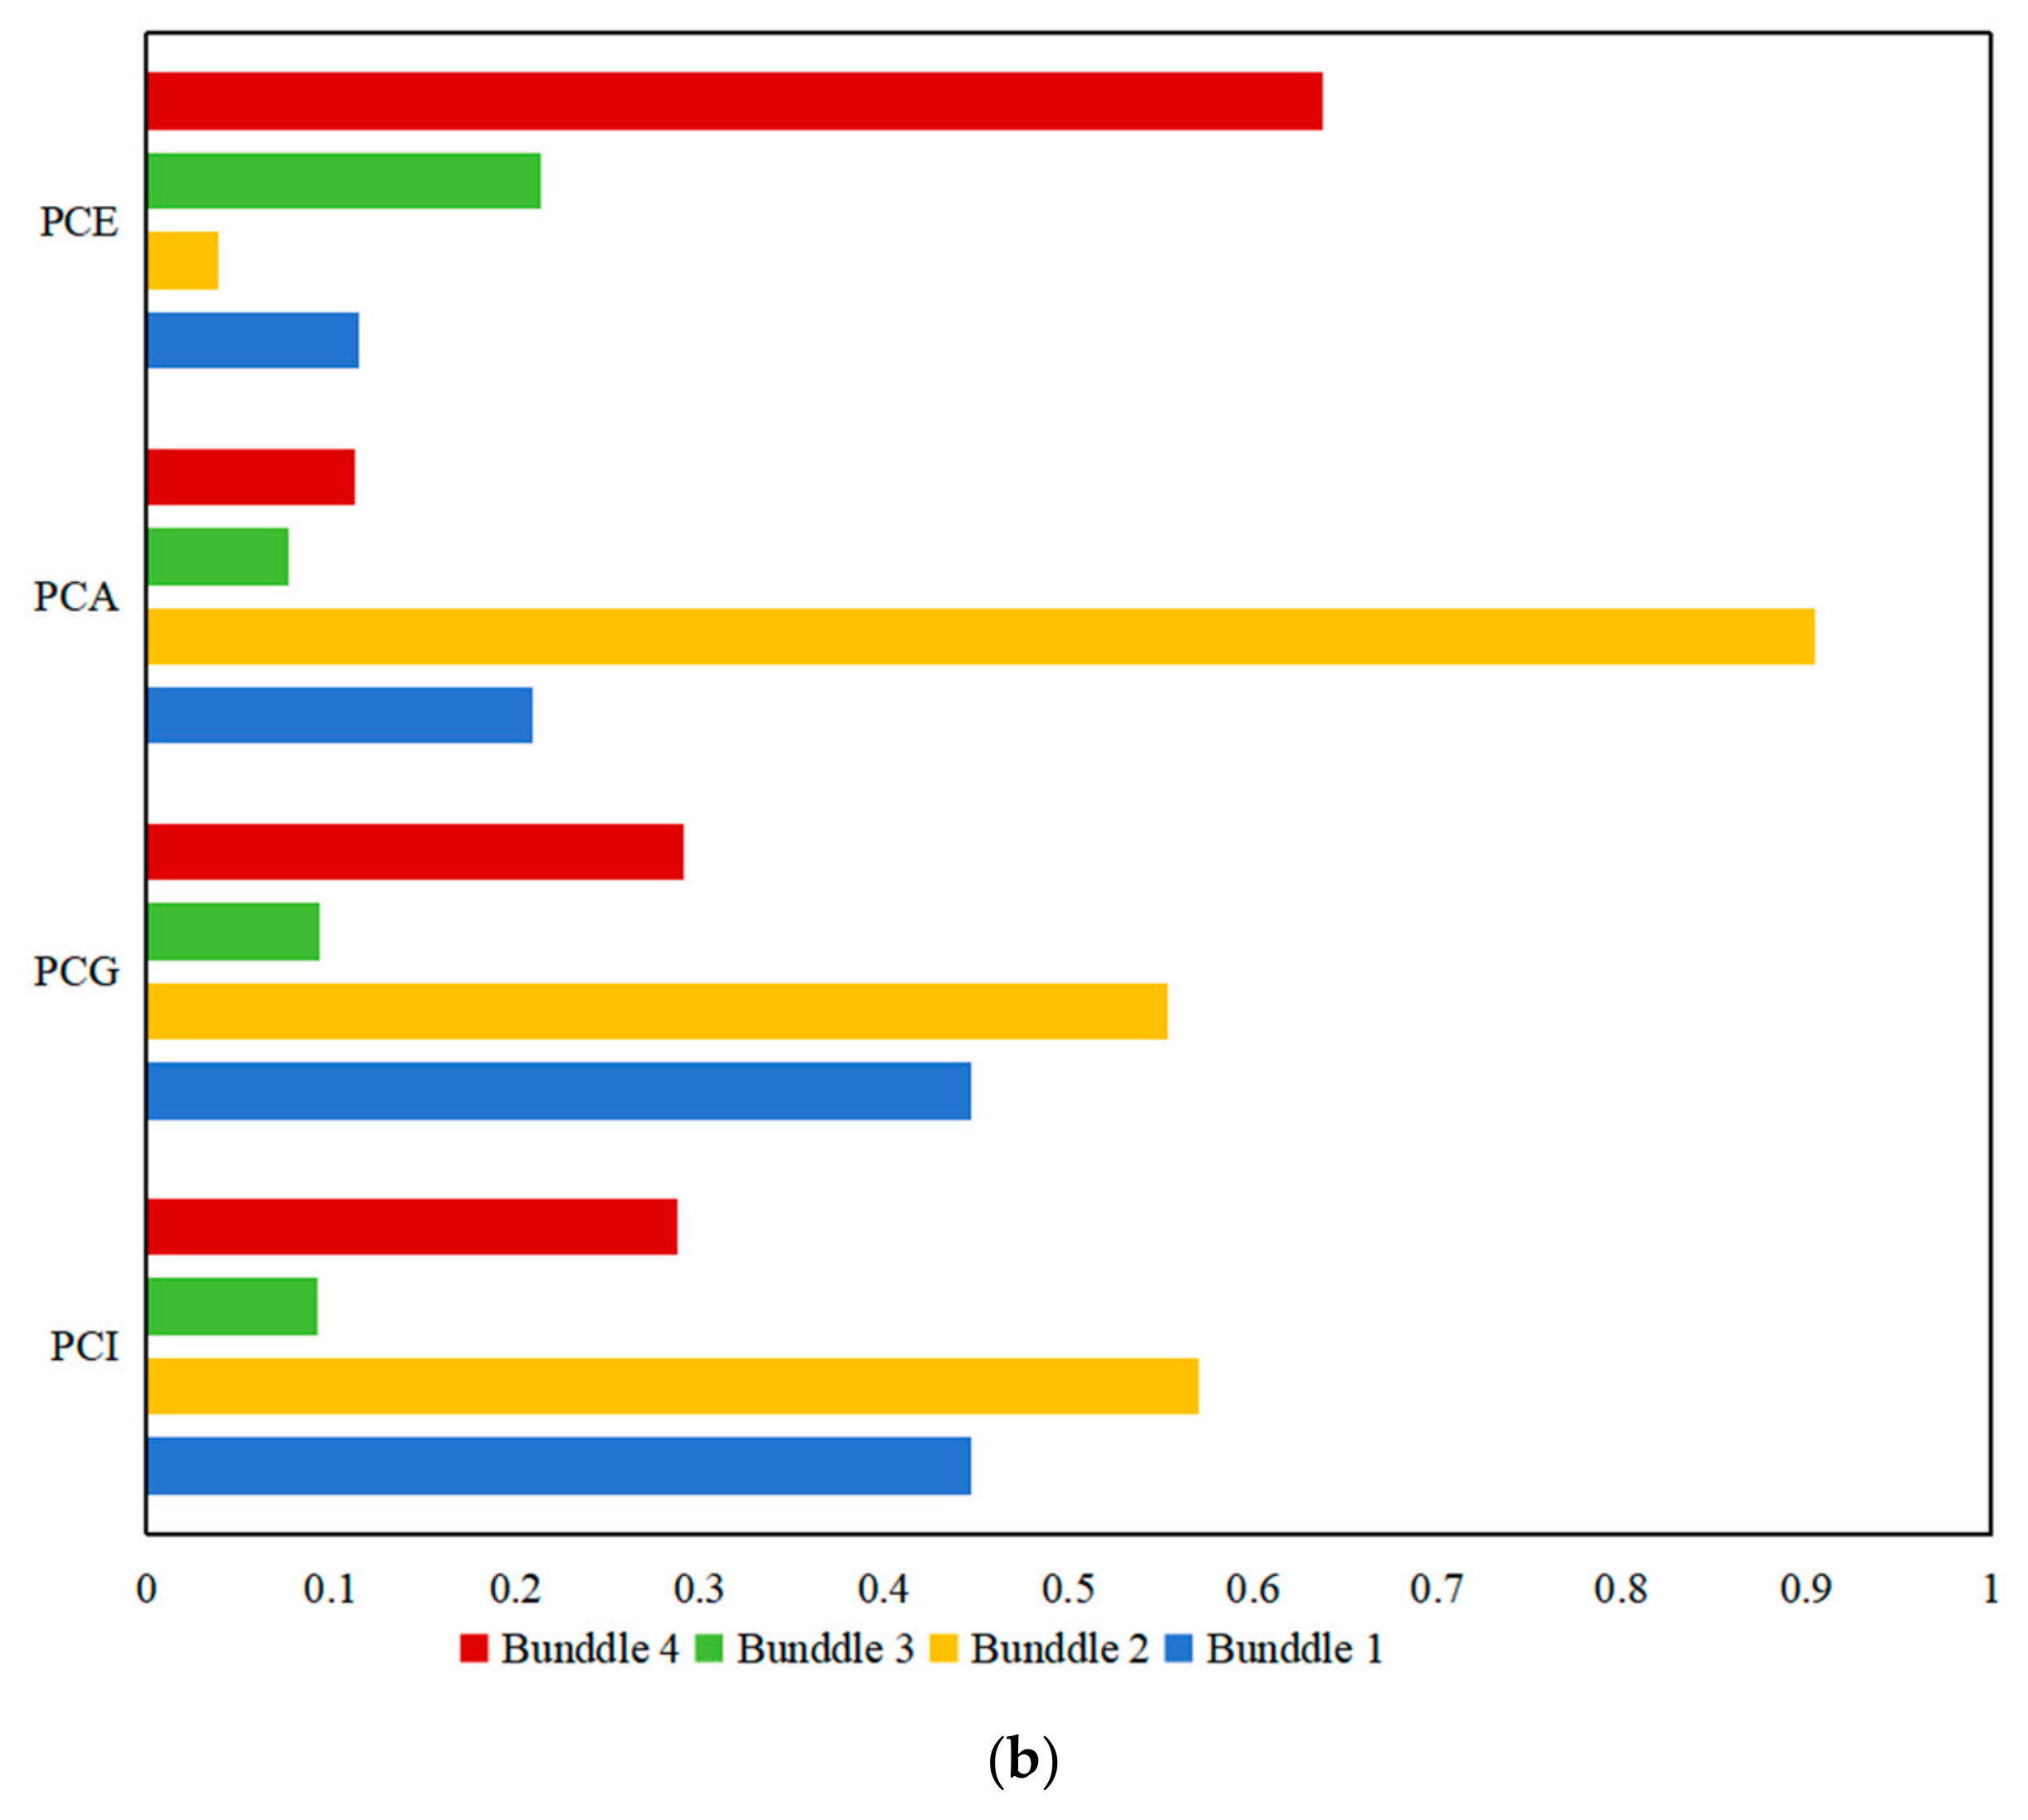
- PCI: PA and NDVI accounted for 52.65% and 21.63% of the total relative importance, respectively. The most significant environmental factor was building density (BB), contributing 6.15%.
- (2)
- PCG: The most important internal landscape factor still accounted for 33.21% of the area. However, the dominant environmental factor was BG, accounting for 4.83%. The distribution of influencing factors for PCI closely resembles that of PCG.
- (3)
- PCA: PA overwhelmingly dominated, accounting for 34.05% of relative importance. NDVI and water area proportion (PW) followed, with contribution rates of 16.49% and 16.21%, respectively. BG was the most influential environmental factor for PCA, contributing 5.86%.
- (4)
- PCE: PA and NDVI held a substantial relative importance at 52.65% and 21.63%, respectively. Contributions from PW, park perimeter (PG), LSI, BB, BG, and buffer road density (BR) were all below 10%.
3.3. TVoE of Urban Parks
3.4. Cluster Analysis of Different Park Types
4. Discussion
4.1. Cooling Effects of Urban Parks
- (1)
- (2)
- (3)
- (4)
4.2. Factors Influencing Cooling Effects
4.3. Recommendations for Park Planning and Design
- (1)
- (2)
- When planning internal configurations, keep a balance of surrounding vegetation and building distributions, as these features significantly influence park cooling. Prioritizing factors with higher relative importance (e.g., NDVI, water bodies) is recommended when trade-offs are unavoidable, to ensure maximal cooling benefits for urban thermal environment improvement.
- (3)
- High-Density Residential Zones: It is recommended to deploy community parks and pocket parks (Bundle 4) to rapidly mitigate localized heat islands.
- (4)
- Urban Periphery/Suburbs: It is recommended to develop large comprehensive parks and scenic green spaces (Bundles 1 and 2) with high vegetation coverage. These parks act as ecological barriers, enhancing regional microclimates.
- (5)
- Highly Urbanized Cores: Small, flexible pocket parks (Bundle 3) are proposed for integration due to their demonstrated cost-effectiveness and adaptability in constrained spaces.
- (1)
- (2)
- When designing internal park configurations, planners should balance surrounding vegetation and building patterns. Priority should be given to high-impact factors (e.g., NDVI, water bodies) when trade-offs are necessary, to enhance overall cooling effectiveness.
- (1)
- High-density residential zones: Community parks and pocket parks (Bundle 4) are recommended to quickly mitigate localized heat islands.
- (2)
- Urban periphery and suburban areas: Large-scale parks with high vegetation coverage (Bundles 1 and 2) are suggested to function as ecological buffers and enhance regional microclimates.
- (3)
- Highly urbanized cores: Small, adaptable pocket parks (Bundle 3) offer a cost-effective and flexible cooling solution where space is limited.
4.4. Limitations and Future Research Directions
- (1)
- Temporal Scope: The analysis is restricted to daytime cooling effects during summer, while ignoring annual and diurnal variations. Given seasonal differences in urban cooling and heat island dynamics [63,64], future research should explore park cooling performance across seasons and day–night cycles. For instance, a study in Zhengzhou found that LST in urban parks reduced by 0.65 °C (spring), 1.41 °C (summer), and 2.84 °C (fall) but increased by 1.92 °C in winter [65].
- (2)
- Sample Diversity: The limited sample size (64 parks) may constrain the generalizability of findings, particularly regarding cooling bundle classifications and TVoE thresholds. Further studies should include more park types and climatic regions.
- (3)
- Previous studies have highlighted the significant cooling effect of water bodies in urban environments, often exceeding that of vegetation [66]. However, in this study, the water body coverage within parks was generally low (average proportion < 5%), and statistical analyses did not reveal a significant correlation between water body coverage and cooling indicators. Some studies have suggested that the cooling effect becomes statistically significant only when the water body proportion exceeds 10% [15]. It is important to clarify that this finding does not negate the theoretical cooling value of water bodies but rather reflects the statistical outcome within the specific sample scope of this study. Future research is encouraged to conduct more refined observations on water bodies of varying scales, particularly: comparing the cooling effects of large (>10% of park area) versus small water bodies; quantifying the impact of water body shape complexity on microclimates; and evaluating the synergistic cooling effects of water–vegetation configurations.
- (4)
- Methodological Refinements: Incorporating advanced remote sensing data (e.g., higher-resolution thermal imagery) and field measurements (e.g., microclimate sensors) would validate and complement satellite-derived results.
- (5)
- Socioeconomic Integration: Future work could consider the cooling efficiency of socioeconomic factors (e.g., park accessibility, visitors) to optimize equity in green space distribution.
- (6)
- Recent studies have made significant progress in pedestrian thermal comfort modeling. For instance, some research has combined the Universal Thermal Climate Index (UTCI) with computational fluid dynamics (CFD) through the “City Comfort+” model to dynamically simulate UTCI at the pedestrian scale and predict future climate scenarios [67]. Xia et al. (2025) further utilized DepthmapX and XGBoost to identify key design factors, such as visibility percentage (PV) and connectivity (CON), that contribute to campus “cool spots” in Hong Kong [68]. However, these innovative methods rely on high-precision 3D models and dense field data, making them difficult to implement in resource-constrained areas. In contrast, the large-scale urban heat island (UHI) assessment methods employed in this study, such as macro analysis based on meteorological stations and LST, although limited in resolution, offer the advantages of ease of access and broad coverage, making them suitable as preliminary screening tools. By incorporating spatial indicators such as PV and CON into the existing evaluation framework, it becomes possible to preliminarily identify micro-scale hotspot areas that require prioritized intervention. Future research could establish a three-tiered system: (1) macro-scale screening using satellite data to identify high-risk UHI zones; (2) meso-scale validation using UTCI simulations to quantify pedestrian heat stress; (3) micro-scale design integrating machine learning to generate cool spot solutions. This framework would not only reduce the cost of fine-scale comprehensive simulations but also provide decision-makers with full-chain support from strategic planning to specific design. Addressing these limitations will deepen our understanding of urban park cooling mechanisms and support climate-adaptive urban planning.
5. Conclusions
- (1)
- Urban parks exhibited notable cooling effects, and the mean PCI, PCG, PCA, and PCE were 0.02 °C, 0.71, 63.72 ha, and 10.71 °C, respectively. The average temperature reduction and cooling distance were, respectively, 3.35 °C and 211.53 m. Correlation analysis revealed that park area, park perimeter, and NDVI (Normalized Difference Vegetation Index) were significantly positively correlated with PCA, PCI, and PCG. Conversely, these factors presented a significant negative correlation with PCE. Additionally, water body ratio and green space ratio were positively correlated with PCA.
- (2)
- The building density, road network density, and green space ratio in the buffer zone also impact cooling.
- (3)
- The identified TVoE (threshold of efficiency) for urban park area was 30.24 ha in Qingdao. And, it represented the minimum area of urban park green space required to maximize cooling benefits.
- (4)
- Through Ward’s hierarchical clustering method based on cooling indicators, 64 urban parks were grouped into four bundles with distinct cooling characteristics. To enhance the cooling effects for these bundles, differentiated measures should be taken according to the characteristics of urban parks. Among them, bundle 1 accounted for 43.75% of the 64 park green spaces, and it was dominated by PCI and PCG.
Author Contributions
Funding
Institutional Review Board Statement
Informed Consent Statement
Data Availability Statement
Conflicts of Interest
Abbreviations
| UHI | Urban heat island effect |
| PCI | Park cooling intensity |
| PCG | Park cooling gradient |
| PCA | Park cooling area |
| PCE | Park cooling efficiency |
| NDVI | Normalized difference vegetation index |
| TVoE | Threshold value of efficiency |
| LST | Land surface temperature |
Appendix A

| NO. | Park Name | Park Type | NO. | Park Name | Park Type |
|---|---|---|---|---|---|
| 1 | Bainidi Park | Specialized Park | 33 | Qingxiaoyuan Huqing Road Pocket Park | Pocket Park |
| 2 | Yandun Mountain Park | Community Park | 34 | Qingxiaoyuan Haier Road Pocket Park (South/North Gardens, Miaoling Road) | Pocket Park |
| 3 | Loushan Park | Community Park | 35 | Zhangcun River Ecological Park | Pocket Park |
| 4 | Fangzijie Mountain Park | Community Park | 36 | Qingxiaoyuan Liaoyang East Road Park | Pocket Park |
| 5 | Ancient City Ruins Park | Specialized Park | 37 | Zhongshan Park, Zoo and Botanical Garden Green Cluster | Specialized Park |
| 6 | Dazaoyuan Pocket Park | Specialized Park | 38 | Guanhai Mountain Park | Specialized Park |
| 7 | Shimei’an Park and Laohu Mountain | Scenic Recreation Green Space | 39 | Lao She Park | Specialized Park |
| 8 | Jinshui River Park | Specialized Park | 40 | Zhanqiao Plaza | Pocket Park |
| 9 | Licun River Park | Pocket Park | 41 | Qingxiaoyuan Ningwuguan Road Pocket Park | Specialized Park |
| 10 | Qinglong Mountain Park and Riverside Gardens | Specialized Park | 42 | Gu Mountain Park | Pocket Park |
| 11 | Kutao Floral Eco-Park | Scenic Recreation Green Space | 43 | Binhai Greenway | Pocket Park |
| 12 | Licun Park | Comprehensive Park | 44 | Qingxiaoyuan Hualing Amusement Park | Pocket Park |
| 13 | Licun Riverside Park | Pocket Park | 45 | Yongxing Pocket Park | Pocket Park |
| 14 | Shuiqinggou East Mountain Park | Community Park | 46 | Qingxiaoyuan (Haier No.2 Gate West Pocket Park, Heilongjiang Road) | Pocket Park |
| 15 | Jiading Mountain Park | Community Park | 47 | Qingxiaoyuan Fun Park | Pocket Park |
| 16 | Beiling Mountain Forest Park | Specialized Park | 48 | Xishan Senior Citizens Theme Park | Pocket Park |
| 17 | Fulong Mountain Park | Community Park | 49 | Jinshui Bridge Park | Specialized Park |
| 18 | Guanxiang Mountain Park | Specialized Park | 50 | Zhangcun River Park | Pocket Park |
| 19 | Xinhao Mountain Park | Specialized Park | 51 | Jinsong 7th Road Pocket Park | Pocket Park |
| 20 | Baguanshan Park | Community Park | 52 | Qingxiaoyuan Songling Road Pocket Park (Qingdao No.2 Middle School South Garden) | Pocket Park |
| 21 | Qingdao Mountain WWI Ruins Park | Specialized Park | 53 | Haibo River Park | Comprehensive Park |
| 22 | Taipingjiao Park | Community Park | 54 | Zhushui Mountain Children’s Park | Specialized Park |
| 23 | Fushan Fragrant Garden | Scenic Recreation Green Space | 55 | Qingxiaoyuan Yuanxiang Garden | Pocket Park |
| 24 | Tianjiacun East Mountain Park | Pocket Park | 56 | Qingxiaoyuan Changchun Road Pocket Park | Pocket Park |
| 25 | Jialing Mountain Park | Scenic Recreation Green Space | 57 | Qingxiaoyuan Jinsong 1st Road Pocket Park | Pocket Park |
| 26 | Nanshan Park | Community Park | 58 | Huanhu Park | Community Park |
| 27 | Tanding Mountain Park | Community Park | 59 | Shinan Legal Culture Park | Specialized Park |
| 28 | Cangkou Park | Community Park | 60 | Laoshan District Shenzhen Road Sports Park | Specialized Park |
| 29 | Niumao Mountain Park | Community Park | 61 | Juelin Park | Specialized Park |
| 30 | Water Park | Community Park | 62 | Fushan Forest Park | Scenic Recreation Green Space |
| 31 | Laoshan Martyrs’ Revolutionary Garden | Specialized Park | 63 | Laodong Park | Specialized Park |
| 32 | Qingxiaoyuan Pocket Park (North of Qingdao No.67 Middle School, Haier Road) | Pocket Park | 64 | Qingxiaoyuan Yichun Road Pocket Park | Pocket Park |
References
- Zhang, J.; Zhang, H.; Qi, R. A Study of Size Threshold for Cooling Effect in Urban Parks and Their Cooling Accessibility and Equity. Sci. Rep. 2024, 14, 16176. [Google Scholar] [CrossRef] [PubMed]
- Mohammad Harmay, N.S.; Kim, D.; Choi, M. Urban Heat Island Associated with Land Use/Land Cover and Climate Variations in Melbourne, Australia. Sustain. Cities Soc. 2021, 69, 102861. [Google Scholar] [CrossRef]
- Guo, A.; Yue, W.; Yang, J.; Li, M.; Zhang, Z.; Xie, P.; Zhang, M.; Lu, Y.; He, T. Quantifying the Cooling Effect and Benefits of Urban Parks: A Case Study of Hangzhou, China. Sustain. Cities Soc. 2024, 113, 105706. [Google Scholar] [CrossRef]
- Goodwin, S.; Olazabal, M.; Castro, A.J.; Pascual, U. Global Mapping of Urban Nature-Based Solutions for Climate Change Adaptation. Nat. Sustain. 2023, 6, 458–469. [Google Scholar] [CrossRef]
- Solecki, W.D.; Rosenzweig, C.; Parshall, L.; Pope, G.; Clark, M.; Cox, J.; Wiencke, M. Mitigation of the Heat Island Effect in Urban New Jersey. Glob. Environ. Change Part B Environ. Hazards 2005, 6, 39–49. [Google Scholar] [CrossRef]
- Antoszewski, P.; Świerk, D.; Krzyżaniak, M. Statistical Review of Quality Parameters of Blue-Green Infrastructure Elements Important in Mitigating the Effect of the Urban Heat Island in the Temperate Climate (C) Zone. Int. J. Environ. Res. Public. Health 2020, 17, 7093. [Google Scholar] [CrossRef]
- Demuzere, M.; Orru, K.; Heidrich, O.; Olazabal, E.; Geneletti, D.; Orru, H.; Bhave, A.G.; Mittal, N.; Feliu, E.; Faehnle, M. Mitigating and Adapting to Climate Change: Multi-Functional and Multi-Scale Assessment of Green Urban Infrastructure. J. Environ. Manag. 2014, 146, 107–115. [Google Scholar] [CrossRef]
- Oliveira, S.; Andrade, H.; Vaz, T. The Cooling Effect of Green Spaces as a Contribution to the Mitigation of Urban Heat: A Case Study in Lisbon. Build. Environ. 2011, 46, 2186–2194. [Google Scholar] [CrossRef]
- Wang, W.; Feng, C.; Liu, F.; Li, J. Biodiversity Conservation in China: A Review of Recent Studies and Practices. Environ. Sci. Ecotechnology 2020, 2, 100025. [Google Scholar] [CrossRef]
- Yang, M.; Nie, W.; Wu, R.; Yan, H.; Tian, S.; Wang, K.; Shi, L.; Cheng, X.; Ji, T.; Bao, Z. Towards More Equitable Cooling Services of Urban Parks: Linking Cooling Effect, Accessibility and Attractiveness. J. Environ. Manag. 2024, 370, 122475. [Google Scholar] [CrossRef]
- Han, D.; Xu, X.; Qiao, Z.; Wang, F.; Cai, H.; An, H.; Jia, K.; Liu, Y.; Sun, Z.; Wang, S.; et al. The Roles of Surrounding 2D/3D Landscapes in Park Cooling Effect: Analysis from Extreme Hot and Normal Weather Perspectives. Build. Environ. 2023, 231, 110053. [Google Scholar] [CrossRef]
- Chang, C.-R.; Li, M.-H.; Chang, S.-D. A Preliminary Study on the Local Cool-Island Intensity of Taipei City Parks. Landsc. Urban Plan. 2007, 80, 386–395. [Google Scholar] [CrossRef]
- Jauregui, E. Influence of a Large Urban Park on Temperature and Convective Precipitation in a Tropical City. Energy Build. 1990, 15, 457–463. [Google Scholar] [CrossRef]
- Yu, C.; Hien, W.N. Thermal benefits of city parks. Energy Build. 2006, 38, 105–120. [Google Scholar] [CrossRef]
- Yao, X.; Yu, K.; Zeng, X.; Lin, Y.; Ye, B.; Shen, X.; Liu, J. How Can Urban Parks Be Planned to Mitigate Urban Heat Island Effect in “Furnace Cities” ? An Accumulation Perspective. J. Clean. Prod. 2022, 330, 129852. [Google Scholar] [CrossRef]
- Xu, C.; Wang, W.; Zhu, H. Spatial Gradient Differences in the Cooling Island Effect and Influencing Factors of Urban Park Green Spaces in Beijing. Buildings 2024, 14, 1206. [Google Scholar] [CrossRef]
- Feyisa, G.L.; Dons, K.; Meilby, H. Efficiency of Parks in Mitigating Urban Heat Island Effect: An Example from Addis Ababa. Landsc. Urban Plan. 2014, 123, 87–95. [Google Scholar] [CrossRef]
- Cao, X.; Onishi, A.; Chen, J.; Imura, H. Quantifying the Cool Island Intensity of Urban Parks Using ASTER and IKONOS Data. Landsc. Urban Plan. 2010, 96, 224–231. [Google Scholar] [CrossRef]
- Toparlar, Y.; Blocken, B.; Maiheu, B.; van Heijst, G.J.F. The Effect of an Urban Park on the Microclimate in Its Vicinity: A Case Study for Antwerp, Belgium. Int. J. Climatol. 2018, 38, e303–e322. [Google Scholar] [CrossRef]
- Xiao, Y.; Piao, Y.; Wei, W.; Pan, C.; Lee, D.; Zhao, B. A Comprehensive Framework of Cooling Effect-Accessibility-Urban Development to Assessing and Planning Park Cooling Services. Sustain. Cities Soc. 2023, 98, 104817. [Google Scholar] [CrossRef]
- Peng, J. How to Quantify the Cooling Effect of Urban Parks? Linking Maximum and Accumulation Perspectives. Remote Sens. Environ. 2021, 252, 112135. [Google Scholar] [CrossRef]
- Zhang, N. Quantification and Mapping of the Cooling Effect of Urban Parks on the Temperate Monsoon Climate Zone. Sustain. Cities Soc. 2024, 101, 105111. [Google Scholar] [CrossRef]
- Cai, X.; Yang, J.; Zhang, Y.; Xiao, X.; Xia, J. Cooling Island Effect in Urban Parks from the Perspective of Internal Park Landscape. Humanit. Soc. Sci. Commun. 2023, 10, 674. [Google Scholar] [CrossRef]
- Spronken Smith, R.A.; Oke, T.R.; Spronken Smith, R.A.; Oke, T.R. The Thermal Regime of Urban Parks in Two Cities with Different Summer Climates. Int. J. Remote Sens. 1998, 19, 2085–2104. [Google Scholar] [CrossRef]
- Tan, X. Comparison of Cooling Effect between Green Space and Water Body. Sustain. Cities Soc. 2021, 67, 102711. [Google Scholar] [CrossRef]
- Wan, J. Temporal and Spatial Effects of Large Airport Construction and Operation on the Local Thermal Environment. Environ. Sci. Pollut. Res. 2023, 30, 13788–13800. [Google Scholar] [CrossRef]
- Li, Z.-L.; Wu, H.; Duan, S.-B.; Zhao, W.; Ren, H.; Liu, X.; Leng, P.; Tang, R.; Ye, X.; Zhu, J.; et al. Satellite Remote Sensing of Global Land Surface Temperature: Definition, Methods, Products, and Applications. Rev. Geophys. 2023, 61, e2022RG000777. [Google Scholar] [CrossRef]
- Feng, L.; Yue, D.; Guo, X. A Review on the Application of Vegetation Indices. For. Inventory Plan. 2009, 34, 48–52. [Google Scholar]
- Li, M. Research on Remote Sensing Estimation Methods of Vegetation Coverage. Master’s Thesis, Graduate University of Chinese Academy of Sciences (Institute of Remote Sensing Applications), Beijing, China, 2003. [Google Scholar]
- Li, W.; Qin, Z.; Li, W.; Yang, Q. Comparative Analysis of MODIS NDVI and MODIS EVI. Remote Sens. Inf. 2010, 112, 73–78. [Google Scholar] [CrossRef]
- Yu, C.; Liu, D.; Feng, R.; Tang, Q.; Guo, C. Construction of Ecological Security Pattern in Northeast China Based on Minimum Cumulative Resistance Model. Acta Ecol. Sin. 2021, 41, 290–301. [Google Scholar]
- Xu, H. A New Index for Delineating Built-up Land Features in Satellite Imagery. Int. J. Remote Sens. 2008, 29, 4269–4276. [Google Scholar] [CrossRef]
- CJJ/T 85-2017; Urban Green Space Classification Standard. Ministry of Housing and Urban-Rural Development: Beijing, China, 2017.
- Li, Z.-L.; Tang, B.-H.; Wu, H.; Ren, H.; Yan, G.; Wan, Z.; Trigo, I.F.; Sobrino, J.A. Satellite-Derived Land Surface Temperature: Current Status and Perspectives. Remote Sens. Environ. 2013, 131, 14–37. [Google Scholar] [CrossRef]
- Park, C.Y.; Lee, D.K.; Asawa, T.; Murakami, A.; Kim, H.G.; Lee, M.K.; Lee, H.S. Influence of Urban Form on the Cooling Effect of a Small Urban River. Landsc. Urban Plan. 2019, 183, 26–35. [Google Scholar] [CrossRef]
- Yu, Z.; Xu, S.; Zhang, Y.; Jørgensen, G.; Vejre, H. Strong Contributions of Local Background Climate to the Cooling Effect of Urban Green Vegetation. Sci. Rep. 2018, 8, 6798. [Google Scholar] [CrossRef]
- Yu, Z.; Guo, X.; Jørgensen, G.; Vejre, H. How Can Urban Green Spaces Be Planned for Climate Adaptation in Subtropical Cities? Ecol. Indic. 2017, 82, 152–162. [Google Scholar] [CrossRef]
- He, M.; Yang, C. Analyzing Cooling Island Effect of Urban Parks in Zhengzhou City: A Study on Spatial Maximum and Spatial Accumulation Perspectives. Sustainability 2024, 16, 5421. [Google Scholar] [CrossRef]
- Cheng, X.; Wei, B.; Chen, G.; Li, J.; Song, C. Influence of Park Size and Its Surrounding Urban Landscape Patterns on the Park Cooling Effect. J. Urban Plan. Dev.-Asce 2015, 141, A4014002. [Google Scholar] [CrossRef]
- Qiu, K.; Jia, B. The Roles of Landscape Both inside the Park and the Surroundings in Park Cooling Effect. Sustain. Cities Soc. 2020, 52, 101864. [Google Scholar] [CrossRef]
- Geng, X.; Yu, Z.; Zhang, D.; Li, C.; Yuan, Y.; Wang, X. The Influence of Local Background Climate on the Dominant Factors and Threshold-Size of the Cooling Effect of Urban Parks. Sci. Total Environ. 2022, 823, 153806. [Google Scholar] [CrossRef]
- Zhao, M.; Peng, J.; Liu, Y.; Li, T.; Wang, Y. Mapping Watershed-Level Ecosystem Service Bundles in the Pearl River Delta, China. Ecol. Econ. 2018, 152, 106–117. [Google Scholar] [CrossRef]
- Tran, D.X.; Pla, F.; Latorre-Carmona, P.; Myint, S.W.; Caetano, M.; Kieu, H.V. Characterizing the Relationship between Land Use Land Cover Change and Land Surface Temperature. ISPRS J. Photogramm. Remote Sens. 2017, 124, 119–132. [Google Scholar] [CrossRef]
- Ibrahim, M. Mitigation Strategies of the Urban Heat Island over Greater Cairo Metropolitan Area, Egypt Utilizing ENVI-Met Model. Catrina Int. J. Environ. Sci. 2021, 330, 35–47. [Google Scholar] [CrossRef]
- Yan, H.; Wu, F.; Dong, L. Influence of a Large Urban Park on the Local Urban Thermal Environment. Sci. Total Environ. 2018, 622–623, 882–891. [Google Scholar] [CrossRef]
- Lin, P.; Lau, S.S.Y.; Qin, H.; Gou, Z. Effects of Urban Planning Indicators on Urban Heat Island: A Case Study of Pocket Parks in High-Rise High-Density Environment. Landsc. Urban Plan. 2017, 168, 48–60. [Google Scholar] [CrossRef]
- Zhou, B.; Rybski, D.; Kropp, J.P. On the Statistics of Urban Heat Island Intensity. Geophys. Res. Lett. 2013, 40, 5486–5491. [Google Scholar] [CrossRef]
- Tan, M.; Li, X. Quantifying the Effects of Settlement Size on Urban Heat Islands in Fairly Uniform Geographic Areas. Habitat Int. 2015, 49, 100–106. [Google Scholar] [CrossRef]
- 4Bernard, J.; Rodler, A.; Morille, B.; Zhang, X. How to Design a Park and Its Surrounding Urban Morphology to Optimize the Spreading of Cool Air? Climate 2018, 6, 10. [Google Scholar] [CrossRef]
- Gromke, C.; Blocken, B.; Janssen, W.; Merema, B.; Van Hooff, T.; Timmermans, H. CFD Analysis of Transpirational Cooling by Vegetation: Case Study for Specific Meteorological Conditions During a Heat Wave in Arnhem, Netherlands. Build. Environ. 2015, 83, 11–26. [Google Scholar] [CrossRef]
- Jaganmohan, M.; Knapp, S.; Buchmann, C.M.; Schwarz, N. The Bigger, the Better? The Influence of Urban Green Space Design on Cooling Effects for Residential Areas. J. Environ. Qual. 2016, 45, 134. [Google Scholar] [CrossRef]
- Xiao, Y.; Fan, F. Analysis of Cooling Effects of Urban Park Green Spaces: A Case Study of Taiyuan City. J. South China Norm. Univ. (Nat. Sci. Ed.) 2024, 56, 80–92. [Google Scholar]
- Hamada, S.; Tanaka, T.; Ohta, T. Impacts of Land Use and Topography on the Cooling Effect of Green Areas on Surrounding Urban Areas. Urban For. Urban Green. 2013, 12, 426–434. [Google Scholar] [CrossRef]
- Yang, C.; He, X.; Yu, L.; Yang, J.; Yan, F.; Bu, K.; Chang, L.; Zhang, S. The Cooling Effect of Urban Parks and Its Monthly Variations in a Snow Climate City. Remote Sens. 2017, 9, 1066. [Google Scholar] [CrossRef]
- Brown, R.D.; Vanos, J.; Kenny, N.; Lenzholzer, S. Designing Urban Parks That Ameliorate the Effects of Climate Change. Landsc. Urban Plan. 2015, 138, 118–131. [Google Scholar] [CrossRef]
- Zheng, S. Study on Cooling Effects and Planning Strategies of Urban Parks in China. Master’s Thesis, Lanzhou University, Lanzhou, China, 2023. [Google Scholar]
- Chen, M.; Jia, W.; Yan, L.; Du, C.; Wang, K. Quantification and Mapping Cooling Effect and Its Accessibility of Urban Parks in an Extreme Heat Event in a Megacity. J. Clean. Prod. 2022, 334, 130252. [Google Scholar] [CrossRef]
- Weng, Q.; Lu, D.; Schubring, J. Estimation of Land Surface Temperature–Vegetation Abundance Relationship for Urban Heat Island Studies. Remote Sens. Environ. 2004, 89, 467–483. [Google Scholar] [CrossRef]
- Akbari, H.; Kolokotsa, D. Three Decades of Urban Heat Islands and Mitigation Technologies Research. Energy Build. 2016, 133, 834–842. [Google Scholar] [CrossRef]
- Imran, H.M.; Kala, J.; Ng, A.W.M.; Muthukumaran, S. Effectiveness of Green and Cool Roofs in Mitigating Urban Heat Island Effects during a Heatwave Event in the City of Melbourne in Southeast Australia. J. Clean. Prod. 2018, 197, 393–405. [Google Scholar] [CrossRef]
- Lottrup, L.; Grahn, P.; Stigsdotter, U.K. Workplace Greenery and Perceived Level of Stress: Benefits of Access to a Green Outdoor Environment at the Workplace. Landsc. Urban Plan. 2013, 110, 5–11. [Google Scholar] [CrossRef]
- Kothencz, G.; Blaschke, T. Urban Parks: Visitors’ Perceptions versus Spatial Indicators. Land Use Policy 2017, 64, 233–244. [Google Scholar] [CrossRef]
- Sharifi, F.; Nygaard, A.; Stone, W.M. Heterogeneity in the Subjective Well-Being Impact of Access to Urban Green Space. Sustain. Cities Soc. 2021, 74, 103244. [Google Scholar] [CrossRef]
- Yang, G.; Yu, Z.; Jørgensen, G.; Vejre, H. How Can Urban Blue-Green Space Be Planned for Climate Adaption in High-Latitude Cities? A Seasonal Perspective. Sustain. Cities Soc. 2020, 53, 101932. [Google Scholar] [CrossRef]
- Feng, Y.; Zhang, K.; Li, A.; Zhang, Y.; Wang, K.; Guo, N.; Wan, H.Y.; Tan, X.; Dong, N.; Xu, X.; et al. Spatial and Seasonal Variation and the Driving Mechanism of the Thermal Effects of Urban Park Green Spaces in Zhengzhou, China. Land 2024, 13, 1474. [Google Scholar] [CrossRef]
- Sun, R.; Chen, A.; Chen, L.; Lü, Y. Cooling Effects of Wetlands in an Urban Region: The Case of Beijing. Ecol. Indic. 2012, 20, 57–64. [Google Scholar] [CrossRef]
- Huang, J.; Tang, X.; Jones, P.; Hao, T.; Tundokova, R.; Walmsley, C.; Lannon, S.; Frost, P.; Jackson, J. Mapping Pedestrian Heat Stress in Current and Future Heatwaves in Cardiff, Newport, and Wrexham in Wales, UK. Build. Environ. 2024, 251, 111168. [Google Scholar] [CrossRef]
- Xia, Y.; Lu, W.; Peng, Z.; Lou, J.; Huang, J.; Niu, J. Understanding the Impacts of Space Design on Local Outdoor Thermal Comfort: An Approach Combining DepthmapX and XGBoost. Energy Build. 2025, 332, 115451. [Google Scholar] [CrossRef]
| Category | Influencing Factors | Definition |
|---|---|---|
| Urban Park Landscape Composition Characteristics | Park shape area (PA) | Park area (ha) |
| Park shape length (PP) | Park perimeter (m) | |
| Park LSI (LSI) | Park Shape Index (dimensionless) | |
| Park water rate (PW) | Proportion of water bodies in urban parks (%) | |
| Park green rate (PG) | Proportion of urban parks and green spaces (%) | |
| Park Mean NDVI (NDVI) | The average value of normalized vegetation index (dimensionless) | |
| External Environmental Factors of Urban Parks | Buffer Road density (BR) | Road network density within a 300 m buffer zone of urban parks (km/km2) |
| Buffer Building density (BB) | Building density within the 300 m buffer zone of the urban park (%) | |
| Buffer green rate (BG) | Green space ratio within a 300 m buffer zone of urban parks (%) |
Disclaimer/Publisher’s Note: The statements, opinions and data contained in all publications are solely those of the individual author(s) and contributor(s) and not of MDPI and/or the editor(s). MDPI and/or the editor(s) disclaim responsibility for any injury to people or property resulting from any ideas, methods, instructions or products referred to in the content. |
© 2025 by the authors. Licensee MDPI, Basel, Switzerland. This article is an open access article distributed under the terms and conditions of the Creative Commons Attribution (CC BY) license (https://creativecommons.org/licenses/by/4.0/).
Share and Cite
Zhang, T.; Zhang, J.; Yang, N.; Li, J.; Gao, Y.; Zhang, L.; Li, S. Cooling Effects of Urban Park Green Spaces in Downtown Qingdao. Sustainability 2025, 17, 4521. https://doi.org/10.3390/su17104521
Zhang T, Zhang J, Yang N, Li J, Gao Y, Zhang L, Li S. Cooling Effects of Urban Park Green Spaces in Downtown Qingdao. Sustainability. 2025; 17(10):4521. https://doi.org/10.3390/su17104521
Chicago/Turabian StyleZhang, Tianci, Jiacheng Zhang, Ning Yang, Jing Li, Ying Gao, Lebao Zhang, and Shimei Li. 2025. "Cooling Effects of Urban Park Green Spaces in Downtown Qingdao" Sustainability 17, no. 10: 4521. https://doi.org/10.3390/su17104521
APA StyleZhang, T., Zhang, J., Yang, N., Li, J., Gao, Y., Zhang, L., & Li, S. (2025). Cooling Effects of Urban Park Green Spaces in Downtown Qingdao. Sustainability, 17(10), 4521. https://doi.org/10.3390/su17104521