1. Introduction
Carbon taxation is one of the most effective market-based instruments for reducing carbon emissions, offering wide coverage, high efficiency in emission reduction, enhanced fairness, and flexible collection methods [
1]. By 2021, more than 30 countries and regions worldwide had implemented a carbon tax, while a carbon tax in China had been under consideration for a long time but had not yet been implemented. As the primary emission reduction mechanism currently adopted in China, the carbon emissions trading market can only cover 50% of the country’s carbon emissions. In addition, the European Commission officially put forward the Carbon Border Adjustment Mechanism (CBAM, also known as carbon tariffs), which came into effect on 1 October 2023 and would significantly impact the export of related goods from China [
2]. Therefore, the timely and judicious implementation of a carbon tax not only addresses the deficiencies of the carbon trading market but also represents an effective strategy through which China can proactively counter the (CBAM) and assert its influence in shaping international carbon tax regulations [
3]. A higher carbon tax rate generally leads to greater effectiveness in emission reduction but also exerts a more pronounced impact on the macroeconomy. The optimal carbon tax only considers carbon emission reduction; the suboptimal carbon tax balances efficiency and equity objectives, ensuring the achievement of emission reduction targets while minimizing adverse macroeconomic effects and addressing the regressive nature of such taxation. Therefore, it is crucial to identify and implement an optimal carbon tax rate, evaluating its dual effects on macroeconomic stability and emission reduction performance.
Currently, numerous studies on carbon taxes focus mainly on the following areas. Some studies focused on the implementation effect of carbon taxation. For example, many scholars argue that while the carbon tax significantly impacts reducing emissions, it also raises enterprise costs [
4,
5,
6] and exerts a notable inhibitory effect on GDP [
7,
8,
9,
10]. Carbon taxation policies may initially have a negative impact on GDP, while in the long term, they are expected to drive technological progress and transform the effect on GDP from negative to positive [
11,
12]. Some have mentioned that while a carbon tax can significantly reduce emissions, its impact on economic development is not readily discernible [
13]. However, implementing appropriate support systems may yield positive economic effects [
14]. In the study of social effects, most research has indicated that carbon taxes are regressive [
15,
16,
17,
18,
19,
20], with higher tax rates adversely affecting social welfare [
21,
22]; carbon taxes can disproportionately impact low- and middle-income groups [
23,
24], and governments can utilize transfer payments and other methods to mitigate the regressive effects of carbon taxes, thereby promoting fairness [
25,
26,
27]. Some studies also show that the regressive effects of carbon taxes are not significant, as certain countries or regions demonstrate neutral or even progressive effects [
28,
29,
30,
31,
32].
Secondly, researchers have studied carbon tax rates. In the study of uniform carbon tax rates, many scholars tend to favor them [
33,
34,
35,
36], as they believe they are easier to implement and more widely accepted [
37]. In the study of varied carbon tax rates, some contend that setting distinct carbon tax rates for different regions and industries is more appropriate than employing a uniform approach [
38,
39]. Some insist that implementing differentiated carbon tax rates tailored to regional areas can enhance the precision of emission reduction efforts [
40,
41], while others contend that sector-specific carbon taxes may be more effective in promoting CO
2 emission reductions [
42,
43]. In examining the optimal carbon tax rate, it is essential to consider achieving maximum reduction in carbon emissions, minimizing efficiency losses, and addressing social equity objectives [
26,
44]. Numerous scholars have focused on determining the optimal carbon tax rate [
45,
46,
47]. They argue that the optimal tax rate should maximize carbon reduction, minimize economic losses, and narrow income disparities [
48,
49]. Additionally, some advocate for dynamically adjusting the optimal carbon tax [
50,
51,
52].
The theoretical foundation of carbon tax is Pigou’s tax, which imposes a levy on polluters to increase their private marginal costs and internalize the external costs in the private sector, ultimately aligning private costs with social costs. The higher the carbon tax rate, the more effective the emission reduction; however, this can also lead to more significant loss of efficiency and regressive effects that are unfavorable to fairness. The optimal carbon tax is the tax level that maximizes the reduction of carbon emissions while minimizing economic distortions and welfare losses. When the marginal cost of emission reduction equals the marginal social benefit, society reaches an optimal state in terms of emission reduction, and the marginal cost of emission reduction at this point becomes the appropriate carbon tax rate. Although the optimal carbon tax is theoretically appealing, it faces numerous challenges in practice, such as inadequate information, dynamic changes, and policy feasibility. The suboptimal carbon tax rate refers to the tax level that aims for a suboptimal emission reduction effect under realistic constraints, including inadequate information, imperfect market competition, and policy feasibility. It is typically determined by balancing various factors when the optimal carbon tax rate cannot be fully implemented. The optimal carbon tax is often difficult to achieve, and the suboptimal carbon tax is more in line with the reality. The suboptimal carbon tax rate is more flexible and can be adjusted according to actual circumstances. In this study, the suboptimal carbon tax should balance emission reduction targets, efficiency goals, and fairness considerations [
53,
54,
55].
Though existing research has made some progress, there are still unresolved issues surrounding the carbon tax rate and its effects on macroeconomics and carbon reduction. In light of this, this paper extends upon the findings of previous scholars and compiles a Carbon Tax-adjusted Input–Output Table of China’s Non-competitive Carbon Emissions in 2020 (26 sectors). Then, a multi-objective suboptimal carbon tax model is constructed with carbon reduction and equity targets as objective functions and efficiency targets as constraint conditions. Finally, using the input–output price change model, the carbon tax rate under four different constraint conditions is simulated, and the impact of the carbon tax on macroeconomics and carbon emission reduction is measured.
The study is organized as follows. After this introduction section,
Section 2 introduces a theoretical analysis of the carbon tax.
Section 3 presents our methodology and materials.
Section 4 discusses the results.
Section 5 draws research conclusions.
2. Methods and Materials
The issue of carbon taxes is a matter of prices in nature. That is, in the production process, products are both forms of input and output. Hence, changes in the price of a product in one sector will have ripple effects on the prices of others among different sectors, reflecting intricate inter-dependencies, which can be calculated using an input–output model [
56]. Firstly, the input–output model captures the intrinsic relationships between sectors within the national economy and the various stages of the production process. It serves as a powerful tool for simulating the outcomes of different economic policies when key factors such as prices, labor remuneration, and taxes are treated as exogenous control variables [
56]. Secondly, the input–output model enables the quantification of how changes in value-added components—such as GDP and taxes—affect prices. It provides a comprehensive framework for analyzing the interconnections among value addition, production, and consumption from a macroeconomic perspective. In this study, we focus specifically on assessing the effects of varying carbon tax rates on sectoral product prices, sectoral GDP, and sectoral carbon emission reductions. The analysis is conducted using tools such as MATLAB 2021 and Excel 2019.
2.1. Preparation of a Non-Competitive Carbon Emission Input–Output Table
The intermediate and final use in the Non-competitive Carbon Emission Input–Output Table includes both domestic and imported goods. However, this study focuses exclusively on carbon emissions from domestic products. Consequently, the use of the Non-competitive Input–Output Table is essential in differentiating between domestic and imported goods.
By integrating China’s Non-competitive Input–Output Table 2020 with the data from the China Energy Statistical Yearbook 2021, a Carbon Tax-adjusted Input–Output Table of China’s Non-competitive Carbon Emissions 2020 (26 sectors) is constructed accordingly. Because the industry carbon emission data and the industry data in the non-competitive input–output table should be corresponding, some seriously affected sub-industries may be covered. It is determined that the energy sector comprises four industries: coal mining and dressing, petroleum and natural gas extraction, refined petroleum and nuclear fuel processing, and gas production and supply. These are the key sectors in energy production. In energy statistics, the production and supply of electricity and heating are often categorized as secondary energy sectors. The carbon emissions resulting from the use of secondary energy sources, such as electricity and heating, are classified as indirect carbon emissions. Therefore, the direct carbon emissions from each end-use sector for these products are considered zero. So, according to the prescribed research methodology, carbon emissions are not incorporated into the input–output table for the energy sector. The format of this table helps readers to distinguish the carbon emission input–output table from a standard input–output table, and it also emphasizes the presence of a carbon tax, which aids readers in comprehending the model presented in the article. However, due to the extensive amount of data, including detailed information within
Table S1 is not feasible.
Referring to
Table S1, it is evident that the net production tax after implementing a carbon tax equals the net production tax (denoted T) plus the carbon tax (denoted T*). Following the income approach for GDP calculation (i.e., value added in input–output tables), GDP can be expressed as GDP = wages + net production tax + depreciation of fixed assets + operating surplus. Consequently, the aggregate value added (i.e., the new GDP) after the imposition of a carbon tax can be calculated as wages + net production tax + carbon tax + depreciation of fixed assets + operating surplus. The total input following the implementation of a carbon tax equals the original total input plus the carbon tax. Similarly, the domestic final use in question is equivalent to the original domestic final use plus the carbon tax. Accordingly, the total output (after the implementation of a carbon tax) equals the original total output plus the carbon tax.
2.2. Analysis of Impacts of Carbon Taxation
The carbon tax rate is closely linked to the taxation basis. As CO
2 emissions serve as the foundation for carbon taxation, and the ecological impact caused by CO
2 emissions is directly proportional to their quantity rather than their value, the carbon tax is imposed on a per-unit basis or at a fixed rate [
56].
2.2.1. The Impact of Carbon Taxation on Prices
The conclusions are shown below, according to the Carbon Tax-adjusted Input–Output Table of China’s Non-competitive Carbon Emissions 2020.
The General Pricing Model before carbon taxation is [
56,
57,
58,
59]
The General Pricing Model after carbon taxation is
The Price Variation Model after carbon taxation is
The total Consumer Price Index after carbon taxation is
Any change in the consumer price index after carbon taxation is denoted as the inflation rate IR [
49], expressed as
where inflation rate =
CPI* − 1.
As the carbon tax rate increases, the price indexes of all sectors will rise, resulting in a total consumer price index exceeding one and heightened inflationary pressure. Consequently, it is imperative to control the inflation rate.
Referring to China’s inflation rates in recent years and the research findings of other scholars, we set α at 1.5%, 3%, 4.5%, and 6%.
In Equations (1)–(6), A is the direct consumption coefficient matrix for domestic products, AT the transpose of matrix A, and (I−A)−1 the Leontief inverse matrix; Av = vj/Xjj represents the coefficient of labor remuneration, as a row vector; Ad = dj/Xj represents the coefficient of fixed asset depreciation, as a row vector; As = sj/Xj represents the coefficient of operating surplus, as a row vector; At = tj/Xj represents the net production tax coefficient before carbon taxation, as a row vector; A*t = t*j/X*j represents the net production tax coefficient after carbon taxation, as a row vector; △At = (△at1, △at2, …, △atn)T represents the change in net production tax coefficient before and after carbon taxation, as a row vector; P = (p1, p2, …, pn)T represents the price of domestic products before carbon taxation, as a column vector; P* = (p*1, p*2, …, p*n)T represents the price of domestic products after carbon taxation, as a column vector; △Pt = (△Pt1, △Pt2, …, (△Ptn)T represents the change in product prices for each sector before and after carbon taxation, as a column vector; and P (a column vector) is the price before carbon taxation. P* (a column vector) is the price after carbon taxation, CPI the resident consumer price index before carbon taxation, CPI* the resident consumer price index after carbon taxation, YCP (a column vector) the final consumption demand of residents before carbon taxation, and Y*CP (a column vector) the final consumption demand of residents after carbon taxation.
2.2.2. The Impact of Carbon Taxation on Consumption
We assume that the share of consumption spending in GDP remains unchanged after the carbon tax is imposed, expressed as
Then, the pre-taxation GDP is
If considering inflation, then the post-taxation GDP is
Furthermore, the change in consumption spending after carbon taxation is
Drawing on the research methods and hypothesis of Yang Chao and other scholars [
49], this paper posits that there will be a reduction in consumption expenditure following the implementation of carbon taxation. However, given the current government’s emphasis on stimulating domestic demand to drive economic growth, it is imperative to minimise the magnitude of change in consumption expenditure, expressed as
In Equations (7)–(12), IT = (1, 1, …, 1) is an n-order row vector, GDP (a row vector) is the gross domestic product before carbon taxation, GDP* (a row vector) the gross domestic product after carbon taxation, GDP*′ (a row vector) the gross domestic product adjusted for inflation after carbon taxation, YCP (a column vector) the final consumption demand of residents before carbon taxation, Y*CP (a column vector) the final consumption demand of residents after carbon taxation, ′ (a column vector) the consumption expenditure after carbon taxation with inflation considered, and △′ (a column vector) the rate of change in actual consumption expenditures after carbon taxation.
2.2.3. The Impact of Carbon Taxation on CO2 Emission Reduction
Assuming that carbon emission intensity remains unchanged before and after the imposition of a carbon tax, carbon emission per unit GDP remains unchanged before and after carbon taxation (see Equation (13)), as follows.
When inflation is considered, the change rate of CO
2 after carbon taxation is
In Equations (13) and (14), CO2 (a column vector) represents the CO2 emissions before carbon taxation, (CO2)* (a column vector) the CO2 emissions after carbon taxation, (CO2)*′ (a column vector) the CO2 emissions after carbon taxation with inflation considered, and (∆CO2)*′ (a column vector) the rate of change in CO2 emissions after carbon taxation with inflation considered.
The objective of carbon taxation is to achieve rapid reduction of carbon emissions. Therefore, this paper’s objective is to maximize the rate of change in CO
2 emissions (absolute value) (see Equation (15)), as follows.
2.2.4. The Impact of Carbon Taxation on GDP
By integrating Equations (8)–(10) and the impact of inflation, we obtain the change in GDP after carbon taxation:
In Equation (16), I = (1, 1, …, 1)T is a column vector, and GDP (a row vector) is the gross domestic product before carbon taxation. Additionally, by taking into account inflation (a column vector), GDP* (a column vector) represents the domestic product after carbon taxation, and (ΔGDP)* (a column vector) denotes the change rate of GDP after carbon taxation.
If we do not consider carbon trading and other factors, the GDP of all sectors will decrease when the carbon tax is levied, reducing the total GDP. However, reducing emissions through carbon taxation cannot come at the expense of a significant decline in GDP. Therefore, the change rate of GDP (ΔGDP*) after the carbon tax is imposed should satisfy the following constraint conditions:
Concerning the research results of Yang Chao et al. [
48], we herein set
β at 0.5%, 1%, 1.5% and 2%.
2.2.5. Construction of the Suboptimal Carbon Tax Rate
Equation (18) shows that after a carbon tax is imposed, the objective function is to maximize the absolute value of the change in carbon emissions, and the impact of the carbon tax on consumption should be minimized.
Based on the inflation rate, we divided four sets of constraints: low inflation, low-to-medium inflation, medium to high inflation, and high inflation. Their definitions are as follows in
Table 1.
2.3. Data Source
Given the data availability, the CO
2 emissions in this study only account for those generated from fossil fuel consumption across various sectors, excluding emissions from other greenhouse gases. Moreover, the input–output data utilized herein are sourced from China’s Non-competitive Input–Output Table 2020, and the carbon emission data are derived from the China Carbon Emission Database (CEAD) [
60].
3. Result
3.1. Determination of the Suboptimal Carbon Tax Rate
According to Equations (3), (5), (6), (11) and (16)–(18), we can calculate the carbon tax rate under four different sets of constraints (see
Table 2).
As shown in
Table 2, under the first set of constraints, i.e., with the constraint that the total inflation rate is less than 1.5% and the GDP decline rate is less than 0.5%, the carbon tax rate is CNY 49.2 per ton of CO
2, the inflation rate is 1.4972%, the change in total consumption expenditure is −0.2782%, the change in total carbon emissions is −2.4275%, and the change in total GDP is −0.4884%.
Under the second set of constraints, i.e., with the constraint that the total inflation rate is less than 3% and the GDP decline rate is less than 1%, the carbon tax rate is CNY 98.3 per ton of CO2, the inflation rate is 2.9985%, the change in total consumption expenditure is −0.5402%, the change in total carbon emissions is −4.5314%, and the change in total GDP is −0.9435%.
Under the third set of constraints, i.e., with the constraint that the total inflation rate is less than 4.5% and the GDP decline rate is less than 1.5%, the carbon tax rate is CNY 147.1 per ton of CO2, the inflation rate is 4.4972%, the change in total consumption expenditure is −0.7871%, the change in total carbon emissions is −6.3669%, and the change in total GDP is −1.3682%.
Under the fourth set of constraints, i.e., with the constraint that the total inflation rate is less than 6% and the GDP decline rate is less than 2%, the carbon tax rate is CNY 195.5 per ton of CO2, the inflation rate is 5.9893%, the change in total consumption expenditure is −1.0205%, the change in total carbon emissions is −7.9803%, and the change in total GDP is −1.7655%.
3.2. The Impact of the Suboptimal Carbon Tax Rate on the Macroeconomy and Carbon Emission Reduction
3.2.1. The Impact of a Suboptimal Carbon Tax on Sectors’ Prices
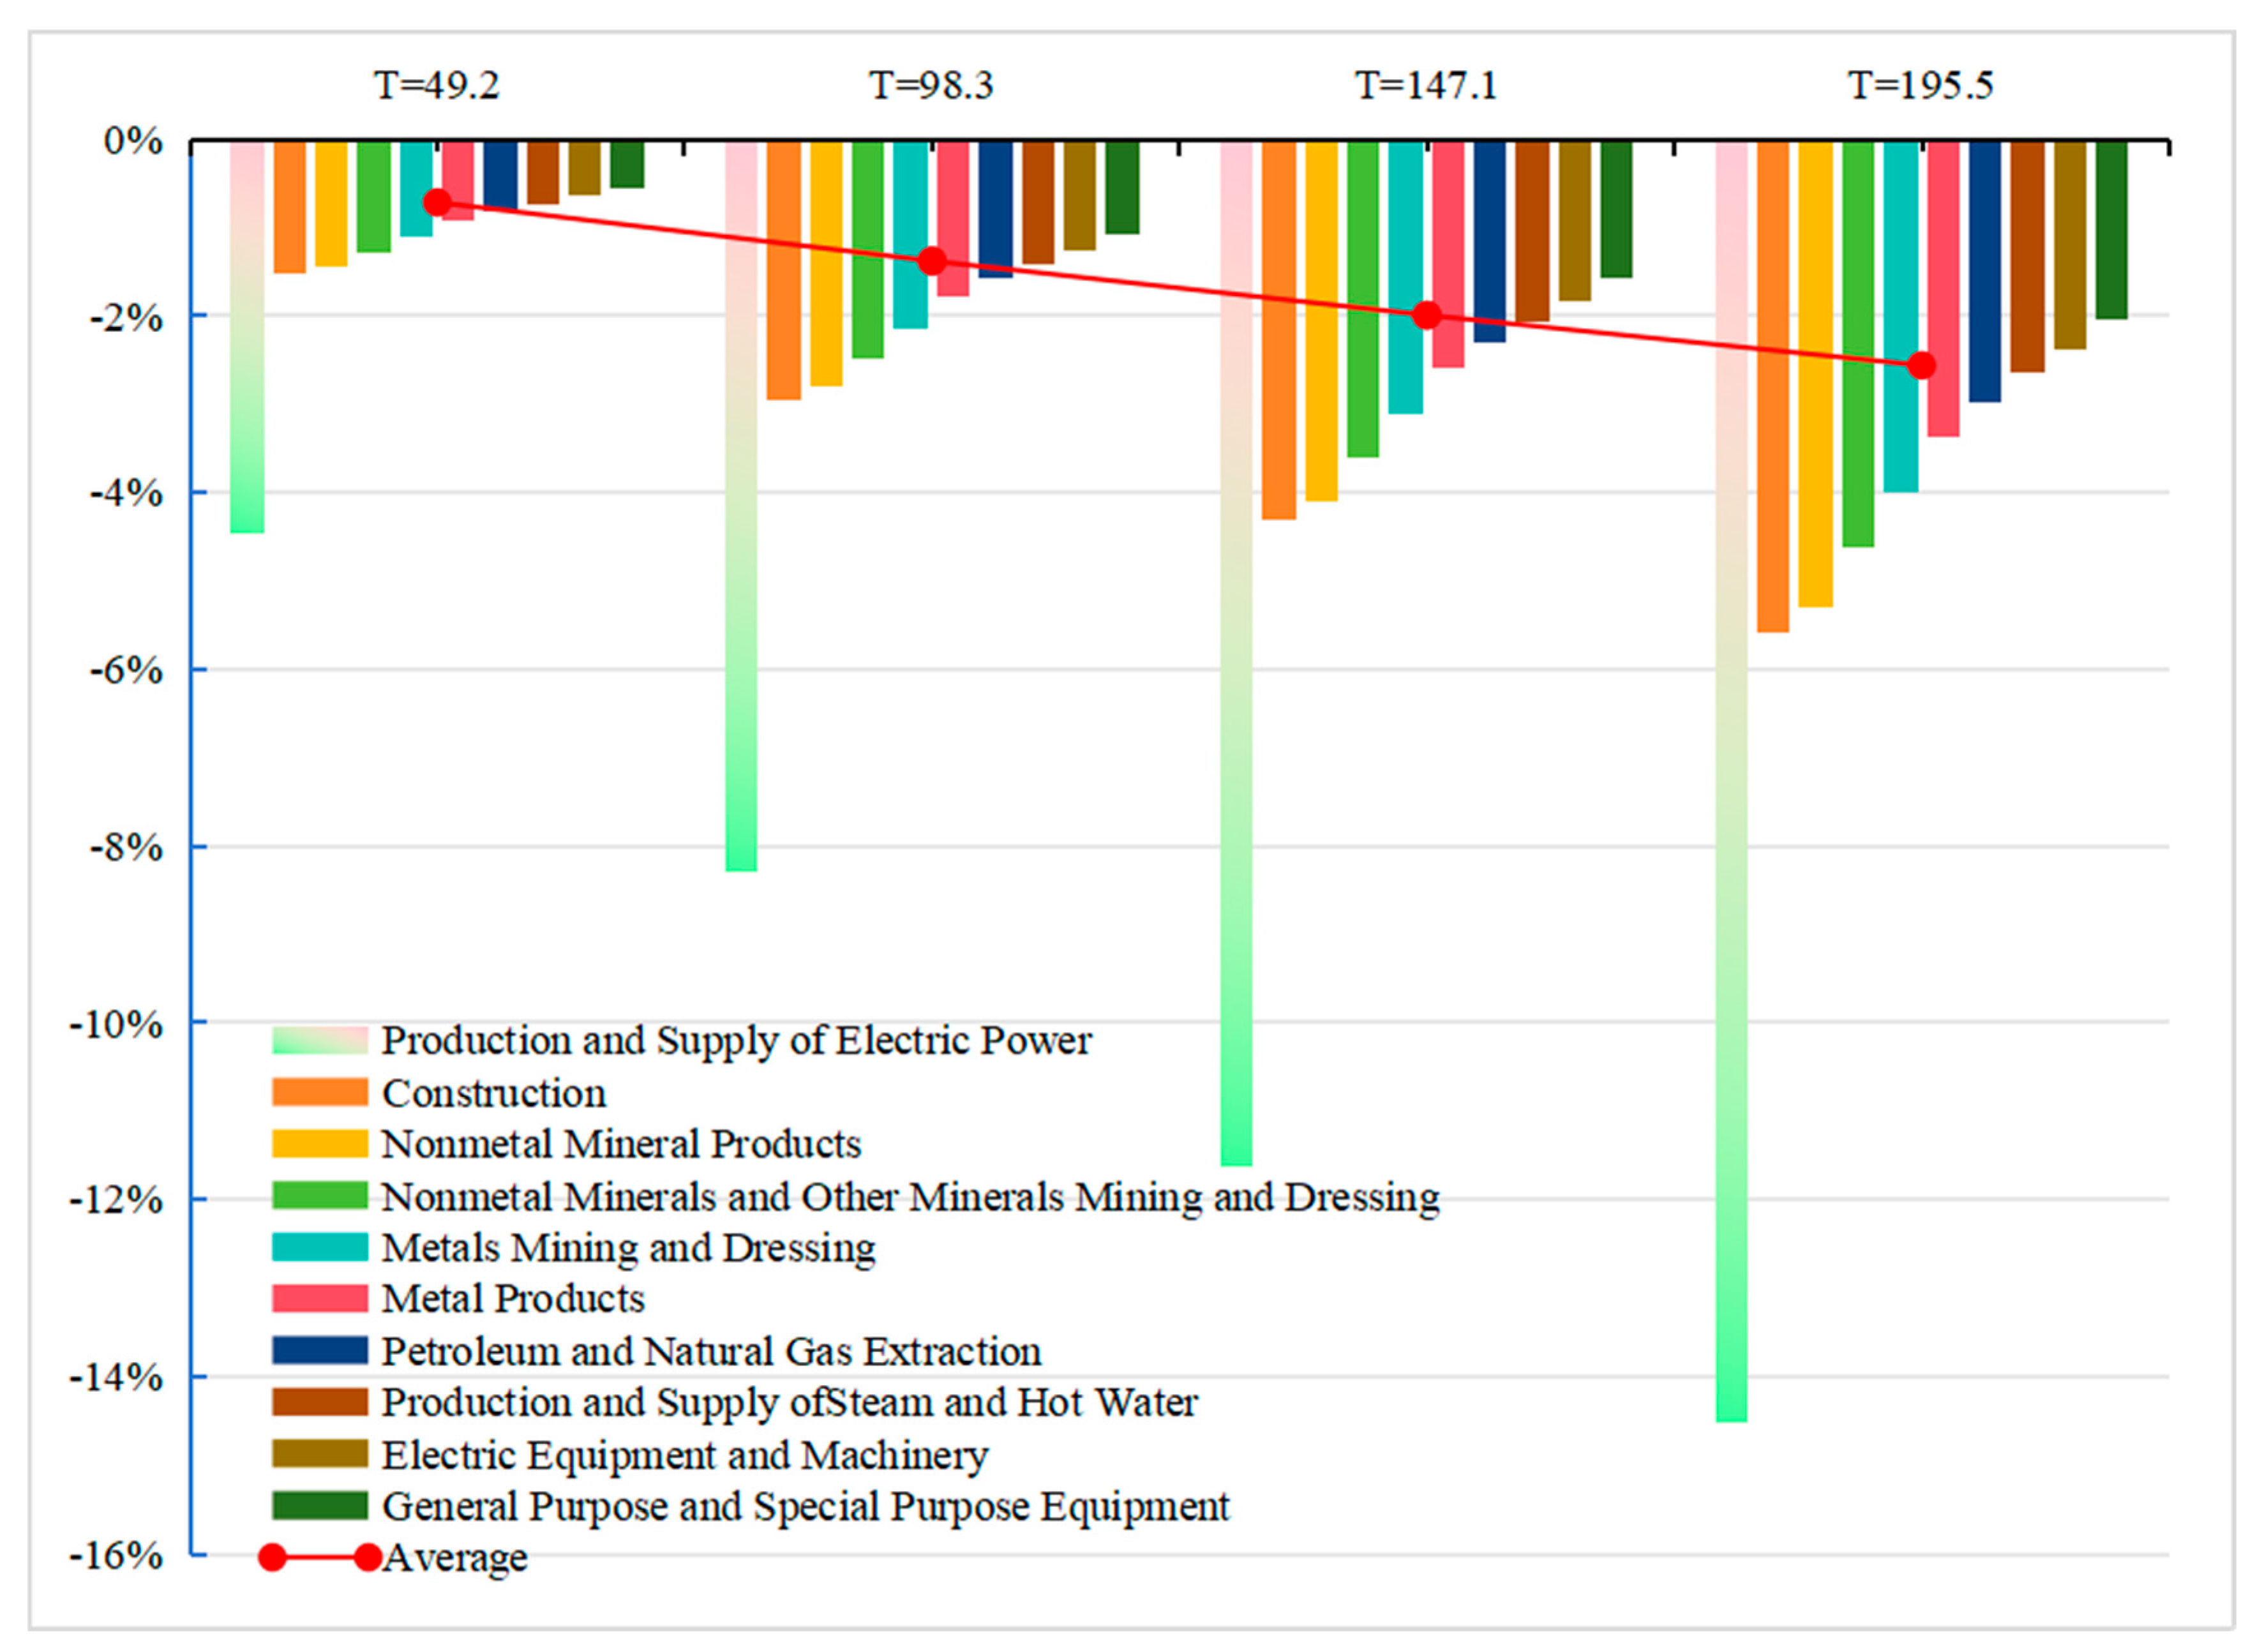
According to Equation (3), we used EXCEL and MATLAB software to calculate the impact of four different carbon tax rates on the prices of 26 sectors, separately, as well as their average impact on prices, among which we identify the top 10 sectors with the most significant impact (shown in
Figure 1). In
Figure 1, the horizontal axis represents the four carbon tax rates, and the vertical axis represents the percentage change in sector prices.
Through simulations under various constraint conditions, it is evident that the carbon tax exerts the most significant influence on prices within the electricity, heating and power production and supply sectors, followed by the metal smelting and rolling processing sectors, with the non-metallic mineral products sector exhibiting a comparatively smaller impact. As shown in
Figure 1, among the top 10 sectors experiencing price changes after carbon taxation, 9 belong to heavy industries within the secondary industry domain, which aligns with China’s current stage of heavy chemical industrialization. However, the impact of carbon taxation on prices within primary and tertiary industries remains relatively modest.
After imposing a carbon tax, consumers’ prices will rise, and producers’ production costs will also go up. Increasing production costs will cause cost-push inflation, causing prices in all sectors to rise to varying degrees. In a nutshell, the higher the carbon tax rate, the more significant the impact on prices.
3.2.2. The Impact of a Suboptimal Carbon Tax on Carbon Emission Reduction in Different Sectors
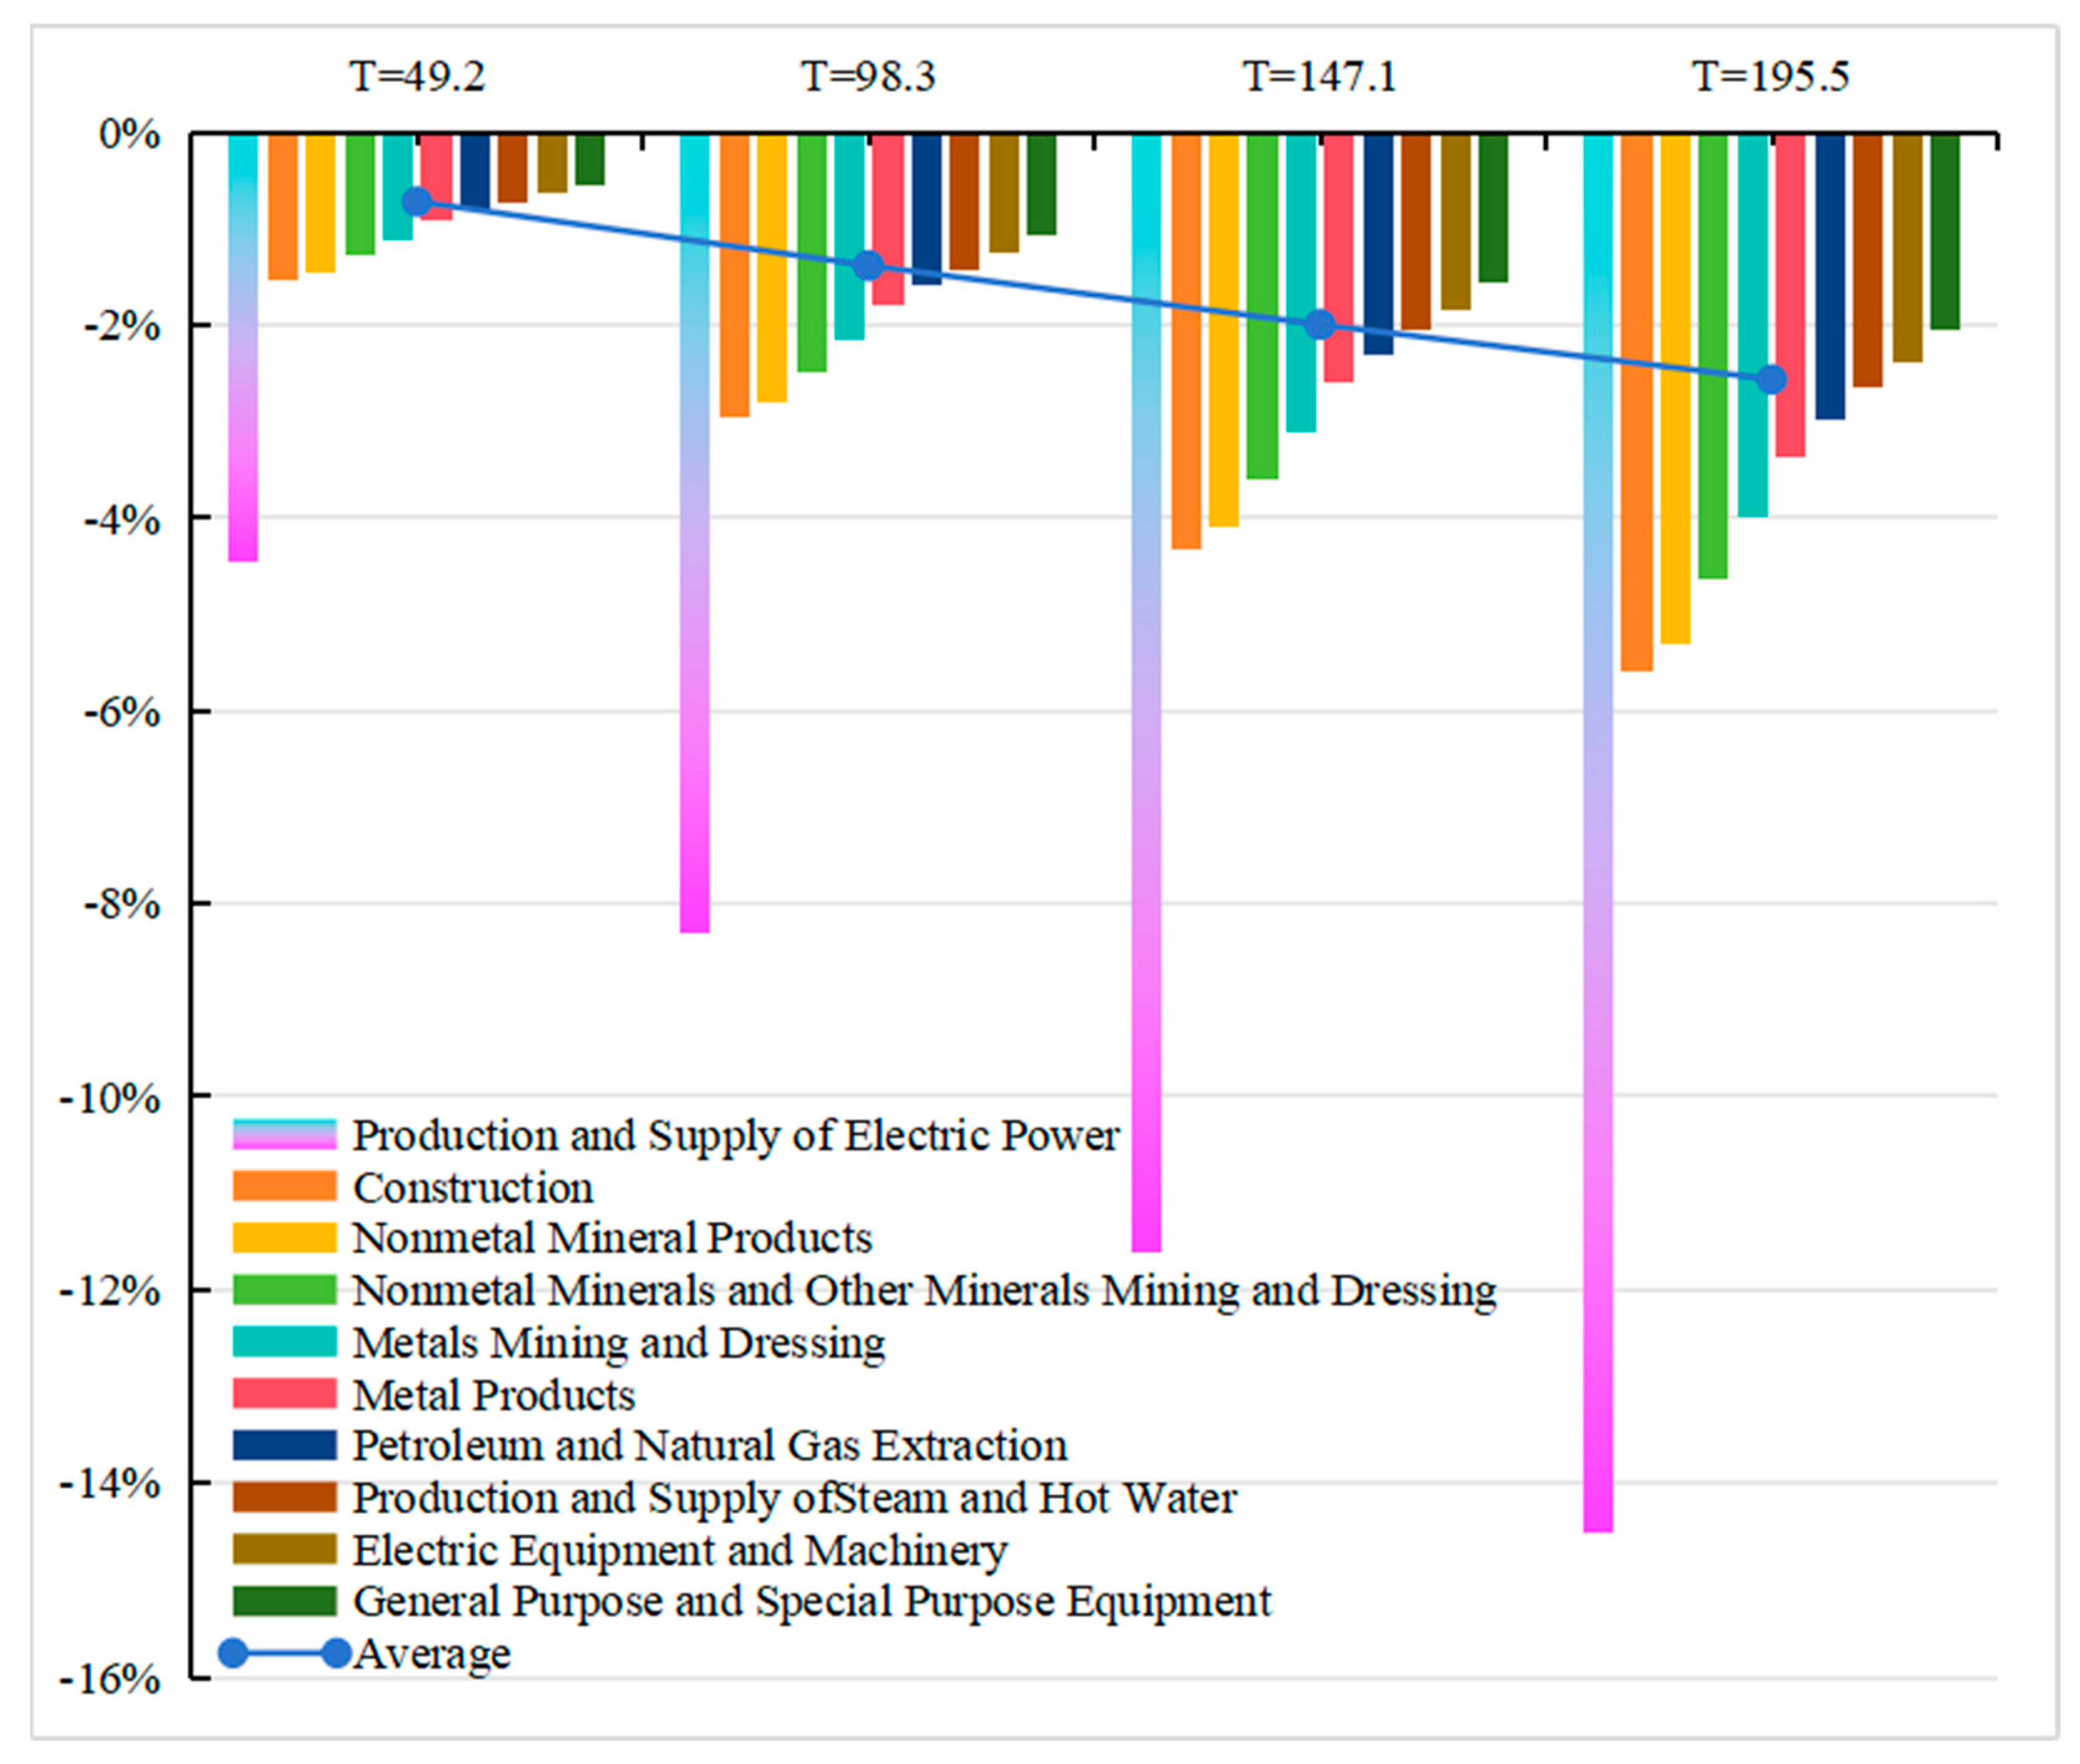
Using Excel and MATLAB software, the impact of four carbon tax rates on carbon emissions from 26 sectors can be calculated based on Equations (13) and (14). The average impact on carbon emissions can also be determined.
Figure 2 illustrates the top 10 sectors with the most significant impact, where the horizontal axis represents different carbon tax rates and the vertical axis represents the change rate of carbon emissions across various sectors.
Through simulations under various constraint conditions, it is determined that the carbon tax policy exerts the most significant influence on reducing carbon emissions in the electricity, heating, and power supply sectors, followed by the building sector and, subsequently, the non-metallic mineral products sector. Among the top 10 sectors with the most significant impact on carbon emissions after carbon taxation, 9 belong to heavy industries in the secondary industry, reflecting China’s current stage of heavy chemical industrialization. In contrast, carbon tax policy has a comparatively more minor effect on carbon emissions in both primary and tertiary industries.
From the perspective of effects on income, for producers, the production possibility curve shifts inward as production decreases, inevitably leading to a reduction in carbon emissions. For consumers, assuming a constant budget income, the quantity of goods purchased will decline, thereby lowering carbon emissions. From the perspective of the substitution effect, producers are likely to engage in technological innovation, improve energy efficiency, reduce reliance on high-carbon energy as a production factor, and seek alternative energy sources, thereby increasing the substitution of capital and labor for energy inputs. Simultaneously, consumers will inevitably reduce their consumption of high-carbon products as producers decrease the production of such goods. Consequently, the combined income and substitution effects across all sectors will lead to an overall reduction in carbon emissions.
3.2.3. The Impact of the Suboptimal Carbon Tax on Sectors’ GDP
Using Excel and MATLAB software, the impact of four carbon tax rates on the GDP of 26 sectors and the average GDP can be calculated based on Equations (13)–(16).
Figure 3 illustrates the top 10 sectors with the most significant impact, where the horizontal axis represents different carbon tax rates, and the vertical axis represents the change rate of GDP for each sector.
By simulating the carbon tax rate under different constraint conditions, it is evident that the sector with the most significant impact on GDP resulting from implementing a carbon tax is electricity, heating, and supply, followed by the construction sector and then the non-metallic mineral products sector. Among the top 10 sectors with the most significant impact on GDP due to carbon taxation, 9 belong to heavy industries in the secondary industry, reflecting China’s current stage of heavy industrialization. In contrast, the influence of the carbon tax on GDP in primary and tertiary industries is relatively limited.
When a carbon tax is implemented, the GDP in 26 sectors experiences varying degrees of decline. Producers face increased production costs as energy becomes more expensive due to the tax burden shift, causing a reduction in production reflected by an inward shift of the production possibility curve. Similarly, consumers will encounter higher prices due to the tax burden shift, leading to decreased demand. As a result of reduced production and consumption, GDP is inevitably expected to decrease.
4. Policy Recommendations
China must implement a carbon tax to achieve its dual carbon goals and effectively address the CBAM. This paper presents an analysis of the Chinese non-competitive carbon emissions input–output table for 26 sectors in 2020 following the imposition of the carbon tax and develops a multi-objective suboptimal carbon tax model using the input–output price change model. Furthermore, it simulates the carbon tax rate under four different sets of constraint conditions, with empirical results indicating that designing a suboptimal carbon tax should take into account its impact on prices, carbon reduction, and GDP and that higher carbon tax rates lead to more significant macroeconomic impacts and increased efforts to reduce emissions.
We propose recommendations in the following areas to formulate a more scientifically grounded carbon tax policy.
4.1. Launching a Comprehensive Research Program and Roadmap for Carbon Tax Implementation
It is recommended that the Ministry of Finance, the State Taxation Administration, and other relevant departments collaborate to study and implement our carbon tax system expeditiously. According to the implementation time of the European Union’s carbon tariff, China should officially impose a carbon tax in 2026, only for some industries, including steel, cement, electricity, fertilizer, aluminum and hydrogen. Therefore, a carbon tax should be integrated into the environmental protection tax as a taxable item, with regional variations in taxation basis, tax rate establishment, and tax collection methods. High-emission activities should incur higher carbon taxes, while low-emission activities should face lower rates, with ongoing adjustments to the tax rates. Additionally, tax rebates should be introduced to support innovation in low-carbon technologies. Following the achievement of our 2030 carbon peak target, consideration can be given to establishing a standalone carbon tax. We should levy a carbon tax across all industries while implementing differentiated carbon tax rates and tax rebates, with the rebated tax revenue being used for low-carbon technological innovation. We also need to develop a flexible and fair tax system.
4.2. Designing the Suboptimal Carbon Tax Framework
It is strongly recommended that we design a suboptimal carbon tax that effectively balances emission reduction, efficiency, and equity goals; implement varying tax rates for high-emission and low-emission industries, establishing differentiated carbon tax rates for different sectors and adjusting them dynamically; develop a precise carbon emissions accounting system to ensure transparency and fairness in the calculation of the carbon tax base; continuously monitor the implementation effects of the carbon tax; and regularly evaluate its impact. Also, we need to explore the integration of carbon tax and ecological compensation mechanisms. For instance, carbon tax revenues should be allocated to supporting ecological compensation projects, such as forest conservation, wetland restoration, and biodiversity protection. By integrating carbon tax with ecological compensation, it is possible to not only enhance carbon sequestration capacity but also promote the sustainable development of ecologically fragile regions.
4.3. Establishing a Synergistic and Complementary Mechanism Between Carbon Taxation and Carbon Trading
China should clarify carbon tax and trading objectives, achieve complementary coverage, and establish a comprehensive mechanism for reducing carbon emissions. An appropriate carbon tax rate and initial quota price for the carbon trading market are necessary to create synergy between pricing mechanisms and leverage the role of carbon tax in stabilizing carbon prices. Additionally, China needs to learn from the EUETS (European Union Emissions Trading System) and Canada’s integrated carbon tax and carbon trading model, thereby exploring cross-border cooperation mechanisms in the carbon market. Since carbon trading currently covers only 50% of carbon emissions, for enterprises not participating in carbon trading, a carbon tax could be considered, followed by a tax rebate mechanism. The returned tax revenue would be allocated specifically to funding low-carbon technological innovations.
4.4. Design a Suboptimal and Dynamic Carbon Tax
We strongly recommend designing a carbon tax that balances emission reduction, efficiency, and equity. Sector-specific and dynamic rates should be introduced. A precise carbon emissions accounting system should be developed to ensure transparency and fairness when calculating the tax base. Continuous monitoring of the tax’s implementation and regular evaluation of its impact are essential. China should also draw on the successful experiences and lessons of countries with established carbon taxes to refine its policy.
5. Conclusions
This paper, based on other scholars’ research, compiles the Carbon Tax-adjusted Input–Output Table of China’s Non-competitive Carbon Emissions in 2020 (26 sectors) to achieve the goals of carbon emission reduction and fairness as the objective functions and efficiency as the constraint condition; it also constructs a multi-objective suboptimal carbon tax model. By using the input–output price change model, the paper calculates the carbon tax rates under four different constraint conditions—namely, 49.2 CNY/ton, 98.3 CNY/ton, 147.1 CNY/ton, and 195.5 CNY/ton (of CO2)—and also evaluates the impact of the carbon tax on the macroeconomy and carbon emission reduction, which may provide a basis for China’s governmental departments when they are formulating carbon tax policies. The conclusions drawn from this research are summarized as follows.
Firstly, regarding the impact of the carbon tax on prices, as the carbon tax rate increases, prices in 26 sectors experience varying degrees of escalation, with the most significant increase observed in the electricity, heating, and supply sectors, followed by the metal smelting and rolling/processing products sector and then the non-metallic mineral products sector.
Secondly, regarding the impact of the carbon tax on the macroeconomy, with an increase in the carbon tax rate, the GDP of 26 sectors experiences varying degrees of decline. The most significant decline is observed in the electricity, heat, and power production and supply sectors, followed by the construction and non-metallic mineral products sectors.
Thirdly, regarding the impact of the carbon tax on carbon emission reduction, with an increase in the carbon tax rate, there are varying degrees of decline in carbon emissions across all 26 sectors. The most significant reduction occurs in the electricity, heating, and supply sectors, followed by the construction and non-metallic mineral products sectors.
Based on the research findings of this paper, considering the impact of the carbon tax on inflation and GDP as well as the pressure caused by the current economic downturn, it is recommended that a low tax rate should be implemented with a dynamic adjustment mechanism if imposing a carbon tax.
The introduction of the EU Carbon Border Adjustment Mechanism on 1 October 2023 implies that China needs to harmonize its carbon pricing with international standards in the future. Implementing carbon taxation is an effective strategy through which China can address the EU Carbon Border Adjustment Mechanism.


 ,
, 

