1. Introduction
Reservoirs are essential hydraulic engineering structures for the utilization and management of water resources. However, their construction alters the natural flow dynamics and spatial distribution of river runoff, which can lead to adverse ecological impacts. While facilitating the benefits of water resource use, reservoirs can mitigate their negative effects on river ecosystems through well-designed ecological operation. From an engineering perspective, key elements of the ecological operation of reservoirs include ensuring ecological water requirements, implementing ecological water replenishment, improving river water quality, regulating the water–sediment process, supporting fish reproduction, and mitigating the impact of reservoir water temperature [
1,
2,
3,
4]. Among these, the most notable and representative are ecological operations aimed at supporting fish reproduction. Ecological operation experiments have been conducted in reservoirs such as the Gavins Point Reservoir on the Mississippi River (USA), the Glen Canyon Reservoir on the Colorado River, the Pindari Reservoir on the Severn River (Australia), and the Three Gorges Reservoir (TGR) in China using artificial flood pulses to stimulate fish spawning [
5,
6,
7,
8].
However, in addition to being influenced by hydrological rhythms, water temperature is also a critical ecological factor that affects various life processes of fish [
9]. Preece et al. found that low water temperatures can reduce the spawning success rate of fish downstream [
10]. Therefore, to ensure the success of fish reproduction stimulation, it is essential to consider water temperature requirements when selecting the timing of ecological operations. Taking the ecological operation practice in the Yangtze River Basin of China as an example, since 2011, the Three Gorges Reservoir has undergone annual ecological operation trials for three to seven days during May–June for over ten consecutive years. By creating artificial flood pulses at opportune moments, the operation aims to stimulate the natural spawning of drifting egg fish species, particularly the “Four Major Chinese Carps” (
Mylopharyngodon piceus,
Ctenopharyngodon idella,
Hypophthalmichthys molitrix, and
Aristichthys nobilis), and large-scale spawning activities have been observed simultaneously in the Yidu spawning grounds [
7]. At the same time, the selection of ecological operation timing is crucial for the operation’s effect. For example, in 2013, the initial water temperature of the ecological operation of TGR was lower than 18 °C, which did not reach the water temperature range suitable for fish reproduction, and the ecological operation’s effect was not ideal [
11]. In addition, reservoirs often undertake multiple tasks, such as flood control, power generation, water supply, and shipping, while undergoing ecological operations. Predicting future water temperature changes in advance helps to reasonably plan the ecological operation window period and coordinate the balance between ecological benefits and economic benefits. Therefore, it is necessary to develop a model with long-term water temperature prediction ability to assist in the selection of ecological operation timing.
At present, there are three main methods for river water temperature prediction. The first category is statistical analysis, which establishes correlations between predictor and target variables [
12,
13,
14]. These methods are computationally simple but have limited prediction accuracy due to their inability to handle complex nonlinear relationships involving multiple predictor variables. The second category is numerical simulation, which involves creating mathematical models to predict the target variable [
15,
16]. These methods offer high computational accuracy and a clear physical basis, enabling precise descriptions of the target variable’s variation patterns. Prediction time series can be accurate to the hour or even the minute. However, they require extensive hydrological and meteorological data and involve complex computations. The third category is machine learning algorithms [
17,
18,
19], which learn from observed data through network models. These methods can capture the complex relationships between multiple predictor variables and the target variable. They offer high prediction accuracy and fast computation speed and can be applied in real time in reservoir operation systems. Zhang et al. [
19] used machine learning algorithms such as backpropagation (BP) neural networks, support vector regression (SVR), and long short-term memory (LSTM) to predict the discharge water temperature process of large reservoirs. The results showed that the LSTM algorithm effectively captured the nonlinear and long-term dependencies between discharge water temperature and its influencing factors, enabling accurate prediction of the reservoir discharge water temperature process [
19]. Taking the Tunga Bhadra River as an example, Rajesh et al. [
20] used machine learning models such as ridge regression (RR), K-nearest neighbors (KNN) regressor, random forest (RF) regressors, and SVR to predict changes in water temperature at the next time step. They used relevant factors such as water temperature and air temperature from the previous time step as input variables and predicted the changes in water temperature at daily, monthly, and seasonal scales [
20]. Huang et al. used an LSTM neural network to simulate the monthly river temperature of the Dongting Lake Basin, China [
21]. It can be seen that current machine learning-based water temperature prediction models are mostly applied to short-term daily or monthly average temperature forecasting. However, ecological operation generally spans three to seven days, and the formulation and approval of an ecological operation scheme takes longer. As a result, existing water temperature prediction models struggle to provide scientific support for selection of the optimal timing for ecological operation.
In summary, given the advantages of machine learning algorithms in quickly simulating complex nonlinear problems, this study takes water temperature prediction in the Yidu spawning grounds downstream of TGR as a case study. The goal was to explore the application of machine learning algorithms to develop a long-term water temperature forecasting model, providing methodological support for selecting optimal ecological operation timing.
2. Study Area and Data
2.1. Study Area
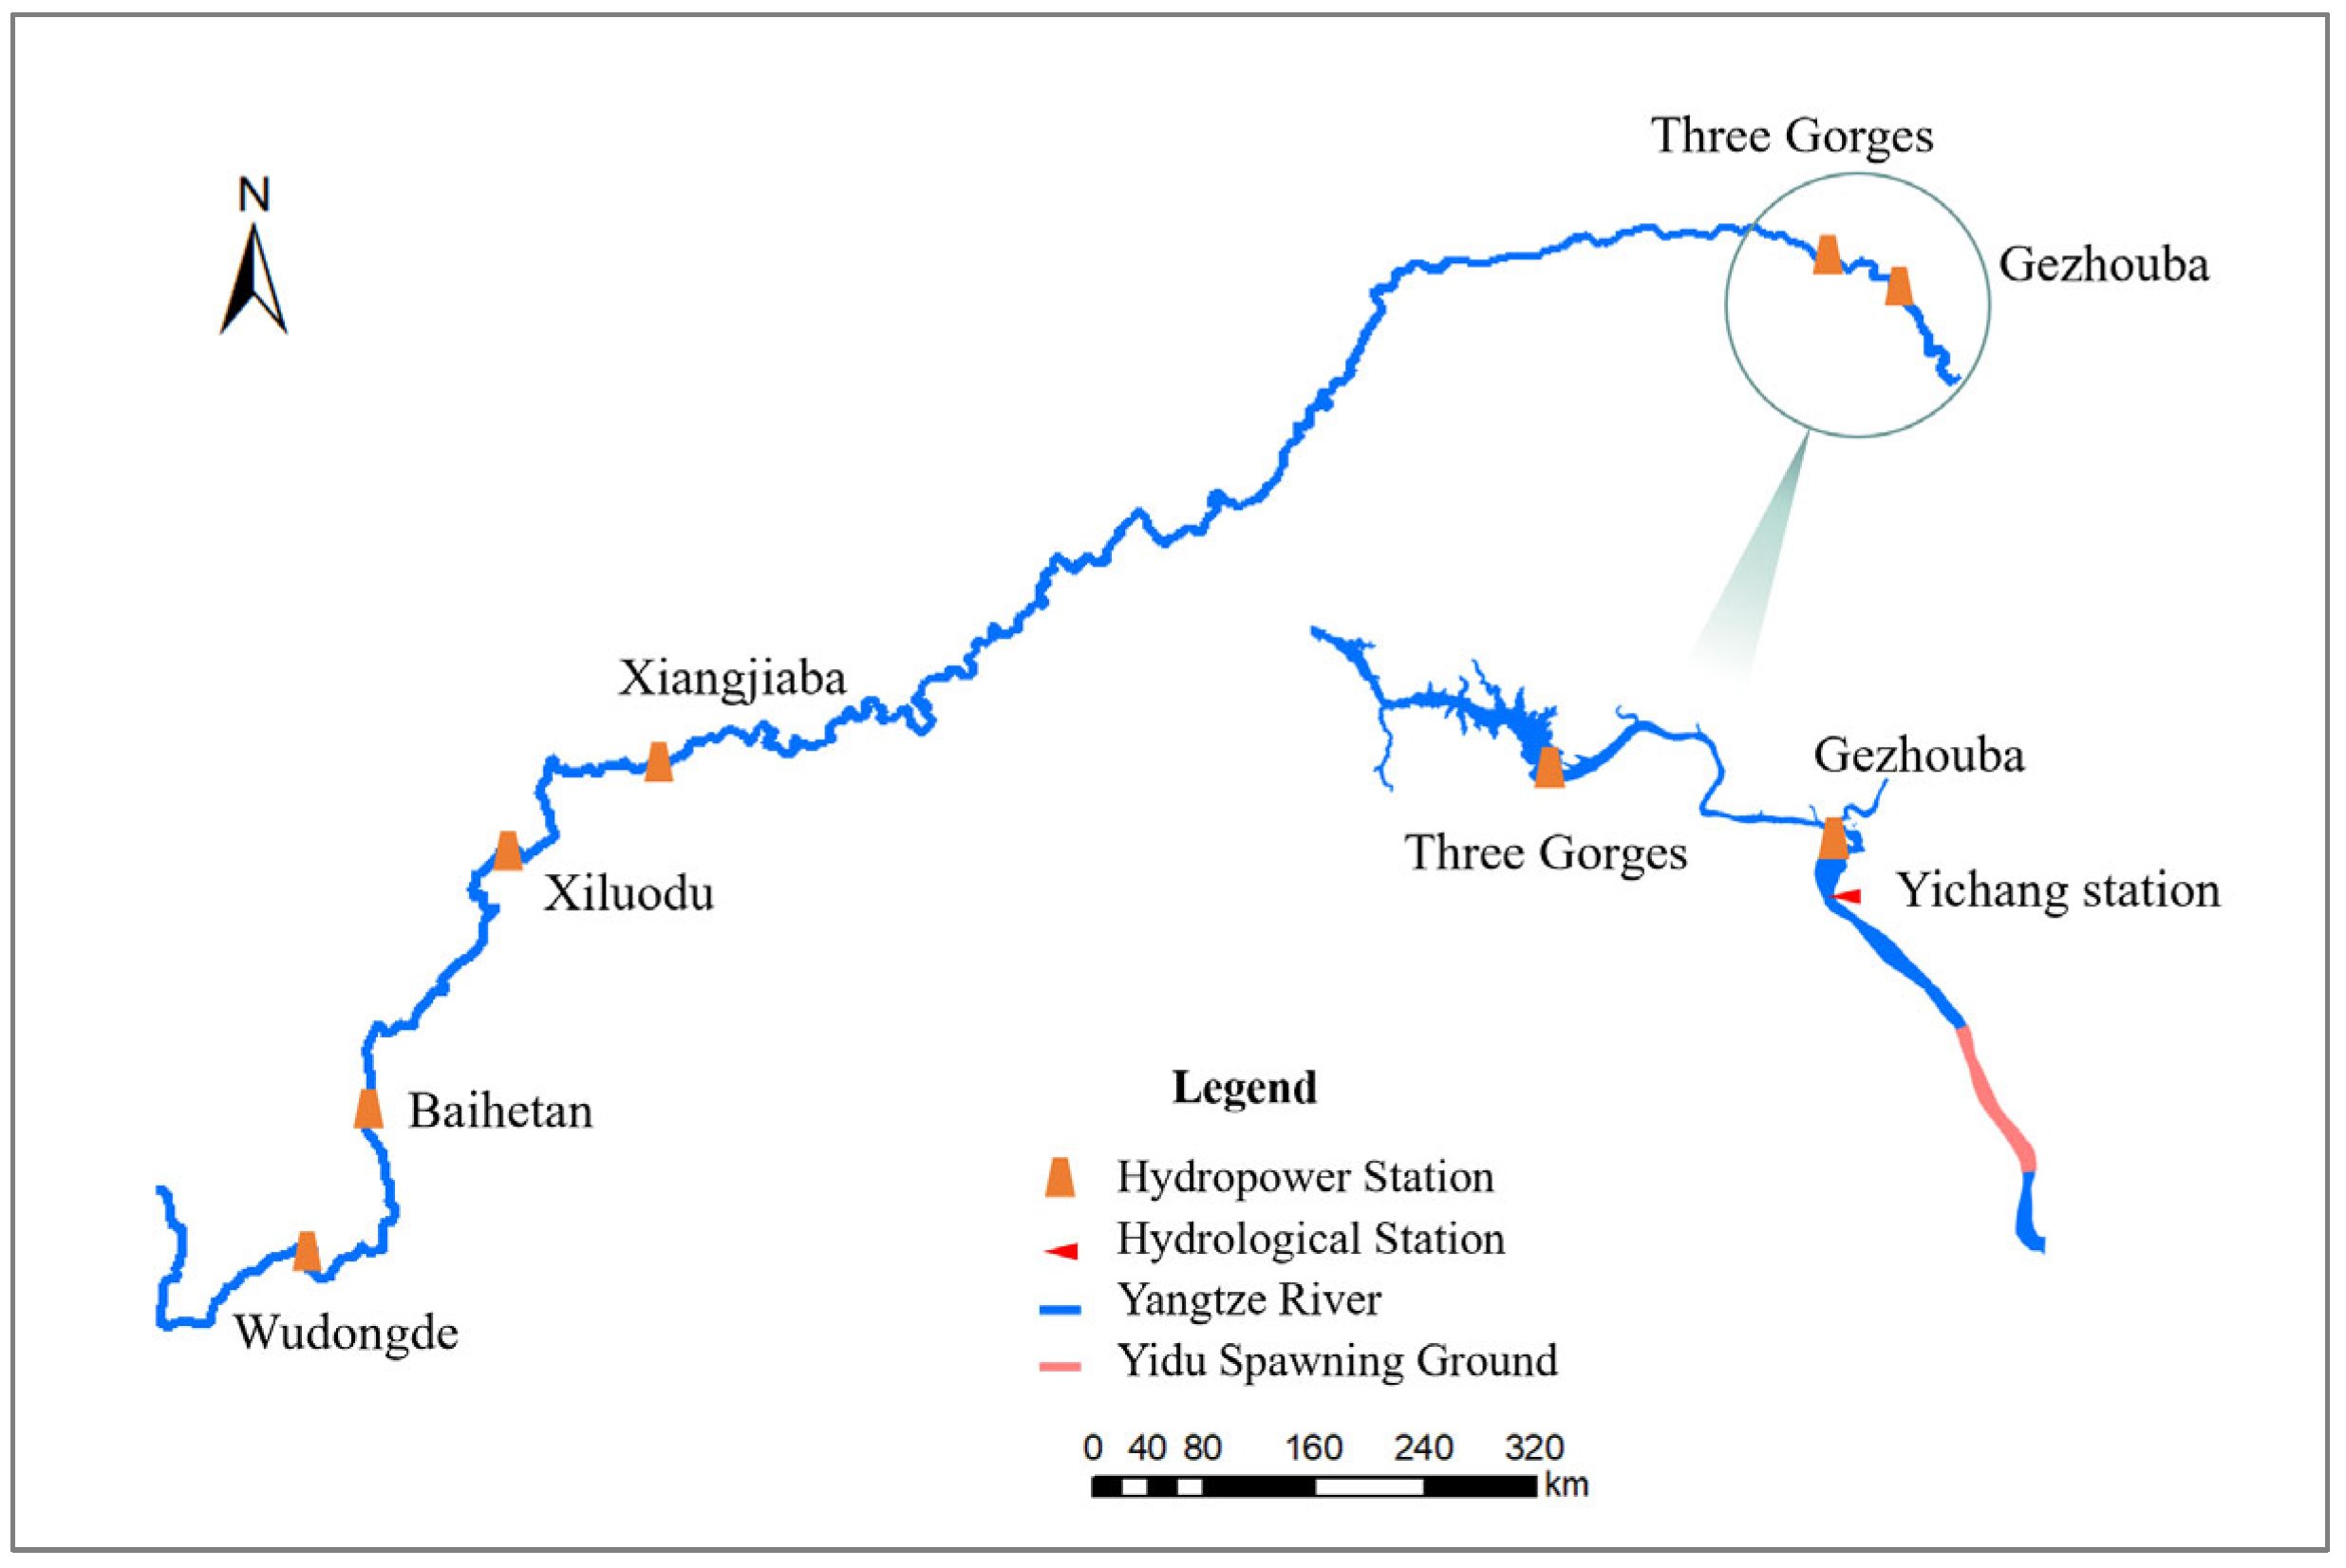
The Yangtze River is the largest river in Asia and China and supports a rich diversity of fish species. The Yangtze River Basin is home to 378 fish species, making it the most biodiverse river system in China. Additionally, the basin is rich in hydropower resources. With the development of the Yangtze River Economic Belt, hydropower development along the river has accelerated. Hydropower projects such as Xiangjiaba, Xiluodu, Wudongde, and Baihetan have been completed in the upper reaches, while the Three Gorges and Gezhouba dams are located in the middle reaches. These projects collectively form the world’s largest clean energy corridor in the Yangtze River Basin. Among them, TGR, located in the upper reaches, is the control reservoir for the middle reaches and the largest hydropower project in the world. The dam stands 185 m tall, with a water storage level of 175 m, a total reservoir capacity of 39.3 billion m3, and an installed capacity of 22.5 million kW. The Gezhouba Reservoir, a run-of-river hydropower station located approximately 38 km downstream, serves as the counter-regulation reservoir for the Three Gorges and is the final reservoir in the cascade of hydropower stations along the upper and middle reaches. The Gezhouba dam has a maximum height of 47 m, a total reservoir capacity of 1.58 billion m3, and an installed capacity of 2.715 million kW.
Downstream of the Gezhouba Reservoir lies the Yidu spawning grounds, the largest spawning area for the four major Chinese carps along the main stream of the Yangtze River, spanning approximately 24 km [
22]. Yichang Hydrological Station, located approximately 44 km downstream of the Three Gorges Project and 6 km downstream of the Gezhouba Project (
Figure 1), serves as the designed representative station for both projects and the overall outflow control station for the Three Gorges Project. It is also the representative station for the hydrological and water temperature conditions of the Yidu spawning grounds.
2.2. Data Analysis
In machine learning models, data play a crucial role in model training [
23], which can be observed in three main aspects. First, the amount of data: the training effectiveness of a model is generally positively correlated with the volume of data. As the data volume increases, the model is exposed to more samples and feature combinations, enabling it to capture the underlying patterns more comprehensively and enhancing its generalization ability [
24]. Second, the quality of the data: high-quality data should be accurate, complete, consistent, and relevant [
25]. Third, the features of the data: when the training and prediction data share high similarity and regularity in terms of feature distribution, trends, and other characteristics, the model can more accurately learn the relevant patterns during training, significantly improving performance [
26]. Therefore, this study analyzed and organized the collected data in terms of volume, quality, and features.
This study collected daily average water and air temperature data from the Yichang Hydrological Station between 2007 and 2023, totaling over 6000 data points. In terms of data volume, this is generally sufficient to meet the training requirements of a machine learning model [
27]. Regarding data quality, the water temperature data were sourced from the Hydrological Yearbook of the People’s Republic of China, and the air temperature data were obtained from the National Meteorological Data Sharing Network (
https://data.cma.cn/). The data were processed and compiled to ensure high quality, meeting the standards required for machine learning models. As for data features, the dataset covered an extended period and, due to the impact of upstream hydropower development, water temperature characteristics may vary over time. Therefore, we considered the cumulative effects of hydropower projects and analyzed water temperature patterns in the Yichang section of the Yangtze River across different periods.
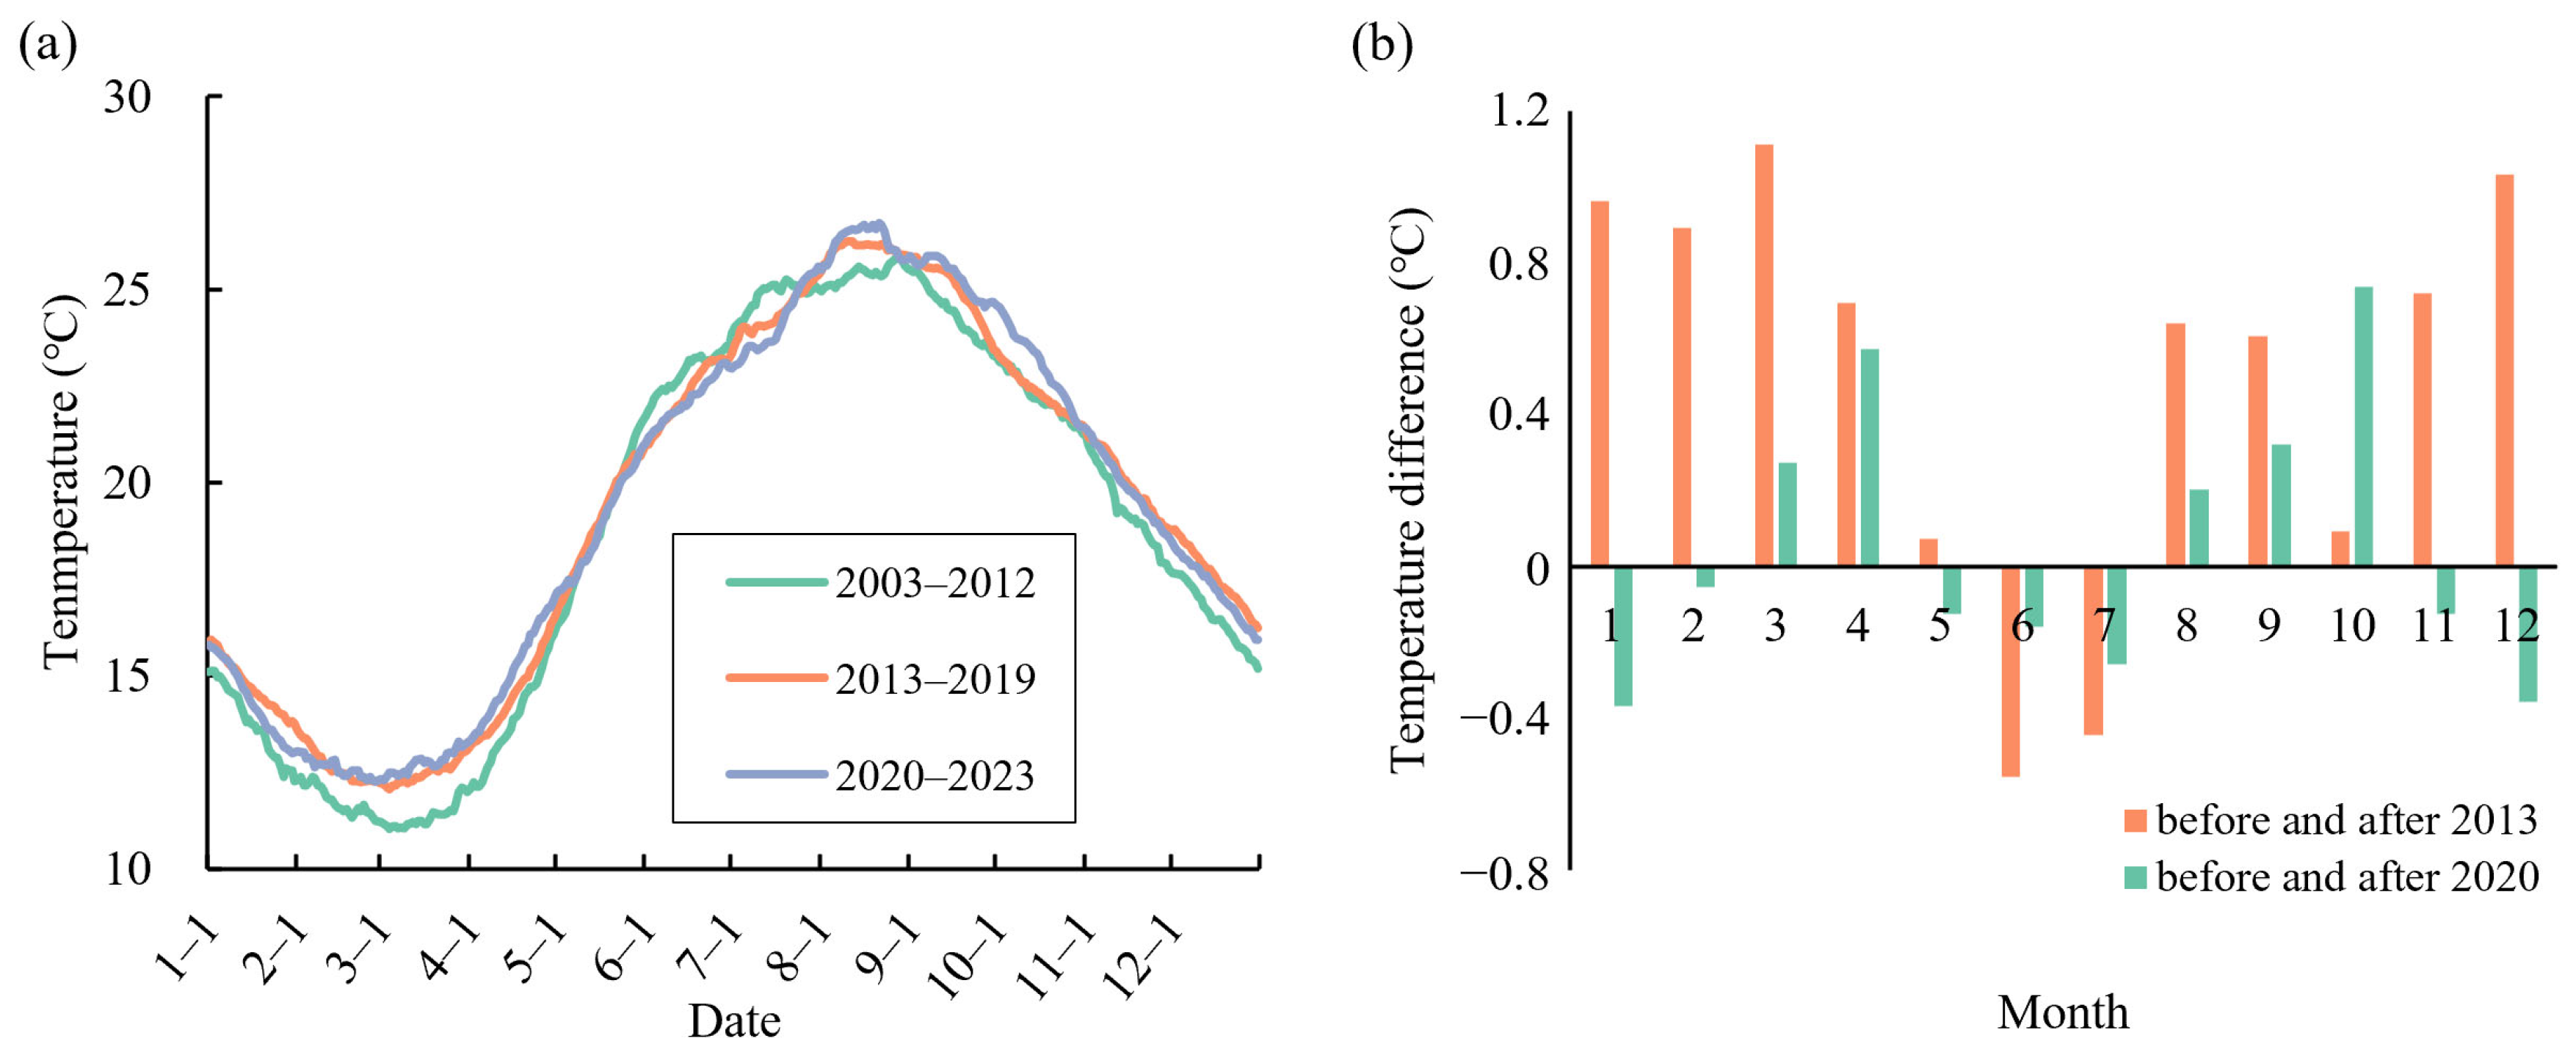
Among the cascade hydropower stations in the basin, Gezhouba Station was the first to be completed. However, due to its relatively small reservoir capacity and limited regulation ability, its impact on water temperature is minimal. TGR began its initial impoundment in 2003, followed by the Xiangjiaba and Xiluodu hydropower stations, which began generating power in 2012 and 2013, respectively. The Wudongde and Baihetan hydropower stations were successively put into operation in 2020 and 2021. This study used 2003, 2012, and 2020 as cutoff points to compare intra-annual water temperature variations at Yichang Station during different periods. The results showed that the water temperature variation at Yichang Station generally followed a seasonal pattern across all stages of hydropower development (
Figure 2). However, specific differences were observed in water temperature within the same months during different periods. Notably, after the completion of the Xiluodu and Xiangjiaba stations, the water temperature at Yichang increased significantly from January to April and from August to December, while it significantly decreased in June and July. The completion of the Wudongde and Baihetan stations also impacted the water temperature at Yichang, with an increase observed in March–April and August–October, reaching a maximum rise of 0.73 °C. In other months, while the water temperature slightly decreased, the variation did not exceed 0.4 °C (
Figure 2).
In summary, the water temperature variation characteristics at Yichang Station were generally similar and suitable for training machine learning models. However, given the differences in water temperature across different stages, we explored the feasibility of enhancing the model’s performance using transfer learning techniques.
3. The Water Temperature Forecasting Model
3.1. Overview
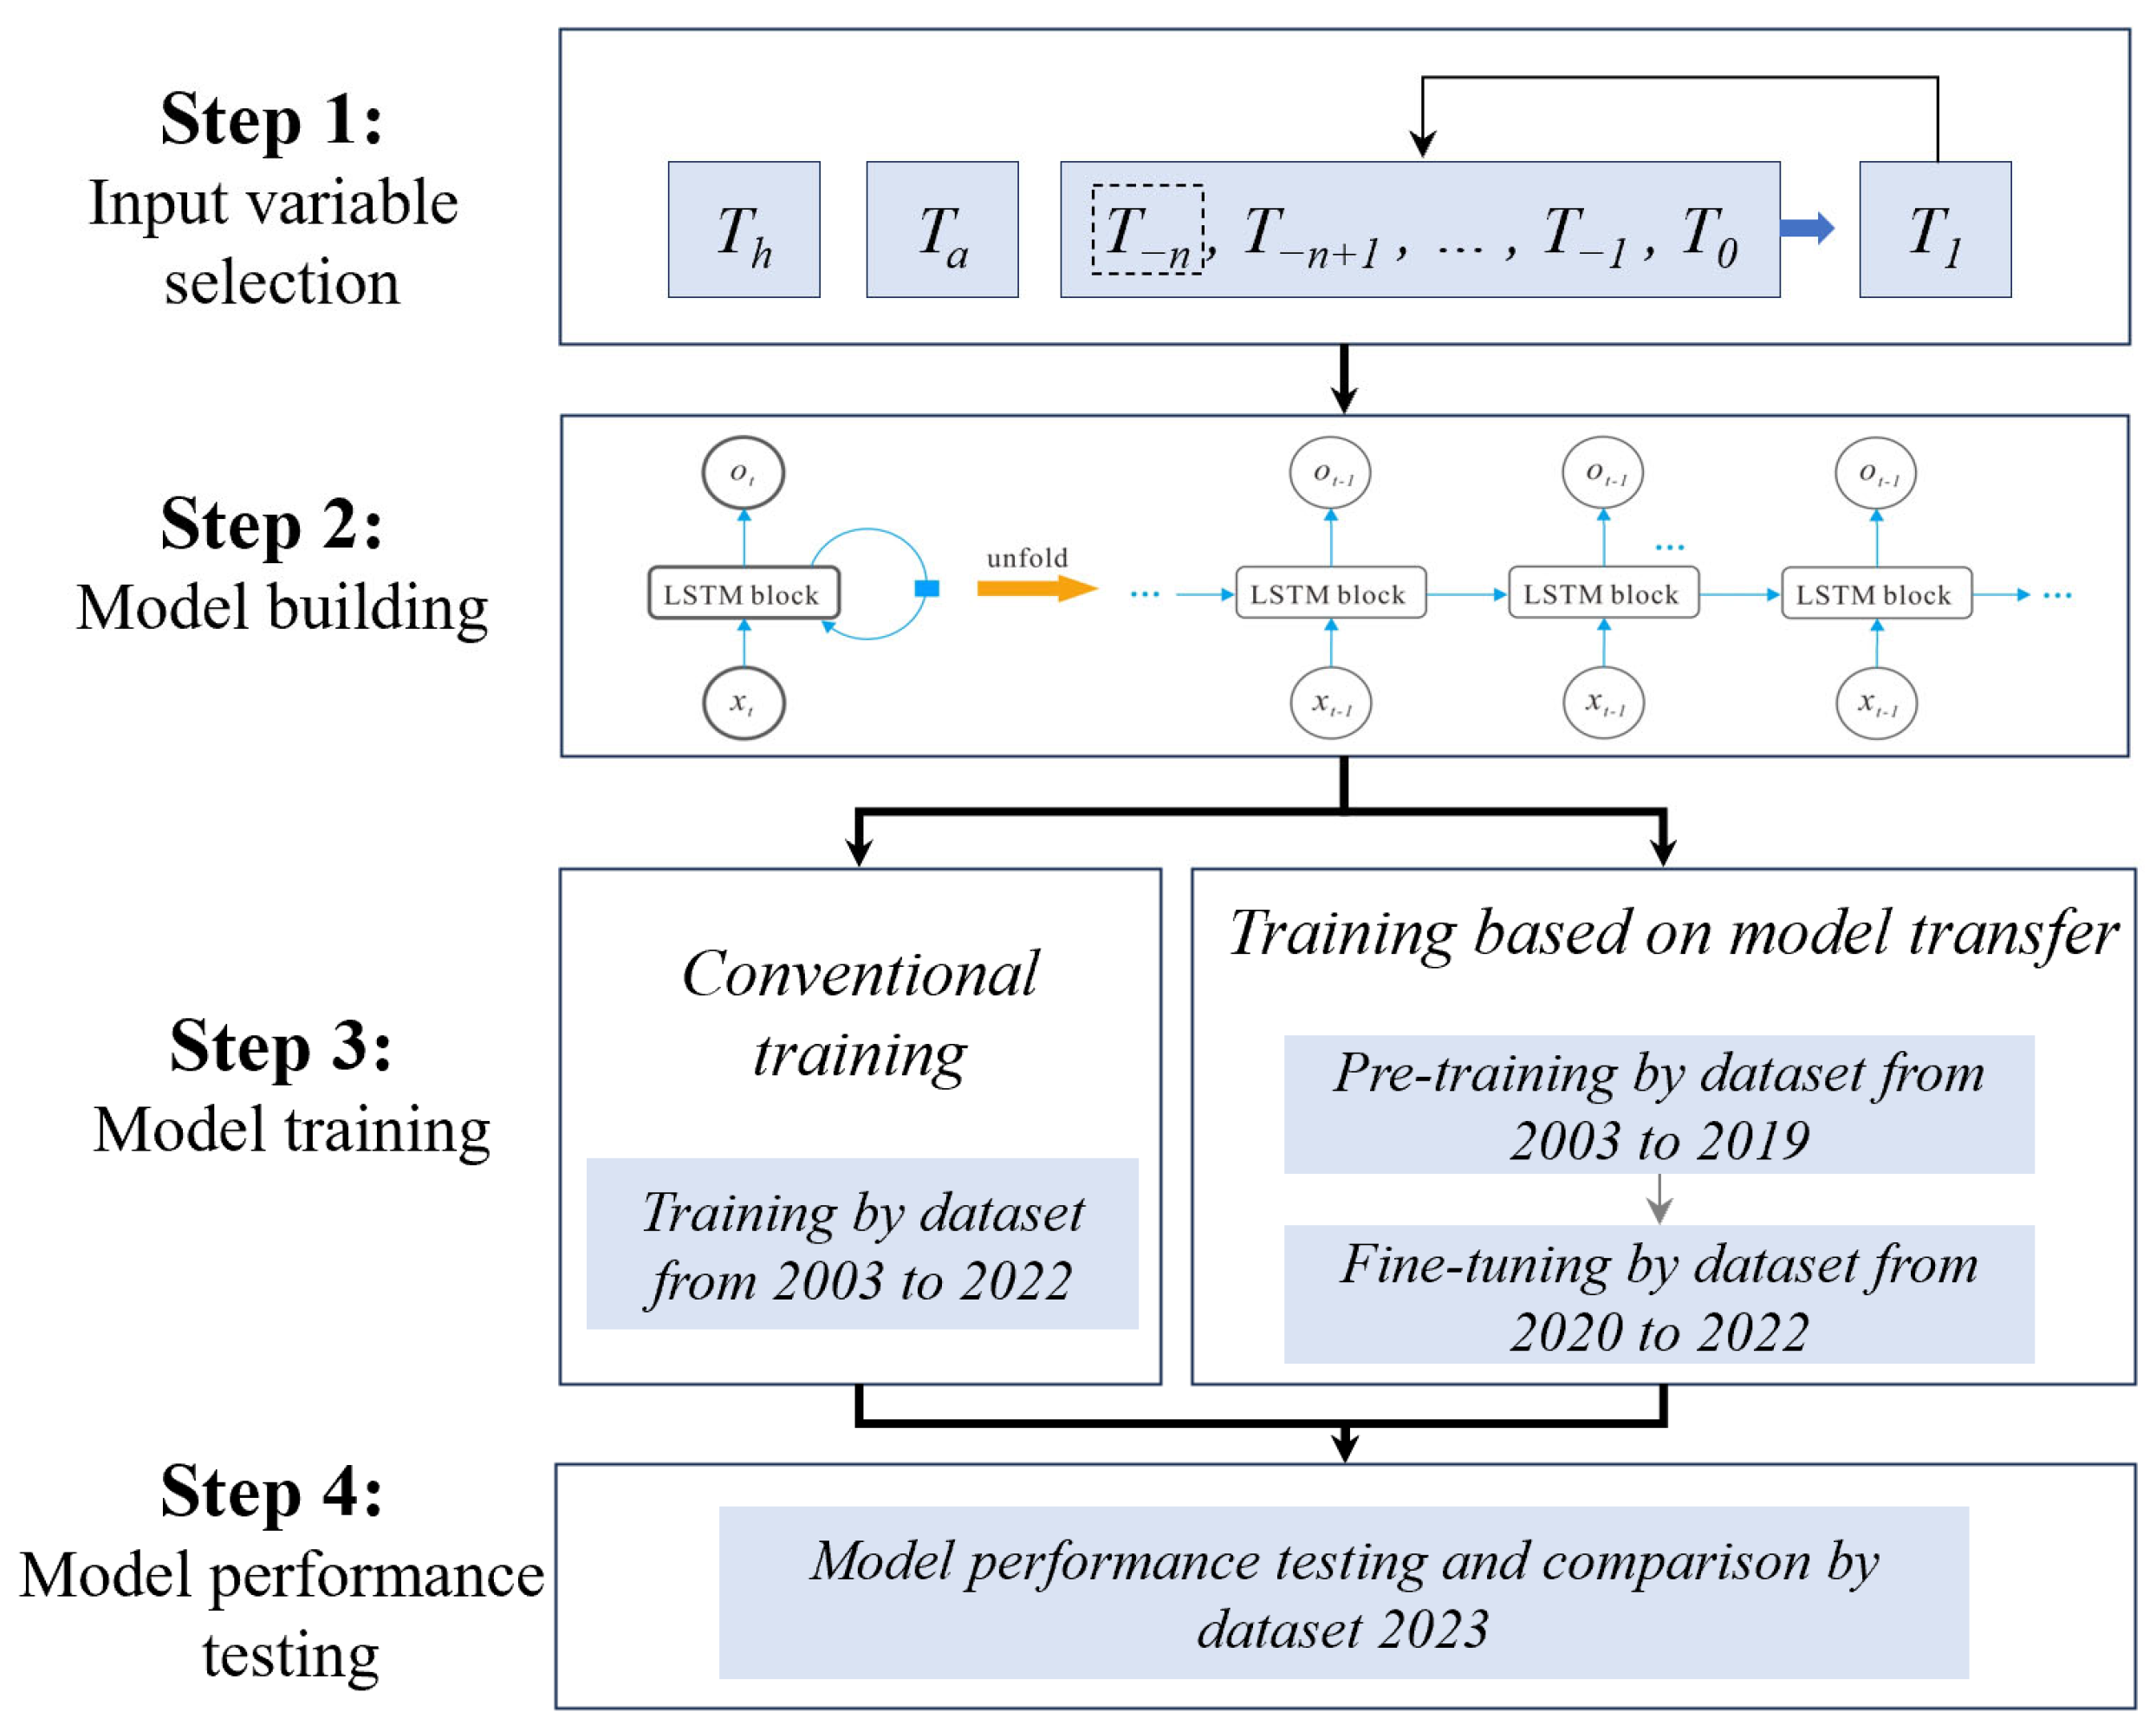
To achieve long-term water temperature prediction in this study, we adopted the following approach: (1) Based on the temporal variation characteristics of water temperature and key influencing factors, we selected appropriate model inputs. Additionally, we used a multi-step recursive prediction method, where the predicted water temperature for the next step was used as input, discarding the previous time step’s water temperature for iterative forecasting. (2) Given the temporal nature of water temperature prediction, we used the LSTM model, which is effective for time series problems, to establish the mapping relationship between the input and output for the prediction model. (3) Considering the impact of upstream cascade reservoir construction on the water temperature at Yichang Station, two approaches—conventional training and transfer learning—were used to train the prediction models. These models are referred to as the conventional model and the transfer learning model, respectively. (4) The model’s performance was evaluated using 2023 data, comparing the results to assess the strengths and weaknesses of the models trained with different approaches.
3.2. Selection of Input Variables
The selection of input variables is crucial to the predictive capability of the model and, as this study was oriented to the actual demand for water temperature forecasting in the selection of reservoir ecological operation timing, on the basis of comprehensively considering the availability of data acquisition and the correlation with water temperature changes, the water temperature sequence at the previous n moments, the historical water temperature at the predicted time, and the air temperature at the predicted time were finally selected as the input factors of the model, while the water temperature at the predicted time was used as the output factor of the model. The prediction results were added to the input factor of the water temperature prediction at the next moment, and the recursive prediction method was used to realize the prediction of water temperature at multiple times in the future (
Figure 3).
The length of the water temperature time series significantly impacts the model’s prediction performance. If the series is too short, the model has insufficient data, leading to low accuracy. To the contrary, if the series is too long, it becomes challenging to optimize the model’s parameters, and redundant information may reduce the accuracy and increase the training time. Therefore, this study tested the impact of different time series lengths on model performance to determine the optimal input sequence length.
3.3. LSTM Algorithm
Recurrent neural networks (RNNs) are a type of machine learning model particularly suited for time series problems. In an RNN, each time step corresponds to a standard feedforward neural network, with a memory unit at each step that records its output. This output is then passed to the next time step, making RNN-based algorithms ideal for recursive prediction tasks [
28,
29]. Building on previous research, this study selected long short-term memory (LSTM), a representative RNN algorithm, to construct the water temperature prediction model [
19,
21,
30]. LSTM is an improved version of RNN, designed to address the vanishing and exploding gradient problems in traditional RNNs when processing long sequences. By introducing a gating mechanism, LSTM can effectively capture long-term dependencies, allowing the model to utilize long-range temporal information. The computation formulas defined in the LSTM model at time step t are as follows:
In the above formulas, f, i, C, o, and h are the forget gate, input gate, memory cell, output gate, and hidden output, respectively; σ and tanh represent the gate activation function and the hyperbolic tangent activation function, respectively; W represents the corresponding weight coefficient matrix; and b represents the offset vector.
3.4. Training Method Based on Model Transfer
Transfer learning-based model training is a common approach in transfer learning [
31,
32]. It leverages the knowledge acquired from one or more source domains using a pre-trained model to perform tasks in the target domain. This allows the model to apply previously learned knowledge, improving performance on the new task, even with limited data from the target domain. The specific training steps were as follows: (1) The source domain network model was trained with the dataset from 2003 to 2019 so that the parameters of the source domain network were continuously optimized through training, until the error of the source domain network model reached the minimum. (2) The parameters of the underlying temporal feature extraction layer of the source domain network were transferred to the target domain model and frozen to prevent distribution drift interference. (3) The parameters of the top fully connected layer were reset based on the 2020–2022 data to adapt to the recent data characteristics, and the top parameters were optimized with a low learning rate to avoid catastrophic forgetting. (4) The 2023 data were used as an independent test set to test the prediction effect of the model on the water temperature characteristics of Yichang Station in recent years.
3.5. Key Parameter Settings of the Model
In order to ensure the fairness of the test, the performance of the two models was tested under the same parameter setting conditions, and the main parameter settings are shown in the
Table 1.
3.6. Model Performance Test Index
To evaluate prediction accuracy, the mean absolute error (
MAE) was selected as the performance metric. The corresponding formula is as follows:
where
Xi represents a predicted value and
Ti represents an observed value.
All of the experiments presented in this study were performed on a Windows 10 Home Edition system with an Intel(R) Core(TM) i7-10870H CPU (Intel Corporation, Santa Clara, CA, USA) @ 2.20 GHz, 16 GB of system memory, and an NVIDIA GeForce RTX 3070 Laptop GPU (Nvidia Corporation, Santa Clara, CA, USA). The testing experiments for the machine learning model were conducted using Python 3.6.0.
4. Results Analysis
4.1. Selection of the Input Time Window
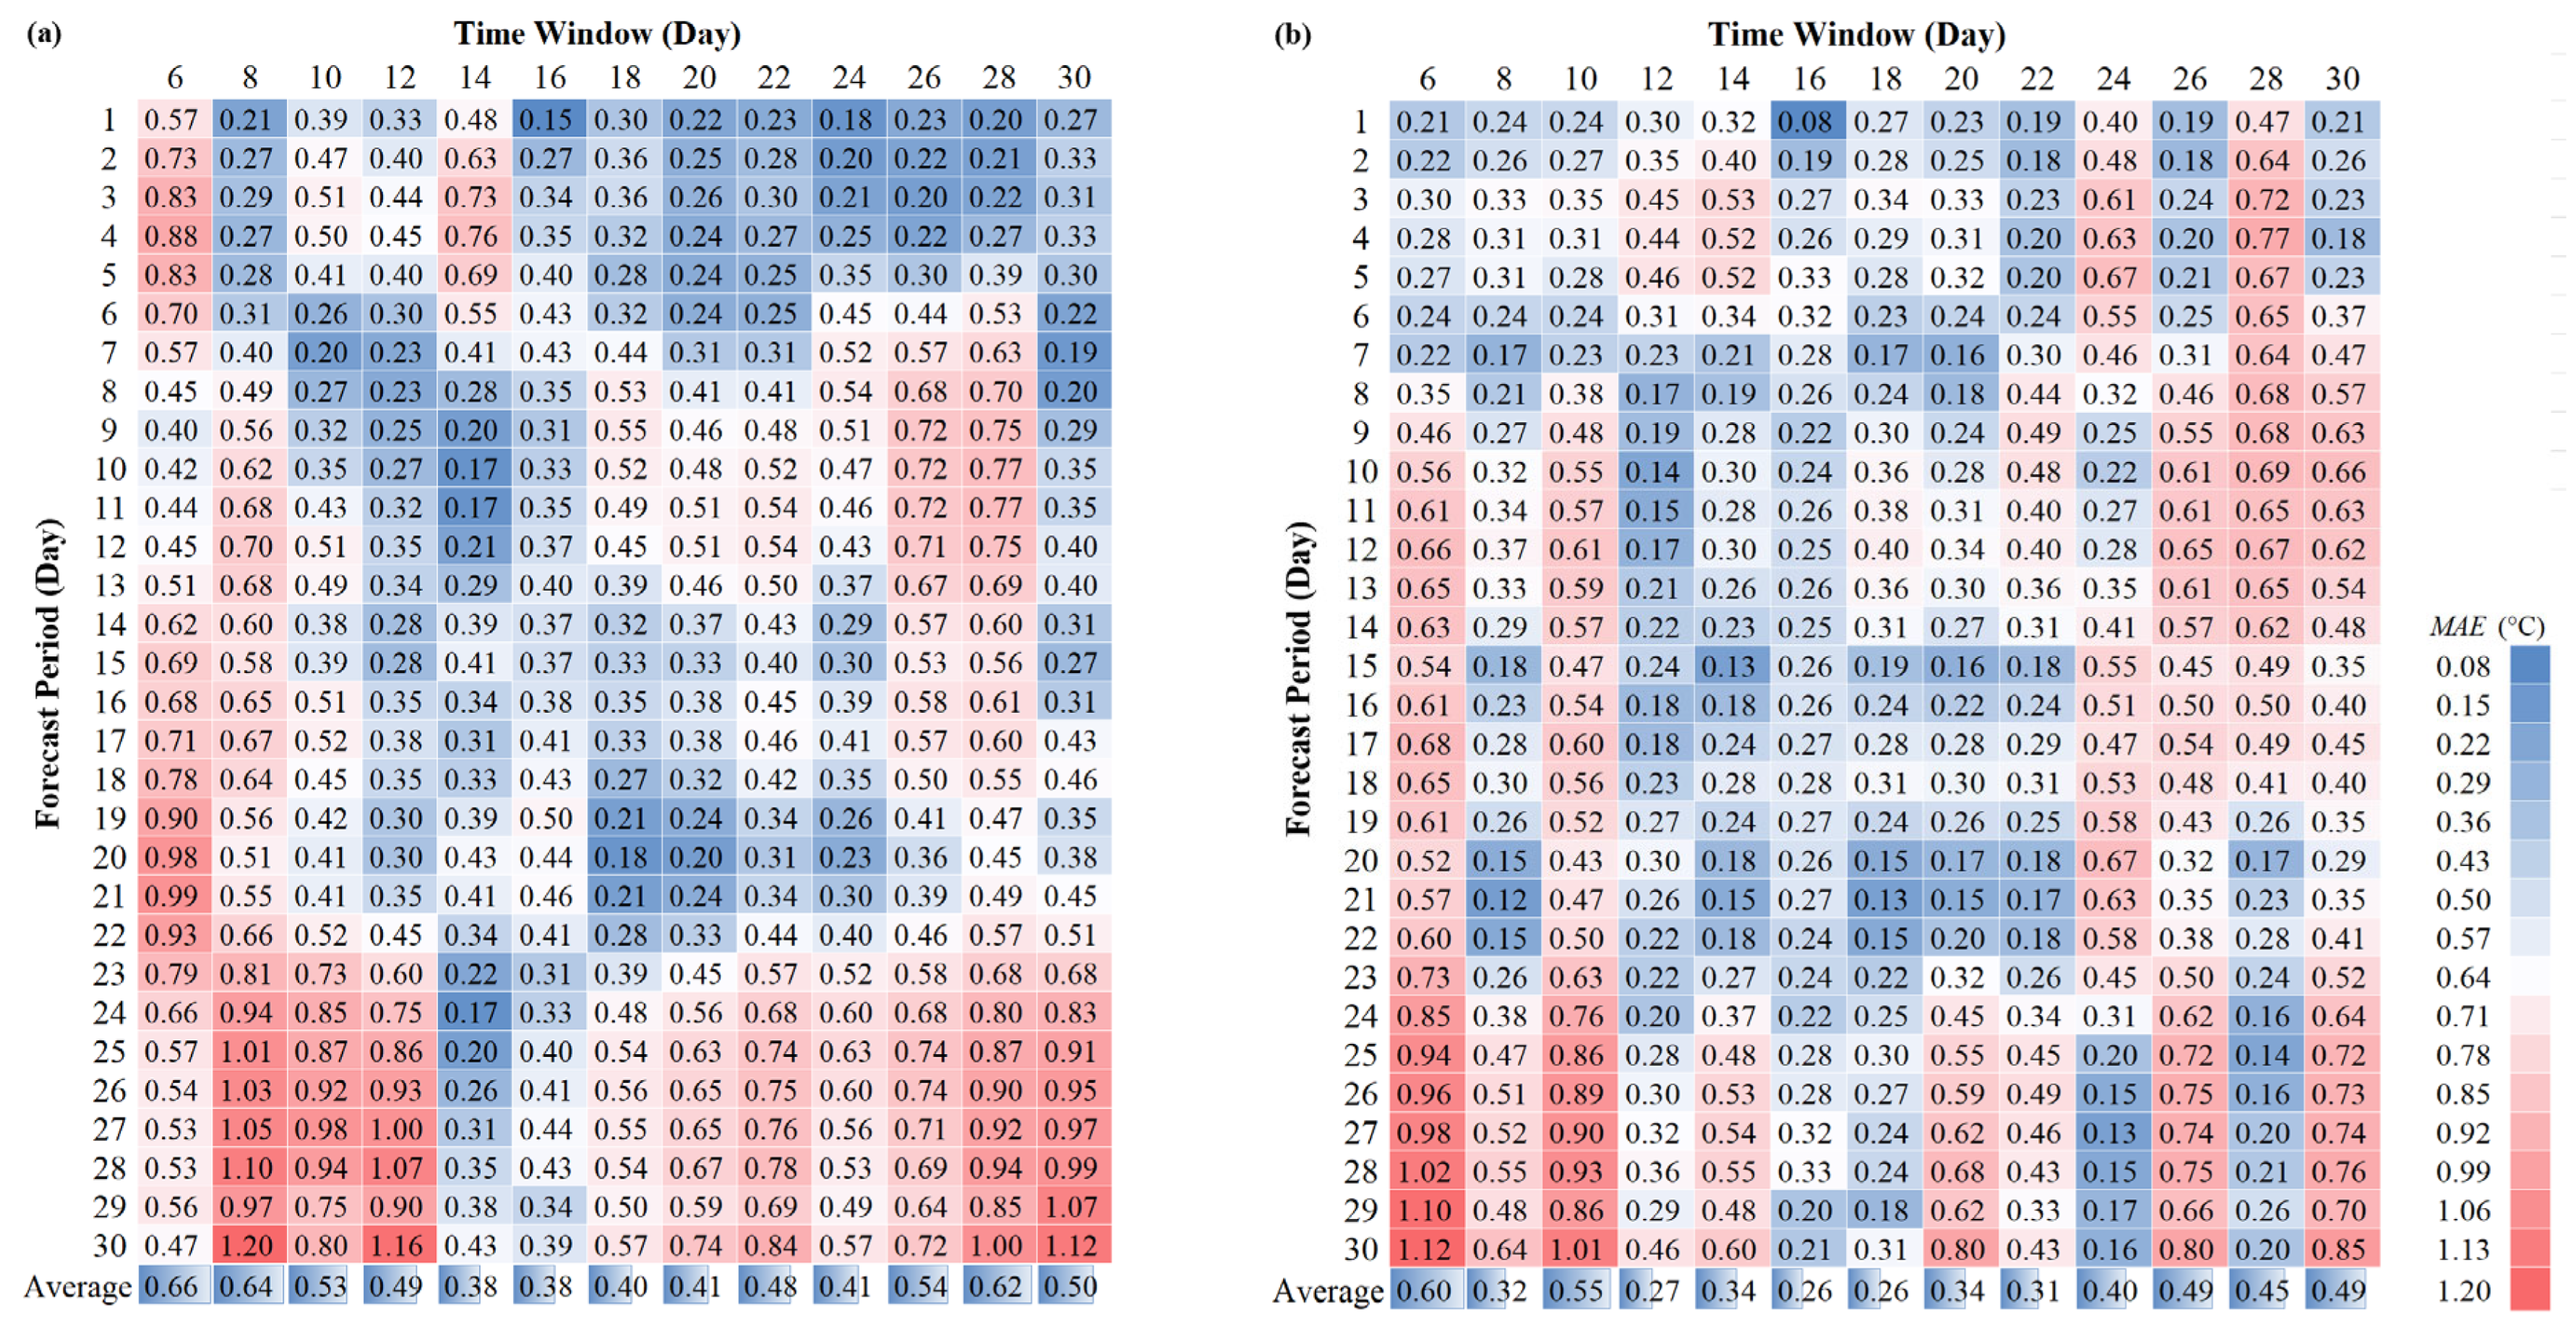
The selection of input variables is crucial for the model’s predictive performance. This study aimed to forecast water temperature over a 30-day period and examine the impact of different historical water temperature sequence lengths on model accuracy. The objective was to determine the optimal input time window. The results are presented in
Figure 4.
The test results indicated that for the conventional model, the overall prediction error remained relatively low when the input time window length was between 14 and 20, with an MAE value of approximately 0.37–0.39 °C. For the transfer learning model, the prediction error was also relatively low within a time window length of 12 to 22, with an MAE value of around 0.26–0.33 °C. Additionally, since the model’s prediction approach relied on recursive forecasting, the cumulative error may have increased as the forecast horizon was extended. The results showed that when the input time window was either too short or too long, the model’s cumulative error rose significantly. However, within the optimal range, the cumulative errors for both models remained relatively small. This can be attributed to the natural volatility of water temperature and the randomness of the errors. When the model’s prediction accuracy was high and the error was small, cumulative errors tended to cancel out over time. Within a certain forecast horizon, there was no significant change in cumulative error as time progressed.
Based on these findings, we set the input time window for the water temperature data to a fixed length of 16 time steps. The input factors included the water temperature data from the previous 16 time steps, the historical water temperature at the prediction time, and the forecasted temperature at the prediction time. These inputs were used to construct a long-term water temperature prediction model.
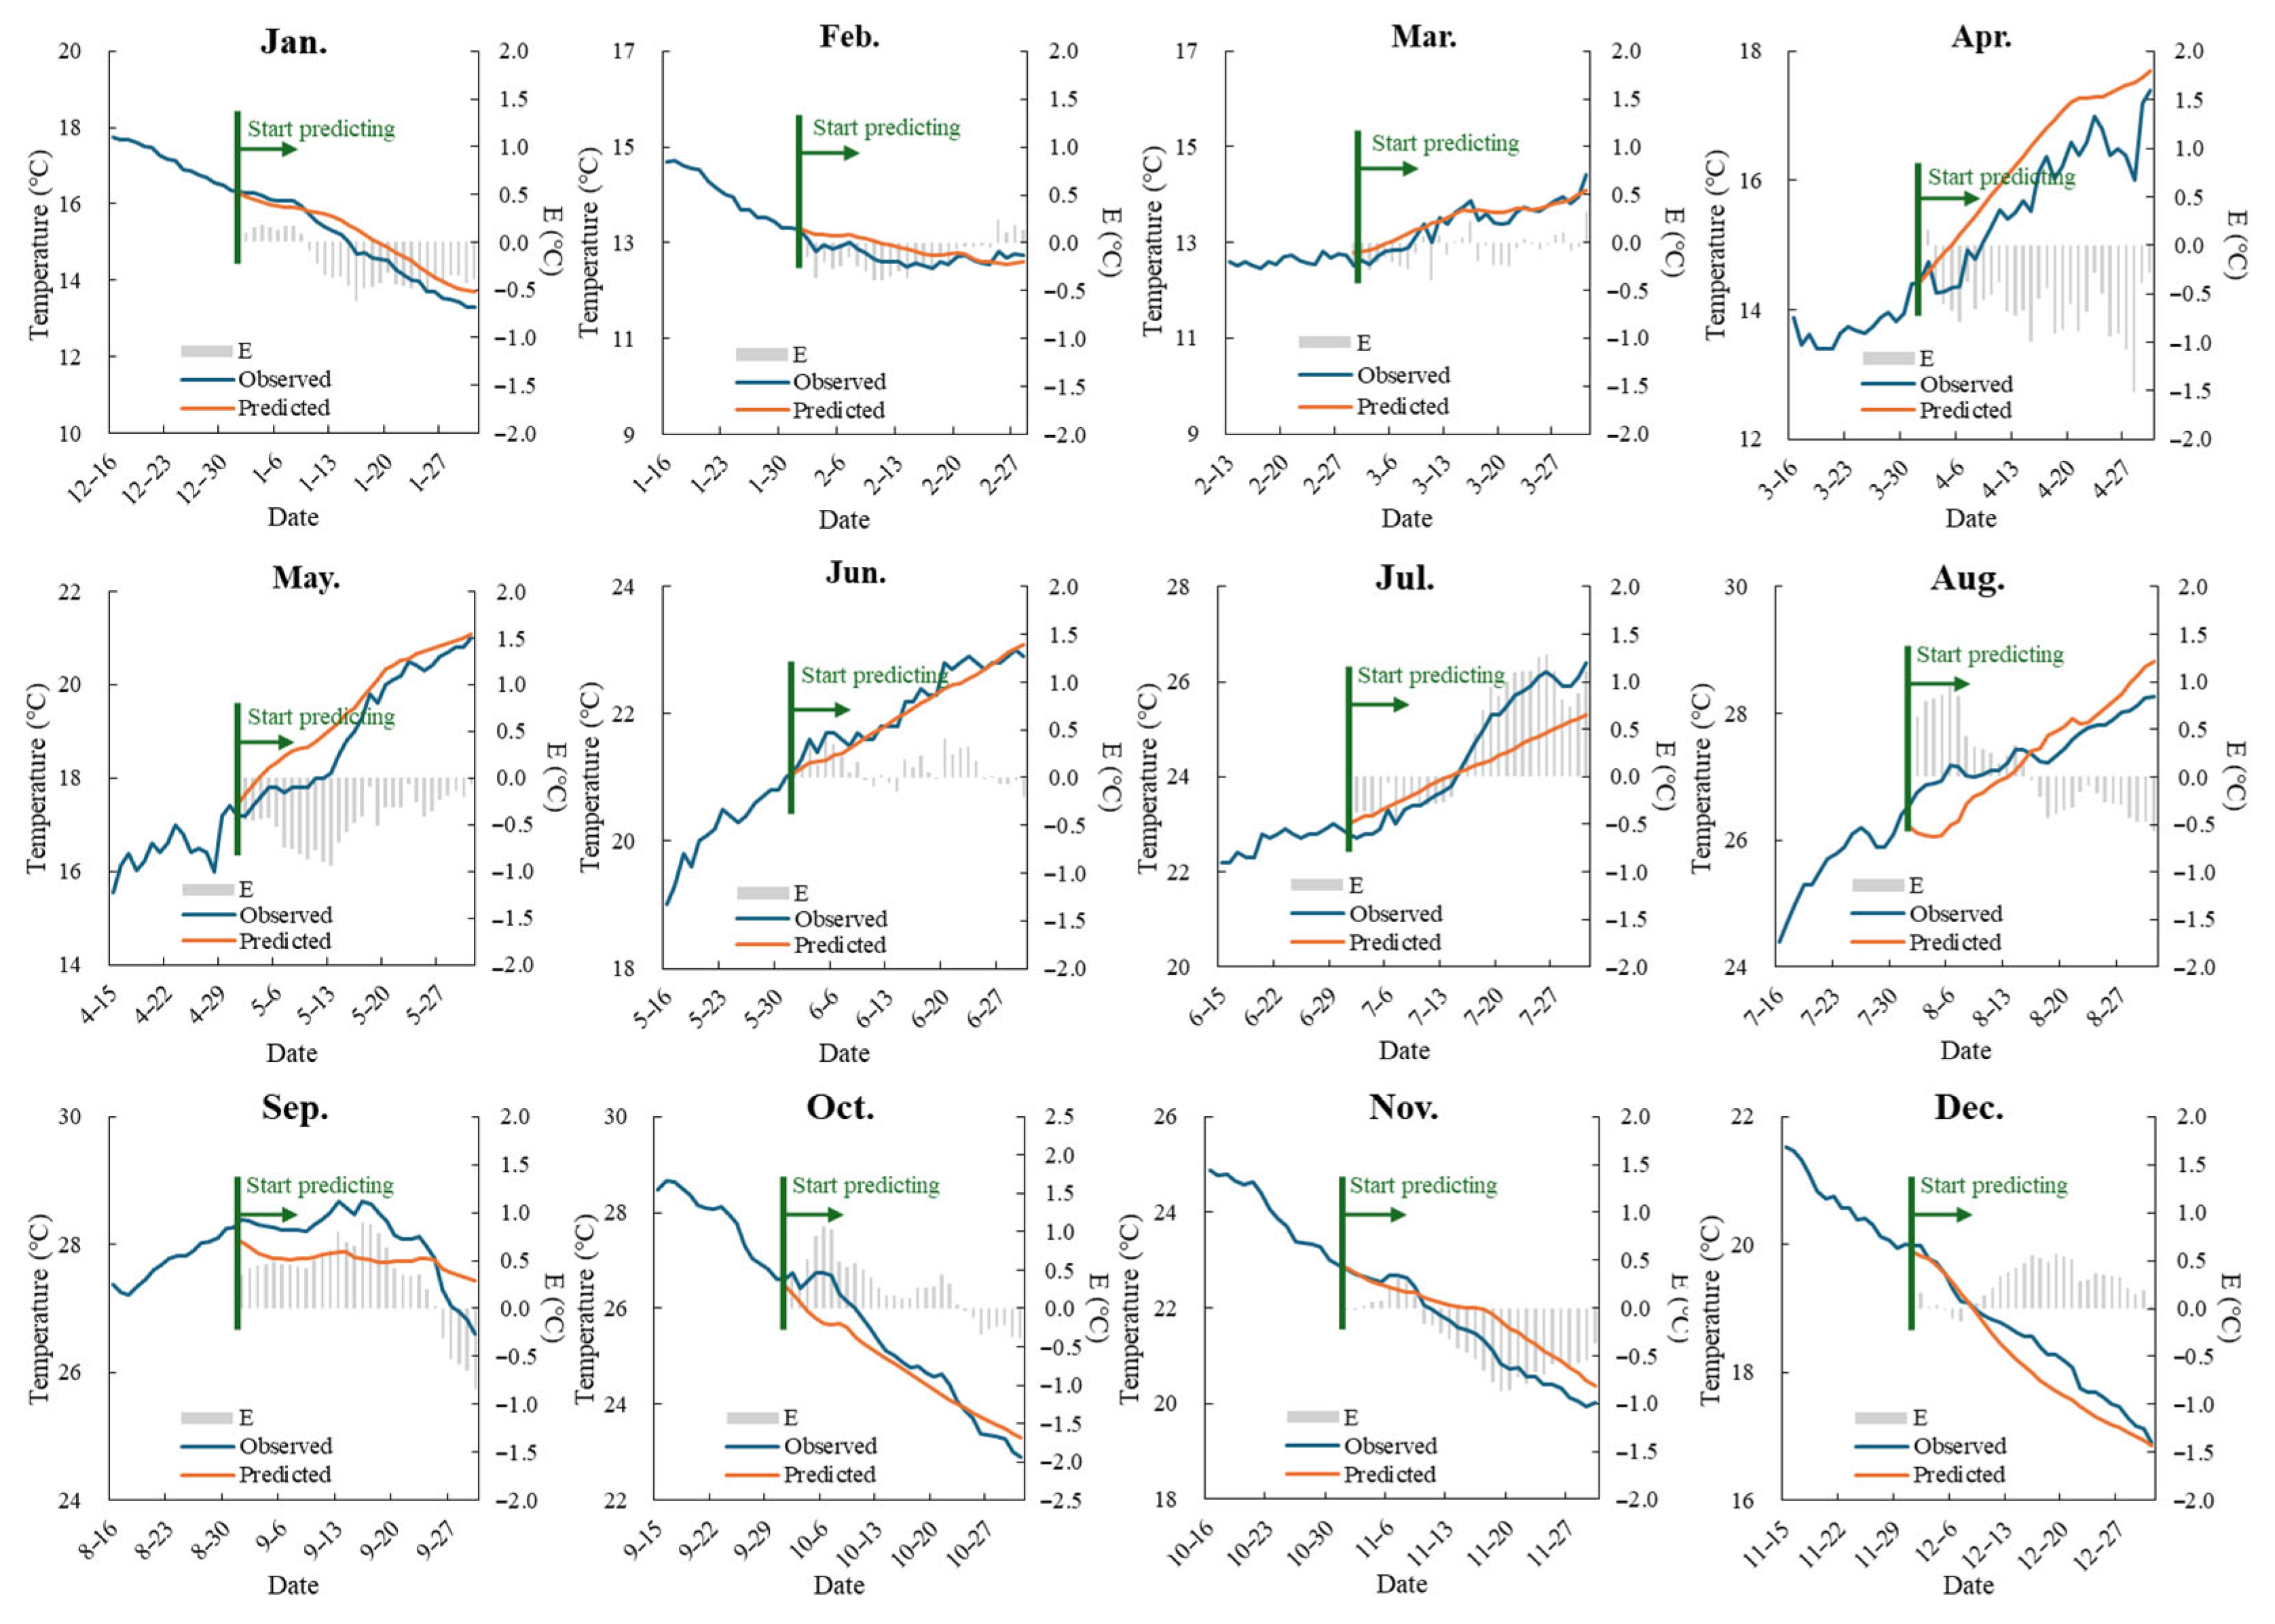
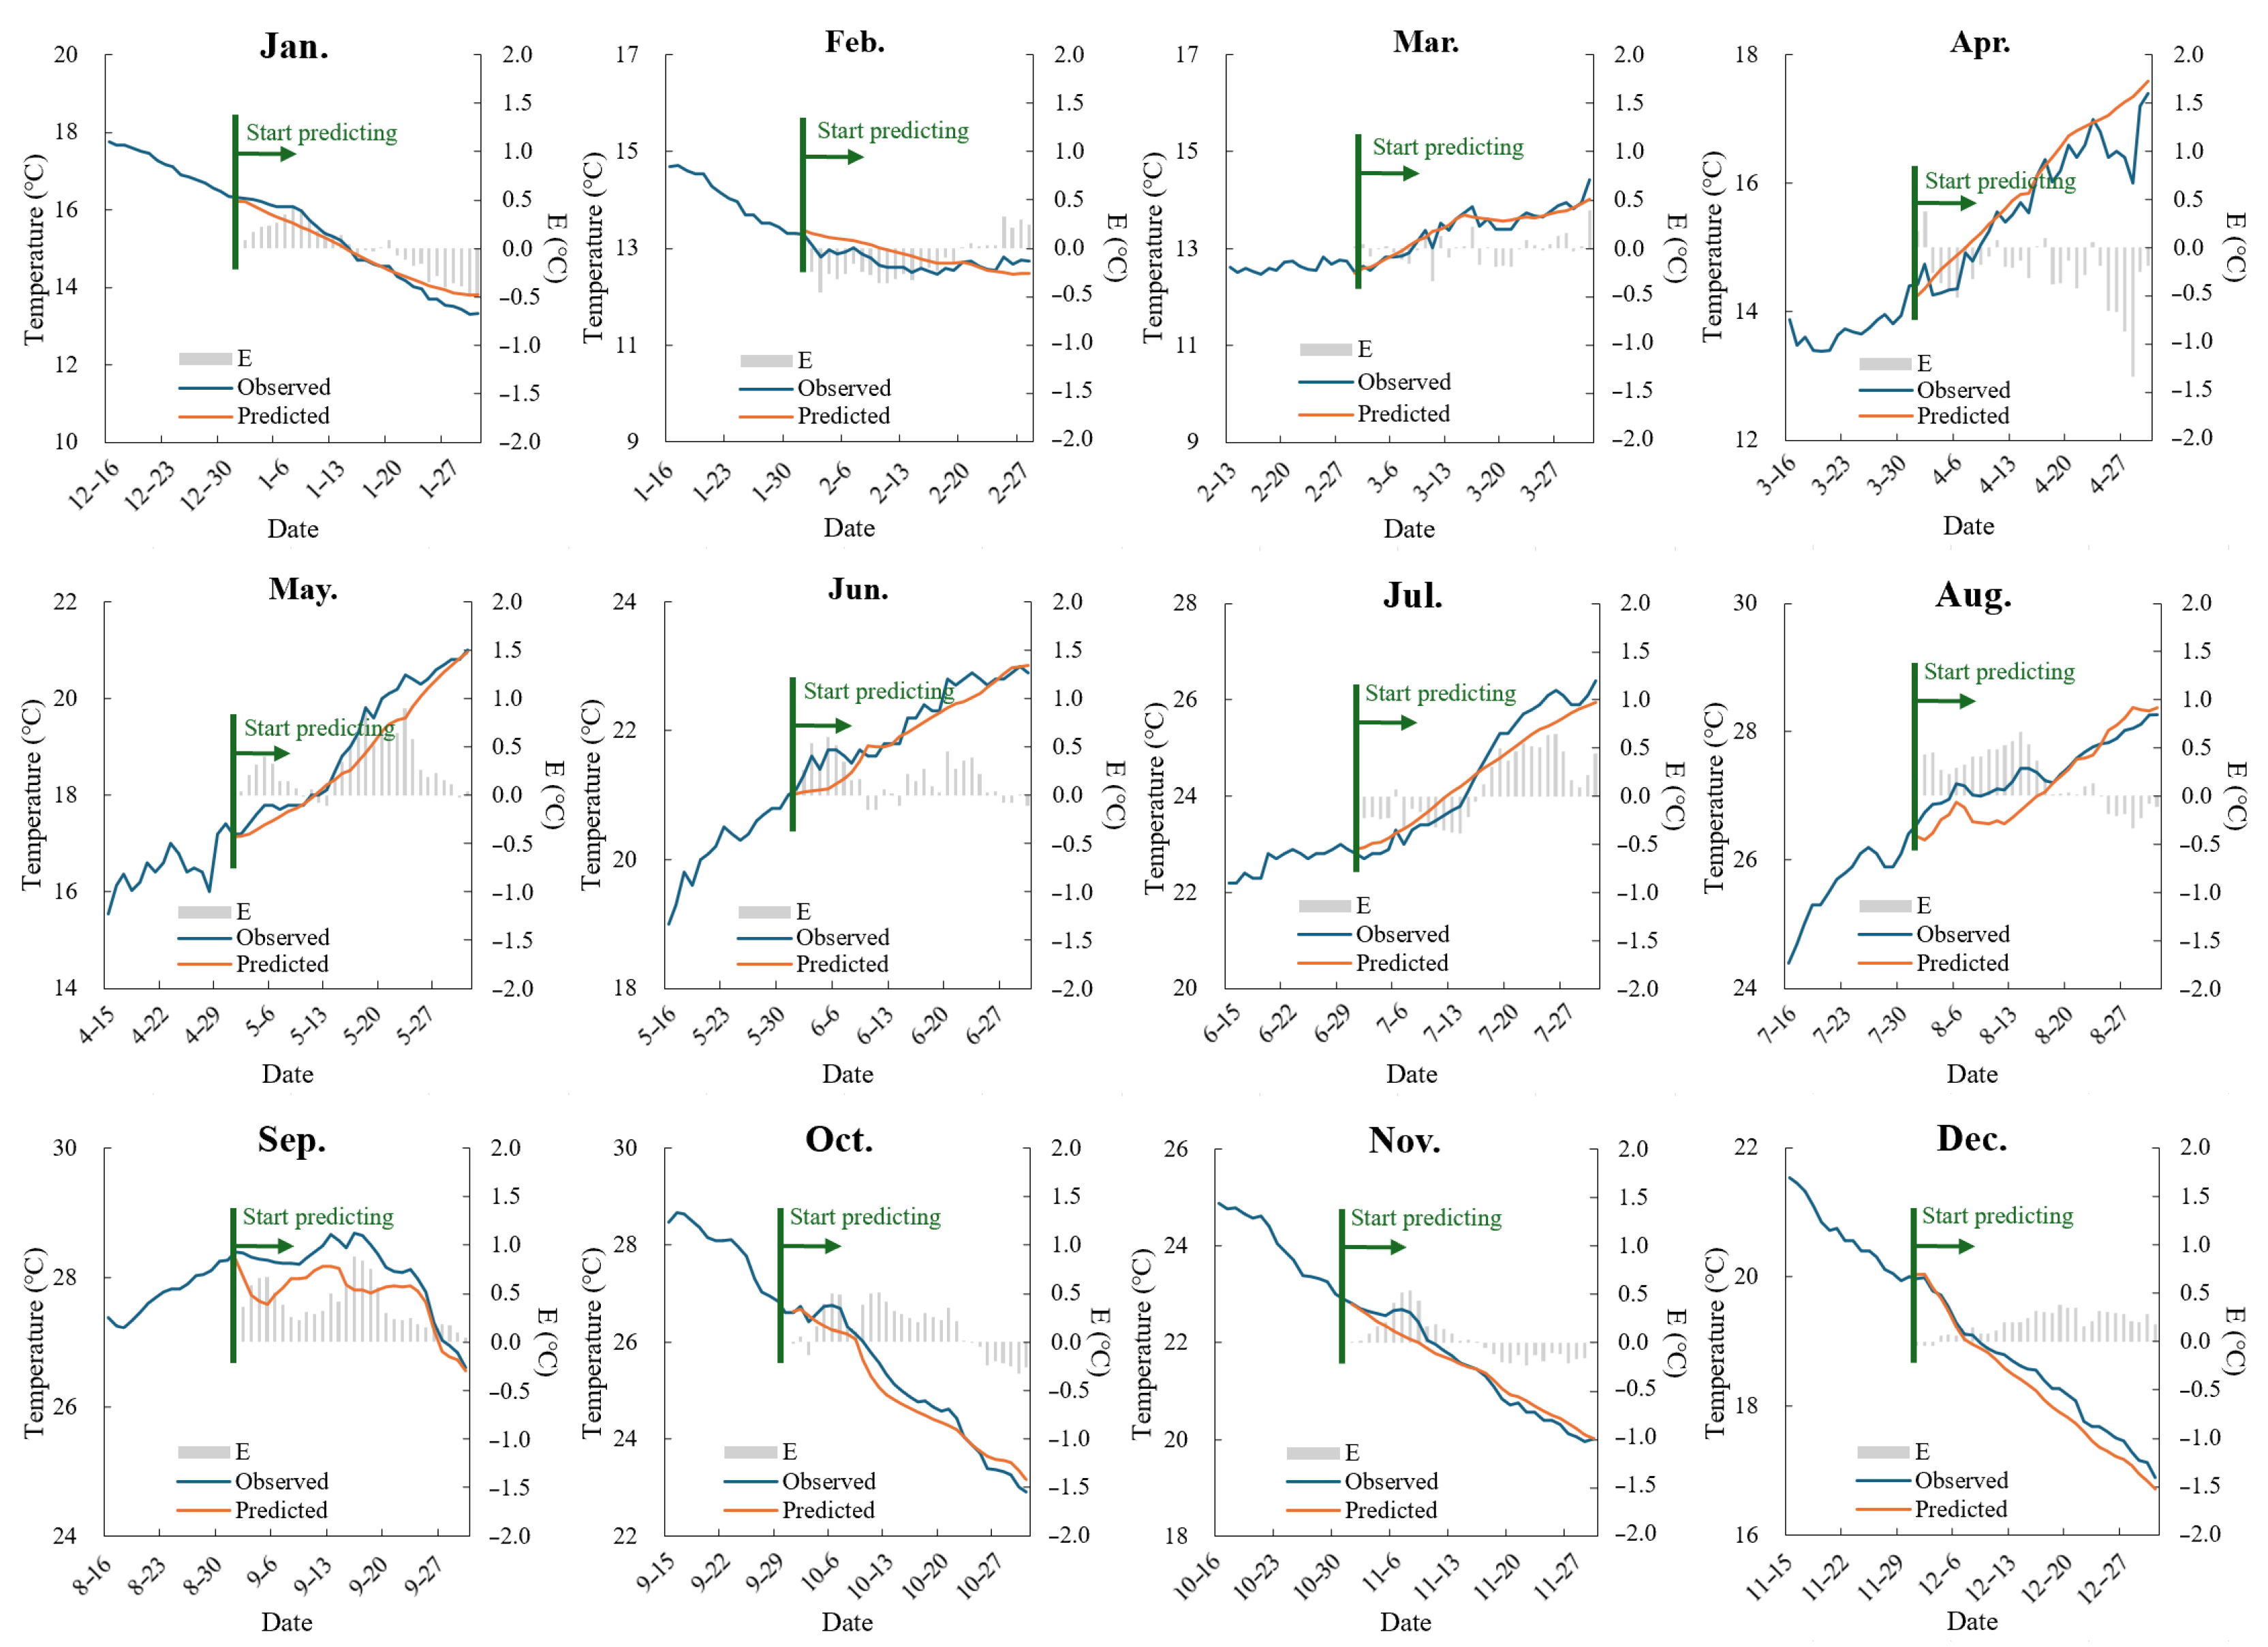
4.2. Model Prediction Accuracy
To test the model’s prediction accuracy, we used the first day of each month as the starting point for predictions. Following the recursive prediction approach, the result from the previous time step was incorporated into the input factors for the next time step. This process continued step by step, completing the water temperature prediction for the entire month based on the number of days in each month.
Figure 5 and
Figure 6 display the prediction results for the conventional and transfer learning models, respectively.
For the conventional model, the average prediction error for water temperature across the months ranged from 0.15 to 0.6 °C. The model performed best in February, March, and June, with
MAE values below 0.3 °C. However, the prediction accuracy was poorest in April and July, with
MAE values reaching 0.6 °C (
Table 2). At the same time, affected by the recursive prediction method, the error of the model had a certain cumulative effect with an increase in the number of prediction steps, which indicated that although the conventional model could achieve a good prediction effect, the stability of the model’s prediction needed to be further improved.
For the transfer learning model, the average prediction error for water temperature across the months ranged from 0.16 to 0.35 °C (
Table 2). The model performed well in January–March and October–December, when water temperature changes were relatively stable, with
MAE values below 0.3 °C. However, from April to July, as the river water temperature rose due to seasonal changes and fluctuations increased, the model’s prediction accuracy declined. In August and September, as the water temperature transitioned from rising to falling, this shift in trend further challenged the model’s performance. Our results indicated that the transfer learning model effectively captured temperature fluctuations during the warming phase and the transition from rising to falling temperatures. However, its prediction accuracy decreased slightly during months with larger temperature variations, with an
MAE value of around 0.3 °C. A maximum
MAE value of 0.35 °C occurred in September, during the turning point of the temperature change, while the highest daily prediction error of 1.34 °C appeared in April, a period of significant water temperature fluctuations.
This study showed that the transfer learning model offered slightly higher overall accuracy and demonstrated a stronger ability to capture complex variations in water temperature.
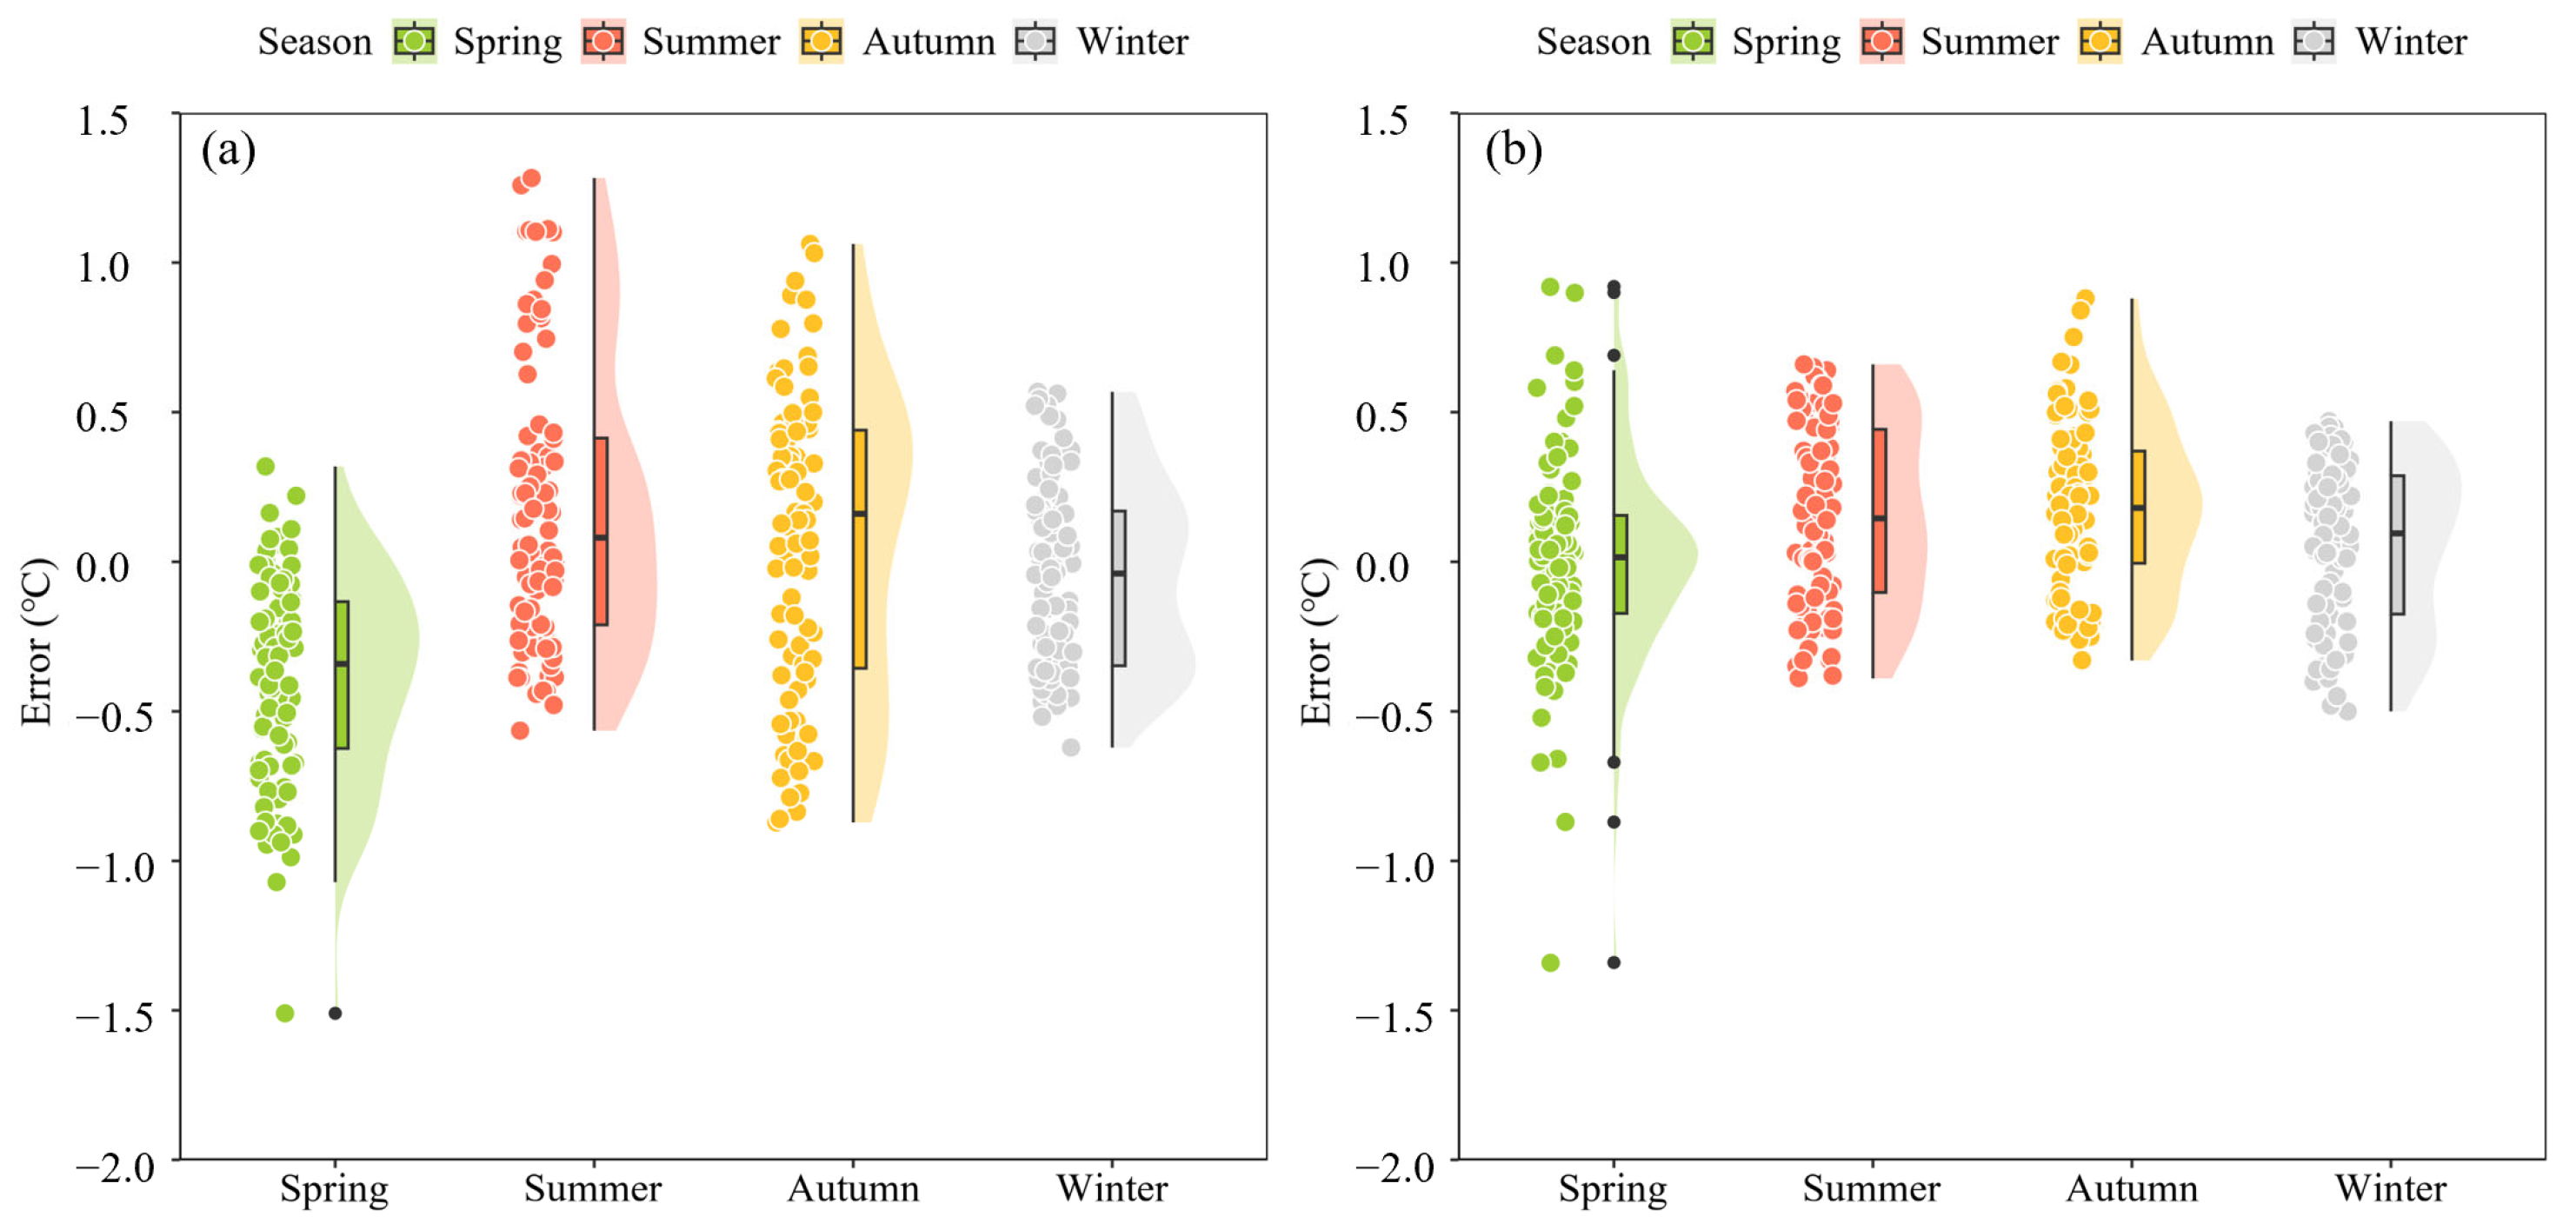
The distribution of model errors in different seasons is shown in
Figure 7. In the four seasons of spring, summer, autumn, and winter, the
MAE values of the conventional model were 0.4, 0.38, 0.42, and 0.27 °C, respectively. The error values in winter (December to February of the next year) varied from −0.62 to 0.57 °C, and the distribution range was relatively concentrated. The
MAE values of the transfer learning model were 0.23, 0.28, 0.25, and 0.24 °C, respectively. The error distribution range was wide in spring (March to May), ranging from −1.34 to 0.92 °C, and the error distribution in the other months was more concentrated. Combined with the water temperature change process of each month in
Figure 5 and
Figure 6, it can be seen that in winter, when the water temperature changed gently, the two models showed high prediction accuracy. In the other seasons, especially in spring, there was a relatively drastic change process in water temperature, and the prediction accuracy of the conventional model decreased significantly, while the transfer learning model still maintained a high prediction accuracy. However, for April to May (spring), when the water temperature changed most sharply, the model’s prediction error also experienced large fluctuations, with the maximum positive error value reaching 0.92 °C and the negative error value reaching −1.34 °C.
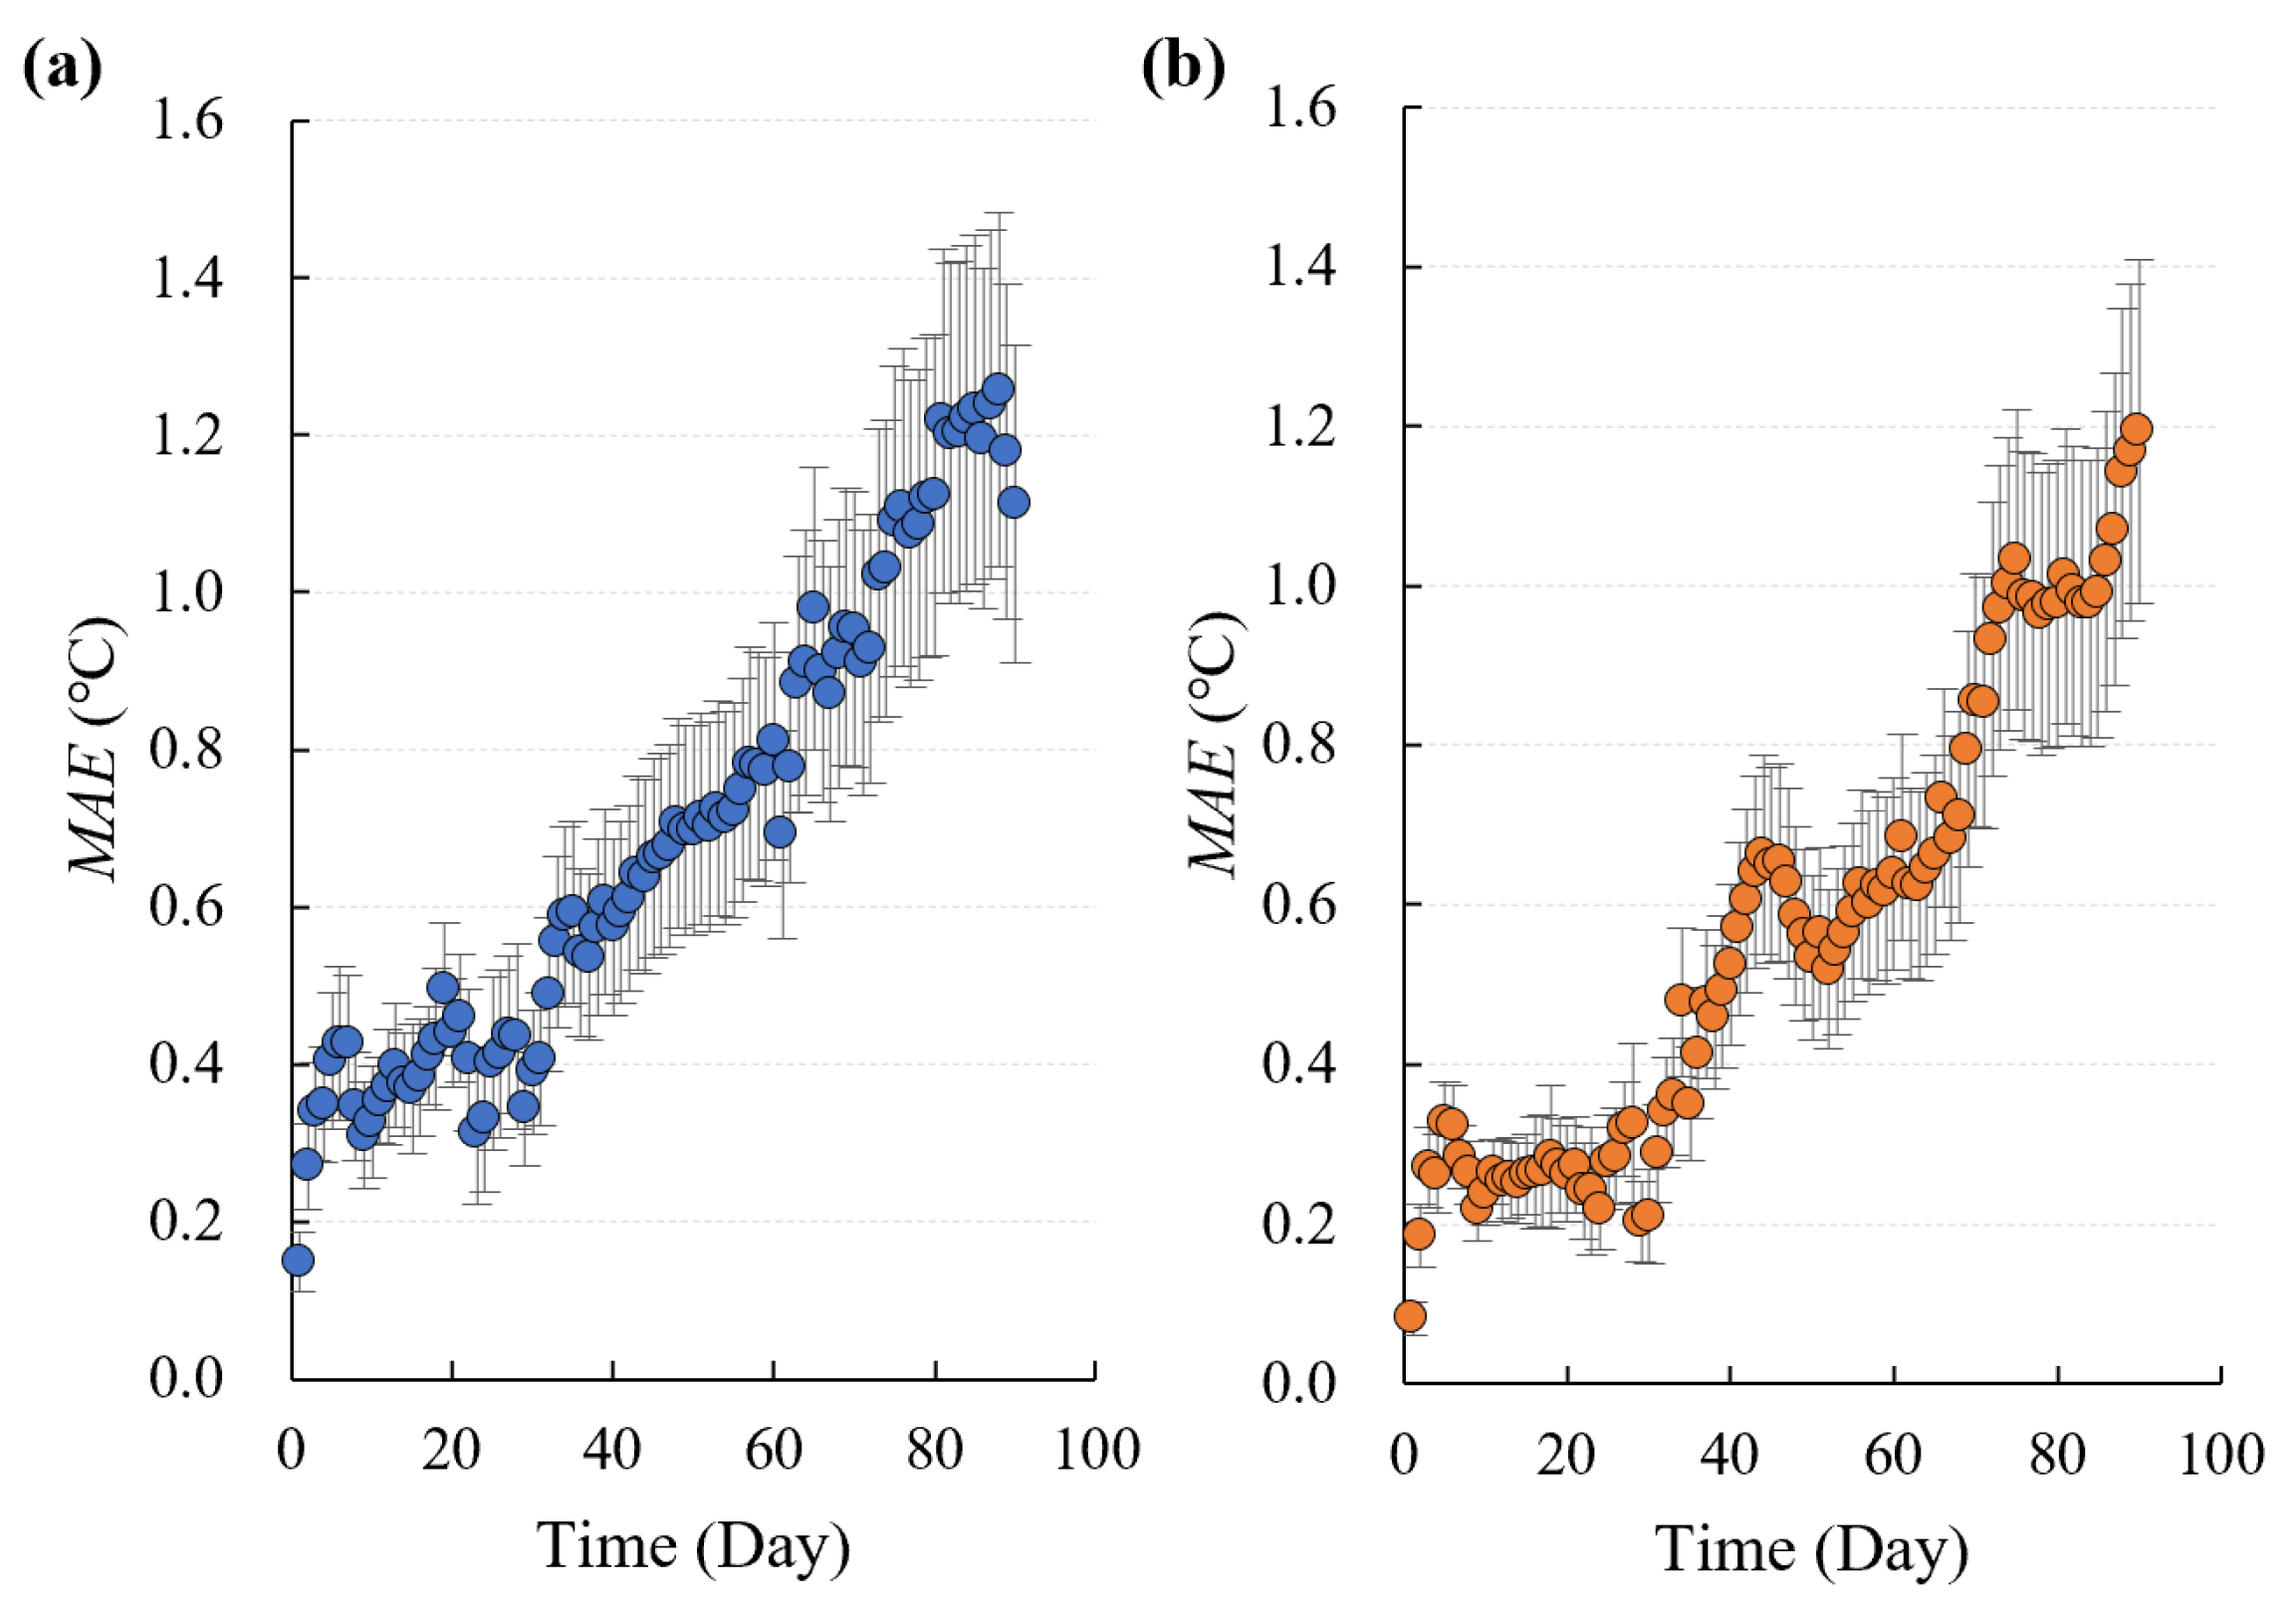
4.3. Model Forecast Period
The forecast period is a crucial metric for evaluating the model developed in this study. To assess its performance over time, we examined how the model’s prediction accuracy varied. The results are presented in
Figure 8.
For the conventional model, the overall prediction accuracy decreased as the forecast horizon was extended. Within 30 days, the average prediction error remained below 0.5 °C, and within 40 days, it remained below 0.6 °C. However, beyond this point, the prediction error increased sharply, exceeding 0.7 °C after 49 days and generally surpassing 1 °C after 74 days.
For the transfer learning model, the average prediction error remained below 0.4 °C within 30 days and below 0.5 °C within 40 days. However, beyond this point, the prediction error increased sharply, exceeding 0.6 °C after 43 days and 0.7 °C after 67 days. After 75 days, the prediction error typically exceeded 1 °C.
Based on the above test results, it can be seen that the prediction accuracy of the conventional and pre-trained models decreased with the extension of the preview period, and the distribution range of the model’s prediction error was rapidly enlarged with an increase in the forecast deployment, but the transfer learning model maintained a high level of accuracy in the prediction time range of 0–60 days.
4.4. Model Calculation Speed
Computational speed is also a critical factor influencing the practical applicability of the model. Therefore, we measured the training and prediction times for different training approaches. The training time included the total duration required to optimize structural parameters such as the input window size, learning rate, and training batch size. The results indicated that the conventional model required 6.01 h to achieve optimal training results and 6.27 s to complete a 30-day water temperature prediction. For the transfer learning model, the pre-training process took 5.37 h, the transfer learning training process took 77.73 s, and the prediction process took 6.36 s. Overall, the transfer learning model had a shorter total training duration. Additionally, when data were updated, the transfer learning model learned from the new data through transfer learning training, without the need to retrain the entire model. As a result, it offered advantages in terms of computational speed and training efficiency.
5. Discussion
5.1. Applicability Analysis of the Model in Ecological Operation Timing Selection
Water temperature, as a key environmental factor influencing fish reproduction, plays a crucial role in the scientific determination of ecological operation timing for reservoirs. This study addressed the practical need for long-term water temperature forecasting in the ecological operation of reservoirs. Focusing on the Yidu spawning grounds downstream of TGR, a long-term water temperature prediction model based on machine learning algorithms was developed. The goal was to provide reliable methodological support for optimizing ecological operation timing in reservoir management.
The research subject of this study, TGR, typically experiences its ecological operation period in May and June each year. The target species for operation are the four major Chinese carps. Based on the reproductive habits of these species, the optimal breeding water temperature ranges from 18 to 22 °C. If the water temperature falls below 18 °C, gonadal development in the four major Chinese carps is inhibited, making it difficult to initiate reproductive activities. Furthermore, previous research has shown that when the operation start temperature exceeds 20 °C, it is more conducive to promoting the reproduction of the four major Chinese carps [
11]. Therefore, accurate water temperature forecasting is essential for selecting the most appropriate ecological operation timing.
At the same time, the ecological operation period of TGR overlaps with the flood season’s drawdown period. In ecological operations, a certain amount of water storage is required to facilitate the flood peak process, necessitating water retention operations in the reservoir. To the contrary, flood control operation requires maintaining the reservoir water level at a lower level than before the flood season to reserve sufficient storage capacity for intercepting and storing floodwaters [
33,
34,
35]. However, water retention operations during ecological operations may reduce the available storage capacity when floods occur, thus hindering effective flood control. Therefore, a long-term water temperature forecasting model can help decision makers to identify optimal ecological operation opportunities within a broader time window. This enables early planning to balance the conflicting goals of reservoir ecology, flood control, and other operation objectives.
The results of this study indicated that, in terms of prediction accuracy, during the ecological operation period (May–June), the conventional model exhibited MAE values ranging from 0.15 to 0.45 °C, while the transfer learning model showed MAE values between 0.2 and 0.3 °C. Both models accurately predicted the water temperature variations during May–June. However, the transfer learning model demonstrated more consistent accuracy and was better at capturing the water temperature trend. Regarding the forecast period, the conventional model had an average error of less than 0.5 °C within 30 days and less than 0.6 °C within 40 days. The transfer learning model maintained an average error of less than 0.4 °C within 30 days and less than 0.5 °C within 40 days. In summary, we believe that the transfer learning model can maintain a relatively low level of error over a longer forecast period. In the planning stage of the ecological operation scheme, the model can rely on this advantage to give more reliable data support for the selection of operation timing.
5.2. Analysis of the Model Prediction Effect in Scenarios with Drastic Water Temperature Fluctuations
In this study, a long-term water temperature prediction model based on a machine learning algorithm was constructed. The results showed that the model can effectively capture the long-term sequence change law of water temperature and predict the change process of water temperature within a certain period in the future. However, the prediction effect of the model for different months and seasons was different, and the prediction effect of some months with drastic changes in water temperature needs to be further optimized.
According to the test results, both models had high prediction errors in months with large water temperature fluctuations (such as April and May) and with changing water temperature trends (such as September). Combined with previous research results, we analyzed the possible reasons and proposed a targeted optimization scheme.
One possible reason is that the feature extraction ability of the machine learning model for complex water temperature changes needs to be improved, and the model structure can be optimized in the future. Many studies have shown that appropriately increasing the number of hidden layers and nodes can effectively enhance the model’s ability to extract complex features [
36,
37]. Meanwhile, integrated forecasting technology, which is widely used in the field of meteorology, also has reference significance [
38,
39]. It can be explored to obtain integrated prediction results by integrating multiple algorithms, such as random forest, gated recurrent unit (GRU) neural network, and transformer-based models, in order to improve the stability of model prediction. In addition, for the transfer learning technology used in this study, the model relied on historical data similarity for training. In transfer learning, if the similarity between the source and target domain data is too high, it may also lead to overfitting problems and cause a decrease in model accuracy. In the future, we can explore data augmentation operations to artificially introduce distribution differences and adopt regularization techniques such as L1 and L2 regularization to limit the size of the model’s parameters and prevent overfitting [
40].
Another possible reason is that the main factors influencing water temperature change were not fully considered. Considering the convenience of practical application, the input factors of the current model only included the water temperature sequence of the previous 16 moments before the prediction moment, historical water temperature, and air temperature data of the same period. However, the change in reservoir water temperature may be affected by many factors, including operation factors such as reservoir inflow and outflow, discharge mode, and meteorological elements such as solar radiation and wind speed [
19,
20,
21]. This study employed statistical analysis methods using observational data from 2023 to compare the explanatory capabilities of different input variable selection schemes on water temperature variations. The results demonstrated that the current variable configuration explained 96.1% of water temperature fluctuations, while incorporating reservoir operation parameters and meteorological variables enhanced the explanatory power to 98.5%. This indicates that the current variable selection already provides adequate explanatory capacity for water temperature variation patterns, essentially satisfying fundamental requirements for temperature prediction. The findings suggest that while existing models demonstrate sufficient predictive performance, further refinement through multidimensional data integration could yield marginal improvements in simulation accuracy. However, due to operation factors being affected by the operation plan and currently available medium- and long-term weather forecasts (3–40 days) lacking predictions of specific values, such as solar radiation and precipitation, these factors could not be incorporated as input variables when constructing the model in this study. In the future, it is possible to combine the reservoir operation model and the meteorological forecasting model to integrate the reservoir operation elements and meteorological factors into the input factors of the water temperature prediction model to further enhance the prediction ability of the model.
5.3. Analysis of Model Prediction Ability Under Extreme Climate Scenarios
Against the backdrop of the intensifying global climate crisis, extreme weather events are becoming more frequent. Since the beginning of the 21st century, the risk of high temperatures and drought events accompanied by extreme heat and drought in the Yangtze River Basin has continued to rise. Taking 2022 as an example, the Yangtze River Basin experienced an anomalous phenomenon of reverse drought during the flood season and encountered the most serious basin-wide drought and high-temperature compound event since records began in 1961.
In the 2023 test set selected for this study, no extreme drought events occurred in the Yangtze River Basin, and the most severe drought in the whole year occurred in July. The prediction results showed that the prediction effect of the conventional model for July was not satisfactory, and the MAE value was 0.6 °C. Meanwhile, the transfer learning model performed well, with an MAE value of 0.31 °C and an error distribution between −0.33 and 0.66 °C. This is likely because the transfer learning model could effectively capture the change in water temperature under the extreme high-temperature and drought scenario in 2022 through the learning of data from 2020 to 2022, so as to achieve better prediction performance, which also confirmed that the transfer learning model constructed in this study has a certain predictive ability for drought events.
However, in the face of more extreme climate events that may occur in the future, the prediction performance of the model still needs to be further validated. Previous studies have pointed out that the prediction effect of machine learning models in the range of training data is ideal, but the prediction effect beyond this range needs further exploration [
41,
42]. In the future, downscaled climate models can be combined with the environmental fluid dynamics model. The precipitation and air temperature predictions from the downscaled climate models are input into the hydrological model to simulate the changes in basin runoff. The runoff and air temperature conditions are then used as the input boundaries of the environmental fluid dynamics model to simulate the water temperature change process under the scenario of future extreme climate events to expand the model’s training dataset, so that the model can learn the characteristics of extreme conditions and then improve its adaptability to extreme weather.
5.4. Feasibility Analysis of Model Cross-Basin Generalization
In this study, the water temperature prediction of Yichang Station in the lower reaches of TGR was taken as a typical case to carry out an in-depth exploration. The results verified that the machine learning model has the ability to effectively capture the long-term series of water temperature changes through deep learning of historical data. Especially in the face of the complex situation where the water temperature pattern has changed due to hydropower development and observational data are relatively limited, accurate prediction of the water temperature change process under current conditions can be realized by applying transfer learning training technology to a pre-trained machine learning model combined with a small amount of current data. It is worth emphasizing that although this model is based on Yichang Station of TGR, based on the universality of its core technical principles and methods, it has good scalability and can be applied to other river basins with similar geographical and hydrological characteristics and hydropower development, providing strong support for water temperature prediction in a wider region.
In addition, in water resource research, water temperature prediction in areas with little data is a major problem, and transfer learning technology brings new opportunities to solve this [
43]. We can try to collect supplementary data from surrounding areas or similar watersheds to enrich the data samples and, following the transfer learning training approach used in this study, first train the model in a source watershed with sufficient data and then further optimize the model’s parameters. Then, the parameters of the underlying feature extraction layer of the source domain model can be transferred to at least the target basin model of the data, and the partial parameters can be frozen to effectively avoid the distribution drift problem. On this basis, according to the limited data of the target watershed, the parameters of the top fully connected layer can be reset to fit the unique data characteristics of the target watershed. In the training process, a lower learning rate can be used to fine-tune the top-level parameters to prevent the loss of source domain knowledge. In this way, the performance of the water temperature prediction model in areas with little data can be enhanced, and scientific support can be provided for local water temperature prediction and related operation decisions.


 ,
, 
