1. Introduction
Society of the XXI century is in constant development, creating opportunities for the major industries of the world but also challenges in terms of population needs [
1]. One may notice how extensive and exponentially our society is developing into a smart society, posing challenges for redesigning green processes [
2]. In parallel with society, technology is also advancing, influencing the development of products and services [
3]. Thus, products are developing to have more convenient and customized functions [
4], enabling increased market competitiveness.
Companies are implementing complex management systems, aiming to comply with regulatory frameworks that are specific to certain industries. Quality management systems in line with the ISO 9001 standard are part of these management systems, and these are implemented in either regulated or voluntary frameworks, depending on the company’s field of activity.
In this context, organizations analyze and update their organizational framework continuously and regularly, aiming to respond to stakeholders’ needs. Moreover, stakeholder satisfaction appears to be a constant strategic goal for most industries. Standards associated with ISO 9001, such as the ISO 10000 series [
5], consist of guidelines, but despite numerous approaches and tools, companies invest in collecting customers’ feedback for developing structured and systematic actions [
6]. Difficulties arising from the subjective/emotional perspective should be considered [
7].
In parallel, integrated management systems and business models have been developed, tested, and adopted by companies from different sectors [
8]. The latest version of the European Foundation for Quality Management Model (2020, 2025) is aligned with the sustainability principles referenced in standard ISO 26000 and the SDGs (Sustainable Development Goals) defined by the United Nations [
2].
Research on competitive advantage has been extensively conducted in the service and retail sectors, demonstrating a direct association between the quality of customer service and customer satisfaction and loyalty [
9,
10,
11].
Despite numerous studies on management systems, business models, and the role of the customer as a central stakeholder in sustainable business [
12,
13,
14], companies still face limitations in fully integrating their customers into all stages of the product life cycle. Customizing their experience requires resources to be efficiently balanced, and, in a global context, the coordination of processes is challenging.
Whether in products or services, today’s complexity requires practical solutions in all industries. Our study focuses on the challenging and highly demanding automotive industry. Vehicle manufacturers are undertaking similar efforts to ensure that their approach is customer-centric [
15,
16].
Our study explores the key factors that influence customer satisfaction in the automotive industry and proposes a generic example that is meant to capture trends influencing customer satisfaction when developing a new product/model based on industry specificities. Various elements of customer experience are mapped by identifying touchpoints with the customer based on a customer experience map.
The remainder of this paper is structured as follows: customer satisfaction (
Section 2) and customer experience (
Section 3) are defined based on related works, aiming to identify the main phases of integrating CX into product development; the customer journey map is proposed for the product, a vehicle (
Section 4); the customer experience (
Section 5), measured using multiple surveys whose results are processed, is linked to the product life cycle; based on the preceding analysis, the three identified meta-factors (price, design, and durability) are statistically validated (
Section 6); and conclusions, future developments, and limitations are highlighted (
Section 7 and
Section 8).
2. Literature Review
To cover the large and diverse body of research related to the proposed research topic, multiple reviews were carried out [
17].
Despite the practical relevance of customer experience and the increase in research in this field, the current literature provides a limited understanding of this concept. Researchers have acknowledged the emergence of this concept as the result of stimuli occurring at the points of contact between the client and the organization. The process that customers go through before, during, and after a purchase includes direct and indirect interactions [
18]. A similar understanding is presented in [
7,
8], indicating that practitioners primarily rely on explicit measurements to develop customer profiles based on customer perceptions.
Differences may be noticed given the domain, with various studies being conducted in the service, retail, education, health, banking, tourism, and transport sectors [
6,
13,
18,
19,
20,
21,
22,
23].
A selective list related to the concept of customer experience, summarizing the conceptualization of full CX integration, is given in
Table 1. One may notice the evolution, initially researching tools to integrate the customer into the life cycle [
24,
25] and continuing with exploring the description and associated social experiences [
26] that will allow the customer experience [
27] to contribute to branding and strategic sustainable development [
9,
28,
29].
Customer satisfaction cannot be summed up by a universal definition, as it represents the level of customer satisfaction following the use of a product or service. Despite the lack of standardization, this concept still has measurable characteristics. To manage customer satisfaction properly, companies must treat customers as a priority through a data-driven approach that allows them to increase customer satisfaction.
Customer retention [
12] is vital for almost any business, and attracting new customers involves a high consumption of resources.
The evolution of the customer satisfaction concept has led to a much deeper understanding of customer satisfaction and customer value, putting pressure on organizations to meet compliance standards and monitor customer complaints [
5,
27].
Considering the link between customer experience, customer journey [
30], and customer satisfaction [
28,
31], the gap between connecting different customer satisfaction studies with companies’ strategies while developing new products has been explored. The current article proposes different ways of achieving CX integration considering the assessment of customer satisfaction based on the identification and usage of essential determining factors.
The link between the performance level of the attributes and customer satisfaction is not always symmetrical, which does not imply an increase or decrease in the performance of the attribute, but a fluctuation in the overall satisfaction result. The asymmetry between performance and customer satisfaction was demonstrated by Kano (1984) through a study that classifies product attributes according to their impact on satisfaction [
4,
31,
32,
33].
The example proposed in the present study was validated through product attributes, using the methodology described by Kano and a survey. Since its appearance in 1984, the Kano model, also called AQC (Attractive Quality Creation), has become a popular methodology for analyzing the relational asymmetry between attribute performance and customer satisfaction. The goal is “creating a new product with a quality that is not only distinguishable from the qualities of current products but is also attractive to customers”, offering customers the full experience of its development [
32,
34,
35].
3. Customer Experience (CX) Definition
Starting from the need to have global control and visibility over customer satisfaction, the necessity of designing a customer journey map for following customer satisfaction through the process of creating and selling a product has been identified [
36].
Due to the significance of the automotive industry in European and national economies, car manufacturers face several obstacles that may affect product development. Price fluctuations, production costs, and difficulties in operational or administrative processes are just some of the challenges. These obstacles have been intensified by the COVID-19 health crisis and the global economic and financial crisis that followed it. European regulations aiming to achieve a greener economy add additional challenges for this industry.
Customer experience can be seen as a customer’s overall impression of a brand, considering the perception of a company’s products and/or services and the interactions they have had with that company from the marketing research stage to the after-sales support stage [
37,
38,
39].
There are also a multitude of factors such as branding, marketing, websites, social media, and even customer support that can affect their actual experience [
34]. Customer loyalty can increase through positive experiences and can also be lost through negative experiences, which can damage the reputation of companies [
21,
28,
29,
40,
41].
Three phases are necessary to develop the fundamental capabilities for improving customer experience:
Phase 1: Leadership alignment and capability development required in customer orientation, defined as follows:
Conduct research on customer requirements/the market through the use of a range of tools for identifying long-term customer needs, motivations, and behaviors.
Identify and track loyal customers who represent the most valuable customers and learn about their desires, culture, and aspirations.
Implement the voice of the customer (VOC), a tool used to understand customer perceptions and experiences when they interact with an organization across all touchpoints by collecting feedback from customers using multiple sources [
6,
42].
Draft the customer experience/journey map (CJM), a visual representation of every interaction that customers have with an organization [
43].
Implement customer experience/journey analysis (CJA), the process of approaching and analyzing how customers use a combination of specific channels to interact with organizations [
44,
45].
Phase 2: Using loyal customers and mapping their journey to understand and enhance their experience.
To understand customer needs, it is necessary for an organization to create external maps that encompass the points of contact between themselves and the customer. To provide customers with the most pleasant experiences, organizations map their itinerary throughout the life cycle of products or services, considering key touchpoints [
43]. By focusing on these key touchpoints, organizations aim to develop a deep understanding of customers’ wants and needs. Prioritizing loyal customers contributes to the initiative of mapping their experience based on key subsets of customers. Thus, there must be ample data on these clients, which can come from VOC data, interviews, surveys, analysis tools, ethnographic studies, and dedicated groups.
Phase 3: Using experience analytics (CJA) to improve the customer journey.
CJA covers all interactions that a customer has, such as placing an order, receiving goods, filing a complaint, making a purchase in a physical or online store, or returning a product. Considering the evolution of organizations and their adaptation to new digital business models, transactions are becoming more and more complex, and an increase in the number of interaction channels between the customer and the company can be observed [
46].
CJA not only accelerates analysis by coordinating across channels, but at the same time combines a multitude of signals, such as interaction history, demographics, estimated spend, etc. The approach must be complementary to client-oriented plans.
The proposed study combines all three phases, aiming to highlight the full integration of the customer experience through the life cycle of a product. We start with the identification of the critical points for drafting the maps that capture customer experience and collecting the relevant data from each step of product development, ending with the statistical validation of the attributes that were derived from the survey results.
4. Customer Journey Map for Vehicle Development
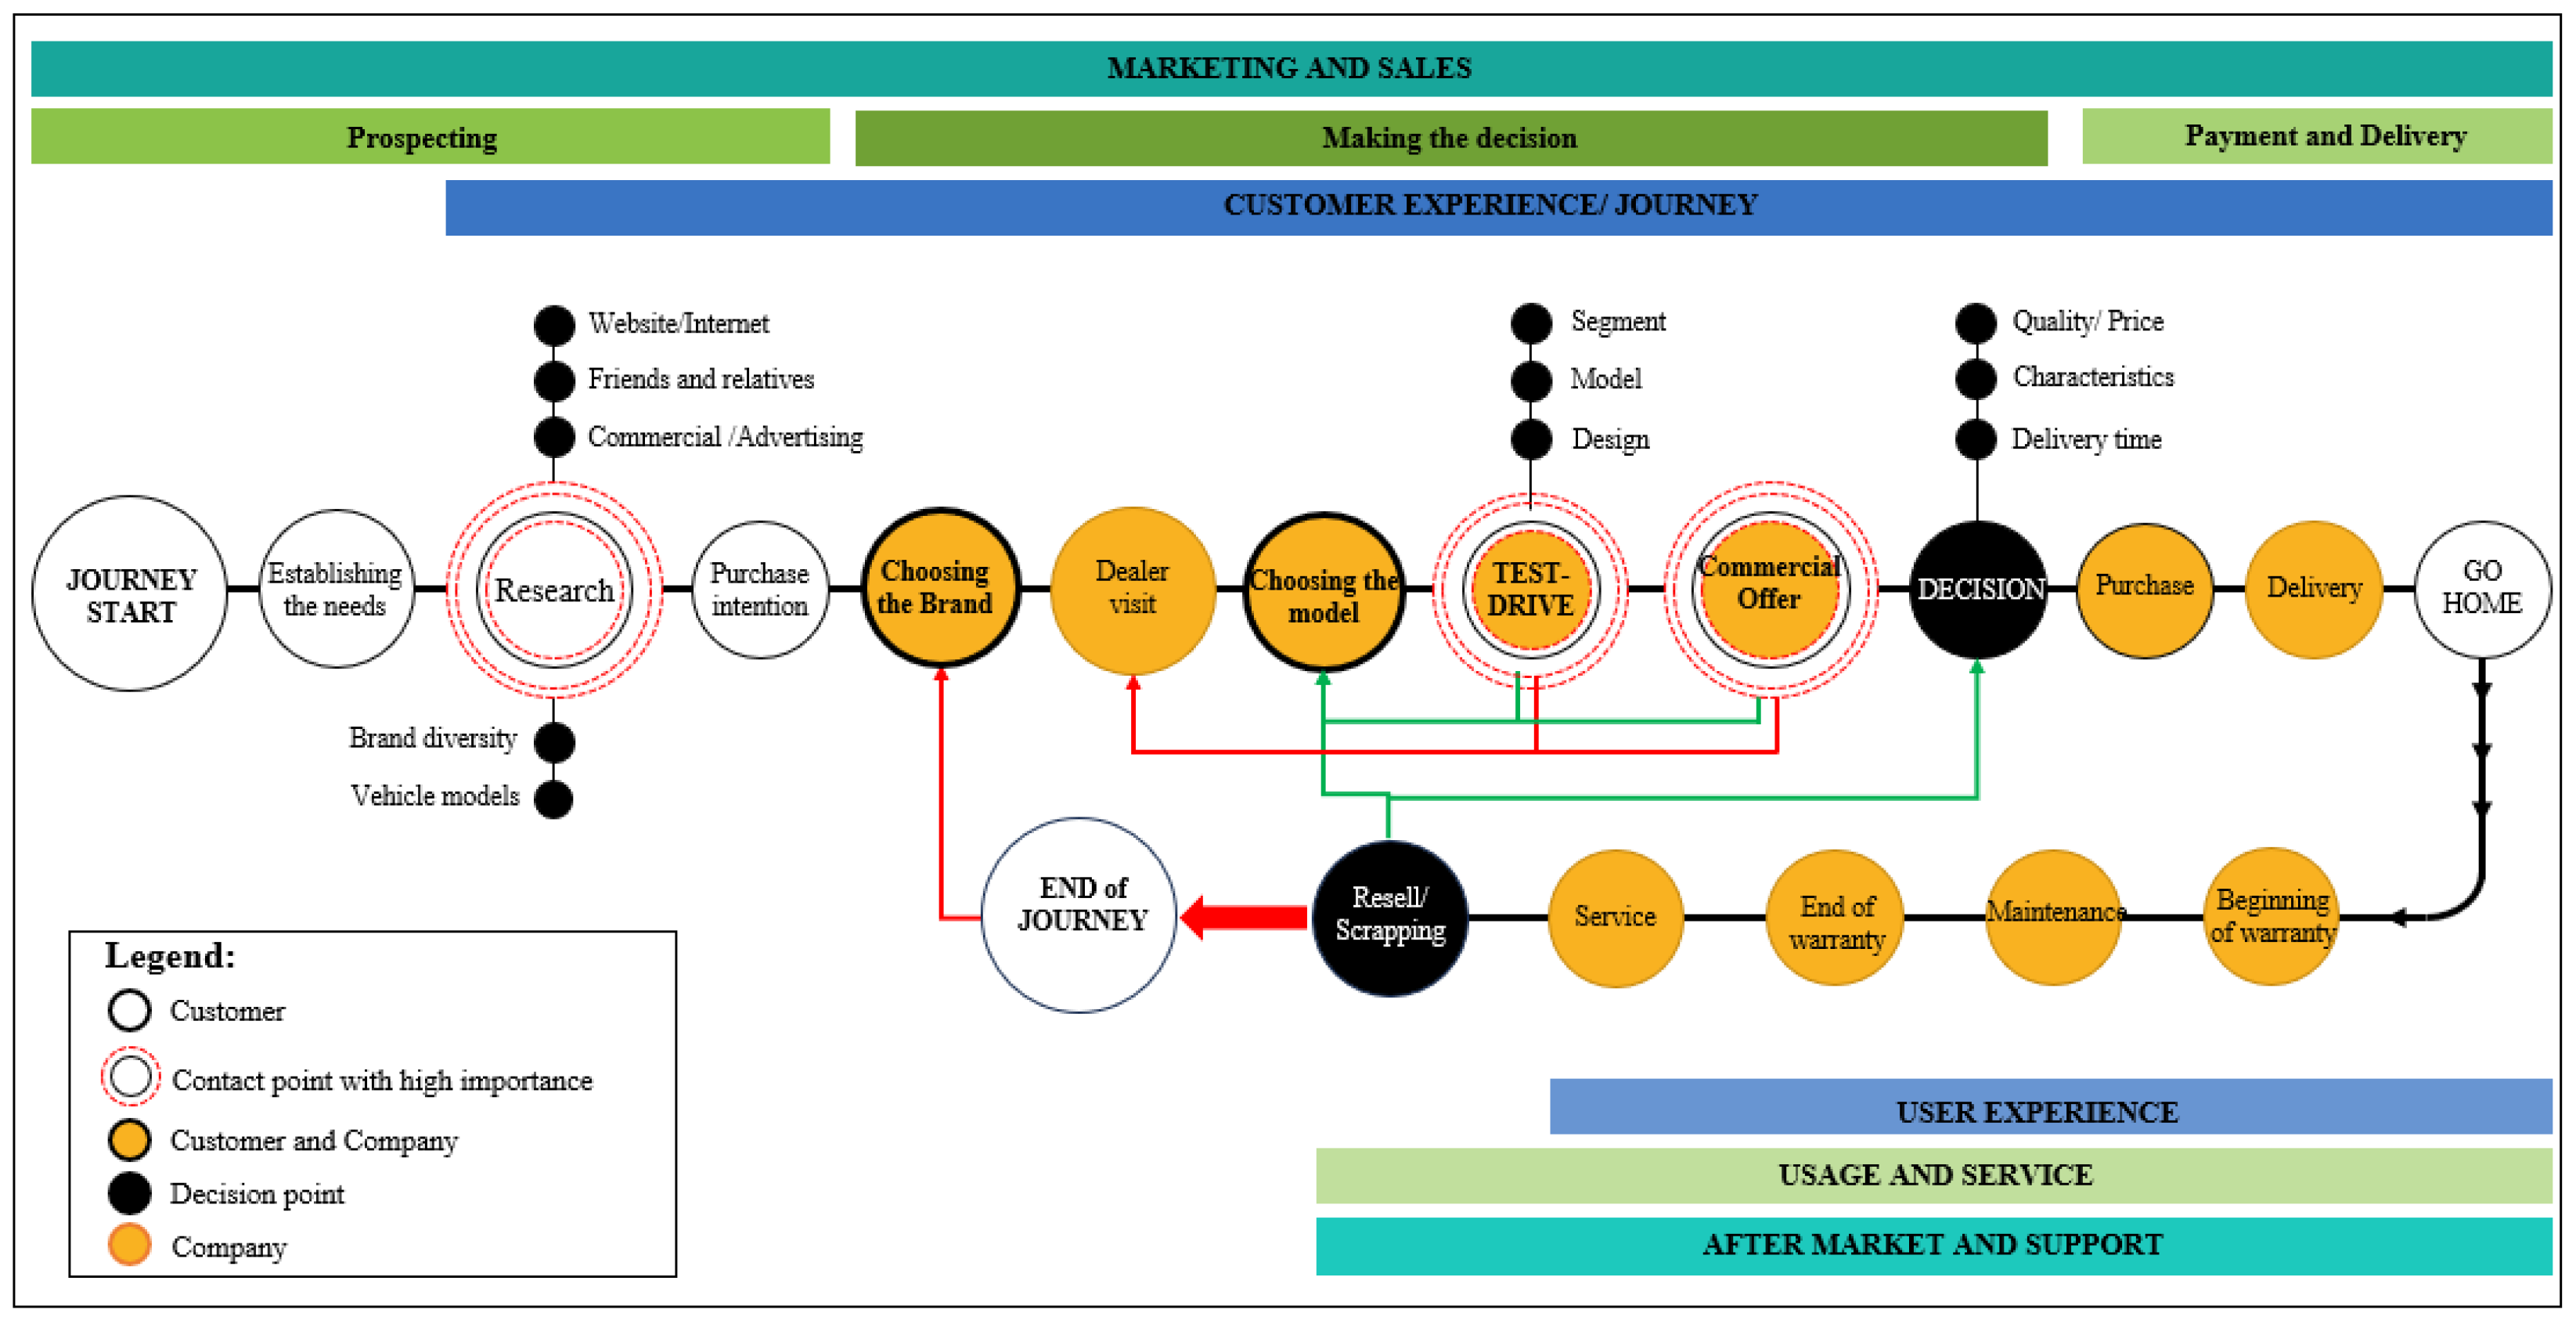
The customer journey map is a graphical visualization of the customer experience, and it enables an organization to identify, structure, and evaluate customer interactions.
Figure 1 illustrates an example of a map of the customer experience for the automotive industry.
The map breaks down customers’ interactions with the organization from the awareness phase to the acquisition phase and beyond, including the initial research stage, the experience (test drive), the purchase, and the service, and ends with the customers’ support for the vehicle brand.
The customer experience begins when they realize that they need a new vehicle. Once the customer has consulted various sources of information, they will start thinking about which option is best for them: brand, vehicle, price, etc. Following visits to one or more dealerships of different brands, the decision phase follows as the final step. Customers know exactly which vehicle meets their needs, and the next step is to choose from the different options offered. Next comes the action of placing the order, followed by payment and delivery of the vehicle. After-sales assistance (maintenance, repair, and spare parts) is also an important aspect in customer retention.
Each customer is unique, and that is why they each has a different influence on the business. Consequently, the manufacturer must effectively explore customer opinions. This study is descriptive and integrates quantitative and qualitative elements that have been measured, classified, and statistically validated, and that have contributed to the identification of customer patterns. The survey was used as a method of data collection based on questionnaires that were used as application tools [
47,
48,
49].
In the present study, a selective survey was used, being a frequent investigation method, based on different techniques and tools for data collection. It can provide complete information regarding a certain situation or data from different periods, such as the key points of customers’ experience with manufacturers.
The questionnaire is a research tool made up of a series of questions that are logically organized for the purpose of collecting information from different people. Thus, to achieve the aim of this research, the objectives of the questionnaire-based surveys were set as follows:
1. Determining customer satisfaction in the automotive industry.
2. Identifying the meta-factors that influence customer satisfaction.
Finally, the meta-factors’ effect on overall customer satisfaction using ordinal regression was tested [
50,
51,
52].
5. Customer Experience (CX) Integration Through the Product Life Cycle
To achieve the integration of customer satisfaction, four main stages were completed: data collection, centralization, data review, and statistical validation.
The example used in this study is structured based on the life cycle of a vehicle, including the following stages: planning and exploration, design and development, manufacturing and validation, industrialization, and after-sales assistance.
The development of a vehicle has been carried out in stages over several years. All of these steps have as the starting point the market prospect, then continue with a fully industrial life cycle, and end with the total exclusion of the vehicle from the market [
31,
53,
54]. As defined by Juran’s quality loop [
53], the set of vehicle development stages can be visualized as shown in
Figure 2 and contains 11 stages, grouped into the following five main phases:
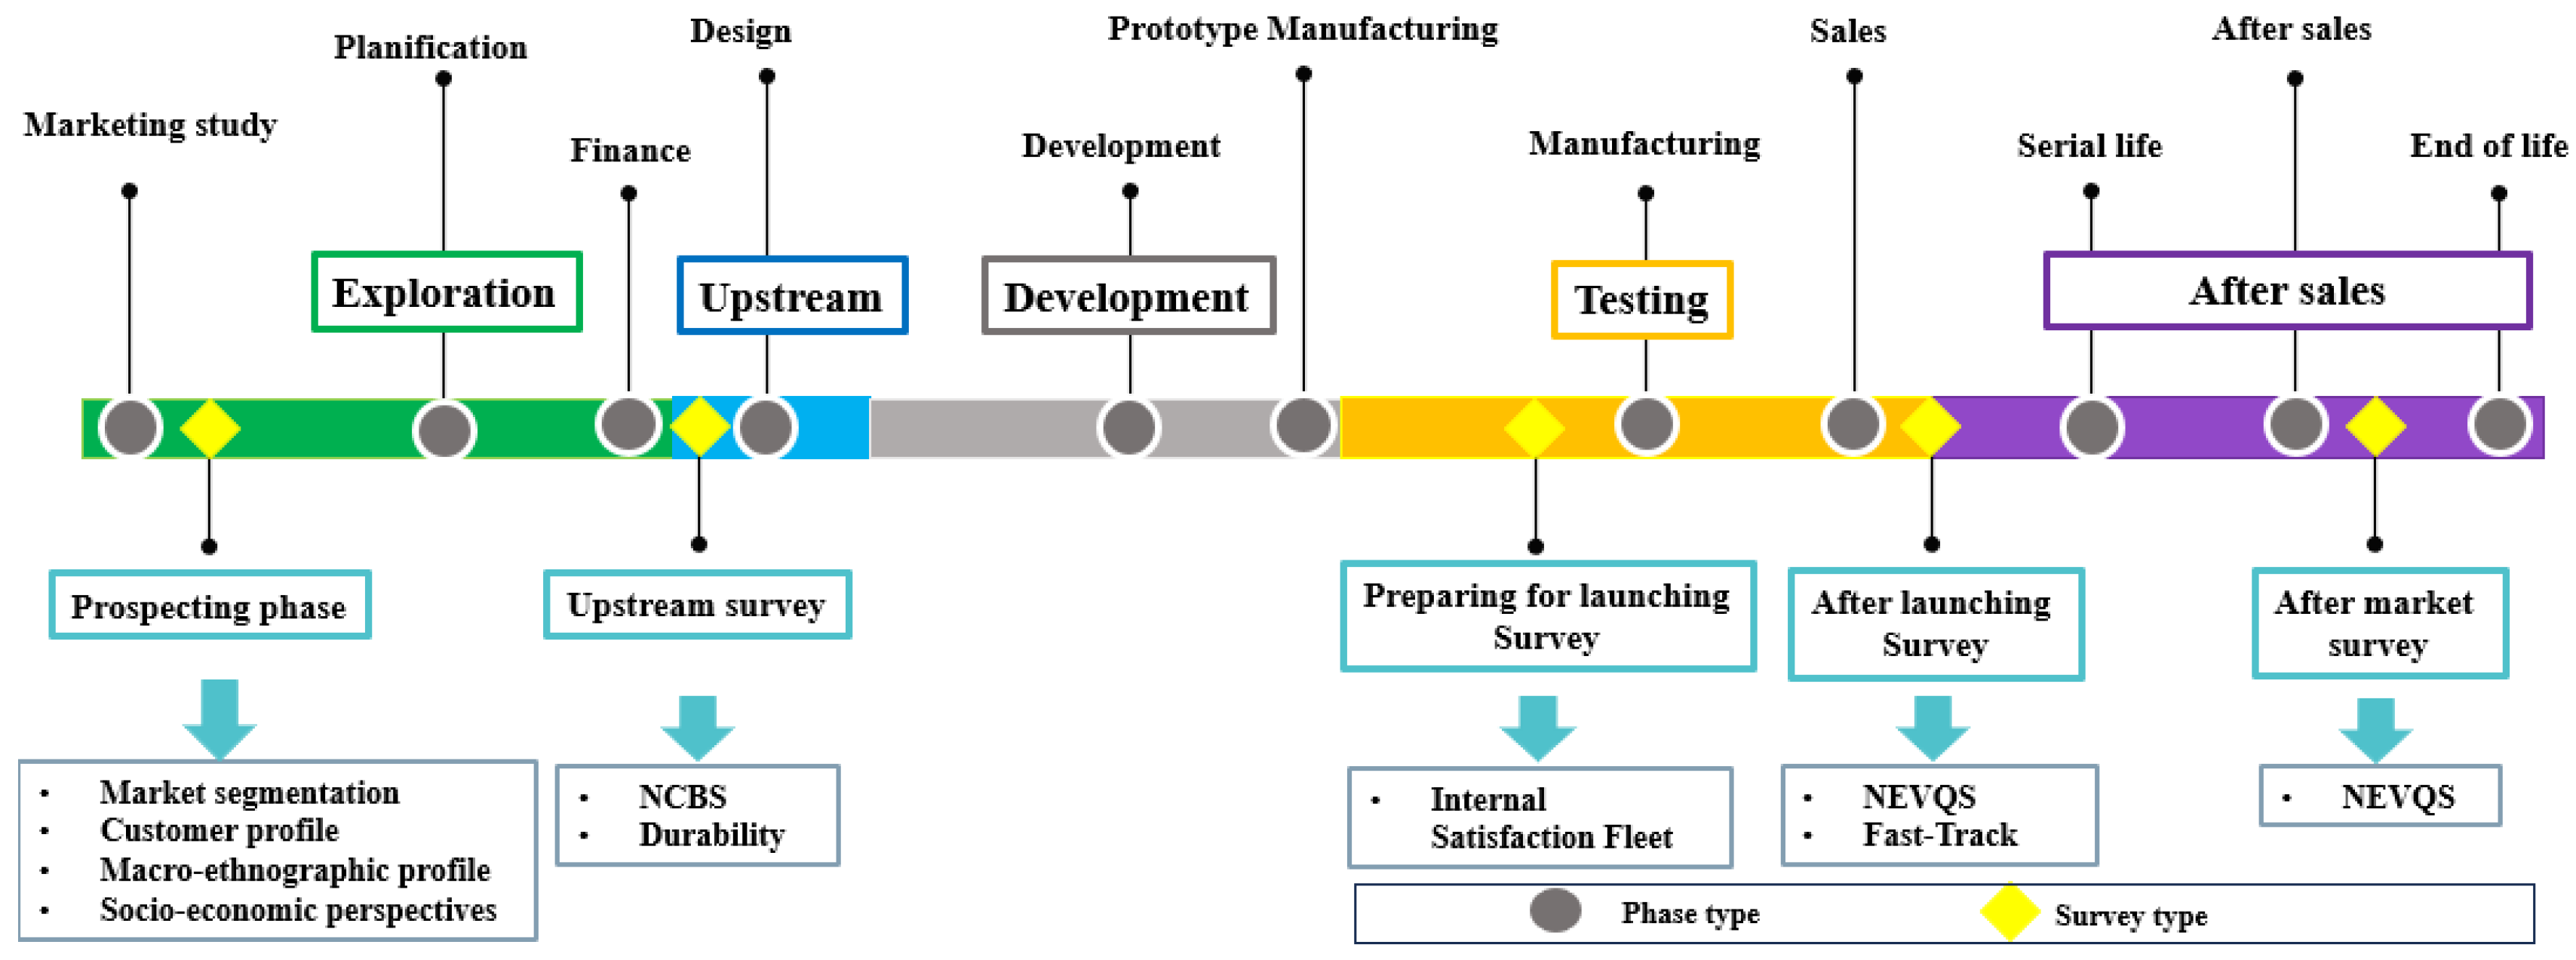
In this process, each customer considers that their experience is unitary, with each touchpoint having a different impact on the purchase decision. This is why manufacturers actively involve their customers in vehicle development, introducing data collection surveys at key moments in the development process.
Figure 3 presents the key moments chosen by manufacturers to assess customer satisfaction.
The following presents the chosen method for polling customer satisfaction (type of survey) and the type of instruments (questionnaire) that are used in the development stages of a vehicle:
The prospecting survey is used in the exploration phase for market potential research.
The upstream survey is conducted before the design phase begins and is based on the NCBS (New Car Buyer Survey) and the durability survey.
The launch preparation survey is a Customer Satisfaction Fleet survey and represents a type of internal survey.
The post-launch survey is conducted through NEVQS (and Fast-Track surveys).
The life cycle survey aims to monitor customer satisfaction over a defined turnover period through the NEVQS.
For a better understanding of the impact of measuring customer satisfaction on the process of developing and selling a new vehicle, all of the factors that influence the process were identified. Therefore, this study considered two types of necessary information: data provided directly from the client and internally collected data from studies and analyses carried out on figures and costs.
5.1. Prospecting Survey
The selection of what type of vehicle model should be designed is a decision made in the exploration phase following the prospecting survey. At this stage, certain market studies will be considered to contribute to the identification and selection of the proposed vehicle model and segment.
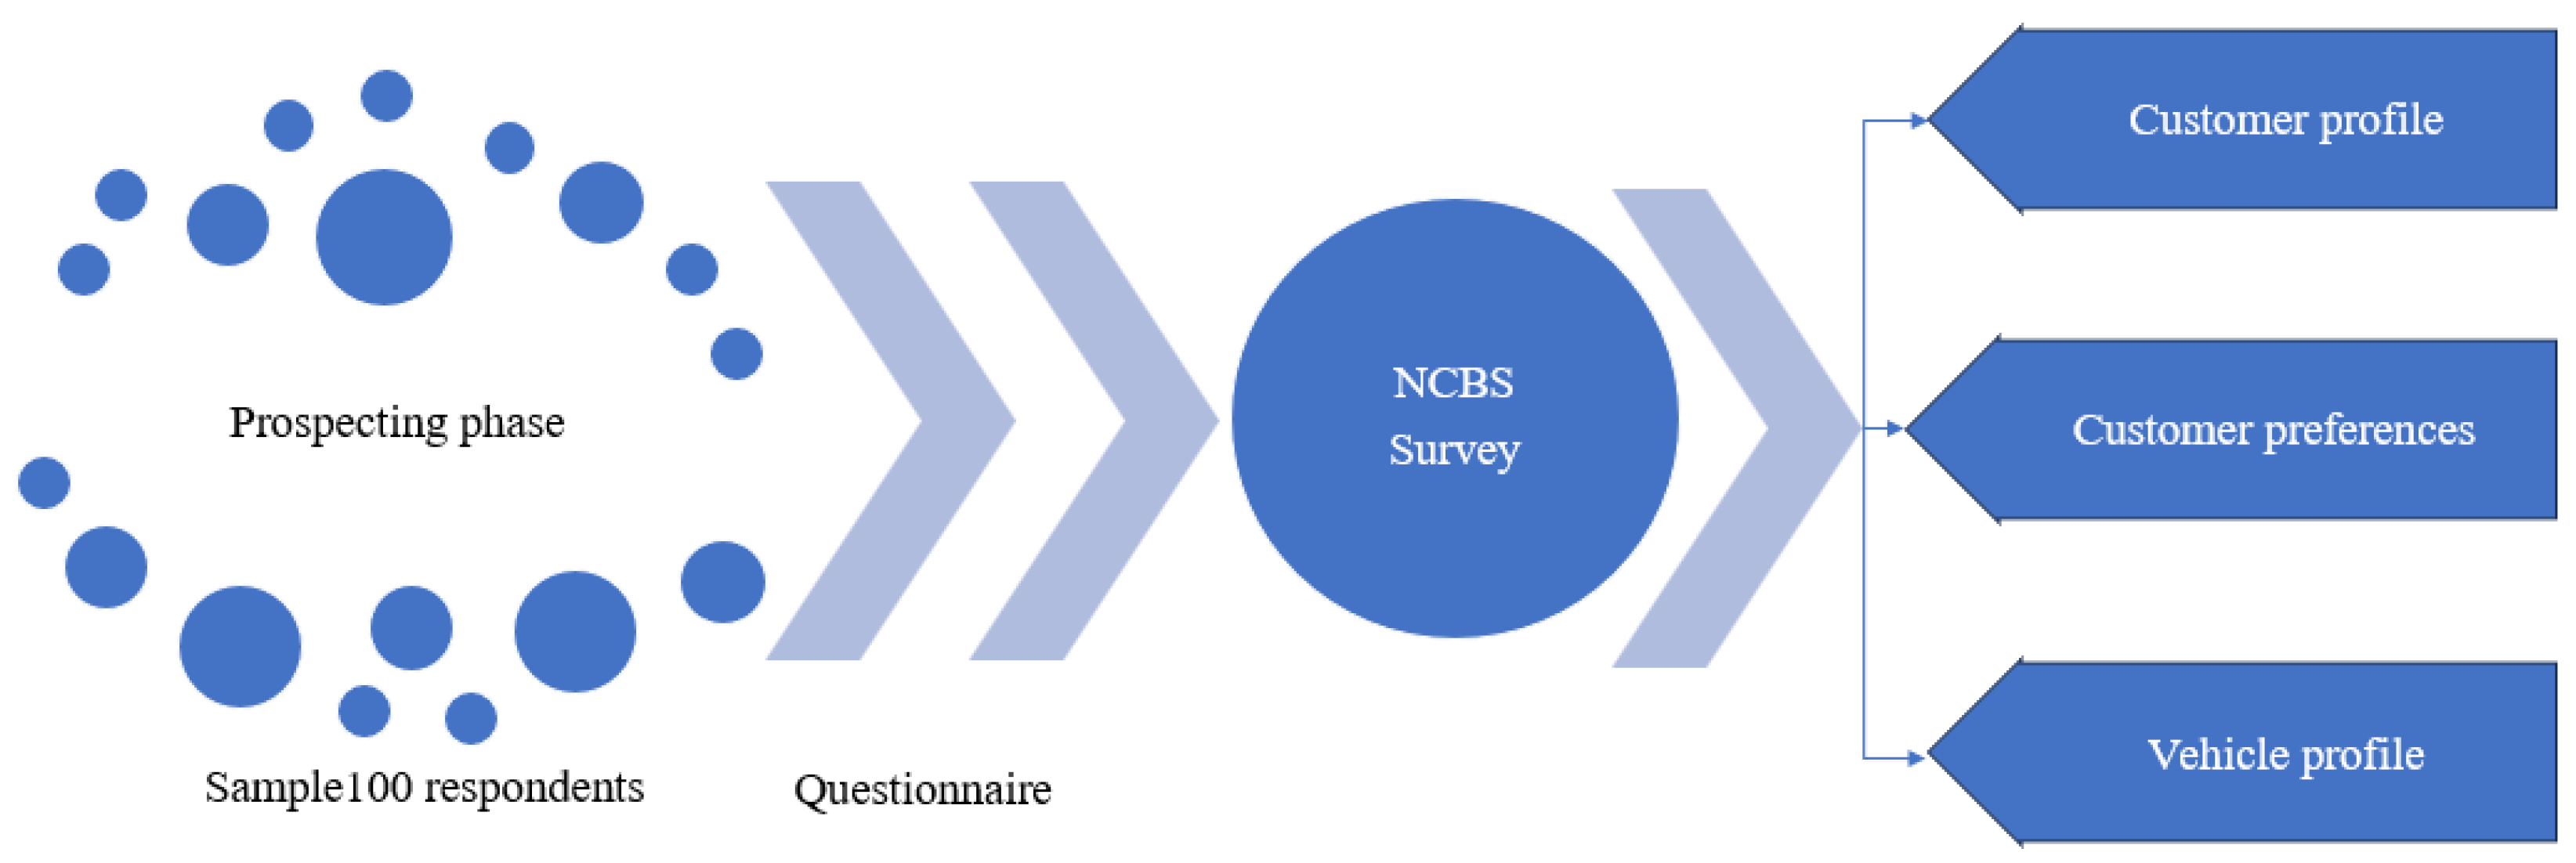
The NCBS is used to identify customer profiles and their needs, as presented in
Figure 4.
The NCBS is applied through the NCBS questionnaire, which contains 23 mixed questions as follows:
- (1)
Demographics: The questions used are intended to obtain personal information from survey participants (age, gender, occupations, income, education level, and ethnicity).
- (2)
Geographic: The questions used are intended to obtain information related to the locations of customers, namely city dwellers or suburbanites.
- (3)
Socio-economic characteristics: The questions used involve details related to class, lifestyle, personality traits, generation, interests, hobbies, or customer preferences.
- (4)
Behavioral characteristics: The questions capture details regarding the affinity for a brand, consumption and shopping habits, expenses, etc.
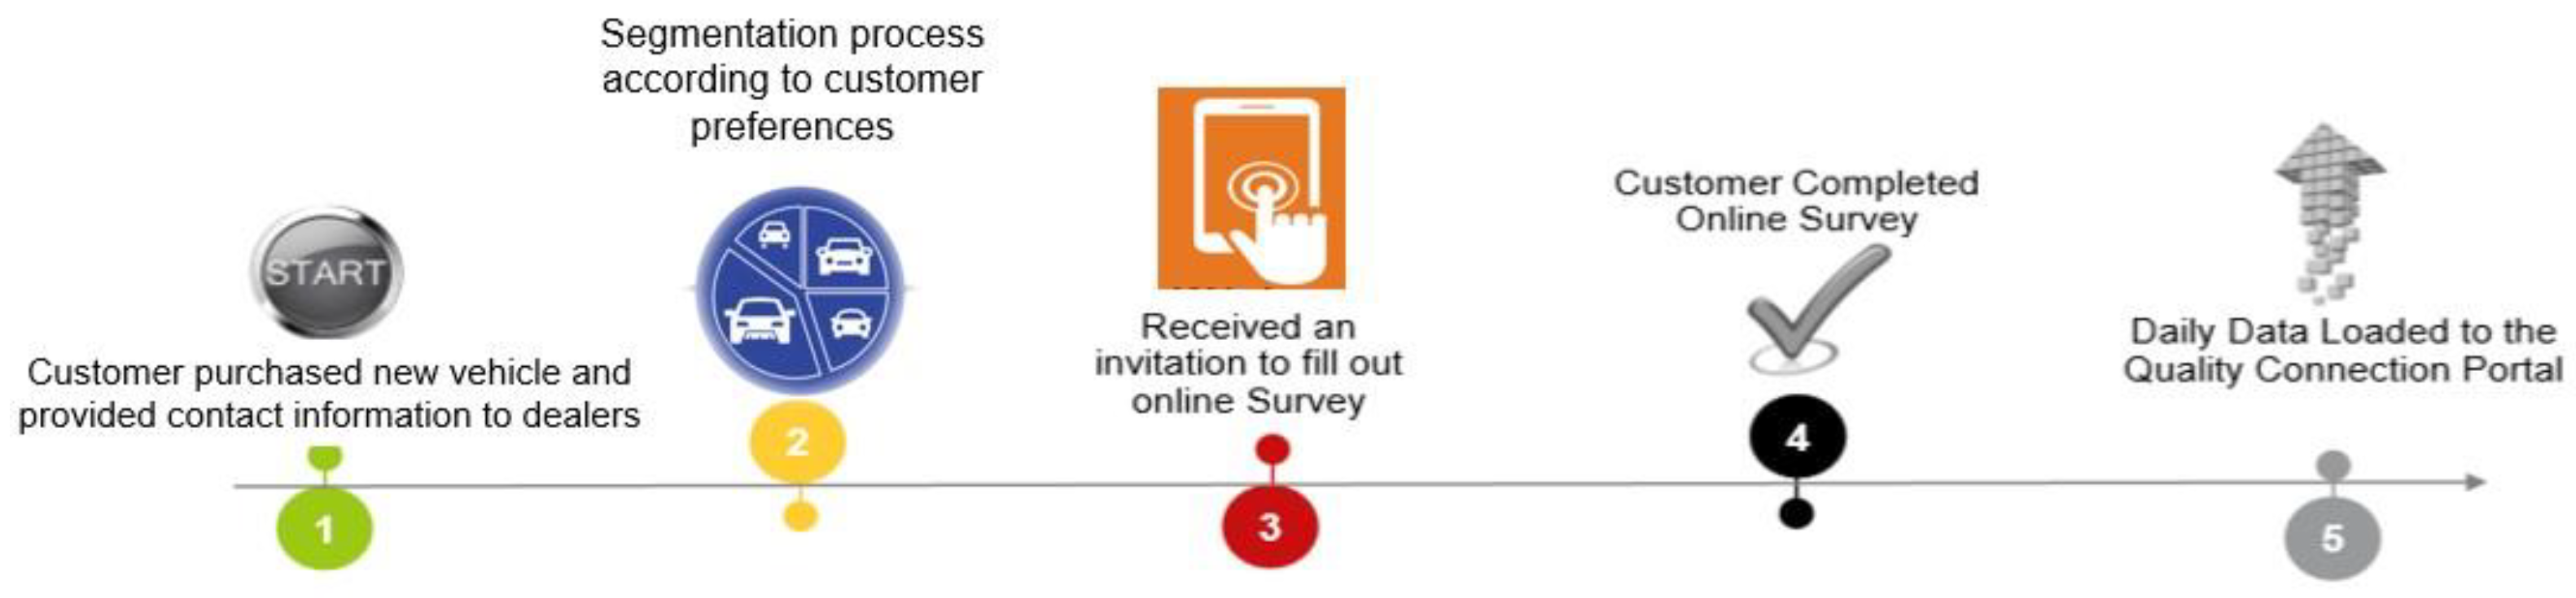
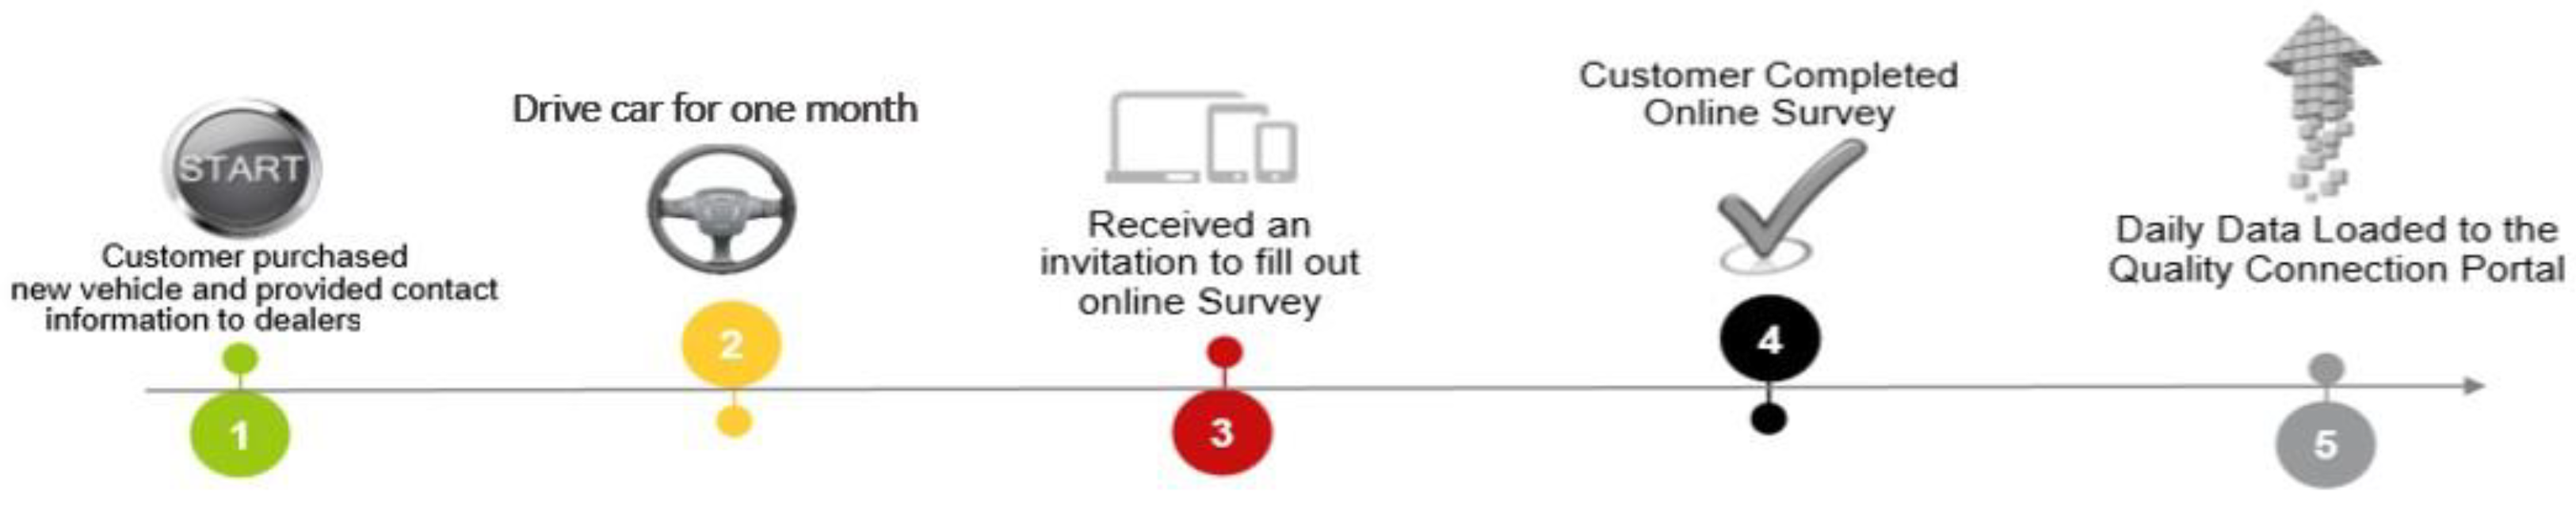
The NCBS investigation is carried out in five steps, as shown in
Figure 5.
After the visit to the dealer, the customer leaves their contact details, and depending on their profile and requirements, a vehicle segmentation process is carried out, ranking their preferences. Depending on the resulting ranking, a sample of customers with specific preferences will be selected to fill out the survey, receiving an invitation by e-mail to complete the questionnaire. After submitting the questionnaire through various platforms, the data will be automatically downloaded to internal platforms, and the data analyzing process will begin.
After employing the survey to collect data from the proposed generic example, the following steps were taken:
- (1)
The first step was to explore the Romanian market based on the registrations of 2022 and 2023, published by DRPCIV, the Romanian Vehicle Registration institute [
55].
The extracted data were used in market exploration, offering us early insights into customer preferences for the brands that are sold in Romania. In this phase, customers’ preferences in terms of brand were identified, considering the number of registrations from the selected period and the segmentation of vehicles according to their class.
The top brands of vehicles registered in Romania in 2022 can be viewed in
Figure 6.
The selection of nine brands was made based on the percentage sum of the number of vehicles that were registered for each of them, and the number obtained represents 95% of the total vehicles registered in Romania in 2022. Thus, we decided that only the top nine vehicle brands were relevant for presentation in this study. In this ranking, Dacia ranks top in terms of sales for 2022, with 39,910 registered vehicles, representing 38% of the total number of vehicles that were registered in 2022, followed by Toyota, with a percentage of 10%.
The selection of the top brands in
Figure 7 was made based on the percentage sum of the number of vehicles registered for each of them, and the number obtained represents 85% of the total vehicles that were registered in Romania in 2023.
In this ranking, Dacia also ranks top in terms of sales, with 40,752 vehicles, representing 33% of the total number, followed this time by Renault, with a percentage of 8%, and Toyota, reaching third place with 7%.
As a customer preference for Dacia can be distinguished, we chose to focus on this brand for this study. The study of customer behavior and vehicle segmentation according to their needs was the next step in the analysis.
- (2)
Considering the same timeline (2022–2023), the segmentation of vehicles according to class was carried out, highlighting a preference for segment B.
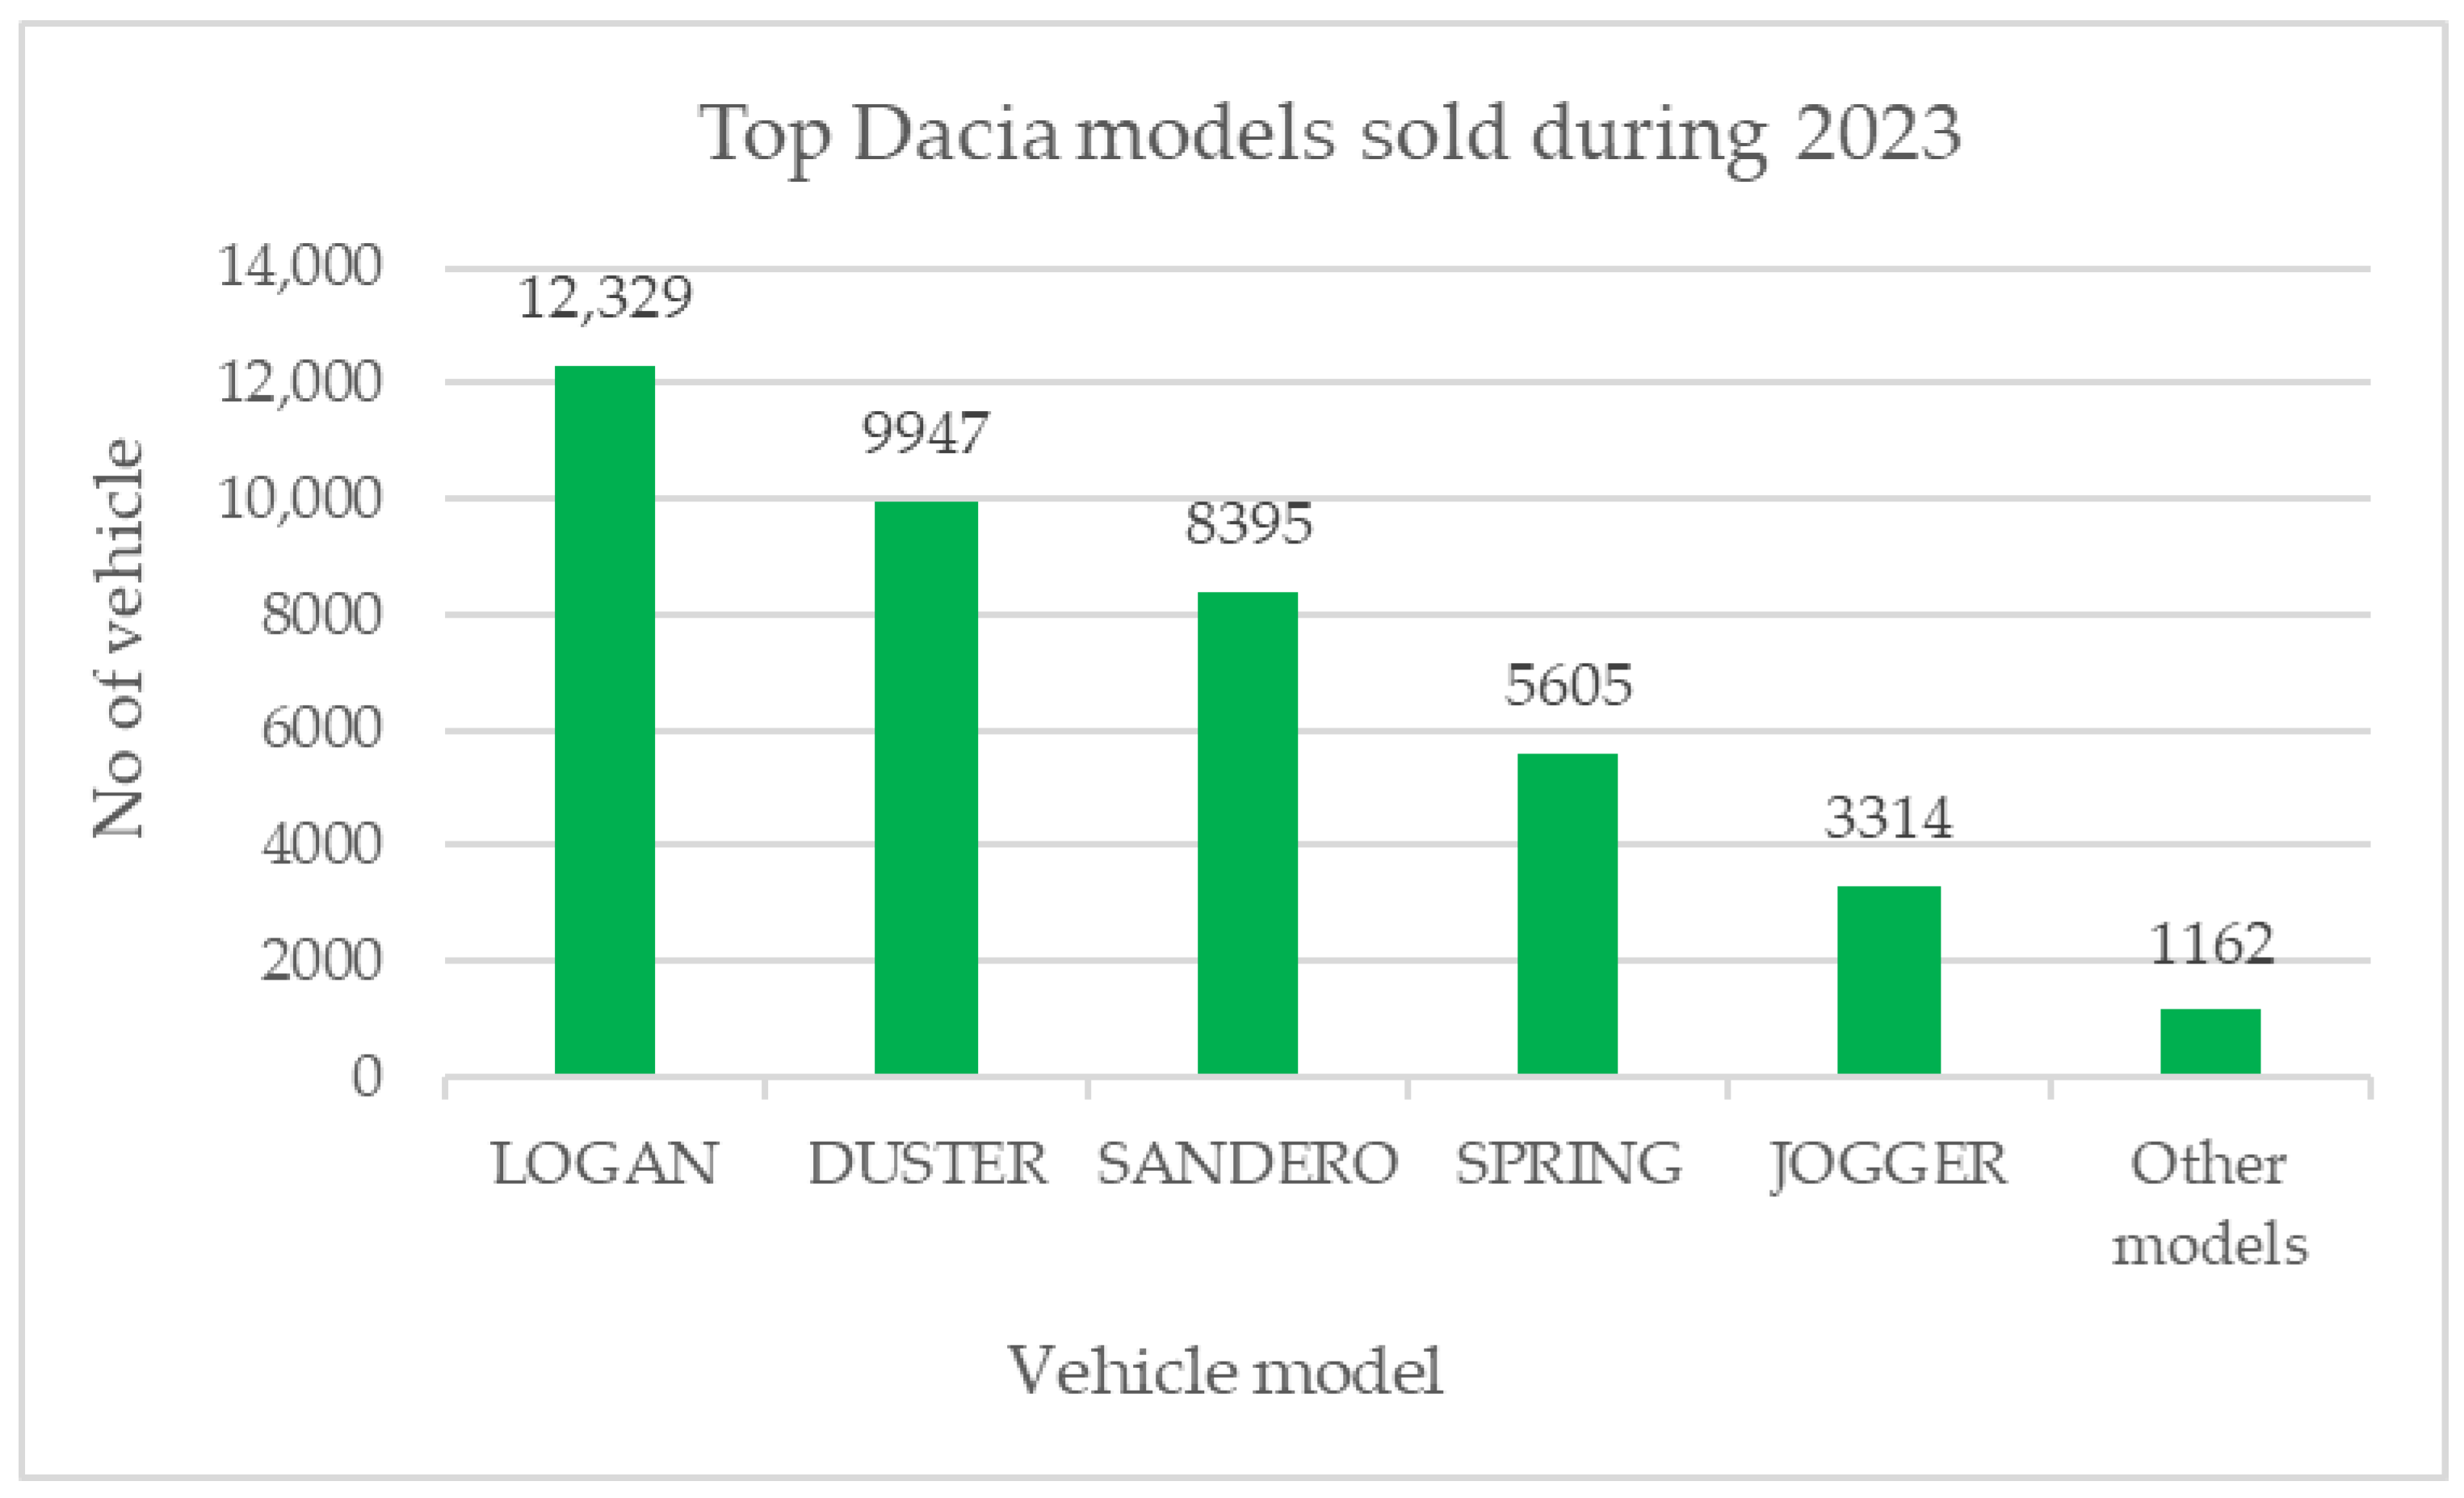
Figure 8 highlights the ranking of the bestselling models from the Dacia range, and according to the manufacturer’s classification, they were classified into the following classes:
The Logan model—class B, described as a compact car that can be found in several forms such as hatchback, combi, or sedan. This type of vehicle is often used for driving in the city, but also outside of it.
The Duster model—the B-SUV segment, described as a compact SUV positioned between the small and compact class.
The Sandero model—part of the B segment, described as a subcompact or minicar. The model represents the small car category and was the bestselling segment in Europe in 2020.
The Spring model—segment A, which is the first category in the classification system defined as an electrically powered car, created to be driven mainly in the city.
The Jogger model—part of the C-MPV segment, described as a minivan, with a shape like a minibus and the specification that it is used for personal use.
Considering the results from this step, the analysis continued with the identification of the customer profile using the NCBS.
- (3)
The figure below presents the main steps of the survey methodology, including the targeted participants, namely a minimum of 100 potential customers, who received an invitation to fill out the NCBS questionnaire.
The analysis of the customer profile can be viewed in
Figure 9.
Analyzing the answers of the respondents, 72% were male customers, with an average age of 46–55 years; they did not have children and were interested in small cars with which they could move around the city.
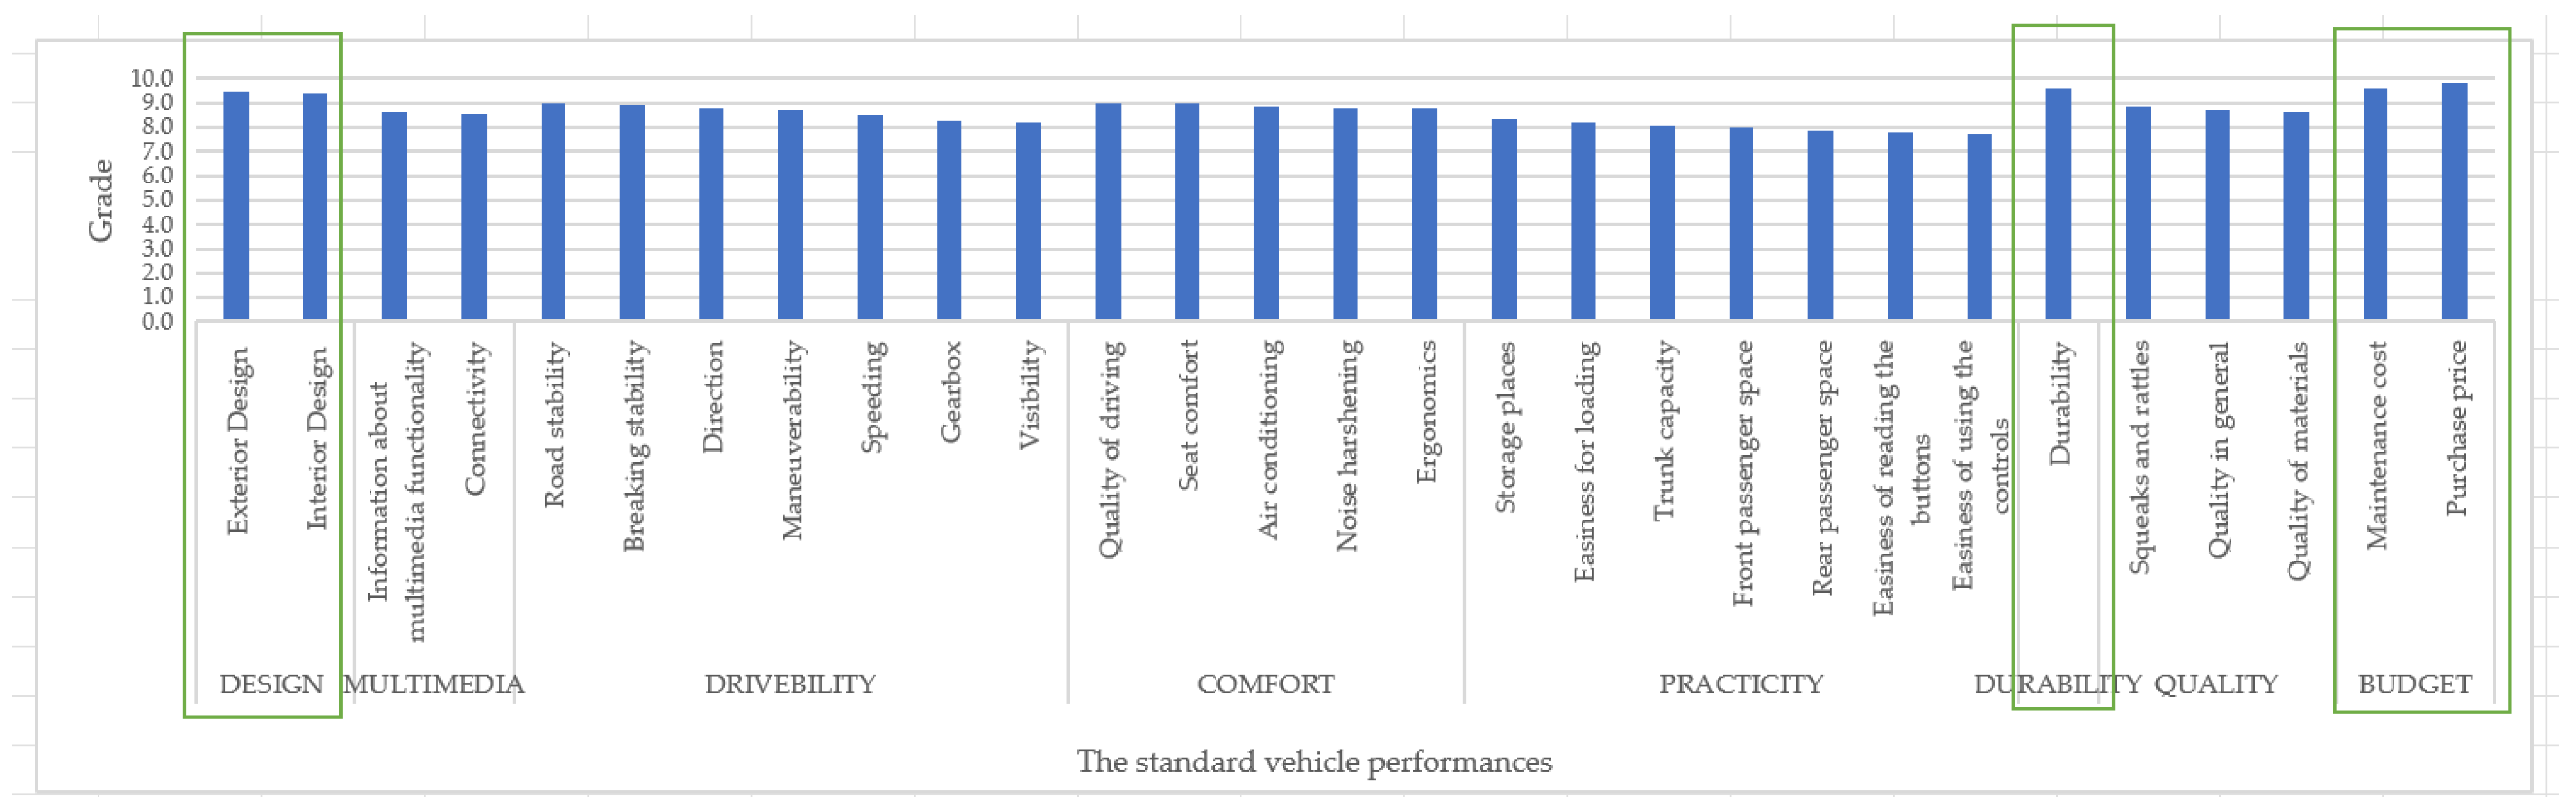
Figure 10 highlights the top ranking of customer needs and preferences for a B-segment vehicle, considering its standard performance. The ranking was performed by calculating the average scores awarded by the respondents in terms of the importance of performance. The grading system used was built using a Likert scale with grades ranging from 1 to 10, where grade 1 represents the lowest importance and grade 10 the highest importance.
Analyzing the main performance aspects of a vehicle—design, multimedia, driving performance, comfort, practicality, durability, quality, and budget (according to
Figure 10)—three aspects with the highest scores could be distinguished: design, with an average of 9.4 and 9.5; durability, with an average of 9.6; and budget, with averages of 9.6 and 9.8. In contrast, the aspects of performance that are deemed less important lie in the “Practical use” category: storage space, with 8.3; ease of loading, with 8.2; trunk capacity, with 8.1; front space, with 8.0; rear space, with 7.9; button readability, with 7.8; and ease of button access, with 7.7.
The scoring system for standard performance shown in
Figure 10 is presented in
Table 2.
The market prospecting showed that 23% of customers are moving toward purchasing cheaper vehicles, which is why they want to maximize the value of their investment. Their choice is influenced by numerous factors such as purchase price, maintenance costs, and income.
These conclusions are correlated with the results of the survey and show that the needs and preferences are focused on price and design. Customers desire an economical vehicle with a pleasant appearance.
5.2. Upstream Survey
The design and development of a vehicle model are activities that take place in the planning phase, following the upstream survey. The design and development of a vehicle model focus on several aspects. First, in developing a new vehicle, one starts from existing models in the factory and analyzes whether they contain components that should be transferred to the vehicle being developed. Most manufacturers use at least 40% of existing vehicle components to avoid complicating the diversity of parts and wasting resources for a new portfolio of suppliers.
The conclusion of the exploration phase investigation represents the starting point of the design and development of the new vehicle. The new model’s design is based on an existing vehicle in production, aiming to keep modifications made to components below 50%. This indicator is based on knowledge that is directly acquired in the automotive industry. The selection of reused components in the new model will consider several factors, such as the costs and production capacity, the potential of suppliers to increase the production volume, and customers’ returns based on the reliability and durability of the vehicle over time. Technical progress and development require a mandatory improvement in certain components. Legislative regulations are also considered.
At this stage, both components that will be retained from previous vehicles and components that will be improved for the newly developed vehicle model have been identified through the NEVQS and the prospecting survey, with the objective of creating an economically affordable car.
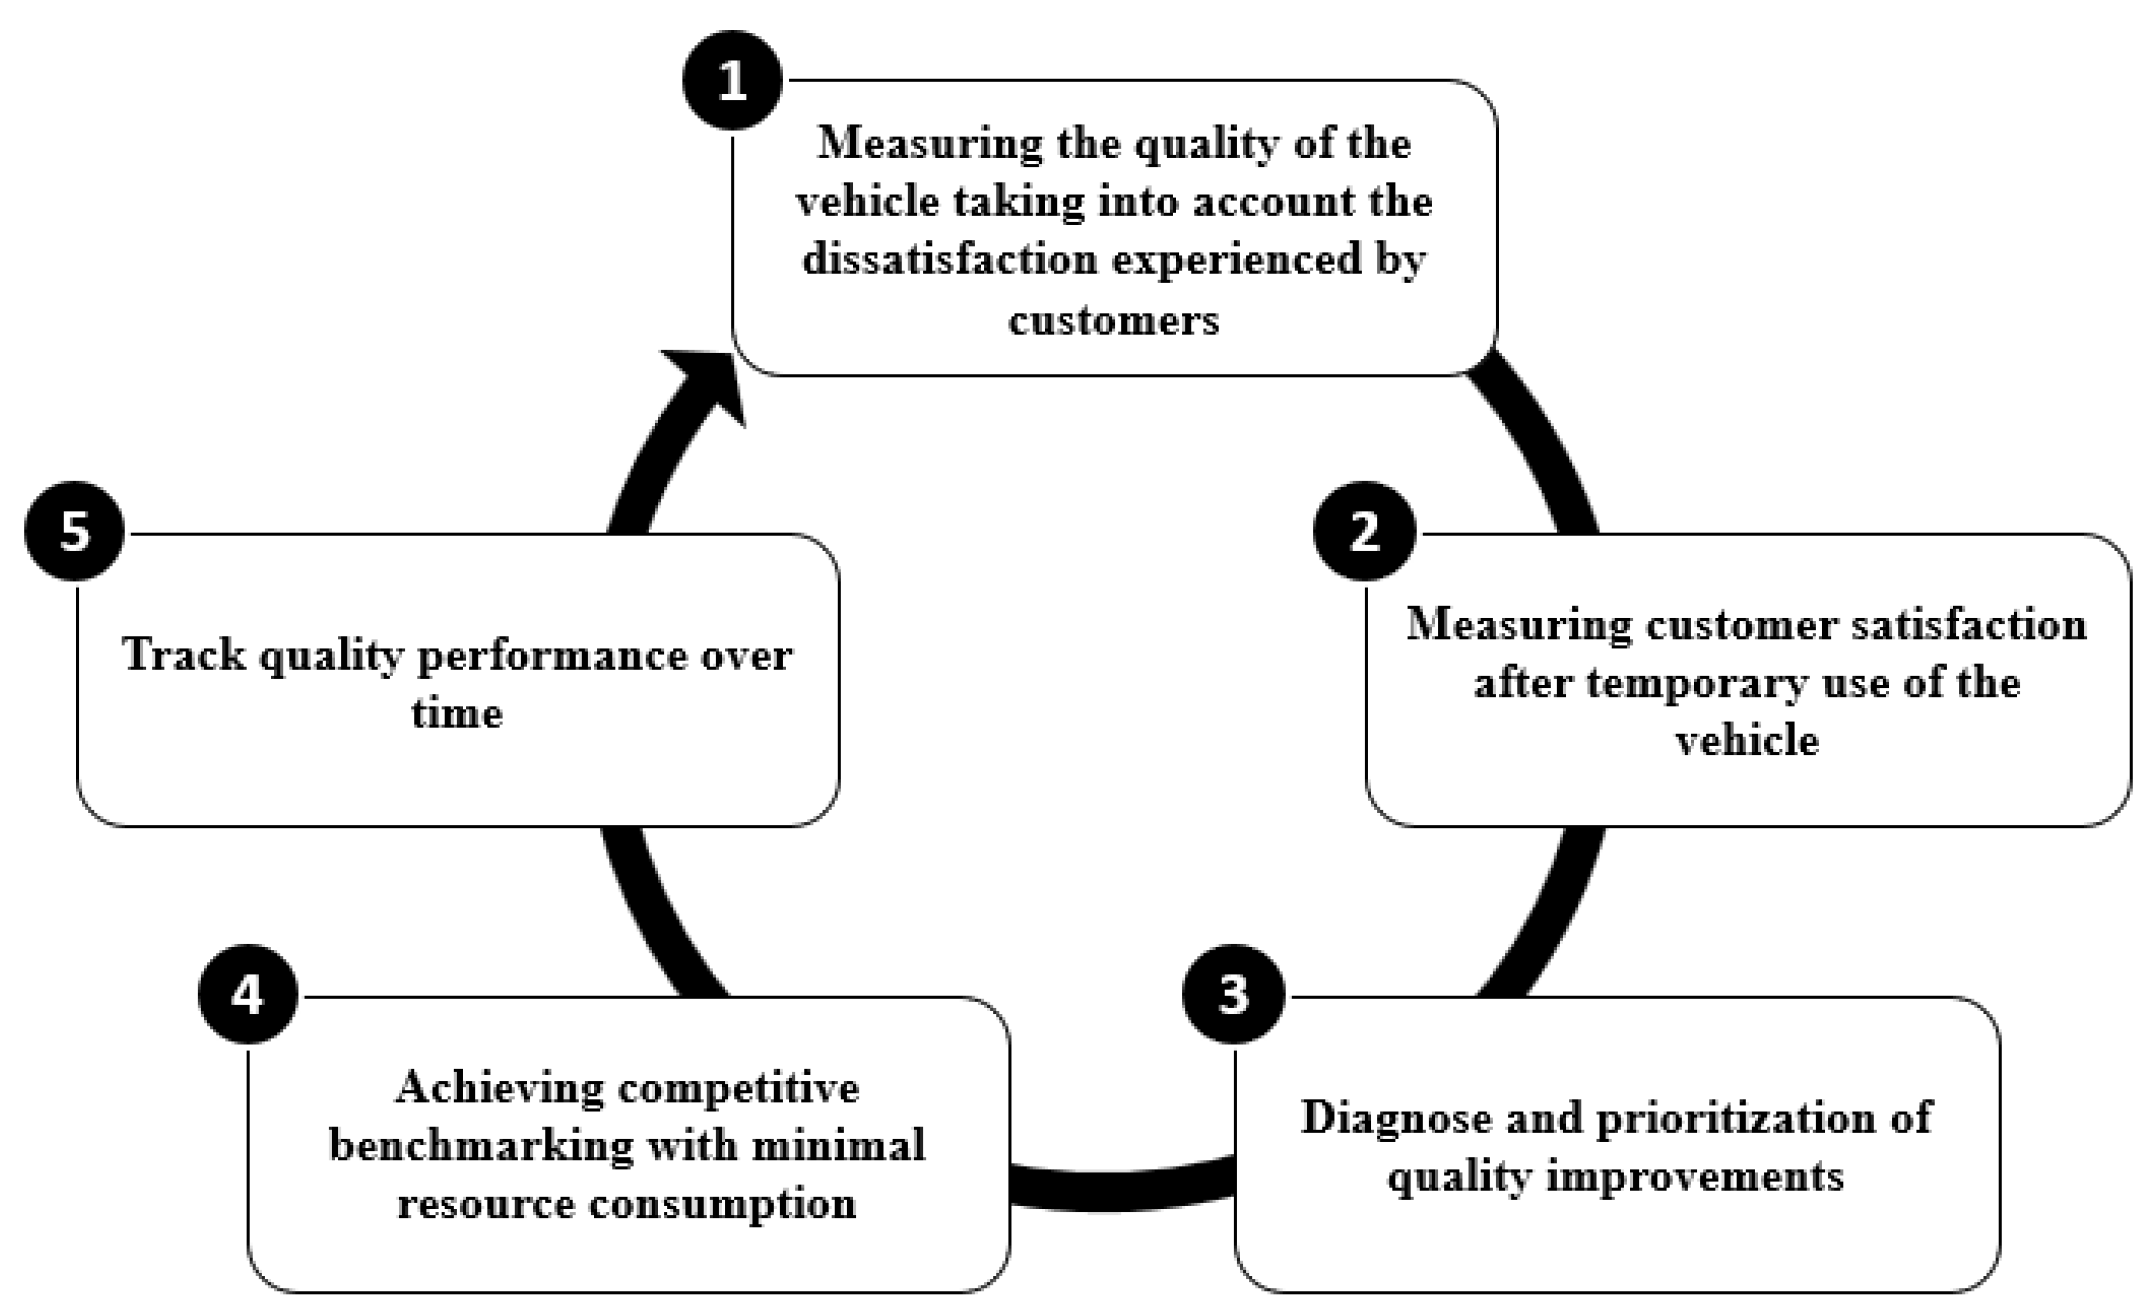
The NEVQS has multiple functionalities in research, impacted by the type of NEVQS questionnaire. It is a survey that involves understanding customer experiences after a predetermined turnover period. The period can be set according to the producers’ objective, varying from three months to three years. For capturing real insider knowledge, the survey explores vehicle attributes such as quality and reliability, driving experience, and sales dealership experience (buying and maintaining). The five general objectives of the survey are divided as indicated in
Figure 11.
The NEVQS is applied in two phases:
- (1)
In the post-launch phase, for customers who have driven their vehicle during a period of up to three months, the survey identifies defects that went unnoticed in the testing phase.
- (2)
In the life cycle phase, for customers who have a vehicle mileage period ranging between 3 and 36 months, the survey collects information on the vehicles’ quality and reliability as perceived by customers.
The NEVQS questionnaire contains four sections, as follows: (1) a section containing customer-related questions, (2) a section containing questions related to overall satisfaction with the vehicle, (3) a section containing questions related to identifying defects, problems, or other grievances, and (4) a section containing details related to customer preferences.
The survey structure is presented in
Figure 12.
After the purchase of a vehicle, the customer’s data remain registered in the network. Depending on the purpose of the survey, after a period ranging between 3 and 36 months, an online invitation is sent out asking them to fill in the specific questionnaire. The information from the completed questionnaire is input through platforms and used for analysis. The obtained data are recorded as a unit of measurement in Ni% (number of non-satisfaction), providing insights into the car’s performance, depending on its impact on customer satisfaction (
Figure 13).
According to the proposed example, the feedback collected from the survey participants is used in the planning of future model vehicles.
The results of the survey are presented in
Figure 14 and indicate 20 aspects with poor performance, for which there is dissatisfaction counted in terms of Ni (%), the specific unit of measurement for this type of survey.
According to the results of the NEVQS, the most common problems are durability, ergonomics, multimedia, and noise and vibration. As the survey aims to identify durability-related performance, customer complaints with the greatest impact over time were analyzed as shown in
Figure 15.
Figure 15 shows the five main elements that are directly related to durability. According to customer feedback, the main components and accessories that will be improved in the next project are the quality of the paint, the carpet material, the materials used inside the car, the exterior gaskets of the windows and bodywork, and the use of an anti-corrosion protective layer for the components under the body.
At this stage, both components that will be retained from previous vehicles and components that will be improved for the new vehicle model developed have been identified, with the aim of creating an economically accessible car.
After applying both the NCBS and NEVQS, we can identify the three meta-factors with the most significant impact on customer satisfaction, namely price, design, and durability.
5.3. Launch Preparation Survey
Following the launch preparation investigation, the activities that take place in the testing phase are manufacturing and validation of the new vehicle, together with performance measurement and improvement. Based on customer feedback from earlier phases, the vehicle reaches the manufacturing stage meeting customer expectations. These expectations cannot be met 100%, because priority will be given to legislative regulations and costs related to improvements.
To verify, one must validate and measure the performance of the new vehicle before reaching the customer, and then the internal Customer Satisfaction Fleet survey will be applied. This survey can often capture common aspects that can also be found in external customer surveys, but the general perception of a customer paying for a vehicle is different from one who has not paid for it.
The launch preparation survey allows the prototype vehicle to be internally evaluated by employees and highlights the overall satisfaction and quality, focusing on strengths, weaknesses, and opportunities for improvement. All of these factors are meant to contribute to validation, identifying any problems or defects before launch.
The number of vehicles to be tested is established before the Customer Satisfaction Fleet surveys are launched. The vehicles are visually inspected and tested on the road by a group of employees who are selected in advance according to certain criteria and who will fill in the specific questionnaire at the end. The structure of the Customer Satisfaction Fleet survey is presented in
Figure 16.
The launch preparation survey is applied through the Customer Satisfaction Fleet questionnaire, which contains eight simplistic questions that highlight the characteristics of the vehicle by rating them with scores from 1 to 10. Grades higher than 8 represent maximum satisfaction, those between 6 and 8 represent average satisfaction, and those below 6 represent minimum satisfaction.
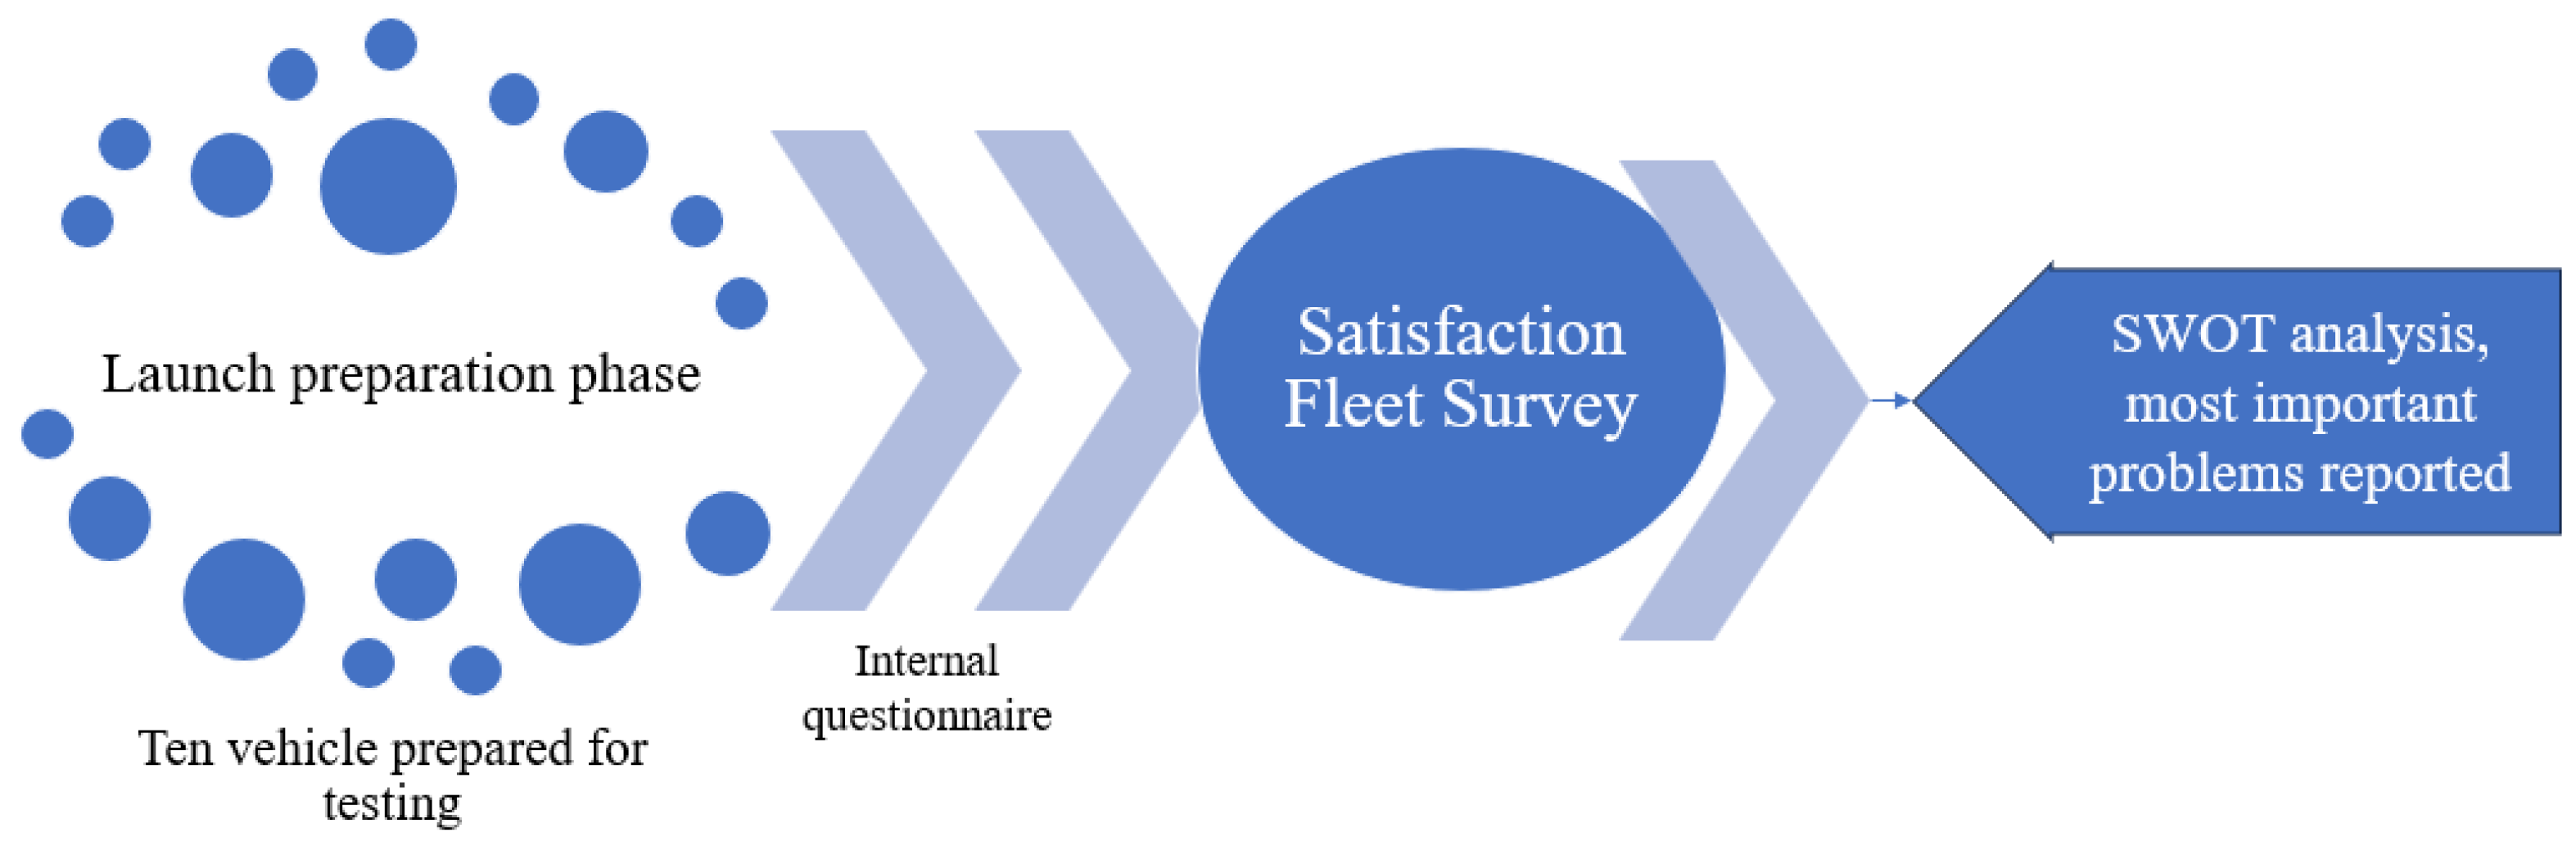
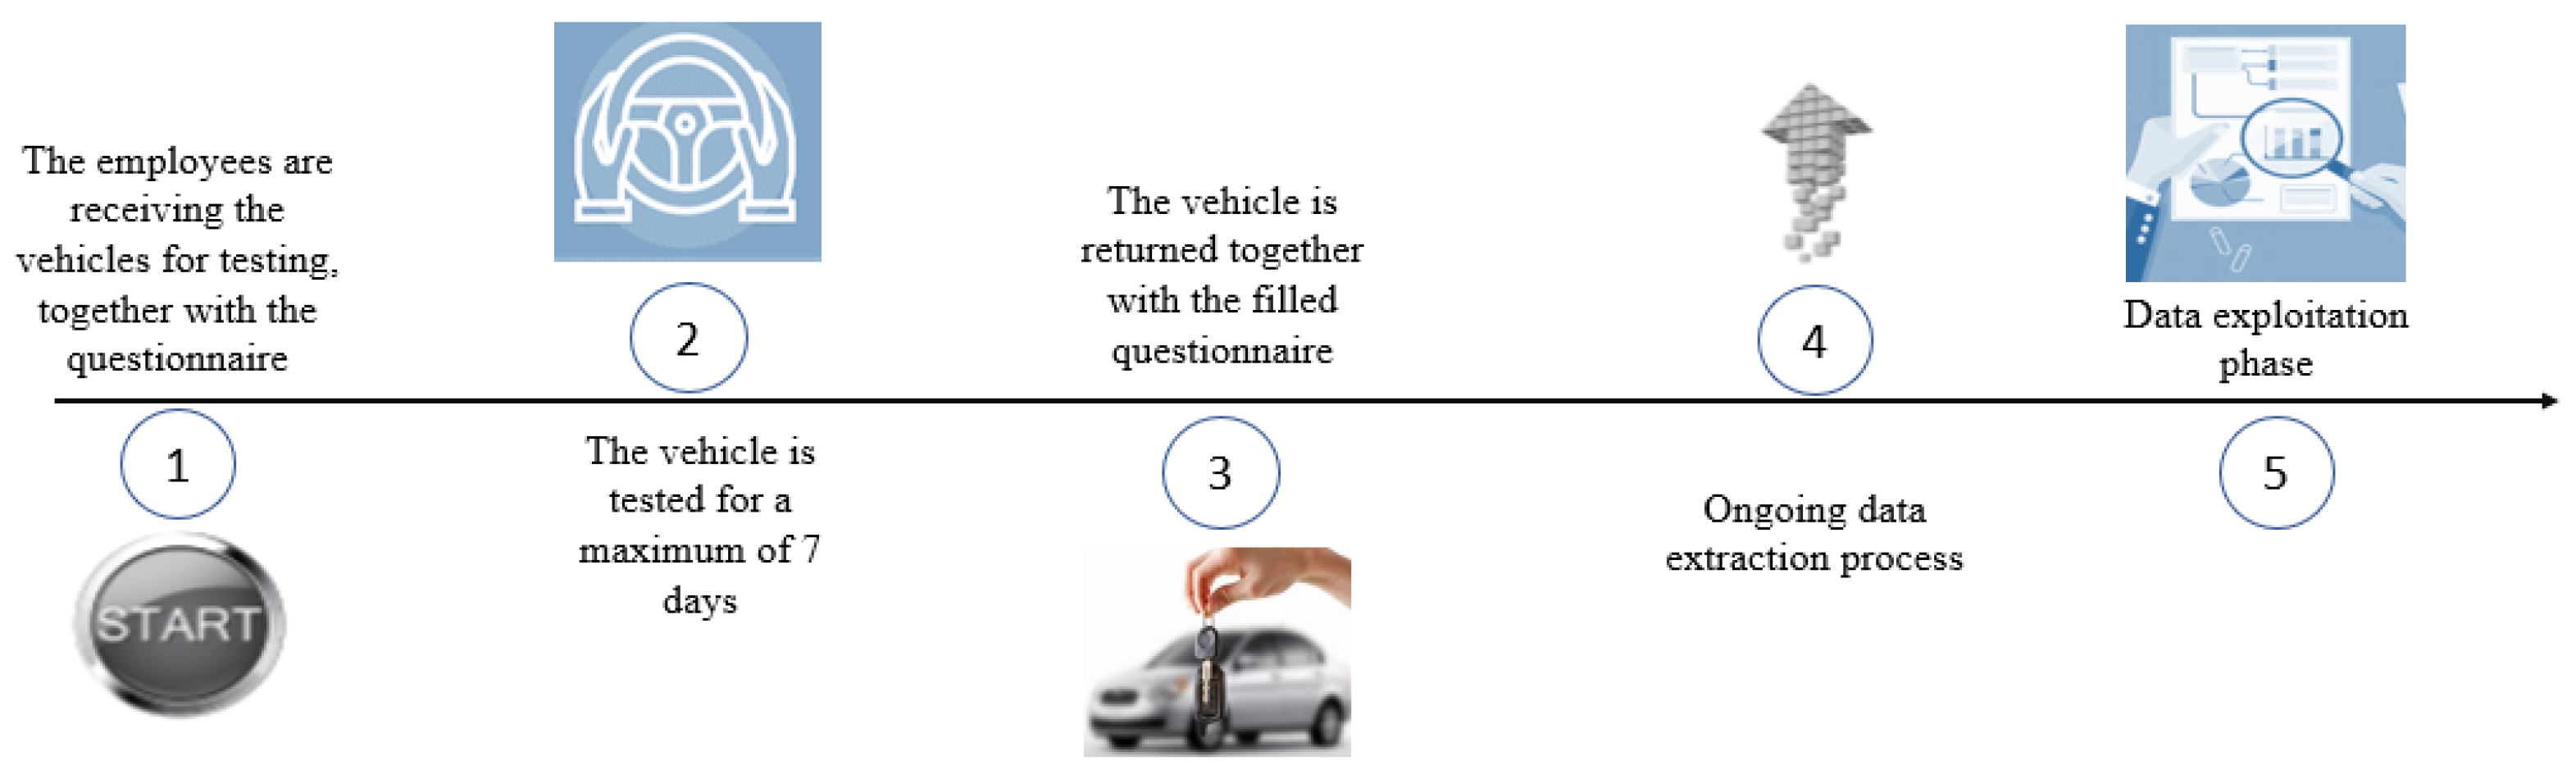
The Customer Satisfaction Fleet survey is carried out in five steps, as shown in
Figure 17. Employees who are selected to participate in the survey are notified in advance to confirm their participation and book their turnover interval, which can be for a maximum period of seven days. On the day of departure, they are given specific training on the use of the car and the specific questionnaire for the survey. After testing the vehicle, the employees return the car and complete the questionnaire, and the data for operation are extracted.
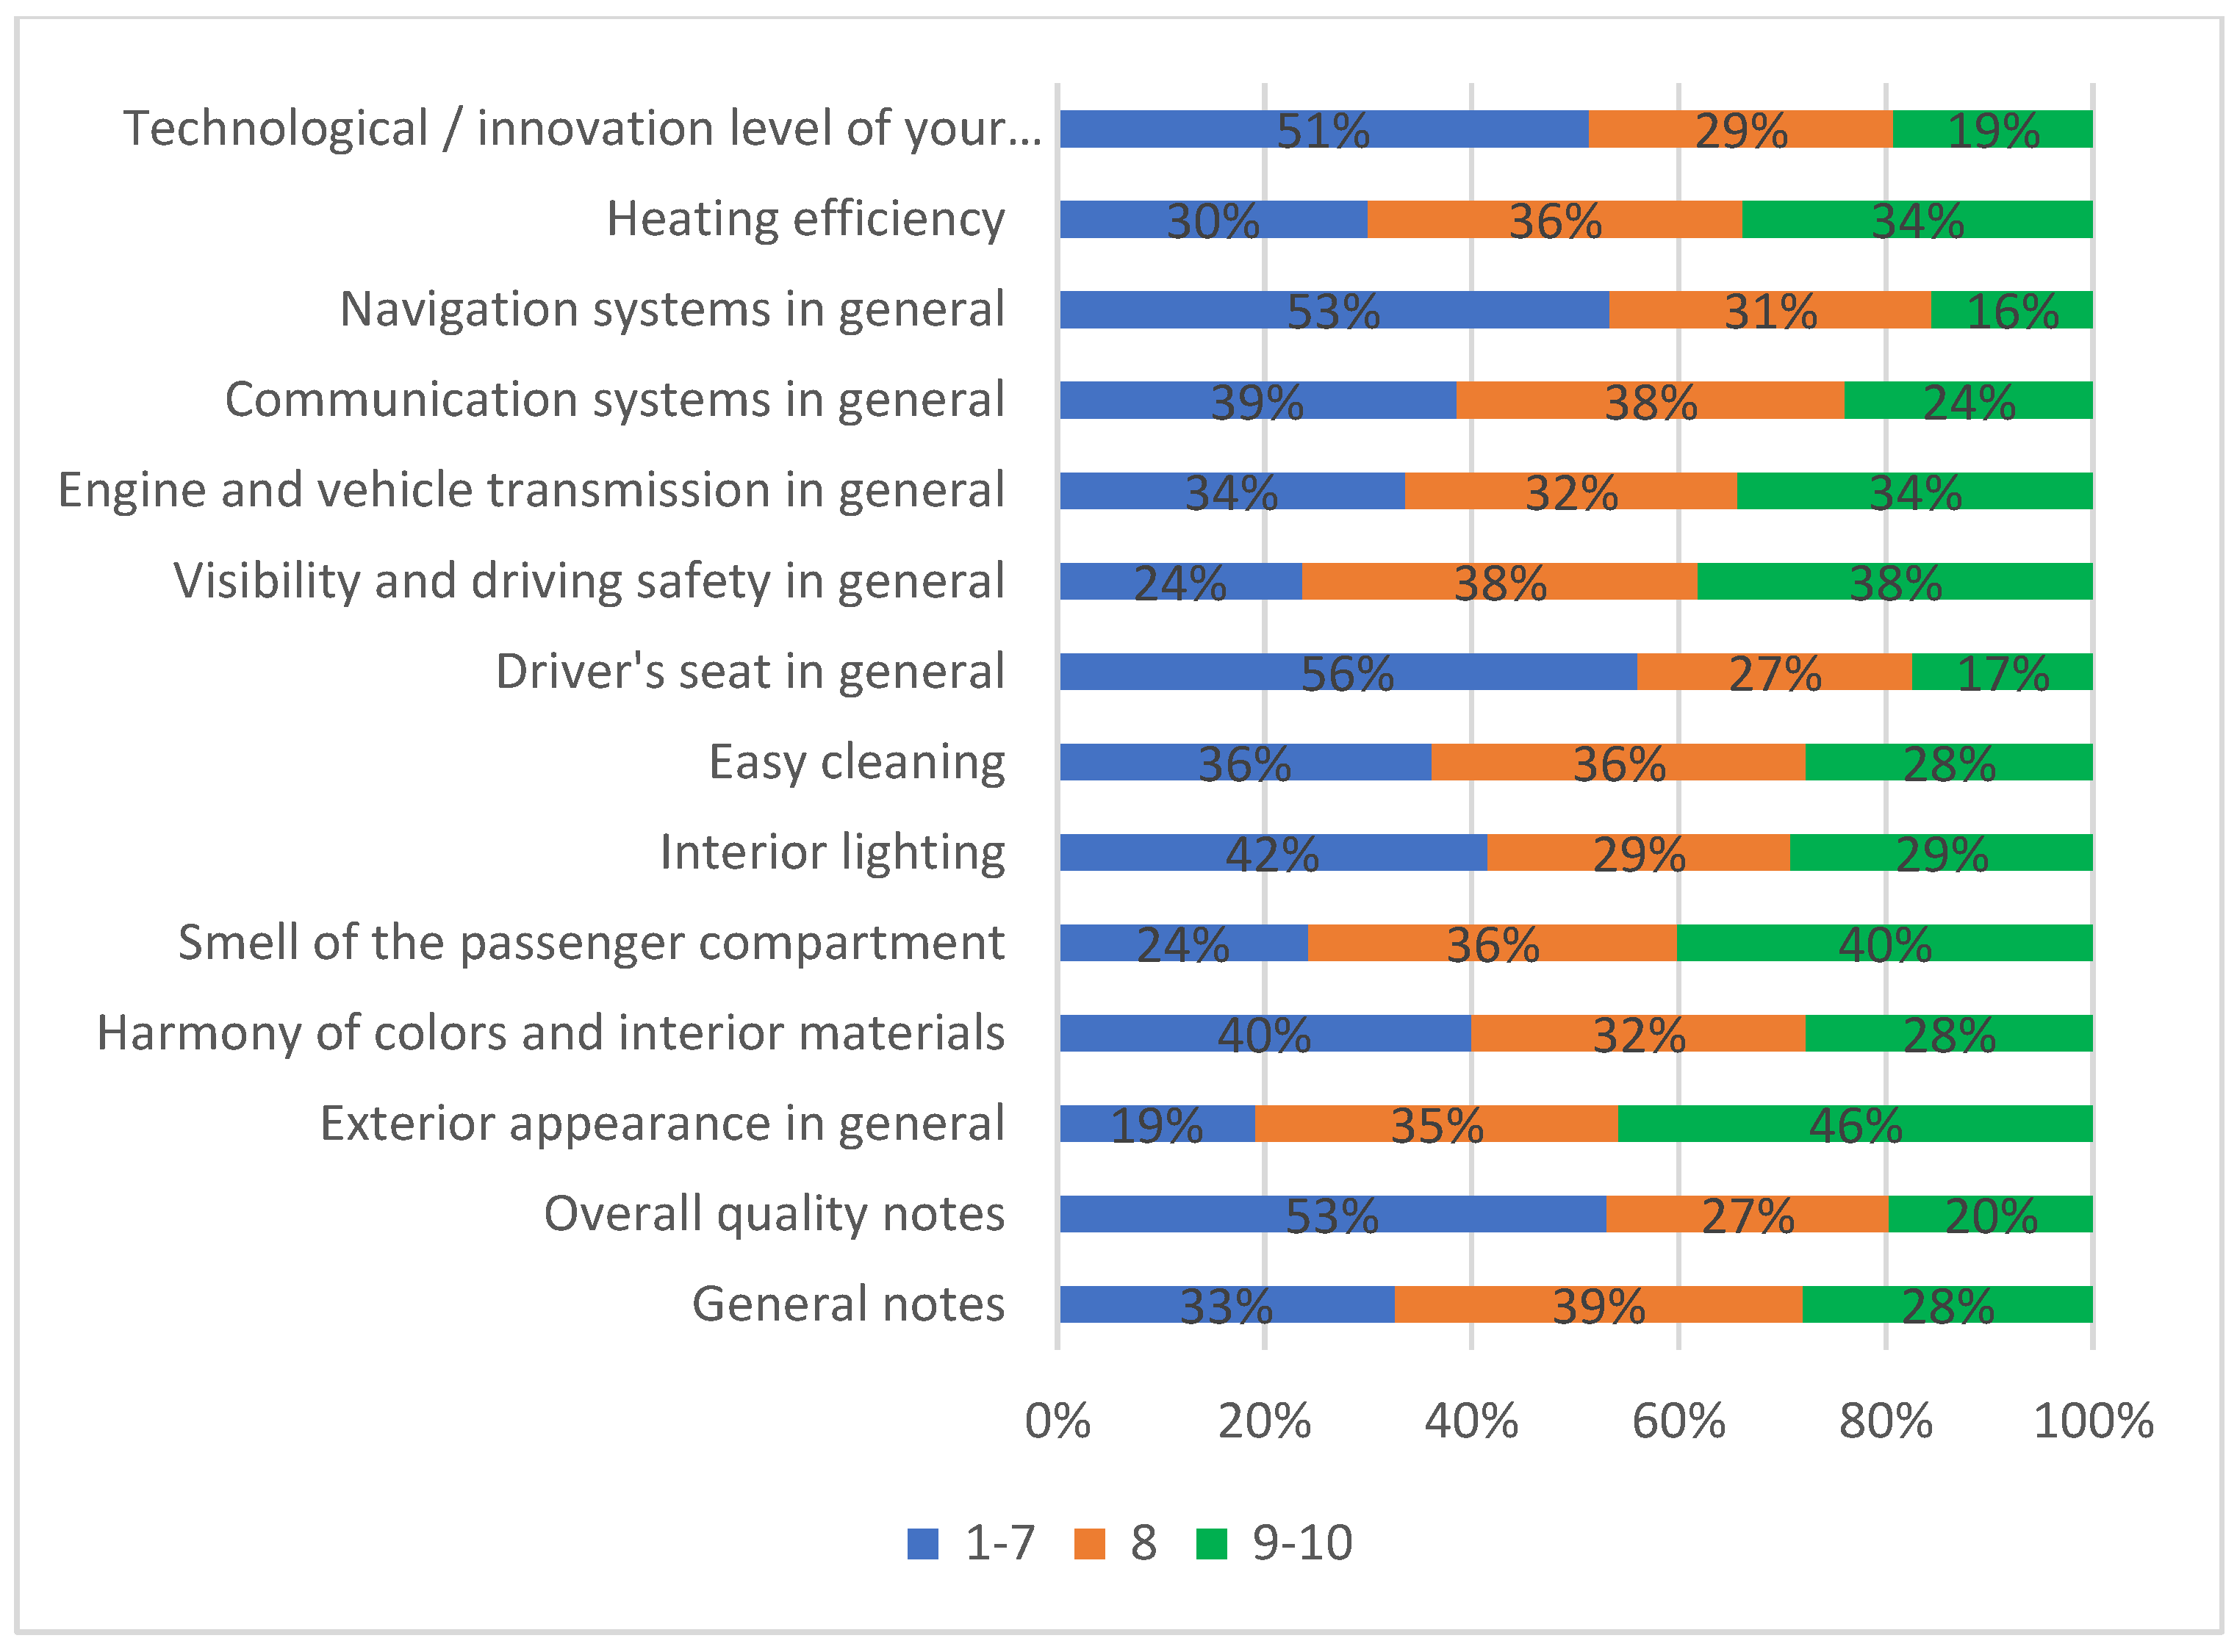
To follow up on the example of using the Customer Satisfaction Fleet survey, 10 prototype vehicles are proposed for internal testing by an employee using the car for trips for various professional purposes. Each vehicle is driven by 10 people, which represents 100 employees participating in the survey. The overall results of the survey are shown in
Table 3, and the detailed results are shown in
Figure 18 and
Figure 19.
Figure 18 shows the scores that were awarded for each performance. In blue, scores awarded between 1 and 7 are presented as a percentage; in orange, a score of 8 is presented as a percentage; and in green, scores of 9 and 10 are presented in a similar way.
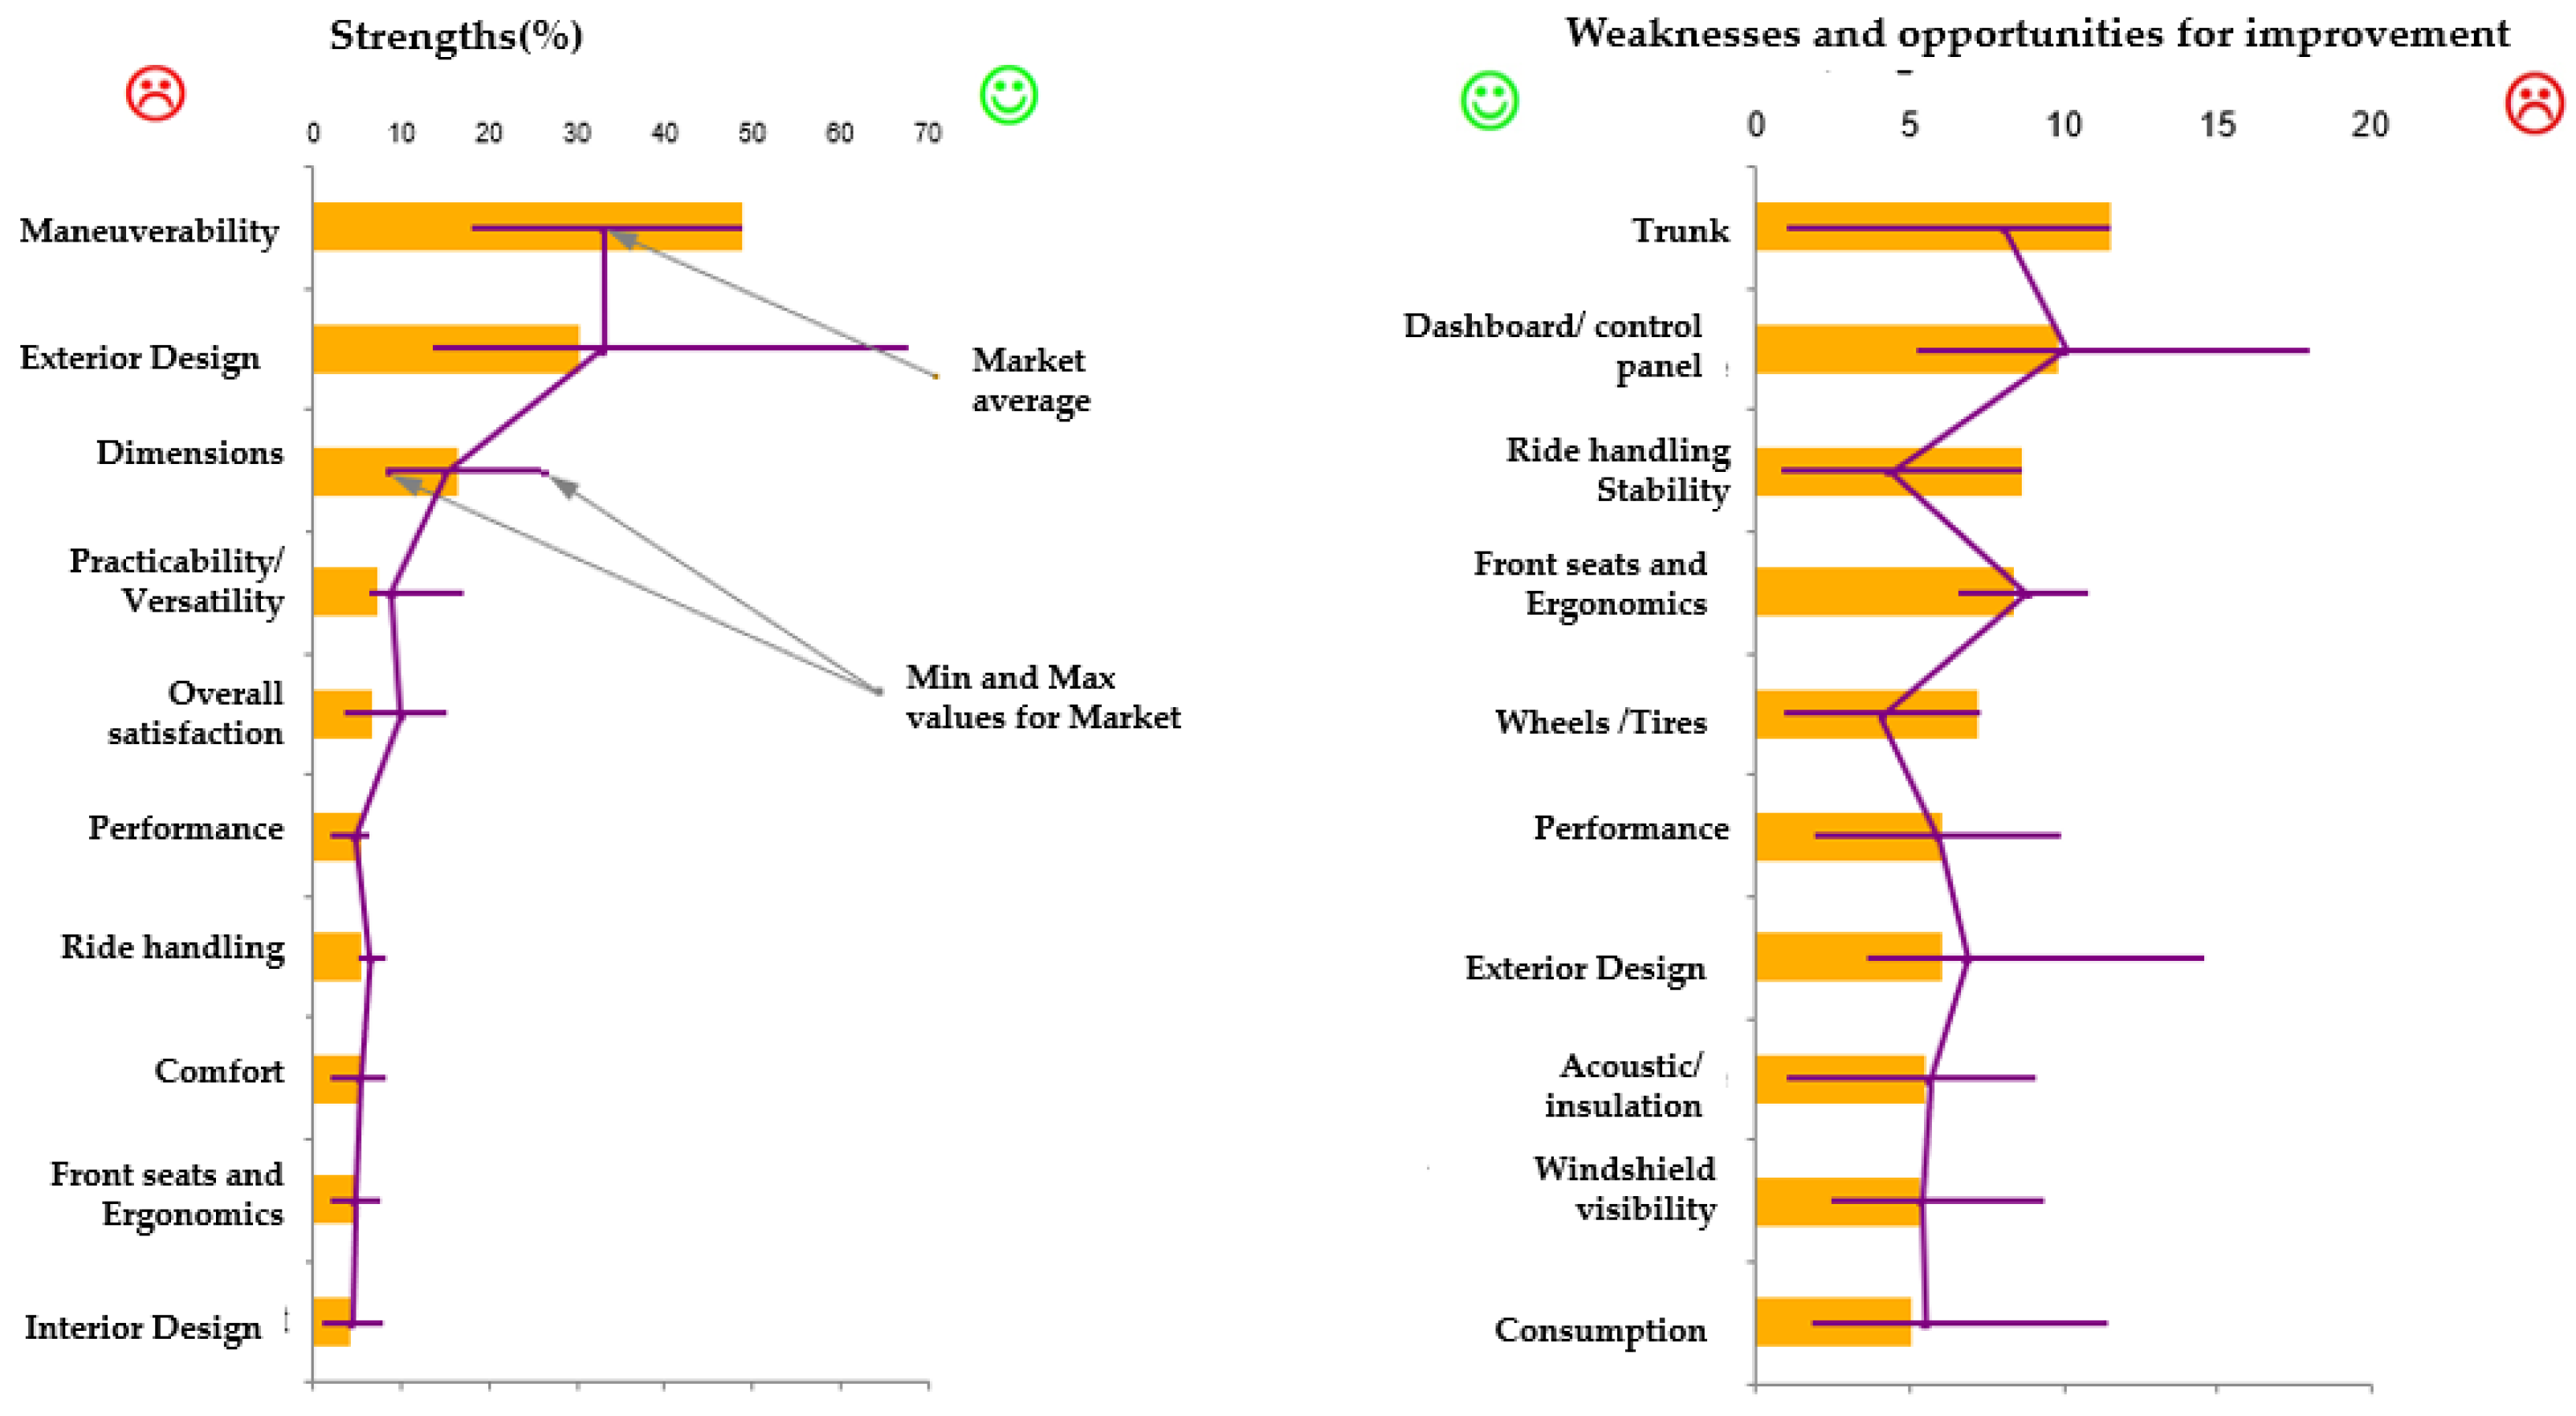
Another objective of the survey is to capture detailed information on strengths and weaknesses, and opportunities for improvement, as shown in
Figure 19.
Figure 19 highlights the strengths and weaknesses relative to the market average. The main strengths are the maneuverability, exterior design, and dimensions of the vehicle. From the category of weaknesses, the trunk stands out, more precisely its load capacity and volume, the center console, the instrument area, and the road holding, which stands out negatively due to an instability on curves or in crosswind conditions.
After validating the prototype and improving the performance based on the problems highlighted by the Customer Satisfaction Fleet survey, the vehicle is ready for market launch.
5.4. Post-Launch Investigation
To collect initial customer feedback after the launch of the new vehicle model, three types of surveys can be used simultaneously.
The first investigation is based on incident alerts that are recorded directly in car repair units when functionality problems occur. The second investigation is referred to as “Fast-Track”, with fast-tracking implemented after the first month of driving the vehicle and carried out in parallel with the incident investigation. The third investigation involves applying the NEVQS after three months of driving the vehicle, offering information about competitors, together with a wealth of information about customer satisfaction.
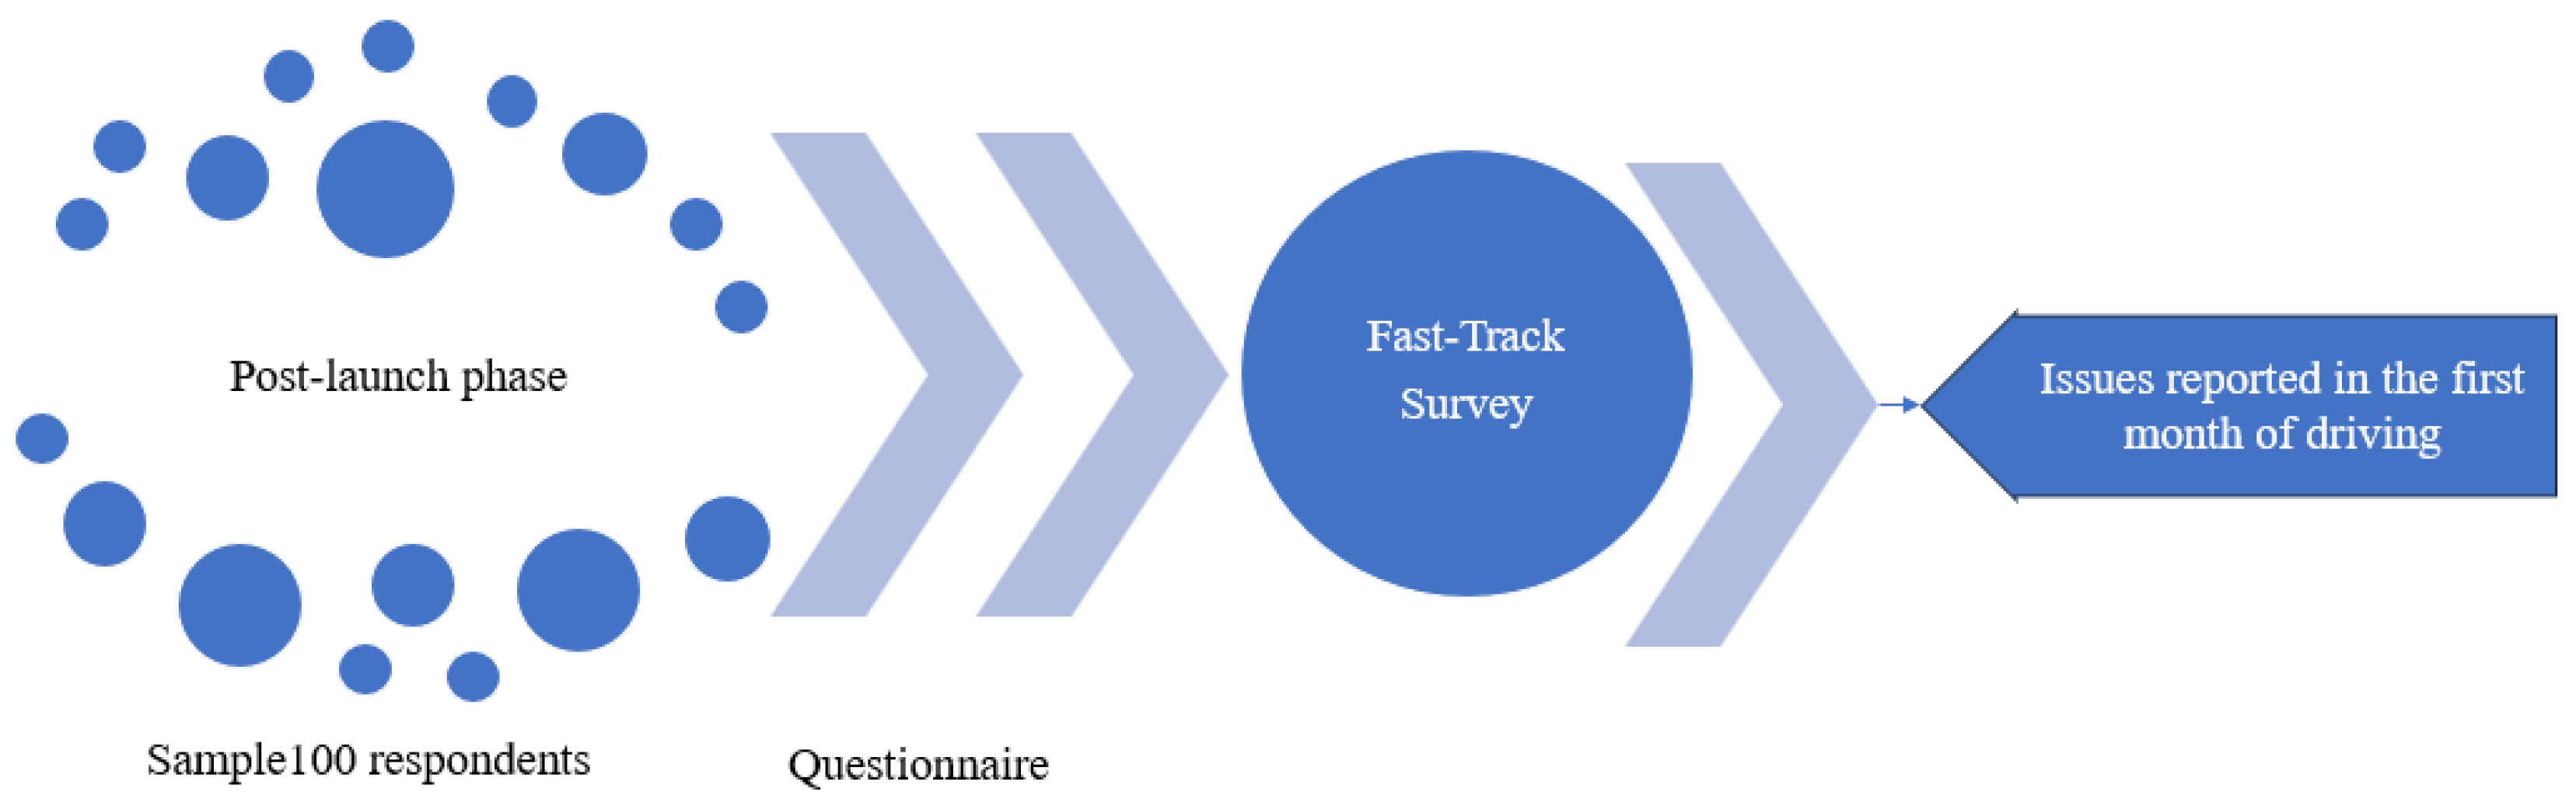
The structure of the Fast-Track survey is presented in
Figure 20.
The post-launch survey is applied through the Fast-Track questionnaire based on multiple choice, rating, and Likert scales. The data obtained are easy to process and analyze. Open-ended questions are also used, but in a small number, given that they increase survey abandonment rates.
The Fast-Track survey is carried out in five steps, as shown in
Figure 21.
Customers purchase the vehicle, and after a period of one month, they receive an online invitation to complete the specific questionnaire. After completing the questionnaire, the data are uploaded to specific platforms and analyzed immediately, allowing us to take immediate measures in case of major non-conformities or other issues related to customer safety.
To apply the Fast-Track survey, the questionnaire was sent to 100 customers who owned the new vehicle model. The customers’ socio-demographic details and the overall results obtained from the survey can be viewed in
Table 4. According to the results, customers preferred diesel (diesel) cars and exhibited good overall satisfaction, giving a quality score of 9/10, while 98% of them would recommend it, and 97% would like to buy it again.
The problems reported by customers in the survey questionnaire are described in
Figure 22. The problems are ranked according to the frequency of occurrence in the survey, which highlights that the first two problems declared (high fuel consumption and carpet catching) produced 50% of the complaints.
The problems reported by the customers in the Fast-Track survey were discussed by the customer satisfaction committee, who considered how to resolve the issues. At the end of the committee meeting, each reported issue was given one of the following statuses: resolved, in progress, in the process of being addressed, or not possible to be resolved.
To collect feedback from customers at this stage, several types of surveys can be applied so that the data received are comprehensive. Incident alerts record functionality problems, “Fast-Track” investigations have a rapid follow-up and are carried out in parallel with the incident investigation, and the NEVQS investigation provides us with more diverse information.
All responses obtained from the applied surveys contribute to improving the vehicle model, as well as contributing to the proposal of derivative model versions in the coming years.
5.5. Life Cycle Survey and After-Sales Support
To better understand the information related to the level of customer satisfaction, feedback is continuously collected via the NEVQS throughout the vehicle’s life cycle.
Feedback can be requested after the first three months of vehicle usage if information about the new model’s performance is needed or for the period between 12 months and 36 months of vehicle usage if information about durability and reliability is needed.
The application of the surveys proposed in this section supports the results of this study by highlighting customers’ needs and dissatisfactions, but also the aspects generating satisfaction among the customers participating in the five surveys. Each survey has been included in key customer touchpoints in the design–development–life cycle process of the new vehicle, so that we can effectively capture the contribution of customer satisfaction throughout all processes.
These methods and techniques for measuring customer satisfaction were selected so that there is continuity of information between manufacturing stages, highlighting full CX integration into the product life cycle. The multitude of questions that are used in each questionnaire covers several important issues such as the sales process, after-sales support, and the durability and quality of the vehicle. After collecting the responses from these surveys, a clear picture of customers’ needs and preferences can be obtained, and areas for improvement can be identified. The results also point out three critical meta-factors of customer satisfaction, namely price, design, and durability.
The proposed structure for full CX integration into the development of a new product is applied in this situation as a generic example in the automotive industry, but it can be adapted to any product or service from another industrial sector.
6. Validation of Study Results Through Statistical Analysis
Based on the results of the surveys that were applied in the present study to assess the impact of customer satisfaction in the life cycle of a new vehicle, three defining factors for customers were differentiated, namely the price, the design, and the durability of the car.
6.1. Data Collection and Validation
For studying the relationship between the three factors and overall satisfaction, a questionnaire was chosen as an investigative tool.
Validation of the customer satisfaction results obtained during the study was carried out in 2023, using a questionnaire for a sample of 100 people (customers). These questionnaires were completed by customers in dealer locations at different interaction points.
After the 100 questionnaires were collected, only 74 were retained for further analysis, after a primary validation step (the exclusion criterion was a lack of response to more than two items).
General information such as gender, age, and number of children was collected to investigate the possible different customer profiles based on these characteristics. A five-point Likert scale was used to measure the three factors (price, design, durability) and overall satisfaction: very dissatisfied, unsatisfied, indifferent, satisfied, and very satisfied, coded from 1 (very dissatisfied) to 5 (very satisfied).
6.2. Statistical Analysis
All statistical analyses were performed on SPSS version 23.0 (SPSS, Chicago, IL, USA). The level of statistical significance was set at 0.05 (for all tests performed and for confidence intervals). Considering the context of our research, the advantages and limitations of statistical methods, the complexity of the data, and the relationship to explore, ordinal regression analysis was selected.
Our data satisfy the assumptions of OLS regression well enough, and our sample size is smaller than 100. We also have a straightforward relationship to analyze and focus on predicting an outcome based on a few independent variables; therefore, we used OLS regression rather than SEM [
56,
57,
58].
6.3. Descriptive Statistics
The demographic profile of the respondents is described in
Table 5. Thus, it can be observed that of the 74 respondents, 66% were men and 34% were women. The average age of the responders was 42 years, 32% were single, and 45% were married, while 23% did not declare their relationship status. Most of the respondents had families with more than one child (23%), while 19% of the respondents did not have any children.
6.4. Ordinal Regression Model
Ordinal regression analysis assumes a dependence or causal relationship between one or more independent variable and one dependent variable. Moreover, the effect of one or more covariates can be accounted for.
Firstly, ordinal regression might be used to identify the strength of the effect that the independent variables have on a dependent variable.
Secondly, ordinal regression can be used to forecast the effects or impacts of changes. That is, ordinal regression analysis helps us to understand how much the dependent variable will change when we change the independent variables. A typical question is “When is the response most likely to jump into the next category?”
In our model, the dependent variable is “overall satisfaction”, an ordinal variable with five categories of responses. As independent variables (factors or predictors), we set the other three variables, price, design, and durability, all being ordinal variables with five categories of response.
Before setting the ordinal regression, we must check if the main assumptions of this statistical technique are met:
Multicollinearity occurs when we have two or more independent variables that are highly correlated with each other. This leads to problems with understanding which variable contributes to the explanation of the dependent variable and technical issues in calculating an ordinal regression.
To test multicollinearity, we conduct a correlation analysis for our three predictors using Spearman’s correlation coefficient (suitable for ordinal variables). The results are presented in
Table 6.
We conclude that there is no multicollinearity present, because the values of the correlation coefficients are very low (close to 0) and the p-values are larger than 0.05.
- 2.
Proportional odds
The assumption of proportional odds means that each independent variable has an identical effect at each cumulative split of the ordinal dependent variable.
In SPSS, this assumption is checked using the Parallel Line Test. If the assumption of proportional odds is met, then the p-value of the test is greater than 0.05. We obtained a p-value of 0.302, which means that the assumption is met, and we can run the ordinal regression.
For the ordinal regression, we use the Logit link function.
In the first step, we check for model deviances—an indicator of a lack of fit—using the Likelihood Ratio chi-squared test (
Table 7).
The chi-square value shown in this table is the difference in the deviance between an intercept-only/null model (−2LL = 170.441) and a model containing the full set of predictors (−2LL = 51.269). The chi-square value is used to test whether the change in chi-square from the null to the final model is significantly greater than 0. The degrees of freedom for the model equal the number of predictors in the final model (we have three predictors).
For our analysis, we see that the full model containing our predictors does represent a significant improvement in fitness relative to the null model, with p < 0.001.
In the second step, we investigate how much better the final model fits the data relative to the null model by examining the Pseudo R-square values (this indicator represents the discrepancy in fit between the model and a saturated model that fits the data perfectly). For our analysis, we chose McFadden’s Pseudo R-square form, which yielded a value of 0.685. This value can be viewed as causing a strong improvement in model fit (see Pituch and Stevens (2016) [
50] and Tabachnick and Fidell (2013) [
51]—a value of McFadden’s Pseudo R-square between 0.2 and 0.4 means a strong improvement in model fit).
The third step is represented by the parameter estimates presented in
Table 8.
Assuming that the categories of the dependent variable (overall satisfaction) are ordered in an ascending fashion (i.e., moving from lower to higher values), we can interpret an estimated regression slope (denoted as “B” in the above table) as the predicted change in the log odds (or logits) of a case falling above a given category for the dependent variable, holding the remaining predictors constant. For ease of interpretation, the exp(B) is calculated (exponentiated B); this coefficient represents the proportional odds ratio and can easily be interpreted in the same manner as the odds ratio from a binary logistic regression. The odds ratio (OR) indicates the multiplicative change in the odds of a case falling into a higher category per unit increase in the predictor. An OR > 1 indicates increasing odds of being in a higher category per unit increase in the predictor. An OR < 1 indicates decreasing odds of being in a higher category per unit increase, and an OR = 0 indicates no change in odds per increase in the predictor.
Design (OR = 3.082) is a significant predictor of overall satisfaction—for one unit increase in the “design” scale, the odds of a person who appreciates the design falling into a higher level of overall satisfaction changes by a factor of 3.082. In other words, those who appreciate the design are three times more likely to have high overall satisfaction than those who do not appreciate the design.
Price (OR = 4.083) is a significant predictor of overall satisfaction—for one unit increase in the “price” scale, the odds of a person who is more satisfied with the price falling into a higher level of overall satisfaction changes by a factor of 4.083. In other words, those who are more satisfied with the price are four times more likely to have high overall satisfaction than those who are less satisfied with the price.
Durability (OR = 3.792) is a significant predictor of overall satisfaction—for one unit increase in the “durability” scale, the odds of a person who appreciates the durability falling into a higher level of overall satisfaction changes by a factor of 3.792. In other words, those who appreciate durability are almost four times more likely to have high overall satisfaction than those who are less satisfied with durability.
The statistical validation confirms that the three identified meta-factors, namely design, price, and durability, are relevant for customer satisfaction in the automotive industry when aiming to launch a new product.
Summarizing the approach to integrate customer satisfaction into the development of a new product, certain steps may be followed, such as (i) identifying the product life cycle and the customer touchpoints of interaction in order to collect relevant evidence on high-importance attributes; (ii) capturing customer feedback and prioritizing high-importance factors in every step of the life cycle; (iii) correlating customer feedback with regulations, manufacturing, supply chain, and competitive constraints and retaining the factors with high importance for customer satisfaction; and (iv) statistically validating the meta-factors and their significance in overall customer satisfaction.
Considering the type of product, the questionnaires that is used to collect relevant evidence should be adapted for each step of the life cycle, and then the results should be aggregated in line with the specific industry’s framework (regulations, supply chain, manufacturing capabilities, competitive environment, after-sale logistics, etc.).
Finally, the focus on the selected and validated meta-factors appears to be the company’s strategic decision, enabling us to target highly matched customer profiles in terms of overall satisfaction with the acquired product. This study considered products with high complexity and a life cycle of medium-to-long mean use duration (at least higher than several to ten years). Based on this rationale of collecting information on customer experience at relevant touchpoints of the product life cycle, the model may be transferred and adapted to other industries.
7. Conclusions
The most important part of this study is identifying the interaction touchpoints between customers and the organization, which were chronologically mapped to understand and improve customer experience and to fully integrate it into product life cycle development. The satisfaction of each customer is influenced by their experience with the organization, starting from their awareness of the reason for purchase and ending with the purchase or post-sale.
In the automotive industry, different surveys are applied in the exploration phase for market potential research (New Car Buyer Survey, durability survey, Customer Satisfaction Fleet survey). Post-launch research is conducted through the New European Vehicle Quality Survey (NEVQS) and the Fast-Track survey. The life cycle survey aims to monitor customer satisfaction over a defined turnover period using the NEVQS.
Aggregating data collected from the different surveys at the interaction touchpoints, three meta-factors were identified, namely the design, the price, and the durability of the new vehicle. The relationship between these factors and customer satisfaction was statistically tested using a statistical method that can be applied to our data sample and the relationship to be explored.
The ordinal regression conducted for all three significant predictors for determining customer satisfaction revealed the level of satisfaction based on these factors, namely, more than three times for design, almost four for durability, and more than four for price. In other words, those who appreciate these factors (design, durability, price) are three to four times more likely to have high overall satisfaction than those who do not appreciate the factors.
The relationship between the meta-attributes validates the results of this study from a statistical perspective, enhancing the presented structure for CX integration.
The proposed structure for presenting the impact of CX can be transferred from the automotive industry to other industries, adapting the customer journey map and the surveys to specific domains and aggregating the relevant meta-factors for customer satisfaction. This study provides an explicit customer satisfaction screening process in all phases of the life cycle of a complex product and a proposed methodology, transferable to other sectors or industries, for integrating customer experience into product development.


